beyond high school, before baccalaureate - education week · 1969 77.1% 2008 71.7% 1870 1880 1890...
TRANSCRIPT
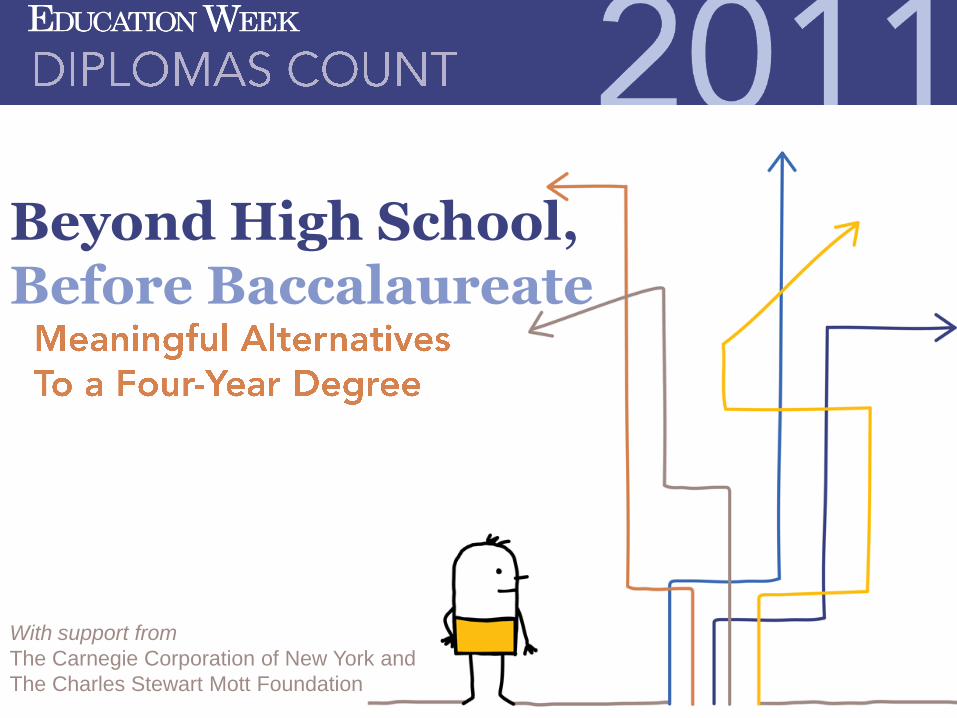
Beyond High School,Before Baccalaureate
With support from
The Carnegie Corporation of New York and
The Charles Stewart Mott Foundation

Ambitious National Priorities
I ask every American to commit to at least
one year or more of higher education or
career training. This can be community
college or a four-year school; vocational
training or an apprenticeship. But whatever
the training may be, every American will
need to get more than a high school
diploma.”
President Barack Obama
State of the Union Address
February 24, 2009
Ambitious Goals
Leaders from the public and private sectors have mobilized efforts around college readiness and completion
The Administration’s ESEA Blueprint
♦ “Together, we must achieve a new goal, that by 2020, the United States will once again lead the world in college completion.”
Lumina Foundation’s Big Goal (Goal 2025)
♦ To increase the proportion of Americans with high-quality degrees and credentials to 60 percent by the year 2025
Focus is not just on four-year college
Diploma is a First Step
Nationally, 1.2 million students fail to earn a diploma every year
Communities across the nation still struggle to boost graduation rates
In some way, this is a very concentrated crisis
The Good News
♦ After years of concerted reform efforts, nation seems to be gaining traction on the dropout problem
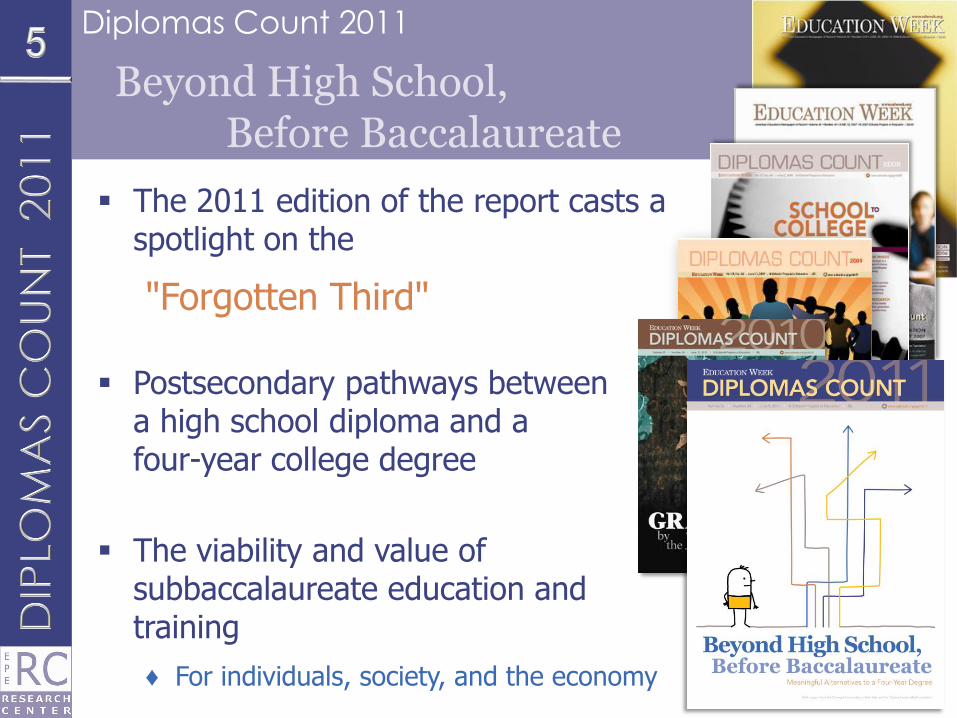
Diplomas Count 2011
Beyond High School, Before Baccalaureate
The 2011 edition of the report casts a spotlight on the
"Forgotten Third"
Postsecondary pathways between a high school diploma and a four-year college degree
The viability and value of subbaccalaureate education and training
♦ For individuals, society, and the economy
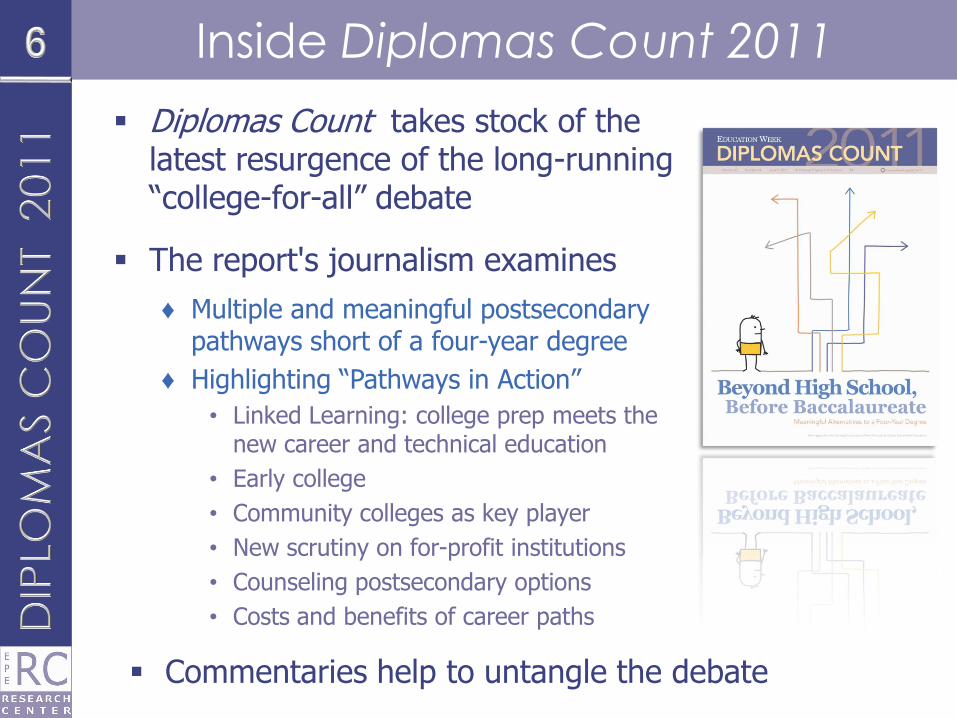
Inside Diplomas Count 2011
Diplomas Count takes stock of the latest resurgence of the long-running “college-for-all” debate
The report's journalism examines
♦ Multiple and meaningful postsecondary pathways short of a four-year degree
♦ Highlighting “Pathways in Action”
• Linked Learning: college prep meets the new career and technical education
• Early college
• Community colleges as key player
• New scrutiny on for-profit institutions
• Counseling postsecondary options
• Costs and benefits of career paths
Commentaries help to untangle the debate
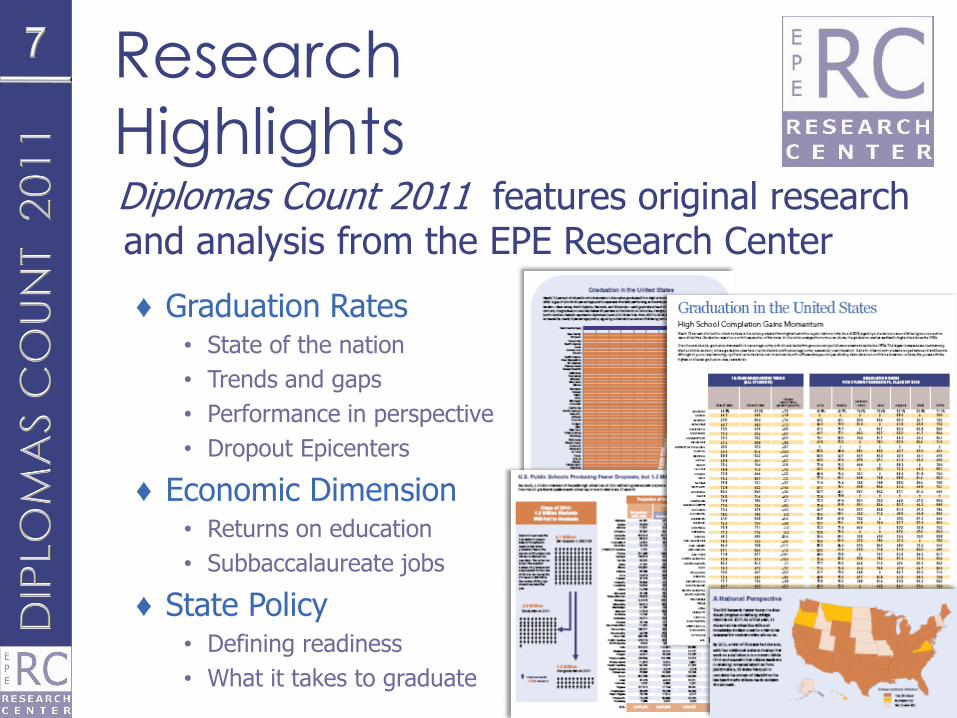
Research
HighlightsDiplomas Count 2011 features original research and analysis from the EPE Research Center
♦ Graduation Rates• State of the nation
• Trends and gaps
• Performance in perspective
• Dropout Epicenters
♦ Economic Dimension• Returns on education
• Subbaccalaureate jobs
♦ State Policy• Defining readiness
• What it takes to graduate

Graduation in the
United States
Nation Turns a Corner

Updated Graduation Analysis
Diplomas Count 2011 features results for the public high school class of 2008, the most recent year of data available
Data source
♦ Common Core of Data (CCD), U.S. Department of Education
♦ Annual census of public schools and districts
Calculation method
♦ Cumulative Promotion Index (CPI)
♦ Widely reported, independent source of information
Comprehensive data
♦ Consistent rates available from national to local level
Strengths and limitations
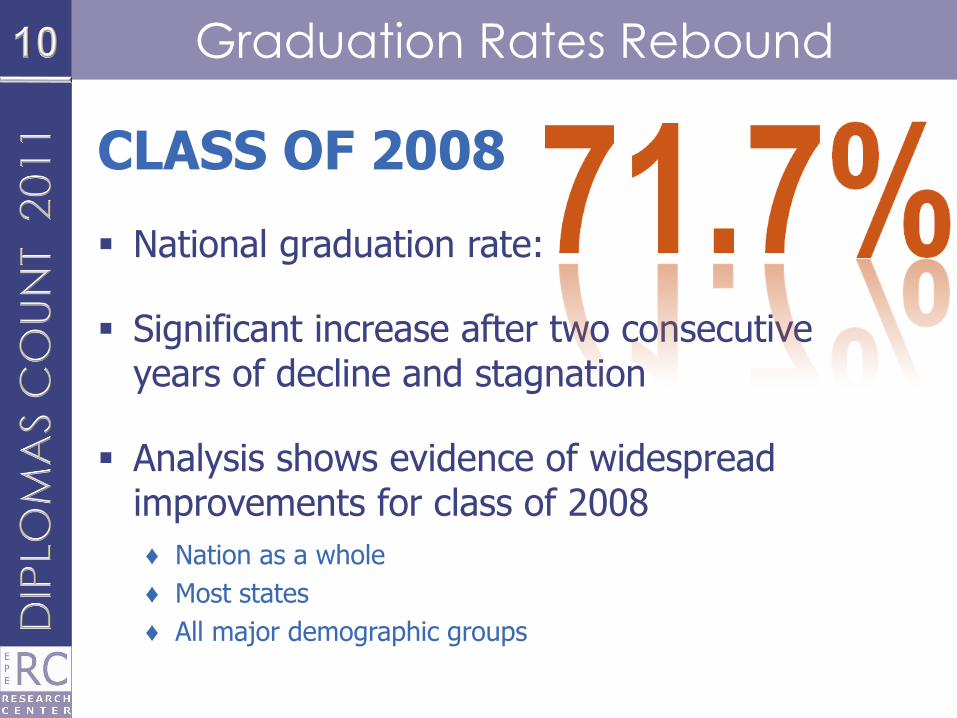
Graduation Rates Rebound
CLASS OF 2008
National graduation rate:
Significant increase after two consecutive years of decline and stagnation
Analysis shows evidence of widespread improvements for class of 2008
♦ Nation as a whole
♦ Most states
♦ All major demographic groups
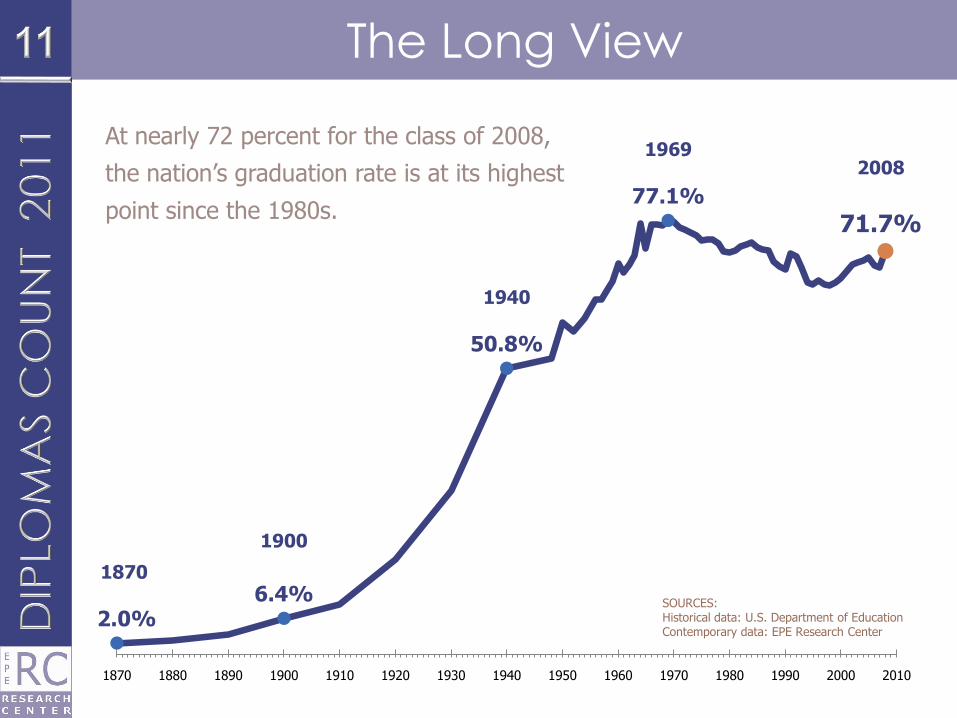
The Long View
1870
2.0%
1900
6.4%
1940
50.8%
1969
77.1%
2008
71.7%
1870 1880 1890 1900 1910 1920 1930 1940 1950 1960 1970 1980 1990 2000 2010
SOURCES: Historical data: U.S. Department of EducationContemporary data: EPE Research Center
At nearly 72 percent for the class of 2008,
the nation’s graduation rate is at its highest
point since the 1980s.

A More Contemporary Perspective
Trends over the past 10 years show broad-based improvements
All Students 71.7
American Indian 53.9
Asian 82.7
Hispanic 57.6
Black 57.0
White 78.4
45
50
55
60
65
70
75
80
85
1998 2000 2002 2004 2006 2008
Gra
du
ati
on
-ra
te p
erc
en
tag
e
Challenges
Remain
Historical Disparities
Persist
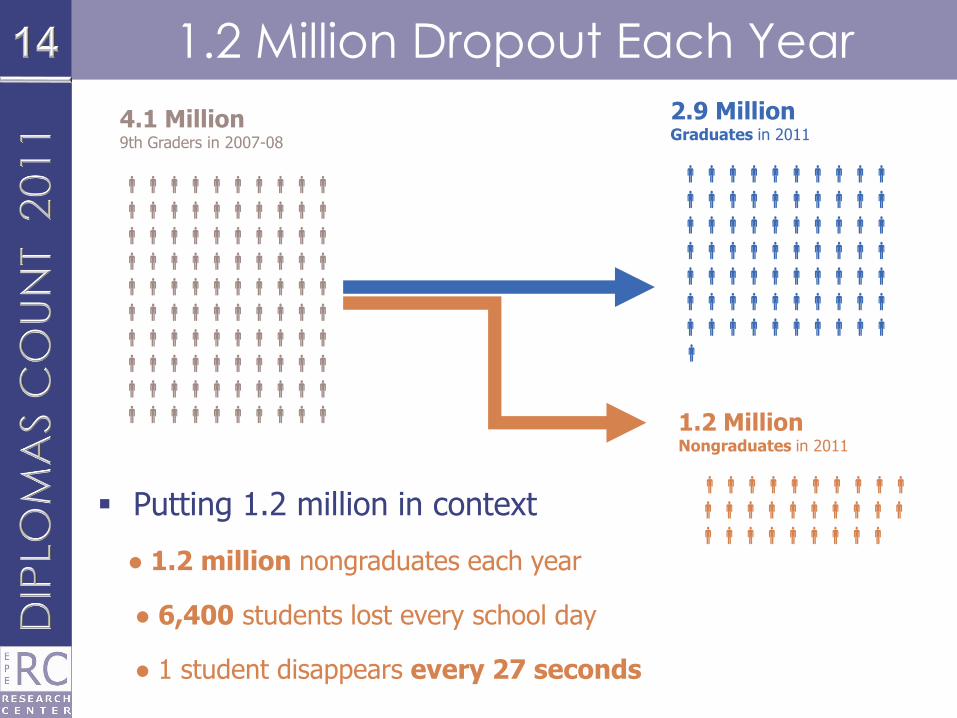
1.2 Million Dropout Each Year
Putting 1.2 million in context
● 1.2 million nongraduates each year
● 6,400 students lost every school day
● 1 student disappears every 27 seconds
4.1 Million 9th Graders in 2007-08
2.9 Million Graduates in 2011
1.2 Million Nongraduates in 2011

Minorities, Males Most At-Risk
Graduation rates are far below the national average for:
♦ Racial and ethnic minorities
♦ Male students
♦ Males from historically underserved groups
71.7
57.6 57.053.9
67.7
52.850.0 48.9
0
10
20
30
40
50
60
70
80
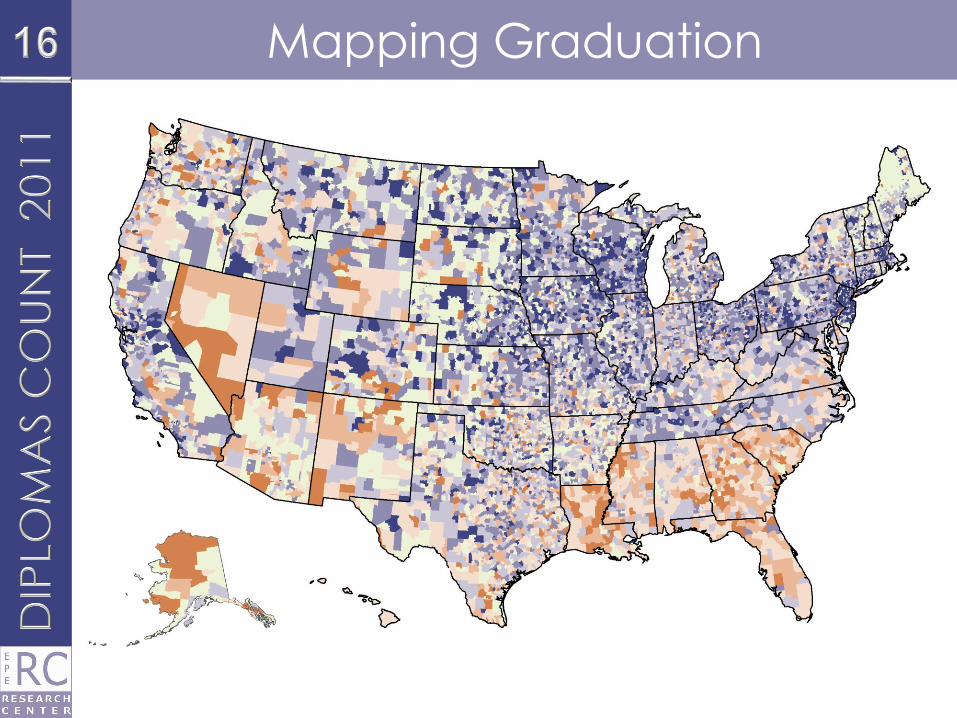
Mapping Graduation
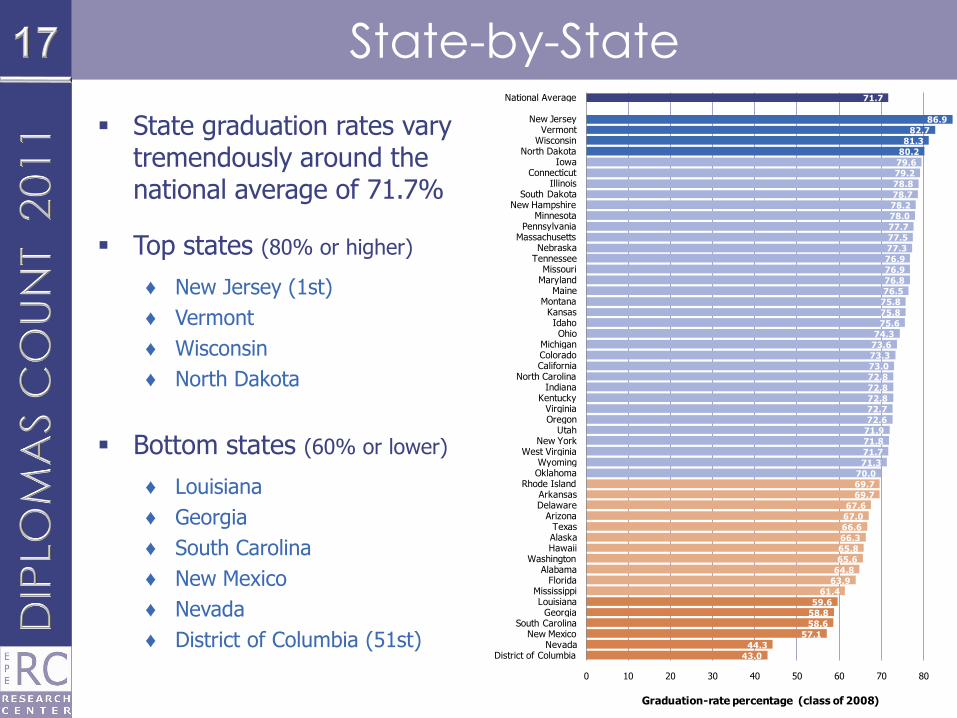
State-by-State
State graduation rates vary tremendously around the national average of 71.7%
Top states (80% or higher)
♦ New Jersey (1st)
♦ Vermont
♦ Wisconsin
♦ North Dakota
Bottom states (60% or lower)
♦ Louisiana
♦ Georgia
♦ South Carolina
♦ New Mexico
♦ Nevada
♦ District of Columbia (51st)43.0
44.3
57.1
58.6
58.8
59.6
61.4
63.9
64.8
65.6
65.8
66.3
66.6
67.0
67.6
69.7
69.7
70.0
71.3
71.7
71.8
71.9
72.6
72.7
72.8
72.8
72.8
73.0
73.3
73.6
74.3
75.6
75.8
75.8
76.5
76.8
76.9
76.9
77.3
77.5
77.7
78.0
78.2
78.7
78.8
79.2
79.6
80.2
81.3
82.7
86.9
71.7
0 10 20 30 40 50 60 70 80 90 100
District of ColumbiaNevada
New MexicoSouth Carolina
GeorgiaLouisiana
MississippiFlorida
AlabamaWashington
HawaiiAlaskaTexas
ArizonaDelawareArkansas
Rhode IslandOklahomaWyoming
West VirginiaNew York
UtahOregonVirginia
KentuckyIndiana
North CarolinaCaliforniaColoradoMichigan
OhioIdaho
KansasMontana
MaineMarylandMissouri
TennesseeNebraska
MassachusettsPennsylvania
MinnesotaNew Hampshire
South DakotaIllinois
ConnecticutIowa
North DakotaWisconsinVermont
New Jersey
National Average
Graduation-rate percentage (class of 2008)
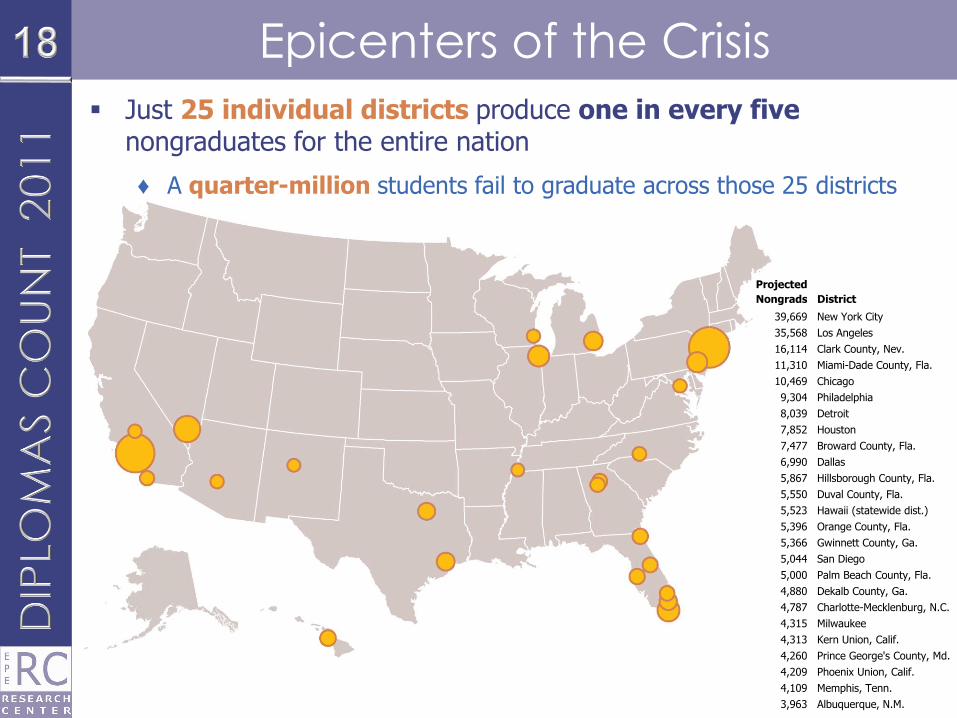
Epicenters of the Crisis
Projected
Nongrads District
39,669 New York City
35,568 Los Angeles
16,114 Clark County, Nev.
11,310 Miami-Dade County, Fla.
10,469 Chicago
9,304 Philadelphia
8,039 Detroit
7,852 Houston
7,477 Broward County, Fla.
6,990 Dallas
5,867 Hillsborough County, Fla.
5,550 Duval County, Fla.
5,523 Hawaii (statewide dist.)
5,396 Orange County, Fla.
5,366 Gwinnett County, Ga.
5,044 San Diego
5,000 Palm Beach County, Fla.
4,880 Dekalb County, Ga.
4,787 Charlotte-Mecklenburg, N.C.
4,315 Milwaukee
4,313 Kern Union, Calif.
4,260 Prince George's County, Md.
4,209 Phoenix Union, Calif.
4,109 Memphis, Tenn.
3,963 Albuquerque, N.M.
Just 25 individual districts produce one in every fivenongraduates for the entire nation
♦ A quarter-million students fail to graduate across those 25 districts
Ending on a Positive Note
REMINDERS
♦ Graduation rate for class of 2008 showed dramatic increase from previous year
♦ Improvements were broad-based
♦ Seeing some narrowing of racial gaps (between Blacks and whites)
Findings may show results of years of effort directed toward dropout prevention and reform
Effects of reforms can take years to materialize at a measurable level
The next question: Can the gains be sustained?

Diplomas, Degrees,
and Dollars
Returns to Education
Original Analysis
There is a growing body of data and research on the connections between educational attainment and economic outcomes
In Diplomas Count 2011, we take a fresh look at “returns to education,” with a focus on subbaccalaureate schooling
The American Community Survey 2009 (ACS)
♦ Very large annual survey of residential population (3 million people) conducted by the U.S. Census Bureau
♦ Information on: demographics, geography, socioeconomic status, and economic factors (e.g., occupation, employment, earnings)
ACS can generate very detailed and localized results
♦ Just a taste today
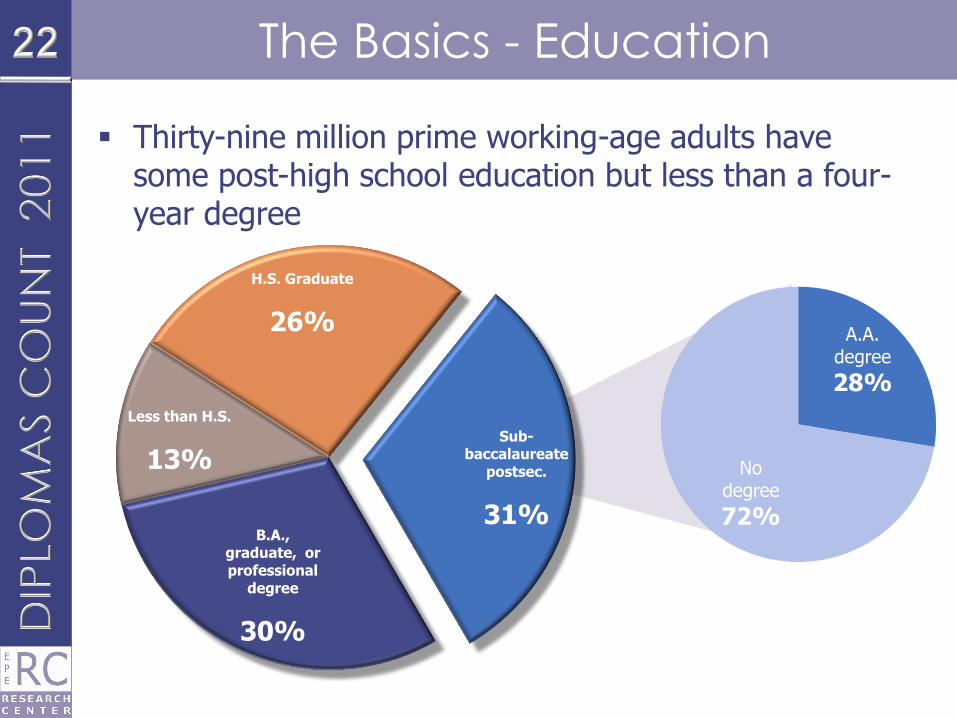
The Basics - Education
Thirty-nine million prime working-age adults have some post-high school education but less than a four-year degree
Less than H.S.
13%
H.S. Graduate
26%
Sub-baccalaureate
postsec.
31%B.A.,
graduate, or professional
degree
30%
A.A. degree
28%
No degree
72%
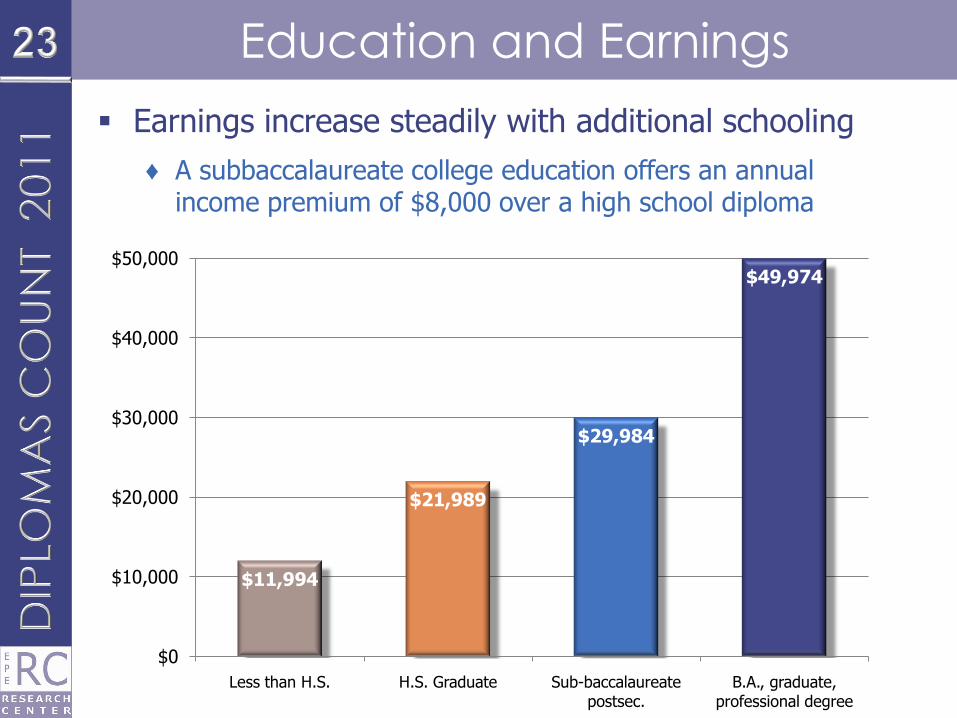
Education and Earnings
Earnings increase steadily with additional schooling
♦ A subbaccalaureate college education offers an annual income premium of $8,000 over a high school diploma
$11,994
$21,989
$29,984
$49,974
$0
$10,000
$20,000
$30,000
$40,000
$50,000
Less than H.S. H.S. Graduate Sub-baccalaureate postsec.
B.A., graduate, professional degree
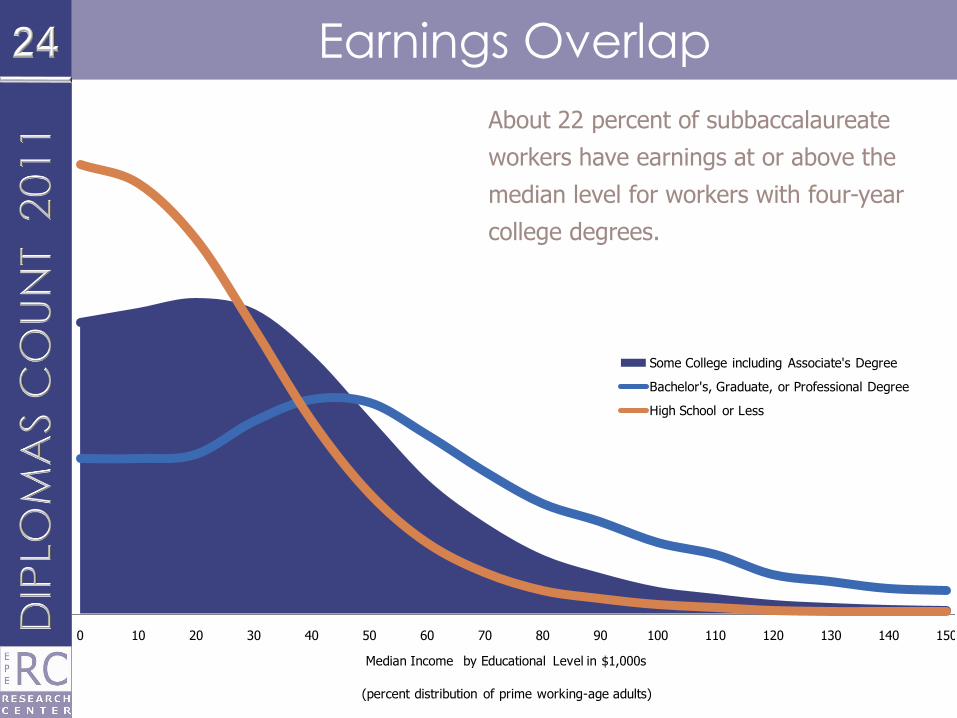
Earnings Overlap
0 10 20 30 40 50 60 70 80 90 100 110 120 130 140 150
Median Income by Educational Level in $1,000s
(percent distribution of prime working-age adults)
Some College including Associate's Degree
Bachelor's, Graduate, or Professional Degree
High School or Less
About 22 percent of subbaccalaureate
workers have earnings at or above the
median level for workers with four-year
college degrees.
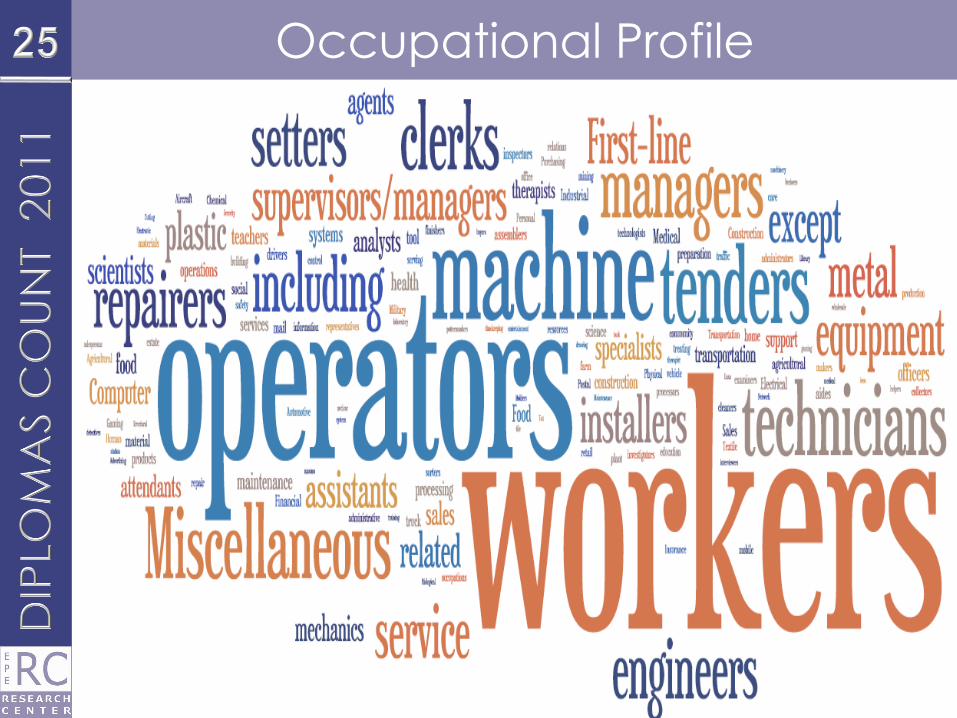
Occupational Profile
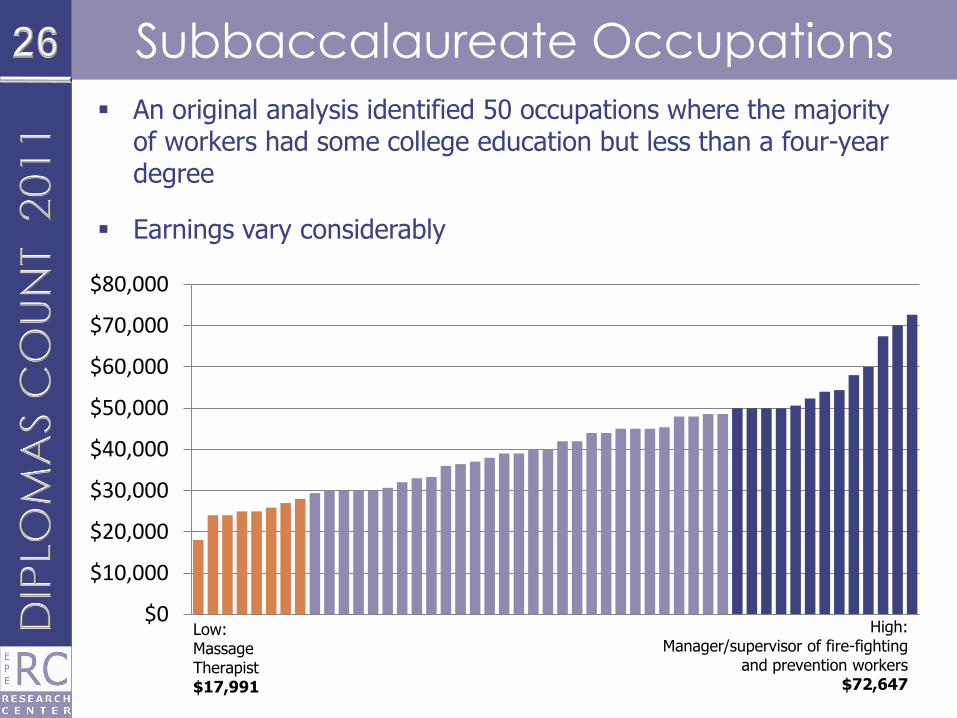
Subbaccalaureate Occupations
An original analysis identified 50 occupations where the majority of workers had some college education but less than a four-year degree
Earnings vary considerably
$0
$10,000
$20,000
$30,000
$40,000
$50,000
$60,000
$70,000
$80,000
Low:Massage Therapist$17,991
High:Manager/supervisor of fire-fighting
and prevention workers$72,647

The State
of State Policy

The 2011 Policy Survey
Each year, the EPE Research Center surveys the 50 states and District of Columbia about their policies in a wide range of areas
Meticulous administration and vetting of surveys
Research Center survey and outside sources provide information about:
♦ Defining college and work readiness
♦ Coursetaking requirements for a diploma
♦ High school completion credentials
♦ High school exit exams
♦ Implementation of federal accountability for graduation rates
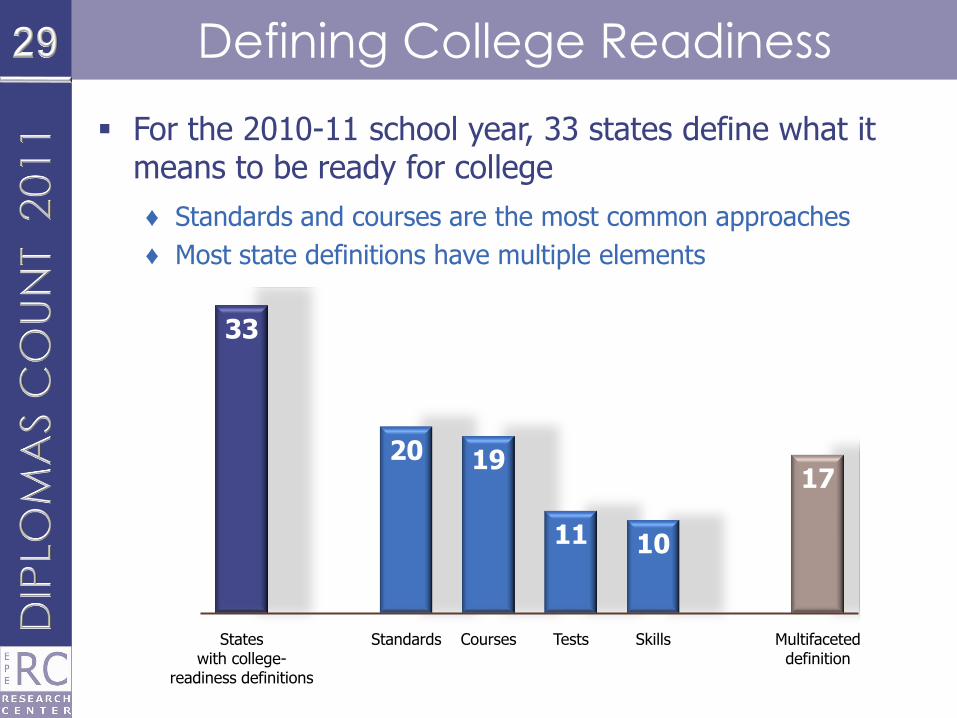
Defining College Readiness
For the 2010-11 school year, 33 states define what it means to be ready for college
♦ Standards and courses are the most common approaches
♦ Most state definitions have multiple elements
33
20 19
11 10
17
States with college-
readiness definitions
Standards Courses Tests Skills Multifaceted definition

What it Takes to Graduate
Requirements for the Class of 2011
EPE Research Center review of state policies shows relatively little change from prior year
Coursetaking for diploma
♦ 21 credits in average state
Completion credentials
♦ 26 states offer advanced diploma or recognition
♦ 29 states issue alternative credential
High school exit exams
♦ 24 states with exit exam for Class of 2011
♦ All but 3 of those states have an alternative route or appeals process

Accountability for Graduation
States approaching milestone for full implementation of 2008 Title I regulations requiring more rigorous calculation methods and higher standards for graduation
EPE Research Center reviewed state implementation of key graduation provisions related to federal accountability
♦ Calculation methods
♦ Current targets
♦ Improvement targets
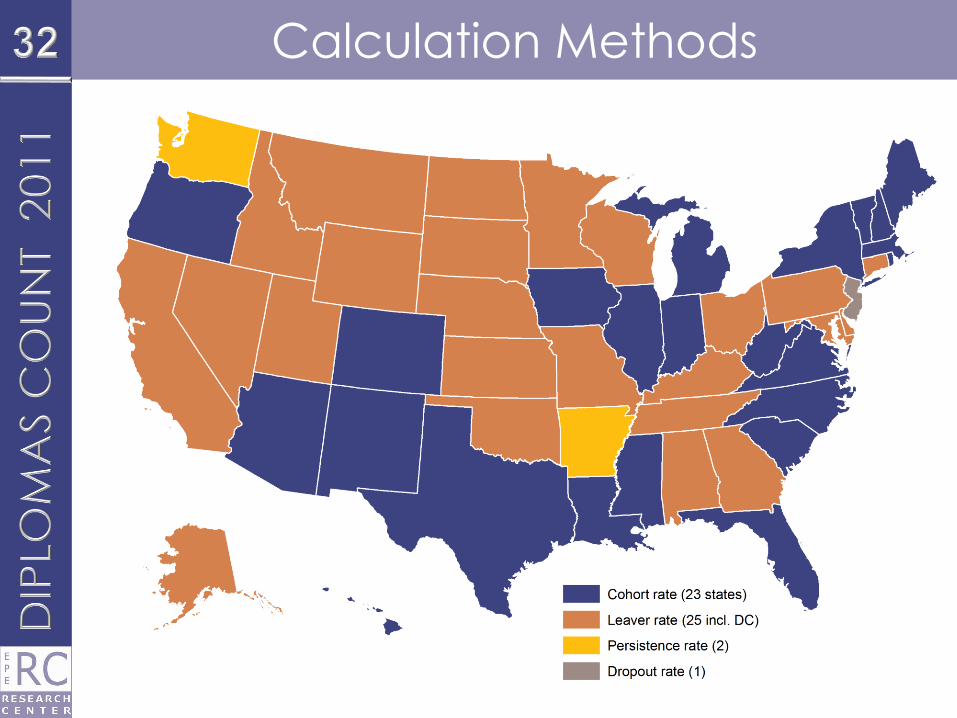
Calculation Methods
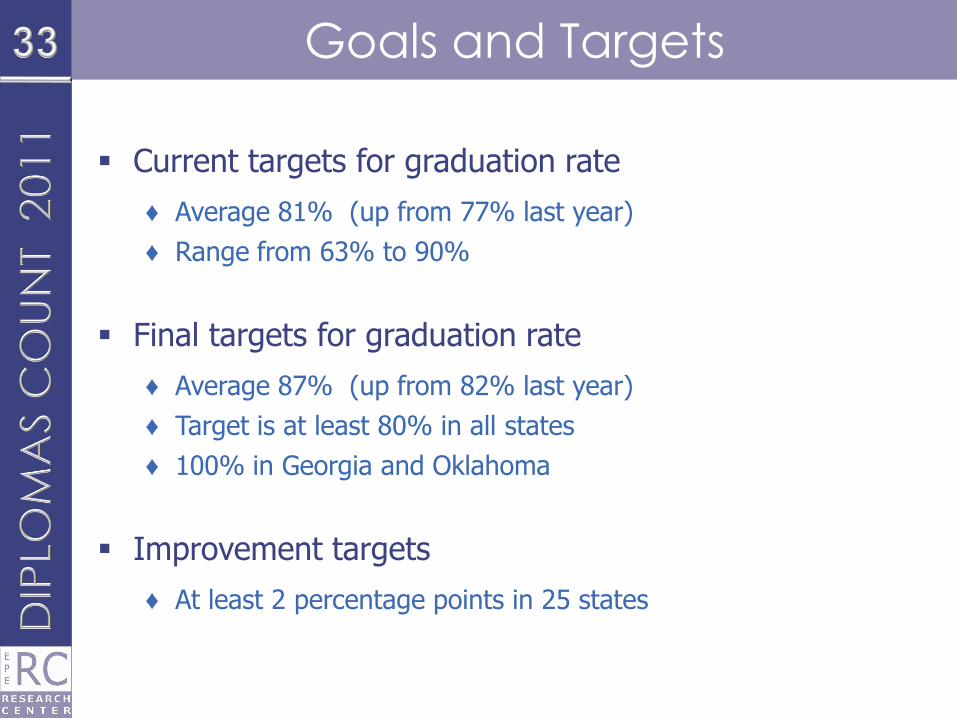
Goals and Targets
Current targets for graduation rate
♦ Average 81% (up from 77% last year)
♦ Range from 63% to 90%
Final targets for graduation rate
♦ Average 87% (up from 82% last year)
♦ Target is at least 80% in all states
♦ 100% in Georgia and Oklahoma
Improvement targets
♦ At least 2 percentage points in 25 states
Online Resources
From
Education Week and the EPE Research Center
Diplomas Count 2011
Full report plus Web-only features
♦ www.edweek.org/go/dc11
Graduation Briefs for States and Nation♦ www.edweek.org/go/dc11/sgb
Education Counts♦ www.edcounts.org
EdWeek Maps
♦ maps.edweek.org
Beyond High School,Before Baccalaureate
With support from the Carnegie
Corporation of New York and the
Charles Stewart Mott Foundation
Contact the EPE Research Center
Christopher B. Swanson
Vice President, Editorial Projects in Education by email: [email protected]
Amy M. Hightower by phone: 301-280-3100
Director, EPE Research Center