beyond the meter - amazon s3 · beyond the meter addressing the locational valuation challenge for...
TRANSCRIPT
Beyond the MeterADDRESSING THE LOCATIONAL
VALUATION CHALLENGE FOR DISTRIBUTED ENERGY
RESOURCESESTABLISHING A COMMON METRIC
FOR LOCATIONAL VALUE
IN PARTNERSHIP WITH
SEPTEMBER 2016

2 NEXANT & SEPA | A BEYOND THE METER SERIES REPORT
BEYOND THE METER SERIES
ForewordThe Smart Electric Power Alliance (SEPA) facilitates the utility industry’s smart transition to a clean energy future through education, research, and collaboration. New technologies—often labeled “smart” technologies—are enabling an acceleration of this transition, allowing the grid to run with greater efficiency, less environmental impact and a more intensive focus on customer engagement and empowerment. However, for this transition to be truly smart and deliver on the promise of these advanced technologies, the utility industry must move beyond simply understanding these resources by taking three key steps. First, utilities must also better understand and proactively engage with consumers. Second, they need to enhance their existing planning processes, applying to the distribution system the level of sophistication used in bulk power system planning and operations. Finally, they need to make a strategic, organization-wide commitment to deploying and integrating these technologies, and examining how these changes may affect the fundamentals of their business models.To help utilities realize this vision, SEPA launched the Beyond the Meter research series with the
white paper “Beyond the Meter: The Potential for a New Customer-Grid Dynamic” in August 2016. The goal of that report, and the series, is to provide our members with insights on cutting-edge approaches to the emerging customer-grid dynamic, which has the potential to revolutionize how utilities provide safe, reliable, affordable, and clean power for consumers.This report, “Addressing the Locational Valuation Challenge for Distributed Energy Resources,” the second in the Beyond the Meter series, focuses on evaluating distributed energy resources (DERs) as grid assets. Several utility-led projects now underway are testing DERs—or as some call them, “non-wires alternatives”—as an option preferable to investments in traditional assets for capacity expansion, upgrade, or renewal. Many thought leaders and industry experts have mapped the stream of potential benefits and provided the initial foundational frameworks to identify opportunities where DERs could serve as preferable non-wires alternatives. So far, much of this work remains conceptual and abstract. Susan Tierney in her recent report, “The Value of DER to D,” writes:
“[F]or DERs designed to compete with traditional utility investments within the distribution-system resource planning process, valuation should move beyond the initial screen, which examines potential benefits, to more location-based analyses that focus on both expected and actual performance of DERs in identifying cost-effective substitutes for traditional D (and for T, and G) solutions.”
In this quote, D represents the distribution system; T, the high-voltage transmission system; and G, the power generation system. “Addressing the Locational Valuation Challenge” works to close this gap by going one step beyond conceptual frameworks and providing a methodology developed by Nexant for quantifying the locational value of DERs for distribution capacity.
REWIRING STANDARD
OPERATING PRACTICES
INTEGRATINGCUSTOMERINSIGHTS
EVALUATINGDERS AS
GRID ASSETS
"BEYOND THE METER:
THE POTENTIALFOR A NEW
CUSTOMER-GRID DYNAMIC."
Source: SEPA

ADDRESSING THE LOCATIONAL VALUATION CHALLENGE FOR DISTRIBUTED ENERGY RESOURCES 3
ABOUT SEPASEPA facilitates collaboration across the electric power industry to enable the smart deployment and integration of clean energy resources. Our focus centers on solar, storage, demand response, and other enabling technologies.
ABOUT NEXANTFormed in 2000, Nexant is a global industry leader focused on every facet of the energy industry. Nexant offers best-in-class energy consulting services that transform utility business processes and improve implementation of smart grid, clean energy, distributed energy resources, and customer experience initiatives. Nexant consultants help utilities embrace a customer-centric strategic planning model that aligns markets, products, technology and customer strategies, reducing risk to achieve superior business results.
ACKNOWLEDGEMENTSSEPA would like to thank Nexant for their time and collaboration on this report. We would also like to thank the following SEPA staff for their involvement in the development and review process: Vazken Kassakhian, Tanuj Deora, Erika Myers, John Sterling, Mike Taylor, and Ryan Edge. Nexant would also like to acknowledge its clients including Central Hudson whose partnership, feedback, and openness to solving new problems enabled Nexant to demonstrate and refine the methodology outlined in this paper.
COPYRIGHT© Smart Electric Power Alliance and Nexant, 2016. All rights reserved. This material may not be published, reproduced, broadcast, rewritten, or redistributed without permission.
The approach is grounded in real-world analysis and utility case study applications. The paper does not attempt to address all the elements of valuation, much less provide a truly holistic approach for evaluating systemic and individual benefits for any specific DER deployment. The focus on locational value does, however, provide a start for one of the key components of developing such an approach. SEPA will continue to work with Nexant, and other SEPA members and industry stakeholders to build upon this research on how to evaluate DERs as grid assets. Additional reports over the next two years will address other
elements of SEPA’s “Beyond the Meter” approach, such as integrating customer insights and rewiring utility operating practices.We hope you find this paper and the entire Beyond the Meter series educational and thought provoking. Your direct feedback on the report and any additional topics you would like SEPA and its research partners to explore will be appreciated.
Tanuj Deora Chief Strategy Officer Email: [email protected] Phone: (202) 552-4411
n Beyond The Meter: The Potential for a New Customer-Grid Dynamic (August 2016)
n Distributed Energy Resources Capabilities Guide (September 2016)
n Benchmarking Utility Organizational Structures: How Renewable Energy is Reshaping the Utility Hierarchy (with ScottMadden)
n The Flexible Solar Utility: Preparing for Solar’s Impacts to Utility Planning and Operations (with the National Renewable Energy Laboratory)
n Planning the Distributed Energy Future: Emerging Electric Utility Distribution Planning Practices for Distributed Energy Resources (with Black & Veatch)
BEYOND THE METER SERIES
OTHER RELATED SEPA RESEARCH

4 NEXANT & SEPA | A BEYOND THE METER SERIES REPORT
BEYOND THE METER SERIES
TABLE OF CONTENTS
1 EXECUTIVE SUMMARY ........................................................................................................................................................5
2 INTRODUCTION ....................................................................................................................................................................8
3 EVOLUTION OF DER VALUATION APPROACHES .................................................................................................... 11
4 QUANTIFYING HOW UNIQUE DERS PROVIDE LOCATIONAL CAPACITY VALUE ........................................... 15
5 UNANSWERED QUESTIONS AND FUTURE CHALLENGES .................................................................................... 32
6 CONCLUSION ...................................................................................................................................................................... 36
AUTHORSJosh Bode, Vice President, Nexant
Mr. Bode is a national expert on valuation of distributed energy resources, targeted demand management, program evaluation, and data analytics using large volumes of hourly and sub-hourly building and distribution system data. He has led over 50 studies including analysis of the impact of DERs and renewables on planning and operations; redesign of programs to align with grid value; energy and demand impacts of new and established utility programs and technologies. He also has extensive experience in the design, development, and application of program design and cost-effectiveness tools. [email protected]
Alana Lemarchand, Senior Consultant, Nexant
Ms. Lemarchand has helped utilities across the country build and implement Distributed Energy Resource (DER) valuation approaches including the locational valuation approach described in this report. She has supported utility clients in New York with REV filings (DSIP and demonstration projects) and in the West with developing overarching Utility of the Future and DER strategic plans. Alana also has deep expertise in using advanced quantitative market research methods to understand customer adoption of DERs. [email protected]
Josh Schellenberg, Vice President, Nexant
Mr. Schellenberg is a Vice President in Nexant’s Strategy & Planning group and a member of SEPA’s Advisory Board for Demand Response and Smart Grid. He is a recognized expert in measurement and evaluation of behind-the-meter distributed energy resources. Mr. Schellenberg is also a thought leader in grid modernization planning, with his work in this area recently cited in a report by President Barack Obama’s Council of Economic Advisors. [email protected]

ADDRESSING THE LOCATIONAL VALUATION CHALLENGE FOR DISTRIBUTED ENERGY RESOURCES 5
1 | Executive SummaryDistributed Energy Resources (DERs) are at the center of a broad array of policy conversations across the country, propelled by potential for growing deployments of DERs to shape energy and grid investments. An explicit goal of some of the more developed efforts—such as the Renewing the Energy Vision (REV) proceeding in New York or the Distribution Resource Planning (DRP) and Integrated Distributed Energy Resources (IDER) proceedings in California—is to establish or unlock DER value through some combination of markets and regulatory innovation. Approaches considered include allowing DERs access to existing wholesale markets for energy and generation capacity and creating new economic constructs for capturing other potential value streams such as locational grid services.
In these places, utility planners are being asked to integrate DERs into distribution system planning. In order to do this it will be necessary to evaluate DERs in the context of more traditional distribution resources. All of this indicates there is a need for a common metric or approach for assessing the capacity deferral value provided by various DERs so their value can be stacked and combined. It is equally important that this metric be translatable to the traditional distribution investments, which may be deferred or avoided. However, a universal, common
methodology has yet to emerge, with DER valuation efforts largely focusing on enumerating various potential value streams, including distribution capacity deferral.1,2 This document seeks to fill that
gap by laying out a methodology for evaluating this capacity deferral potential, heretofore referred to as locational capacity value. This methodology is a real world decision tool that has already been applied at multiple utilities to evaluate DER alternatives to traditional distribution investments but universal enough that it could be adopted by any utility for assessing locational capacity value.
Historical DER valuation approaches tended to center around technology specific benefit cost protocols intended for evaluating program cost-effectiveness. More recently, comprehensive DER
valuation frameworks and locational value demonstration projects have called out and begun to address this locational valuation methodology gap. In addition, it is increasingly apparent that approaches that seek to boil DER value down to a single benefit-cost ratio or average value per kilowatt-hour (kWh) are missing the differences in temporal and locational3 characteristics inherent in DERs. This trend is seen in the New York REV proceeding,
which places DERs in their own category with their own common valuation frameworks, such as the Benefit Cost Analysis Handbook.4 This is one of
1 A key conclusion of the “Value of DER to D” from Analysis Group was the need to “Move beyond conceptual frameworks.”
2 The EPRI Integrated Grid Framework which covers methodological development of hosting capacity measurement provided minimal information on calculating locational “thermal capacity”, noting that “This is an area that merits research to devise a more universal methodology.“
3 For locational value to be realized its value must also be delivered when it is needed (e.g. temporally).
4 http://documents.dps.ny.gov/public/Common/ViewDoc.aspx?DocRefId=%7bF8C835E1-EDB5-47FF-BD78-73EB5B3B177A%7d
All of this indicates there is a need for a common metric or approach for assessing the capacity
deferral value provided by various DERs so their
value can be stacked and combined.
It is increasingly apparent that approaches that seek to boil DER value down to a single benefit-cost ratio or average value per kilowatt-hour (kWh) are missing the differences in temporal and
locational characteristics inherent in DERs.

6 NEXANT & SEPA | A BEYOND THE METER SERIES REPORT
BEYOND THE METER SERIES
several ongoing discussions, which include several proceedings in California (DRP and IDER); the EPRI Integrated Grid project5 (which has included collaboration with utilities in both New York and California6); and the Smart Electric Power Alliance (SEPA) “Distributed Energy Resources Capabilities Guide”.7
The approach covered here is a real world, working methodology that has already been applied in key deferral demonstration projects—including the Central Hudson Targeted Demand Response program—and was foundational to many components of the Central Hudson Distribution System Implementation Plan (DSIP) filed on June 30, 2016,8 including the assessment of DER locational value. This approach is also similar and extensible to the approach used by Southern California Edison (SCE) for their multi-year Preferred Resources Pilot (PRP), another key example demonstrating how DERs can be used to defer or avoid need by providing bulk and locational services.9 This is not the only valid approach, but is one that may spur additional discourse and share real-world experience in an area that is central to understanding DER value in the context of the electric grid.
Whereas Sections 2 and 3 introduce and provide context for the methodologies by describing historical and existing approaches for evaluating DER value, highlighting a methodological gap for locational valuation, Section 4 provides a step by step guide to the approach. First, Section 4.1 explains how locational capacity value is directly
driven by the characteristics of local peak loads and by the deferral of planned distribution investments. The section introduces four key concepts, which help identify when and where DERs have the potential to provide the most distribution deferral value.
n Excess capacity—(or lack thereof) and the magnitude of distribution investments are key drivers of locational value;
n Projected load growth—rates and deferral benefits are closely linked;
n Load shape attributes—distribution area load shapes and the concentration and timing of peak demand vary substantially and matter; and
n Timing, duration, and magnitude of need—How many hours of relief are needed? When do they occur? For how long must production (or reductions) be sustained? How much production (or reduction) must be provided?10
The methodology for calculating a common locational capacity value metric builds on these key concepts and on a probabilistic future load growth simulation approach, and has already been used to calculate avoided transmission and distribution (T&D) costs for Central Hudson.11 Essentially, the economic metric for
the locational capacity provided by DERs is the future cost of traditional distribution equipment (substation, transformer, etc.) that would otherwise be needed. The net locational capacity value of DERs is the avoided distribution cost minus the cost of the DER alternative.12
5 http://www.epri.com/abstracts/Pages/ProductAbstract.aspx?ProductId=000000003002004878
6 http://www.epri.com/abstracts/Pages/ProductAbstract.aspx?ProductId=000000003002008687
7 Smart Electric Power Alliance, September 2016, Distributed Energy Resources Capabilities Guide.
8 http://documents.dps.ny.gov/public/Common/ViewDoc.aspx?DocRefId=%7B2DDB3EBC-411E-4B9E-AB96-7940190F8013%7D
9 The SCE PRP, which will be fed by the Local Resource Capacity (LCR) Request for Offer (RFO) is distinct in that rather than deferring a distribution investment, the DERs are needed to fill the local generation gap created by the decommissioning of generating resources such as the San Onofre nuclear power plant. See https://www.sce.com/wps/wcm/connect/1ac76183-53c2-4762-8db2-4d52345dfa74/SCE_PRPOverview.pdf?MOD=AJPERES
10 What is the magnitude (MW) of the traditional investment that would otherwise be needed?
11 See Appendix D at http://documents.dps.ny.gov/public/Common/ViewDoc.aspx?DocRefId=%7B2DDB3EBC-411E-4B9E-AB96-7940190F8013%7D
The approach covered here is a real world,
working methodology that has already been applied in key deferral
demonstration projects.

ADDRESSING THE LOCATIONAL VALUATION CHALLENGE FOR DISTRIBUTED ENERGY RESOURCES 7
Section 4.2 describes how the allocation of locational capacity value to DERs is directly dependent upon the unique operating characteristics of individual DERs as this drives the ability to defer locational capacity investments. Three questions can help quantify DER locational value by establishing the extent to which characteristics for a given DER differ from distribution equipment, which is always available to accommodate loads:
n Is the DER tied to a specific load shape?
n Is the resource flexible?
n Are there specific operating constraints?
These questions underlie the calculation of Load Carrying Capacity Factor (LCCF): a derating factor that captures the ability of a given DER to provide effective locational capacity, when and where it is needed. As illustrated in Figure 1, alignment of characteristics such as local capacity risk profile and DER production or load profiles are
central to quantifying this derating factor. While LCCF can be used to compare individual resources, the LCCF of a resource portfolio should ideally be calculated as an iterative process where the peaking risk allocation is recalculated as least cost resources
are layered in to the portfolio. Such a portfolio will leverage and combine unique strengths of different resource options—including DERs and traditional distribution investments—resulting in a whole portfolio that is more effective than its individual parts.
Finally, accurately valuing DER locational capacity value is one building block toward holistically integrating DERs into various utility functions, including: distribution planning; bulk power planning; and
customer strategy. However, to do so there are still many key issues that need to be resolved. The final section addresses the following four issues, which are important but by no means exhaustive.
n How can locational value be included in Integrated Benefit Cost Analysis?
n How can integrated distribution planning capability gaps be addressed?
n How can the need for contractual obligation and guarantees be reflective competitive mechanisms?
n How can distribution planning reflect uncertainty and risk planning?
While these future challenges remain unanswered, this paper helps address the locational valuation challenge by establishing a common metric and moving the conversation from exploration of concepts to discussion of real-world, quantitative approaches.
FIGURE 1: ALIGNMENT OF DERS WITH HIGHLY CONCENTRATED PEAKING RISK
100
80
60
40
20
0
30
20
10
0
CONCENTRATION OF PEAK RISKHOUR ENDING
C&I AC
0 4 8 12 16 20 24
SOLARC&I EE LIGHTING RES EE LIGHTING RES ROOM AC
BASED ON LOCAL PEAK DAYS ACROSS 4-YEAR HOURLY LOADS
NO
RMAL
IZED
SH
APE
(DER
PEA
K=10
0%)
PEAK
ING
RIS
K AL
LOC
ATIO
N (%
)
Source: Nexant
While these future challenges remain
unanswered, this paper helps address the locational
valuation challenge by establishing a common
metric and moving the conversation from
exploration of concepts to discussion of real-world, quantitative approaches.
12 Which may reflect non-locational benefits and costs.

8 NEXANT & SEPA | A BEYOND THE METER SERIES REPORT
BEYOND THE METER SERIES
2 | IntroductionThere are two distinct features of Distributed Energy Resources (DERs): they include a wide range of technologies with diverse operating characteristics and they can affect all aspects of the electric grid’s infrastructure, including investments in the central, or bulk, electricity system, and in distribution grids. Centralized power plants, in contrast, do not impact the need for distribution grid investments and distribution grid investments occur independently of generation investments. DERs are at the center of a broad array of policy conversations across the country, propelled by potential for growing deployments of DERs to shape energy and grid investments. An explicit goal of some of the more developed efforts, such as the Renewing the Energy Vision (REV) proceeding in New York or the Distribution Resource Planning (DRP) and Integrated Distributed Energy Resources (IDER) proceedings in California, is to establish or unlock DER value through some combination of markets and regulatory innovation. Approaches considered include allowing DERs access to existing wholesale markets for energy and generation capacity and creating new economic constructs for capturing other potential value streams such as locational grid services.13
In these places, utility planners are being asked to integrate DERs into distribution system planning.
To do so it will be necessary to evaluate DERs in the context of more traditional distribution resources. This is largely uncharted territory for utilities in most regions because of various policy priorities and utility structures. For example, vertically integrated utilities face a much different regulatory reality and set of economic constructs than do utilities in retail
choice states like New York or states like California where revenues are decoupled from energy generation.14 Nonetheless, there is an interest in better understanding the value and interplay between DERs and the electric grid to more fully realize the potential of decentralized, non-wires alternatives. Across these various state and utility efforts DERs can broadly be defined to include: customer owned generation; rooftop solar
photovoltaics (PV); battery storage; energy efficiency (EE); demand response (DR); and sometimes electric vehicles—namely, an extensive array of relatively small, geographically dispersed resources that connect directly to the distribution system, either as changes in load or as local generation, rather than to the bulk transmission system.
While integrated resource planning15 for the bulk system has been applied for many years, integrated distribution resource planning is an emerging concept. Part of the impetus behind this concept is if and how planning for various DER related
13 Might include distribution capacity deferral, voltage support, etc.
14 In vertically integrated markets individual state control is much greater than in states operated by regional markets (e.g., Regional Transmission Organizations or Independent System Operators). This difference in “control” could lead to very different outcomes and different perceived economic value (customer focused versus all market participant focused). Differences in load serving obligations from state to state may also drive different solutions. Even in market operated states like New York and California where transmission and distribution infrastructure and wholesale energy and capacity markets play prominent roles in utility business decisions, there are still policy changes that need to be made to enable utilities to incorporate the economics of DERs into planning and operations. Indeed, this is a primary purpose of proceedings such as the REV, DRP, and IDER).
15 In efficient integrated resource planning—the process behind bulk system planning—net benefits for customers are maximized. To do this, planners identify the resource and investment mix that results in the greatest benefit at the least cost, while accounting for risk and uncertainty.
Utility planners are being asked to integrate
DERs into distribution system planning. To do so it will be necessary
to evaluate DERs in the context of more
traditional distribution resources.

ADDRESSING THE LOCATIONAL VALUATION CHALLENGE FOR DISTRIBUTED ENERGY RESOURCES 9
programs or resources can be aggregated and fed into the resource planning process. Within this context, establishing a standard, common language for comparing traditional distribution investments with DER alternatives is valuable not only for regions already venturing into the new world of integrated distributed resource planning with DERs, but also for regions where stakeholders may simply want to better understand how integrated planning could be applied at the distribution level.
This document proposes a straightforward methodology for establishing a common metric for distribution value across the broad array of DERs, as well as traditional distribution investments. A particular focus of the methodology is an evaluation of the locational impacts of DERs. There have been several recent explorations into DER potential for delivering locational value, as well as gaining a better understanding of how to locate DERs to most effectively leverage existing hosting capacity and minimize potential locational costs.16
Locational value includes the potential to defer or eliminate the need for localized grid infrastructure investments needed for supplying power (transformers, substations, etc.). These investments are known as distribution capacity17, are distinct from hosting capacity, and are driven by the few hours of greatest peak capacity served at a location. When peak capacity causes infrastructure to approach or surpass thermal design ratings,
wear and tear can be accelerated and damage can occur. When DERs are deployed, aggregated, and incorporated into the distribution planning process in such a way that a traditional investment can be deferred or avoided, there is an economic value18 that can be captured, assuming there are regulatory or economic structures in place for capturing this value. The magnitude of this locational distribution capacity value for a particular DER investment depends upon the value of the deferred capacity
investment, as well as the ability of that DER to defer the need, given unique operational characteristics. Because DERs are by nature small and disparate, the ability to actually defer such an investment requires an aggregation or a portfolio of DERs to be assembled that would function together in the same way as the traditional investment would have functioned.19 Unlike research into evaluation of hosting capacity, research into evaluation of thermal distribution capacity has been less
widespread or universally discussed.
In addition, distributed energy resources vary in terms of flexibility, load shapes, and operating characteristics. Not all distributed energy resources are flexible, for example. Some are tied to specific load shapes or production patterns and are not available for all hours. Other resources have limits on how long they can sustain production (or load reductions), how often they can be used, and how fast they can be delivered. These characteristics fundamentally affect the value of each type of
16 Locational costs largely consist of grid reinforcements necessary to maintain reliability and power quality in the face of geographic concentrations of DERs. The ability of the existing grid infrastructure to support DERs is referred to as hosting capacity. Depending on their location and their unique operation characteristics, DERs may increase, decrease, or leave unchanged the need for grid investment to maintain these important operational factors. The locational value maps being developed for the California DRP and EPRI’s Integrated Grid Framework are a prime example of current work on understanding these dynamics.
17 Referred to as thermal capacity in the EPRI Integrated Grid Framework.
18 This may not be the case for utilities whose regulatory load serving obligations do not allow for substituting utility owned and controlled infrastructure for resources owned and / or controlled by customers or by third parties.
19 As an exception, a large battery connected at a substation or transformer may not require aggregation to defer a distribution investment. However, most individual DERs (typically a few kW) are too small to effectively defer a distribution investment (typically hundreds of kW).
The magnitude of this locational distribution
capacity value for a particular DER investment depends
upon the value of the deferred capacity investment,
as well as the ability of that DER to defer the need, given unique operational
characteristics.

10 NEXANT & SEPA | A BEYOND THE METER SERIES REPORT
BEYOND THE METER SERIES
distributed energy resource in each distribution area and also affect how they should be integrated into distribution planning and, perhaps, markets.
All of this indicates there is a need for a common metric or approach for assessing the capacity deferral value provided by various DERs so their value can be stacked and combined. It is equally important that this metric be translatable to the traditional distribution investments, which may be deferred or avoided. However, a universal, common methodology has yet to emerge, with DER valuation efforts largely focusing on enumerating various potential value streams, including distribution capacity deferral20,21. This document seeks to fill that gap by laying out a methodology for evaluating this
capacity deferral potential, heretofore referred to as locational capacity value. This methodology is a real world decision tool that has already been applied at multiple utilities to evaluate DER alternatives to traditional distribution investments but universal enough that it could be adopted by any utility for assessing locational capacity value.
Establishing this common metric for enabling comparison of traditional and non-traditional distribution resources including DERs with different characteristics will help enable:
n Balanced resource mix investment;
n Technology agnostic resource selection; and
n Equitable cost sharing.
2.1 | BALANCED RESOURCE MIX INVESTMENTA common metric for locational capacity value enables comparison of DER technologies and portfolio optimization. This helps identify a functional mix of least cost resources (DER and traditional infrastructure) to address a variety of needs and goals (transmission and distribution, clean energy, capacity utilization, rate stability, etc.). A functional, least cost resource mix is one that capitalizes on the various resource characteristics (reliability, flexibility, predictability, low carbon
intensity, resource efficiency, affordability, social equity, etc.) to supply power with a desired set of attributes. A suite or portfolio of complementary resources can be designed and balanced to supply a set of desired power attributes (net benefits), which a single resource or investment category may be unable to supply on its own. In this way, a balanced resource mix can maximize net benefits22 across resources and across goals.
2.2 | TECHNOLOGY AGNOSTIC RESOURCE SELECTIONA common metric enables technology agnostic valuation, which captures unique resource characteristics and their impact on locational capacity value. This is doubly important given
the rapid pace of technology change to enable establishing a common language that does not favor one technology over another and that helps prevent siloed, less efficient investment.
20 A key conclusion of the “Value of DER to D” from Analysis Group was the need to “Move beyond conceptual frameworks.”
21 The EPRI Integrated Grid Framework which covers methodological development of hosting capacity measurement provided minimal information on calculating locational “thermal capacity,” noting that, “This is an area that merits research to devise a more universal methodology.”
22 Note that the market or regulatory structure within which a utility operates has a substantial impact on the definition and scope of net benefits. For example, in vertically integrated markets individual state control is much greater than in states operated by regional markets (e.g., Regional Transmission Organizations or Independent System Operators). This difference in “control” could lead to very different outcomes and different perceived economic value (customer focused versus all market participant focused).

ADDRESSING THE LOCATIONAL VALUATION CHALLENGE FOR DISTRIBUTED ENERGY RESOURCES 11
2.3 | EQUITABLE COST SHARINGA common metric for valuing DER locational capacity value can also be used to appropriately reflect economic signals used to inform DER investment.23 In addition to enabling a balanced
resource mix investment, such signals can help avoid over or underinvestment in the grid or DERs (by the utility or by customers).
3 | Evolution of DER Valuation Approaches
3.1 | FROM TECHNOLOGY SPECIFIC PROTOCOLS TO DER VALUATION FRAMEWORKS
Many DER technologies have been around for a long time and utilities in many states have been asked to fund DER programs for various aims including societal and environmental priorities. Because of this, valuation frameworks and methodologies have been evolving for some time. Historical approaches tended to center around technology specific benefit cost protocols.
The value of these earlier frameworks is that they began to not only enumerate cost and benefit categories, but also developed methodologies for calculating these values. Most categories have more or less regionally established approaches to valuation, based on the regulatory priorities and unique power system configurations in each region. In particular, energy costs (fuel, O&M, hedge), generating capacity, overhead costs (program admin, etc.), and non-energy impacts (environmental compliance, other socialized costs or benefits) all have methodologies that while not entirely immutable or perfect are relatively established and more
importantly can be appropriately valued at the bulk system level.
However, the goal of these protocols was largely to assess overall cost effectiveness of rate funded
programs rather than to capture locational value. Because of this, locational value was either not addressed at all or addressed in an overly simplistic manner, often using system average approaches and failing to address unique technology and program specific operating characteristics. In addition, such frameworks were siloed in that each reflects the unique operating and program characteristics of each technology, a specialization that
did not lend itself to comparing value across DERs and even less to understanding potential synergies between DERs, which instead might compete for funding simply on cost-effectiveness as rolled into a single benefit cost ratio.
More recently, comprehensive DER valuation frameworks and locational value demonstration projects have called out and begun to address this locational valuation methodology gap. In addition,
23 There are multiple potential economic mechanisms that could be used to communicate distribution deferral value, including location specific critical peak pricing, incentives in the form of targeted demand management programs, etc. but this is not the focus of this document. For further reading see http://www.nexant.com/resources/designing-and-unlocking-markets-distributed-energy-resources, prepared for the New York Joint Utilities as part of the New York REV.
Such frameworks were siloed in that each reflects the unique operating and program characteristics
of each technology, a specialization that did not
lend itself to comparing value across DERs and even less to understanding potential synergies between DERs.

12 NEXANT & SEPA | A BEYOND THE METER SERIES REPORT
BEYOND THE METER SERIES
it is increasingly recognized that approaches that seek to boil DER value down to a single benefit-cost ratio or average value per kilowatt-hour (kWh) are missing the differences in temporal24 and locational25 characteristics inherent in DERs. This trend can be seen in the New York REV proceeding, which conceives of DERs as a category and have begun the work of establishing common valuation frameworks, such as the Benefit Cost Analysis Handbook. This is one of several ongoing discussions that include several proceedings in California (DRP, IDER), the EPRI Integrated Grid project (which has included collaboration with utilities in both New York and California26), and the Smart Electric Power Alliance (SEPA) “Distributed Energy Resources Capabilities Guide”.27
These documents build and expand upon approaches such as Value of Solar (VOS), an approach used in many policy discussions around the country to evaluate distributed PV. While there have been dozens of VOS studies over the past few years and there is variation in the methodologies and approaches used, as the discussion evolves there does appear to be a coalescence around a set of benefit and cost categories,28 which directly affect the energy system as well as an emerging attention paid to the interplay between DERs and the grid.29 An example of this is the Tennessee Valley Authority (TVA) VOS study30 in which various stakeholders and experts (TVA, utilities, EPRI, SEPA) collaborated to develop a consensus framework for evaluating distributed PV and then applied it to estimate an average net value for PV on the TVA system.
While naming conventions have not been standardized, the common trends across various
DER valuation frameworks are that they are meant to:
n Apply to various DERs (not technology specific);
n Address the interplay between DERs and the grid; and
n Reflect locational and temporal value.
The often stated goal of these frameworks is to facilitate the incorporation of DERs into distribution planning, either directly or potentially through some market mechanism, be it tariffs and contracts, access to existing wholesale markets, or new future locational value markets.
Table 1 summarizes six energy and grid related capabilities that can be provided by DERs31 including any existing competitive mechanisms used in some U.S. markets for capturing an economic value for each. Note that many grid products and services provide value to the bulk system (capabilities in blue), where well established competitive mechanisms—wholesale markets—already exist, but are not necessarily designed for small, geographically dispersed DERs. Part of what enables the market based competitive mechanisms for the bulk services is the existence of standardized approaches for valuation and measurement. This is not to say that such approaches are universal across the entire country but there is sufficient agreement and technology to enable markets to function.
In contrast, there are no formal market products for capturing DER capability value at the distribution level (capabilities in green), also referred to as locational value. This is perhaps in part a result of the data intensity, technical complexity, and lack of
24 The extent to which DER characteristics allow delivery of value when it is needed.
25 The extent to which DERs are co-located with need on the distribution system. For locational value to be realized its value must also be delivered when it is needed (e.g., temporally).
26 http://www.epri.com/abstracts/Pages/ProductAbstract.aspx?ProductId=000000003002008687
27 Smart Electric Power Alliance, September 2016, Distributed Energy Resources Capabilities Guide.
28 Energy production (fuel, O&M, hedge), generating capacity, grid impacts / ancillary services, overhead costs (program admin, etc.), and non-energy impacts (environmental compliance, other socialized costs or benefits).
29 Grid impacts or ancillary services.
30 https://www.tva.gov/Energy/Renewable-Energy-Solutions/Distributed-Generation%E2%80%93Integrated-Value-Report.
31 See the SEPA DERs Capabilities Guide for an in depth exploration of each capability and how they vary for individual DER technologies.

ADDRESSING THE LOCATIONAL VALUATION CHALLENGE FOR DISTRIBUTED ENERGY RESOURCES 13
universal approach to quantifying locational value. As described in the introduction, understanding and quantifying locational value and impacts is a key area of ongoing research. Understanding of voltage regulation and hosting capacity has been at the center of efforts in California, with the development of hosting capacity maps for the DRP proceeding as well as with various demonstration projects establishing / measuring technical value,
hosting capacity, and for actually demonstrating locational value.35 In New York, the recent Brooklyn-Queens Demand Management (BQDM) initiative36 and Central Hudson’s Targeted Demand Response (TDR)37 program are both examples where competitive mechanisms were used to incent various types of DERs to locate and deliver resources where they provide the most value.
3.2 | FILLING THE LOCATIONAL VALUATION METHODOLOGY GAPAs described earlier, there is a gap between standardization of valuation methods for bulk level impacts as compared to locational impacts, and
this gap has not been closed by the various DER valuation frameworks that have been proposed. These documents tend to enumerate impacts
TABLE 1: ENERGY AND GRID RELATED CAPABILITIES THAT CAN BE PROVIDED BY DERS
IMPACT DER CAPABILITIES / SERVICES KEY FUNCTION EXISTING COMPETITIVE
MECHANISMS AND PRODUCTS
BULK LEVEL IMPACT
Energy production What mix of resources can produce electricity at lowest cost?
§ Bilateral contracts § ISO Day-Ahead Auctions § ISO Real-Time Auctions
Generation Capacity Is the system able to meet extreme32 peak demand levels?
§ ISO capacity markets § Utility Tariffs
Frequency regulation / Load following / Balancing
Can the bulk system respond quickly enough to balance supply and demand?
§ Regulation § Utility OATTs33
Spinning reserve / Non-spinning reserve
Does the grid have the ability to withstand system shocks (e.g. forced outages and unforecasted changes in loads)?
§ 10 Minute Spinning Reserve § 10 Minute Non-Synchronous Reserve
§ 30 Minute Operating Reserve34
LOCATIONAL IMPACT
Locational (T&D) Capacity
Is the distribution system able to accommodate local peak loads?
§ Utility program tariffs RFI/RFP’s
Voltage regulationAre voltage levels stable and reliable? Can line losses be reduced?
§ No market § Some tariffs
Source: Nexant
32 Multi-year peaking conditions that may not occur every year.
33 Open Access Transmission Tariff
34 These example products are from the NYISO, but product time intervals vary by control area.
35 See Integration Capacity Analysis (ICA) Maps and public workshop content for Demonstration Projects A, B, C, D, and E at http://www.cpuc.ca.gov/General.aspx?id=5071
36 In the BQDM initiative a portfolio of DERs was identified for deferral of $1B substation upgrade.
37 See Section VII.B at http://documents.dps.ny.gov/public/Common/ViewDoc.aspx?DocRefId=%7B2DDB3EBC-411E-4B9E-AB96-7940190F8013%7D

14 NEXANT & SEPA | A BEYOND THE METER SERIES REPORT
BEYOND THE METER SERIES
rather than to quantify impacts, to the point where a recent assessment of the literature called for a need to, “Move beyond conceptual frameworks.”38 When valuation studies have been published they are generally an assessment of specific regions or demonstration projects. Layered upon this is a regulatory complexity that may lead to different approaches given local market rules, local electric system makeup, and local policy considerations and priorities.
Because of these regional differences and the dynamic nature of the electricity system (locational value that changes over time), deriving a fixed, single average DER value estimate is not likely to accurately reflect the value of DERs in different locations and regions. Further, it may not be feasible or appropriate to derive a full valuation methodology for all bulk and locational impacts that would reflect all regional characteristics and such is not the aim of this document.
However, continuing to base DER locational value on contributions to system peak needs for a single hour, as has been done historically, simply does not accurately reflect the multi-faceted interaction of locational grid needs with the diverse range of DER operating characteristics. According to EPRI, which has done considerable research on voltage regulation and hosting capacity, the other key components of locational value—locational capacity valuation—is an area “that merits research to devise a more universal methodology.” In addition, locational value of DERs have historically gone unmeasured with the exception of a few targeted deferral projects, but the ability to both measure locational value and incorporate it into distribution planning may soon expand due to
ongoing improvements in data availability as well as technology improvements.39 For all of these reasons this paper seeks to fill this gap by proposing a straightforward methodology for establishing a common metric for locational capacity value.
The approach that will be covered in the remainder of the paper is a real world, working methodology that has already been applied in key deferral demonstration projects including multiple projects in New York State such as the Central Hudson TDR, and was foundational to many components of the Central Hudson Distribution System Implementation Plan (DSIP) filed on June 30, 2016,40 including the assessment of DER locational value. This approach is also similar and extensible to the approach used by Southern California Edison (SCE) for their multi-year Preferred Resources Pilot (PRP), another key example demonstrating how DERs can be used to defer or avoid need by providing bulk and locational services.41 This is not the only valid approach, but is one that may spur additional discourse and share real-world experience in an area that is central to understanding DER value in the context of the electric grid.
Finally, while this methodology is an approach for identifying distribution value, it is not a recommendation or an approach for procuring DERs and in and of itself was not the DER procurement vehicle for any of the examples referenced. There are a variety of direct and indirect means for procuring DERs, including auction mechanisms, tariffs, a request for proposal process, etc. This valuation approach can be used simply for planning purposes or to complement any of those procurement methods and does not preclude or preference any one of them.
38 Value of DER to D, Analysis Group, 2016.
39 SCADA, AMI, and in the near future: advanced DMS, DERMS and smart inverters—EV or PV—or fast dispatch DR
40 http://documents.dps.ny.gov/public/Common/ViewDoc.aspx?DocRefId=%7B2DDB3EBC-411E-4B9E-AB96-7940190F8013%7D
41 The SCE PRP, which will be fed by the Local Resource Capacity (LCR) Request for Offer (RFO) is distinct in that rather than deferring a distribution investment, the DERs are needed to fill the local generation gap created by the decommissioning of generating resources such as the San Onofre nuclear power plant. See https://www.sce.com/wps/wcm/connect/1ac76183-53c2-4762-8db2-4d52345dfa74/SCE_PRPOverview.pdf?MOD=AJPERES

ADDRESSING THE LOCATIONAL VALUATION CHALLENGE FOR DISTRIBUTED ENERGY RESOURCES 15
4 | Quantifying How Unique DERs Provide Locational Capacity Value
One of the unique attributes of DERs is that they affect all aspects of the electricity grid’s infrastructure, including the need for transmission, generation, and distribution capacity. While a significant amount of electricity costs are tied to fuel and energy production, a larger amount is tied to power infrastructure. Many DERs produce energy, and all DERs reduce the need to transmit power across long distances, either through local energy production or by reducing local demand for energy. Both generation and distribution infrastructure are sized to meet the aggregate peak demand of customers when it is forecasted to be at its highest. The key difference is the geographic scale of load being served. Whereas generation and transmission infrastructure is sized to cover the system demand over broad geographic regions, distribution infrastructure is sized to cover the coincident demand of much smaller geographic areas, whose locational capacity needs can be quite diverse. If DERs deliver when the system peaks, they can help avoid the need to build peaking generators that mostly sit idle throughout the year. If DERs deliver when local demand is nearing distribution capacity they may help avoid or defer growth-related distribution investments.
System peaks and distribution peaks do not necessarily occur at the same time or on the same day. The implication is that benefits may not be additive for all DERs because a DER responding
to a bulk system need may not be able to also respond to a distribution need. Further, some DERs are only able to deliver reductions or energy at certain times that may or may not align with the system or distribution peaks due to technology (e.g., solar) or customer characteristics (e.g., commercial office customers have limited loads
in the evenings). Hence, in order to provide functional locational capacity value, DERs must usually be aggregated to provide enough capacity when and where it is needed. Often, mixed technology portfolios can more efficiently provide this capacity, especially if one considers that traditional infrastructure is one of many potential distribution resources and that a portfolio can be constructed of a mix of traditional investments and DERs.
The first part of this section—4.1 Quantifying distribution investment deferral value—explains how locational capacity value is directly driven by the characteristics of local peak loads and by the deferral of planned distribution investments. Then it will describe an approach for quantifying this value through calculating a common locational capacity value metric. The second part of this section—4.2 How to quantify locational value for unique DERs—will describe how the allocation of locational capacity value to DERs is directly dependent upon the unique operating characteristics of individual DERs as this drives the ability to defer locational capacity investments.
Whereas generation and transmission infrastructure
is sized to cover the system demand over
broad geographic regions, distribution infrastructure is sized to cover the coincident
demand of much smaller geographic areas, whose locational capacity needs
can be quite diverse.

16 NEXANT & SEPA | A BEYOND THE METER SERIES REPORT
BEYOND THE METER SERIES
4.1 | QUANTIFYING DISTRIBUTION INVESTMENT DEFERRAL VALUEThe electricity distribution system is the last link in a vast infrastructure network that connects electricity end users with generation sources. One vital role of the electric utility is to ensure that electricity supply remains reliable by projecting future demand and reinforcing the local distribution network so that distribution capacity is available to meet local needs as they grow over time, thereby avoiding costly outages. When demand exceeds local distribution capacity, equipment is overloaded, degrades more quickly, and the risk of equipment stress or failure grows considerably.
The locational capacity value of DERs is directly tied to supplying this distribution capacity42—the ability to provide load relief when needed to ensure reliability and avoid distribution equipment overloads. Essentially, the economic metric for the locational capacity provided by DERs is the future cost of traditional distribution equipment (substation, transformer, etc.) that would otherwise be needed. The net locational capacity value of DERs is the avoided distribution cost minus the cost of the DER alternative.43 Whether provided by DERs or by traditional upgrades to distribution circuits, locational distribution capacity is a type of insurance against equipment stress of failure. If DERs cannot be incorporated into distribution planning with enough lead time to defer an otherwise necessary traditional investment, the value DERs provide diminishes substantially.
When distribution investments are avoided or deferred, it frees up capital for other alternate uses, improving the efficient use of resources. However, the value of distribution deferral varies significantly across local distribution areas. Four key concepts can help identify when and where DERs have the potential to provide the most distribution deferral value.
n Excess capacity—(or lack thereof) and the magnitude of distribution investments are key drivers of locational value;
n Projected load growth—rates and deferral benefits are closely linked;
n Load shape attributes—distribution area load shapes and the concentration and timing of peak demand vary substantially and matter; and
n Timing, duration, and magnitude of need—How many hours of relief are needed? When do they occur? For how long must production (or reductions) be sustained? How much production (or reduction) must be provided?44
In areas with excess distribution capacity and where local, coincident peaks are declining or growing slowly, the value of distribution capacity relief can be minimal. By contrast, in areas such as Brooklyn-Queens, where a large, growth related investment is imminent, the value of distribution capacity relief can be quite substantial.
4.1.1 | EXCESS CAPACITY (OR LACK THEREOF) IS A KEY DRIVER OF LOCATIONAL VALUEThe distribution system must have enough capacity to support local loads. Traditional forms of locational capacity include utility owned and operated substations, feeders, and transformers. Some investments are tied to customer interconnection costs and are essentially fixed. Other investments must take place because of aging or failed equipment or because of the need to improve reliability and modernize the grid.
Unless it is infeasible to do so, aging or failed equipment must usually be replaced with traditional equipment. Other distribution investments are driven by local, coincident peak loads, presenting an opportunity for managing
42 Distinct from hosting capacity and voltage regulation capabilities—the other locational value stream
43 Which may reflect non-locational benefits and costs
44 What is the magnitude (MW) of the traditional investment that would otherwise be needed?

ADDRESSING THE LOCATIONAL VALUATION CHALLENGE FOR DISTRIBUTED ENERGY RESOURCES 17
load growth with strategically placed DERs in lieu of traditional investments. By integrating DERs into distribution planning and operations it is possible to manage local, coincident demands that are shared across many customers. If a customer helps reduce coincident demand, either by injecting power within the distribution grid (e.g., behind-the-meter generation) or by reducing demand, the unused capacity can accommodate another customer’s load growth and thereby help avoid or defer investments required to meet load growth, assuming issues of certainty and load serving obligation are addressed.45
Figure 2 is a conceptual example that demonstrates how large, traditional capacity investments are lumpy and infrequent—when distribution components are upgraded or reinforced to supply load growth, excess capacity to accommodate additional load growth is typically installed. The blue line represents forecasted peak demand growth and the top, orange line represents total built capacity supplied by major traditional infrastructure upgrades to meet that growth (each step represents an upgrade). The grey line represents what peak demand growth would be net of DER-supplied locational capacity. The yellow line represents total built capacity supplied by major traditional infrastructure upgrades to meet the growth remaining after using DERs to supply some of the load. Note that with DERs it is possible to delay some capacity investments and to reduce their frequency. This leads to a tighter operation of the distribution system, where there is less traditional locational capacity headroom because it is provided by a fleet of DERs over which the operator may not have full control. It is important to remember with less excess capacity, grid management becomes more challenging and the likelihood of component
failures and adverse reliability events in the area’s distribution grid increases. This means that limiting the excess headroom provided by traditional infrastructure will require changes to operations and system requirements going forward.
4.1.2 | PROJECTED LOAD GROWTH RATES CLOSELY LINKED TO LOCATIONAL VALUEBecause locational capacity value is driven by the deferral of traditional distribution investments, it follows that value will be greater where more, higher value investments will be deferred. Figure 3 demonstrates this concept. The top frame shows a baseline scenario where distribution investments of about $120M each are needed at about five year intervals to address load growth, with a Net Present Value (NPV) cost of about $280M. The middle frame shows conceptually how these
FIGURE 2: CONCEPTUAL ILLUSTRATION OF LOCAL PEAK DEMAND AND DISTRIBUTION CAPACITY
Source: Nexant
70
60
50
40
30
20
NETWORK PEAK DEMAND FORECAST (MWA)FUTURE YEARS
0 3 6 9 12 15
NETWORK PEAK DEMAND WITH DERLOAD CARRYING CAPACITY (MWA)LOAD CARRING CAPACITY WITH DR
MW
A
MAJOR UPGRADESWITHOUT DER
45 Because this locational capacity relies on customer behavior and / or customer owned investments, distribution operators do not have the same level of control as they would over traditional distribution investments, therefore it is critical that the DERs provide locational capacity when and where it is needed, and that there is sufficient certainty that this DER based capacity will serve peak loads when needed. This means that when establishing a common metric for locational capacity value it is critical to take reliability and certainty into account. This may require changes to technical protocols (e.g., changes to IEEE guidelines to enable solar PV smart inverters to island and ride through instead of shutting off during voltage disturbances) and to the regulatory compact in some regions where utilities are not allowed to accept a lower level of load serving certainty.

18 NEXANT & SEPA | A BEYOND THE METER SERIES REPORT
BEYOND THE METER SERIES
investments could be deferred by using a solution integrating DERs with distribution equipment. In this scenario the first distribution investment would be deferred for five years, resulting in an NPV savings of about $55M ($280M minus $225M). The bottom frame shows conceptually how deferral value would increase if load growth were slower, meaning the integrated DER solution could defer the distribution investments for at least ten years (instead of five years). This longer deferral period would result in a much higher savings of about $114M ($280M minus $166M).
4.1.3 | LOAD SHAPES MATTER AND VARY SUBSTANTIALLY BY LOCATIONDemand management through DERs needs to ramp up at the right time and right place to provide distribution relief or deferral value. The magnitude of locational capacity introduced by a portfolio of DERs needs to be large enough to actually influence both investment decisions and reliability. Finally, the resources need to target the right hours, must be available to cover all peak hours, and must provide capacity with certainty comparable to traditional distribution equipment. If any of these criteria are not satisfied, the DER portfolio will fail to avoid peaking damage or stress and a forced outage may be required to avoid distribution equipment overloads.
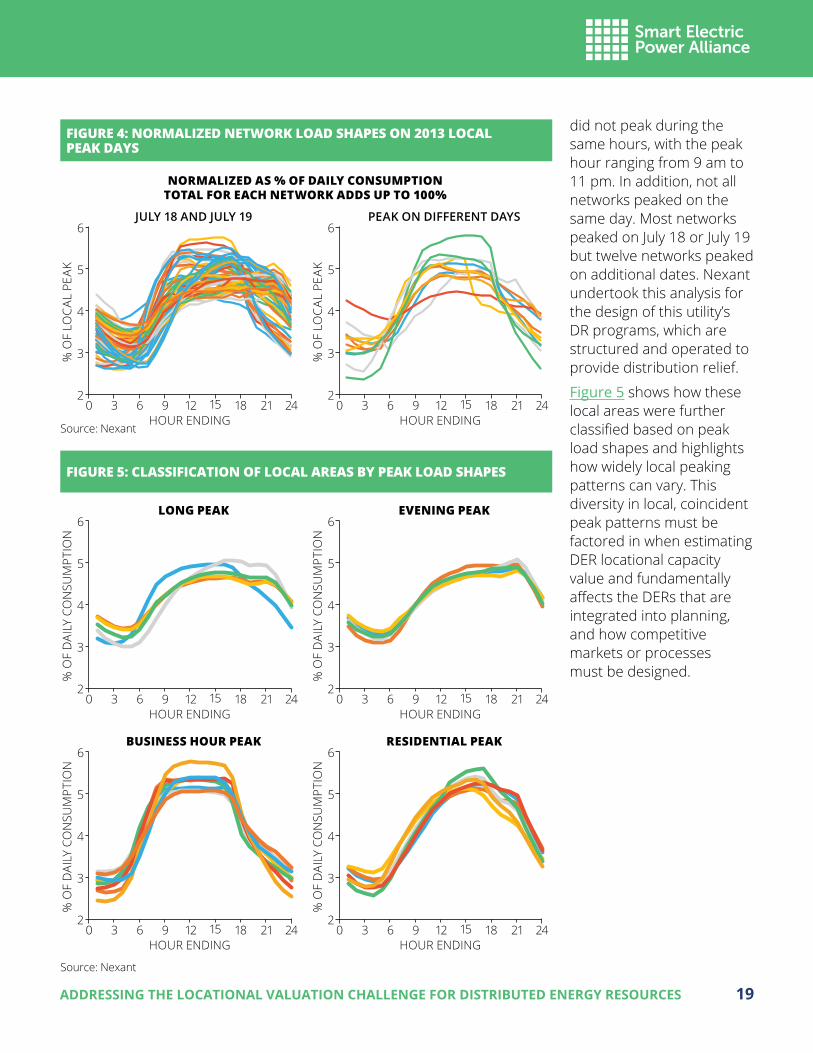
Figure 4 illustrates the role of local peak demand patterns. It shows the load shape for each of a New York utility’s distribution networks on the day when each network peaked in 2013, one of the hottest years on record (extreme peaks may occur only once every five or ten years and annual peaks may occur in different months or seasons from one year to the next). Individual networks
FIGURE 3: HYPOTHETICAL ILLUSTRATION OF THE EFFECT OF DERS ON EXPENDITURES46
$150M
$100M
$50M
$0
YEAR1 2 3 4 5 6 7 8 9 10
$150M
$100M
$50M
$0
$150M
$100M
$50M
$0
1 2 3 4 5 76 8 9 10
1 2 3 4 5 6 7 8 9 10
DISTRIBUTION EQUIPMENTBATTERY STORAGERES AC CONTROL
C&I DRCOMM. LIVINGSOLAR
DISTRIBUTION EQUIPMENT ONLY SOLUTION10 YEAR NPV $280M
YEAR
INTEGRATED SOLUTION WITH FAST LOAD GROWTH10 YEAR NPV $225M
YEAR
INTEGRATED SOLUTION WITH SLOW LOAD GROWTH10 YEAR NPV $166M
Source: Nexant
46 Based on hypothetical costs to demonstrate the impact of slow versus fast load growth
If any of these criteria are not satisfied, the
DER portfolio will fail to avoid peaking damage or stress and a forced
outage may be required to avoid distribution
equipment overloads.
ADDRESSING THE LOCATIONAL VALUATION CHALLENGE FOR DISTRIBUTED ENERGY RESOURCES 19
did not peak during the same hours, with the peak hour ranging from 9 am to 11 pm. In addition, not all networks peaked on the same day. Most networks peaked on July 18 or July 19 but twelve networks peaked on additional dates. Nexant undertook this analysis for the design of this utility’s DR programs, which are structured and operated to provide distribution relief.
Figure 5 shows how these local areas were further classified based on peak load shapes and highlights how widely local peaking patterns can vary. This diversity in local, coincident peak patterns must be factored in when estimating DER locational capacity value and fundamentally affects the DERs that are integrated into planning, and how competitive markets or processes must be designed.
FIGURE 4: NORMALIZED NETWORK LOAD SHAPES ON 2013 LOCAL PEAK DAYS
FIGURE 5: CLASSIFICATION OF LOCAL AREAS BY PEAK LOAD SHAPES
Source: Nexant
Source: Nexant
NORMALIZED AS % OF DAILY CONSUMPTIONTOTAL FOR EACH NETWORK ADDS UP TO 100%
6
5
4
3
2
HOUR ENDING
JULY 18 AND JULY 19
0 3 6 9 12 15 18 21 24
% O
F LO
CAL
PEA
K
6
5
4
3
2
HOUR ENDING
PEAK ON DIFFERENT DAYS
0 3 6 9 12 15 18 21 24
% O
F LO
CAL
PEA
K
6
5
4
3
2
HOUR ENDING
LONG PEAK
0 3 6 9 12 15 18 21 24
% O
F D
AILY
CO
NSU
MPT
ION
6
5
4
3
2
HOUR ENDING
EVENING PEAK
0 3 6 9 12 15 18 21 24
% O
F D
AILY
CO
NSU
MPT
ION
6
5
4
3
2
HOUR ENDING
BUSINESS HOUR PEAK
0 3 6 9 12 15 18 21 24
% O
F D
AILY
CO
NSU
MPT
ION
6
5
4
3
2
HOUR ENDING
RESIDENTIAL PEAK
0 3 6 9 12 15 18 21 24
% O
F D
AILY
CO
NSU
MPT
ION

20 NEXANT & SEPA | A BEYOND THE METER SERIES REPORT
BEYOND THE METER SERIES
4.1.4 | TIMING AND DURATION OF RISK DRIVES LOCAL CAPACITY NEEDFigure 6 shows another view of peaking risk. Each frame shows the top 200 hours of the normalized load duration curve47 for three different substations analyzed as part of the Central Hudson TDR project. This load duration curve analysis is widely used in system planning and is a key building block to the locational capacity valuation methodology presented in this paper. Essentially, peaks that risk crossing recommended thermal ratings of system infrastructure are a risk that planners must manage. The two main tools for addressing this peaking risk are deploying traditional infrastructure capacity upgrades or deploying demand management through DERs to shave the load duration curve. The latter is at the heart of using DERs to capture locational capacity value because DERs have the potential to shave the load duration curve by decreasing local peak capacity needs. However, this approach may not be the most practical in all situations and the concentration of the local load duration curve affects the type of resources that are needed or will be most effective at addressing peaking risk.
In areas with highly concentrated peaks (left panel), meaning peak loads are concentrated in very few hours, reducing loads even for a very limited number of hours can substantially reduce peak demand. Targeted DERs can often compare quite favorably to traditional infrastructure in this situation, because the additional capacity is needed for very few hours and the remainder of the time the incremental capacity can be underutilitized.48 In areas with less concentrated peaks (right panel), coverage is needed for more hours and days, requiring locational capacity from DERs to be available for much longer periods of time.
FIGURE 6: LOAD DURATION CURVE COMPARISON BY PEAK LOAD CONCENTRATION
Source: Nexant
100
95
90
85
80
HOURS RANKED BY LOAD, TOP 200 HOURS
HIGHLY CONCENTRATED
0 50 100 150 200
LOAD
AS
% O
F AN
NU
AL P
EAK
100
95
90
85
80
HOURS RANKED BY LOAD, TOP 200 HOURS
MEDIUM
0 50 100 150 200
LOAD
AS
% O
F AN
NU
AL P
EAK
100
95
90
85
80
HOURS RANKED BY LOAD, TOP 200 HOURS
LESS CONCENTRATED
0 50 100 150 200
LOAD
AS
% O
F AN
NU
AL P
EAK
47 The values are normalized as the percent of the annual peak.
48 This doesn’t mean it is not used at all. When possible, distribution system operators may switch loads between neighboring areas to provide additional capacity. It is important to remember that the distribution system is dynamic and that locational areas are not islands cut off from other parts of the system.

ADDRESSING THE LOCATIONAL VALUATION CHALLENGE FOR DISTRIBUTED ENERGY RESOURCES 21
In addition to the concentration of peaking risk, the timing and duration of local peaks are also critically important in understanding locational capacity value. Figure 7 shows hourly loads in an area on days where loads surpassed 90% of the historical, all-time local peak. To keep loads under this 90% cutoff, demand reductions would have been needed from 11 am to 9 pm, for a total of 53 hours over 8 days from 2010 to 2014. Understanding the quantity, timing, and duration of peaking risk hours is critical to designing a functional local capacity solution, which draws on DERs and traditional investments to address the actual need. For example, a single DER, which could have only provided local capacity for four hours or one which could only have provided capacity
midday, would not on their own have been able to provide the capacity when, where, or for how long it would have been needed.
4.1.5 | CALCULATING A COMMON LOCATIONAL CAPACITY VALUE METRICThis section has demonstrated how locational capacity value is directly tied to excess capacity, load growth rates and resulting planned investments, local area load shapes, and the concentration and timing of local peaks. This means that a common metric for locational capacity value needs to reflect all of these characteristics. The approach Nexant has used for projects such as the Central Hudson TDR is built around the load duration curve and using hourly load data49 from the recent past (preferably at least five years) to estimate when and for how long peaking relief would have been needed. Figure 8 demonstrates the basic four step process.
1. Establish rules for peak load cutoffs. This could be in terms of a MW thermal rating over which a traditional investment would be triggered or a target for shaving the load duration curve, say the top 100 hours or 10% below a multi-year peak.50
2. Simulate reductions required to avoid investments on multiple years of historical data. If one had been trying to cut loads by, say, 10% or some MW amount of capacity, how much DERs would have been needed? When, how often, and for how long would DERs have been needed?
3. Develop risk allocation (orange area), the total MWh that would have been needed to shave load duration curve over some threshold.
4. Allocate risk (needed reductions) across specific days / hours by summing all load above the cut off (peaking risk) in each hour and divide the load in each hour by the total. The total risk sums to 100%.
FIGURE 7: HOURLY LOADS IN A DEMAND MANAGEMENT AREA ON PEAK DAYS
100
80
60
40
20
HOUR ENDING
HOURLY LOADS ON DAYS SURPASSING CUTOFF
0 3 6 9 12 15 18 21 24
% O
F AL
L-TI
ME
PEAK
5% REDUCTION• 1 PM TO 6 PM• 16 HOURS OVER 2010-2014
• 4 DAYS
10% REDUCTION• 11 AM TO 9 PM• 53 HOURS OVER 2010-2014
• 8 DAYS
Source: Nexant
49 Hourly interval data for every day of the year, sometimes referred to as 8760 data (24 x 365 = 8,760).
50 It is a complex undertaking to forecast and manage local distribution peaks, due to the variability of annual and multi-year peaks and due to the interconnected nature of distribution nodes. Because of this complexity, establishment of peak reduction targets needs to be done collaboratively by working with the utility’s distribution planning team.

22 NEXANT & SEPA | A BEYOND THE METER SERIES REPORT
BEYOND THE METER SERIES
The peaking risk allocation described in the steps above is at the 8,760 hourly level.51 However, because the allocation is normalized, it can be summarized by hour, by month, or by day type. Figure 9 shows that normalized peaking risk allocation can also be compared across different locations. The three curves depict the peaking risk allocation summed by hour52 for the three locations covered in Figure 6. It shows how highly concentrated peaking risk demonstrated by the highly concentrated load duration curve is also often concentrated in a few hours of the day.
This approach has also been extended to future load growth forecasts for the Central Hudson T&D Avoided Cost Study,53 in which future load growth was probabilistically simulated and avoided T&D cost was essentially the deferral value in specific areas where investments would be triggered if peak loads surpassed designated local equipment ratings. By combining the likelihood of triggering the investment with the cost of the investment, it is possible to establish a net present value of avoided locational capacity cost.
51 Hourly interval data for every day of the year, sometimes referred to as 8760 data (24 x 365 = 8,760)
52 The total under each curve sums to 100%.
53 See Appendix D at http://documents.dps.ny.gov/public/Common/ViewDoc.aspx?DocRefId=%7B2DDB3EBC-411E-4B9E-AB96-7940190F8013%7D.
FIGURE 9: ALLOCATION OF PEAKING RISK COMPARISON BY PEAK LOAD CONCENTRATION
BASED ON LOADS OVER 90% OF PEAK30
20
10
0
HOUR ENDING0 3 6 9 12 15 18 21 24
% A
LLO
CAT
ION
OF
PEAK
ING
RIS
K
HIGHLY CONCENTRATEDMEDIUMLESS CONCENTRATED
Source: Nexant
Source: Nexant
100
95
90
85
RANK OF HOURLY LOAD OVER 4 YEARS0 50 100 150 300
% O
F PE
AK
200 250
MULTI−YEAR LOAD DURATION CURVE (2010−13)4.0
3.0
2.0
1.0
0.0
RANK OF HOURLY LOAD OVER 4 YEARS0 10 20 30 60
% A
LLO
CAT
ION
40 50 9070 80
ALLOCATION OF MWh OVER 90% OF ALL PEAK
2
1
3
4
FIGURE 8: STEPS FOR CALCULATING LOCATIONAL CAPACITY VALUE

ADDRESSING THE LOCATIONAL VALUATION CHALLENGE FOR DISTRIBUTED ENERGY RESOURCES 23
Figure 10 describes the main steps in developing the location specific avoided T&D costs using these probabilistic methods. The process was implemented for each Central Hudson substation, load area, and transmission area with at least three years of valid, historical hourly data. Importantly, the thousands of simulations of potential growth trajectories are critical to both the forecast and to estimating T&D costs54 with and without demand management in the form of DERs.
1. Clean the data—One of the key challenges in estimating load patterns and growth at granular locations is the quality of data. Not all substations have full historical metered data and, for those
that do, it is important to identify and remove load transfers, outages, data gaps, and data recording errors.
2. Estimate historical load growth—Econometric time-series modeling identifies year-to-year growth patterns, which are in turn used to assess the growth trend and the variability of load growth patterns; the degree of growth in a given year was related to growth during the prior year but also to the variability between years. This is how it is possible to derive non-linear growth estimates that more realistically represent what happens in real life.
FIGURE 10: KEY STEPS IN ESTIMATING LOCATION SPECIFIC AVOIDED COSTS
Daily Peak Loads versus Weather Conditions (Weekday)Substation Dashville Distribution – Design Rating 2
ESTIMATEHISTORICALLOAD GROWTH
SIMULATELOAD GROWTHTRAJECTORIES
ESTIMATE T&D COSTS WITH AND WITHOUT DERS
TIME DIFFERENTIATEVALUE
Cummulative Change in Peak Loads Since 2010Substation Dashville Distribution
CLEAN THE DATA
Forecasted Peak Loads as Percent of 2015Modena Distribution Substation – Firm Rating (to be added)
160
140
120
100
80
% o
f 201
5 P
eak
Lo
ad
2010 2015 2020 2025 2030
Source: Nexant
54 Reflecting the probability that the thermal design rating of locational equipment will be surpassed, triggering a traditional investment.

24 NEXANT & SEPA | A BEYOND THE METER SERIES REPORT
BEYOND THE METER SERIES
3. Simulate potential load growth trajectories—Load growth forecasts are developed using probabilistic methods—Monte Carlo simulations based on the historical load growth patterns—that produce the range of possible load growth outcomes by year and which reflect the reality that near-term forecasts have less uncertainty than forecasts 10 years out. Each one of thousands of simulations produces specific information about if and when a traditional T&D investment would be needed and the amount of DERs required to maintain loads below locational capacity thresholds.55
4. Estimate costs with and without DERs— The estimates of the avoided T&D costs are based on the load growth forecast and the outcome of each simulation run. The multi-year cost stream with and without demand management is simulated over thousands of draws for each location.56
5. Time-differentiate the value of local T&D avoided costs—This assesses when loads are most likely to peak across hour of day, weekday/weekend, and season. The annual avoided costs are then time-differentiated to reflect when demand management is most needed and most valuable.
TABLE 2: SUMMARY OF DER CHARACTERISTICS THAT CAN LIMIT THEIR ABILITY TO DELIVER PEAK LOAD REDUCTION
KEY QUESTION CONSTRAINT DEFINITION
Is the DER tied to a specific load shape?
Load profile
Structural shape of load reductions deliverable by a resource. For example, energy efficiency will deliver loads aligned with underlying consumption patterns (e.g., lighting or HVAC); solar PV will deliver loads varying by time of day, peaking in early afternoon; batteries of fuel based generation have no such limits.
Seasonal availability Availability year round versus summer only.
Is the resource flexible?
Availability window (start and end hours)
Hours of the day during which the resource is available. May be longer than the duration category. If duration category is shorter than the availability window, optimal window is used (e.g., the window with the most peak load).
Ramp speed Length of time it takes for resource to achieve maximum load reduction.
Dispatch delay Advance notice which must be given for resource to be dispatched.
Are there specific operating constraints?
Dispatch duration
Maximum number of consecutive hours during which a resource is able to deliver load reduction. May be limited by technology constraints (battery discharge time) or program limits (demand response event window).
Max dispatch hours per year Limit to total number of dispatchable hours in a year.
Max events per year Limit to total number of dispatch events (days) in a year.
Max consecutive Limit to total number of consecutive dispatch events (days) in a year.
Events per year (Days) in a year.Source: Nexant
55 Based on equipment thermal capacity design ratings
56 Simulating thousands of scenarios or draws establishes the range of eventualities. If a peaking threshold is surpassed in only 5% of draws, one can infer that such a peaking event has a likelihood of 5%.

ADDRESSING THE LOCATIONAL VALUATION CHALLENGE FOR DISTRIBUTED ENERGY RESOURCES 25
However, not all DERs are equally suited to avoid such investments. To understand this and to quantify the locational value for individual DERs or for an integrated DER solution, it is necessary
to identify and understand how unique DER characteristics impact the ability to provide locational capacity.
4.2 | HOW TO QUANTIFY LOCATIONAL VALUE FOR UNIQUE DERSA distinctive feature of distributed energy resources is that they include a wide range of technologies with diverse operating characteristics. From a distribution capacity standpoint, prices being equal, the ideal, stand-alone DER is:
n Available at all hours;
n Reliable, dispatchable, and predictable;
n Able to quickly ramp production (or reduction) levels up and down in a controlled and predictable manner or deliver permanent load reductions;
n Deliver the right amount of production (or reduction) at the right hour; and
n Without limitations on when, for how long, and how often it can produce (or reduce).
Most types of DERs deviate from the ideal resource and, individually, are not direct substitutes for distribution equipment. Distribution equipment is always there and accommodates additional loads.
Accurately quantifying DER locational value begins with asking the right questions to distinguish how individual DERs differ from others.57 Table 2
summarizes three key questions which guide a step by step process for doing this.
4.2.1 | IS THE DER TIED TO A SPECIFIC LOAD SHAPE?Figure 11 illustrates how important it is for DER characteristics to align with peaking risk. The lines show load profiles for various types of DERs that either follow a specific production pattern or are based on loads that vary by hour.58 The load profiles are normalized (as the percent of the annual peak) so they can be directly compared and juxtaposed against the local peaking risk (the shaded area in the graph, which also corresponds to the peaking risk allocation for the highly concentrated area discussed above).
FIGURE 11: ALIGNMENT OF DERS WITH HIGHLY CONCENTRATED PEAKING RISK
100
80
60
40
20
0
30
20
10
0
CONCENTRATION OF PEAK RISK
HOUR ENDING
C&I AC
0 4 8 12 16 20 24
SOLAR
C&I EE LIGHTING RES EE LIGHTING RES ROOM AC
BASED ON LOCAL PEAK DAYS ACROSS 4-YEAR HOURLY LOADS
NO
RMAL
IZED
SH
APE
(DER
PEA
K=10
0%)
PEAK
ING
RIS
K AL
LOC
ATIO
N (%
)
Source: Nexant
57 Whereas the SEPA DERs Capabilities Guide focuses on overarching characteristics that are shared to varying degrees across technologies, these questions seek to capture and quantify the impact of characteristics which may be unique to one DER or another. For example, operating constraints typically only apply to demand response (due to program or contract rules) and to storage (due to physical storage constraints), but do not apply to energy efficiency or solar PV.
58 The figure does not include DERs that are not time dependent.

26 NEXANT & SEPA | A BEYOND THE METER SERIES REPORT
BEYOND THE METER SERIES
In the illustrated location, some resources—commercial and residential air conditioner loads—align well with the local peaking risk. Other resources—residential lighting, solar—do not align as well in this particular case. As it turned out, peak loads were likely driven by cooling loads in this particular area, so it makes sense that controlling these loads would also be most effective for mitigating the peaking risk. The concentration of local peaking risk and the alignment with specific DERs will vary for local areas and the most effective DERs, or portfolio of DERs, may be different for a different distribution area with a different risk concentration or profile. Distribution operators must have the right mix of resources at the right location at the right time.
DERs with an underlying load profile provide load relief that may vary by time of day, season, climate, etc. Development of these load profiles is a critical input to quantifying DER locational capacity value. The starting point is 8,760 end use load profiles for each DER being assessed.59 These should reflect
the climate, weather, and time period underlying the load data used to derive the peaking risk allocation. Then each load profile is scaled so maximum non-coincident load or output equals 100%. The normalized load profiles in Figure 11 are simply average hourly output for days with historical peak loads.60
4.2.2 | IS THE RESOURCE FLEXIBLE?Flexibility is the ability to be dispatched at any time, on short notice, with the ability to ramp quickly—note that this characteristic also applies to bulk system resources and grid services such as operational reserves, frequency regulation, generation capacity, etc. For resources that much be dispatched—storage, load control—flexibility is key to enabling delivery of capacity when it is needed. If flexibility is limited, say by advance notice or speed of dispatch, it adds a layer of complexity and uncertainty for a distribution operator trying to use DERs to deliver peaking relief. For example, an operator may know in real time or with short notice, say less than ten minutes, if loads will rise beyond
FIGURE 12: ILLUSTRATION OF THE EFFECT OF DER CONSTRAINTS—FOUR HOUR LIMITS ON DISPATCH DURATION
RANK OF HOURLY LOAD OVER 4 YEARS0 10 20 30
% A
LLO
CAT
ION
40 50
ALLOCATION OF MWh OVER 90% OF ALL TIME PEAK100
80
60
40
5.0
4.0
3.0
2.0
1.0
0.0
HOUR ENDING
HOURLY LOADS ON DAYS SURPASSING CUTOFF
0 3 6 9 12 15 18 21 24
% O
F AL
L-TI
ME
PEAK
ON PEAK DAYS RESOURCES ARE NEEDED FROM 11 AM TO 9 PM. A FOUR HOUR RESOURCE PROVIDES
INCOMPLETE COVERAGE
HIGHESTLOAD DAY
COVERAGENO COVERAGE
ORANGE BARS REFLECT HOURS WHERE THE 4 HOUR RESOURCE
PROVIDES COVERAGE (WITH OPTIMAL DISPATCH)
BLUE BARS REFLECT HOURS WHERE THE 4 HOUR RESOURCE CANNOT PROVIDE COVERAGE BECAUSE OF
THE DISPATCH LIMIT
Source: Nexant
59 For demand side DER (load control, EE) expected peak relief is highly correlated with device load profiles so end use load profiles are used directly.
60 Where peaking risk allocation is greater than 0.

ADDRESSING THE LOCATIONAL VALUATION CHALLENGE FOR DISTRIBUTED ENERGY RESOURCES 27
a peaking risk threshold. However, if the operator must give day ahead advance notice to call a demand response load control event, there is a loss of certainty: the event might be called unnecessarily or a needed event may fail to be called.
Table 3 summarizes three criteria for determining a resource’s flexibility. For each criteria it gives an example of a resource which does and which does not fulfil the criteria.
4.2.3 | ARE THERE SPECIFIC OPERATING CONSTRAINTS?In addition to load shapes and flexibility, operating constraints can also influence how useful a DER is at reducing the need for additional distribution infrastructure investments. Operating constraints such as how long a resource can sustain production (or reductions), when it is available, and how many hours it can be utilized, can materially affect locational capacity value.
Figure 12 shows how the inability to sustain production (or reductions) for more than four hours can limit the value of a DER or portfolio with such a constraint. The left hand panel shows the
hourly peak patterns during days when capacity relief is needed most. During the highest load day, resources are needed from 11 am to 9 pm.
A resource with a four-hour dispatch duration limit cannot, on its own, sustain loads below the target threshold during the highest load day. The right hand panel shows the loads above the target threshold in the form of a peak risk allocation curve. Each bar represents a specific hour when resources are needed to maintain loads below the target threshold. A resource or portfolio with a four-hour dispatch duration limit cannot deliver resources for all of the hours needed. The blue bars are specific hours when reductions are needed, but the specific DER or portfolio cannot deliver because the resource has already reached the four-hour constraints on a given day. A DER limited to four hours only provides insurance against half of the existing peaking risk.
Dispatch duration limits are just one of many constraints or operating characteristics that can impact the ability of a resource to provide the peak load relief that is an important driver of DER value. Such constraints also include availability window61
TABLE 3: CRITERIA FOR DETERMINING A RESOURCE’S FLEXIBILITY
CRITERIA EXAMPLE EXPLANATION AND CAVEATS
Can it be dispatched with different start and end hours?
R AC load control Load control programs can be designed to allow flexible dispatch between a range of hours.
S Solar Except for curtailment, generation occurs when the sun shines.
Can the magnitude of output be controlled (ramping)?
R Adaptive AC load controlIf only what is needed is dispatched when it is needed (different amounts in different hours rather than all at once).
S Energy efficiency Energy efficiency is “always on” and cannot be ramped up or down.
How far ahead must it be scheduled?
R Batteries As long as they are charged ahead of time, batteries can respond almost immediately.
S Day ahead Demand response
DR contracts specify advance notice requirements (can be Day ahead, hours ahead, etc.).
Source: Nexant
61 Hours between when a resource can be called upon.

28 NEXANT & SEPA | A BEYOND THE METER SERIES REPORT
BEYOND THE METER SERIES
and event limitations.62 Figure 13, an illustrative example based on Nexant analysis, highlights how these constraints can limit the ability of DERs to deliver peak load reduction. The blue bars indicate the percent of locational capacity value that can be addressed by conceptual DERs with the constraints on each row. For example, while a perfectly flexible, unconstrained DER could deliver 100% of its nameplate capacity in locational capacity value, a resource with a three hour duration limitation could only deliver 69% of its nameplate capacity in locational capacity value. Essentially, this means that while the maximum output—the maximum non-coincident peak—of a resource may be, say, 1 kW, because of its operational constraints it will not be able to deliver 1 kW of locational capacity value during every hour in which it is needed by the distribution system. Instead, on days where peaking risk occurs for more than three hours, some hours cannot be addressed, and on average only 69%, or 0.69 kW, of locational capacity value will be delivered for each 1 kW of nameplate capacity. Adding an availability constraint of 3 pm to 7 pm further reduces this to 65% and so on.63
This effective load carrying capacity factor (LCCF) is at the heart of the proposed methodology for estimating locational capacity value. The result will vary across each location and across each individual DER resource assessed: in some cases, constraints are material, in others they are inconsequential. Ultimately, though, the usefulness of DERs in helping reduce growth related distribution costs very much depends on how well operational characteristics of DERs, both individually and as part of a portfolio, align with local peak patterns and reduction needs.
4.2.4 | CALCULATING A COMMON METRIC FOR DER LOCATIONAL CAPACITY VALUEThis section began by laying out three key questions as the primary criteria for estimating an individual DER’s locational capacity value. The approach Nexant has used for projects such as the Central Hudson TDR projects incorporates answers to these questions to quantify a resource’s ability to provide locational capacity and identifies the overlap between this and the peaking risk allocation, which defines locational capacity need. The result is LCCF,
FIGURE 13: CONCEPTUAL IMPACT OF OPERATING CONSTRAINTS ON LOCATIONAL CAPACITY VALUE
UNCONSTRAINED RESOURCE
MAX DISPATCH DURATION OF THREE HOURS, COMPLETELY FLEXIBLE
+ AVAILABLE ONLY FROM 3 PM TO 7 PM
+ MAXIMUM 5 EVENTS PER YEAR
+ MAXIMUM OF 20 DISPATCH HOURS PER YEAR
100%
69%
65%
64%
62%
Source: Nexant
62 Limits to total number of hours in the year, to total number of events, and to the number of events that can be called consecutively. These are largely various characteristics of demand response contracts and load control programs, but will increasing apply to broader arrays of DERs as dispatchable batteries, smart inverters, and smart home energy management systems are combined with DERs such as PV, forming PV-DR-Storage hybrids.
63 Note that this is just an example conceptually representing one specific distribution location. These values can be very different depending on the historical peaking conditions that are used to create the peak risk allocation.

ADDRESSING THE LOCATIONAL VALUATION CHALLENGE FOR DISTRIBUTED ENERGY RESOURCES 29
a common metric for evaluating locational capacity value across all possible resources, including traditional distribution investments, a variety of single DERs, or an integrated portfolio of DERs.
Table 4 demonstrates the basic process for estimating LCCF, showing the LCCF for two different DERs (solar and residential lighting efficiency) in a particular location.
Equation 4-1 summarizes the straightforward calculation for estimating the LCCF for a particular resource. Essentially the LCCF is the sum product of risk allocation and scaled resource production for all 8,760 hours for each year of data.
Equation 4-1: Calculation of load carrying capacity factor
LCCFResource = ∑ Ai × Bi
Where
A = Peaking risk allocation64 and
B = Resource production on peak risk days (including all constraints, load profile, etc.)65
While conceptually simple, the LCCF is quite powerful, in that it allows for a wide variety of operating characteristics and their interaction with a local capacity needs to be distilled into a single common metric. On its own the metric can reveal a lot about DERs and local area need. For example, if LCCF drops substantially in the face of resource duration limits, peaking risk is likely spread over many hours and not very concentrated.
Just as LCCF is built off of peaking risk allocation, the economic value of a resource’s locational capacity, or cost per effective MW, can be calculated using the LCCF. Equation 4-2 shows how to calculate this cost per effective load carrying capacity.
Equation 4-2: Calculation of cost per effective MW
$ NPV = NPV (costs) effective MW nameplate MW * LCCF
Put very simply, a DER solution may be a preferred locational capacity solution if it fulfils the following criteria:
n Sufficient effective locational capacity can be provided to address all peaking risk which would otherwise trigger a traditional capacity investment.
n Sufficient locational capacity may be defined to include capacity buffer similar to what would be provided by the traditional investment and at a comparable level of reliability, which may necessitate a guarantee or contract.
n The NPV cost of the solution, which may include a deferred traditional capacity investment, is lower than the cost of the non-deferred traditional investment, thus capturing the time value of money of the deferral.
4.2.5 THE WHOLE IS MORE IMPORTANT THAN THE PARTSThe LCCF and cost per effective MW metrics enable comparison of various resources. However, many DERs deliver incomplete solutions for locational capacity relief when deployed individually but have characteristics that can provide complementary value when deployed in combination with other DERs or traditional distribution solutions. In the right combination, DERs deliver more value as a whole solution than as stand-alone components.66 What is more, DERs have the ability to alter the loads which underlie the LCCF calculation, as shown
64 See Section 4.1.5 for calculation methodology.
65 See Section 4.2.1 for details on developing load shapes. Calculation assumes resource production is scaled so that maximum reliable output = 100%. Note that maximum output should be adjusted for uncertainty and performance, ideally based on actual measured load reduction or production.
66 The idea being that capacity from different resources is stacked rather than being redundant. For example, a portfolio can be designed so that the sum of DERs provide the capacity needed in each hour, rather than DERs providing redundant capacity in each hour. Of course, such procurement would need to be structured to avoid double paying for the same capacity relief, which is why it is so critical to understand the effective capacity provided by each resource in combination in each hour.

30 NEXANT & SEPA | A BEYOND THE METER SERIES REPORT
BEYOND THE METER SERIES
30 NEXANT & SEPA | A BEYOND THE METER SERIES REPORT
BEYOND THE METER SERIES
TABLE 4: EXAMPLE CALCULATIONS FOR ESTIMATING LOAD CARRYING CAPACITY FACTOR
HOUR (END)
SOLAR PANELS RESIDENTIAL LIGHTING ENERGY EFFICIENCY
PEAKING RISK
ALLOCATION
RESOURCE PRODUCTION
(PER NAMEPLATE kW)
LCCF INTERIM
CALCULATION
PEAKING RISK
ALLOCATION
RESOURCE PRODUCTION
(PER NAMEPLATE kW)
LCCF INTERIM
CALCULATION
(A) (B) (A X B) (A) (B) (A X B)
1:00 0.0% 0.00 0.00 0.0% 0.38 0.00
2:00 0.0% 0.00 0.00 0.0% 0.14 0.00
3:00 0.0% 0.00 0.00 0.0% 0.12 0.00
4:00 0.0% 0.00 0.00 0.0% 0.12 0.00
5:00 0.0% 0.00 0.00 0.0% 0.12 0.00
6:00 0.0% 0.00 0.00 0.0% 0.17 0.00
7:00 0.0% 0.02 0.00 0.0% 0.32 0.00
8:00 0.0% 0.10 0.00 0.0% 0.39 0.00
9:00 0.0% 0.23 0.00 0.0% 0.39 0.00
10:00 0.0% 0.35 0.00 0.0% 0.27 0.00
11:00 0.0% 0.48 0.00 0.0% 0.14 0.00
12:00 0.0% 0.56 0.00 0.0% 0.11 0.00
13:00 1.9% 0.57 0.01 1.9% 0.11 0.00
14:00 7.2% 0.58 0.04 7.2% 0.11 0.01
15:00 11.1% 0.55 0.06 11.1% 0.11 0.01
16:00 17.9% 0.42 0.07 17.9% 0.11 0.02
17:00 27.0% 0.30 0.08 27.0% 0.15 0.04
18:00 26.0% 0.24 0.06 26.0% 0.29 0.08
19:00 8.9% 0.11 0.01 8.9% 0.49 0.04
20:00 0.0% 0.03 0.00 0.0% 0.72 0.00
21:00 0.0% 0.00 0.00 0.0% 0.90 0.00
22:00 0.0% 0.00 0.00 0.0% 0.99 0.00
23:00 0.0% 0.00 0.00 0.0% 0.87 0.00
24:00 0.0% 0.00 0.00 0.0% 0.60 0.00
Max average hourly production 0.08 Max average
hourly production 0.08
LCCF 0.34 LCCF 0.20
Source: Nexant
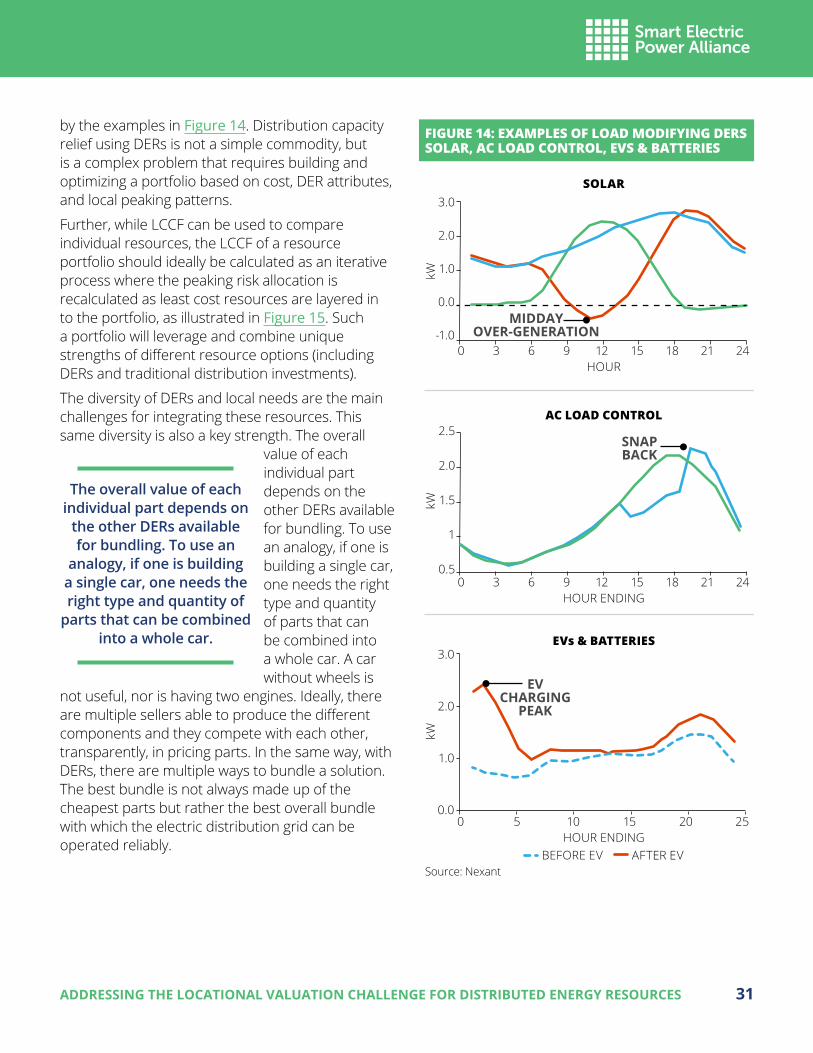
ADDRESSING THE LOCATIONAL VALUATION CHALLENGE FOR DISTRIBUTED ENERGY RESOURCES 31
by the examples in Figure 14. Distribution capacity relief using DERs is not a simple commodity, but is a complex problem that requires building and optimizing a portfolio based on cost, DER attributes, and local peaking patterns.
Further, while LCCF can be used to compare individual resources, the LCCF of a resource portfolio should ideally be calculated as an iterative process where the peaking risk allocation is recalculated as least cost resources are layered in to the portfolio, as illustrated in Figure 15. Such a portfolio will leverage and combine unique strengths of different resource options (including DERs and traditional distribution investments).
The diversity of DERs and local needs are the main challenges for integrating these resources. This same diversity is also a key strength. The overall
value of each individual part depends on the other DERs available for bundling. To use an analogy, if one is building a single car, one needs the right type and quantity of parts that can be combined into a whole car. A car without wheels is
not useful, nor is having two engines. Ideally, there are multiple sellers able to produce the different components and they compete with each other, transparently, in pricing parts. In the same way, with DERs, there are multiple ways to bundle a solution. The best bundle is not always made up of the cheapest parts but rather the best overall bundle with which the electric distribution grid can be operated reliably.
FIGURE 14: EXAMPLES OF LOAD MODIFYING DERS SOLAR, AC LOAD CONTROL, EVS & BATTERIES
BEFORE EV AFTER EV
3.0
2.0
1.0
0.0
-1.0
HOUR
kWkW
kW
0 3 6 9 12 15 18 21 24
HOUR ENDING0 3 6 9 12 15 18 21 24
SOLAR
AC LOAD CONTROL
MIDDAYOVER-GENERATION
3.0
2.0
1.0
0.0
HOUR ENDING0 5 10 15 20 25
EVs & BATTERIES
SNAPBACK
EVCHARGING
PEAK
2.5
2.0
1.5
1
0.5
Source: Nexant
The overall value of each individual part depends on
the other DERs available for bundling. To use an
analogy, if one is building a single car, one needs the right type and quantity of
parts that can be combined into a whole car.

32 NEXANT & SEPA | A BEYOND THE METER SERIES REPORT
BEYOND THE METER SERIES
5 | Unanswered Questions and Future Challenges
Accurately valuing DER locational capacity value is one building block toward holistically integrating DERs into various utility functions including distribution planning, bulk power planning, and customer strategy. However, to do so there are still many key issues that need to be resolved. The four issues addressed below are key but are by no means exhaustive:
n How can locational value be included in Integrated Benefit Cost Analysis?
n How can integrated distribution planning capability gaps be addressed?
n How can the need for contractual obligation and guarantees be reflective competitive mechanisms?
n How can distribution planning reflect uncertainty and risk planning?
While these future challenges remain unanswered, it is hoped that this paper helps address the locational valuation challenge by establishing a common metric for locational value and moving the conversation from exploration of concepts to discussion of real-world, quantitative approaches.
FIGURE 15: AN ITERATIVE PROCESS FOR BUILDING A LEAST-COST DER PORTFOLIO
LOWEST COST MIXOF RESOURCES NEEDED
TO AVOID UPGRADE (ONLY SELECT DERS IF LESS COSTLY THAN WIRES
ALTERNATIVE)
APPLY BENEFITCOST ANALYSIS AND
CALCULATE NET COSTS FOR ALL OPTIONS INDIVIDUALLY
(Net cost=Total cost – all non-locational benefits)
RUN LCCF FOR ALL OPTIONS
IDENTIFY THE LOWESTMARGINAL COST OPTION
((Net Locational Cost)/(LCCF*Nameplate))
CALCULATEREMAINING NEEDS
ARE ALL THENEEDS MET?
UPDATECONCENTRATION
OF NEED ANDREALLOCATE
REMAINING VALUE
Source: Nexant

ADDRESSING THE LOCATIONAL VALUATION CHALLENGE FOR DISTRIBUTED ENERGY RESOURCES 33
5.1 | HOW CAN LOCATIONAL VALUE BE INCLUDED IN INTEGRATED BENEFIT COST ANALYSIS?
This document intentionally focused on the quantification of one potential benefit: locational capacity value. This is but one component to the more complete benefit cost frameworks discussed in many industry documents and at the center of efforts such as the New York Renewing the Energy Vision Benefit Cost Analysis Handbook and the California Integrated DER proceeding. Just as the locational capacity value for a particular DER impacts that of another and a portfolio of DERs should be evaluated as a unit, benefits and costs for a DER portfolio need to be assessed as a package. This means that the locational capacity valuation approach needs to be integrated into the benefit cost analyses being laid under development. This represents a complexity because while some benefits and costs vary locationally, others do not. One possible approach that has been proposed is to evaluate total non-locational (bulk) benefits and costs and then subtract that from the total cost of a resource. This net cost can in turn be used to derive
cost per effective local capacity and to assess the interrelated total cost of a portfolio of DERs.
In regions where there isn’t a policy push to incorporate DER locational value into planning, additional regulatory changes may also be required to allow utilities to consider DERs in integrated benefit cost analysis. For example, the obligation of a utility to serve all loads varies by region and market. In most vertically integrated markets, the utility is required to plan for the maximum amount of load that could be placed on the system. In order to meet this obligation, the distribution planning process normally has to assume any non-utility controlled DER is not available at the time of the peak. Given this requirement, the value for deferral or avoidance of new system improvements for DER cannot be considered in the value proposition unless each commission expressly recognizes the increased risk of not serving all loads. To address this, state level regulatory frameworks would need to adapt this guidance for determining load serving obligation.
5.2 | HOW CAN INTEGRATED DISTRIBUTION PLANNING CAPABILITY GAPS BE ADDRESSED?
Integrated resource planning involves considering the full array of available resources and layering in least cost resources to develop a least cost portfolio to meet established needs and priorities. This is already done at the bulk power level, using a variety of tools and analyses that include avoided cost estimations and load duration curve analyses similar to some of the methodology components proposed in this document. Extending integrated planning to the distribution system will fundamentally change how things are done today and will require a more
automated, scalable approach as planning will be done for many more nodes—planning for hundreds of local peaks will require different resources than planning for a single system peak.
In addition, current planning models and tools will need to adapt to address the variability of local peaks,67 to better predict and understand potential costs incurred by DER integration,68 and to incorporate the change over time of distribution system configuration and operation.69 An additional challenge will be may also mean tracking historically
67 A feeder may be mid-day summer peaking in year one and could be winter peaking in year two.
68 Including protection schemes, communication equipment, and software such as Distribution Management Systems (DMS) and Distributed Energy Resource Management Systems (DERMS) for control and dispatch of DERs.
69 The configuration of the distribution feeders will like change as new circuits are added or loads being shifted from one circuit to another on a temporary or permanent basis. Investments in distribution automation will change the way the system is operated, in part as increased visibility and control of the distribution system and leads to system optimization and dynamic switching.

34 NEXANT & SEPA | A BEYOND THE METER SERIES REPORT
BEYOND THE METER SERIES
integrated DERs and forecasting future, incremental DER growth, especially for non-dispatchable, load modifying DERs such as PV, time-of-use rates, and energy efficiency. Past experience with this endeavor in the context of energy efficiency shows that it will be no easy matter to do so for more even more DERs down to the local level. These future challenges will add significant complexity to feeder level load forecasting and require capabilities that do not yet exist for practical applications.
The methodology laid out in this document is a step toward addressing these challenges as it is: quite scalable; has been automated for real world analyses and applications; has been iteratively improved to reflect planning complexities; and can continue to be adapted. However, many utilities still face gaps in the data needed70 to conduct this
approach. While this approach can be applied even at the system level, its value increases with the availability of more granular data such as substation or feeder level data. As applications proliferate there will need to be both access to more granular data and integration of utility data systems. This will enable analyses to feed into and to inform various utility functions including distribution planning, bulk power planning, and customer strategy. These enhancements will require new near term and long term planning and operational methods and models to be developed and deployed. A determination of the costs and benefits for developing and implementing these new requirements will need to be factored in the economic valuation of locational pricing on the distribution system.
5.3 | HOW CAN THE NEED FOR CONTRACTUAL OBLIGATION AND GUARANTEES BE REFLECTED IN COMPETITIVE MECHANISMS?
As alluded to throughout this document, DERs are fundamentally different from traditional investments in that they are in many cases owned and operated by customers and third parties, rather than by utility operators. This means that there is an added level of uncertainty around whether a DER portfolio will deliver on the full locational capacity value that was planned for. Therefore, the presence of DERs increase the risk profile a utility must manage unless the utility has operational and dispatch control over DERs and DER maintenance and reliability requirements are established and followed. While even utility owned infrastructure is not completely free of risk, the utility has much greater operational visibility and control into its own equipment, and skilled planners and operators will operate and maintain infrastructure to minimize such risk. This risk is taken very seriously by utilities
because failure to deliver capacity can lead to financial impacts for the utility by way of reduced reliability,71 the need to purchase expensive emergency capacity,72 or even equipment failures and accelerated replacements. This issue is more problematic for non-networked73 distribution systems where there is less flexibility to switch or transfer loads or generation from one node to another. The ownership of the DER by a customer or a third party greatly increases the risk profile for the utility. Without some form of contractual obligation with financial or other penalties for long term performance and availability, the inclusion of DERs would be a major concern and issue for the utilities.
If a utility foregoes or delays construction of a highly reliable traditional investment for a lower cost
70 In order to implement and capture locational valuations at the distribution level with this increased level of complexity, utilities will require improvements in load forecasting, data collection, and other tools for evaluating system impacts.
71 Which can result in economic penalties.
72 This is less relevant for locational capacity for which there are no markets.
73 While few systems, notably the ConEdison system located in New York City, are highly networked, most are not and are referred to as having a radial configuration.
ADDRESSING THE LOCATIONAL VALUATION CHALLENGE FOR DISTRIBUTED ENERGY RESOURCES 35
DER, this should not come at the cost of reliability. Vendor guarantees are common for DERs such as commercial demand response and DERs that are incorporated into the planning process. However, these guarantees often only cover liquidated damages and may not cover the full risk borne by the utility. If utilities are asked to integrate DERs with the purpose of investment deferral, contractual obligations for DER delivery of locational capacity value need to reflect financial or other penalties for long term performance and availability, thereby bringing in line the risk profile of DERs with the risk profile of the deferred investment. In addition,
some reliability risks may be more difficult to assess. When utilities contract with Engineering, Procurement, Construction (EPC) firms to procure bulk services and traditional infrastructure investments there is an important vetting process used to assess the long term reliability of the provider.74 This has been used as a model in some of the initial locational value projects mentioned in this document. Both of these reliability considerations should be kept in mind as contracts and competitive mechanisms such as markets are developed for an increasingly broad array of DER products.
5.4 | HOW CAN DISTRIBUTION PLANNING REFLECT UNCERTAINTY AND RISK PLANNING?
Load forecasting is a critical component to determining peaking risk and deferral value, and is also used for distribution and system planning. Currently, however, load forecasts are largely done in a non-probabilistic manner, which does not capture the higher level of uncertainty inherent in longer planning time horizons and does not reflect the reality that even though trends exist, loads do not change by the same rate each year, as suggested by deterministic, straight-line forecasts.75
Updating the standard forecast methodologies with more sophisticated, simulation based approaches will better quantify uncertainty across different
planning horizons. Updated methods can be applied to both load forecasting and forecasts
of load modifying DERs, which increasingly represent challenges for planners.76 Forecasts that more accurately reflect uncertainty will be necessary in a world with more uncertain loads and resources and will enable planners to plan more dynamically and granularly. This will also enable better, more explicit balancing of cost and risk and will help identify least risk portfolios.
74 For example, can the provider demonstrate competency, a track record of delivering, and sufficient long term financial stability?
75 As an example, a deterministic forecast will predict a constant annual load growth rate, plus or minus some constant uncertainty band. A non-deterministic forecast will provide a much more realistic estimation of, say, the probability that peak loads will reach some capacity threshold by some year or the increased uncertainty at longer time horizons.
76 In some regions, inclusion of some load modifying DERs in load forecasting, especially solar PV, may require changes to technical protocols (e.g., changes to IEEE guidelines to enable solar PV smart inverters to island and ride through instead of shutting off during voltage disturbances) and to the regulatory compact in some regions where utilities are not allowed to accept a lower level of load serving certainty.
Forecasts that more accurately reflect
uncertainty will be necessary in a world with more uncertain
loads and resources and will enable planners to plan more dynamically
and granularly.

1220 19TH STREET NW, SUITE 800, WASHINGTON, DC 20036-2405
202-857-0898©2016 Smart Electric Power Alliance. All Rights Reserved.
6 | ConclusionExtensive electric industry research and thought leadership has identified a whole host of system, community, and locational benefits that could be achieved through careful, targeted deployment of DERs, including the locational value of deferring traditional distribution investments through management of local loads—the subject of this paper. Some regulatory commissions are exploring potential DER integration roles that have been identified for market mechanisms and for extending integrated planning down to the distribution level. Substantial economic and engineering analysis, including the real world demonstrations discussed in this paper, are being devoted to these efforts with the goal of better understanding how to make this potential a reality.
These demonstrations are showing that it should be possible to capture this potential to leverage DERs as a tool for the electric system, a new addition to the toolkit of traditional infrastructure and evolving modern grid technologies which may enable leaner and leaner management and operation of the
grid potential. Such forays are also showing that delivering holistic economic benefits by optimizing use of all the tools in this evolving toolkit will not be easy. As more possibilities are explored, more is learned about the challenges that must be faced, including those discussed toward the end of this paper.
While addressing these and other challenges may not be an easy, simple problem it is also very solvable, provided there is a focus on developing sound, clear methodologies focused on unlocking the economic potential of DERs. This paper is a step in that direction, addressing the locational valuation challenge by establishing a common metric for locational value. Such methodologies are not static, and the approach discussed in the paper continues to evolve to address current and future challenges. By rising to these challenges, it will be possible to unleash the potential of DERs in concert with the other tools in the industry toolkit and transform the electric system of the twenty first century in a strategic manner.