bezelglide: interacting with graphs on smartwatches with
TRANSCRIPT

BezelGlide: Interacting with Graphs on Smartwatches with Minimal Screen Occlusion
Ali Neshati Bradley Rey Sharif AM Faleel [email protected] [email protected] [email protected] University of Manitoba University of Manitoba University of Manitoba Winnipeg, Manitoba Winnipeg, Manitoba Winnipeg, Manitoba
Sandra Bardot Celine Latulipe Pourang Irani [email protected] [email protected] [email protected]
University of Manitoba University of Manitoba University of Manitoba Winnipeg, Manitoba Winnipeg, Manitoba Winnipeg, Manitoba
ABSTRACT We present BezelGlide, a novel suite of bezel interaction techniques, designed to minimize screen occlusion and ‘fat fnger’ efects, when interacting with common graphs on smartwatches. To explore the design of BezelGlide, we conducted two user studies. First, we quan-tifed the amount of screen occlusion experienced when interacting with the smartwatch bezel. Next, we designed two techniques that involve gliding the fnger along the smartwatch bezel for graph interaction. Full BezelGlide (FBG) and Partial BezelGlide (PBG), use the full or a portion of the bezel, respectively, to reduce screen occlusion while scanning a line chart for data. In the common value detection task, we fnd that PBG outperforms FBG and Shift, a touchscreen occlusion-free technique, both quantitatively and sub-jectively, also while mobile. We fnally illustrate the generzability potential of PBG to interact with common graph types making it a valuable interaction technique for smartwatch users.
CCS CONCEPTS • Human-centered computing → Empirical studies in inter-action design.
KEYWORDS smartwatch, data charts, visuzation, interaction, input ACM Reference Format: Ali Neshati, Bradley Rey, Sharif AM Faleel, Sandra Bardot, Celine Latulipe, and Pourang Irani. 2021. BezelGlide: Interacting with Graphs on Smart-watches with Minimal Screen Occlusion. In CHI Conference on Human Fac-tors in Computing Systems (CHI ’21), May 8–13, 2021, Yokohama, Japan. ACM, New York, NY, USA, 13 pages. https://doi.org/10.1145/3411764.3445201
1 INTRODUCTION Data visualizations are designed to provide an overview of often complex collected data [13], by reducing details or simplifying the
Permission to make digital or hard copies of all or part of this work for personal or classroom use is granted without fee provided that copies are not made or distributed for proft or commercial advantage and that copies bear this notice and the full citation on the frst page. Copyrights for components of this work owned by others than ACM must be honored. Abstracting with credit is permitted. To copy otherwise, or republish, to post on servers or to redistribute to lists, requires prior specifc permission and/or a fee. Request permissions from [email protected]. CHI ’21, May 8–13, 2021, Yokohama, Japan © 2021 Association for Computing Machinery. ACM ISBN 978-1-4503-8096-6/21/05. . . $15.00 https://doi.org/10.1145/3411764.3445201
Figure 1: A: interacting with visuzation on-the-go. Using Par-tial BezelGlide to intract with bar chart (B), line graph (C) and stacked graph (D).
visual presentation [7]. This simplifcation of data is important for smaller screen displays, such as those found on smartwatches. However, while research eforts have often focused on designing the visualizations appropriately [31], the loss of detail in the data does not allow for full exploration. Often times, exploration of collected data from a smartwatch requires using an auxiliary smartphone to fully explore said data. With the benefts that smartwatches provide, due to their always accessible nature, improved data visualization interaction techniques could allow users to fully explore their data collected while in-situ and directly on the watch.
Generally, designing any interaction technique for smartwatches can be challenging due to the limited display [35] and input space [3]. Even common techniques used on smart devices, such as tap-ping and ficking, can not be performed as efectively on smart-watches as they are on smartphones [48]. Furthermore, the common ‘fat fnger’ problem on smartphones is further exacerbated on the even smaller watch displays. Moreover, screen occlusion can afect the majority of the smartwatch display. When interacting with data visualizations on the watch, this screen occlusion can block a user’s view of many necessary display elements, making direct interaction inefective. Researchers have proposed novel interac-tion techniques to expand the limited smartwatch input modalities [15, 25, 36, 56, 60]. However, such interactive capabilities were not specifcally designed for the common task of exploring data on smartwatches, including line-, bar-, donut-, and radial bar-charts.
To mitigate the ‘fat fnger’ and screen occlusion problems on smartwatch displays, we explore the use of the bezel to facilitate exploration. This focuses the interaction away from the center of the screen where the visualization is viewed, and utilizes often untouched pixels on smart device displays [42]. We postulate that

CHI ’21, May 8–13, 2021, Yokohama, Japan Ali Neshati, Bradley Rey, Sharif AM Faleel, Sandra Bardot, Celine Latulipe, and Pourang Irani
such a mechanism may mitigate the ‘fat fnger’ and screen occlu-sion efects, albeit providing only indirect input. While certain smartwatches allow physically rotating bezels, soft bezel solutions have shown to improve smartwatch input [26, 41, 58], particularly when the device is circular, the form-factor we focus on for our exploration. We thus guide our investigation with the following two research questions: 1) What are the quantifed amounts of screen occlusion when interacting with a round smartwatch bezel; and 2) how do we then utilize the smartwatch bezel to design ef-fective interaction techniques for interactive data displayed on smartwatches.
To address these research questions, we frst explore the degree of screen occlusion resulting from interacting with a circular smart-watch bezel. We identifed regions resulting in the lowest degree of occlusion. We based our interaction technique on-bezel, around the smartwatch, and we designed two versions of BezelGlide: Full and Partial. Full BezelGlide (FBG) draws a target line between the smartwatch center and the location of the user’s touch location on the bezel (see Figure 5). As we understand that FBG does not com-pletely mitigate occlusion efects, we also created Partial BezelGlide (PBG) which further minimizes occlusion by focusing input in the region of the bezel with the highest degree of screen visibility (see Figure 1). In contrast to FBG, PBG uses a non-uniform mapping from pixels in the interactive bezel region, drawing a target line to the rest of the screen. In both techniques, the user moves their fnger within the bezel region while values are displayed for intersecting points with the target line. To assess visualization legibility with our interaction techniques, we evaluate FBG and PBG against Shift [53] a technique known for its efectiveness in resolving the ‘fat’ fnger challenge on smartphones. The result of this value detection task shows that PBG is signifcantly more efcient compared to the other two interaction techniques with a clear subjective preference due to the minimally occluded screen during interaction.
Our contributions in this paper are twofold: 1) we explore and quantify the amount of occlusion on circular smartwatch screens while users interact with the smartwatch bezel; 2) we present Bezel-Glide a novel suite of techniques with two variants (Full and Partial) designed to overcome ‘fat’-fnger and screen occlusion problems for interacting with data visualizations on smartwatches. Finally, we also illustrate the potential for generalizing our BezelGlide tech-niques to other graph types.
2 RELATED WORK In this section, we summarize relevant work regarding smartwatch usage scenarios, data visualizations for smartwatches, mitigation of screen occlusion, and smartwatch interaction, including bezel interaction. We then describe how our work builds on this previous research.
2.1 Smartwatch Usage Due to the always accessible nature of smartwatches, their use is often quick and has been shown to occur in under 5 seconds [51]. Further, smartwatches have seen increased use while on-the-go [40]. Such on-the-go use can be seen when walking to a destination, while on a transit system, or performing other tasks. The common use cases involve notifcations, checking time, communication, and
inspecting health data among others [6, 12, 30]. Specifcally, health data, which often uses data visualizations to convey information, was utilized for two types of interaction. These two types are peek-ing, as well as physically interacting with the health data which occupied 57.3% of the type of interaction [51]. Due to these common usage scenarios and knowledge regarding health data interaction, as well as the understanding that mobility can afect touch interac-tion [33, 48], we look to explore our data visualization techniques in not only static conditions but also while walking. This will ofer an improved understanding of any efects that may occur due to mobility, and justify the use of our BezelGlide techniques across usage scenarios.
2.2 Data Visualization on Smartwatches Interacting with and viewing data visualizations on small displays can be challenging due to the limited screen real estate [2]. To gain insights from monitored activities by smartwatches, such as ftness targets [2], sleep quality [39], and health bio-markers [50], smartwatch users rely on the available visualizations. In an explo-ration by Amini et al. [2] they demonstrated that general users are growing reliant on the visualizations conveyed to draw meaningful conclusions from their hidden/raw data. To address challenges of visualizing content on small screen displays, designers draw in-spiration from space-efcient and micro-visualizations, two very common space-preserving techniques [10, 17, 37]. However, when the smartwatch user desires further insight from the data (e.g., the exact value of data points), interactive controls for data exploration becomes critical. Our work is motivated by the need to provide users access to efective graph interaction capabilities, with consideration for the arising challenges on small display sizes.
To assess the legibility of such visualizations, researchers resort to a set of canonical data exploration tasks [4, 8, 9, 22, 32, 38]. For example, data value detection, in which the user is exploring the exact values of data points, is one of the most common visual queries in several studies [21, 22, 27]. Data point comparison is another task [4, 32], in which the user must look for the exact diferences between two or multiple data points; or the user has to identify which of two data points has the higher or lower value. Since this task involves the comparison of values at two or more data points, it can be appraised as a more onerous version of the single value detection task. Trend detection and pattern recognition are two other commonly used tasks across diferent studies examining chart legibility [11, 18, 24, 29, 57]. Users perform these two tasks for seeking particular patterns and trends in charts. Such tasks are more closely associated with the specifc data being represented and the ability to perform these can largely depend on the visualization used. Given that value detection is fundamental to all of these data exploration tasks, we adopt it as the primary task in our work.
2.3 ‘Fat’ Finger and Screen Occlusion Considerations During Interaction
The limited input and output space on smartwatches results in the display being largely occluded when interaction takes place [1, 44, 49, 64]. Two main problems arise. First, the ‘fat fnger’ efect, is a result of the width of the fngertip blocking the exact touch location and contents underneath [47]. For example, selecting a

BezelGlide: Interacting with Graphs on Smartwatches with Minimal Screen Occlusion CHI ’21, May 8–13, 2021, Yokohama, Japan
point on a graph results in occluding both that segment of the graph, but also the value that would commonly be displayed aside it. Second, screen occlusion occurs when the interaction blocks content of interest on other areas of the screen due to the body of the fnger across the screen. This may force the user to move their head or adjust the interacting point to better examine the display. This can occur on a smartwatch, when a right handed fnger is interacting with the upper left corner of a smartwatch display on the left wrist, blocking the content on the upper left corner of the display [59].
Due to these efects seen when interacting with smart displays, Vogel and Balakrishnan explored screen occlusion from the hand when interacting on a a large touch display [52]. Because of the issues that arise from these problems many interaction techniques and adaptive methods [16, 25, 44, 53, 59] have been created to overcome these issues. While many of these techniques mitigate the ‘fat fnger’ and screen occlusion problems, on smartwatches they often utilize external hardware or are input modalities that are not common to users. Further, these techniques are not designed to interact with data visualizations, rather focusing on smartwatch interface navigation and control.
Shift, as an input technique, was designed such that content directly under the fngertip moves, or shifts away for better legibility [53]. Shift is highly efective in a number of settings, including on smartwatches [28, 46], but also in comparison to techniques such as ThumbSpace[23], TapTap or MagStick [43].
What is unknown in research, is the degree to which interaction with the bezel of a smartwatch occludes the smartwatch screen itself. Measuring the degree of screen occlusion can help further determine the optimum positioning of information on the display, and to provide more suitable interaction techniques. Moreover, these interaction techniques must also aim to provide control of visualizing data represented on the smartwatch.
2.4 Bezel Interaction Techniques One such interaction method that has been explored on smart-watches, is to utilize the bezels. These bezels can be used for mul-tiple forms of interaction. This includes rotary movement [5, 62], bezel taps [63], bezel initiated sequential tapping [45], bezel press-ing [61], edge based interaction [1, 16, 41], bezel initiated swiping [16, 58], and bezel to bezel [26]. Of note, is edge based interaction, as seen in [1], which gives the user an indirect form of interaction with content, as the point of interaction is at the edge, while the actual display may be in the screen centre. However, ‘square watch interaction’ (SWI) techniques proposed by [1] are specifcally de-signed for smartwatches with square displays and require additional sensors. Although SWI techniques were designed to cover various tasks, they are not specifcally designed for visual exploration on smartwatches. Furthermore, edge plus screen interaction proposed by [1], with which the user needs to interact directly on the screen, can block a considerable portion of the display.
Similarly, in ‘EdgeTouch’ [34], an array of touch sensors were used to detect around-the-display touch points. Since the accuracy and performance of this interaction technique relies heavily on the resolution of the array of sensors around the display, using
EdgeTouch to interact with dense charts and graphs on a smart-watch display could be challenging. Moreover, if the ofset of the interaction area is considerable in EdgeTouch, this may afect the user’s performance.
Interestingly, smartwatch bezels have been used in commercial smartwatch applications1 and on some devices is embedded in the hardware2. Even without embedded hardware, bezel techniques only need to consume an eighth of the width of the screen [58], pixels which are often unused [42]. This is an important fact, in that bezel interaction may allow for data visualizations to occupy the majority of the small screen display on smartwatches while still providing a means of interaction.
Many interaction techniques have been created for smartwatches utilizing the whole touch screen, the bezel, and external hardware. While these techniques improve the navigation of smartwatch in-terfaces, they do not explore their use for interacting with data visualizations. This interaction is crucial, as smartwatches are con-tinuously collecting data and providing feedback for quick and in-situ exploration.
3 STUDY 1: SMARTWATCH OCCLUSION The goal of this study is to explore the amount of screen occlusion resulting from interacting with diferent areas of the smartwatch bezel. The results of this study enabled us to design an interaction technique with minimal screen occlusion.
3.1 Experimental Design In this experiment, we divided the smartwatch bezel into 24 equally sized segments. In each trial, one of these 24 segments was ran-domly highlighted in green and participants had to touch the target with their fngertip. To make sure that participants were pressing the correct target, we provided them with auditory and vibratory feedback. Thus, they had to try and hit the target until they heard and felt feedback. We segmented the bezel into 24 units (15 degrees each) based on the results of the optimal touch target size for smart-watches [19]. Using 24 segments provided sufcient granularity, as smaller segments would not be accurately interact-able.
We used a helmet with a mounted camera to capture images from the smartwatch screen. Any approach will create an ofset, but we aimed to minimize this efect based on prior methods used. Our camera setup was similar to that of prior work [54, 55] to measure screen occlusion. Vogel et al. showed that the captured images from the head mounted camera lineup closely with the users’ line of sight (LOS) [55]. Similar to the approaches of Vogel et al. [54, 55], we ensured our mounted camera was centered with the eyes (Fig 2-left), without interfering with their LOS or disrupting them from performing the main task. In this experiment, participants had to perform the task three times for each segment. In total, we captured 3 (repetitions) × 24 (segments) × 11 (participants) = 792 images. Each experiment session lasted approximately 30 minutes.
1https://www.samsung.com/global/galaxy/galaxy-watch-active2/2https://www.samsung.com/us/mobile/wearables/smartwatches/samsung-gear-s3-frontier-sm-r760ndaaxar/

CHI ’21, May 8–13, 2021, Yokohama, Japan Ali Neshati, Bradley Rey, Sharif AM Faleel, Sandra Bardot, Celine Latulipe, and Pourang Irani
3.2 Apparatus We used a smartwatch Galaxy Watch Active 23, which has a 44mm diameter display with a 360 pixel × 360 pixel resolution. We made sure that participants were not distracted during the study by dis-abling all notifcations as well as the notifcation pane on the watch. To implement the experiment, we created a web app using HTML and JavaScript which was deployed natively on the smartwatch. Participants wore a helmet with a GoPro Hero3 camera mounted to the front side, to capture the images from the participants’ view point, see Figure 2. We used these images to compute the degree of occlusion resulting from interacting with the watch bezel. We captured the images remotely for each trial via a smartphone re-motely connected to the mounted camera. The research assistant conducting the experiment captured stills on the smartphone as soon as the trial feedback was audible.
3.3 Participants In total, we had 11 participants (9 males, 2 females, Maдe = 29, SD = 5.39) complete the study. None of our participants were color blind as per the Ishihara color blind test4 we administered. Participants were compensated with a $15 gift card for their time.
3.4 Procedure This study was conducted during the COVID-19 pandemic. As such, special permission from the university ethics board was obtained for in-person human subjects data collection, and up-to-date health guidelines were strictly followed before, during, and after the exper-iment. Upon their arrival, participants were asked to follow these guidelines: pass a set of COVID-19 related health and travel screen-ing questions, sanitize their hands, and wear a mask, see Figure 2. Participants were given a consent form to read, and a chance to ask questions about the study before signing the consent form.
During the study, participants were seated and wore the smart-watch on their left hand, interacting with their right index fnger. We forced this aspect of the study (regardless of hand dominance) to avoid mixed results regarding the screen occlusion. This does not impact the results as screen occlusion characteristics would be mirrored across the vertical centre of the watch, and results are not reliant on time performance of participants. Participants were then given the helmet, with the camera mounted to it. We made sure the helmet was steady from the start and remained steady throughout the study, such that the camera did not move relative to the participants’ point of view.
Participants were allowed to practice tapping the segments of the bezel until they felt comfortable, thus ensuring they could complete the task appropriately. We asked all participants to land on the targets as comfortably and naturally as possible. Participants were not instructed to perform fast since our focus was to capture the degree of screen occlusion. We did not inform participants of the experiment goal, and as such we did not ask them to minimize fnger occlusion. Once participants were comfortable, we began the data capture phase. In this phase participants were randomly presented with a target and had to touch the target to end the trial. Each segment was presented as the target 3 times, for a total of 72
3https://www.samsung.com/global/galaxy/galaxy-watch-active2/specs/4https://enchroma.com/pages/color-blind-test
trials. There was a 1 second pause between each trial in which the bezel cleared during which the participant was instructed to move their fnger away from the watch.
Figure 2: Screen occlusion study setup. A camera was mounted to the front side of a helmet to capture images of the fnger on a region of the bezel from the user’s vantage point. Images were then processed to compute the degree of occlusion.
3.5 Image Processing To detect the amount of screen occlusion experienced by partici-pants on the smartwatch when interacting with the bezel segments, an image processing algorithm was implemented in Python. We frst cropped all the images to a fxed size such that the smartwatch screen was fully within the cropped region. Since the screen of the smartwatch was relatively bright and white, the visible screen region was extracted, converting the RGB image to a binary image and removing the noise using erode and dilation. To approximate the complete area of the screen, including the occluded part of the screen, the border of the screen was extracted. This was done by distinguishing the edges formed in the binary image between the skin from visible screen edges and the edges formed with the border of the smartwatch screen. These edges were computed using Canny edge detection, and for each edge pixel, the neighbourhood pixels in the RGB image were extracted. The edge pixels were identifed to belong to the edge of the smartwatch screen if the red channel of the respective neighbourhood was not diferent from the average of the blue and green channels of the neighbourhood. This followed from the observation that the edges that the visible screen forms with the skin has a higher diference between the red channel and the other two channels. Once pixels belonging to the edge of the screen were identifed, they were used as coordinates for the ellipse ftting algorithm [14]. Since the experiments were conducted under controlled conditions, with the data that was collected, the color between skin and the screen edge was distinguishable when the neighborhood of a pixel was considered. The algorithm and the parameters were defned specifcally for this environment and data collected. The results of the algorithm were verifed by authors; ensuring the ftted ellipse matched the screen edge on a sub-sample of the complete dataset.
This ellipse ftting algorithm was then used because the screen would not always form a perfect circle on the camera from the users’ perspective. The ftted ellipse model approximated the region of the binary image that would contain the complete screen of the smart watch. The ratio of the number of pixels in this region to the number of pixels representing the region of the visible screen on the binary image was used as an approximation of the region of the screen that was visible to the user. The ellipse-ftting algorithm [14] outlines this process. Figure 3 illustrates the result of our image

BezelGlide: Interacting with Graphs on Smartwatches with Minimal Screen Occlusion CHI ’21, May 8–13, 2021, Yokohama, Japan
processing on three of captured images in this study. Our image processing algorithm is provided in the Appendix.
Figure 3: Using image processing techniques to calculate the screen visibility. A: 96%, B: 38% and C: 86% screen visibility.
3.6 Results The average screen visibility across all segments, across all partici-pants was 76%. The results of this experiment show that interacting with segments on the right lower corner of the screen provides the highest screen visibility, compared to other bezel segments. The indicated area in Figure 4 (denoted by the green arc inside the bezel segments) provides an average of 93.1% percent screen visibility, with all segments in that area providing over 90% visibility. This area ranges from 15◦ ( just above 3:00 on a clock face) to 225◦
(7:30 on a clock face). The result also shows that interacting with segments on the left upper quadrant of the screen (from 105-175 degrees) has the worst screen occlusion, allowing only 51% of the screen to be visible, on average.
Figure 4: Left: heatmap from the screen occlusion experi-ment. The indicated area has screen visibility of at least 90% from 15◦ (2:30 on a clock face) to 225◦ (7:30 on a clock face). Right: spider graph representing the mean value of screen visibility for each segment in the screen occlusion study. The indicated bezel segments in green represent screen visi-bility of at least 90%.
3.7 Discussion The average screen visibility across all segments was 76%, while the left upper quadrant is the area with the lowest screen visibil-ity, and conversely the lower right quadrant provided the highest screen visibility. We note that using the entire bezel can be a good potential way to interact with the content on the screen due to the moderate overall average screen visibility. Moreover, utilizing the segments that provide the highest amount of screen visibility may also provide an interaction technique that is benefcial.
In this study we asked participants to wear their smartwatch on their left wrist to obtain consistent results. To generalize the results of this experiment for left handed smartwatch users (who may wear a smartwatch on the right wrist), we could mirror the results for each segment, fipped on the centre vertical position. Thus, the left lower corner would be the area with the least screen occlusion and the right upper quadrant would be the area with the most screen occlusion.
We note that while mobility may afect the performance of in-teracting with smart devices, this study did not look at this as a variable. Participants were given time, multiple chances, and the ability to move their fnger on the touch screen until they were interacting with the highlighted segment. Thus, we captured the screen occlusion, which we expect would remain relatively similar across mobility conditions, such as while walking.
4 BEZEL INTERACTION TECHNIQUES To overcome the fat fnger and screen occlusion problems we de-signed BezelGlide; a novel suite of interaction techniques that can be utilized for data visualziations. Within this suite, we created Full BezelGlide and Partial BezelGlide. These were designed specifcally to enable interaction with graphs, where being able to view the visual representation and associated content is essential. In this section, we describe how these techniques operate.
4.1 Full BezelGlide From the occlusion study, we observed that across all bezel seg-ments, an average of 76% of the screen was visible, with over 60% the bezel segments providing over 80% visibility and just under half providing over 90%. Inspired by existing bezel interaction tech-niques [1, 41, 62], Full Bezel Glide (FBG) is designed to utilize the entire bezel around the watch face to interact with data visualiza-tions. This technique aims to address the ‘fat fnger’ issue as it prevents the user from directly interacting with the content on the screen, as well as mitigates screen occlusion due to the bezel segments providing high screen visibility being included.
FBG is represented by a line, connecting the center of the screen (starting point of the line) to the position of the fnger on the bezel (ending point of the line). By sliding the fnger along the bezel, the location of the endpoint changes. As this line intersects with data points in the visualization, the value is displayed to the user; See Figure 5. Using the entire bezel allows the user to unambiguously access the entire screen area in a natural means.
4.2 Partial BezelGlide We designed a second technique, Partial BezelGlide (PBG), to focus on the area of the bezel with at least 90% screen visibility, based

CHI ’21, May 8–13, 2021, Yokohama, Japan Ali Neshati, Bradley Rey, Sharif AM Faleel, Sandra Bardot, Celine Latulipe, and Pourang Irani
Figure 5: A demonstration of the FBG technique. Here the user can touch down anywhere on the bezel and a line will connect their touch location with the centre of the watch. The user can then slide their fnger along the bezel, thus moving the line. Intersecting data points with the line will show the value.
on the results of the screen occlusion study. These results showed that interacting with the portion of the bezel between 15◦ (2:30 on a clock face) to 225◦ (7:30 on a clock face) ensures that at least 90% of the screen will be visible. Thus, the PBG technique only requires interaction to occur on this portion of the smartwatch bezel.
In PBG, we use the interaction area and the remaining area on the bezel, which we call the projection area; See Figure 6. The user does not interact within the projection area, they solely interacting with the interaction area. Similar to FBG, there is a line with start and end points. The starting point of the PBG line is the position of the fnger on the interaction area. For each starting point, there is a mapping function that calculates the end point on the projection area of the bezel, due to the reduced interaction area. The line behaves similarly to FBG, in that when the line intersects with data points the value is shown to the user.
Since we are using a smartwatch with a round watch face, frst we need to convert the Cartesian coordinates (x and y) of the touch point on the interaction area to Polar coordinates. The center of the polar coordinate, in our implementation, is the center of the display. To calculate the polar coordinates we need to calculate the distance of the point to the center as well as the angle of the line connecting this point and the center of the screen. We calculate the distance using the following formula: q
r = (x − xcenter )2 + (y − ycenter )2
We calculate the angle using the following equation:
y − ycenter θ = arctan
x − xcenter After calculating r and θ , we have the polar coordinate of the
start point of the line which is within the interaction area. A simple mapping function can then calculate the polar coordinate of the end point based on the polar coordinate of the start point. Notice that the interaction area covers 150◦ while the projection area covers 210◦ of the area of the smartwatch bezel. The following formula calculates the end point by scaling the start point from one range
(interaction area on the bezel) to the new range (projection area on the bezel).
(θInteraction − θOldRanдeMin ) × (NewRaдe)θProject ion =
OldRanдe + θN ewRanдeMin
Notice that we just need to use the formula to calculate the angle, since the distance of the projected point to the center does not change. For the next step we calculate the Cartesian coordinates of the projected point.
Through this process, the interaction line will connect the start-ing point (touch point) and the calculated projected point on the projection area on the bezel. Similar to the previous technique, the intersection of the interaction line and data points will show the value of data points.
Figure 6: Left: shows how the mapping extends a touch point from the interaction space to the projection space. Middle and right: As the user glides their fnger along the bezel the projection is updated and the intersecting points are se-lected on the graph.
5 STUDY 2: TECHNIQUE COMPARISON Our second study investigates the performance of the two new techniques, comparing them with the baseline Shift technique [53]. Due to commonly interacting with smartwatches while on-the-go, we assessed our interaction techniques while standing (static) and walking. Ideally, interaction techniques on smartwatches can also generalize to mobility conditions [48].
5.1 Shift Technique To evaluate our techniques we chose the Shift [53] technique as our baseline. It is a standard and well-known interaction technique designed to overcome the ‘fat fnger’ efect on small displays. Using the Shift technique, the user can interact directly with the informa-tion on the screen by showing the content underneath the user’s fnger, in an ofset miniature window. As the user moves their fnger over the display, the ofset window’s position also changes to avoid occlusion. In our implementation of the Shift technique, the size of the ofset window was 70 × 70 pixels. Pilot studies revealed that this size has optimal to display content.
We chose the Shift technique for a few reasons. 1) For increas-ingly dense data visualizations (e.g., graphs with pixel size data points), discrete tapping of data points becomes more difcult and

BezelGlide: Interacting with Graphs on Smartwatches with Minimal Screen Occlusion CHI ’21, May 8–13, 2021, Yokohama, Japan
requires additional steps each time a user wants to view a chart value. Thus, 2-step techniques do not aford continuous graph ex-ploration, a highlight of our technique. 2) Shift was specifcally designed for fnger occlusion, and has shown promise on smart-watches [28, 46]. Shift has shown optimal performance under a number of contexts, including back-of-device input [20]. 3) Multi-stage tapping may not mitigate occlusion as the user would still be required to precisely tap each time. Continuous gestures, such as ours and Shift, aford the ability to adjust the fnger position to quickly read out data values.
5.2 Experimental Design For this experiment, we followed a 3x2 within-subjects study design, with the interaction technique (Shift, FBG, PBG) and mobility con-ditions (Standing and Walking) as factors. Evaluating PBG against FBG was necessary to identify if our consideration for occlusion mattered when browsing a graph. Although PBG is designed to minimize the ‘fat fnger’ efect, it is not clear if the performance of FBG, as a more natural bezel interaction technique, is slower, faster or equal to PBG.
In this experiment, all participants performed all three interac-tion techniques in both mobility conditions, leading to 6 combina-tions in total. We counterbalanced only the order of the techniques (half of the participants performed FBG before PBG and vice versa). Participants started with the standing condition and then did the walking condition.
Stimulus. We generated random line-graphs with 24 data points as the visualization in our study. We focused on the interaction of line-graphs as this technique is commonly used for health data [7, 32]. We used 24 data points as per prior smartwatch studies [4]. This number also follows the number of hours in a day to mimic data collected and represented at hourly intervals. A block (including one interaction and one mobility condition) consisted of 50 line-graphs, the same used across all participants, and randomly ordered for each participant. For each line-graph presented to the user, one of the 24 data points was randomly selected to be the target prior to the study. We used a range between 0 and 100 to generate data point values. For all graphs, lines as well as data points are drawn in blue. We used red dots to highlight the target data point. We chose blue, red, as well as a white background, to ensure good contrast and legibility.
Task. Data detection tasks are one of the most commonly used tasks across research exploring various data visualization tech-niques [21, 22, 27]. In this task, the main goal is to interact with the line-graph to detect the value of a highlighted data point, among all other data points. Selection occurs on a lift-of, and to cancel the user simply slides their fnger past the ‘active bezel’ region to dismantle the intersecting line.
5.3 Participants We recruited 12 new participants (9 males, 3 females, Maдe = 22.2, SD = 5.62) in this experiment. All of the participants were right handed and none of them were color blind as per the Ishihara color blind test we administered5. Participants were compensated with a
5https://enchroma.com/pages/color-blind-test
$15 gift card for their time. None of the participants took part in Study 1.
5.4 Apparatus As in Study 1, we used the same Samsung Galaxy Watch Active 2 smartwatch. All three interaction techniques were implemented as web apps, by using HTML, JavaScript and CSS and which run native on the watch. All data and graphs were made in Microsoft Excel and exported for use in the implementation. Furthermore, to simulate the walking condition, a treadmill was used, see Figure 7.
Figure 7: Apparatus of the study. Left: Standing condition; Right: Walking condition on a treadmill.
5.5 Procedure Similarly to Study 1, this study was conducted during the COVID-19 pandemic. As such, proper health guidelines were strictly followed before, during, and after the experiment. Upon their arrival, par-ticipants were asked to follow these guidelines: answer COVID-19 related health and travel questions, sanitize their hands, and wear a mask; See Figure 7. After going over the ethics protocol with each participant, we provided the general information regarding the study.
First, we explained the interaction technique and we let partic-ipants practice until they felt comfortable to perform the task in that condition. Participants were informed that we were measuring their response time and we asked them to perform the task as fast as possible. We informed participants that they could take a break at the end of a block. At the end of the experiment, we asked par-ticipants to fll out a questionnaire to share their opinions on and rank the three interaction techniques.
To start the trial, the participant tapped the smartwatch screen. Immediately a graph was shown and the timer would start. As soon as the participant reached the indicated data point in the graph, we fagged this event indicating the participant had actually crossed and seen the desired data point. Once this fag had been set, the time of the last touch up event stopped the timer and this was the response time for that trial. We did this so that participants could touch up and down as many times as they liked, while ensuring the desired data point had been crossed. Aside from response time, we had the participants tell us the value of the data point before moving to the next graph. This was done to validate that they had correctly seen the desired data point.

CHI ’21, May 8–13, 2021, Yokohama, Japan Ali Neshati, Bradley Rey, Sharif AM Faleel, Sandra Bardot, Celine Latulipe, and Pourang Irani
For the walking condition, we asked participants to walk on the treadmill and to adjust the speed to their Preferred Walking Speed (PWS) [48]. In addition to allowing for a safer experimental proto-col, this ensured participants were comfortable with the mobility condition.
Lastly, we logged all participants interactions with the smart-watch display during each trial. This included touch points and the number of times they touched up and down. In total, we collected 3 (interaction techniques) × 2 (mobility conditions) × 50 (line-graphs) × 12 (participants) = 3600 trials.
5.6 Results In this section, we report both quantitative and qualitative analyses from the data collected in the study.
5.6.1 Response Time. For the data analysis, the results of a Shapiro-Wilk test showed that our data was not normally distributed. There-fore, Kruskal-Wallis and Mann-Whitney U tests were conducted to identify signifcant diferences between interaction techniques. To reduce Type I error, Bonferroni correction was applied.
The results of the Kruskal-Wallis test showed that there is a signifcant diference between three interaction conditions across the two mobility conditions (χ2 = 597.62, p < 0.001, d f = 2). To identify the location of signifcant diferences, we conducted Mann-Whitney U tests, and we found signifcant diferences between all condition pairs: FBG and Shift (U = 831936, p < 0.001, Shift; Mdn = 2944ms, FBG; Mdn = 2148ms), PBG and Shift (U = 941740, p < 0.001, Shift; Mdn = 2944ms, PBG; Mdn = 1920ms) and PBG and FBG (U = 770018, p < 0.001, FBG; Mdn = 2148ms, PBG; Mdn = 1920ms). Figure 8 summaries the results.
Figure 8: Left: Overall average response times (ms) for Shift, FBG, and PBG. Right: average response times for each inter-action technique, separated out by mobility condition.
We further analyzed response time for each interaction technique by dividing the watch-face into 24 even pie segments. We labeled each target in our graphs to belong to one of these 24 segments. We calculated the average response time for each technique for targets within each segment. Figure 9 (a) summarises the results. The aver-age response time for targets in each segment is represented using a spider graph wherein the points closer to the center represent faster response times. We observe the following. We note that for PBG, the response time is the fastest for almost all segments. This demonstrates that PBG is the most efcient technique when targets appear in each of these pie segments on the smartwatch. The FBG technique also does well for some segments on the watch, but is slower for targets that appear near the right side (segments 23, 24 and 1-6). For the Shift technique, we note that while windowing
mitigates the fat fnger problem, response times are higher in the upper left corner. This may be due to the fact that the body of the fnger still occludes the screen, and thus the window. In general, we observer larger fuctuations in response times around the diferent watch segments with the Shift and FBG techniques. In contrast, PBG shows the most consistent pattern.
Figure 9: Response times divided by the location of the data point within pie segments (a) and concentric classes (b).
We also classifed the targets on the all line graphs into 4 concen-tric classes based on the location along the smartwatch radius. We calculated the average response time for each of these four classes for the diferent interaction techniques. For this comparison, we only consider PBG and FBG, as users clearly perform faster with these than the Shift technique. See Figure 9 (b). For both PBG and FBG, as we start from the center segment, and move towards the smartwatch edge, the response times increase. While these tech-niques utilize the bezel of the smartwatch, slight occlusion still occurs even in the highest visibility segments of the bezel. Thus, for points near the edge of the screen, these can still take slightly more time to acquire.
5.6.2 Touch Points. To gain a better understanding of the interac-tion itself we further analyzed the touch points collected during the participant’s interactions. We explored both touch down locations as well as the overall distance travelled during the interaction.
Figure 10: Touch point results for both (a) touch down lo-cations and (b) average touch interaction distance travelled (with 95% confdence intervals denoted by the red bars). For touch distance travelled we note the circumference of the watch is 1131 pixels.

BezelGlide: Interacting with Graphs on Smartwatches with Minimal Screen Occlusion CHI ’21, May 8–13, 2021, Yokohama, Japan
Touch Down Locations. First, we wanted to explore the locations in which participants landed, and thus started their interaction from. Figure 10 (a) shows the results of the plot, with notable results for the FBG and PBG techniques. As can be seen, the PBG touch down position is relatively condensed within the interaction area, although slightly skewed to the right. Surprisingly, the touch down locations for the FBG technique also tended to start in the bottom and bottom right bezel areas.
Touch Path Distance. Due to the interesting results regarding the FBG touch down locations, we next aimed to explore the distance travelled during interactions by participants. The average distance travelled for each condition can be seen in Figure 10 (b). These show signifcantly reduced distances travelled for the only the PBG technique. We also note that mobility did not have an efect on this distance in both the BezelGlide interaction techniques.
5.6.3 Mobility Conditions. We were interested in seeing if there would be an interaction efect on response time between the two mobility conditions (standing and walking) and the three inter-action techniques (Shift, FBG, and PBG). The result of our data analysis showed that there was no interaction efect. We also did not fnd any signifcant diference between the walking and running conditions for each interaction technique.
5.6.4 Participant Preferences. At the end of the experiment, partic-ipants flled out a questionnaire regarding their technique prefer-ence. We also asked them to provide reasons for liking or disliking a particular interaction techniques. 10 participants preferred the PBG technique compared to the two other interaction techniques (Shift and FBG).
Many participants pointed out that PBG is better than the other techniques because it fxed the screen occlusion problem. For in-stance, P1 mentioned “ my fnger wasn’t blocking the view and I could fnd the point easier.”., P7 commented “Your hand is not in the way of seeing the number. ” and P10 noted that “it only covers a tiny part of the screen so your fngers are not covering the whole screen as you move your hand around.”. With respect to screen occlusion, some participants mentioned that moving their head to adjust their view in the FBG technique made it harder to interact with, compared to PBG. For instance, P8 mentioned “With FBG, sometimes your hand is in the way of the screen so you can’t see the number.”.
Some participants mentioned that they liked having to move their fnger less in the PBG technique to interact with graphs. For example, P2 pointed out that “smaller area that interacts making it easier to get to a number ”. Also, P11 mentioned that “Limiting the area in my opinion made if faster to target the point and read the value and also the fnger was not blocking the view.” As a disadvantage of PBG, some participants mentioned that it took time for them to get used to this technique.
5.7 Discussion Our results show that both FBG and PBG are signifcantly faster than the Shift technique. We also showed that in PBG, by limiting the interaction area on the bezel to the area with maximum visibility, we decreased the response time and travel distance signifcantly compared to the FBG technique. We attribute this outcome to two efects. First, PBG reduces the overall amount of screen occlusion.
In the Shift technique, participants had to directly interact with the screen, which blocked a great portion of the display. The FBG technique does not entirely mitigate screen occlusion concerns, especially while interacting with the left upper corner of the screen. This is resolved with PBG which allows for 90% of screen visibility, overall. Second, we observed the need for shorter displacements with PBG than with either FBG or Shift. FBG uses the entire bezel, and thus choosing the most appropriate landing point to make the intersecting segment appear can be time consuming. Further, in FBG participants tended to start in a position that allowed for them to view the graph before moving to the correct bezel location, and thus the data point desired; an already natural aspect of PBG. Shift uses the entire display, requiring the user to move signifcantly within this space.
6 DISCUSSION We discuss our study 1 and 2 fndings, and present the key take away lessons. We also discuss other potential applications of our techniques and present limitations of our work.
6.1 Overall Findings From study 1 we learn that we can achieve a high degree of screen visibility, if the interaction is limited to a region of the bezel in the lower right side (when interacting with the right hand). To retain 90% screen visibility, we should only use about 40% of the bezel region in the lower right quadrant (encompassing 15◦ to 225◦
clockwise). We also fnd that the opposite area, ie. the top left corner of the smartwatch bezel, has the least screen visibility. This area (105◦ to 175◦ counter-clockwise) has a screen visibility of 60% at most. We also found that in the worst case, interacting with the smartwatch bezel will yield a 50% screen visibility. Furthermore, on average across all segments, we obtain a 76% screen visibility. This leaves designers with at least 2/3 of the display to provide information. This makes the bezel a useful interactive region for mitigating screen occlusion on circular smartwatches.
In the second study, our results show that our participants per-formed better while they interacted with graphs using the PBG technique. PBG was designed based on the result of study 1 to mitigate the ‘fat fnger’ and screen occlusion problems. On average, PBG was nearly 34% faster than the Shift techniques and 10% faster than FBG.
Further analysis shows that, for both PBG and FBG, if the target data point is close to the smartwatch bezel, it takes more time for users to reach and read the value of the data point. Whereas, if the data point is closer to the center of the screen, users can access them quicker. Figure 9 (b) shows that for all 4 segments (from center to the edge), PBG was more efcient compared to FBG.
Lastly, analyzing the touch points showed that total distance travelled was signifcantly reduced in the PBG technique. As well, both the BezelGlide techniques had users tending to start the inter-action in or near the interaction area of PBG. Thus, the argument can be made that participants desired to start the interaction while being able to view and asses the data visualization before targeting the specifc data point.
CHI ’21, May 8–13, 2021, Yokohama, Japan Ali Neshati, Bradley Rey, Sharif AM Faleel, Sandra Bardot, Celine Latulipe, and Pourang Irani
6.2 Potential for Generalizability Our experiment used a common graph visualization, the line-graph. However, there are many other types of graph visualizations that a user may want to interact with on a smartwatch[2, 4]. In this section we illustrate how the PBG technique (which had the best performance in our experiment and causes the least amount of occlusion) can be generalized to other commonly used graph types on smartwatches.
Blascheck et al. [4] showed that donut, bar and radial bar charts are the most commonly used visualization techniques on smart-watches. We thus illustrate the potential of PBG with these charts. We also show how PBG generalizes to pie charts, as they are very similar to donut charts.
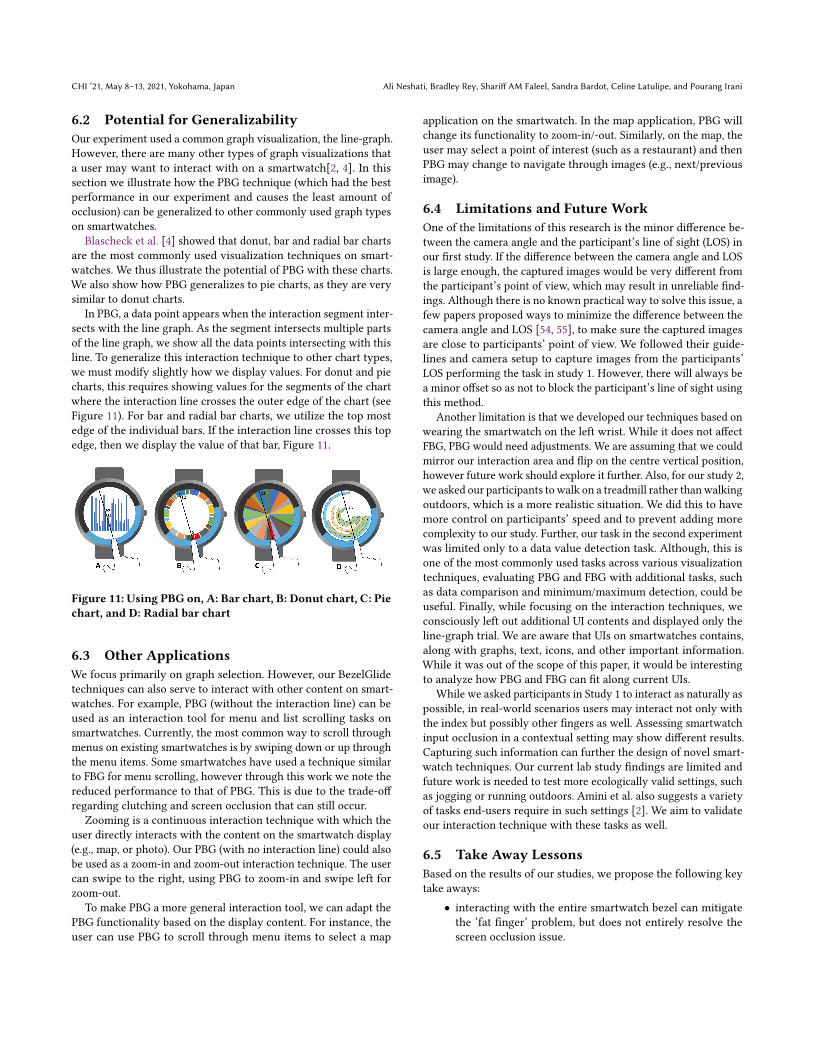
In PBG, a data point appears when the interaction segment inter-sects with the line graph. As the segment intersects multiple parts of the line graph, we show all the data points intersecting with this line. To generalize this interaction technique to other chart types, we must modify slightly how we display values. For donut and pie charts, this requires showing values for the segments of the chart where the interaction line crosses the outer edge of the chart (see Figure 11). For bar and radial bar charts, we utilize the top most edge of the individual bars. If the interaction line crosses this top edge, then we display the value of that bar, Figure 11.
Figure 11: Using PBG on, A: Bar chart, B: Donut chart, C: Pie chart, and D: Radial bar chart
6.3 Other Applications We focus primarily on graph selection. However, our BezelGlide techniques can also serve to interact with other content on smart-watches. For example, PBG (without the interaction line) can be used as an interaction tool for menu and list scrolling tasks on smartwatches. Currently, the most common way to scroll through menus on existing smartwatches is by swiping down or up through the menu items. Some smartwatches have used a technique similar to FBG for menu scrolling, however through this work we note the reduced performance to that of PBG. This is due to the trade-of regarding clutching and screen occlusion that can still occur.
Zooming is a continuous interaction technique with which the user directly interacts with the content on the smartwatch display (e.g., map, or photo). Our PBG (with no interaction line) could also be used as a zoom-in and zoom-out interaction technique. The user can swipe to the right, using PBG to zoom-in and swipe left for zoom-out.
To make PBG a more general interaction tool, we can adapt the PBG functionality based on the display content. For instance, the user can use PBG to scroll through menu items to select a map
application on the smartwatch. In the map application, PBG will change its functionality to zoom-in/-out. Similarly, on the map, the user may select a point of interest (such as a restaurant) and then PBG may change to navigate through images (e.g., next/previous image).
6.4 Limitations and Future Work One of the limitations of this research is the minor diference be-tween the camera angle and the participant’s line of sight (LOS) in our frst study. If the diference between the camera angle and LOS is large enough, the captured images would be very diferent from the participant’s point of view, which may result in unreliable fnd-ings. Although there is no known practical way to solve this issue, a few papers proposed ways to minimize the diference between the camera angle and LOS [54, 55], to make sure the captured images are close to participants’ point of view. We followed their guide-lines and camera setup to capture images from the participants’ LOS performing the task in study 1. However, there will always be a minor ofset so as not to block the participant’s line of sight using this method.
Another limitation is that we developed our techniques based on wearing the smartwatch on the left wrist. While it does not afect FBG, PBG would need adjustments. We are assuming that we could mirror our interaction area and fip on the centre vertical position, however future work should explore it further. Also, for our study 2, we asked our participants to walk on a treadmill rather than walking outdoors, which is a more realistic situation. We did this to have more control on participants’ speed and to prevent adding more complexity to our study. Further, our task in the second experiment was limited only to a data value detection task. Although, this is one of the most commonly used tasks across various visualization techniques, evaluating PBG and FBG with additional tasks, such as data comparison and minimum/maximum detection, could be useful. Finally, while focusing on the interaction techniques, we consciously left out additional UI contents and displayed only the line-graph trial. We are aware that UIs on smartwatches contains, along with graphs, text, icons, and other important information. While it was out of the scope of this paper, it would be interesting to analyze how PBG and FBG can ft along current UIs.
While we asked participants in Study 1 to interact as naturally as possible, in real-world scenarios users may interact not only with the index but possibly other fngers as well. Assessing smartwatch input occlusion in a contextual setting may show diferent results. Capturing such information can further the design of novel smart-watch techniques. Our current lab study fndings are limited and future work is needed to test more ecologically valid settings, such as jogging or running outdoors. Amini et al. also suggests a variety of tasks end-users require in such settings [2]. We aim to validate our interaction technique with these tasks as well.
6.5 Take Away Lessons Based on the results of our studies, we propose the following key take aways:
• interacting with the entire smartwatch bezel can mitigate the ‘fat fnger’ problem, but does not entirely resolve the screen occlusion issue.

BezelGlide: Interacting with Graphs on Smartwatches with Minimal Screen Occlusion CHI ’21, May 8–13, 2021, Yokohama, Japan
• interacting with the right lower corner of the smartwatch display, within a specifc angle range (15◦ - 255◦ clockwise) is the most suitable place to minimize screen occlusion on smartwatch displays.
• using this optimal area on the smartwatch, our BezelGlide technique can facilitate efective value detection tasks on line graphs, in static and mobile conditions.
7 CONCLUSION We present BezelGlide, a suite of interactive smartwatch techniques to facilitate interacting with graphs on a small display. Our tech-nique is motivated by the need to inspect graph contents, in-situ, during the activity generating the data, such as a while running. BezelGlide is designed to minimize occlusion with the display and thus allows using the smartwatch bezel as an input modality. First, we examined regions around the bezel that minimize screen oc-clusion. We fnd that bezel regions in the lower right quadrant have optimal screen visibility of at least 90%. This led us to de-sign two BezelGlide techniques: Full BezelGlide (FBG) and Partial BezelGlide (PBG). The FBG technique involves gliding the fnger around the watch’s entire bezel to target values using an intersect-ing segment from the screen centre to the fngertip. PBG uses a non-linear transformation of points from a specifc bezel region, chosen from our optimal screen visibility results in our frst study, to cover the entire screen with a similar segment. We fnd that PBG, enables rapid interaction with line-graphs, both while standing and walking. PBG also outperforms both FBG and Shift, a technique to mitigate touchscreen occlusion and the ‘fat fnger’ problem, in a value detection task on line graphs. We demonstrate that PBG can be generalized to other graph types, including donut-, bar-, pie-, and radial-bar charts on smartwatches. In this work, we ofer one of the frst input modalities allowing for improved interaction with graphs on smartwatches. This furthers the ability to explore data visualizations, all while considering minimal display occlusion on small displays.
ACKNOWLEDGMENTS We would like to thank all of our participants. We also acknowledge support from the NSERC CREATE grant on Visual and Automated Disease Analytics and the CRC program.
REFERENCES [1] Sunggeun Ahn, Jaeyeon Lee, Keunwoo Park, and Geehyuk Lee. 2018. Evaluation
of edge-based interaction on a square smartwatch. International Journal of Human-Computer Studies 109 (2018), 68–78.
[2] Fereshteh Amini, Khalad Hasan, Andrea Bunt, and Pourang Irani. 2017. Data representations for in-situ exploration of health and ftness data. In Proceedings of the 11th EAI International Conference on Pervasive Computing Technologies for Healthcare. 163–172.
[3] Shaikh Shawon Arefn Shimon, Courtney Lutton, Zichun Xu, Sarah Morrison-Smith, Christina Boucher, and Jaime Ruiz. 2016. Exploring non-touchscreen gestures for smartwatches. In Proceedings of the 2016 CHI Conference on Human Factors in Computing Systems. 3822–3833.
[4] Tanja Blascheck, Lonni Besançon, Anastasia Bezerianos, Bongshin Lee, and Petra Isenberg. 2018. Glanceable visualization: Studies of data comparison performance on smartwatches. IEEE transactions on visualization and computer graphics 25, 1 (2018), 630–640.
[5] Emeline Brulé, Gilles Bailly, Marcos Serrano, Marc Teyssier, and Samuel Huron. 2017. Investigating the design space of smartwatches combining physical rotary inputs. In Proceedings of the 29th Conference on l’Interaction Homme-Machine. 13–20.
[6] Jaemin Chun, Anind Dey, Kyungtaek Lee, and SeungJun Kim. 2018. A qualitative study of smartwatch usage and its usability. Human Factors and Ergonomics in Manufacturing & Service Industries 28, 4 (2018), 186–199.
[7] Tak chung Fu, Fu lai Chung, Robert Luk, and Chak man Ng. 2007. Stock time series pattern matching: Template-based vs. rule-based approaches. Engineering Applications of Artifcial Intelligence 20, 3 (2007), 347 – 364. https://doi.org/10. 1016/j.engappai.2006.07.003
[8] Frederick E Croxton and Harold Stein. 1932. Graphic comparisons by bars, squares, circles, and cubes. J. Amer. Statist. Assoc. 27, 177 (1932), 54–60.
[9] Walter Crosby Eells. 1926. The relative merits of circles and bars for representing component parts. J. Amer. Statist. Assoc. 21, 154 (1926), 119–132.
[10] Paolo Federico, Stephan Hofmann, Alexander Rind, Wolfgang Aigner, and Sil-via Miksch. 2014. Qualizon graphs: Space-efcient time-series visualization with qualitative abstractions. In Proceedings of the 2014 International Working Conference on Advanced Visual Interfaces. 273–280.
[11] Johannes Fuchs, Fabian Fischer, Florian Mansmann, Enrico Bertini, and Petra Isenberg. 2013. Evaluation of alternative glyph designs for time series data in a small multiple setting. In Proceedings of the SIGCHI conference on human factors in computing systems. 3237–3246.
[12] Rúben Gouveia, Fábio Pereira, Evangelos Karapanos, Sean A Munson, and Marc Hassenzahl. 2016. Exploring the design space of glanceable feedback for physical activity trackers. In Proceedings of the 2016 ACM International Joint Conference on Pervasive and Ubiquitous Computing. 144–155.
[13] Garrett Grolemund and Hadley Wickham. 2015. Visualizing complex data with embedded plots. Journal of Computational and Graphical Statistics 24, 1 (2015), 26–43.
[14] Radim Halır and Jan Flusser. 1998. Numerically stable direct least squares ftting of ellipses. In Proc. 6th International Conference in Central Europe on Computer Graphics and Visualization. WSCG, Vol. 98. Citeseer, 125–132.
[15] Teng Han, Khalad Hasan, Keisuke Nakamura, Randy Gomez, and Pourang Irani. 2017. Soundcraft: Enabling spatial interactions on smartwatches using hand generated acoustics. In Proceedings of the 30th Annual ACM Symposium on User Interface Software and Technology. 579–591.
[16] Teng Han, Jiannan Li, Khalad Hasan, Keisuke Nakamura, Randy Gomez, Ravin Balakrishnan, and Pourang Irani. 2018. PageFlip: Leveraging Page-Flipping Ges-tures for Efcient Command and Value Selection on Smartwatches. In Proceedings of the 2018 CHI Conference on Human Factors in Computing Systems. 1–12.
[17] Ming C Hao, Umeshwar Dayal, Daniel A Keim, and Tobias Schreck. 2005. Importance-driven visualization layouts for large time series data. In IEEE Sym-posium on Information Visualization, 2005. INFOVIS 2005. IEEE, 203–210.
[18] Ming C Hao, Manish Marwah, Halldór Janetzko, Umeshwar Dayal, Daniel A Keim, Debprakash Patnaik, Naren Ramakrishnan, and Ratnesh K Sharma. 2012. Visual exploration of frequent patterns in multivariate time series. Information Visualization 11, 1 (2012), 71–83.
[19] Kiyotaka Hara, Takeshi Umezawa, and Noritaka Osawa. 2015. Efect of button size and location when pointing with index fnger on smartwatch. In International Conference on Human-Computer Interaction. Springer, 165–174.
[20] Khalad Hasan, Xing-Dong Yang, Hai-Ning Liang, and Pourang Irani. 2012. How to position the cursor? an exploration of absolute and relative cursor positioning for back-of-device input. In Proceedings of the 14th international conference on Human-computer interaction with mobile devices and services. 103–112.
[21] Jefrey Heer and Michael Bostock. 2010. Crowdsourcing graphical perception: using mechanical turk to assess visualization design. In Proceedings of the SIGCHI conference on human factors in computing systems. 203–212.
[22] Waqas Javed, Bryan McDonnel, and Niklas Elmqvist. 2010. Graphical perception of multiple time series. IEEE transactions on visualization and computer graphics 16, 6 (2010), 927–934.
[23] Amy K Karlson and Benjamin B Bederson. 2007. ThumbSpace: generalized one-handed input for touchscreen-based mobile devices. In IFIP Conference on Human-Computer Interaction. Springer, 324–338.
[24] Eamonn Keogh, Harry Hochheiser, and Ben Shneiderman. 2002. An augmented visual query mechanism for fnding patterns in time series data. In International Conference on Flexible Query Answering Systems. Springer, 240–250.
[25] Frederic Kerber, Tobias Kiefer, Markus Löchtefeld, and Antonio Krüger. 2017. Investigating current techniques for opposite-hand smartwatch interaction. In Proceedings of the 19th International Conference on Human-Computer Interaction with Mobile Devices and Services. 1–12.
[26] Yuki Kubo, Buntarou Shizuki, and Jiro Tanaka. 2016. B2B-Swipe: Swipe gesture for rectangular smartwatches from a bezel to a bezel. In Proceedings of the 2016 CHI Conference on Human Factors in Computing Systems. 3852–3856.
[27] Bongshin Lee, Catherine Plaisant, Cynthia Sims Parr, Jean-Daniel Fekete, and Nathalie Henry. 2006. Task taxonomy for graph visualization. In Proceedings of the 2006 AVI workshop on BEyond time and errors: novel evaluation methods for information visualization. 1–5.
[28] Luis A Leiva, Alireza Sahami, Alejandro Catala, Niels Henze, and Albrecht Schmidt. 2015. Text entry on tiny qwerty soft keyboards. In Proceedings of the 33rd Annual ACM Conference on Human Factors in Computing Systems. 669–678.

CHI ’21, May 8–13, 2021, Yokohama, Japan Ali Neshati, Bradley Rey, Sharif AM Faleel, Sandra Bardot, Celine Latulipe, and Pourang Irani
[29] Jessica Lin, Eamonn Keogh, and Stefano Lonardi. 2005. Visualizing and discover-ing non-trivial patterns in large time series databases. Information visualization 4, 2 (2005), 61–82.
[30] Donald McMillan, Barry Brown, Airi Lampinen, Moira McGregor, Eve Hoggan, and Stefania Pizza. 2017. Situating wearables: Smartwatch use in context. In Proceedings of the 2017 CHI Conference on Human Factors in Computing Systems. 3582–3594.
[31] Andrew Vande Moere and Helen Purchase. 2011. On the role of design in information visualization. Information Visualization 10, 4 (2011), 356–371.
[32] Ali Neshati, Yumiko Sakamoto, Launa C Leboe-McGowan, Jason Leboe-McGowan, Marcos Serrano, and Pourang Irani. 2019. G-Sparks: Glanceable Sparklines on Smartwatches.. In Graphics Interface. 23–1.
[33] Alexander Ng, John Williamson, and Stephen Brewster. 2015. The efects of encumbrance and mobility on touch-based gesture interactions for mobile phones. In Proceedings of the 17th International Conference on Human-Computer Interaction with Mobile Devices and Services. 536–546.
[34] Ian Oakley and Doyoung Lee. 2014. Interaction on the edge: ofset sensing for small devices. In Proceedings of the SIGCHI Conference on Human Factors in Computing Systems. 169–178.
[35] Ian Oakley, Carina Lindahl, Khanh Le, DoYoung Lee, and MD Rasel Islam. 2016. The fat fnger: Exploring area touches on smartwatches. In Proceedings of the 2016 CHI Conference on Human Factors in Computing Systems. 4238–4249.
[36] Keunwoo Park, Daehwa Kim, Seongkook Heo, and Geehyuk Lee. 2020. MagTouch: Robust Finger Identifcation for a Smartwatch Using a Magnet Ring and a Built-in Magnetometer. In Proceedings of the 2020 CHI Conference on Human Factors in Computing Systems (Honolulu, HI, USA) (CHI ’20). Association for Computing Machinery, New York, NY, USA, 1–13. https://doi.org/10.1145/3313831.3376234
[37] J Parnow. 2015. Micro visualizations: How can micro visualisations enhance text comprehension, memorability, and exploitation? Design MS Thesis, Potsdam Univ. Appl. Sci., Potsdam, Germany (2015).
[38] Lewis V Peterson and Wilbur Schramm. 1954. How accurately are diferent kinds of graphs read? Audiovisual communication review 2, 3 (1954), 178–189.
[39] Zablon Pingo and Bhuva Narayan. 2019. “My smartwatch told me to see a sleep doctor”: a study of activity tracker use. Online Information Review (2019).
[40] Stefania Pizza, Barry Brown, Donald McMillan, and Airi Lampinen. 2016. Smart-watch in vivo. In Proceedings of the 2016 CHI Conference on Human Factors in Computing Systems. 5456–5469.
[41] Katrin Plaumann, Michael Müller, and Enrico Rukzio. 2016. CircularSelection: optimizing list selection for smartwatches. In Proceedings of the 2016 ACM Inter-national Symposium on Wearable Computers. 128–135.
[42] Volker Roth and Thea Turner. 2009. Bezel swipe: confict-free scrolling and multiple selection on mobile touch screen devices. In Proceedings of the SIGCHI Conference on Human Factors in Computing Systems. 1523–1526.
[43] Anne Roudaut, Stéphane Huot, and Eric Lecolinet. 2008. TapTap and MagStick: improving one-handed target acquisition on small touch-screens. In Proceedings of the working conference on Advanced visual interfaces. 146–153.
[44] Léa Saviot, Frederik Brudy, and Steven Houben. 2017. WRISTBAND. IO: ex-panding input and output spaces of a Smartwatch. In Proceedings of the 2017 CHI Conference Extended Abstracts on Human Factors in Computing Systems. 2025–2033.
[45] Marcos Serrano, Eric Lecolinet, and Yves Guiard. 2013. Bezel-Tap gestures: quick activation of commands from sleep mode on tablets. In Proceedings of the SIGCHI Conference on Human Factors in Computing Systems. 3027–3036.
[46] Tomoki Shibata, Daniel Afergan, Danielle Kong, Beste F Yuksel, I Scott MacKenzie, and Robert JK Jacob. 2016. DriftBoard: A panning-based text entry technique for ultra-small touchscreens. In Proceedings of the 29th Annual Symposium on User Interface Software and Technology. 575–582.
[47] Katie A Siek, Yvonne Rogers, and Kay H Connelly. 2005. Fat fnger worries: how older and younger users physically interact with PDAs. In IFIP Conference on Human-Computer Interaction. Springer, 267–280.
[48] Gaganpreet Singh, William Delamare, and Pourang Irani. 2018. D-SWIME: A design space for smartwatch interaction techniques supporting mobility and encumbrance. In Proceedings of the 2018 CHI Conference on Human Factors in Computing Systems. 1–13.
[49] Srinath Sridhar, Anders Markussen, Antti Oulasvirta, Christian Theobalt, and Sebastian Boring. 2017. WatchSense: On-and above-skin input sensing through a wearable depth sensor. In Proceedings of the 2017 CHI Conference on Human Factors in Computing Systems. 3891–3902.
[50] John Trimpop, Hannes Schenk, Gerald Bieber, Friedrich Lämmel, and Paul Burggraf. 2017. Smartwatch based respiratory rate and breathing pattern recog-nition in an end-consumer environment. In Proceedings of the 4th international Workshop on Sensor-based Activity Recognition and Interaction. 1–5.
[51] Aku Visuri, Zhanna Sarsenbayeva, Niels van Berkel, Jorge Goncalves, Reza Rawas-sizadeh, Vassilis Kostakos, and Denzil Ferreira. 2017. Quantifying sources and types of smartwatch usage sessions. In Proceedings of the 2017 CHI Conference on Human Factors in Computing Systems. 3569–3581.
[52] Daniel Vogel and Ravin Balakrishnan. 2010. Occlusion-aware interfaces. In Proceedings of the SIGCHI Conference on Human Factors in Computing Systems. 263–272.
[53] Daniel Vogel and Patrick Baudisch. 2007. Shift: a technique for operating pen-based interfaces using touch. In Proceedings of the SIGCHI conference on Human factors in computing systems. 657–666.
[54] Daniel Vogel and Géry Casiez. 2012. Hand occlusion on a multi-touch tabletop. In Proceedings of the SIGCHI Conference on Human Factors in Computing Systems. 2307–2316.
[55] Daniel Vogel, Matthew Cudmore, Géry Casiez, Ravin Balakrishnan, and Liam Keliher. 2009. Hand occlusion with tablet-sized direct pen input. In Proceedings of the SIGCHI Conference on Human Factors in Computing Systems. 557–566.
[56] Bryan Wang and Tovi Grossman. 2020. BlyncSync: Enabling Multimodal Smart-watch Gestures with Synchronous Touch and Blink. In Proceedings of the 2020 CHI Conference on Human Factors in Computing Systems (Honolulu, HI, USA) (CHI ’20). Association for Computing Machinery, New York, NY, USA, 1–14. https://doi.org/10.1145/3313831.3376132
[57] Marc Weber, Marc Alexa, and Wolfgang Müller. 2001. Visualizing time-series on spirals.. In Infovis, Vol. 1. 7–14.
[58] Pui Chung Wong, Kening Zhu, Xing-Dong Yang, and Hongbo Fu. 2020. Exploring Eyes-free Bezel-initiated Swipe on Round Smartwatches. In Proceedings of the 2020 CHI Conference on Human Factors in Computing Systems. 1–11.
[59] Haijun Xia, Tovi Grossman, and George Fitzmaurice. 2015. NanoStylus: Enhanc-ing input on ultra-small displays with a fnger-mounted stylus. In Proceedings of the 28th Annual ACM Symposium on User Interface Software & Technology. 447–456.
[60] Robert Xiao, Teng Cao, Ning Guo, Jun Zhuo, Yang Zhang, and Chris Harrison. 2018. LumiWatch: On-arm projected graphics and touch input. In Proceedings of the 2018 CHI Conference on Human Factors in Computing Systems. 1–11.
[61] Hui-Shyong Yeo, Juyoung Lee, Andrea Bianchi, and Aaron Quigley. 2016. WatchMI: pressure touch, twist and pan gesture input on unmodifed smart-watches. In Proceedings of the 18th International Conference on Human-Computer Interaction with Mobile Devices and Services. 394–399.
[62] Xin Yi, Chun Yu, Weijie Xu, Xiaojun Bi, and Yuanchun Shi. 2017. Compass: Rotational keyboard on non-touch smartwatches. In Proceedings of the 2017 CHI Conference on Human Factors in Computing Systems. 705–715.
[63] Cheng Zhang, Junrui Yang, Caleb Southern, Thad E Starner, and Gregory D Abowd. 2016. WatchOut: extending interactions on a smartwatch with inertial sensing. In Proceedings of the 2016 ACM International Symposium on Wearable Computers. 136–143.
[64] Junhan Zhou, Yang Zhang, Gierad Laput, and Chris Harrison. 2016. AuraSense: enabling expressive around-smartwatch interactions with electric feld sensing. In Proceedings of the 29th Annual Symposium on User Interface Software and Technology. 81–86.

BezelGlide: Interacting with Graphs on Smartwatches with Minimal Screen Occlusion CHI ’21, May 8–13, 2021, Yokohama, Japan
tbinary 235 knoise 7
1. t 100canny2t 200canny αcontr ast 1.4 nnbh 10 αchannel 2.4 tchannel 98
Table 1: Parameter values used in our algorithm 1
A OCCLUSION ESTIMATION ALGORITHM The following pseudo code (Algorithm 1) represents our image processing algorithm to calculate the screen occlusion from cap-tured images in study 1. The RemoveNoise uses dilate and erode to remove noisy pixels by a kernal of size knoise . The FitEllipseModel model used is from the sci-kit learn library 6. The |.| notation is used to indicate the length of a list. The formulation for Contrast used is (i − 128) ∗ αcontrast + 128, where i is the pixel value.
The parameters used for the algorithm during study 1 are listed in Table 1. These values were calculated based on our test on a sample of images in study 1.
Algorithm 1: Calculate non-occluded region of an image
1
2
3
4
5
6
7
8
9
10
11
12
13
14
15
Input: image ← cropped image Input: tbinary ← The threshold used for ConvertToBinary Input: knoise ← Kernel size for RemoveNoise
1 2Input: tcanny , tcanny ← Threshold values for Canny’s edge detection
Input: αcontr ast ← contrast value for Contrast Input: nnbh ← Neighbourhood size for
neighbourhoodPixels Input: αchannel ← Multiplier red channel when deciding
smart watch edges Input: tchannel ← Threshold value for deciding smart
watch edges Output: ro : approximated non-occluded region as ratio of
the complete screen SW Edдes ← emptylist ; binaryImaдe ← ConvertToBinary(imaдe, tbinary ); binaryImaдe ← RemoveNoise(binaryImaдe, knoise ); visibleScreenPixels ← NonZeroPixels(binaryImaдe); edдePixelsList ←
1 2CannyEdдeDetection(binaryImaдe, tcanny , tcanny ); contrastedImaдe ← Contrast(imaдe, αcontr ast ); foreach edдePixel in edдePixelList do
neighbourhoodPixels ← GetNeighbourhood(image,edgePixel, nnbh );
redChannelAverage ← Average(neighbourhoodPixels.redChannel);
otherChannelsAverage ← Average(neighbourhoodPixels.greenChannel) + Average(neighbourhoodPixels.blueChannel);
if redChannelAveraдe ∗ αchannel − otherChannelsAveraдe < tchannel then
SW Edдes .insert(edдePixel); ellipseModel ← FitEllipseModel(SW Edдes); ellipseReдionPixels ← DrawEllipse(ellipseModel); r0 ← |visibleScreenPixels |/|ellipseReдionPixels |;
6https://scikit-image.org/docs/0.18.x/api/skimage.measure.html?highlight= ellipsemodel#skimage.measure.EllipseModel