bfar 2006 overview of philippine fisheries
TRANSCRIPT

_______________________________________________________________________________________ Comprehensive National Fisheries Industry Development Plan
CHAPTER 2 OVERVIEW OF PHILIPPINE FISHERIES
This chapter provides an analysis of the fisheries situation in the country, both past and present. In eight sections, such characterizations cover the biophysical, socioeconomic and institutional dimensions. Section 2.1 (Geographic Setting) describes the landscape in general and the spatial context of the water resource base (coastal/marine and inland waters) for fisheries highlighting the archipelagic nature of the Philippines. Section 2.2 (Fisheries Resources) covers the capture fisheries resources, aquaculture resources and critical fisheries habitats, such as estuaries, mangroves, coral reefs, seagrass beds, rivers, lakes and small islands. Section 2.3 (Economic Performance of the Fisheries Sector) includes macroeconomic performance of the fisheries sector in relation to the national economy. Section 2.4 (The Socioeconomic Setting) highlights, among others, the population trends, key demographic features, labor force, employment and income patterns. This is followed by Section 2.5 (The Institutional Environment) that provides a synopsis of the policy and regulatory framework, institutional arrangements and mechanisms, coordination across agencies and private sector participation. Section 2.6 (Fisheries Subsectors: Status and Trends) describes four concerns: capture fisheries, aquaculture, post harvest and markets. Section 2.7 (Key Development Challenges) characterizes these nine key issues and/or problems confronting the sector: (1) depleted fishery resources; (2) degraded fishery habitats; (3) intensified resource use competition and conflict; (4) unrealized full potential of aquaculture and commercial fisheries; (5) uncompetitive products; (6) post-harvest losses; (7) limited institutional capabilities; (8) inadequate/inconsistent fisheries policies; and (9) weak institutional partnerships. Section 2.8 (Key Development Opportunities) describes some positive conditions, such as the delineation of property rights, utilization of offshore exclusive economic zone (EEZ), aquaculture expansion, improved post harvest, export potential and natural resource pricing.

CHAPTER 2
_____________________________________________________________________ Comprehensive National Fisheries Industry Development Plan
18
2.1 Geographic Setting The Philippines is an archipelago of more than 7,100 islands that are located in Southeast Asia between the latitudes of 4°05’N and 21°25’N and between the longitudes of 112°20’E and 127°00’E (Figure 2.1.a). It extends some 2,000 km in a south-north direction from the territorial limit off Borneo up to 150 km off Taiwan. The Philippines has a coastline of 17,460 km and a total land area of 300,000 km2. The larger islands are mostly mountainous with narrow to extensive coastal lowlands.
Figure 2.1.a. Map of the Philippines showing the limits of archipelagic waters, territorial waters, treaty limits (200 nautical miles EEZ) and Kalayaan Claim.

CHAPTER 2
_____________________________________________________________________ Comprehensive National Fisheries Industry Development Plan
19
The territorial waters of the Philippines including EEZ total 2.2 million km2, of which 226,000 km2 are considered coastal while the rest are oceanic. The shelf area or the area within depths of 200 m (Figure 2.1.b) measures 184,600 km2.
Figure 2.1.b. Generalized bathymetry of Philippine waters.
Generalized bathymetry of Philippine waters
Shallow (<200 m)
Intermediate (200 – 1,000 m)
Deep (>1,000 m)
Territorial limits
Generalized bathymetry of Philippine waters
Shallow (<200 m)
Intermediate (200 – 1,000 m)
Deep (>1,000 m)
Territorial limits
Shallow (<200 m)
Intermediate (200 – 1,000 m)
Deep (>1,000 m)
Territorial limits

CHAPTER 2
_____________________________________________________________________ Comprehensive National Fisheries Industry Development Plan
20
The climate of the Philippines is categorized as a tropical maritime climate, which is characterized by relatively high temperature, high humidity and abundant rainfall. Two major seasons occur: the rainy season from June to November, and the dry season from December to May. The dry season is further divided into the cool dry season from December to February and the hot dry season from March to May. The main weather systems that affect the country are the Southwest Monsoon, the Northeast Monsoon, the North Pacific Trade Winds and the Intertropical Convergence Zone. The Southwest Monsoon or the habagat blows from June to November, carrying moisture that produces the rainy season. The dry winds of the Northeast Monsoon or the amihan blow from December to May. During the transition between monsoons, the influence of the North Pacific Trade Winds is felt. On the other hand, the Intertropical Convergence Zone, a belt of low pressure formed where the Northeast Trade Winds meet the Southeast Trade Winds, oscillates throughout the country, bringing rains and thunderstorms. The Philippines lies at the world’s typhoon belt and is on average affected by 15 typhoons and struck by 5-6 tropical cyclones per year. Tropical cyclones typically advance in a northwesterly direction and often do not directly hit Mindanao. The eastern side of the country is influenced by the North Equatorial Current coming from the Pacific Ocean. Upon reaching the Philippines, the North Equatorial Current divides into a northward current flowing along eastern Luzon and Visayas and a southward current flowing along the eastern coast of Mindanao. The northward current exits the country as the Kuroshio Current and heads towards Taiwan and Japan. The southward current, known as the Mindanao Current, veers east to join the Equatorial Counter Current with a weaker branch flowing along the east coast of Mindanao. On the western side of the country, currents generated by seasonal monsoon winds are the dominant influence.
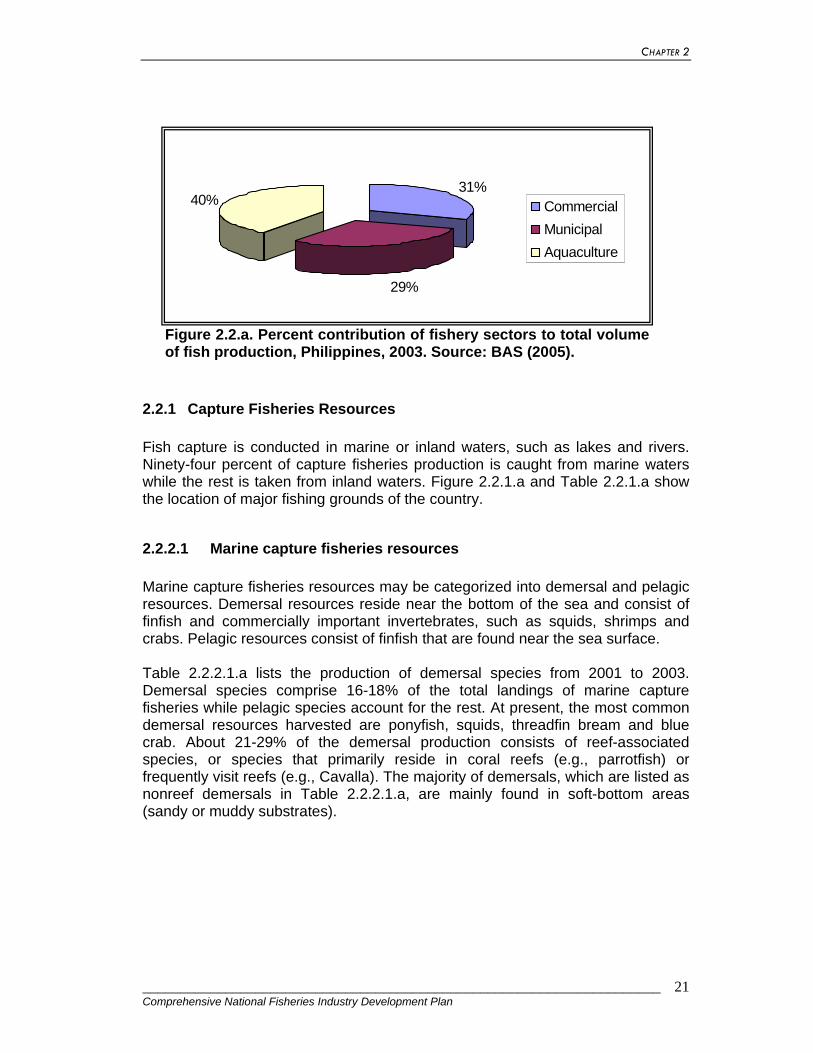
2.2 Fisheries Resources Fisheries may be broadly categorized into capture fisheries and aquaculture. Capture fisheries involve catching or collecting fish and other aquatic animals from the natural environment while aquaculture is the husbandry or farming of aquatic plants and animals. Capture fisheries in the Philippines are divided into two subsectors: commercial or large-scale and municipal or small-scale. Legally, the Philippine Fisheries Code of 1998 defines municipal fishing as fishing without using vessels or with vessels of 3 GT or less and commercial fishing as fishing with vessels of more than 3 GT. In 2003, the aquaculture sector contributed 40% of the volume of fisheries production while the rest was split almost evenly between commercial and municipal fisheries subsectors (Figure 2.2.a). The fisheries resources that maintain capture fisheries and aquaculture include the exploited species as well as the habitats that support these species.
CHAPTER 2
_____________________________________________________________________ Comprehensive National Fisheries Industry Development Plan
21
Figure 2.2.a. Percent contribution of fishery sectors to total volume of fish production, Philippines, 2003. Source: BAS (2005).
2.2.1 Capture Fisheries Resources Fish capture is conducted in marine or inland waters, such as lakes and rivers. Ninety-four percent of capture fisheries production is caught from marine waters while the rest is taken from inland waters. Figure 2.2.1.a and Table 2.2.1.a show the location of major fishing grounds of the country.
2.2.2.1 Marine capture fisheries resources Marine capture fisheries resources may be categorized into demersal and pelagic resources. Demersal resources reside near the bottom of the sea and consist of finfish and commercially important invertebrates, such as squids, shrimps and crabs. Pelagic resources consist of finfish that are found near the sea surface. Table 2.2.2.1.a lists the production of demersal species from 2001 to 2003. Demersal species comprise 16-18% of the total landings of marine capture fisheries while pelagic species account for the rest. At present, the most common demersal resources harvested are ponyfish, squids, threadfin bream and blue crab. About 21-29% of the demersal production consists of reef-associated species, or species that primarily reside in coral reefs (e.g., parrotfish) or frequently visit reefs (e.g., Cavalla). The majority of demersals, which are listed as nonreef demersals in Table 2.2.2.1.a, are mainly found in soft-bottom areas (sandy or muddy substrates).
31%
29%
40% CommercialMunicipalAquaculture
31%
29%
40% CommercialMunicipalAquaculture
CommercialMunicipalAquaculture

CHAPTER 2
_____________________________________________________________________ Comprehensive National Fisheries Industry Development Plan
22
Figure 2.2.1.a. Major fishing grounds in the Philippines. See Table 2.2.1.a for key to abbreviations and area of fishing grounds. Source: BAS (2005).
LaGLaG

CHAPTER 2
_____________________________________________________________________ Comprehensive National Fisheries Industry Development Plan
23
Table 2.2.1.a. Area and location of major fishing grounds in the Philippines. For a map of these fishing grounds, see Figure 2.2.1.a. Source: BAS (2005).
Fishing ground Abbre-viation Area (km2) Location
Seas 1. West Sulu Sea WSS 29,992.50 Palawan 2. South Sulu Sea SSS 12,642.00 Zamboanga del Sur/Sulu/Tawi-Tawi 3. East Sulu Sea ESS 9,288.00 Zamboanga del Norte/Negros 4. Sibuyan Sea SS 8,127.00 Aklan/Masbate/Romblon 5. Bohol Sea BS 7,946.00 Bohol 6. Samar Sea SaS 3,870.00 Samar/Masbate/Leyte 7. Visayan Sea VS 3,096.00 Panay/Negros/Cebu/Masbate 8. Camotes Sea CS 2,476.80 Cebu/Leyte/Bohol Bays 1. Lamon Bay LB 2,838.00 Quezon/Camarines Norte 2. Tayabas Bay TB 2,213.00 Quezon 3. Illana Bay IlB 2,128.50 Lanao del Sur/Maguindanao 4. Manila Bay MB 1,935.00 Manila/Bataan/Cavite 5. Sibugay Bay SB 1,935.00 Zamboanga del Sur 6. Iligan Bay IB 1,811.16 Misamis Occidental/Lanao del Norte 7. Imuruan Bay ImB 1,087.80 Palawan 8. San Miguel Bay SMB 774 Camarines Sur 9. Tawi-Tawi Bay TwB 592.4 Tawi-Tawi 10. Butuan Bay BuB 516 Agusan del Norte Gulfs 1. Moro Gulf MG 12,900.00 Zamboanga del Sur/Maguindanao/Sultan Kudarat 2. Davao Gulf DG 4,024.00 Davao del Sur/Davao del Norte/Davao Oriental 3. Ragay Gulf RG 3,225.00 Camarines Sur/Quezon 4. Leyte Gulf LG 2,724.00 Leyte Island/Samar Island 5. Panay Gulf PG 2,311.00 Iloilo/Negros Occidental 6. Lingayen Gulf LiG 2,064.00 Pangasinan 7. Lagonoy Gulf LaG 1,935.00 Albay/Camarines Sur/Catanduanes 8. Asid Gulf AG 619 Masbate 9. Albay Gulf AlG 412.8 Albay Channels 1. Babuyan Channel BC 3,612.00 Cagayan/Babuyan Island 2. Jintotolo Channel JC 280 Capiz/Masbate 3. Maqueda Channel MC 129 Camarines Sur/Catanduanes Straits 1. Tablas Strait TaSt 3,870.00 Tablas Island/Mindoro Oriental 2. Mindoro Strait MSt 3,426.24 Palawan/Mindoro Occidental 3. Tañon Strait TSt 2,786.40 Cebu/Negros 4. Cebu Strait CSt 1,818.90 Cebu/Bohol 5. Iloilo Strait ISt 1,006.00 Iloilo/Guimaras Passages 1. Burias Pass BP 1,393.20 Burias Island/Camarines Sur 2. Ticao Pass TP 804.75 Ticao Island/Sorsogon

CHAPTER 2
_____________________________________________________________________ Comprehensive National Fisheries Industry Development Plan
24
Table 2.2.2.1.a. Volume (t) of the top demersal species landed by commercial and municipal sectors from 2001 to 2003. Sources: production figures from BAS (2005). Habitat classification based on Froese and Pauly (2006).
2001 2002 2003
Com. Mun. Total Com. Mun. Total Com. Mun. Total Nonreef demersals Slipmouth (sapsap) 38,722 26,285 65,007 37,768 28,048 65,816 36,313 33,528 69,841Squid (pusit) 14,177 27,787 41,964 16,616 33,996 50,612 15,365 37,735 53,100Threadfin bream (bisugo) 6,931 20,148 27,079 12,834 36,423 49,257 13,817 26,697 40,514Blue crab (alimasag) 1,053 37,030 38,083 1,444 31,503 32,947 1,587 31,433 33,020Acetes (alamang) 9,031 10,915 19,946 7,907 5,713 13,620 5,890 7,197 13,087Mullet (kapak, banak) 1,992 13,344 15,336 1,954 12,642 14,596 2,179 11,456 13,635Porgies (pargo) 259 6,405 6,664 2,565 5,472 8,037 2,358 5,703 8,061Subtotal (nonreef species) 72,165 141,914 214,079 81,088 153,797 234,885 77,509 153,749 231,258
Percentage of demersal production 23.9 47.0 70.8 24.9 47.1 72.0 23.9 47.4 71.2
Percentage of capture fisheries production 4.0 7.8 11.8 4.3 8.1 12.4 3.8 7.6 11.4
Reef-associated demersals Goatfish (saramulyete) 5,992 8,299 14,291 11,262 13,178 24,440 10,389 14,855 25,244Siganid (samaral) 1,194 19,142 20,336 947 16,634 17,581 1,103 17,424 18,527Cavalla (talakitok) 3,098 11,981 15,079 2,370 12,383 14,753 3,150 12,290 15,440Snapper (maya-maya) 1,202 13,169 14,371 2,132 11,498 13,630 2,067 9,772 11,839Grouper (lapu-lapu) 1,746 9,593 11,339 3,441 10,472 13,913 3,359 10,450 13,809Parrotfish (loro) 395 12,269 12,664 620 6,486 7,106 656 7,893 8,549Subtotal (reef-associated species) 13,627 74,453 88,080 20,772 70,651 91,423 20,724 72,684 93,408
Percentage of demersal production 4.5 24.6 29.2 6.4 21.7 28.0 6.4 22.4 28.8
Percentage of capture fisheries production 0.8 4.1 4.9 1.1 3.7 4.8 1.0 3.6 4.6
Combined total (reef-associated and nonreef species)
85,792 216,367 302,159 101,860 224,448 326,308 98,233 226,433 324,666
Percentage of capture fisheries production 4.7 12.0 16.7 5.4 11.8 17.2 4.8 11.1 16.0
Fishing for demersal resources is typically conducted at depths of 40 m or less. Figure 2.2.2.1.a shows the location of the traditional demersal fishing grounds in the country. Pelagic resources are further subdivided into small pelagics and large pelagics. Common small pelagic species include roundscad (galunggong), Indian sardines (tamban) and frigate tuna (tulingan) (Table 2.2.2.1.b). Most small pelagic fisheries occur in water less than 200 m deep (Zaragoza et al. 2004). Small pelagics account for about 56% of the total production of marine capture fisheries.

CHAPTER 2
_____________________________________________________________________ Comprehensive National Fisheries Industry Development Plan
25
Figure 2.2.2.1.a. Traditional demersal fishing grounds of the Philippines. Source: Armada (2004).

CHAPTER 2
_____________________________________________________________________ Comprehensive National Fisheries Industry Development Plan
26
Table 2.2.2.1.b Volume (t) of the top small pelagic species landed by commercial and municipal sectors from 2001 to 2003. Sources: production figures from BAS (2005). Habitat classification based on Froese and Pauly (2006).
2001 2002 2003 Com. Mun. Total Com. Mun. Total Com. Mun. Total
Nonreef small pelagics Roundscad (galunggong) 250,679 35,525 286,204 234,230 43,273 277,503 254,659 55,980 310,639Indian sardines (tamban) 153,741 31,630 185,371 145,879 30,547 176,426 130,024 40,051 170,075Frigate tuna (tulingan) 60,032 51,687 111,719 100,958 62,174 163,132 114,760 64,326 179,086Anchovies (dilis) 39,191 61,708 100,899 33,706 40,389 74,095 28,654 42,447 71,101Fimbriated sardines (tunsoy) 50,935 39,806 90,741 35,110 25,161 60,271 36,358 28,863 65,221Indian mackerel (alumahan) 31,804 28,905 60,709 30,846 39,433 70,279 32,037 45,083 77,120Flyingfish (bolador) 7,060 26,152 33,212 12,539 22,111 34,650 14,678 22,893 37,571Indo-Pacific mackerel (hasa-hasa) 15,605 12,486 28,091 18,389 14,268 32,657 20,502 17,792 38,294
Round herring (tulis) 10,785 6,117 16,902 7,655 846 8,501 7,973 2,515 10,488Hairtail (balila) 2,640 5,675 8,315 3,319 5,868 9,187 3,427 6,750 10,177Subtotal (nonreef species) 622,472 299,691 922,163 622,631 284,070 906,701 643,072 326,700 969,772Percentage of small pelagic production 59.6 28.7 88.3 58.8 26.8 85.6 57.1 29.0 86.0
Percentage of capture fisheries production 34.4 16.6 51.0 32.8 15.0 47.7 31.7 16.1 47.7
Reef-associated small pelagics Big-eyed scad (matang-baka) 36,596 44,262 80,858 38,889 61,897 100,786 39,621 64,354 103,975
Crevalle (salay-salay) 11,128 16,235 27,363 14,628 24,638 39,266 14,077 26,576 40,653Caesio (dalagang-bukid) 6,047 7,630 13,677 5,841 6,321 12,162 6,062 6,636 12,698Subtotal (reef-associated species) 53,771 68,127 121,898 59,358 92,856 152,214 59,760 97,566 157,326
Percentage of small pelagic production 5.2 6.5 11.7 5.6 8.8 14.4 5.3 8.7 14.0
Percentage of capture fisheries production 3.0 3.8 6.7 3.1 4.9 8.0 2.9 4.8 7.7
Combined total (reef-associated and nonreef species)
676,243 367,818 1,044,061 681,989 376,926 1,058,915 702,832 424,266 1,127,098
Percentage of capture fisheries production 37.4 20.3 57.7 35.9 19.8 55.7 34.6 20.9 55.5
Table 2.2.2.1.c lists the production of the common large pelagics, which account for 12-15% of the total production of the marine capture fisheries sector. The largest among these is the yellowfin tuna (Thunnus albacares), which attains a maximum length of 239 cm (fork length) and has a maximum published weight of 200 kg. Next largest is the Spanish mackerel (Scomberomorus commerson) followed by the skipjack (Katsuwonus pelamis) and the eastern little tuna (Euthynnus affinis). These species have respective maximum fork lengths of 240 cm, 108 cm and 100 cm, and respective maximum published weights of 70.0 kg, 34.5 kg and 14.0 kg. In contrast, the frigate tuna (Auxis thazard), though considered a large pelagic by some, attains a maximum length of only 65 cm and has a maximum published weight of 1.7 kg (Froese and Pauly 2006).

CHAPTER 2
_____________________________________________________________________ Comprehensive National Fisheries Industry Development Plan
27
Table 2.2.2.1.c. Volume (t) of the top large pelagic species landed by commercial and municipal sectors from 2001 to 2003. Sources: production figures from BAS (2005).
2001 2002 2003
Com. Mun. Total Com. Mun. Total Com. Mun. Total Skipjack (gulyasan) 80,766 24,718 105,484 83,385 26,592 109,977 114,077 24,242 138,319Yellowfin tuna (tambakol) 49,055 34,505 83,560 63,051 36,743 99,794 87,473 39,767 127,240Eastern little tuna (katchorita) 20,634 6,646 27,280 26,811 7,870 34,681 27,036 11,639 38,675
Spanish mackerel (tanigue) 1,735 7,350 9,085 2,429 6,601 9,030 2,790 6,641 9,431
Total 152,190 73,219 225,409 175,676 77,806 253,482 231,376 82,289 313,665Percentage of capture fisheries production 8.4 4.0 12.5 9.2 4.1 13.3 11.4 4.1 15.4
Yellowfin tuna, skipjack and eastern little tuna are highly migratory species that cross territorial boundaries of several nations. In the Philippines, tunas are caught mainly from the Sulu Sea, Moro Gulf and north Celebes Sea, although considerable tuna fisheries also exist in waters off Western Negros, Northwestern Luzon and Southern Luzon (Zaragoza et al. 2004).
2.2.1.2 Inland fishing resources The country’s inland water resources include 200,000 ha of lakes, 31,000 ha of rivers, 19,000 ha of reservoirs, 106,328 ha of freshwater swamplands and 139,735 ha of brackishwater swamplands (BAS 2005). With a combined area of 496,063 ha, these water bodies can potentially support inland fishing, although aquaculture activities (e.g., fishponds, fishpens and fishcages) also utilize these resources. Most inland fishing occurs in lakes. By far, the biggest lake is Laguna Lake (90,000 ha), followed by Lanao Lake (34,700 ha) and Taal Lake (23,400 ha) (BAS 2005). Together these three lakes account for 74% of the country’s total area of lakes. In 2003, the total landings from inland fishing amounted to 133,292 metric tons (t) valued at PhP 3.58 billion, of which 57% by volume were finfish, 37% were mollusks and 5% were crustaceans. The total finfish catch consisted of tilapia species (42% by volume), snakehead (dalag, 10%), carp (carpa, 10%), goby (biya, 8%), grunter or tigerperch (ayungin, 6%), catfish (kanduli, 6%), and other species. Shrimps (hipon) dominated the crustacean catch at 66% by volume, followed by freshwater crabs (talangka, 7%), white shrimps (hipong puti, 7%), mud crabs (alimango, 6%) and giant freshwater shrimps (ulang, 6%). Ninety-five percent of the mollusks caught were snails (suso) (BAS 2005).

CHAPTER 2
_____________________________________________________________________ Comprehensive National Fisheries Industry Development Plan
28
2.2.2 Aquaculture Resources Aquaculture is conducted in freshwater, brackishwater and marine waters. Fishcages and fishpens are employed in all three environments while fishponds are confined to freshwater and brackishwater areas. In marine waters, aquaculture also includes mariculture or the farming of aquatic organisms, mostly consisting of oysters, mussels and seaweeds. Seaweeds, milkfish and tilapia are the top three commodities produced by the country’s aquaculture sector, accounting for more than 90% of total aquaculture production (Table 2.2.2.a). Seaweeds are farmed in shallow coastal waters that are protected from strong wave action. The top seaweed-producing regions are ARMM (producing about 40% of total volume), Region IV-B (27%) and Region IX (10%). Milkfish is cultured mostly in brackishwater fishponds, which are concentrated mainly in Regions III, VI, IV and I, in the descending order of milkfish production and total area of brackishwater fishponds. Tilapia is produced mostly in freshwater fishponds and freshwater fishcages. Region III, which produces most of its tilapia in freshwater fishponds, leads the country in tilapia production. This is followed by Region IV, where tilapias are mostly cultured in freshwater fishcages. Table 2.2.2.a. Aquaculture production (t) of major species from 2001 to 2003. Source: BAS (2005).
2001 2002 2003 Species (t) (%) (t) (%) (t) (%)
Seaweed 785,795 64.5 894,857 67.0 988,888 68.1Milkfish (bangus) 225,337 18.5 232,162 17.4 246,505 17.0Tilapia 106,746 8.8 122,399 9.2 135,996 9.4Tiger prawn (sugpo) 40,698 3.3 35,493 2.7 34,998 2.4Carp (carpa) 19,568 1.6 18,151 1.4 8,895 0.6Oyster (talaba) 19,042 1.6 12,570 0.9 14,510 1.0Mussel (tahong) 13,513 1.1 11,646 0.9 13,490 0.9Mud crab (alimango) 4,608 0.4 4,747 0.4 4,809 0.3Catfish (hito) 1,525 0.1 2,634 0.2 2,163 0.1White shrimp (hipong puti) 1,276 0.1 1,541 0.1 1,517 0.1Other species 2,348 0.2 2,193 0.2 2,733 0.2Total 1,218,108 100.0 1,336,200 100.0 1,451,771 100.0Total minus seaweeds 432,313 441,343 462,883
Table 2.2.2.a lists other major species cultured besides seaweeds, milkfish and tilapia. In addition to the culture of the species in Table 2.2.2.a, less common forms of aquaculture include the culture of groupers, snappers, seabass, catfish, mudfish, carp, Pompano, Cobia, freshwater prawn (Macrobrachium), eel, spiny lobsters, pearl oysters, abalone, rabbitfish, spadefish and ornamental aquarium fish. Table 2.2.2.b presents a summary of aquaculture production in 2003 by culture environment and region. Mariculture in marine waters registered the highest production figures, mainly due to seaweed production. Next to seaweed-growing

CHAPTER 2
_____________________________________________________________________ Comprehensive National Fisheries Industry Development Plan
29
areas, brackishwater fishponds are the second biggest contributor to aquaculture production. The country has 239,323 ha of brackishwater fishponds (both operational and nonoperational). The next important culture environment are the freshwater fishponds. With a total area of 14,531 ha, these account for about 6% of the total area of fishponds (brackishwater and freshwater) yet contribute 22% to the combined output of all fishponds. Table 2.2.2.b. Aquaculture production (t) by culture environment and region. Source: BFAR (2003).
Region Total production Brackish water Fresh water Marine waters
Fishpond Fish- cage
Fish- pen Total Fish-
pond Fish- cage
Fish- pen Total Fish-
cage Fish- pen
Mari-culture* Total
3,429 474 474 456 2,499 2,955 0CAR 12,074 0 463 11,611 12,074 0I 46,594 19,063 2,403 4,375 25,841 3,061 29 3,090 8,185 7,097 2,381 17,663II 5,447 921 147 1,068 2,180 1,376 3,556 9 814 823III 148,926 80,913 74 80,987 61,282 69 61,351 1,368 3 5,217 6,588IV-A 112,725 14,524 14,524 810 37,885 25,646 64,341 103 414 33,343 33,860IV-B 39,805 4,258 1,077 7 5,342 518 518 33,945 33,945V 37,687 8,663 8,663 314 5,454 5,768 76 23,180 23,256VI 118,209 57,123 57,123 295 295 22 1,268 59,501 60,791VII 84,440 8,751 8,751 31 0 31 11 12 75,635 75,658VIII 18,441 2,529 2,529 128 12 9 149 53 15,710 15,763IX 120,999 19,180 19,180 94 94 19 101,706 101,725X 31,406 11,829 11,829 641 641 37 23 18,876 18,936XI 11,255 7,179 4 7,183 602 3 605 1,200 1,202 1,065 3,467XII 23,010 7,785 7,785 1,255 5,647 7,688 14,590 635 635XIII 22,595 3,836 1,658 5,494 150 169 319 47 33 16,702 16,782ARMM 400,570 2,454 2,454 165 104 33 302 3 397,811 397,814
Total 1,237,612 249,482 5,363 4,382 259,227 71,989 62,815 35,875 170,679 11,746 10,074 785,886 807,706
*Mariculture of oysters, mussels and seaweeds. 2.2.3 Critical Fisheries Habitats Mangroves, seagrasses, algal beds and coral reefs are critical fisheries habitats because they perform vital ecological functions that sustain fisheries. In addition, they are sites of important fisheries.
2.2.3.1 Mangroves Mangroves are communities of woody trees that can tolerate salt water and thrive in tidal muddy areas. The trees continuously shed leaves that decompose in the mud into soluble nutrients and organic detritus, which form the foundation of complex food webs. Thus, mangrove areas are nutrient and food-rich environments that support abundant marine life and function as nurseries for a variety of marine organisms, particularly reef fish. Though not conclusive, evidence suggests that the biomass of several commercially important reef fish species may be doubled in the coral reefs used by such species as adult habitat, if the reefs are connected to mangroves. This may be due to the increased survival of juveniles resulting from abundant food and sheltering from predators provided by mangroves (Mumby et al. 2004). Because mangroves function as nurseries and breeding grounds for fish and prawns, they are said to be the foundation of major fisheries (Primavera 2000).

CHAPTER 2
_____________________________________________________________________ Comprehensive National Fisheries Industry Development Plan
30
Fisheries exist in mangrove areas. Finfish, penaeid shrimps, crabs, lobsters, gastropods, bivalves and other invertebrates are collected from mangroves. Other harvestable materials include wood for fishing poles, firewood and charcoal making, among others (Primavera 2000). In addition to providing harvestable resources, mangroves provide ecological services. They trap sediment and pollutants from the land, absorbing the latter and thus helping maintain water quality. Mangroves also shield coastal areas from the damaging effects of waves, tidal currents, storm surges and typhoons (UNEP-WCMC 2006). In 1994, the total cover of mangroves in the country was estimated at 120,500 ha, most of which was concentrated in Western Mindanao (44.9%), Southern Tagalog (24.4%) and Northern Mindanao (16.8%). The present total cover of mangroves is less than a third of the 450,000 ha of mangroves reported in 1918, when mangroves were first assessed nationally. Conversion to other uses, particularly to fishponds, is the main cause of mangrove loss (Primavera 2000 citing DENR 1996).
2.2.3.2 Seagrasses Seagrasses are flowering plants that thrive in shallow marine waters, anchored to bottom substrates by roots and horizontal stems called rhizomes. They are typically found in the intertidal areas of bays, estuaries and coastal waters. Although capable of attaching to hard substrates, seagrasses tend to spread extensively on sandy or muddy substrates. Like mangroves, seagrasses provide habitat, nursery areas and feeding grounds to a variety of marine organisms. Seagrasses support fisheries by sheltering juvenile fish and prawns. Siganids or rabbitfish spawn in seagrass areas and are typically caught there. The diet of the green sea turtle (Chelonia mydas) and the dugong (Dugong dugon), which are endangered species, consists mainly of seagrass. Seagrass leaves slow water movement, which promotes settling of sediment, while their roots and rhizomes stabilize sediment and hold these to the bottom. Thus, seagrasses help decrease turbidity and help minimize the sedimentation of nearby coral reefs. There are no estimates of the total area of seagrass beds in the Philippines because the country’s extensive coastline has yet to be adequately assessed. Most seagrass areas assessed so far are heavily stressed, based on estimates of biomass per square meter and shoot density (BFAR-NFRDI-PAWB 2005). Among several identified factors causing seagrass degradation, their general overuse resulting from increasing human population is apparently the most significant factor (Fortes and Santos 2004).
2.2.3.3 Coral reefs Coral reefs are among the most productive and diverse of ecosystems, rivaling tropical rain forests in terms of variety of organisms contained and supported. The

CHAPTER 2
_____________________________________________________________________ Comprehensive National Fisheries Industry Development Plan
31
foundation of coral reefs are colonies of coral polyps, which secretion of limestone slowly creates massive reefs over geologic time scales. Coral reefs are a substantial resource base. Reef-associated species accounted for 12-13% of the total annual landings of the capture fisheries sector from 2001 to 2003 (Tables 2.2.2.1.a and 2.2.2.1.b). This is comparable to the often-quoted figure provided by Carpenter (1977), who estimated that 15% of the country’s fish yield is derived from coral reefs. The live reef food fish trade, based mainly on groupers, as well as the aquarium or ornamental fish trade, are based on reef fisheries known for their lucrativeness and export earnings. In addition to finfish, coral reefs contain commercially valuable seaweeds and invertebrates, such as mollusks, sea cucumbers and sea urchins. It has been estimated that over a million small-scale fishers in the Philippines derive their livelihood from coral reefs (UNEP-WCMC 2006). The country has 27,000 km2 of coral reefs. About 70% of the country’s reefs are in a poor state, based on estimates of coral cover (Gomez et al. 1994).
2.3 Economic Performance of the Fisheries Sector
2.3.1 Fisheries Production in Terms of Value Fisheries production in terms of value has been growing from 2002 to 2004 (Table 2.3.1.a). From 2003 to 2004, all subsectors of the fisheries recorded notable increases in gross receipts. The biggest growth was posted by aquaculture, which grossed 20.90% more in 2004 because of higher production and prices obtained during the period. The same could be said for commercial fisheries with 15.30% and municipal fisheries with 12.32% growth in gross earnings. At constant prices, the fisheries sector exceeded the 2003 performance with the 9.45% growth recorded in 2004 (Table 2.3.1.b). Aquaculture was credited with a remarkable output gain of 17.90%. Production of commercial fisheries moved up by 1.86% and that of municipal fisheries by 2.43%. Table 2.3.1.a. Value of production at current prices. Source: BAS (2006).
In millions (PhP) Growth rates Subsector 2002 2003 2004 2002-2003 2003-2004
Commercial 39,681.17 42,002.91 48,427.90 5.85 15.30Municipal 38,158.88 40,664.30 45,674.85 6.57 12.32Aquaculture 35,418.18 37,199.13 44,972.57 5.03 20.90Total 113,258.23 119,866.34 139,075.32 5.83 16.03
Table 2.3.1.b. Value of production at constant prices. Source: BAS (2006).
In millions (PhP) Growth rates Subsector 2002 2003 2004 2002-2003 2003-2004
Commercial 16,487.60 17,554.35 17,881.35 6.47 1.86Municipal 14,329.74 15,289.12 15,660.36 6.70 2.43Aquaculture 26,178.91 28,450.22 33,542.66 8.68 17.90

CHAPTER 2
_____________________________________________________________________ Comprehensive National Fisheries Industry Development Plan
32-
5,000,00010,000,00015,000,00020,000,00025,000,00030,000,000
65 6667 68 69 7071 72 7374 75 76 7778 79 8081 82 83 8485 86 8788 89 9091 92 93 9495 96 9798 99 00 0102 03
'000
Pes
os
Imports Exports
In millions (PhP) Growth rates Subsector 2002 2003 2004 2002-2003 2003-2004
Total 56,996.25 61,293.69 67,084.36 7.54 9.45
2.3.2 Prices of Fish and Fishery Products Prices in the fisheries sector grew by 6.01% in 2004 (Table 2.3.2.a). Commercial and municipal fisheries recovered from 2003’s negative growth rates. These subsectors registered price increases of 13.19% and 9.66%, respectively. Meanwhile, prices of aquaculture products were higher by an average of 2.54%. Table 2.3.2.a. Weighted average of farmgate prices. Source: BAS (2006).
Price/kg (PhP) Growth rates Subsector 2002 2003 2004 2002-2003 2003-2004
Commercial 38.07 37.85 42.85 -0.58 13.19 Municipal 38.59 38.54 42.26 -0.12 9.66 Aquaculture 26.46 25.58 26.23 -3.36 2.54 All subsectors -1.59 6.01
2.3.3 Contribution of the Fisheries Sector to GDP and GVA In 2003, the fisheries sector contributed 2.2% (PhP95.49 billion) to the country’s gross domestic product (GDP) of PhP4,359 billion at current prices, or 4.1% (PhP44.86 billion) of GDP amounting to PhP1,093 billion at constant prices (BFAR-FPED 2003). It accounted for 15.1% (PhP95.5 billion) of the gross value added (GVA) in agriculture, fishery and forestry group amounting to PhP632 billion at current prices, or 20.9% (PhP44.9 billion) of the GVA of PhP214.3 billion at constant prices. As of the third quarter of 2004, the sector’s contribution to GVA in the agricultural group (PhP158.3 billion at constant prices) was 22.3%, the second largest share next to that of agricultural crops.
2.3.4 Contribution of the Fisheries Sector to Foreign Exchange Earnings Since 1977, foreign trade of fishery products has generated a surplus balance of trade, which means earnings from exports have exceeded payments for imports (Figure 2.3.4.a). Currently, the top fishery exports of the Philippines are tuna, shrimps and prawns, seaweeds, octopus, and crab and crab fat. Altogether, these commodities account for about 82% of total fishery exports (Table 2.3.4.a). The major destinations of Philippine fish and fishery products are Japan, USA, Hong

CHAPTER 2
_____________________________________________________________________ Comprehensive National Fisheries Industry Development Plan
33
Kong, Taiwan and Korea (BAS 2005). Figure 2.3.4.a. Value of Philippine fish exports and imports. Source: FAOSTAT (2003). Table 2.3.4.a. Value of top exports of fish and fishery products. Source: BAS (2005).
2001 2002 2003 Value % Value % Value %
Tuna 5,707,428 25.1 7,194,216 27.5 7,921,002 29.2Shrimps and prawns 6,226,503 27.4 7,287,333 27.8 6,490,951 23.9Seaweeds 3,540,460 15.6 3,759,618 14.4 4,182,926 15.4Octopus 1,430,478 6.3 1,664,988 6.4 1,911,417 7.0Crab and crab fat 1,524,925 6.7 1,555,145 5.9 1,695,005 6.2Grouper, live 574,978 2.5 549,427 2.1 471,280 1.7Squid and cuttlefish 437,859 1.9 447,786 1.7 578,642 2.1Ornamental fish, live 320,500 1.4 333,130 1.3 348,169 1.3Roundscad 325,052 1.4 204,178 0.8 235,361 0.9Sea cucumber, dried 284,949 1.3 228,701 0.9 168,897 0.6Others 2,350,076 10.3 2,953,238 11.3 3,123,433 11.5Total 22,723,208 100.0 26,177,760 100.0 27,127,083 100.0
Note: value in PhP x 1,000.
2.3.5 Contribution of the Fishing Industry to Income and Employment The fisheries sector provides employment to over 1 million people. This is roughly about 12% of the entire agriculture, fishery and forestry sector labor force, and about 5% of the country’s total labor force. Of this total, 9.2% (74,537) are fishfarmers engaged in aquaculture as reflected in Ginintuang Masaganang Ani (2002-2004) document. Also, ancillary activities such as fish marketing, fish processing and boat building generate additional employment.
2.3.6 Contribution of the Fisheries Sector to Nutrition In the diet of the average Filipino, fish contributes 12.3% to total food intake, 22.4% to total protein intake and 56% to total animal protein intake. Fish is the main source of animal protein among Filipinos. In 2001, the per capita consumption of fish was estimated at 26.8 kg/year (Espejo-Hermes 2004 citing FNRI/DOST 2003 and BAS 2002).
2.4 The Socioeconomic Setting Conditions in coastal and fishing communities strongly influence the degree of dependence of resource users on local resources, which determines the intensity with which they utilize these resources. This section describes the increasing

CHAPTER 2
_____________________________________________________________________ Comprehensive National Fisheries Industry Development Plan
34
population density in coastal areas and summarizes the facts about living conditions in municipal fishing households.
2.4.1 Population Density in Coastal Areas Human populations tend to concentrate in coastal areas for a variety of reasons. These include the availability of relatively flat land for settlements and agriculture, access to maritime transportation that tends to spur trade and other economic activities, and access to coastal and fishery resources. In 2000, the population density in coastal areas was characteristically higher than the noncoastal population density and the national average, specifically by 57 and 31 persons/m2, respectively (Table 2.4.1.a). The concentration of human populations in coastal areas is expected to continue into the near future. By year 2020, the population density in coastal areas will be higher by 81 and 44 persons/m2 compared with the noncoastal density and the national average, respectively.

CHAPTER 2
_____________________________________________________________________ Comprehensive National Fisheries Industry Development Plan
35
For capture fisheries, increasing population density in coastal areas would translate to increasing pressure on harvestable fishery resources. Moreover, it implies additional pressure on the critical fisheries habitats that sustain these resources. Table 2.4.1.a. Population density in coastal areas. Source: ArcDev (2004).
Parameter 2000 2005 2010 2015 2020
Population (persons) National 76,498,735 84,299,000 92,736,000 100,571,000 108,210,000 Coastal areas 39,007,905 42,992,490 47,295,360 51,291,210 55,187,100
Noncoastal areas 37,490,830 41,306,510 45,440,640 49,279,790 53,022,900
Land area (km2) National 300,000 300,000 300,000 300,000 300,000 Coastal areas 136,400 136,400 136,400 136,400 136,400
Noncoastal areas 163,600 163,600 163,600 163,600 163,600
Population density (person/km2) National 255 281 309 335 361 Coastal areas 286 315 347 376 405
Noncoastal areas 229 252 278 301 324 2.4.2 Socioeconomic Characteristics of Municipal Fishers and Fishing
Households Based on the data gathered from the 12 priority bays studied under the Fisheries Sector Program in the early 1990s, the average living conditions in municipal fisher households are as follows: - average household age was 41 years - average household size was 5.1 members - educational attainment was about 4-6 years of schooling - average annual household income was PhP25,426 (1992) - those who own their houses constituted 82% of surveyed respondents;
however, only 40% owned their lots - housing type was nipa and bamboo for 41.1% and nipa and wood for 34% - most owned their fishing boats but only 27% were motorized - only 25% of the households were members of community organizations - only 20% availed of loans, of this 83% came from informal sources - the main fishing gears used were hook and line, gillnet and beach seine
(Siason 1999 citing PRIMEX-ANZDEC Report 1996). The average income of fishing households listed above is way below the poverty threshold. Low educational attainment, use of simple housing materials, high proportion of nonmotorized boats and use of simple fishing gear are all consistent with low fishing incomes. These indicators suggest the pervasiveness of poverty in fishing communities.

CHAPTER 2
_____________________________________________________________________ Comprehensive National Fisheries Industry Development Plan
36
2.5 The Institutional Environment
2.5.1 Policy and Regulatory Framework The Philippine legal and policy framework is hierarchical. At the apex is the Philippine Constitution followed by national laws and international agreements, then administrative issuances to implement national laws. At the lowest rung are the ordinances by the local government units (LGUs). The major Philippine laws that serve as the foundation for the current policy and regulatory framework for fisheries in the Philippines are the following: (1) Philippine Fisheries Code of 1998 (Republic Act [RA] 8550); (2) Agriculture and Fisheries Modernization Act (AFMA) of 1997 (RA 8435); (3) Local Government Code of 1991 (RA 7160); (4) National Integrated Protected Areas System (NIPAS) Act of 1992 (RA 7586); and (5) Environmental Impact Statement (EIS) System (Presidential Decree [PD] 1586) of 1978. There are also legal issuances at the local level, and international agreements at the global level.
2.5.1.1 The Philippine Fisheries Code of 1998 The Philippine Fisheries Code of 1998 provides a comprehensive legal framework that governs the development, management and conservation of the country’s fisheries and aquatic resources. The code declares the state policy of achieving food security through a regulatory regime that provides mandates and guidelines for long-term sustainable use of resources, considering as well the welfare of those involved in the sector. Its objectives are poverty alleviation, social equity, food security, rational use of resources, people empowerment and sustainable development. Priorities of this national law include protection of fishery and aquatic resources, optimal utilization of existing resources, maintenance of ecological balance and quality of environment, and improving and rationalizing the domestic market.
2.5.1.2 The Agriculture and Fisheries Modernization Act of 1997 The AFMA of 1997 provides the appropriate budgetary and logistical requirements for modernization of the country’s agricultural and fisheries base. Its priorities include sustained increases in production, industrialization and full employment. Another concern of this law is optimum production of goods, driven by a market-oriented approach within a highly competitive economic environment. The AFMA’s objectives are poverty alleviation, social equity, food security, rational use of resources, people empowerment, sustainable development and global competitiveness. It operates through Strategic Agricultural and Fisheries Development Zones (SAFDZ) as identified by the Department of Agriculture (DA); also through the agriculture and fisheries modernization programs of LGUs. The AFMA’s planning systems are through the Agriculture and Fisheries Modernization Plan (AFMP) at the national and LGU levels and the SAFDZ Plans. The AFMA

CHAPTER 2
_____________________________________________________________________ Comprehensive National Fisheries Industry Development Plan
37
mandates the creation of a network of smallholder cooperatives to engage in marketing activities.
2.5.1.3 The combined implications of the Fisheries Code and AFMA In 1998, the Fisheries Code was enacted only a few months after AFMA came into effect. Unfortunately, both laws did not have the benefit of policy integration. Although both laws deal with the fisheries sector and attempt to provide a policy framework for fisheries development, they were largely the result of independent legislative initiatives. Table 2.5.1.3.a lists the basic differences between the two laws based on a policy study undertaken by the Coastal Resource Management Project (CRMP) (Batongbakal 2000). Table 2.5.1.3.a. Comparison of AFMA of 1997 and the Philippine Fisheries Code of 1998. Source: Batongbakal 2000.
AFMA Fisheries Code Major concern
• To provide the appropriate budgetary and logistical requirements for modernization of the country’s agricultural and fisheries base
• Proper management/husbanding of the country’s fisheries resources.
Priorities • Sustained increases in production, industrialization and full employment
• Optimum production of goods, driven by a market-oriented approach within a highly competitive economic environment
• Management, conservation, protection of fishery and aquatic resources, optimal utilization of existing resources and maintenance of ecological balance and quality of the environment Improving and rationalizing the domestic market
Objectives • Poverty alleviation, social equity, food security, rational use of resources, people empowerment, sustainable development and global competitiveness
• Poverty alleviation, social equity, food security, rational use of resources, people empowerment and sustainable development
Expected benefits
Increased income and wealth, delivery of goods and services, and expansion of productivity
• Better distribution of benefits from limited resources and long-term sustainability of such resources
Operations • Through SAFDZ as identified by DA • Through agriculture and fisheries
modernization programs of LGUs
• Through LGUs and FARMCs for municipal waters
• DA-BFAR for all fisheries and aquatic resources other than municipal waters
Planning systems
• AFMP at national and LGU levels • SAFDZ Plans
• Comprehensive National Fisheries Industry Development Plan
• Municipal Fisheries Development Plans (MFDPs)
• Comprehensive Post-harvest and Ancillary Industries Plan
In essence, the divergence of these two laws is a result of the traditional tug-of-war in fisheries management between production and resource management concerns. On one hand, fisheries are considered as a major source of food for the country’s growing population with the corresponding management urge to

CHAPTER 2
_____________________________________________________________________ Comprehensive National Fisheries Industry Development Plan
38
maximize the socioeconomic benefits. On the other hand, it is widely recognized that fisheries resources are finite and that continued fishing at today’s intensive rate will result in a decline in fish production. Nevertheless, both laws provide policy frameworks to improve fisheries productivity and production and/or to effectively manage the fisheries resources. There are legitimate concerns over inconsistencies, overlapping responsibilities and potential conflicts in objectives. Any progress made (particularly by LGUs) in meeting the objectives of one or the other law, however, will result in benefits for the municipality or city and, eventually, for the entire country.
2.5.1.4 The Local Government Code Consistent with the government policy to promote local autonomy and decentralization, the Local Government Code (LGC) of 1991 established LGU as the key manager of resources within its boundaries. In the process, the code also provided for the devolution of the responsibility to provide a number of basic services from national government agencies (NGAs) to LGUs. Responsibilities devolved to LGUs included: the enforcement of fishery laws in municipal waters; the provision of extension and on-site research services and facilities related to agriculture and fishery activities; the enforcement of environment and natural resources laws within the territory, water and soil resources utilization and conservation projects; and the improvement and development of local distribution channels. Section 149 of LGC provides municipal governments with the authority to grant fishery privileges in municipal waters and to impose rentals, fees and charges. Fishery privileges include the erection of fish corrals and oyster, mussel and other aquatic beds, the collection of fry (e.g., bangus, prawn, kawag-kawag, etc.), and the catching of fish using nets, traps and other gear. The resource management responsibilities (taking into consideration food production, human settlements and industrial expansion) of LGUs are also exercised through the preparation of comprehensive land use plans and the enactment of zoning ordinances (Section 20).

CHAPTER 2
_____________________________________________________________________ Comprehensive National Fisheries Industry Development Plan
39
2.5.1.5 The National Integrated Protected Areas System Act RA 7586 otherwise known as the National Integrated Protected Areas System (NIPAS) Act of 1992 established a system for designating national parks and protected areas in order “to preserve genetic diversity, to ensure the sustainable use of resources therein, and to maintain their natural conditions to the greatest extent possible.” Under NIPAS, 209 sites with a total area of 2.5 million ha comprise an initial list of proposed protected areas that are to be assessed for possible inclusion in the national system of protected areas (PAWB 2003). Sites included in the systems are “outstanding remarkable areas and biologically important public lands that are habitats of rare and endangered species of plants and animals, biogeographic zones and related ecosystems, whether terrestrial, wetland or marine”. Among the categories of protected areas relevant to fisheries management are marine reserves and protected seascapes. Table 2.5.1.6.a lists marine reserves and protected seascapes that have been proclaimed as protected areas under NIPAS as of 2003 as well as other examples of marine protected areas (MPAs). In addition, there are 18 landscapes/seascapes that have been proclaimed under NIPAS as of 2003, but these have been omitted in Table 2.5.1.6.a because the sizes of their land and marine components are not distinguished. In general, MPAs under NIPAS have large sizes. The Fisheries Code also contains provisions for establishing MPAs (called “fish sanctuaries” and “fish refuges” under the code), but these municipal-level MPAs are much smaller (usually less than 100 ha) than MPAs under NIPAS. Thus, NIPAS complements the Fisheries Code with regard to MPA establishment and provides a mechanism for establishing large MPAs. If these MPAs are effectively managed, they can contribute substantially to sustainable fisheries. Table 2.5.1.5.a. Some MPAs under NIPAS. Source: PAWB (2003).
Region MPA Location Year proclaimed Area (ha)
2 Palaui Island Marine Reserve
Sta. Ana, Cagayan 1994 7,415
3 Masinloc and Oyon Bays Marine Reserve
Masinloc, Oyon, Zambales 1993 7,568
4B Apo Reef National Park Sablayan, Occidental Mindoro 1996 15,7926 Sagay Marine Reserve Sagay, Negros Occidental 1999 32,0007 Tanon Strait Protected
Seascape Cebu, Negros Occidental and Negros Oriental
1998 480
7 Panglao Island Protected Seascape
Panglao Island, Bohol 2003 386
9 Turtle Islands Wildlife Sanctuary
Southwestern Sulu Sea, Tawi-Tawi
1999 242,967
12 Sarangani Bay Protected Seascape
Maitm, Kiamba, Maasim, Sarangani
1996 215,950
2.5.1.6 Environmental impact assessment and related laws

CHAPTER 2
_____________________________________________________________________ Comprehensive National Fisheries Industry Development Plan
40
Presidential Decree (PD) 1586 or the Environmental Impact Statement (EIS) System of 1978 and related laws can potentially influence fisheries management, including the allocation of resources to aquaculture, both at the national and local government levels. Under these laws, government agencies, government-owned or controlled corporations and private companies are required to prepare an environmental impact assessment (EIA) for any project or activity that significantly affects the quality of the environment. This set of laws also stipulates that any project defined as environmentally critical or located in an environmentally critical area is required to prepare an EIS to be reviewed by the Environmental Management Bureau (EMB) of the Department of Environment and Natural Resources (DENR). The detailed procedures for the handling of EIAs are outlined in various Department Administrative Orders (DAOs). The requirements for EIAs and Environmental Compliance Certificates (ECCs) were also subsequently incorporated in the Fisheries Code of 1998.
2.5.1.7 From national laws to issue and site-specific regulations Under the umbrella of these national laws and their implementing rules and regulations, the following sets of regulations complete the policy and regulatory framework for Philippine fisheries. First, there are DAOs issued by the different departments/national government agencies (e.g., DA, DENR, etc.). Second, there are Fisheries Administrative Orders (FAOs) issued by DA through BFAR. Third, there are municipal ordinances issued by the municipality or city government.
2.5.1.8 International treaties and agreements There are several international treaties and agreements that have also bearing on the policy and regulatory framework for Philippine fisheries. These instruments, once ratified by the Senate, become part of the Philippine law. The key international agreements include the 2000 Cartagena Protocol on Biosafety, 1995 FAO Code of Conduct for Responsible Fisheries, 1992 Convention on Biological Diversity, 1992 Action Agenda for Sustainable Development (Earth Summit) and 1982 United Nations Convention on the Law of the Sea. These international agreements are elaborated in Chapter 3’s Section 3.1 (Development Philosophy).
2.5.2 Institutional Arrangements and Mechanisms The management of the fishery resources is distributed among many government agencies or instrumentalities. The basic jurisdictional divisions are as follows: (1) municipal or city governments for “municipal waters” and resources within the territorial boundaries of these municipalities or cities; (2) DA-BFAR for commercial (e.g., outside municipal waters) fishing activities and public lands such as tidal

CHAPTER 2
_____________________________________________________________________ Comprehensive National Fisheries Industry Development Plan
41
swamps, mangroves, marshes and foreshore land and ponds; and (3) DENR for shoreline and foreshore areas and, through Protected Area Management Boards (PAMBs), for areas under the category of protected landscapes and seascapes (e.g., such as mangrove swamp forest reserves under the NIPAS Act). These are elaborated in the following sections.
2.5.2.1 Local government units Municipal waters under the Fisheries Code include streams, lakes, inland bodies of water and tidal waters within the municipality, which are not included within the protected areas as defined under the NIPAS Act. These also include marine waters up to 15 km from the municipality’s coastline. Local governments’ interest in properly developing and managing fisheries resources is driven by the fact that these resources contribute directly and significantly to food production, livelihood opportunities and general well-being of their residents. Regulatory, management and development mechanisms are operationalized through ordinances, delivery of services and undertaking programs and projects. Options available to local governments include, among others, the following: authority to grant fishing privileges or license fishing operations in municipal waters; banning or restricting the use of certain fishing methods, techniques or gears; regulating the capture of certain species and/or sizes of fish; land/water use planning and zoning; habitat conservation and restoration (i.e., establishment and maintenance of MPAs, fish sanctuaries and refuges, mangrove reforestation, coral reef conservation, etc.); infrastructure and facilities (e.g., roads, cold storage, markets, etc.); credit; and agriculture and fishery extension services and livelihood training. Relative to fisheries and aquaculture, LGUs have the following responsibilities: enact a municipal ordinance delineating the boundaries of municipal waters and providing rules and regulations for licensing and permits; establish license fees for fishing in municipal waters; enact, in consultation with BFAR, special ordinances declaring special demarcated fisheries areas, closed seasons, environmentally critical areas and sanctuaries; maintain a registry of municipal fisherfolks; and enforce fishery laws, rules and regulations and municipal ordinances. Recognizing that local governments would benefit from consultation with and the involvement of fisherfolk and their organizations, the Fisheries Code provides for the creation of Fisheries and Aquatic Resource Management Councils (FARMCs). The code encourages the formation of such councils at several levels – barangay, municipality/city, cross-municipalities and national. Membership in these councils includes representatives of government agencies and institutions, as well as fisherfolks, fishworkers and other stakeholders. The LGUs and the NGAs are encouraged by the Fisheries Code to consult and coordinate with FARMCs as they carry out their regulatory, management and development functions over fisheries resources. At the municipal or city level, the FARMCs are expected to assist in the development of MFDP for submission to the Municipal Development Council; make recommendations for municipal fishery ordinances; assist in the enforcement of fishery laws, rules and regulations in municipal waters; and provide advice, whenever necessary, to the municipal governments.

CHAPTER 2
_____________________________________________________________________ Comprehensive National Fisheries Industry Development Plan
42
The standard organizational structure of local governments provides for the appointment of an “agriculturist” as a mandatory position for provincial governments and an optional position for municipal and city governments. The agriculturist shall be responsible for the Office for Agricultural Services and is expected to formulate measures for the approval of the provincial and municipal/city councils and to provide technical assistance and support to the governor or mayor. He or she is also expected to develop plans and strategies and, upon approval by the governor or mayor, to implement these. In the context of these responsibilities, the term “agriculture” includes traditional agricultural crops, as well as aquaculture. The list of responsibilities of the LGU agriculturist and even of the environment and natural resources officer, however, does not explicitly include responsibilities for capture fisheries and marine ecosystems. There is an apparent gap between the organizational structure envisioned by the Fisheries Code and the organizational support that the municipal government is expected to provide as gleaned from LGC of 1991. The Fisheries Code expects municipalities and cities to prepare MFDPs as part of the overall municipal development plan. However, LGC declares it optional for municipalities or cities to maintain the position of an agriculturist, who is assumed to be responsible for fisheries in the absence of any other staff position.
2.5.2.2 Inter-LGU mechanisms Very often, one or more municipalities share a bay, gulf, lake, river and/or dam. In such cases, the management of common water bodies and their fisheries resources needs to be shared among the affected municipalities or cities. The sharing of these fisheries resources provides opportunities for collective action and the sharing of effort, resources and costs among LGUs. Nevertheless, it also can serve to increase the complexities and difficulties of management efforts. The Fisheries Code states that the management of contiguous fishery resources “shall be done in an integrated manner, and shall not be based on political subdivisions of municipal waters in order to facilitate their management as single resource systems.” Municipal or city governments are encouraged to group themselves and coordinate with each other to achieve the objectives of fishery resources management. In fact, the Fisheries Code envisions the formation of Integrated Fisheries and Aquatic Resource Management Councils (IFARMCs) as the venues for closer collaboration between and among local governments in the management of shared resources. These IFARMCs have functions similar to the functions of municipal FARMCs. IFARMCs, however, need to relate to all municipal or city governments they serve. The chairpersons of the Committees on Agriculture/Fisheries, the fisheries officers and the development officers of the relevant municipalities and/or cities are expected to serve on IFARMCs together with the representatives of NGOs, private sector and fisherfolk associations.

CHAPTER 2
_____________________________________________________________________ Comprehensive National Fisheries Industry Development Plan
43
2.5.2.3 Bureau of Fisheries and Aquatic Resources The BFAR is the country’s premier fisheries management agency. In coordination/cooperation with other NGAs, BFAR has jurisdiction over management, conservation, development, protection, utilization and disposition of all fisheries and aquatic resources of the country, except those within municipal waters. On municipal waters, BFAR will coordinate with and assist LGUs, FARMCs and other concerned agencies in undertaking the functions specified earlier. The Fisheries Code of 1998 reconstituted BFAR as a line agency and specified its functions as follows: • Policy and enforcement
a. enforce all laws, formulate and enforce all rules and regulations, except in municipal waters, and settle conflicts on resource use;
b. recommend measures for the protection/enhancement of the fishery industries;
c. formulate rules and regulations for the conservation and management, regulation, conservation and protection of the fishery resources;
d. establish a corps of specialists in collaboration with the Department of National Defense and the Department of Foreign Affairs for the efficient monitoring, control and surveillance (MCS) of fishing activities within Philippine waters; and
e. formulate rules and regulations for conservation and management of straddling fish stocks and highly migratory fish stocks.
• Industry development a. prepare and implement a Comprehensive National Fisheries Industry
Development Plan; b. provide extensive development support services in all aspects of fisheries
production, processing and marketing; c. develop value-added fisheries products for domestic consumption and
export; d. provide advisory services and technical assistance on the improvement of
quality of fish from the time it is caught; e. advise and coordinate with LGUs on the maintenance of proper sanitation
and hygienic practices in fish markets and fish landing areas; f. coordinate with LGUs and other concerned agencies for the establishment
of productivity-enhancing and market development programs in fishing communities; and
g. assist LGUs in developing their technical capability in the development, management, regulation, conservation and protection of fishery resources.
• Regulation of commercial fishing
a. issue licenses for the operation of commercial fishing vessels; b. issue identification cards to fishworkers engaged in commercial fishing; and c. monitor and review fishing agreements between Filipinos and foreigners.

CHAPTER 2
_____________________________________________________________________ Comprehensive National Fisheries Industry Development Plan
44
• Industry monitoring
a. establish and maintain a Comprehensive Fishery Information System; b. coordinate efforts relating to fishery production undertaken by primary
fishery producers, LGUs, FARMCs, fishery organizations/ cooperatives; and
c. implement an inspection system for import and export of fishery/aquatic products and fish processing establishments.
• Research
a. formulate and implement a Comprehensive Fishery Research and Development Program.
The BFAR is responsible for issuing licenses for commercial fishing (fishing activities outside municipal waters) as well as for issuing Fishpond Lease Agreements for public lands suitable for aquaculture. The BFAR is also responsible for regulating and monitoring the import and export of all fish and fishery products. It has the following organizational subdivisions: divisions, centers and regional offices. The ten divisions of the bureau include the: Fisheries Resources Management Division, Capture Fisheries Technology Division, Fisheries Post Harvest Technology Division, Fisheries Industry Development Support Division, Inland Fisheries and Aquaculture Division, Fisheries Policy and Economics Division, Fisheries Regulatory and Quarantine Division, Legal Division, Administrative Division and Finance Division. The BFAR also has eight national technology centers which are operated and maintained for activities related to technology generation, field testing of technologies, extension services, demonstration and training/seminars in support of policy formulation and project implementation on fisheries development and conservation in coordination with concerned agencies and organizations. These national technology centers include the: Fisheries Biological Station Complex, Mindanao Freshwater Fisheries Technology Center, National Brackishwater Fisheries Technology Center, National Freshwater Fisheries Technology Center, National Inland Fisheries Technology Center, National Integrated Fisheries Technology Development Center, National Marine Fisheries Development Center and National Seaweeds Technology Center. Aside from the divisions and the national technology centers, BFAR maintains regional offices in all the administrative regions of the country. These regional offices have functions such as MCS, training and extension services. The regional offices also supervise the operations of the Provincial Fisheries Offices. The BFAR, through its regional offices, maintains and operates seven Regional Fishermen's Training Centers. These centers aim to develop and upgrade individual skills and competencies of technical fisheries staff of LGUs and other agencies involved in fisheries implementation and, more specifically, of small-scale fisherfolks/organizations/cooperatives. The centers transfer relevant and appropriate technology to improve present practices and increase individual productivity and income. Each of the training centers is also expected to establish and operate feasible sectoral fishery projects to serve as support/demonstration

CHAPTER 2
_____________________________________________________________________ Comprehensive National Fisheries Industry Development Plan
45
facilities in target fishing communities for replication as source of fisherfolk's income or alternative livelihood.
2.5.2.4 Department of Agriculture The DA takes charge of the overall planning and policymaking in the agriculture and fisheries sector at the national level. The Fisheries Code created within DA the position of Undersecretary for Fisheries and Aquatic Resources for the primary purpose of attending to the needs of the fishing industry. A number of divisions/bureaus within DA have responsibilities that also cover the fisheries sector, as indicated in AFMA. These are briefly described below. The Planning and Budget Division, Public Investment Program Division, and Program Monitoring and Evaluation Division are responsible for DA’s planning service. These divisions handle AFMA-related planning activities, as well as formulate the agriculture and fishery infrastructure plan. The Agribusiness and Marketing Assistance Division takes care of Agribusiness and Marketing Assistance Service. It provides direct assistance to the private sector, including concerned people’s organizations and nongovernment organizations (NGOs), in marketing ventures and in the conduct of market analysis. Two key units are involved for information-related concerns: Bureau of Agricultural Statistics for data on agriculture and fisheries research; and Agricultural and Fisheries Information Service for dissemination of agriculture and fisheries production market information. For post-harvest services and infrastructure, the Bureau of Post Harvest Research and Extension takes the lead. The Bureau of Agriculture and Fisheries Product Standards is responsible for setting and implementing standards for fresh, primary and secondary-processed agriculture and fishery products. The Bureau of Agricultural Research (BAR) serves as the secretariat for research and development (R&D) of the Council on Extension, Research and Development in Agriculture and Fisheries, as well as develops the agriculture and fisheries R&D information system. The Agriculture Training Institute provides leadership in formulation of the national agriculture and fisheries extension agenda, as well as oversees the National Extension System in Agriculture and Fisheries.
2.5.2.5 Department of Environment and Natural Resources The DENR administers environmental management, conservation and development on national and local levels. Its areas of responsibility that are relevant to fisheries management include the management of foreshore and shoreline areas, as well as protected areas. Within the DENR are several natural resource management bureaus, such as the Environmental Management Bureau (EMB), the Forest Management Bureau and the Protected Areas and Wildlife Bureau (PAWB). It has also attached agencies,

CHAPTER 2
_____________________________________________________________________ Comprehensive National Fisheries Industry Development Plan
46
such as the National Mapping and Resource Information Authority and the Laguna Lake Development Authority (LLDA). The policies formulated by DENR and its bureaus are implemented by DENR Regional Offices, which are found in the 13 administrative regions of the country, the Provincial Environment and Natural Resources Offices (PENROs) within each province and the Community Environment and Natural Resources Offices (CENROs) within the municipalities. These PENROs and CENROs fall within the DENR apparatus, although some provincial governments and municipalities also run their own PENROs and CENROs, which are distinct from their counterparts under DENR. Among the organizational units within DENR that are concerned with fisheries are the PAMBs and the Coastal and Marine Management Office (CMMO). A PAMB is a multisectoral body formed to manage an MPA established under the NIPAS Act. Local stakeholders and interest groups are represented in PAMB. In 2002, DENR’s CMMO was established to coordinate and integrate all coastal management activities, especially in policy review and formulation, coordination and integration of development and implementation of coastal programs and projects, and establishment and maintenance of a coastal and marine information management system. Parallel CMMO-type units are now organized at the regional and community (CENRO) levels to respond to the technical needs of LGUs in their efforts to implement coastal resource management programs and projects. In 1998, the Fisheries Code required all fisheries-related projects that have an impact on the environment to prepare an EIS and obtain an ECC from DENR. In fact, the implementing rules and regulations of the Fisheries Code require BFAR to establish an Environmental Unit to coordinate with concerned agencies in assisting project proponents to prepare and submit the required EIS.
2.5.2.6 Other government agencies There are a host of other government agencies involved in various facets of fisheries management, particularly in the areas of law enforcement, fishing vessel registration and safety, credit provision, marketing, infrastructure administration and development, research and development, and education and training. The Philippine National Police–Maritime Group is the main agency that enforces fisheries and coastal management laws. Other agencies that provide law enforcement support include the Philippine Navy and the Philippine Coast Guard (PCG). Fishing vessel registration and safety is administered by the Department of Transportation and Communication with attached agencies such as the PCG and the Maritime Industry Authority (MARINA). The MARINA is responsible for the promotion and development of the maritime industry, including the registration of shipping vessels. It also regulates, in collaboration with PCG, shipping and maritime safety. In the past, MARINA was responsible for issuing commercial fishing licenses – a responsibility that was transferred to BFAR when the Fisheries Code was enacted in 1998. Government lending institutions such as the Land Bank and the Quedancor provide credit for fisheries ventures, with the bulk supporting aquaculture in

CHAPTER 2
_____________________________________________________________________ Comprehensive National Fisheries Industry Development Plan
47
fishponds. Other formal credit institutions include private commercial banks, private development banks, savings and loan associations, rural banks and thrift banks. These institutions provide credit mainly to commercial fisheries and large aquaculture enterprises. Local governments sometimes provide microcredit for small fisheries projects. With regard to marketing of fisheries products, the Department of Trade and Industry (DTI) and its Board of Investments provide support and incentives (networking, enterprise development, investment incentives, market matching services) for investments in fisheries production and ancillary industries. The DTI also provides opportunities for the promotion of fishery products through domestic and international trade fairs and exhibits. The responsibility for developing and operating fisheries infrastructure, such as fishports and fish landing facilities, lies with various government agencies. The DA, however, has the responsibility to formulate the agriculture and fishery infrastructure plan and to monitor its implementation. This plan shall be the consolidation of all the infrastructure plans submitted by the various units within DA and LGUs. The Department of Public Works and Highways executes the development of fishports and related infrastructure while the Philippine Ports Authority and the Philippine Fisheries Development Authority (PFDA) operate and manage the larger ports and related infrastructure. The LGUs manage small ports and landing sites. R&D, particularly on emerging aquaculture technologies and status of fishery resources, is vital to the management of the country’s fisheries. Several institutions are involved in fisheries R&D. The Fisheries Code of 1998 established the National Fisheries Research and Development Institute (NFRDI) to function as the main DA unit for the conduct and coordination of fishery research and development in the country. The Bureau of Agricultural Research, also within DA, complements the research activities of NFRDI. Within the Department of Science and Technology (DOST), the Philippine Council for Aquatic and Marine Research and Development (PCAMRD) formulates and evaluates strategies, programs and R&D projects on aquatic resources including fisheries. The PCAMRD organized the National Aquatic Resources Research and Development System (NARRDS) to assist in the monitoring of R&D on aquatic resources. The NARRDS consists of state universities and colleges and regional units of DA and DENR with R&D functions. The NARRDS is organized into four national centers based on research themes and five zonal centers that cluster member-organizations in Northern Luzon, Southern Luzon, Visayas, Northern Mindanao and Southern Mindanao. To modernize Philippine fisheries, DA-BAR embarked on an initiative of fostering partnerships and collaboration among the various fisheries research, development and extension (RD&E) institutions and agencies in the Philippines. Three RD&E networks (capture fisheries, aquaculture and fisheries, post harvest and marketing) in fisheries networks were conceptualized after a series of workshops and consultations with various stakeholders. These activities also gave birth to the National Integrated RD&E Agenda and Program for each of the three fisheries networks.

CHAPTER 2
_____________________________________________________________________ Comprehensive National Fisheries Industry Development Plan
48
In the area of formal education and training in fisheries, the Commission on Higher Education (CHED), the Technical Education and Skills Development Authority (TESDA) and the Department of Education (DepEd) supervise tertiary-level education (bachelors degree and higher), technical and skills courses (such as the three-year diploma course in fisheries) and secondary-level education (fisheries high schools), respectively.
2.5.3 Coordination across Agencies Collaboration and coordination across the many government bodies and agencies involved in fisheries have been accomplished through various modalities. These include nonpermanent mechanisms, such as the joint implementation of projects and programs, as well as the formation of multi-agency task forces and technical working groups. While the record of success of these various initiatives has been mixed, the inherent advantages of collaboration and coordination among agencies are widely recognized. Accordingly, the AFMA and the Fisheries Code contain provisions that attempt to institutionalize such collaborative mechanisms. In law enforcement, the Fisheries Code tasks BFAR with establishing an MCS System for Philippine Seas in collaboration with LGUs and other government agencies (e.g., members of the Cabinet Committee on Marine and Ocean Affairs). In the area of fisheries research, the code calls for the representation of DA, BFAR, PCAMRD and the academe in the governing board of the NFRDI. The code also specifies that NFRDI become part of the National Research and Development Network of DOST. To link research with extension, AFMA created the Council on Extension, Research and Development in Agriculture and Fisheries with representation from several government agencies involved in RD&E services. To promote information sharing, AFMA calls on DA to establish the National Information Network to progressively interlink its information networks with networks maintained by DENR, DOST, DTI, the state universities and colleges, and other agencies. To integrate disparate efforts in human resource development, CHED, TESDA, DepEd, and the state universities and colleges are called upon to jointly formulate the National Integrated Human Resources Development Plan in Agriculture and Fisheries. Unfortunately, in spite of all the mechanisms in place for interagency coordination and collaboration, coordination is often wanting. Reasons for limited institutional collaboration include: overlapping functions and mandates increase the need for coordination while decreasing the effectivity of coordination efforts; insufficient financial and human resources devoted to coordination and a general failure to recognize the burden and needs of the coordination activity; and plans of the various agencies are not integrated enough to encourage more effective coordination.

CHAPTER 2
_____________________________________________________________________ Comprehensive National Fisheries Industry Development Plan
49
2.5.4 Private Sector Participation Aside from an emphasis on interagency collaboration and coordination, both the AFMA and the Fisheries Code, as well as their implementing rules and regulations, highlight the need for consultative processes with the various stakeholders of the fisheries sector. The Fisheries Code establishes FARMCs as the primary mechanism for participation by the private sector in fisheries management. The FARMCs, as specified in the code, are composed not only of representatives of government agencies but also of NGOs, the private sector, municipal and commercial fisherfolks, fishworkers and processors. Under the code, FARMCs are to be formally consulted for the following: establishment of fishery refuges and sanctuaries; declaration within municipal waters of fishery reserves for special use; license fees for municipal fishers; establishing catch ceilings in municipal waters; declaration of a closed season for fishing in specific areas; operation of a MCS system in municipal waters; enactment of municipal fisheries ordinances; mechanisms for inclusion or exclusion of fisherfolk from outside the municipality; and establishment of mariculture (fishcages, fishpens, etc.) zones. The government has also been encouraging communities to become more involved in area-specific resource management. For this reason, government agencies and NGOs have exerted efforts to organize communities. There also are a number of private sector institutions/organizations involved in fisheries. These include the following nonprofit organizations: NGOs; municipal fisherfolk associations and cooperatives; farmer associations and cooperatives; commercial fishing associations; professional associations and societies; and industry associations. While all these organizations have specific mandates and purposes, they are private-sector institutions that are willing to partner with government for the benefit of their members and/or for the fisheries sector in general. Each of these organizations has its own special situations and specific challenges that have significant impact on its effectiveness and ability to carry out its respective missions. The challenges to these organizations are many and can include: lack of financial and other resources; ineffective governance; difficulties in increasing memberships; poor membership contributions to the organization; poor leadership; poor planning and implementation systems; and lack of recognition by government agencies. In recent years, government agencies have begun to appreciate the benefits to government that could result from effective partnerships with such associations and organizations. Unfortunately, effective partnerships can only be built on effective organizations – on the side of the government, as well as on the side of the private sector.
2.6 Fisheries Subsectors: Status and Trends

CHAPTER 2
_____________________________________________________________________ Comprehensive National Fisheries Industry Development Plan
50
This section provides a close examination of the main producing subsectors of fisheries, namely, capture fisheries and aquaculture. Afterwards, the section presents a host of subjects under the post-harvest domain, including landing sites, ice plants and cold storage facilities, fish processing and post-harvest losses. Finally, markets for fish and fishery products are described.
2.6.1 Capture Fisheries This section begins by separately examining municipal and commercial fisheries, focusing on factors that determine the overall amount and intensity of fishing conducted by these two subsectors. Next, their production trends and their combined impacts on particular fishery resource groups – demersals, pelagics and invertebrates – are simultaneously examined.
2.6.1.1 Municipal fisheries Population of municipal fishers Municipal fisheries include capture operations using nonmotorized and motorized boats that weigh 3 GT or less, as well as fishing and gathering less mobile aquatic animals without using boats. In 2002, there were 1,781,000 municipal fishers, accounting for 87% of those employed in capture fisheries and aquaculture (Figure 2.6.1.1.a) (NSO 2002).
Figure 2.6.1.1.a. Number of persons employed in the municipal fisheries, commercial fisheries and aquaculture subsectors. Source: NSO (2002).
The changing population of municipal fishers through four decades is shown in Table 2.6.1.1.a and Figure 2.6.1.1.b. From 1970 to 1980, the total number of municipal fishers more than doubled. This drastic increase, which was much
M u n i c i p a l 1 ,7 8 1 ,0 0 0
8 6 .9 9 %
C o m m e rc i a l7 ,8 0 00 .3 8 %
A q u a c u ltu re2 5 8 ,4 8 0 1 2 .6 3 %

CHAPTER 2
_____________________________________________________________________ Comprehensive National Fisheries Industry Development Plan
51
0200400600800
1,0001,2001,4001,6001,8002,000
1970 1980 1990 2000Year
No.
of m
unic
ipal
fish
ers
(‘000
)
0200400600800
1,0001,2001,4001,6001,8002,000
200400600800
1,0001,2001,4001,6001,8002,000
1970 1980 1990 2000Year
No.
of m
unic
ipal
fish
ers
(‘000
)
higher than the rate of population growth, meant that in rural areas, fishing became an attractive source of livelihood, drawing labor away from other sectors. In the next decade, the increase in municipal fishers continued but at a much decelerated rate of 6.6%. From 1990 to 1995, the population of municipal fishers dropped by 29.9%, indicating that many had exited the municipal fisheries sector.
Table 2.6.1.1.a. Number of municipal fishers, 1970–1995. Source: Tietze et al. (2000).
Number of municipal fishers Major island group 1970 1980 1990 1995
Luzon 158,714 350,282 377,502 - Visayas 138,442 296,056 291,384 - Mindanao 102,786 257,666 294,453 - Total 399,942 904,004 963,339 675,677
Note: - not reported.
Figure 2.6.1.1.b. Population trend of municipal fishers, 1970-2002. Source: Tietze et al. (2000) and NSO (2002).
From 1990 to 1995, while the population of municipal fishers declined, commercial fisheries and aquaculture expanded. By 1995, the commercial fisheries subsector was employing 56,715 fishers while the aquaculture subsector had 258,480 fishfarmers, which was more than twice the number in 1990. Apparently, in the first half of the 1990s, large numbers of municipal fishers sought employment in the commercial fisheries and aquaculture subsectors (Tietze et al. 2000). After 1995, the population of municipal fishers apparently shot up to 1.78 million fishers

CHAPTER 2
_____________________________________________________________________ Comprehensive National Fisheries Industry Development Plan
52
in 2002. Thus, the population of municipal fishers from 1970 to the present has been generally — but not continuously — increasing. Like most economic agents, municipal fishers respond to changing opportunities within and outside their subsector. Municipal fishing vessels and gears By law, municipal fishing operators use fishing boats weighing 3 GT or less. In 2002, the number of municipal fishing boats stood at 777,700, doubling from 388,200 in 1980 or in just two decades. Municipal fishing boats are either motorized or nonmotorized. The number of motorized boats in 2002 was 351,000 units, representing a threefold increase from 110,600 motorized boats in 1980 (NSO 2002). In 1980, motorized boats comprised 28.5% of the municipal fishing fleet. By 2002, the percentage of motorized boats had increased to 45.1%. Thus, the sharp increase in municipal fishing boats from 1980 to 2002 has been accompanied by accelerated motorization. The majority of motorized boats (40.1%) have engines with 5.0-9.9 horsepower, of which 83.0% have outriggers (NSO 2002). In 2002, the most common fishing gear used by municipal fishers was the hook and line with 9.45 million units, followed by the gill net with 1.19 million units. Other common gears included the cast net, cover pot and crab hook (NSO 2002).
2.6.1.2 Commercial fisheries Fishing grounds of commercial fisheries The Fisheries Code defines commercial fishing as fishing with the use of vessels weighing more than 3 GT. Commercial fishers may be classified into those that operate mainly in Philippine waters, and those that can operate beyond our territorial limits. An example of the latter is the country’s distant-water fishing fleet, which conducts purse seine operations in Indonesia and Papua New Guinea. Within the country, the ten most important commercial fishing grounds are Moro Gulf, East Sulu Sea, South Sulu Sea, Davao Gulf, Visayan Sea, Bohol Sea, Cuyo Pass, Guimaras Strait, Manila Bay and Lingayen Gulf (Barut 1996) (see Figure 2.2.b and Table 2.2.a in Section 2.2).
Commercial fishing vessels The Fisheries Code classifies commercial fisheries based on vessel tonnage as follows: (1) small-scale, using vessels of 3.1–20 GT; (2) medium-scale, using vessels of 20.1-150 GT; and (3) large-scale, using vessels of more than 150 GT. Small-scale boats have outriggers and motors that are generally second-hand diesel engines imported from Japan and converted for marine use. The medium-scale type includes liftnet boats (basnig), large Danish seiners (super hulbot), medium trawlers and old monohulls fitted with outriggers, some of which engage

CHAPTER 2
_____________________________________________________________________ Comprehensive National Fisheries Industry Development Plan
53
in ring net or baby purse seine operations. Large-scale commercial boats, which are mostly bought second-hand from Japan, USA and Taiwan, mainly engage in purse seining. Most of these catchers are after tuna or seasonal pelagic fish, such as mackerels and roundscads. Large commercial vessels fish all over the archipelago; their landings at the Navotas Fish Port may come from Celebes Sea, Sulu Sea or other areas of the country (Aguilar 2004). Table 2.6.1.2.a shows the distribution of registered commercial fishing boats by region. The National Capital Region is home to the most number of commercial fishing vessels, which tend to be larger than vessels based in other regions (i.e., percent of total gross tonnage is greater than percent of total number). Region XI has the next highest number of commercial fishing vessels, followed by Regions VI and IX. The rest of the regions have less than 10% of the commercial fishing boats.
Table 2.6.1.2.a. Number and gross tonnage of commercial fishing vessels (catcher and accessory boat) by region, 1999. Source: BFAR-FPED (2003).
Region Number Percentage Gross tonnage Percentage NCR 1,351 37.5 158,509.59 58.6 I 113 3.1 1,832.99 0.7 II 64 1.8 717.94 0.3 III 40 1.1 1,080.67 0.4 IV 221 6.1 3,857.38 1.4 V 160 4.4 4,385.85 1.6 VI 404 11.2 25,674.39 9.5 VII 94 2.6 2,053.81 0.8 VIII 124 3.4 1,740.27 0.6 IX 392 10.9 22,758.66 8.4 X 43 1.2 1,215.10 0.4 XI 555 15.4 45,893.86 17.0 XII 7 0.2 85.09 0.0 XIII 26 0.7 293.86 0.1 ARMM 7 0.2 181.94 0.1 Total 3,601 100.0 270,281.00 100
Note: NCR means National Capital Region; ARMM means Autonomous Region for Muslim Mindanao
In 2002, the entire fleet of the commercial sector consisted of 10,860 boats (Table 2.6.1.2.b) including both registered and unregistered boats, as well as boats weighing three GT or less but are used for commercial operations. Thus, 2.6.1.2.b cannot be compared with the figures in Table 2.6.1.2.a. As Table 2.6.1.2.b indicates, there was a three-fold increase in the total number of commercial fishing boats from 1980 to 2002. Boats were added to all size categories. Most of the additional boats were small-scale commercial fishing boats (3-20 GT), although a considerable number of boats in the 19.1-49.0 GT range (medium-scale) was added to the fleet. Table 2.6.1.2.b. Number of commercial fishing vessels by tonnage categories in 1980 and 2002. Source: NSO (2002).

CHAPTER 2
_____________________________________________________________________ Comprehensive National Fisheries Industry Development Plan
54
1980 2002 Vessel tonnage (GT) No. of boats Percentag
e No. of boats Percentage Increase in no. of boats
3.0 or less 179 5.2 1,204 11.1 1,025 3.1 - 5.0 1,044 30.6 3,001 27.6 1,957 5.1 - 9.0 559 16.4 2,211 20.4 1,652 9.1 - 19.0 728 21.3 1,427 13.1 699 19.1 - 49.0 460 13.5 1,492 13.7 1,032 49.1 - 99.0 239 7.0 577 5.3 338 99.1 - 499.0 200 5.9 516 4.8 316 > 499.0 2 0.1 177 1.6 175 Not reported - 255 2.3 Total 3,411 10,860 7,194
Commercial fishing gear NSO records as of August 2003 disclosed a total of 146.2 thousand fishing gear units used by commercial fishing operators, which represent a greater than 20-fold increase from 1980 (Table 2.6.1.2.c). Over the 23-year period, all types of gears – except bag net – increased in number. The hook and line group of fishing gear, which includes the longline, handline and troll line (Munprasit et al. 1995), was the dominant gear in both periods and also accounted for most of the increase. The gill net, which also accounted for a large portion of the overall increase in gear numbers, is the second most dominant gear. Purse seine/ring net ranks third. All other gears accounted for less than 1% of the total in 2003. Among the latter are the trawl net and bag net, which accounted for 10.6% and 15.0% of the total number of gears in 1980, respectively. The decline in the relative importance (i.e., percentage of total) of these two gears, as well as other gears in 2003, seems to suggest an overall tendency for gear types in the sector to shift towards the hook and line group and the gill net. However, this tendency cannot be ascertained, as there was a large number of gears reported in the “others” category in 2003.

CHAPTER 2
_____________________________________________________________________ Comprehensive National Fisheries Industry Development Plan
55
Table 2.6.1.2.c. Number of fishing gear (by type) used by commercial fishing operators, Philippines, 1980 and 2003. Source: NSO (2003).
1980 2003* Fishing gear Number
Percentage Number
Percentage No. of units added
Hook and line/longline/ troll line/pole and line
2,655 38.6 54,883 37.5 52,228
Gill net 243 3.5 22,701 15.5 22,458Purse seine/ring net 1,064 15.5 3,026 2.1 1,962Trawl net 729 10.6 904 0.6 175Bag net 1,031 15.0 751 0.5 -280Beach seine 135 2.0 653 0.4 518Muro-ami/drive-in net 61 0.9 466 0.3 405Push net 154 2.2 344 0.2 190Round haul seine 65 0.9 340 0.2 275Others 742 10.8 50,622 34.6 49,880Not reported - 11,523 7.9 Total 6,879 100.0 146,213 100.0
* As of 31 August 2003.
Notable developments in commercial fishing technology The application of the fish aggregating device (FAD) – locally called payaw – as an accessory to commercial fishing gear, has minimized fish scouting. Its use has thus reduced fuel costs and enhanced fish aggregation resulting in increased fish production, particularly for tuna and tuna-like species. Offshore or deep-sea FADs consist of four types, namely: bamboo, steel buoy, combination of bamboo and steel buoy, and galvanized drum. These floating FADs are anchored with concrete weights, the number of which depends on the depth (1-5 drums); the anchor line also depends on depth, the ratio of which is 1:1.2 or 1: 5 (de Jesus 1996). The country’s commercial fisheries subsector has also benefited from advances in fishing technology. Such include innovative fishing methods, as well as larger and improved vessels that can fish for longer periods at distant fishing grounds. Progress in electronics and computer technology has also transformed the efficiency of commercial fishing, especially in purse seine fisheries (de Jesus 1996).

CHAPTER 2
_____________________________________________________________________ Comprehensive National Fisheries Industry Development Plan
56
2.6.1.3 Capture fisheries resources: exploitation status Production levels and trends in municipal and commercial fisheries Figure 2.6.1.3.a shows the trend in the annual production of the municipal and commercial fisheries alongside the aquaculture production trend. Municipal landings increased from 1965 to its peak in 1983 at about 1.2 million t, after which it leveled off at 0.9 million t to 1.2 million t annually. On the other hand, commercial fisheries production matched municipal fisheries production from 1965 to 1968, then increased slowly from about 400,000 t in 1969 to about 500,000 t in 1973. Commercial production then essentially remained constant at the level of about 500,000 t annually until 1985, which was followed by a steadily increasing annual production. This would reach a “plateau” a decade later in 1995. The year 1995 also marked the point at which commercial fisheries production caught up with municipal fisheries production. From 1995 to 2003, commercial production essentially matched municipal production at more or less 1 million t annually. From 1991 to 1995, although commercial production was increasing, municipal production was simultaneously decreasing. Overall, it can be discerned that capture fisheries production leveled off at the beginning of the 1990s.
Figure 2.6.1.3.a. Fisheries production by subsector, 1965-2003. Source: BFAR (2005).
0
500
1,000
1,500
2,000
2,500
3,000
3,500
4,000
65 66 67 68 69 70 71 72 73 74 75 76 77 78 79 80 81 82 83 84 85 86 87 88 89 90 91 92 93 94 95 96 97 98 99 00 01 02 03
'000
t
Commercial Municipal Aquaculture Total
0
500
1,000
1,500
2,000
2,500
3,000
3,500
4,000
65 66 67 68 69 70 71 72 73 74 75 76 77 78 79 80 81 82 83 84 85 86 87 88 89 90 91 92 93 94 95 96 97 98 99 00 01 02 03
'000
t
Commercial Municipal Aquaculture Total
CHAPTER 2
_____________________________________________________________________ Comprehensive National Fisheries Industry Development Plan
57
Municipal fisheries production reached its peak in 1985. Meanwhile, commercial fisheries production experienced the same about a decade later in 1995. When viewed against the generally increasing numbers of fishers in the municipal sector and the dramatic increases in number of boats in both subsectors during the same periods, the more or less constant outputs imply progressively declining catch rates in both subsectors. Status of demersal resources At present, demersal fish species comprise 16% of capture fisheries production. Of these, 69-72% are landed by municipal fishers while the rest are caught by commercial fishers (see Table 1.2.b. in Section 1.2). Demersal stocks in almost all trawlable areas of the country are depleted. This conclusion is based on a review of various trawl surveys conducted throughout the country, particularly in major trawlable areas, such as Lingayen Gulf, Manila Bay and San Miguel Bay. This conclusion is supported by the observation that since the 1960s, annual demersal production has continuously declined relative to total capture fisheries production (BFAR-NFRDI-PAWB 2005). The country’s demersal stocks were overfished as early as the 1970s (Silvestre and Pauly 1987). Demersal biomass levels are today estimated to be only 10-30% of the levels in the late 1940s. Annual rent dissipation as a result of overfishing has been estimated at US$130 million (Silvestre et al. 1986). The decline in demersal biomass has been accompanied by a shift in species composition, including the relative decline of larger-sized and commercially valuable species and the increase in shrimps and squids among the catch (BFAR-NFRDI-PAWB 2005). The change in species composition indicates that fishing has come to the point where it is changing fundamental characteristics of the marine ecosystem. The increase in number of fishers, as well as the number and power of boats described earlier, combined to increased aggregate fishing pressure, which result in the decline of demersal stocks. In addition, demersal fishing became more efficient with technological advances, such as the high-opening trawl (BFAR-NFRDI-PAWB 2005). Status of small pelagic resources About 56% of the present production of capture fisheries is composed of small pelagic species, most of which (62-65%) are landed by commercial fishing operators (see Table 2.2.c. in Section 2.2). For small pelagic stocks, maximum sustainable yield (MSY) was reached in the mid-1970s (BFAR-NFRDI-PAWB 2005). By the 1980s, the level of fishing effort was already twice the magnitude necessary to harvest MSY (Barut et al. 2004) while the average catch rate during the same period was only 1/6 of the rate in the 1950s. Today, the biomass of small pelagics is only 17% of the levels in the early 1950s (Zaragosa 2004). Annual rent dissipation in the small pelagic fisheries has been estimated at US$290 million (Silvestre et al. 1986).

CHAPTER 2
_____________________________________________________________________ Comprehensive National Fisheries Industry Development Plan
58
Status of large pelagic resources Large pelagics, which are mostly landed by the commercial fishing operators (68-74%), comprise 12-15% of the annual production of capture fisheries (see Table 2.2.2.1.c. in Section 2.2). Because most large pelagic species are highly migratory, studying their populations is difficult, and no definitive statements can be made about their biological status. Nevertheless, concern has been raised about the prevalent practice of catching of juvenile tunas in payaw (Babaran 2004). Also, decline in the catches of tunas has been observed.
2.6.2 Aquaculture
2.6.2.1 Aquaculture production Figure 2.6.1.3.a also shows production trend of the aquaculture subsector from 1965 to 2003. Aquaculture production has been rising almost continuously since 1976. In 1995, aquaculture production equaled the production of municipal and commercial fisheries (i.e., the three subsectors had more or less equal production in 1995). Thereafter, aquaculture out-produced both subsectors of capture fisheries. While capture fisheries production reached a plateau in 1991 and thereafter remained more or less constant, aquaculture production continued rising. Thus, the continued rise of overall fisheries production from the 1990s to the present is the result of continued increases in annual aquaculture production. As shown in Table 2.2.2.a in Section 2.2, seaweeds, milkfish and tilapia are the main products being farmed by the aquaculture subsector. The top seaweed-producing regions are the ARMM, Region IV-B and Region IX, which altogether account for 77% of seaweed production in the Philippines (Table 2.6.2.1.a). With regard to milkfish production, 82% is accounted for by the top producing regions, namely, Regions III, VI, I, IV and VII (Table 2.6.2.1.b). Tilapia production is concentrated in Regions III and IV, which produce 78% of total production (Table 2.6.2.1.c).

CHAPTER 2
_____________________________________________________________________ Comprehensive National Fisheries Industry Development Plan
59
Table 2.6.2.1.a. Seaweed production (t) by culture environment and region in 2003. Source: BFAR (2003).
Region Production (t) Percentage
II 484 0.0
IV-A 29,977.50 3.0
IV-B 263,946.10 26.7
V 22,331.40 2.3
VI 48,270.90 4.9
VII 75,480.24 7.6
VIII 12,914.00 1.3
IX 101,458.50 10.3
X 18,876.14 1.9
XI 636.4 0.1
XIII 16,702.00 1.7
ARMM 397,811.00 40.2
Total 988,888.18 100.0
Table 2.6.2.1.b. Milkfish production by culture environment and region in 2003. Source: BFAR (2003).
Brackish water Fresh water Marine Region Total Fishpond Fishcage Fishpen Fishpond Fishcage Fishpen Fishcage Fishpen
NCR 2,917.60 411.30 7.00 2,499.30
I 39,995.74 18,013.80 2,402.50 4,337.20 8,145.44 7,096.60
II 359.90 296.00 63.00 0.90
III 59,599.40 59,200.40 28.00 1,368.00 3.00
IV 32,243.00 17,274.00 735.00 201.00 13,516.00 103.00 414.00
V 1,742.00 1,673.70 1.00 67.60
VI 56,821.70 55,553.70 1,268.00
VII 7,406.10 6,992.70 401.70 11.60
VIII 2,178.40 2,178.40
IX 9,722.40 9,722.40
X 6,200.06 6,164.40 20.66 15.00
XI 9,445.45 7,083.10 3.70 0.30 3.05 1,164.68 1,190.62
XII 12,651.70 6,663.50 1,940.00 3,524.00 534.20
XIII 3,306.90 1,607.00 1,658.00 27.00 2.70 8.10 4.10
ARMM 1,913.90 1,913.90
Total 246,504.55 193,738.40 4,890.20 4,344.70 30.05 2,144.70 19,539.30 11,814.28 10,002.92
Table 2.6.2.1.c. Tilapia production by culture environment and region in 2003. Source: BFAR (2003).

CHAPTER 2
_____________________________________________________________________ Comprehensive National Fisheries Industry Development Plan
60
Brackish water Fresh water Region Total
Fishpond Fishcage Fishpen Fishpond Fishcage Fishpen Fishcage
NCR 460.90 62.60 398.30 CAR 2,063.76 453.26 1,610.50 I 3,743.40 715.30 36.30 2,959.20 28.50 4.10 II 3,959.90 459.00 81.00 2,037.00 1,375.50 7.40 III 64,168.90 5,169.00 46.00 58,885.40 68.50 IV 42,574.80 22.50 7.00 1,301.20 37,243.10 4,001.00 V 5,716.52 21.20 249.82 5,445.50 VI 615.96 512.80 103.16 VII 136.17 99.70 31.27 0.20 5.00 VIII 148.49 127.89 11.50 9.10 IX 1,191.90 1,114.90 77.00 X 631.30 300.00 331.20 0.10 XI 671.74 244.40 424.84 2.50 XII 9,216.20 445.50 899.90 3,706.80 4,164.00 XIII 317.77 15.70 115.57 186.50 ARMM 378.10 183.50 59.80 101.50 33.30 Total 135,995.81 9,366.10 134.00 36.30 68,056.51 50,178.90 8,207.40 16.60
2.6.2.2 Status of culture technologies With regard to major farmed species, Table 2.6.2.2.a summarizes the status of their culture technologies in terms of availability of hatchery, source of seed stock and growout method. The extent of commercialization is also indicated. The table identifies cultured species which production could be boosted by the application of technology, whether existing in other countries or obtainable through R&D. This may be pursued through government assistance for further commercialization or other means. Table 2.6.2.2.a. Status of culture technology and extent of commercialization of major farmed species.
Species Hatchery Source of seed stock Growout Extent commercialized
Fish Milkfish · Chanos chanos
Developed Mainly wild-caught plus hatchery
Extensive to intensive
Brackishwater ponds Freshwater pens/cages Marine pens/cages Deepwater cages
Growout industry highly developed but as of 1998 only one commercial hatchery
Commercial feeds readily available
Tilapia · Oreochromis niloticus · O. mossambicus
Developed, already into genetic manipulation
Hatchery SRT, GMT, GIFT, saline hybrids
Extensive to intensive Freshwater ponds Brackishwater ponds Freshwater pens/cages Concrete tank systems
Both hatchery and growout industry highly developed
Commercial feeds readily available
Carps · Cyprinus carpio · Aristichthys nobilis · others
Developed Hatchery Extensive to semi-intensive Freshwater ponds/cages/pens
Limited and not widespread
Few private hatcheries mostly government
Catfish Developed Hatchery Semi-intensive Limited, mostly small-scale, but
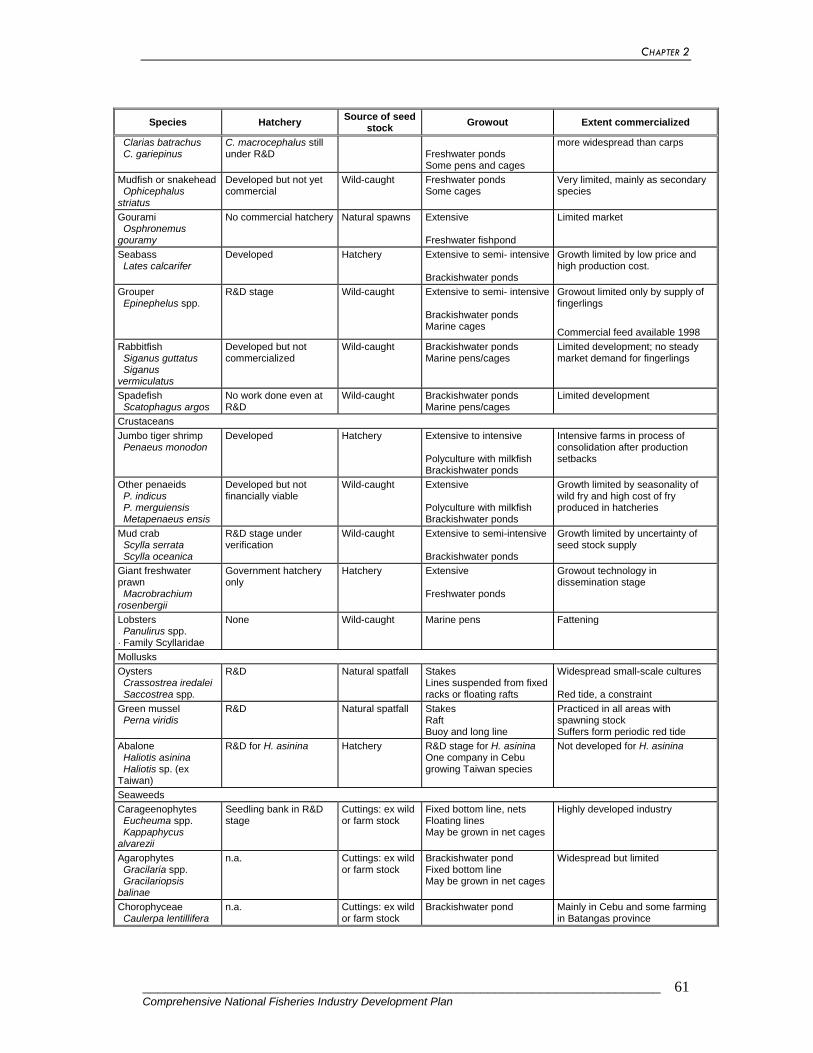
CHAPTER 2
_____________________________________________________________________ Comprehensive National Fisheries Industry Development Plan
61
Species Hatchery Source of seed stock Growout Extent commercialized
· Clarias batrachus · C. gariepinus
C. macrocephalus still under R&D
Freshwater ponds Some pens and cages
more widespread than carps
Mudfish or snakehead · Ophicephalus striatus
Developed but not yet commercial
Wild-caught Freshwater ponds Some cages
Very limited, mainly as secondary species
Gourami · Osphronemus gouramy
No commercial hatchery Natural spawns Extensive Freshwater fishpond
Limited market
Seabass · Lates calcarifer
Developed Hatchery Extensive to semi- intensive Brackishwater ponds
Growth limited by low price and high production cost.
Grouper · Epinephelus spp.
R&D stage Wild-caught Extensive to semi- intensive Brackishwater ponds Marine cages
Growout limited only by supply of fingerlings
Commercial feed available 1998 Rabbitfish · Siganus guttatus · Siganus vermiculatus
Developed but not commercialized
Wild-caught Brackishwater ponds Marine pens/cages
Limited development; no steady market demand for fingerlings
Spadefish · Scatophagus argos
No work done even at R&D
Wild-caught Brackishwater ponds Marine pens/cages
Limited development
Crustaceans Jumbo tiger shrimp · Penaeus monodon
Developed Hatchery Extensive to intensive Polyculture with milkfish Brackishwater ponds
Intensive farms in process of consolidation after production setbacks
Other penaeids · P. indicus · P. merguiensis · Metapenaeus ensis
Developed but not financially viable
Wild-caught Extensive Polyculture with milkfish Brackishwater ponds
Growth limited by seasonality of wild fry and high cost of fry produced in hatcheries
Mud crab · Scylla serrata · Scylla oceanica
R&D stage under verification
Wild-caught Extensive to semi-intensive Brackishwater ponds
Growth limited by uncertainty of seed stock supply
Giant freshwater prawn · Macrobrachium rosenbergii
Government hatchery only
Hatchery Extensive Freshwater ponds
Growout technology in dissemination stage
Lobsters · Panulirus spp. · Family Scyllaridae
None Wild-caught Marine pens Fattening
Mollusks Oysters · Crassostrea iredalei · Saccostrea spp.
R&D Natural spatfall Stakes Lines suspended from fixed racks or floating rafts
Widespread small-scale cultures Red tide, a constraint
Green mussel · Perna viridis
R&D Natural spatfall Stakes Raft Buoy and long line
Practiced in all areas with spawning stock Suffers form periodic red tide
Abalone · Haliotis asinina · Haliotis sp. (ex Taiwan)
R&D for H. asinina Hatchery R&D stage for H. asinina One company in Cebu growing Taiwan species
Not developed for H. asinina
Seaweeds Carageenophytes · Eucheuma spp. · Kappaphycus alvarezii
Seedling bank in R&D stage
Cuttings: ex wild or farm stock
Fixed bottom line, nets Floating lines May be grown in net cages
Highly developed industry
Agarophytes · Gracilaria spp. · Gracilariopsis balinae
n.a. Cuttings: ex wild or farm stock
Brackishwater pond Fixed bottom line May be grown in net cages
Widespread but limited
Chorophyceae · Caulerpa lentillifera
n.a. Cuttings: ex wild or farm stock
Brackishwater pond Mainly in Cebu and some farming in Batangas province

CHAPTER 2
_____________________________________________________________________ Comprehensive National Fisheries Industry Development Plan
62
2.6.2.3 Mariculture parks: an integrated approach to sustainable mariculture
Recently, the Aquaculture Department of the Southeast Asian Fisheries Development Center and the BFAR have been promoting the establishment of mariculture parks or zones for the management of mariculture activities. In a mariculture park, the government regulates the number and sizes of cages, as well as the distances between cages, which are established by the location of the mooring buoys. In this manner, stocking densities can be regulated based on the carrying capacity of an area. Without mariculture parks, mariculture operators, responding to market forces alone, will tend to establish cages anywhere without regard for the overall sustainability of their industry.
2.6.3 Post Harvest
2.6.3.1 Landing sites Fish catches all over the Philippines are typically landed in private, traditional or government-owned landing centers. The government-owned landing centers are fishports managed either by PFDA or by LGUs or jointly managed by both. Table 2.6.3.1.a indicates how commercial landings were distributed among various types of landing sites throughout the country in 2003. The Navotas Fish Port remains as the country’s premier fish landing center, handling about 14% percent of the total commercial landings. About 56% of the commercial catch was landed in traditional landing sites, 22% in PFDA-managed major fishports, 20% in private landing facilities and the remaining 2% in ports managed by LGUs.

CHAPTER 2
_____________________________________________________________________ Comprehensive National Fisheries Industry Development Plan
63
Table 2.6.3.1.a. Commercial fish production (t) by region and type of landing center. Source: BFAR-FPED (2003).
Region Private PFDA LGU Traditional Total NCR - 149,834 - 3,411 153,245I - 771 - 3,366 4,137II - - - 16,019 16,019III - - - 11,067 11,067IV-A - 10,157 - 78,626 88,783IV-B - - - 42,128 42,128V 10,851 - - 31,085 41,936VI 6,391 10,348 19,698 84,291 120,728VII - - - 58,143 58,143VIII - - - 46,015 46,015IX 80,554 17,063 - 114,336 211,953X - - 2,257 37,271 39,528XI 133 5,463 - 6,819 12,415XII 123,226 52,472 - 3,303 179,001XIII - - - 4,676 4,676ARMM - - - 79,862 79,862Total 221,155 246,108 21,955 620,418 1,109,636
The tendency in the subsector to unload most catches in traditional landing sites, where the handling practices cannot be efficiently controlled, is partly due to the fact that there are only seven other major fishport complexes in the country besides the Navotas Fish Port. These are the fishport complexes in Lucena, Camaligan, Iloilo, Davao, Zamboanga, General Santos City and Sual. The government-owned major fishport complexes provide landing quays and market halls for fish traders and handlers. The capacities of the harbor and market facilities of the eight major fishport complexes considerably vary. The Navotas Fish Port Complex has the most number of piers and market halls, followed by the General Santos City Fish Port Complex. The Sual Fish Port Complex has the smallest landing quay, i.e., only 70 LM long. These major fishports basically cater to the commercial fisheries subsector. The major fishport complexes provide landing quays mainly to local fishing vessels, although the Davao and the General Santos Fish Port Complexes reported arrivals of foreign fishing vessels of a total of 7,619 (from 1995 to 2004) and 11 (from 2001 to 2004), respectively. The catch from the municipal fisheries subsector is typically unloaded in the traditional landing sites or in municipal fishports. Data on the unloading in these sites are inadequate, although it is observed that most municipal fishers still utilize the traditional landing sites. However, the number of municipal fishports is seemingly increasing, although it is still not enough to meet the needs of the subsector. As of 2004, there were only 47 PFDA-constructed municipal fishports located in 11 regions in the Philippines. In terms of regional distribution, Region IV (i.e., Regions IV-A and IV-B combined) has the highest number of these PFDA-

CHAPTER 2
_____________________________________________________________________ Comprehensive National Fisheries Industry Development Plan
64
constructed municipal fishports (10 ports or 21.28%), followed by Regions V, VI and III, with 7 (or 14.89%), 6 (or 12.77%) and 5 (or 10.64%) ports, respectively. The aquaculture subsector primarily uses the eight major fishports in the country for the auctioning of aquaculture produce in the domestic market.
2.6.3.2 Ice plants and cold storage facilities The commercial fisheries subsector has access to the refrigeration facilities of the major fishport complexes, which have ice making, freezing and cold storage facilities that considerably vary in number and capacities. For the municipal fisheries subsector, the majority of the fishers have limited access to even simple ice making/plant facilities. To date, there are 23 government-owned ice making facilities that are being managed by LGUs all over the country. However, in December 2004, only 2 (both located in Casiguran and Dingalan, Aurora) of these facilities were reportedly operational. In addition to those ice making facilities under LGUs, there are 27 government-owned ice making facilities all over the country. However, only 11 of these remained operational in 2004. Nine are presently on lease to some private groups/individuals, while 2 operational facilities are now being managed by ARMM. With regard to ice storage facilities available to municipal fishers, 43 of such facilities are owned by the government. However, only 11 remained operational as of December 2004. Although there is also a significant number of privately owned ice making and ice storage facilities in almost all of the regions in the Philippines, the access of municipal fishers to these facilities might be limited by their buying capacity. Among aquaculture operators, a few avail of the refrigeration facilities at the major fishport complexes and other government-owned ice plants/ice making facilities. Most, however, procure ice from private ice plants/ice making facilities.
2.6.3.3 Fish processing methods In the Philippines, several fish processing methods are employed to reduce spoilage and produce quality, safe and competitive fish and fishery products. These techniques typically involve any of the following: (1) temperature control via the use of either low temperature (i.e., chilling and freezing) or high temperature (i.e., thermal processing, boiling and smoking); (2) reduction of moisture (i.e., salting, drying, smoking and fermentation); (3) other processing methodologies (e.g., mincing, surimi processing, seaweed processing, marinating/pickling, etc.); and (4) combination of different processing methodologies to produce value-added fishery products. The most common preservation technique in landing sites is still the reduction of temperature via chilling or the use of crushed ice. There are other chilling media available in the Philippines (e.g., ice in other forms, such as flaked, tube and blocks, refrigerated/chilled seawater, seawater ice and slushed ice). The choice of the medium to be used depends on their availability and affordability.

CHAPTER 2
_____________________________________________________________________ Comprehensive National Fisheries Industry Development Plan
65
Overall, approximately 70% of the total fish consumption in the country is in fresh or chilled forms, while the remaining 30% is processed into either cured (i.e., salted, dried, smoked, fermented and pickled), canned or frozen products, or disposed of as live food (Abella and Baltazar 1995). Fish processors, more particularly in the coastal communities, generally rely on traditional knowledge in processing fish and other aquatic resources. Products processed are fish species that are caught in large quantities during certain seasons, such as sardines, siganids, mackerels/roundscads and anchovies. All are dried, but roundscads are also smoked. Siganids sometimes also undergo de-boning before drying. Besides drying and smoking, anchovies and siganid fry are processed into fish sauce known locally as ginamos and padas, respectively. More recently, milkfish (bangus) has been deboned and marinated and sold in plastic and styrofoam packs. According to DTI, the big majority of processors in the country are small-scale operators. Indeed, most of those who dry and smoke fish are the wives of municipal fishers, if not the fishers themselves. Fish traders also engage in drying and smoking, usually of excess fish.
2.6.3.4 Fish processing establishments Data on fish processing establishments (FPE) in the Philippines are scanty and generally limited to those that are registered, the majority of which are the big players in the industry. As of 2004, only 294 FPEs had licenses to operate (LTO) from BFAD (BFAR 2005). The other FPEs that operate as backyard activities and use traditional fish processing methodologies (e.g., salting, drying, smoking, fermentation, etc.) remain unaccounted. Most backyard processors do not have permits and are thus not regulated or regularly inspected by the authorities. Although some of these fish processors produce good fishery products, quality control can be problematic. The big players in the industry, on the other hand, strive to meet the demands and specifications of the export market. Most of these big players have their own processing plants. Only two fishport complexes (Camaligan and Iloilo Fish Port Complexes) provide processing areas to entrepreneurs. While many succeed in exporting to the USA, Europe, Japan and other Asian countries, there have been a number of shipments that were rejected or detained due to failure to comply with standards of the importing nations.
2.6.3.5 Post-harvest losses Approximately 25-40% of the total fish production in the Philippines is lost from the distribution chain. This is attributed to one or all of the following reasons: (1) actual physical or material losses, such as discards and by-catch in fishing vessels and spoiled/inedible fish in landing facilities; (2) nutritional losses or the decrease in the amount of nutrients a human body derives from eating fish that has lost its nutritional value; and (3) losses in value due to spoilage of wet fish, infestation of

CHAPTER 2
_____________________________________________________________________ Comprehensive National Fisheries Industry Development Plan
66
dried and smoked fish, weight loss and inferior finished products. Proper post-harvest handling practices, therefore, are prerequisites to maintaining fish quality. Post-harvest handling must occur in aquaculture facilities, in commercial and municipal fishing vessels, in major and municipal fishports and other landing sites, and in FPEs. In particular, the limited access of fish handlers to refrigeration facilities on fishing vessels and in landing sites is a major factor contributing to reduced fish quality. For the commercial fisheries subsector, most fishers have to rely on private ice plants/ice making facilities. Although the government provides refrigeration facilities in major fishports and some municipal fishports, most of these facilities are nonoperational. For municipal fishers, the problem is exacerbated by their inability to buy ice for their catch. In terms of storage and distribution of the processed products, the government-owned cold storage facilities are not sufficient to meet the demands of the industry. In fact, only 40% of the freezers and 28% of the cold storage facilities that are government-owned remained operational in 2004. In the distribution of fishery products in the local market, even some local supermarket chains do not handle the products well, especially the frozen products. In terms of packaging fish and fishery products, traditional packaging of fishery products still prevails, particularly for products sold in the wet market. This includes the use of banana leaves, old newspapers and thin plastic bags for retail packaging of fishery products, as well as the use of wooden trays and boxes for storage, transport and marketing of fishery products in wholesale quantities. Although relatively cheap, inferior packaging leads to problems that are related to quality, safety, sales appeal and shelf-stability. For fishery products in retail supermarkets, poor packaging and labeling of fishery products still predominates, despite the implementation of the Labeling Act of the Philippines (RA 3740, Commonwealth Act No. 46, as amended by RA 7394) that governs all consumer products sold in the Philippines.
2.6.4 Markets In general, 20% of Philippine fish production is exported while 80% is consumed locally. Of the latter, 64% is sold fresh, 8% is dried and 8% is processed.
CHAPTER 2
_____________________________________________________________________ Comprehensive National Fisheries Industry Development Plan
67
2.6.4.1 Markets for municipal catches In the domestic market, fish is traditionally sold both in retail and wholesale trading centers. The majority of catches from the municipal fisheries subsector is marketed, mostly in retail quantities, directly in traditional landing sites. There are middlepersons who buy fish from fishers. They then either sell these products in the local wet market or process them into dried, smoked or fermented products. In some areas, the catch of the municipal fishers directly goes to big entrepreneurs of the area, as payment for debt that fishers incur during the lean seasons. The municipal fishers’ fish products are usually marketed locally within a few hours. Smaller fish are sold to village retailers or marketed directly to consumers. The majority of the products of municipal fishers are sold by retailers at the village-level market (talipapa) or at the town center’s wet market. Frequently, fish are sold by women in villages. Marketing costs are low, although a 5-10%/kilo markup exists between sales to retailers and sales to consumers at the village level. The larger and higher quality fish are sold to wholesalers, who sometimes bring the fish to bigger markets in major towns within a province. High-value products, such as mud crab and sea cucumber, are brought to city markets like Metro Manila. Markups at each stage of the marketing chain may range from a low of 10% up to a high of 50%. Thus, farm-gate prices are generally less than half of retail prices. Prices at source are not, however, always identical with prices received by fishers. This is especially true when fishers are hired help and do not own the boats and gears. In such cases, the return to the fisher is as low as 15% of the landed price. A system where the buyer provides capital for fishing for priority in fish landings – an arrangement called suki – is common among fishers. Fishers borrow for capital investments and operating expenses. The lender requires the borrower to sell the fish exclusively to the lender. No interest is charged, but loan repayment is made daily in the form of fish produce at reduced price terms.
2.6.4.2 Markets for commercial catches Most commercial catches are landed and traded in wholesale qualities at traditional landing centers. In some cases, catches that have been landed in private and traditional landing sites are transported to major fishports for auctioning. Some fishing corporations have their own fish canneries and therefore transport their catches directly to these canneries (e.g., Ayala Seafoods Corporation and Universal Canning Corporation, etc.).
2.6.4.3 Markets for aquaculture produce

CHAPTER 2
_____________________________________________________________________ Comprehensive National Fisheries Industry Development Plan
68
In the aquaculture subsector, most of the produce is either auctioned on site or transported to major fishports for auctioning. Those who are engaged in on-site bidding are middlepersons and fish exporters. Meanwhile, bidding in fishports is typically done by middlepersons, fish vendors in the local wet markets and small fish processors. Some aquaculture farms have their own processing facilities (e.g., Alson’s Aquaculture Corporation, Aklan’s Boneless Bangus, etc.). Hence, most of their aquaculture produce directly goes to their processing plants.
2.6.4.4 Markets for processed fishery products Traditional processed fish products (e.g., smoked, dried, salted, fermented and marinated/pickled, etc.) are sold in wet markets throughout the country. Some products are sold in supermarkets, including canned/bottled fish, deboned milkfish, and specialty products (e.g., pasteurized fishpaste, crab fat, etc.).
2.6.4.5 Local consumption Within the country, geographical variations in the consumption of fish and fishery products are determined by proximity to supply source (due to inadequacy of transport facilities), purchasing power and consumer preferences. These, in turn, are also influenced by the availability of substitutes. In 1999, Metro Manila had a per capita consumption of 34 kg, which was lower than the national average because the region has access to other protein foods and the retail prices of fish there are often higher. The Visayan provinces, where fishing is a major industry, had the highest per capita consumption of 49 kg. The national average per capita consumption further declined to 27 kg in 2001, which was attributed by BFAR to faster population growth relative to production growth.
2.6.4.6 Export markets In terms of export, Japan and USA are the traditional export markets for Philippine fish and fishery products. Although these countries still remain as the top major destination, it is still necessary to tap other markets and create a niche for some of our fish and fishery products. Since the world market demands high-quality, safe and globally competitive products, development of new fishery products or improvement of existing ones is only part of the overall strategy. Compliance with existing regulations in the export market is necessary to stay competitive in the export market.
2.6.4.7 Government support for marketing systems The AFMA mandates the creation of a network of smallholder cooperatives called “National Marketing Umbrella” to engage in marketing activities. In addition, Section 34 of the Fisheries Code of 1998 stipulates that at least 10% of

CHAPTER 2
_____________________________________________________________________ Comprehensive National Fisheries Industry Development Plan
69
government loans to the fisheries sector be allotted to post-harvest and marketing projects. More specifically, the Ginintuang Masaganang Ani Program for 2002-2004 aims to improve production-marketing systems in the fisheries sector so that it becomes “more efficient and effective”. Since the 1990s, the government has provided funding for the construction of more than 200 fish landing ports through its national municipal fishing ports program and the Fisheries Sector Program of the early 1990s. In addition, there was an ice supply program led by the private sector which built about 36 ice and cold storage facilities. Problems in infrastructure support include the concentration of fishing ports in urban areas where there is potential for investment and growth, but far from where fisherfolk communities are found. These ports charge high fees and require quota supply from fishers in exchange for landing rights. Given such prohibitive fees, the municipal fishers cannot readily access these ports.
2.7 Key Development Challenges The previous sections offered glimpses of the many challenges facing the country’s fisheries sector. In this section, we pull together the facts about these challenges and elucidate their interconnections. We will show that these challenges are intricately linked, and that the most effective way to address them is to implement a carefully planned and integrated program. Figure 2.7.a schematically illustrates the major issues confronting Philippine fisheries. If the problem of Philippine fisheries can be summarized in a single statement, it can be stated that, despite a long history of attempts, Philippine fisheries have yet to be sustainably managed. Unsustainable management results in greater poverty, more resource use conflicts, and reduced contributions of the fisheries sector to the economy. In specific terms, unsustainable management of fisheries means: (1) our fishery resources are depleted; (2) our fishery habitats are degraded; (3) we see intensified resource use competition and conflict; (4) we have yet to fully exploit the full potential of our aquaculture and commercial fishing grounds; (5) our fishery products are not competitive; and (6) we consistently endure post-harvest losses. The main cause of the above problems — or what prevents us from resolving them — is our inadequate management systems and structures. Hence, all these problems can be traced to an institutional system that is not yet fully effective. We examine these problems below. Figure 2.7.a. Key challenges confronting Philippine fisheries.
Red
uced
con
tribu
tion
to e
cono
my
al o
f er
cial
U
ncom
petit
ive
prod
ucts
Post
-har
vest
lo
sses
othe
r
ers
•Po
or p
rodu
ct q
ualit
y•
Hig
h pr
oduc
tion
cost
s•
Wea
k m
arke
ting
stra
tegi
es
•Li
mite
d fa
cilit
ies
(e.g
., fis
hpor
ts,
mar
ket r
oads
, ha
rves
t fac
ilitie
s,
etc.
)•
Lack
of
tech
nolo
gica
l kn
ow-h
ow
Wea
k in
stitu
tiona
l par
tner
ship
s
•Li
mite
d co
ordi
natio
n am
ong
conc
erne
d ag
enci
es/s
take
hold
ers
•Lo
w p
riorit
y gi
ven
to fi
sher
ies
•W
eak
regu
lato
ry/e
nfor
cem
ent m
easu
res
•W
eak
info
rmat
ion
diss
emin
atio
n•
Lim
ited
rese
arch
and
dev
elop
men
t
uctu
resR
educ
ed c
ontri
butio
n to
eco
nom
y
al o
f er
cial
U
ncom
petit
ive
prod
ucts
Post
-har
vest
lo
sses
othe
r
ers
•Po
or p
rodu
ct q
ualit
y•
Hig
h pr
oduc
tion
cost
s•
Wea
k m
arke
ting
stra
tegi
es
•Li
mite
d fa
cilit
ies
(e.g
., fis
hpor
ts,
mar
ket r
oads
, ha
rves
t fac
ilitie
s,
etc.
)•
Lack
of
tech
nolo
gica
l kn
ow-h
ow
Wea
k in
stitu
tiona
l par
tner
ship
s
•Li
mite
d co
ordi
natio
n am
ong
conc
erne
d ag
enci
es/s
take
hold
ers
•Lo
w p
riorit
y gi
ven
to fi
sher
ies
•W
eak
regu
lato
ry/e
nfor
cem
ent m
easu
res
•W
eak
info
rmat
ion
diss
emin
atio
n•
Lim
ited
rese
arch
and
dev
elop
men
t
uctu
res

CHAPTER 2
_____________________________________________________________________ Comprehensive National Fisheries Industry Development Plan
70
2.7.1 Depleted Fishery Resources The amount of fishing pressure exerted on Philippine capture fishery resources is simply more than what the resources can sustain. Consequently, in the case of demersal resources, biomass levels are down to 10-30% of levels in the late 1940s. In addition, changes in species composition, such as the disappearance of larger-sized demersal species, have begun to occur. The biomass of small pelagics today is only 17% of the levels in the early 1950s. Overfishing of both demersal and small pelagic resources probably started in the 1970s. In the case of large pelagics, their abundance is difficult to ascertain because they are highly migratory. However, scientific evidence suggests that the fishing pressure on these resources is likewise excessive. For tunas, in particular, juveniles now comprise a large portion of the typical catch, indicating that fewer individuals get the chance to grow to adult sizes. Open access to our fishery resources is the main reason for their severe depletion. Under open access, practically anyone who wishes to fish may fish when and where they choose. In this situation, a fisher is motivated to fish as much as possible because the fish that he or she does not catch will most likely be caught by someone else. Such unregulated competition ensures that overall fishing pressure eventually becomes excessive. Despite the directive in the Fisheries Code calling for a shift from open to limited access through licensing, we have yet to implement a nationwide licensing in the municipal fisheries.
2.7.2 Degraded Fishery Habitats The Philippines’ critical fisheries habitats are degraded and their ability to sustain fisheries and provide ecological services is impaired. Conversion of mangroves into other uses, particularly into brackishwater fishponds, has wiped out two-thirds of the country’s mangroves, which in 1918 was estimated at 450,000 ha. Moreover, about 95% of the remaining mangroves are secondary growths with thinner canopies, reduced litter fall, reduced food and consequently a diminished capacity to function as fish nurseries, among other things. In the case of seagrasses, most seagrass areas that have been surveyed thus far are stressed, as indicated by low shoot density and biomass per square meter. Siltation and destructive fishing have rendered 70% of the country’s reefs in poor condition, as evidenced by low live coral cover. Catch rates reported in reefs throughout the country are among the lowest in the world. Destructive fishing practices and pollution likewise contribute to habitat degradation.
2.7.3 Intensified Resource Use Competition and Conflict As resources dwindle, the race to harvest them intensifies. Among the consequences of intensified competition is the proliferation of destructive and illegal

CHAPTER 2
_____________________________________________________________________ Comprehensive National Fisheries Industry Development Plan
71
fishing practices. Fishers turn to such practices in desperation or in a bid to outcatch the competition. Intensified competition leads to resource use conflicts. Where commercial fishers operate within the vicinity of municipal fishers, conflict is the inevitable result. Conflicts also occur among municipal fishers using different gears, especially between those who use gears of highly unequal fishing power. Competition is aggravated by ineffective implementation of fisheries zonation scheme. There are also conflicts between fishers and other users of the fishery resources, such as divers and recreationists.
2.7.4 Unrealized Potential of Aquaculture and Commercial Fisheries In the aquaculture subsector, a number of species are being cultured with less than adequate technology. For example, some culture activities are dependent on the wild for seed stocks because hatcheries are nonexistent. In such cases, production could be significantly increased if a hatchery could provide a stable supply of seed stock. The potential areas available for aquaculture expansion are nearly 285,500 ha. With regard to commercial fishing, most operations are conducted in the country’s shelf area or within depths of 200 m. No serious attempt has been made to explore the largely untapped EEZ waters. Among the potential areas are the offshore areas of Palawan and the Sulu-Sulawesi Marine Eco-region.
2.7.5 Uncompetitive Products In the export market, Philippine fishery products are not known for being competitive. Among other things, some products are of poor quality, have high production costs and are hampered by poor marketing strategies. Some of the shipments of the country’s fishery products have been rejected by the importing nations because they failed to meet the required safety standards.
2.7.6 Post-harvest Losses Approximately 25-40% of the country’s total fish production is lost due to discards and improper post-harvest handling. Such losses can be attributed to one or a combination of physical, nutritional or value losses. About one-third of the harvested products are spoiled before they reach their market destinations. Lack of infrastructure facilities (e.g., fishports, market roads and dry/cold-storage facilities) and limited technological know-how contribute to post-harvest losses.
2.7.7 Limited Institutional Capabilities The responsibility to manage fisheries is shared by NGAs, LGUs and local communities. Yet these groups have serious capability limitations that prevent them from fulfilling their responsibilities. The management agencies are hampered by the lack of financial resources, as well as inadequate human resources. Within

CHAPTER 2
_____________________________________________________________________ Comprehensive National Fisheries Industry Development Plan
72
the agriculture sector, low priority has always been given to fisheries when compared to crops and livestock components.
2.7.8 Inadequate/Inconsistent Fisheries Policies Fisheries management is also hampered by inadequate and inconsistent policies. For example, while the Fisheries Code pursues food security essentially through management and conservation of fishery resources, AFMA promotes the full industrialization of the fisheries sector. Inadequate policies include cases in which some national policies and local regulations are promulgated with limited scientific basis. There are likewise international conventions/commitments that may have an adverse impact on the fisheries sector. For example, trade policies on import liberalization are putting the small-scale fishers at a disadvantage given the importation of cheap fishery products.
2.7.9 Weak Institutional Partnerships Weak institutional partnerships result in limited coordination among concerned agencies and stakeholders, either horizontally or vertically. For example, national enforcement agencies (PNP Maritime Group and Philippine Navy) should ideally work closely with the local law enforcement units. Yet more often, the collaboration is quite loose, resulting in weak enforcement of fisheries rules and regulations. Weak partnerships are also seen between management agencies and institutions involved with R&Ds. Hence, there is often limited use in management of relevant technical information.
2.8 Key Development Opportunities While the challenges confronting fisheries are daunting, we must not lose sight of existing opportunities or positive conditions in the sector. These include the vast water resources for increasing production; the tropical condition, which allows year-round fish culture; increasing demand for fish and fish products from primary markets, such as USA and China; and the strong domestic market. There are opportunities to delineate property rights to gradually replace the open access regime; utilize EEZ; sustainably expand aquaculture and mariculture; improve post-harvest practices and systems; tap export potentials; and extract substantive resource rents through policies based on natural resource pricing. Key opportunities are briefly described below.
2.8.1 Delineation of Property Rights Traditionally, municipal fisheries are an open access subsector. Practically anyone may fish without limit and with little government interference. The result of this free-for-all regime is the overexploitation of capture fisheries. Establishing

CHAPTER 2
_____________________________________________________________________ Comprehensive National Fisheries Industry Development Plan
73
appropriate property rights, especially in municipal fisheries, is a step towards controlling and rationalizing access to fishery resources. When long-term rights of fishers and other users to marine resources are well defined and secure, they will tend to exploit them in a more sustainable manner. This is because they are assured that the ultimate benefits of their practices and activities will accrue to them. The provisions in the Fisheries Code of granting fishery rights to local organizations provide a general basis to delineate property rights at the municipal level. The LGUs now have to appropriate these rights to fishers and users in a socially equitable and environmentally sustainable manner. In the distribution of rights, LGUs must put utmost importance on the ability of organizations to sustainably manage municipal fisheries resources. To do this, LGUs must require proposals from organizations wanting to manage resources to include an EIA, which will serve as an important basis in the granting of fishery rights. In addition, the Fisheries Code provides for the granting to municipal fishers, organizations and cooperatives of demarcated fishery areas for fish capture, mariculture and fish farming. Furthermore, resident fishers, organizations and cooperatives have priority in receiving fishery rights granted by LGUs and in exploiting demarcated fishery areas in their communities.
2.8.2 Utilization of Offshore Exclusive Economic Zone Philippine fisheries essentially remain concentrated in the country’s shelf area, which measures 184,600 km2 in total. This means that there are more than 2 million km2 within the Philippine EEZ that essentially remain unexplored and unexploited. Conceivably, there may be deep-sea resources in these areas that could support viable commercial fisheries. Candidate sites include the offshore hard bottoms around Palawan, southern Sulu Sea and central part of the Pacific coast.

CHAPTER 2
_____________________________________________________________________ Comprehensive National Fisheries Industry Development Plan
74
2.8.3 Aquaculture Expansion After capture fisheries production peaked in the early 1990s and essentially remained unchanged in subsequent years, the aquaculture subsector picked up the slack. Aquaculture has been producing increasingly larger annual volumes to meet the growing demand for fish. Yet, though aquaculture production has been impressive, there is still room for expansion. As earlier described, the culture technologies for some species (e.g., grouper) are still in the stages of infancy (e.g., no hatchery, seed stock from the wild). The culture of such species could be expanded by applying technologies existing elsewhere or by developing them through R&D. Also, some less-known species are presently being cultured essentially by innovators in isolated endeavors. With proper support, the culture of these less-known species could be commercialized. By expanding aquaculture, the pressure on existing supplies of wild fish will be reduced. Some quarter of a million hectares may be developed for aquaculture expansion.
2.8.4 Improved Post Harvest The post harvest sector contributes significantly to the economy and to the livelihood of coastal communities. Many are involved in specific aspects of fisheries post-harvest activities including small-scale processing, marketing and trading, even if it is not their major livelihood. For the fisheries sector to fully develop, additional port and post-harvest facilities are necessary. As earlier mentioned, the post-harvest losses in fisheries are substantial and lowering these to a minimum will do a lot to improve productivity. The available data on fisheries facilities indicate that the country has a large number of ports and most of these are operating. However, several coastal regions do not have regional ports and many coastal municipalities do not have even simple ports. In addition, ice plants, freezers and cold storages are lacking in many areas. In some places where facilities are available, these are underutilized because of the reduced landed harvest by fishers due to stocks depletion.
2.8.5 Export Potential Export earnings from fish and fisheries products constitute a major part of foreign exchange earnings. Global fish trade in 2000 was reported to be US$55.2 billion and is growing at an annual rate of 4% (FAO 2002). Growing international trade provides great opportunity for the Philippine fisheries exports. As in most developing countries, the Philippine trade of fishery products is continuously undergoing a shift from merely exporting raw materials (for importing countries to process) to trading high-value live fish or value-added products. Foreign investments have come in to develop processing plants because of low labor costs. The majority of commodities produced through aquaculture undergo auction procedures, either on-site (farms) or at major trading centers (ports or the

CHAPTER 2
_____________________________________________________________________ Comprehensive National Fisheries Industry Development Plan
75
local consignacion). Many aquaculture products, particularly seaweeds, have competitive export potential.
2.8.6 Natural Resource Pricing The commercial fisheries and aquaculture are the two subsectors where resource rents are potentially high, and where correct resource pricing could be exercised. The goal of sustainable development in the fisheries sector can be pursued through the use of market-based instruments. The Fisheries Code recognizes the importance of market-based instruments as tools in environmental management. For instance, Section 48 of the code stipulates that DA should formulate incentives and disincentives – such as effluent fees, user fees, negotiable permits and other market-based instruments – to encourage compliance to environmental standards and promote sustainable management practices in aquaculture. Charges for access to fishery resources should reflect the community interest, as well as short and long-term economic, environmental, social and cultural costs and benefits. Access to common fishing resources for private profit should be priced to give a reasonable rate of return to the community, consistent with government resource management policies. The correct pricing of fishery resources by the national government is a useful tool for attaining a more sustainable form of development in fisheries. This is because correct resource pricing, largely done through the imposition of accurate fees that reflect resource rents, or above normal profits, will force users to be more efficient. Hence, their activities will produce higher outputs at lower effort levels. Such may eventually reduce overfishing without sacrificing production. In addition to economic and environmental gains of correct pricing, there are generated revenues from extraction of rents from users. The current license fee rates in the commercial fisheries are very low and were set many years ago. For a 250 GT motorized boat, for instance, the annual boat license fee is only PhP1,000 which was set way back in 1983. In addition, the annual application fee is minimal (ranging from PhP400 to PhP2,000) which was determined back in 1993. In the aquaculture subsector, the situation is similar. The rental rates for using government-owned fishponds are minimal and were set decades ago. The annual rental fee per hectare of fishponds is only PhP50 since 1979, while the annual application fee is PhP1,000 since 1993.