bhu pet 2011 m.sc. health stat
TRANSCRIPT

8/12/2019 Bhu Pet 2011 m.sc. Health Stat
http://slidepdf.com/reader/full/bhu-pet-2011-msc-health-stat 1/31
I 1P/211/31 I 060Set No. 1 Question Booklet No .....................................
To be filled up by the candidate by bluelblack ball point pen
Roll No. IL - - - - -_- - - -_- - - _ - - -_- - - - -_L- - - -
Roll No.
Write the digits in words) ...•...........................................................................................................
Serial No. of Answer Sheet .....................................
Day and Date ............................. Signature of Invigilator)
INSTRUCTIONS TO CANDIDATES
Use only bluelblack ball·point pen in the space above and on both sides of the Answer Sheet)
1. Within 10 minutes of the issue of the Question Booklet, check the Question Booklet toensure that it contains all the pages in correct sequence and that no pagelquestion ismissing. In case of faulty Question Booklet bring it to the notice of the
Superintendent/ Invigilators immediately to obtain a fresh Question Booklet.
2. Do not bring any loose paper written or blank, inside the Examination Hall except thedmit Card without its envelope.
3. A separate Answer Sheet is given. I t should not be folded or mutilated. A second AnswerSheet shall not be provided. Only the Answer Sheet will be evaluated.
4. Write your Roll Number and Serial Number of the Answer Sheet by pen in the spaceprovided above.
5 On the front page of the Answer Sheet write by pen your Roll Number in the spaceprovided at the top and by darkening the circles at the bottom. Also wherever applicable
write the Question Booklet Number and the Set Number in appropriate places.6. No overwriting is allowed in the entries of Roll No., Question Booklet No. and Set No.
if any) on OMR sheet and Roll No. and OMR sheet No. on the Quest ion Booklet.
7. Any changes in the aforesaid entries is to be verified by the invigilator, othenvise it will be
taken as lUlfainneans.
8. Each question in this Booklet is followed by four alternative answers. For each questionyou are to record the o r r ~ t option on the Answer Sheet by darkening the appropriatecircle in the corresponding row of the Answer Sheet by pen as mentioned in the guidelinesgiven on the first page of he Answer Sheet.
9. For each question, darken only one circle on the Answer Sheet. I f you darken more thanone circle or darken a circle partially, the answer will be treated as incorrect.
10. Note that the answer once filled in ink cannot be changed. If you do not wish to attempt a
question, leave all the circles in the corresponding row blank such question will beawarded zero marks).
11. For rough work, use the inner back page of the title cover and the blank page at the end of
this Booklet.
12. Deposit only the OMR nswer Sheet at the end of the Test.
13. You are not permitted to leave the Examination HalllUltil the end of the Test.
14. If a candidate attempts to use any fonn of unfair means, he/she shall be liable to such
punishment as the University may detennine and impose on him/her.~ f.mr ~ if 3Il'R i-'f' R 'fl) t I ITotal No. of Printed Pages: 30
A laSem Admi

8/12/2019 Bhu Pet 2011 m.sc. Health Stat
http://slidepdf.com/reader/full/bhu-pet-2011-msc-health-stat 2/31
P 211131
No. of Questions 150
Time : 2t Hours 1 [ Full Marks 450
Note i) Attempt as many questions as you can. Each question carries 3 three)
marks. One mark will e deducted for each incorrect answer Zero mark
will be awarded for each unattempted question.
ii) If more than one alternative answers seem to be approximate to the correct
answer, choose the closest one.
1 An ordinal variable is one for which:
1) The data are discrete and can take one of many values
2) The data are continuous and follow an ordered sequence
3) The data are categorical
4) There can only be two categories of response
2 Which of the following variables are measured on a nominal scale?
1) Height in cm
2) Ethnic group
3) Social class I/lI/IIl-N/IIl-M/IV IV)
4) Age categorized as young, middle-aged or old
3. The data given as 6, 9, 12, 19, 81, 84, 95 will be called as :
1) a continuous series
3) an individual series
2) a discrete series
4) time series
P.T.O.
A laSem Admi

8/12/2019 Bhu Pet 2011 m.sc. Health Stat
http://slidepdf.com/reader/full/bhu-pet-2011-msc-health-stat 3/31
llP1211131
4. The series:
arks
Number o students
is of the type :
. 20 30 30 40 40 50 50 60 60 70 70 80
5 14
1) Discrete series
3) Continuous series
5. Frequency of a variable is always:
1) an integer 2) a fraction
24 12
2) Individual series
4) None of these
9 2
3) in percentage 4) none of these
6. Whether classification is done first or tabulation?
1) Both are done simultaneously
3) Classification follows tabulation
2) Classification precedes tabulation
4) None of these
7. Which o the followings is a one-dimensional diagram?
1) Bar diagram 2) Pie-chart 3) Cylinder 4) A graph
8. Ogives for more than type and less than type distributions intersect at :
1) Mean 2) Median
9. A bar chart :
1) used to display categorical data
2) can also be.called a histogram
3) Mode 4) Origin
3) should be drawn without gaps between the bars
4) can only be used to display data which have a symmetrical distribution
10. The most appropriate diagram to represent the Five Year Plan outlay of a
country in different economic sectors is the following:
1) Pie diagram
3) Line graph
2
2) Histogram
4) Frequency curve
A laSem Admi

8/12/2019 Bhu Pet 2011 m.sc. Health Stat
http://slidepdf.com/reader/full/bhu-pet-2011-msc-health-stat 4/31
llP 211 31
11 In constructing a histogram with unequal class interval, the heights of the
rectangles are chosen such that:
1) They are proportional to the respective width of the class intervals
2) The resulting histogram looks bell shaped
3) They are equal irrespective of the width of the class interval
4) The areas of the resulting rectangles are proportional to the frequencies of
respective class
12. The median of the weight at birth of babies 2500, 2100, 2630, 2550, 2700, 2650,
2300,3100,3000,3050 gm is :
1) 2650 2) 2600 3) 2640
13 In statistics the most commonly used frequency curve is:
1) inverted J·shaped
3) bell-shaped
2) U-shaped
4) mixed
4) 2630
14 An aeroplane covers the four sides of a square at speeds of lOaD, 2000, 3000 and
4000 km/hr. respectively. The average speed of the plane in its flight around
the square will be :
1) 2500 km/hr. 2) 1920 km/hr. 3) 1290 km/hr. 4) 2000 km/hr.
15 The mean marks of 100 students were found to be 40. Later on it was
discovered that a score of 53 was misread as 83. The correct mean will be :
1) 43.5 2) 37.9 3) 39.7 4) 42.5
16 Variance of n observations is found to be 72. Each observation is increased by
a constant where > O f 52 denotes the variance of new set of observations,
then:
3 ) P.T.O.
A laSem Admi

8/12/2019 Bhu Pet 2011 m.sc. Health Stat
http://slidepdf.com/reader/full/bhu-pet-2011-msc-health-stat 5/31
11P1211 31
17 The standard deviation of the following:
Class : 0-10 10-20 20-30 30-40
Frequency
is :
1) 7 6
1
2) 8
3 4 2
3) 3.24
18 The positional measure of central tendency is :
4) 9
1) Median
3) Harmonic mean
2) Arithmetic mean
4) Geometric mean
19 f the coefficient of kurtosis yz of a distribution is zero, the frequency curve is :
1) lepto kurtic 2) platy kurtic 3) meso kurtic 4) none ofthose
20 The coefficient of skewness of a series A is 0.15 and that of series B is 0.062.
Which of the two series is less skew?
1) series A 2) series B 3) no decision 4) none ofthose
21 Height and weight of children have the correlation:
1) Zero 2) One 3) Negative 4) Positive
22. f ~ y x < 1 then ~ x y is:
1) less than 1 2) greater than 1 3) equal to 1 4) equalto 0
where yx and Pxy stand for regression coefficients of y on x and x on y
respectively.
23 f the variables x and y are independent the value of regression coefficient y onx i.e. ~ y x is equal to :
1) 0 2) 1
3) 00 4) any positive value
4 )
A laSem Admi

8/12/2019 Bhu Pet 2011 m.sc. Health Stat
http://slidepdf.com/reader/full/bhu-pet-2011-msc-health-stat 6/31
llP/211131
24 Two series x and y with 50 items each have standard deviation 4.5 and
3.5 respectively. The sum of product of deviations of x and y series from
their respective arithmetic mean is 420. Then the coefficient of correlation
between x and y will be :
(1) 0.85 2) 0.533 (3) 0.253 (4) 0.485
25 Given the two lines of regression as 3x + 4y + 8 0 and 4x - 3y I the means
ofx andy are :
(1) x=4 (2) x=3 y=4 (3)4 5
(4)3 4
y=5 X=- y=- x:::: 4 y=-3 4 5
26. Given r12 0.6, 13 =0.5 and 23 =0.8, the value of 12.3 is :
(1) 0.4 (2) 0.72 (3) 0.38 (4) 0.47
27 If R1.32 =0 then all total and partial correla tion coefficients involving xl are:
1) 1 (2)2
(3) -1 4) 0
28 In a trivariate population r12:::: 0.7,. r13:::: 0.6 and r23:::: 0.5 then the value of
R1.23 is:
1) 0.57 2) 0.84 3) 0.74 (4) 0.50
29 f the regression coefficient of x on y the coefficient of correlation
between x and y and variance of x are - 2, - and I ; respectively. The
variance of y is :
1) 2.J i (2) 21
3) .J i 4) .J i
30 f the regression of y on x and that of x on yare given by 2y = -4x + 6 and
16x = -2y +6 respectively, then the correlation coefficient between x and y is :
(1).J i
(2) -0.9
5 )
(3) -0.5 4) 0.25
P.T.O.
A laSem Admi

8/12/2019 Bhu Pet 2011 m.sc. Health Stat
http://slidepdf.com/reader/full/bhu-pet-2011-msc-health-stat 7/31
11P1211/31
31. For two events and B let
then and Bare:
P A) P B) 28 3
1) mutually exclusive but not independent
2) independent but not mutually exclusive
3) mutually exclusive and independent
4) neither mutually exclusive nor independent
and
32. Two dice are tossed. The probability that the sum of the points on the
dice is 8, is :
1)36
72) 36
33. The probability of an occurrence can be :
1) l to1 2) Oto 1
3) 1
3) 0 to 00
4) 1136
4) -wtooo
34. Given that P A) P B) ~ . , P A/ B) the probability P B/A) is equal to :3 4 6
1) 1 4 2) 2/3 3) 1/8 4) 1 12
35. A probability curve y f x) has a range from 0 to 00 f f x) e-x the mean of
the distribution is :
1) 0 2) 12
3) 2 4) 1
36. The mean and the variance of a distribution is same, then the distribution is :
1) Poisson 2) Binomial 3) Uniform 4) Normal
37 f the mean, median and mode coincide then the distribution is :
1) Geometric 2) Symmetrical 3) Rectangular 4) Poisson
6 )
A laSem Admi

8/12/2019 Bhu Pet 2011 m.sc. Health Stat
http://slidepdf.com/reader/full/bhu-pet-2011-msc-health-stat 8/31
llP/211131
38. A random variable x has the following probability mass function:
x -2 -1 0 1 2 3
pix 0.1 k 0.2 2k 0.3 k
The mean of x is :
1)3
2) 0.5 3) 0.8 4)3
-5 4
39. f a random variable x has a Poisson distribution such that pix 1) pix 2)
then the variance of the distribution is :
1) 3 2) 1 3) 4 4) 2
40 f two independent random variables x and yare distributed as B 4 ) and
B 5 J then the distribution of x + Y is :
41 For a binomial distribution B n, p , then the mean is 4 and variance 3 then n is :
1) 20 (2) 16 3) 18 4) 10
42 Which distribution is the weekly number of car accidents on a stretch of road
likely to follow?
1) Geometric distribution 2) Normal distribution
3) Poisson distribution 4) Binomial distribution
43 The mode of the geometric distribution ~ ) X for x = I, 2, ..... is :
1) 0 2) 12
7)
3) 23
4) 1
P.T.O.
A laSem Admi

8/12/2019 Bhu Pet 2011 m.sc. Health Stat
http://slidepdf.com/reader/full/bhu-pet-2011-msc-health-stat 9/31
llP1211131
44. f - N fl, T2), the maximum probability at tlie point of inflexion of normal
distribution:
11 -
1) -- e2
.j2X
11 -
2) e 2.j2X
13) 1 e 2
u.j2X4) _ _
.j2X
45. The probability mass function for the negative binomial distribution with
parameters rand p is :
1) ] _l)X p q
3) [) p _q)X
2) XH-I) p q
r I
4) all ofthe above
46. A random variable takes values 2, 1, 0 with probabilities u, 2a and 1 - 3a). fE x) ; 1, then the value of a is :
1) . .4
2) 1
2
3) 34
4) 1
3
47. For an exponential distribution with probability density function
x); 1/2)e-x/ 2 ; x<:O;itsrneanandvarianceare:
1) G,2 2) 2, 4) 3) 2, 4) G
48. A random variable has uniform distribution over the interval [-I 3]. Thisdistribution has variance equal to :
1) 85
2) 43
8 )
3) 134
4) 92
A laSem Admi

8/12/2019 Bhu Pet 2011 m.sc. Health Stat
http://slidepdf.com/reader/full/bhu-pet-2011-msc-health-stat 10/31
llP1211 31
49 be two independent gamma random variables. Then xlx X2
has:
1) gamma distribution 2) beta distribution
3) normal distribution 4) F-distribution
50. If the joint probability density function of x and Y, is f(x, y) = 3 - x - y for
a: ; x I, 0 y s; 1, then the marginal distribution of y is :
51) Y(Y)=2-
52) fy(Y)=Y- z 3) f y(y)=3-y 4) fy Y) = 3
51 f and yare two random variables having joint probability density function:
1f (x ,y)=-(6-x-y) ; 0<x<2, 2<y<4
8
0, otherwise
Thenp(x < l lY < 3) is:
1) .: .8
2) 524
3) 940
4) 35
52 or the normal distribution, the quartile deviation, the mean deviation and
standard deviation are approximately:
53.
1) ~ ~ : 13 5
3) 10 : 12 : 15 4) 2 : 3 : 3
Given the joint probability mass function
x =1, 2, 3; Y =1, ; the p x = 3) is equal to:
1) ~9
2) 37
9 )
3) 49
x+yof x and y be f x , y ) =- - ;21
4) 47
P.T.O.
A laSem Admi

8/12/2019 Bhu Pet 2011 m.sc. Health Stat
http://slidepdf.com/reader/full/bhu-pet-2011-msc-health-stat 11/31
P 2 3
54 Given the joint probability density function of and y as,
fix y = 4xy, 0 x < 1, 0 Y < 1
0, otherwise
1) 316
2) 38
3) 516
55. The probability of Type I error is the chance of :
1) rejecting the null hypothesis when it is true
2) not rejecting the null hypothesis when it is true
3) rejecting the null hypothesis when it is false
4) accepting the null hypothesis when it is false
4) 14
56 Assuming all other relevant factors remain constant, the power of a test:
1) decreases as the size of the sample increases
2) increases as the variability of the observations decreases
3) increases as the significance level decreases
4) is the chance of rejecting the null hypothesis when it is true
57 To test the randomness of a sample, the appropriate test is:
1) edian test 2) Sign test 3) Run test 4) None of these
58 Most of the non-parametric methods utilise measurements on :
1) interval scale 2) ratio scale 3) ordinal scale 4) nominal scale
10
A laSem Admi

8/12/2019 Bhu Pet 2011 m.sc. Health Stat
http://slidepdf.com/reader/full/bhu-pet-2011-msc-health-stat 12/31
59 Ordinary sign test utilises:
1) Poisson distribution
3) Geometric distribution
11P/211131
2) Binomial distribution
4)Negative
Binomialdistribution
60 f there are 10 symbols of two types equal in number the minimum possible
number of runs is :
1) 8 2) 9 3) 10 4) none of these
61 A test based on a test statistic is classified as :
1) randomised test
3) sequential test
2) non-randomised test
4) Bayes test
62 The standard error of an estimator t of the parameter e s :
1) E t)-9 (2) V,, t) 3) ,JV,,(t) (4) ,JVar(t) IIL<t)
63 f E statistic) = Parameter then statistic is said to be:
1) positively biased estimate
3) an unbiased estimate
2) negatively biased estimate
4) none of these
64 The standard error of observed sample proportion 'p' is :
1) PQ (2) ,JPQ 3) PQ
Jii(4) t;
65 n usual notations the test statistic for testing the significance of population
correlation coefficient p = 0, is :
1) tr,J n-2)
r2)
r ~ I - r 2 )2) t= ,J n-2)
11 )
4) t= r l - r )
,J(n -2)
P.T.O.
A laSem Admi

8/12/2019 Bhu Pet 2011 m.sc. Health Stat
http://slidepdf.com/reader/full/bhu-pet-2011-msc-health-stat 13/31
llP1211131
66 Two different companies manufacture light bulbs and B respectively. Each
company claims that its bulbs are superior to that of the other. To test the
superiority of the bulbs or B the null hypothesis would be :
1) there is a difference between the two bulbs
2) there is no difference between the lives of two bulbs
3) there is no difference between the two bulbs
4) there is a difference between the lives of two bulbs
67. Let (Xl, Yl), (x2 Y2),····.,(x n, Yn) be a random sample from a bivariate
normal population B N ( ~ l / l2 lui IuiI ), Fisher z transformation used is :
(1) 11 r
2) 11 rz ~ l o g l O ~ z l o g e ~
2 l r 2 l r
3)1 l r
(4)1 l rz l o g e ~ z ~ l o g l O ~
2 1 r 2 1 r
68 Formula for X2
chi-square) for testing a null hypothesis in a multinomial
distribution with usual notations is :
1) Z2
±Oi -Ei)2
i =1 E j
2 k (0_E·)2(3) Z L ,
1=1 O
69. The two sample t-test :
1) may also be called the paired t-test
4) Z2 ±Oi Ei Ji 1 0
2) is an alternative test to the wilcoxon signed ranks test
3) is appropriate when our aim is to compare the medians in two independent
groups of observations
4) assumes that the observations in each of the two comparative groups have
the same variance
12 )
A laSem Admi

8/12/2019 Bhu Pet 2011 m.sc. Health Stat
http://slidepdf.com/reader/full/bhu-pet-2011-msc-health-stat 14/31
11P1211131
70. We use the Chi-square test to compare two proportions in a 2 x 2 contingency
table provided that:
(1) there is no association between the factors that define the rows and
columns of the table2) the observed frequency in each cell of the table is greater than or equal to 5
(3) the rows and columns) of the table are mutually exclusive
(4) the observed and expected frequencies in each cell of the table are equal
71. In a test, a difference is found significant in a two-tailed test, what can you say
about the result in a one tailed test at the same level of significance:
(1) It is automatically significant in a one tailed test
2) t is definitely not significant in a one tailed test
(3) t mayor may not be significant
(4) Significance depends on the level chosen
72. Let x have normal distribution N ~ , 9). f on the basis of a random sample of
size 16, sample mean comes out to be 20, then 95 confidence interval for Jl is :
(1) (20 ± 1.23) (2) (20 ± 1.47) (3) (20 ± 3.69) (4) (20 ± 0.92)
73. The hypothesis that the normal population variance has a definite value, can be
tested by:
(1) F-test (2) Z-test (3) t-test (4) X -test
74. Samples of size n are drawn from a population of size N according to simple
random sampling without replacement (SR5WOR). Then the number of
possible samples be :
2) n(3) C
75. n a simple random sampling with replacement (SRSWR), the probability of aparticular unit being selected at the rth draw is :
1) 1 2) ~ 3) - - 4) N r)
]
( 13) P.T.O.
A laSem Admi

8/12/2019 Bhu Pet 2011 m.sc. Health Stat
http://slidepdf.com/reader/full/bhu-pet-2011-msc-health-stat 15/31
llP1211131
76. f the variances of sample mean in SRSWOR and SRSWR are respectively
VWOR and V , and e VWOR / V ) , then e is :
1) N -n)N-14) N-1)
N -n)
77. Which one of the following procedures is not based on the principle of
probability ?
1) Systematic sampling
3) Stratified sampling
2) Simple random sampling
4) Quota sampling
78. In stratified random sampling, the variance is minimum with:
1) optimum allocation 2) proportional allocation
3) equal allocation 4) allocation in middle of stratum
79. A population of 800 is divided m 3 strata their sizes and standard
deviations (s. d.) are:
Strata
I
siz 200 300 300
s. d. 6 8 12
A stratified sample of size 120 is to be drawn from the population. The size of
the sample from second stratum, by Neyman s allocation is:
1) 45 2) 35
80. Non sampling error arises in :
1) sampling
3) estimator
3) 5 4) 40
(2) complete enumeration
4) 1) and 2) both
81. Advantages of sampling over complete enumeration is :
1) only less time
3) only reduced cost
4 )
2) only less man power
4) all olthese
A laSem Admi
8/12/2019 Bhu Pet 2011 m.sc. Health Stat
http://slidepdf.com/reader/full/bhu-pet-2011-msc-health-stat 16/31
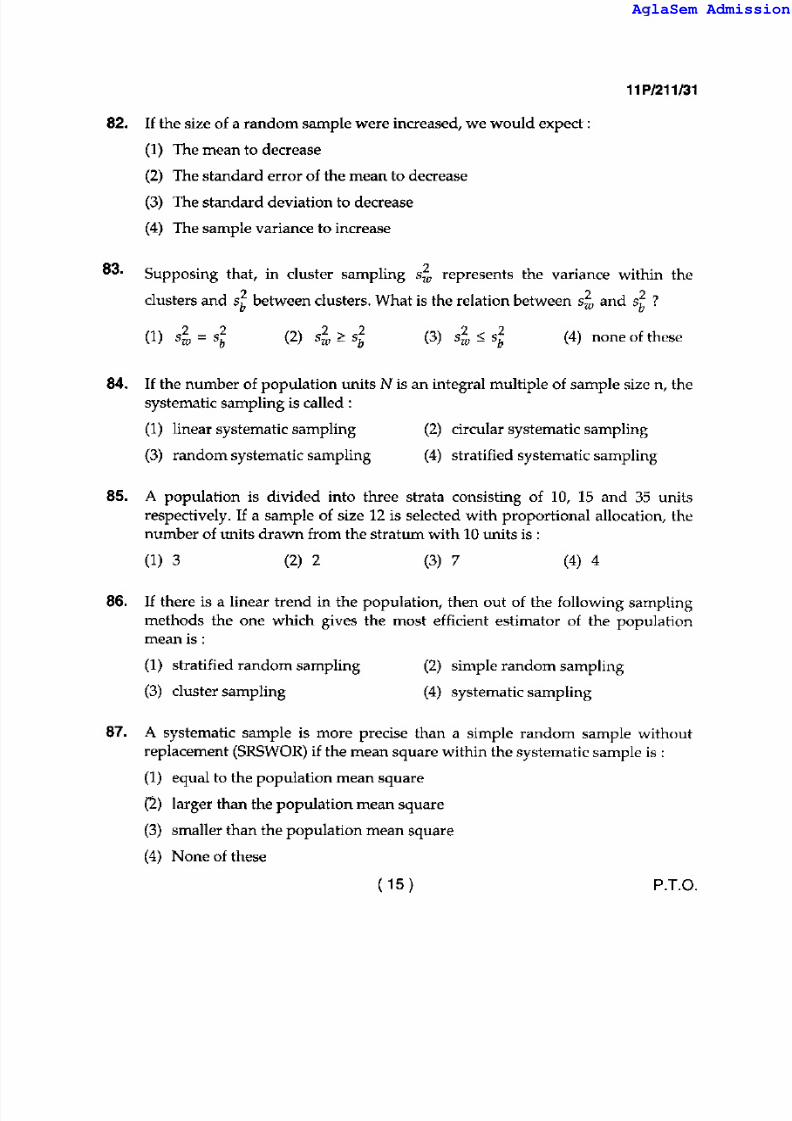
82 f the size of a random sample were increased, we would expect :
1) The mean to decrease
2) The standard error of the mean to decrease
3) The standard deviation to decrease
4) The sample variance to increase
11P1211131
83 Supposing that, in cluster sampling s represents the variance within the
clusters and between clusters. What is the relation between ~ and ?
2 21) w = s 2) 4) none of these
84 f the number of population units N is an integral multiple of sample size n, the
systematic sampling is called:
1) linear systematic sampling
3) random systematic sampling
2) circular systematic sampling
4) stratified systematic sampling
85 A population is divided into three strata consisting of 10, 15 and 35 units
respectively. f a sample of size 12 is selected with proportional allocation, the
number of units drawn from the stratum with 10 units is :
1) 3 2) 2 3) 7 4) 4
86 f there is a linear trend in the population then out of the following sampling
methods the one which gives the most effIcient estimator of the population
mean is:
1) stratified random sampling
3) cluster sampling
2) simple random sampling
4) systematic sampling
87 A systematic sample is more precise than a simple random sample without
replacement SRSWOR) if the mean square within the systematic sample is :
1) equal to the population mea n square
2) larger than the population mean square
3) smaller than the population mean square
4) None of these
15 ) P.T.O.
A laSem Admi

8/12/2019 Bhu Pet 2011 m.sc. Health Stat
http://slidepdf.com/reader/full/bhu-pet-2011-msc-health-stat 17/31
llP1211131
88 The variance of stratified random sample mean st under proportional
allocation is :
1 1 k 23) L Wi 5i
n N i=
2) l. [± Wi 5i J2 ~ ± i 5?Jn i=1 N i=1
4) ( . - ~ ) W252
nN . L . . J=
Where notations have their usual meanings.
89 The relative efficiency of the estimate of the population mean in systematic
sampling over SRSWOR is :
1)N-l ) [ l+ n- l )p ]
n 2) N - I
N-n) [ l+ n- I )p ]
3) k n- l )
nk-l) [ l+ n- l )p]
n k - I
4) N-I)[ I+ n- l )p]
Where k is the sampling interval. p is the intraclass correlation coefficient
between the units of the same systematic sample and other notations have their
usual meanings.
90 In a Latin square design, the number of replicates and the number of
treatments:
1) must be equal 2) former is smaller than the latter
3) former is greater than the latter 4) should not be equal
91 If the degrees of freedom of sum of squares due error in a Latin square design
is 6, the number of rows is :
1) 6 2) 4 3) 8 4) 1
16 )
A laSem Admi

8/12/2019 Bhu Pet 2011 m.sc. Health Stat
http://slidepdf.com/reader/full/bhu-pet-2011-msc-health-stat 18/31
P 2 3
92 In a two-way classification with one observation per cell, there are 4 rows
and 3 columns. The degrees of freedom for the F test for testing equality of all
row means are:
1) 3,6) 2) 4,6) 3) 6,3) 4) 6,4)
93 In a completely randomized design, there are 15 plots and 3 treatments. The
degrees of freedom associated with error sum of squares is :
1) 10 2) 12 3) 4 4) 6
94 In the layout of randomized block design with seven treatments, each
replicated five times, the needed 35 units will be grouped into:
1) 35 blocks of one plot each 2) 7 blocks of 5 plots
3) 5 blocks of 7 plots 4) None ofthese
95 One step of sample survey is not:
1) To form questionnair 2) To collect data
3) To prepare report 4) To generate electricity
96The method of confounding is a device to reduce the size of :
1) experiments 2) replications 3) blocks
97 A systematic sample does not yield good result i f :
1) Variation in units is periodic
2) Units at regular interval are correlated
3) Both 1) and 2)
4) Neither 1) nor 2)
98 Local control is used to :
4) all of the above
1) increase the number of plots 2) reduce the experimental error
3) reduce the degrees of freedom 4) reduce the number of replications
17) P.T.O.
A laSem Admi

8/12/2019 Bhu Pet 2011 m.sc. Health Stat
http://slidepdf.com/reader/full/bhu-pet-2011-msc-health-stat 19/31
l1P1211131
99 n a 23 -factorial experiment the interaction effect of AB is expressed as :
1)
1
2)
1
AB =4 a -1) b-1) c +1) AB =- a-1) b-1) c-1)4
3)1
AB= 4 a-1) b+1) c-1) 4)1
AB =4 a +1) b + l) c -1)
100. Which of the following is a contrast?
1) 3Tj +T2 -3T3 +T4 2) T j +3T2 -3T3 +T4
3) Tj +T2 +T3 -T4 4) 3Tj -T2 +T3 +3T4
101. Two contrasts of k-treatment means tj i 1 2, ..... k), viz.
j=1 ;=1
are said to be orthogonal if :
k
1) Ie i di >0
j=1
k
2) Ie; di <0
i =
k
3) Ie; d i =0
;=1
4) one olthesc
102 f k effects are confounded in a 2n factorial to have k blocks of size 2n-
k
units, the number of automatically confounded effect is :
1) 2k_k 2) k k -1 ) -1 3) 2k - k - 1 4) 2k- j
18
A laSem Admi

8/12/2019 Bhu Pet 2011 m.sc. Health Stat
http://slidepdf.com/reader/full/bhu-pet-2011-msc-health-stat 20/31
llP 211 31
103. With reference to a life table which one of the following is true?
1) dx =Ix l - Ix 2)1
Lx =Ix - dx
2
3) Px = dx
Ix
4) Lx =Ix -dx
104. Gross reproduction rate GRR) is determined by :
1) Number offemale birhts x 1000
Total number of births
3) Total bir ths 1000x
Total female population
105. GRR ranges from:
1) Ot 5 2) a o 1
2) Total bir ths x1000Total population
4) Number offemale birhts x TFR
Total number of births
3) a o 3 4) Ot 4
106. If net reproduction rate NRR) is greater than unity then the population has a
tendency to :
1) decrease 2) Increase
3) remain more or less constant 4) none olthese
107. Crude Birth Rate CB.R.) usually lies between:
1) 10 and 45 per thousand 2) 8 and 55 per thousand
3) 10 and 55 per thousand 4) 11 and 65 per thousand
108. The relation between NRR and GRR is :
1) NRR can never exceed RR 2) NRR and GRR are usually equal
3) NRR is generally greater than GRR 4) one of these
19 P.T.D.
A laSem Admi

8/12/2019 Bhu Pet 2011 m.sc. Health Stat
http://slidepdf.com/reader/full/bhu-pet-2011-msc-health-stat 21/31
llP1211 31
109 A life table constructed for an age interval of 5 to 10 years is specifically
known as:
1) grouped life table
3) abridged life table
2) interval life-table
4) none olthe above
110 The total fertility rate is approximately determined y the formula:
00
1) n n Ix) 2) n n Ix)
x n=:O
00
3) n ix
i=O
4) n
111 With reference to an abridged life table, which the following is true?
112 The total age specific fertility rate taken at 5 years intervals for a group of childbearing females is 446, then the total fertility rate per thousand is :
1) 446 2) 892 3) 2676 4) 2230
113 The ratio of the number of children of age less than five years to the total
number of women 15 - 49 year age is called:
1) replacement index 2) gross reproduction rate
3) vital index 4) net reproduction rate
114 The fertility of a women in India is maximum in the age group:
1) 15-20 2) 20-24 3) 25-29 4) 15 - 29
20 )
A laSem Admi
8/12/2019 Bhu Pet 2011 m.sc. Health Stat
http://slidepdf.com/reader/full/bhu-pet-2011-msc-health-stat 22/31
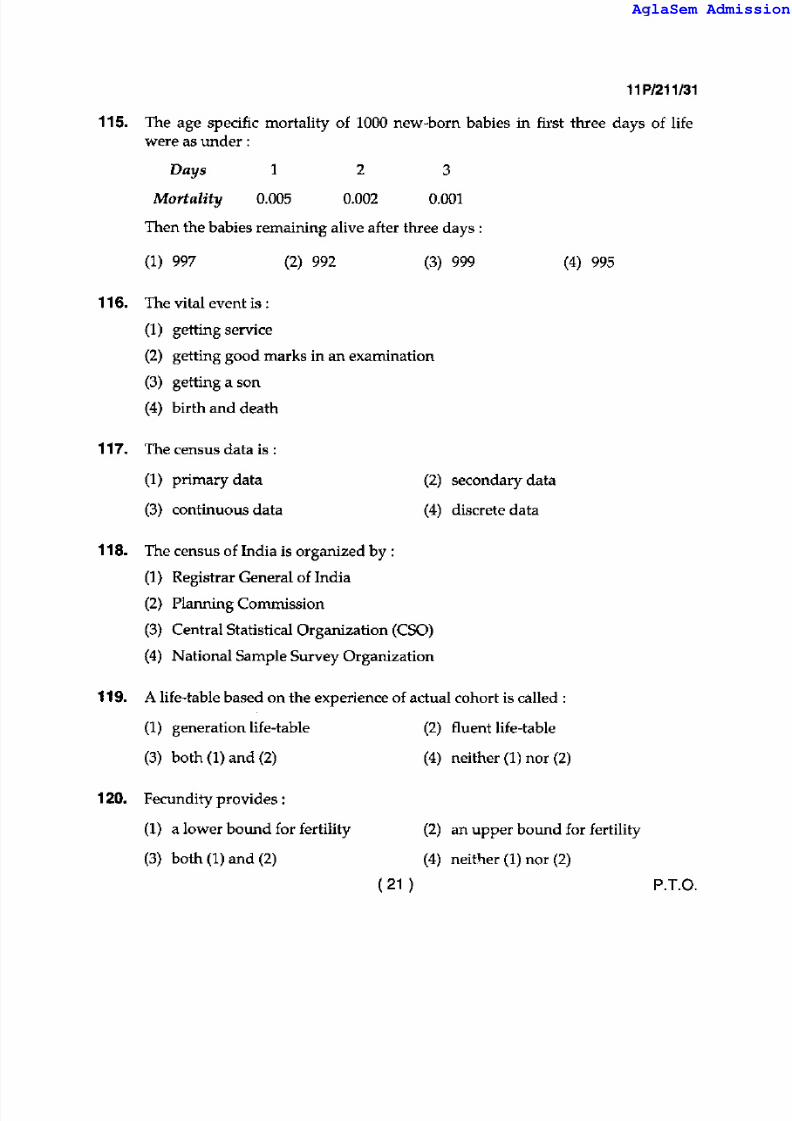
P 2 3
115. The age specific mortality of 1000 new born babies n first three days of life
were as under
ays
ortality
1
0.005
2
0.002
3
0.001
Then the babies remaining alive after three days
1) 997
116. The vital event is :
1) getting service
2) 992 3) 999
2) getting good marks in an examination
3) getting a son
4) birth and death
117. The census data is :
1) primary data
3) continuous data
118. The census of India is organized by :
1) Registrar General ofindia
2) Planning Commission
2) secondary data
4) discrete data
3) Central Statistical Organization CSO)
4) National Sample Survey Organization
4) 995
119. A life table based on the experience of actual cohort is called:
1) generation life-table
3) both 1) and 2)
120. Fecundity provides:
2) fluent life-table
4) neither 1) nor 2)
1) a lower bound for fertility 2) an upper bound for fertility
3) both 1) and 2) 4) neither 1) nor 2)
21 ) P.T.O.
A laSem Admi
8/12/2019 Bhu Pet 2011 m.sc. Health Stat
http://slidepdf.com/reader/full/bhu-pet-2011-msc-health-stat 23/31
P 211 31
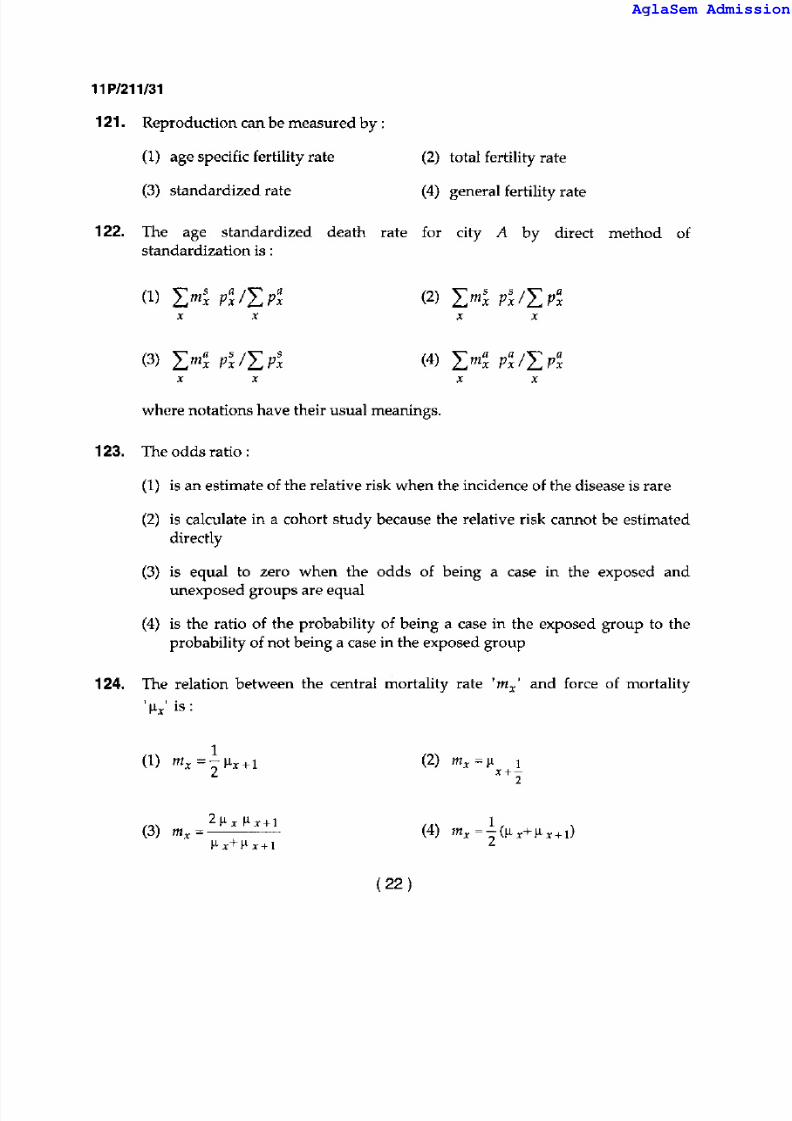
121 Reproduction can be measured y :
1) age specific fertility rate
3) standardized rate
2) total fertility rate
4) general fertility rate
122 The age standardized death rate for city A y direct method of
standardization is :
123.
1) L mi p ~ I p ~ 2) L m ~ pilL ~x x x x
3) L m ~ pilL pi 4) L m ~ P ~ L P ~x x x x
where notations have their usual meanings.
The odds ratio:
1) is an estimate of the relative risk when the incidence of the disease is rare
2) is calculate in a cohort study because the relative risk cannot be estimated
directly
3) is equal to zero when the odds of being a case in the exposed andunexposed groups are equal
4) is the ratio of the probability of being a case in the exposed group to the
probability of not being a case in the exposed group
124 The relation between the central mortality rate mx and force of mortality
Ilx is:
1
(1) mx =2I x+1
3) mx= 2J.1.xflx+l
J.l.x+J.l.x+l
22 )
2) mx 12
A laSem Admi

8/12/2019 Bhu Pet 2011 m.sc. Health Stat
http://slidepdf.com/reader/full/bhu-pet-2011-msc-health-stat 24/31
11P 211 31
125. Having known the population o the two consecutive censuses the formula for
population estimate it in the intercensal year with usual notations is :
, N3) P, ~ P +- P , -PO
, N2) P, ~ P, +- P , -PO
, N4) P, ~ P o + - PO-PI
126. Let U, follow Logistic law. Then the reciprocal of U, will follow:
1) Gornpertz law 2) Modified exponential law
3) Poisson law 4) Negative Binomial law
127. The relation between the operators f:j and E is :
1) E +Ll 2) E Ll 4) Ll 1E
128. f the third difference o a tabulated function is constant the function is a
polynomial of degree
1) three 2) two 3) five 4) four
129. The Newton - Gregory backward interpolation formula is generally used to
interpolate the values:
1) at the end of a set of a table
2) near the beginning of a set of table values
3) in the middle of a set of a table values
4) anywhere in the set of table values
23 ) P.T.C.
A laSem Admi

8/12/2019 Bhu Pet 2011 m.sc. Health Stat
http://slidepdf.com/reader/full/bhu-pet-2011-msc-health-stat 25/31
llP/211131
130 The polynomial of first degree:
1) is not a polynomial
3) can be any shape
131 For the given data:
x 2 o 3
fix 4 o 9
fix is the degree of polynomial:
1) three degrees 2) two degrees
132. Divided differences are useful when:
1) arguments are equally spaced
2) arguments are not equally spaced.
5
2) is a straight line
4) None ofthese
1
25 1
3) five degrees
3) arguments advance with unit interval
4) all of the above
133. Newton s method of divided differences is preferred when:
(1) the arguments are not equally spaced
4) four degrees
2) when the interpolating value of the argument lies in the upper half of the
series
3) both 1) and 2)
4) none of 1) and 2)
134. Simpson s 1 3rd and Simpson s 3 8th rules are used for:
1) interpolation (2) numerical differentiation
(3) numerical integration (4) inverse interpolation
24
A laSem Admi

8/12/2019 Bhu Pet 2011 m.sc. Health Stat
http://slidepdf.com/reader/full/bhu-pet-2011-msc-health-stat 26/31
P1211 31
135 Bessel s and Stirling s interpolation formulae yield good estimates if the values
of u and v in general lie between:
1) -1 and +1 2) -0.5 and 1 3) -0.5 and 0.5 4) oand 1
where and v have their usual meanings.
136. Trapezoidal rule gives the exact value for integral only if the function is :
1) a polynomial of degree four
3) quadratic
137. Simpson s rule requires:
1) an odd number of points
3) both 1) and 2)
2) cubic
4) linear
2) even number of points
4) neither 1) nor 2)
138 f (n 1) pairs of arguments and entries are given, Lagrange s formula is :
1) a polynomial of degree in y
2) a polynomial of degree in x
3) a polynomial in x in which each term has degree
4) a polynomial with highest degree 1
139. Mean square error (MSE) of an estimator t of the parameter e s :
1) E[I_E I)]2 2) E 1)-9)2
4) [E {t-E I)}2 - E I)-9 )2]
140 If t is an unbiased and consistent estimator of S, then t
as an estimate of z is:
1) unbiased and consistent 2) biased and consistent
3) unbiased and inconsistent 4) biased and inconsistent
25) P T O
A laSem Admi

8/12/2019 Bhu Pet 2011 m.sc. Health Stat
http://slidepdf.com/reader/full/bhu-pet-2011-msc-health-stat 27/31
11P 211 31
141 For the probability density function
estimator of 8 is :
1) X1
2) X
1f x, 9) ~ - 0 < x < e an unbiased
9
3) 2X 4) 2X
142 Suppose that Tl and T are two unbiased estimators of S f Tl is the minimum
variance unbiased estimator and e is the efficiency of T2 the correlation
coefficient between Tl and T is :
1) ... ..Je
2)1
3) 4) e
143 Out of the following the one which is not a method of point estimation is :
1) Method of maximum likelihood 2) Method of least squares
4) Method of Invariance3) Method of moments
144 f XII X2 ..... Xn is a random sample from the population having the
probability den function
1 x2 Jx ; 9 ) ~ r ;;;oexp,,2n9 29
then the maximum likelihood estimator for e s :
2) f n 4)
145. A minimum variance unbiased estimator Tn is said to be unique if for any
•other estimator Tn :
3) both 1) and 2) 4) neither 1) nor 2)
26 )
A laSem Admi

8/12/2019 Bhu Pet 2011 m.sc. Health Stat
http://slidepdf.com/reader/full/bhu-pet-2011-msc-health-stat 28/31
llP1211131
146 f A is the likelihood ratio test statistic, then the asymptotic distribution of
which one of the following statistic is 1 2 -distribution?
1) log; l.
147 Under certain assumptions/likelihood ratio test is:
1) Efficient 2) Unbiased 3) Consistent
14) loge-yl.
4) Sufficient
148 Let xl, X2, ..... xn denote a random sample of SIze n from a uniform
population with probability density function:
j x,8)=1;
The maximum likelihood estimator for e is the statistic t = t xl, X2, ..... xn
such that:
1 1(2) x(n) - 2 < t xJ, x2, ..... xn )< X J) 2
Where X(1), X(2) ..... x n) is the ordered sample Le. x l) < x 2) < < x(n»
27) P.T.O.
A laSem Admi

8/12/2019 Bhu Pet 2011 m.sc. Health Stat
http://slidepdf.com/reader/full/bhu-pet-2011-msc-health-stat 29/31
11P1211131
149 In the case of Pearson s Type III distribution
xo - 1e x , O:Sx<oo
The estimates of a and pobtained by the method of moments are:
_- c:n-, ~ _( )2 t n 1
(2) u
(4) ( , -1u = m ,- n 1
Where m l and m 2 are the sample moments.
150 A random sample of three observations is taken from a normal population.
Which one of the following unbiased estimators of mean has least variance?
(28 )
(3) xl +x2 3x3
5
A laSem Admi

8/12/2019 Bhu Pet 2011 m.sc. Health Stat
http://slidepdf.com/reader/full/bhu-pet-2011-msc-health-stat 30/31
1 W'l gFtti '" , Ji1c;ri'r <f; 10 fi'Ac <f; 3R; ' [ t\ ~ <'r ~ ",., ~ i j 1'" ~ 3l'R ~W'l WI 'fift ~ I gFtti "l"gtt> qri) "G T"t 'N 'J:'AT <""'1<'1 "'Ii f."Ii'tIifif> <n'r
WTf , . , q ~ q\j gFtti = c' I
2 ' f 'R i j ~ ' 0 f I / ; f . wm.fT'5f 81R1Riffl. 'IT 'RTGT ~ >fT WIT it., c;rrit I
3 """ . ' f5I 3lO 'T ft 1J'lT ~ I .-& "f fit # ail< " f iIt <tR'1 'f:/ffl iffl'{.fT'5f f iIt
u f l ' l ~ / I i'l'ffi'.fT'5f 'fiT iIt 'l. ' 0'1 fWzrr utdllJll
4 3 <Rr 3ijili ' fiili ff'Tf i'l'ffi'.fT'5f 'fiT Jr'l'1 31TlffUI''['i'f W <R <t f.lmfu 'N
~ I5 i'l'ffi'.fT'5f Jr'l'1 '['i'f w <R <t 3IV'fI8I:J ''fiili f.)EffRd W dill/ oft<t ~ '[ff'f
<tit 7JT' T i i i ' ( <f I unii'. unii' 81/4,qili ilt 45 f JI'l'1'Sffflili/ 'fiT ff'Tf <tc 'fiT f ' i I ' (
Oftra <IllT'fl' w I
6 mo 'f'lo 3jRo 'f5I 'N 3ijll> ;' ~ W'l.gFtti , , q ire ('1ft ~ til) om
W'l'gFtti 'N < l1"'";'" 3l'R mo 'f'lo 3jRo 'f5I q\j F i 1 ~ , , ) i j '3qRokH q\j
'fift ~7 '3Q4<tt1 F i 1 ~ , , ) i j oj) Q R q ~ "",Ii f."Ii'tIifif> l l ff i ,fO,,, til'IT " Tf%it 3f'<l'lT ' l l ' 1f'"
if>T l 'irr ' AT I
8 W'l.gFtti '" , i j woIq;- W'l <f; " f f i I l ; ~",nf8q;mn", ~ ' 1'1 'I I JIfllq, JT< f 4 i 1 i ~ i I i iffl '{
fWt 3II'l'Iff iffl'{.fT'5f qIt .,><t(.tld rffirrr 'I1f'I"l" ' ' [ f r <tit iffl'{.fT'5f JT'l'1 '['i'f W~ . lWj' <R <t 7JT' T q ;m ~ I
9. woIq;- W'l <f; <f; fW'r 1f'" t\ ' [ ff <n'r TJT<;1 <lR I 1f'" ft Wt<n ~ <n'r TJT<;1 m'N = 1f'" '[ff <n'r l:'i 'IR"\ 'N 'f5 'TR<f ' AT I
10 fSlTT'f <f fit;- ' iii" 'ffl" 'fllTIft 'UI<T 3ffiI;a iffl'{ f iIt U/I WIfflT ~ I '1ft 3 T'l fil><fr W'l
if>T iffl '{ f iIt <t fr t. <it <f; ~ ' 1'1 ~ ~ <n'r ' I~ lWlT'N 3iif> ~ ~11 'I'l> if>TIt <f; fW'r ~ gFtti <f; ~ . . <f; 3/'G{ 'ITOIl 1'" om 1'" if>T l 'irr
<lR1
12 'litliff <f; q , 8 l'o ,<,,0 :m<o iffl'{.fT'5f t\ ' f 'R i j "f'iT <lR I
13 'litliff 'ff'lT'<f oFf ft ' f 'R ft 0fT0'{ "G T"t q\j 'fift til1f\ I
14 '1ft ~ i j if>T l 'irr "" '" t <it 'f5 filFi1r><,qmFi1t-.: '<1rnl1 l l ff i f.lmfu
~ if>T / q\j 'Wft ;;Frr / til1f\ I
A laSem Admi

8/12/2019 Bhu Pet 2011 m.sc. Health Stat
http://slidepdf.com/reader/full/bhu-pet-2011-msc-health-stat 31/31
BHU PET Previous Year Question Papers
For All PET Previous Year Question Papers
Click Here