bi-annual economic and capacity survey...cesa bi-annual economic and capacity survey: january –...
TRANSCRIPT

Bi-Annual Economic and Capacity Survey
January - June 2015
Published by The Consulting Engineers South Africa (CESA)
September 2015
Report prepared by
Industry Insight CC
www.industryinsight.co.za
CESA Bi-annual economic and capacity survey: January – June 2015
Page 2 of 48
Table of contents: 1. Economic overview .............................................................................................................................................................. 3
1.1 International Developments .......................................................................................................................................... 3 How are these global phenomena going to affect South Africa? ...................................................................................... 4
New Development Bank (BRICS Development Bank) a catalyst for infrastructure development? ........................................... 4
1.2 Domestic Economy ........................................................................................................................................................ 5 1.4 Gross fixed capital formation ......................................................................................................................................... 8
2. CESA Survey: Background .................................................................................................................................................... 10
3. Prevailing conditions in the Consulting Engineering Industry ............................................................................................. 10
3.1 Financial Indicators ...................................................................................................................................................... 10 3.1.2 Outsourcing ............................................................................................................................................................ 12 3.1.3 Return on Working Capital ..................................................................................................................................... 13 3.1.4 Value of outstanding payments .............................................................................................................................. 13 3.1.5 Profitability and late payments .............................................................................................................................. 14
3.2 Human Resources ........................................................................................................................................................ 15 3.2.1 Employment ........................................................................................................................................................... 15 3.2.2 Salary and Wage bill ............................................................................................................................................... 16 3.2.3 Training ................................................................................................................................................................... 16 3.2.4 Employment profile ................................................................................................................................................ 17
3.3 Industry profile of Executive Staff ................................................................................................................................ 18 3.4 Capacity Utilisation ...................................................................................................................................................... 18 19 3.5 Competition in tendering ............................................................................................................................................. 19 3.6 Pricing .......................................................................................................................................................................... 20
4. Industry Outlook ................................................................................................................................................................. 22
5. Industry challenges as noted by respondents ..................................................................................................................... 25
6. Market Profile ...................................................................................................................................................................... 26
6.1 Sub-disciplines of fee income earned .......................................................................................................................... 26 6.2 Economic Sectors ......................................................................................................................................................... 26 6.3 Geographic Location .................................................................................................................................................... 27 6.4 Clients .......................................................................................................................................................................... 28
7. Professional Indemnity Insurance ....................................................................................................................................... 29
8. Quality Management System .............................................................................................................................................. 30
Statistical Tables ...................................................................................................................................................................... 31
CESA Bi-annual economic and capacity survey: January – June 2015
Page 3 of 48
1. Economic overview 1.1 International Developments
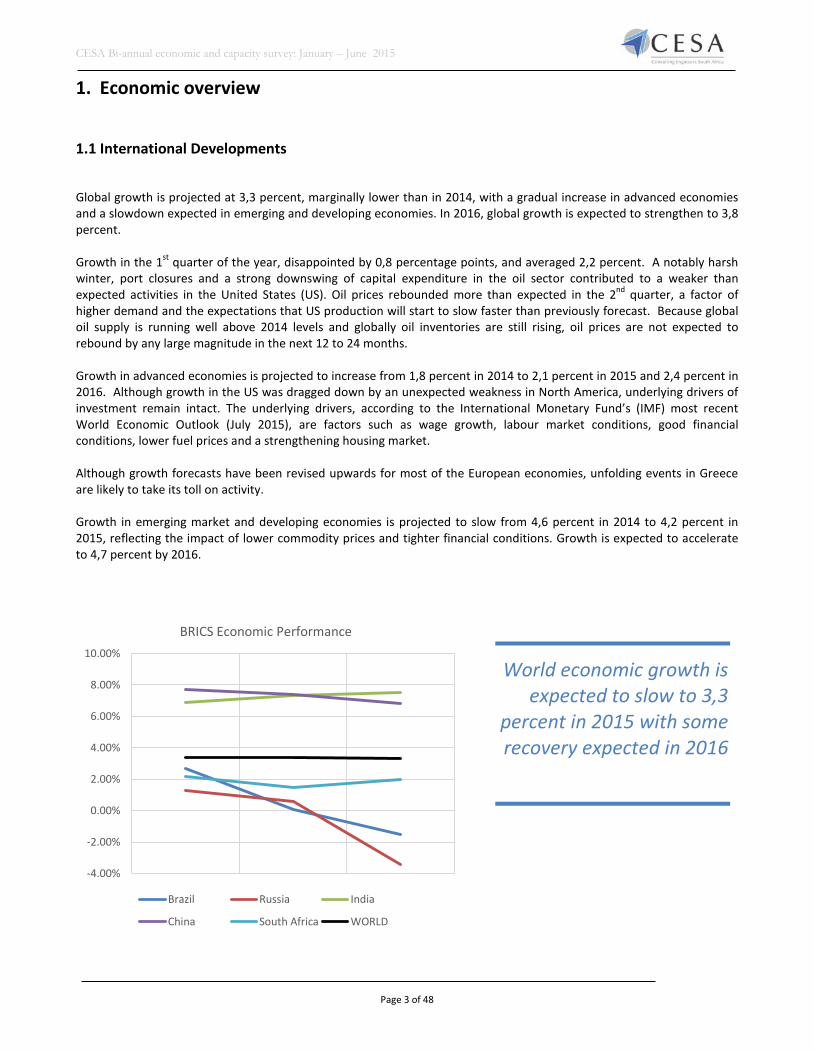
Global growth is projected at 3,3 percent, marginally lower than in 2014, with a gradual increase in advanced economies and a slowdown expected in emerging and developing economies. In 2016, global growth is expected to strengthen to 3,8 percent. Growth in the 1st quarter of the year, disappointed by 0,8 percentage points, and averaged 2,2 percent. A notably harsh winter, port closures and a strong downswing of capital expenditure in the oil sector contributed to a weaker than expected activities in the United States (US). Oil prices rebounded more than expected in the 2nd quarter, a factor of higher demand and the expectations that US production will start to slow faster than previously forecast. Because global oil supply is running well above 2014 levels and globally oil inventories are still rising, oil prices are not expected to rebound by any large magnitude in the next 12 to 24 months. Growth in advanced economies is projected to increase from 1,8 percent in 2014 to 2,1 percent in 2015 and 2,4 percent in 2016. Although growth in the US was dragged down by an unexpected weakness in North America, underlying drivers of investment remain intact. The underlying drivers, according to the International Monetary Fund’s (IMF) most recent World Economic Outlook (July 2015), are factors such as wage growth, labour market conditions, good financial conditions, lower fuel prices and a strengthening housing market. Although growth forecasts have been revised upwards for most of the European economies, unfolding events in Greece are likely to take its toll on activity. Growth in emerging market and developing economies is projected to slow from 4,6 percent in 2014 to 4,2 percent in 2015, reflecting the impact of lower commodity prices and tighter financial conditions. Growth is expected to accelerate to 4,7 percent by 2016.
-4.00%
-2.00%
0.00%
2.00%
4.00%
6.00%
8.00%
10.00%
BRICS Economic Performance
Brazil Russia India
China South Africa WORLD
World economic growth is expected to slow to 3,3
percent in 2015 with some recovery expected in 2016
CESA Bi-annual economic and capacity survey: January – June 2015
Page 4 of 48
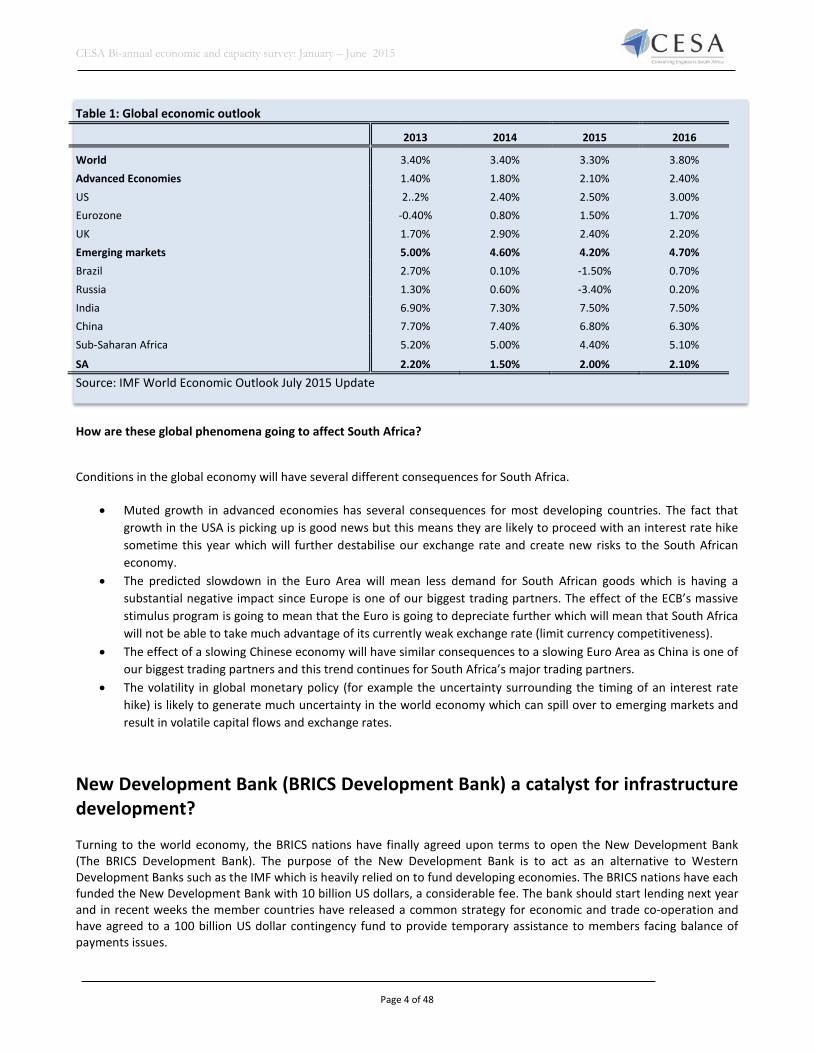
Table 1: Global economic outlook
2013 2014 2015 2016
World 3.40% 3.40% 3.30% 3.80% Advanced Economies 1.40% 1.80% 2.10% 2.40% US 2..2% 2.40% 2.50% 3.00% Eurozone -0.40% 0.80% 1.50% 1.70% UK 1.70% 2.90% 2.40% 2.20% Emerging markets 5.00% 4.60% 4.20% 4.70% Brazil 2.70% 0.10% -1.50% 0.70% Russia 1.30% 0.60% -3.40% 0.20% India 6.90% 7.30% 7.50% 7.50% China 7.70% 7.40% 6.80% 6.30% Sub-Saharan Africa 5.20% 5.00% 4.40% 5.10%
SA 2.20% 1.50% 2.00% 2.10% Source: IMF World Economic Outlook July 2015 Update How are these global phenomena going to affect South Africa?
Conditions in the global economy will have several different consequences for South Africa.
• Muted growth in advanced economies has several consequences for most developing countries. The fact that growth in the USA is picking up is good news but this means they are likely to proceed with an interest rate hike sometime this year which will further destabilise our exchange rate and create new risks to the South African economy.
• The predicted slowdown in the Euro Area will mean less demand for South African goods which is having a substantial negative impact since Europe is one of our biggest trading partners. The effect of the ECB’s massive stimulus program is going to mean that the Euro is going to depreciate further which will mean that South Africa will not be able to take much advantage of its currently weak exchange rate (limit currency competitiveness).
• The effect of a slowing Chinese economy will have similar consequences to a slowing Euro Area as China is one of our biggest trading partners and this trend continues for South Africa’s major trading partners.
• The volatility in global monetary policy (for example the uncertainty surrounding the timing of an interest rate hike) is likely to generate much uncertainty in the world economy which can spill over to emerging markets and result in volatile capital flows and exchange rates.
New Development Bank (BRICS Development Bank) a catalyst for infrastructure development? Turning to the world economy, the BRICS nations have finally agreed upon terms to open the New Development Bank (The BRICS Development Bank). The purpose of the New Development Bank is to act as an alternative to Western Development Banks such as the IMF which is heavily relied on to fund developing economies. The BRICS nations have each funded the New Development Bank with 10 billion US dollars, a considerable fee. The bank should start lending next year and in recent weeks the member countries have released a common strategy for economic and trade co-operation and have agreed to a 100 billion US dollar contingency fund to provide temporary assistance to members facing balance of payments issues.
CESA Bi-annual economic and capacity survey: January – June 2015
Page 5 of 48
The BRICS nations have however been facing several economic headwinds, and many economists would consider the BRICS nations broken. Brazil’s output is stagnating and faces several corruption charges on the highest level, their economy is in bad shape. Russia is in a recession owing mainly to sanctions as well as self-imposed sanctions on imports of several vital products from the US as well as the EU creating a food shortage and driving up prices. India is having issues with high levels of public debt as well as a drastically depreciating currency (similar to South Africa). China experienced growth of 7,4 percent last year which is the lowest in 24 years, thus the economy is clearly slowing. And of course South Africa’s growth too has been weak, with supply side constraints hitting the economy hard. It is clear that the winners of the last decade will most certainly not be winners in this decade. Attention is now being turned away from the BRICS economies to what is called the MINT economies, being Mexico, Indonesia, Nigeria and Turkey. BRICS economies remain an economic force to be reckoned with, accounting for 25,7 percent of world GDP, 42 percent of the global population and 17 percent of total trade. The BRICS countries attract more than 18 percent of the global total of foreign investment, hold 40 percent of all foreign-exchange reserves, and account for 30 percent of total foreign holdings of US Treasury bonds. BRICS consumption markets are worth more than $4 trillion, equivalent to those of the Eurozone. And, according to Goldman Sachs, about 85 percent of the world’s middle class will be living in BRICS and other developing countries by 2030. These statistics however are all due to the size of the Chinese economy, with the other countries coming nowhere close to the size of China’s economy. Economists are worried about this New Development Bank that South Africa has contributed 10 billion US dollars to, in that it is difficult to see the direct benefit that South Africa will get out of contributing such a large amount of tax payers money. The bank was largely opened to in a bid to strengthen China’s ability to offer developing countries further economic support and help the development of other developing and emerging markets. It is also clear that the Chinese government has been leading the discussion, and some analysts offer the opinion that China have been bullying the rest of the BRICS nations to some degree. It is thus difficult to gauge exactly what effect the new BRICS bank will have on the South African economy and the development of local infrastructure projects. If we were to speculate, we would say that the New Development Bank would have very little impact on local infrastructure development in the short term. It seems that it will benefit other African economies who are suffering from serious infrastructure bottlenecks more directly. 1.2 Domestic Economy The South African economy slowed to 1,3 percent in the 1st quarter of 2015, from 4,1 percent in the last quarter of 2014, weighed down by a contracting manufacturing sector. The mild expansion was largely driven by a somewhat robust recovery of 10,2 percent in the mining and quarrying industry. If it is considered, however, that this was merely a statistical base effect following the five month strike action that hit the platinum industry last year, the outlook for the economy is somewhat bleaker. These findings suggest that the South African economy still has very little underlying momentum, and considering the negative impact of the current energy supply constraints that had a more profound impact on the economy this year, economic growth in 2015 is likely to be on par (at best) compared to 2014. This outlook may be more pessimistic in comparison to some forecasts, but considering the weak performance in key indicators in the first six months of the year, it may be a more realistic view. The main economic constraints include:
• Energy supply constraints and the broad based impact on economy, manufacturing and consumer and investor sentiment. In February 2015, the Minister of Finance warned that energy disruptions could shed 1,0 percent off of GDP growth this year.
• Current account deficit accompanied by the trade deficit put significant pressure on government to either cut spending or increase taxes. Attempts to improve exports has failed in light of the weak global demand and weaker performance by SA’s main trading partners, including China and the Eurozone.
CESA Bi-annual economic and capacity survey: January – June 2015
Page 6 of 48
• Further downgrades by international credit ratings on the country as a whole as well as state-owned enterprises (SOE) will have a profound impact on borrowing costs, limit international investment, while resulting in potentially significant capital outflows. This will in turn weaken the currency and add inflationary pressure to an already increasing inflation rate.
• Lately, policy amendments have been criticised for being poorly formulated, with little awareness to the broader consequences. These range from amendments to VISA regulations, foreign ownership in terms of both companies as well as properties. There is a perception that the government implements policy amendments with little regard to the impact and this leads to unnecessary high levels of uncertainty.
• Fraud and corruption has become a South African trade mark with no solution in sight in spite of government’s many promises to address corruption. Corruption is reaching unmanageable levels, from corrupt police officers, school principals, to shoddy workmanship on public sector contracts. While the private sector is quickly punished for being corrupt and isolated from future government work through the government’s supplier’s database, government officials are seemingly not being held accountable.
On the upside, there are a few considerations worth mentioning:
• While affecting the outlook for government infrastructure spending, the steps taken by government to re-balance the economy could have a positive spin off the long term if the real issues are effectively addressed. If government cut spending on infrastructure but not address wasteful expenditure and corruption, the current account deficit may not show an improvement, which means the steps taken were not effective.
• The launch of the BRICS Development Bank this year, is a viable alternative avenue for SOE’s in SA to apply for finance in order to address the much needed further development of critical infrastructure. Eskom has already eluded to using this option.
• The National Development Plan (NDP) has established the development pillars. Although the implementation may seem to be slow, it provides a much needed plan and clearer direction for investment in the future and government’s priorities. It is however extremely important that government remains on the path that has been mapped out by the NDP, as steering away from the targets will seriously diminish government’s credibility and further weaken domestic and foreign market sentiment.
• The development of the ocean economy and the establishment of the special economic zones (SEZ) will redefine spatial integration, unlock much needed economic potential in neglected areas, improve job creation and support stronger economic growth.
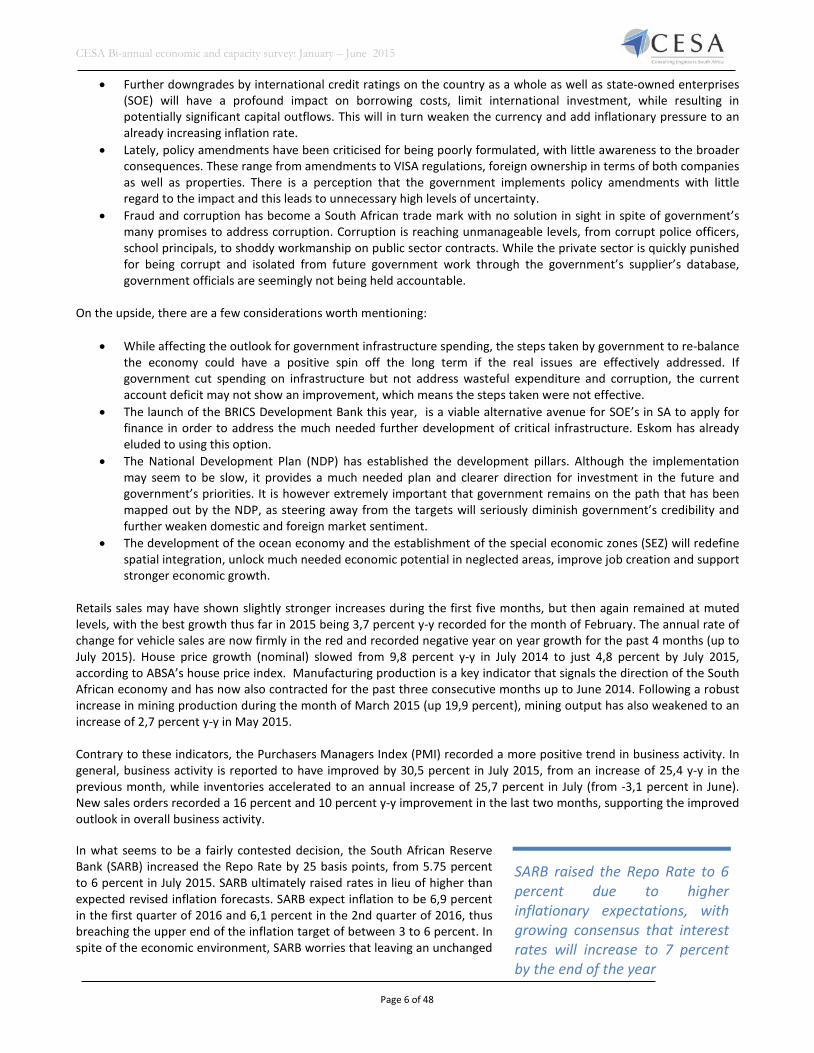
Retails sales may have shown slightly stronger increases during the first five months, but then again remained at muted levels, with the best growth thus far in 2015 being 3,7 percent y-y recorded for the month of February. The annual rate of change for vehicle sales are now firmly in the red and recorded negative year on year growth for the past 4 months (up to July 2015). House price growth (nominal) slowed from 9,8 percent y-y in July 2014 to just 4,8 percent by July 2015, according to ABSA’s house price index. Manufacturing production is a key indicator that signals the direction of the South African economy and has now also contracted for the past three consecutive months up to June 2014. Following a robust increase in mining production during the month of March 2015 (up 19,9 percent), mining output has also weakened to an increase of 2,7 percent y-y in May 2015. Contrary to these indicators, the Purchasers Managers Index (PMI) recorded a more positive trend in business activity. In general, business activity is reported to have improved by 30,5 percent in July 2015, from an increase of 25,4 y-y in the previous month, while inventories accelerated to an annual increase of 25,7 percent in July (from -3,1 percent in June). New sales orders recorded a 16 percent and 10 percent y-y improvement in the last two months, supporting the improved outlook in overall business activity. In what seems to be a fairly contested decision, the South African Reserve Bank (SARB) increased the Repo Rate by 25 basis points, from 5.75 percent to 6 percent in July 2015. SARB ultimately raised rates in lieu of higher than expected revised inflation forecasts. SARB expect inflation to be 6,9 percent in the first quarter of 2016 and 6,1 percent in the 2nd quarter of 2016, thus breaching the upper end of the inflation target of between 3 to 6 percent. In spite of the economic environment, SARB worries that leaving an unchanged
SARB raised the Repo Rate to 6 percent due to higher inflationary expectations, with growing consensus that interest rates will increase to 7 percent by the end of the year
CESA Bi-annual economic and capacity survey: January – June 2015
Page 7 of 48
repo rate amidst higher inflationary expectations, it will be seen to be reneging on its agreement to target inflation – and have price stability as their sole mandate (while still giving considerable weight to growth and protecting the currency, which the bank has done for the past few years). One of the foundations underpinning the inflation targeting regime is anchoring inflation expectations (through communicating an inflation target, once that target is met for a certain time period the public will see the Reserve Bank as being credible, which will in line anchor their inflation expectations to around the targeted band of 3-6 percent and adjust their behavior accordingly). Although the inflation targeting regime has been very successful in the past as well as in a number of countries such as New Zealand (who pioneered the regime) as well as Sweden, the debate on the current inflationary target framework, which should take into consideration external factors affecting the currency as well as supply shocks (in this case energy as one example), is a longstanding one with several arguments for and against rising interest rates in such volatile and vulnerable times. Some have argued that the increase was premature and although strongly disputed by the Monitory Policy Committee (MPC), it may have been in anticipation of an imminent increase to be announced by the US Federal Reserve, which did not happen. Therefore, once the US does start to hike interest rates (whenever that may be), SARB has no choice but to impose a further rate hike, or face further inflationary pressures (and therefore higher inflationary expectations) due to currency depreciation.
0%
2%
4%
6%
8%
10%
12%
14%
Mar-02 Sep-03 Mar-05 Sep-06 Mar-08 Sep-09 Mar-11 Sep-12 Mar-14
Inflationary (CPI) expectations (BER) vs Actual QTR Average
Expectations 12-month Actual
-10.0
-5.0
0.0
5.0
10.0
15.0
20.0
25.0
-10.0
-8.0
-6.0
-4.0
-2.0
0.0
2.0
4.0
6.0
8.0
10.0
Jul-14
Aug-14
Sep-14
Oct-14
Nov-14
Dec-14
Jan-15
Feb-15
Mar-15
Apr-15
May-15
Jun-15
Jul-15
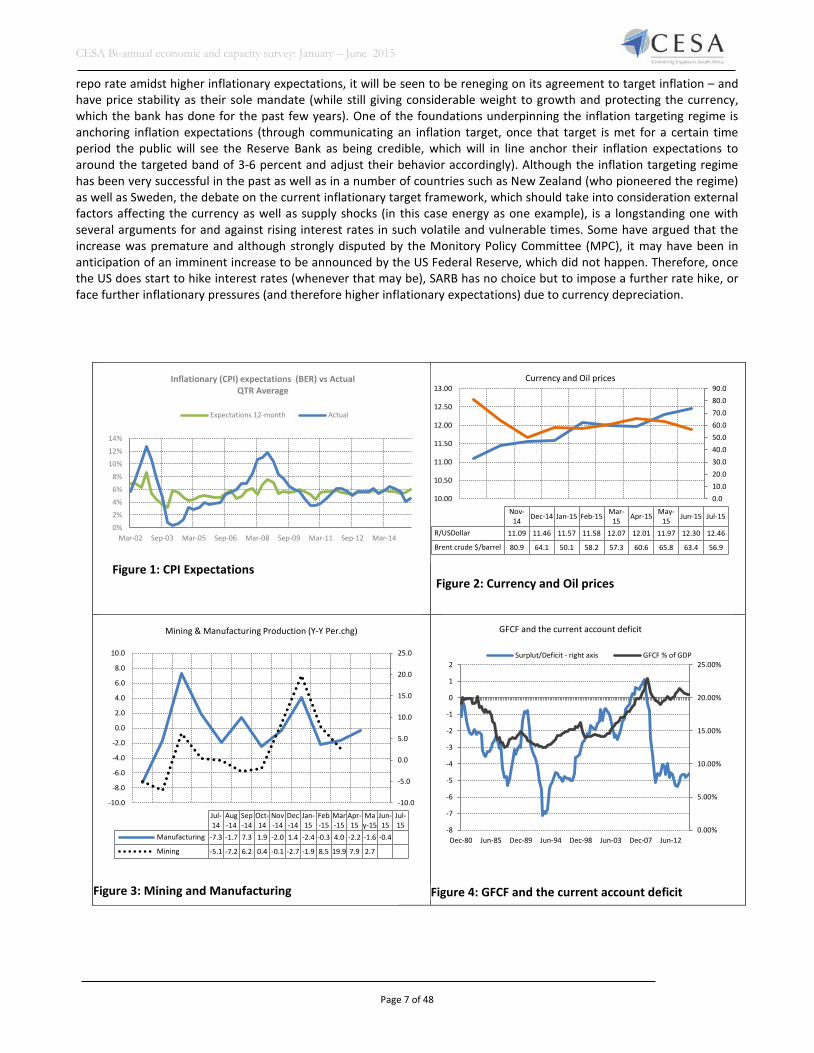
Manufacturing -7.3 -1.7 7.3 1.9 -2.0 1.4 -2.4 -0.3 4.0 -2.2 -1.6 -0.4
Mining -5.1 -7.2 6.2 0.4 -0.1 -2.7 -1.9 8.5 19.9 7.9 2.7
Mining & Manufacturing Production (Y-Y Per.chg)
0.00%
5.00%
10.00%
15.00%
20.00%
25.00%
-8
-7
-6
-5
-4
-3
-2
-1
0
1
2
Dec-80 Jun-85 Dec-89 Jun-94 Dec-98 Jun-03 Dec-07 Jun-12
GFCF and the current account deficit
Surplut/Deficit - right axis GFCF % of GDP
Figure 1: CPI Expectations Figure 2: Currency and Oil prices
Figure 3: Mining and Manufacturing Figure 4: GFCF and the current account deficit
0.010.020.030.040.050.060.070.080.090.0
10.00
10.50
11.00
11.50
12.00
12.50
13.00
Nov-14 Dec-14 Jan-15 Feb-15 Mar-
15 Apr-15 May-15 Jun-15 Jul-15
R/USDollar 11.09 11.46 11.57 11.58 12.07 12.01 11.97 12.30 12.46
Brent crude $/barrel 80.9 64.1 50.1 58.2 57.3 60.6 65.8 63.4 56.9
Currency and Oil prices
CESA Bi-annual economic and capacity survey: January – June 2015
Page 8 of 48
Table 2: Macro economic growth projections (Industry Insight) Macro-Economic Forecasts 2012 2013 2014 2015 2016 2017
GDP 2.2% 2.2% 1.5% 1.6% 1.3% 2.3% Household consumption 3.4% 2.9% 1.4% 4.1% 2.0% 3.1% Government consumption 3.4% 3.3% 1.9% 2.0% 0.7% 0.7% Gross Fixed capital formation 3.6% 7.6% -0.4% 3.3% 1.3% 1.0% US/ZAR 8.21 9.70 10.80 11.88 12.47 11.85 Imports 6.0% 1.8% 6.0% 6.2% 6.0% 6.4% Exports 0.1% 4.6% 4.5% 3.0% 5.5% 6.5% Prime Lending rate 8.50 8.50 9.75 10.50 10.00 9.00 CPI Inflation 5.70 5.80 6.20 3.80 5.50 5.60
Current Account Deficit -5.2 -5.9 -5.5 -5.1 -5.3 -6.3 Source: Industry Insight Forecast Report 2015Q2 1.4 Gross fixed capital formation
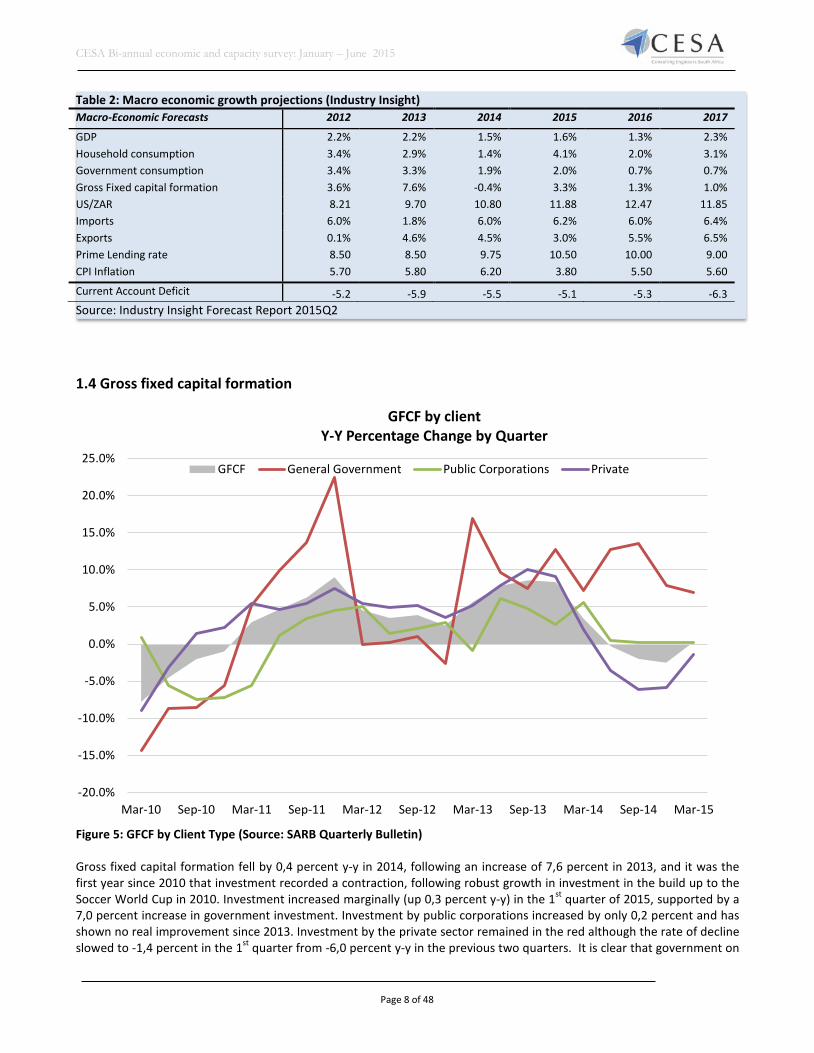
Figure 5: GFCF by Client Type (Source: SARB Quarterly Bulletin) Gross fixed capital formation fell by 0,4 percent y-y in 2014, following an increase of 7,6 percent in 2013, and it was the first year since 2010 that investment recorded a contraction, following robust growth in investment in the build up to the Soccer World Cup in 2010. Investment increased marginally (up 0,3 percent y-y) in the 1st quarter of 2015, supported by a 7,0 percent increase in government investment. Investment by public corporations increased by only 0,2 percent and has shown no real improvement since 2013. Investment by the private sector remained in the red although the rate of decline slowed to -1,4 percent in the 1st quarter from -6,0 percent y-y in the previous two quarters. It is clear that government on
-20.0%
-15.0%
-10.0%
-5.0%
0.0%
5.0%
10.0%
15.0%
20.0%
25.0%
Mar-10 Sep-10 Mar-11 Sep-11 Mar-12 Sep-12 Mar-13 Sep-13 Mar-14 Sep-14 Mar-15
GFCF by client Y-Y Percentage Change by Quarter
GFCF General Government Public Corporations Private

CESA Bi-annual economic and capacity survey: January – June 2015
Page 9 of 48
its own cannot provide sufficient stimulus to encourage positive growth in fixed investment. Without the participation by the private sector, investment growth will remain muted, possibly negative. The outlook for stronger investment growth by government in the near term weakened following budget cuts in the 2015 Budget, where infrastructure allocations were largely reduced due to growing financial constraints. According to SARB, a total of R349bn was spent on construction in 2014, including investment in residential and non-residential buildings and construction works. This would also include purchases of machinery and equipment, often imported, used in the construction process such as the installation of turbines. Government invested R95,0 bn, compared with R88 bn by SOE’s and R164 bn by the private sector. During the 1st quarter of 2015, investment in construction fell by 1,4 percent y-y in current prices to an estimated R86 bn, recording the strongest negative growth since 1st quarter 2011. While investment in the civil industry is reported to have ended flat (increasing by only 0,7 percent), investment in buildings fell by 5,4 percent y-y in current prices, supported by a strong decline in residential investment (down 7,7 percent) and a 3,2 percent contraction reported for investment in non-residential buildings. Gross fixed capital formation (GFCF) as a percentage of GDP averaged at 20,7 percent in 2014, but slowed to 20,6 percent in the 1st quarter of 2015, compared to an average of 21,1 percent in 2013. The NDP has what may seem a somewhat unachievable target of 30 percent contribution of GFCF to GDP by 2030. All economic indicators currently suggest that investment in relation to GDP is likely to slow over the medium term, due to slower government spending, financial constraints experienced by SOE’s and continued weak private sector confidence. Table 3: GFCF Residential, Non-Residential and Construction works, by client 2014 Current prices 2014 Government SOE’s Private Total
Residential 570 32 54,895 55,497 Non-residential 10,951 3,335 48,209 62,495 Civil works 84,088 85,438 61,285 230,811 Total 95,609 88,805 164,389 348,803 Source: South African Reserve Bank Table 4: GFCF by client type, 2010 prices
Source: South African Reserve Bank, Quarterly Bulletin
Rm, 2005 prices, seasonally adj annualised Annual Percentage Change GFCF % of GDP
General Government
Public Corporations
Private Business
enterprises
Total General Government
Public Corporations
Private Business
enterprises
Total
2007 84,800 70,900 367,606 523,306 22.9% 35.3% 8.6% 13.8% 19.2%
2008 91,122 98,074 401,211 590,407 7.5% 38.3% 9.1% 12.8% 21.0%
2009 84,155 117,410 349,422 550,987 -7.6% 19.7% -12.9% -6.7% 20.4%
2010 76,204 111,710 341,517 529,431 -9.4% -4.9% -2.3% -3.9% 19.4%
2011 85,918 112,575 361,245 559,738 12.7% 0.8% 5.8% 5.7% 19.5%
2012 85,599 115,799 378,518 579,916 -0.4% 2.9% 4.8% 3.6% 19.9%
2013 95,537 119,428 409,162 624,127 11.6% 3.1% 8.1% 7.6% 21.1%
2014 105382 121281 395052 621,715 10.3% 1.6% -3.4% -0.4% 20.7%
1st Quarter 2015
109,411 121,763 396,007 627,181 7.0% 0.2% -1.4% 0.3% 20.6%

CESA Bi-annual economic and capacity survey: January – June 2015
Page 10 of 48
2. CESA Survey: Background A total of 119 questionnaires were returned via both the on-line and hard copy system, compared with 86 returned in the previous survey. The sample for the current survey represents a fee income of R3,3 bn, and 9062 employees for the period January – June 2015. The analysis of the questionnaires completed by active firms in the consulting engineering profession provides a proxy for current and expected working conditions for the profession, which can be measured on a regular basis. CESA welcomes commentary received from firms and invites all members to actively participate in sending commentary on either the survey or conditions in the work place thereby increasing the relevance of these reports. The survey is re-evaluated on a continuous basis to ensure that the questions asked are pertinent to current conditions in the industry. Several new questions were included in the current survey to improve the compilation of benchmark indicators.
3. Prevailing conditions in the Consulting Engineering Industry 3.1 Financial Indicators
CESA Bi-annual economic and capacity survey: January – June 2015
Page 11 of 48
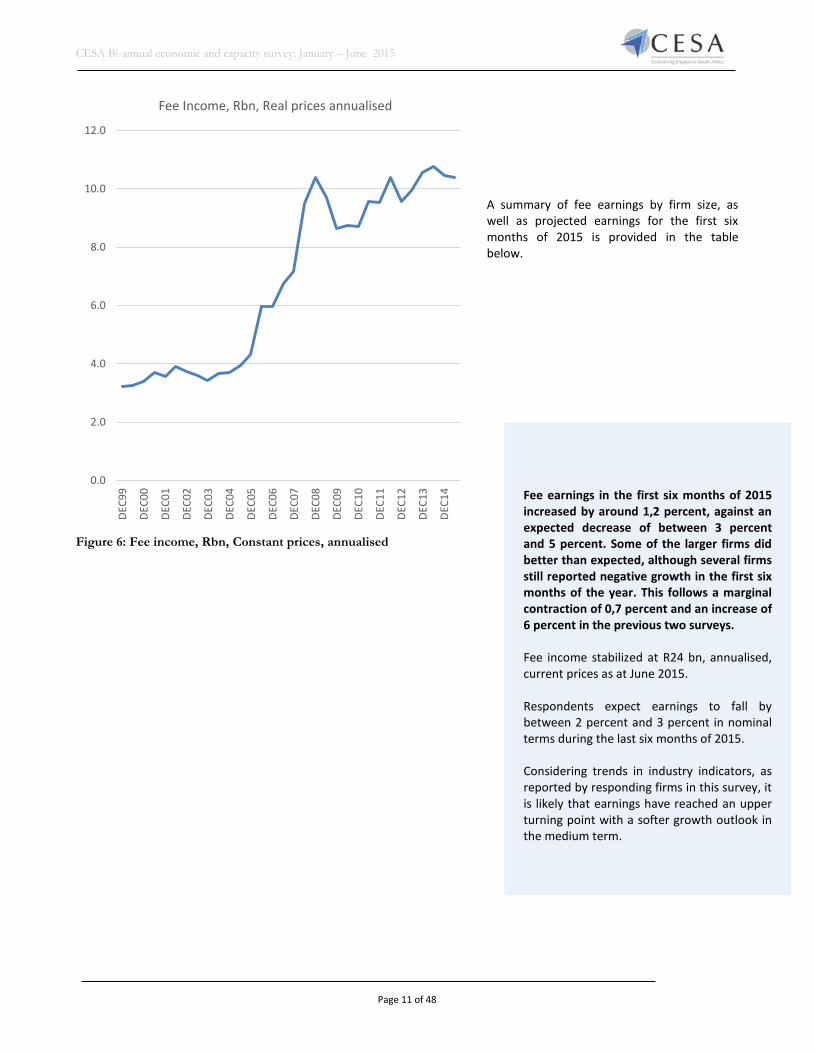
A summary of fee earnings by firm size, as well as projected earnings for the first six months of 2015 is provided in the table below.
0.0
2.0
4.0
6.0
8.0
10.0
12.0DE
C99
DEC0
0
DEC0
1
DEC0
2
DEC0
3
DEC0
4
DEC0
5
DEC0
6
DEC0
7
DEC0
8
DEC0
9
DEC1
0
DEC1
1
DEC1
2
DEC1
3
DEC1
4
Fee Income, Rbn, Real prices annualised
Figure 6: Fee income, Rbn, Constant prices, annualised
Fee earnings in the first six months of 2015 increased by around 1,2 percent, against an expected decrease of between 3 percent and 5 percent. Some of the larger firms did better than expected, although several firms still reported negative growth in the first six months of the year. This follows a marginal contraction of 0,7 percent and an increase of 6 percent in the previous two surveys. Fee income stabilized at R24 bn, annualised, current prices as at June 2015. Respondents expect earnings to fall by between 2 percent and 3 percent in nominal terms during the last six months of 2015. Considering trends in industry indicators, as reported by responding firms in this survey, it is likely that earnings have reached an upper turning point with a softer growth outlook in the medium term.
CESA Bi-annual economic and capacity survey: January – June 2015
Page 12 of 48
Table 5: Fee earnings, actual vs projected by firm size Firm size category Actual (June 2015 vs December 2014) Projected for December 2015 Actual (December 2014 vs
June 2014) Large 2.8% -2.8% -6.6% Medium -13.1% 14.5% 50.0% Small 14.6% -17.7% 9.0% Micro 21.5% -35.2% 28.1% Total 1.0% -1.6% -0.7% 3.1.2 Outsourcing
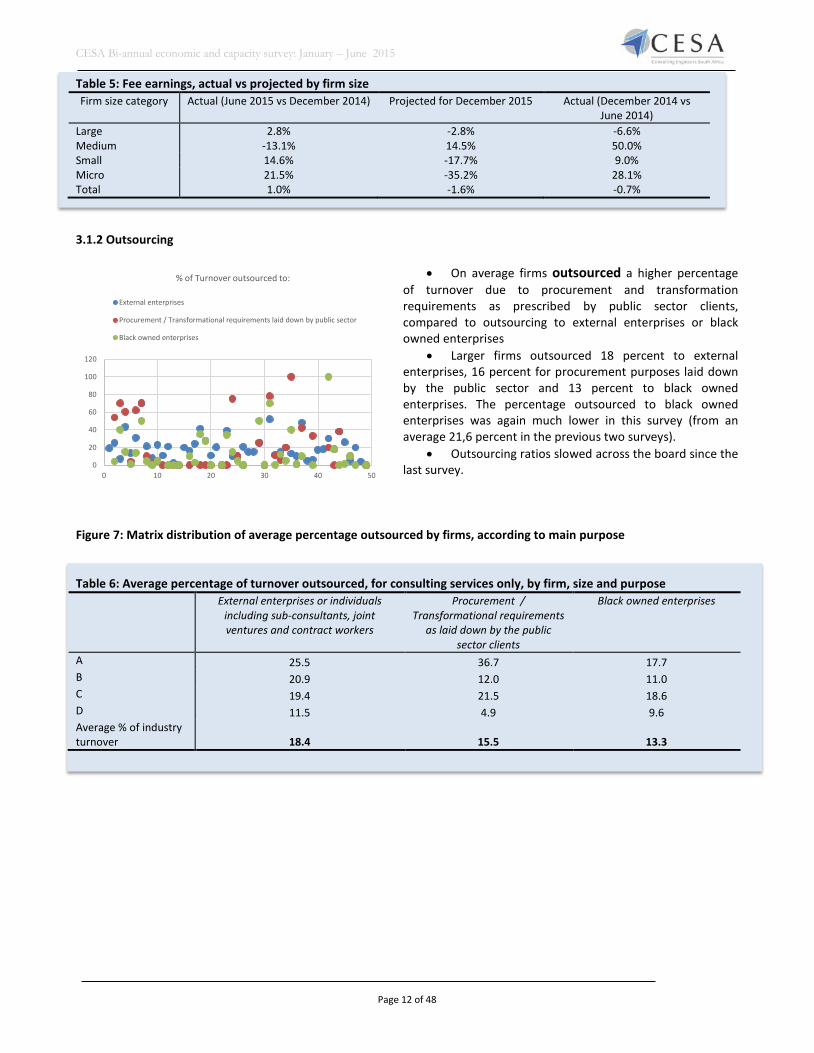
• On average firms outsourced a higher percentage
of turnover due to procurement and transformation requirements as prescribed by public sector clients, compared to outsourcing to external enterprises or black owned enterprises
• Larger firms outsourced 18 percent to external enterprises, 16 percent for procurement purposes laid down by the public sector and 13 percent to black owned enterprises. The percentage outsourced to black owned enterprises was again much lower in this survey (from an average 21,6 percent in the previous two surveys).
• Outsourcing ratios slowed across the board since the last survey.
Figure 7: Matrix distribution of average percentage outsourced by firms, according to main purpose Table 6: Average percentage of turnover outsourced, for consulting services only, by firm, size and purpose External enterprises or individuals
including sub-consultants, joint ventures and contract workers
Procurement / Transformational requirements
as laid down by the public sector clients
Black owned enterprises
A 25.5 36.7 17.7 B 20.9 12.0 11.0 C 19.4 21.5 18.6 D 11.5 4.9 9.6 Average % of industry turnover 18.4 15.5 13.3
0
20
40
60
80
100
120
0 10 20 30 40 50
% of Turnover outsourced to:
External enterprises
Procurement / Transformational requirements laid down by public sector
Black owned enterprises
CESA Bi-annual economic and capacity survey: January – June 2015
Page 13 of 48
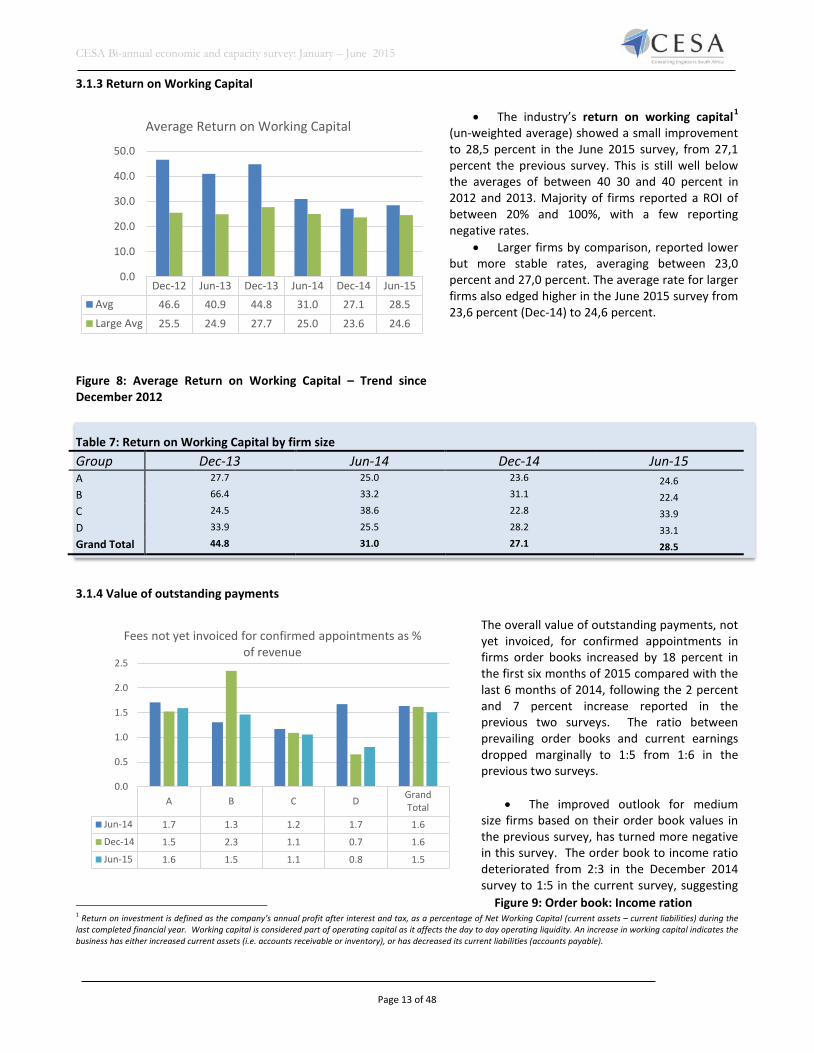
3.1.3 Return on Working Capital
• The industry’s return on working capital1 (un-weighted average) showed a small improvement to 28,5 percent in the June 2015 survey, from 27,1 percent the previous survey. This is still well below the averages of between 40 30 and 40 percent in 2012 and 2013. Majority of firms reported a ROI of between 20% and 100%, with a few reporting negative rates.
• Larger firms by comparison, reported lower but more stable rates, averaging between 23,0 percent and 27,0 percent. The average rate for larger firms also edged higher in the June 2015 survey from 23,6 percent (Dec-14) to 24,6 percent.
Table 7: Return on Working Capital by firm size Group Dec-13 Jun-14 Dec-14 Jun-15 A 27.7 25.0 23.6 24.6 B 66.4 33.2 31.1 22.4 C 24.5 38.6 22.8 33.9 D 33.9 25.5 28.2 33.1 Grand Total 44.8 31.0 27.1 28.5 3.1.4 Value of outstanding payments
The overall value of outstanding payments, not yet invoiced, for confirmed appointments in firms order books increased by 18 percent in the first six months of 2015 compared with the last 6 months of 2014, following the 2 percent and 7 percent increase reported in the previous two surveys. The ratio between prevailing order books and current earnings dropped marginally to 1:5 from 1:6 in the previous two surveys.
• The improved outlook for medium size firms based on their order book values in the previous survey, has turned more negative in this survey. The order book to income ratio deteriorated from 2:3 in the December 2014 survey to 1:5 in the current survey, suggesting
1 Return on investment is defined as the company’s annual profit after interest and tax, as a percentage of Net Working Capital (current assets – current liabilities) during the last completed financial year. Working capital is considered part of operating capital as it affects the day to day operating liquidity. An increase in working capital indicates the business has either increased current assets (i.e. accounts receivable or inventory), or has decreased its current liabilities (accounts payable).
Figure 8: Average Return on Working Capital – Trend since December 2012
Figure 9: Order book: Income ration
Dec-12 Jun-13 Dec-13 Jun-14 Dec-14 Jun-15Avg 46.6 40.9 44.8 31.0 27.1 28.5Large Avg 25.5 24.9 27.7 25.0 23.6 24.6
0.0
10.0
20.0
30.0
40.0
50.0
Average Return on Working Capital
A B C D GrandTotal
Jun-14 1.7 1.3 1.2 1.7 1.6
Dec-14 1.5 2.3 1.1 0.7 1.6
Jun-15 1.6 1.5 1.1 0.8 1.5
0.0
0.5
1.0
1.5
2.0
2.5
Fees not yet invoiced for confirmed appointments as % of revenue

CESA Bi-annual economic and capacity survey: January – June 2015
Page 14 of 48
a drop in expected pipeline income. • For larger firms, the ratio improved slightly to 1:6 in the June 2015 survey, from 1:5 in the previous survey and
1:7 in the June 2014 survey. • On average, larger firms don’t expect an increase in earnings during the last six months of 2015, compared with
an expected 16 increase in earnings by medium size firms. Smaller and micro enterprises expect much weaker conditions in the second half of 2015, with earnings expected to contract by an average of 18 percent.
3.1.5 Profitability and late payments
Profitability unexpectedly improved to an average of 14,4 percent from 12,2, percent and 13,7 percent in the previous two surveys. The average profit margin for larger firms recovered to 9,4 percent in the first six months of 2015, from 4,3 percent in the previous survey (December 2014). Medium size firms managed to maintain profit margins at around 14 percent, while smaller firms reported a drop to 13,1 percent from 19 percent in the previous survey. In line with the previous survey, majority of firms expect margins to weaken, although the percentage of those that expect receding profits increased from 54 percent in the previous survey to 63 percent in the current survey. This is a significant increase and clearly points to an industry under higher levels of financial distress. Not surprising, majority of larger firms (80 percent) are unsatisfied with prevailing margins, compared with only 16 percent of medium firms reporting unsatisfactory levels. The net percentage satisfaction rate remain deep in negative territory. Payment remains a serious issue, having a broad based effect on firms operating in the industry. The percentage of fees outstanding for longer than 90 days as a percentage of total estimated income (including late payments) nonetheless increased only marginally to 24,5 percent from 24,0 percent in the previous survey. This ratio is however still higher when compared to the 17,4 percent in the June 2014 survey. These ratios include income outstanding from foreign clients, which contributed 42 percent to total earnings outstanding after 90 days.
It is estimated that around R5,8bn in earnings is currently outstanding after the 90 day period.
Figure 10: Profitability: Net % Satisfaction rate
Figure 11: % of earnings outstanding for > 90 days 0.00%
5.00%
10.00%
15.00%
20.00%
25.00%
30.00%
Dec-
99O
ct-0
0Au
g-01
Jun-
02Ap
r-03
Feb-
04De
c-04
Oct
-05
Aug-
06Ju
n-07
Apr-
08Fe
b-09
Dec-
09O
ct-1
0Au
g-11
Jun-
12Ap
r-13
Feb-
14De
c-14
% of Earnings outstanding for > 90 days
-100.00%-80.00%-60.00%-40.00%-20.00%
0.00%20.00%40.00%60.00%80.00%
100.00%
Dec-
99De
c-00
Dec-
01De
c-02
Dec-
03De
c-04
Dec-
05De
c-06
Dec-
07De
c-08
Dec-
09De
c-10
Dec-
11De
c-12
Dec-
13De
c-14
Profitability : Net % Satisfaction rate
Nett perception trends improving
4 per. Mov. Avg. (Nett perception trends improving)

CESA Bi-annual economic and capacity survey: January – June 2015
Page 15 of 48
Foreign clients represented 42 percent of earnings outstanding for longer than 90 days (compared with 60 percent in December 2014), followed by 43 percent owed by the private sector, 8 percent by local authorities, 4 percent by provincial government and 1 percent by central government. SOE’s contributed 2 percent during the current survey.
3.2 Human Resources 3.2.1 Employment
• Employment improved in the first six months of 2015, up by 4 percent, supported by a 6 percent increase as reported by larger firms. This follows three consecutives survey periods of contraction. Compared to the same period last year, employment is estimated to have increased by around 2 percent to an estimated 23,838.
• The number of firms looking for engineers increased to just under 70 percent from 48 percent and 82 percent in the previous two surveys. It would seem there is increased demand for technologists and other technical staff, where 68 percent and 51 percent of respondents reported the desire to increase staff. This is well above the average over the last four surveys of 34 percent and 18 percent respectively.
• A total of 67 percent of firms reported difficulties in recruiting male engineers and 80 percent reported problems recruiting female engineers. These rates are also higher than in the previous survey.
• A higher percentage, between 87 percent and 90 percent, reported difficulties in recruiting previously disadvantaged male and/or female engineers. It would seem the issue on recruiting female engineers is becoming more profound, although bursaries are still mainly in favour of male recipients.
1% 4% 8%
2%
43%
42%
Payment oustanding > 90 days Distribution by client type
Central Provincial
Local State Owned enterprises
Private Foreign
0
50
100
Jun-
05
Feb-
06
Oct
-06
Jun-
07
Feb-
08
Oct
-08
Jun-
09
Feb-
10
Oct
-10
Jun-
11
Feb-
12
Oct
-12
Jun-
13
Feb-
14
Oct
-14
Jun-
15
Employment Demand
EngineersTechnologistTechnicians
0 20 40 60 80 100 120
Eng Male
Technologist Male
Technician Male
Other Tech Male
Support male
PDI Eng Male
PDTechnologist Male
PDI Technician Male
Difficulties in Recruitment

CESA Bi-annual economic and capacity survey: January – June 2015
Page 16 of 48
Table 8: % of firms wanting to increase staff, by type of personnel
Type of personnel
% of firms wanting to
increase staff June 2012
% of firms wanting to
increase staff December
2012
% of firms wanting to
increase staff June 2013
% of firms wanting to
increase staff December
2013
% of firms wanting to
increase staff June 2014
% of firms wanting to
increase staff December
2014
% of firms wanting to
increase staff June 2015
Engineers 86.5 61.2 50.8 32.0 86.2 48.0 69.3 Technologists 38.2 19.9 46.2 23.0 26.7 39.0 68.2 Technicians 22.2 18.1 30.5 22.0 12.9 35.0 5.1 Other technical staff 17.5 12.5 20.9 36.0 3.4 13.0 51.1
Support staff 6.6 7.5 24.0 28.0 2.1 3.8 2.9
3.2.2 Salary and Wage bill • The salary and wage bill is a significant contributor to the average cost of production in the consulting
engineering profession. • The contribution of the salary and wage bill to fee earnings stabilised at an average rate of 66 percent. • The contribution of the salary and wage bill was highest amongst larger firms (68 percent), 62 percent for
medium size firms, 56 percent for smaller firms and around between 20 and 30 percent for micro enterprises. 3.2.3 Training
Figure 12: Employment Demand and Difficulties in recruitment
Figure 13: Training direct expenses as % of salary bill and Training Matrix
0.00%
0.50%
1.00%
1.50%
2.00%
2.50%
3.00%
3.50%
1/98 12/99 12/01 12/03 12/05 12/07 12/09 12/11 12/13
TRAINING Direct expenses as % of Salary Bill
0.0%
0.5%
1.0%
1.5%
2.0%
2.5%
3.0%
3.5%
0 5 10 15 20 25
Direct Training as % of Salary and Wage bill
Large Medium Small Micro
CESA Bi-annual economic and capacity survey: January – June 2015
Page 17 of 48
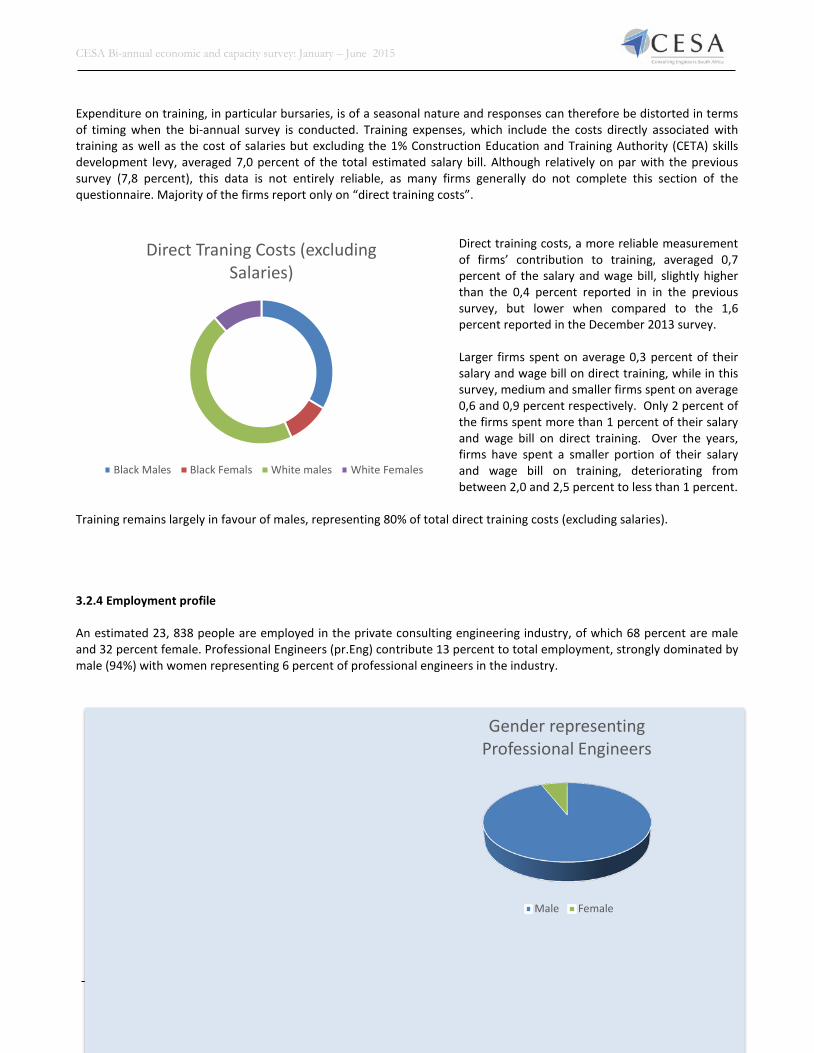
Expenditure on training, in particular bursaries, is of a seasonal nature and responses can therefore be distorted in terms of timing when the bi-annual survey is conducted. Training expenses, which include the costs directly associated with training as well as the cost of salaries but excluding the 1% Construction Education and Training Authority (CETA) skills development levy, averaged 7,0 percent of the total estimated salary bill. Although relatively on par with the previous survey (7,8 percent), this data is not entirely reliable, as many firms generally do not complete this section of the questionnaire. Majority of the firms report only on “direct training costs”.
Direct training costs, a more reliable measurement of firms’ contribution to training, averaged 0,7 percent of the salary and wage bill, slightly higher than the 0,4 percent reported in in the previous survey, but lower when compared to the 1,6 percent reported in the December 2013 survey. Larger firms spent on average 0,3 percent of their salary and wage bill on direct training, while in this survey, medium and smaller firms spent on average 0,6 and 0,9 percent respectively. Only 2 percent of the firms spent more than 1 percent of their salary and wage bill on direct training. Over the years, firms have spent a smaller portion of their salary and wage bill on training, deteriorating from between 2,0 and 2,5 percent to less than 1 percent.
Training remains largely in favour of males, representing 80% of total direct training costs (excluding salaries). 3.2.4 Employment profile An estimated 23, 838 people are employed in the private consulting engineering industry, of which 68 percent are male and 32 percent female. Professional Engineers (pr.Eng) contribute 13 percent to total employment, strongly dominated by male (94%) with women representing 6 percent of professional engineers in the industry.
Direct Traning Costs (excluding Salaries)
Black Males Black Femals White males White Females
Gender representing Professional Engineers
Male Female
CESA Bi-annual economic and capacity survey: January – June 2015
Page 18 of 48
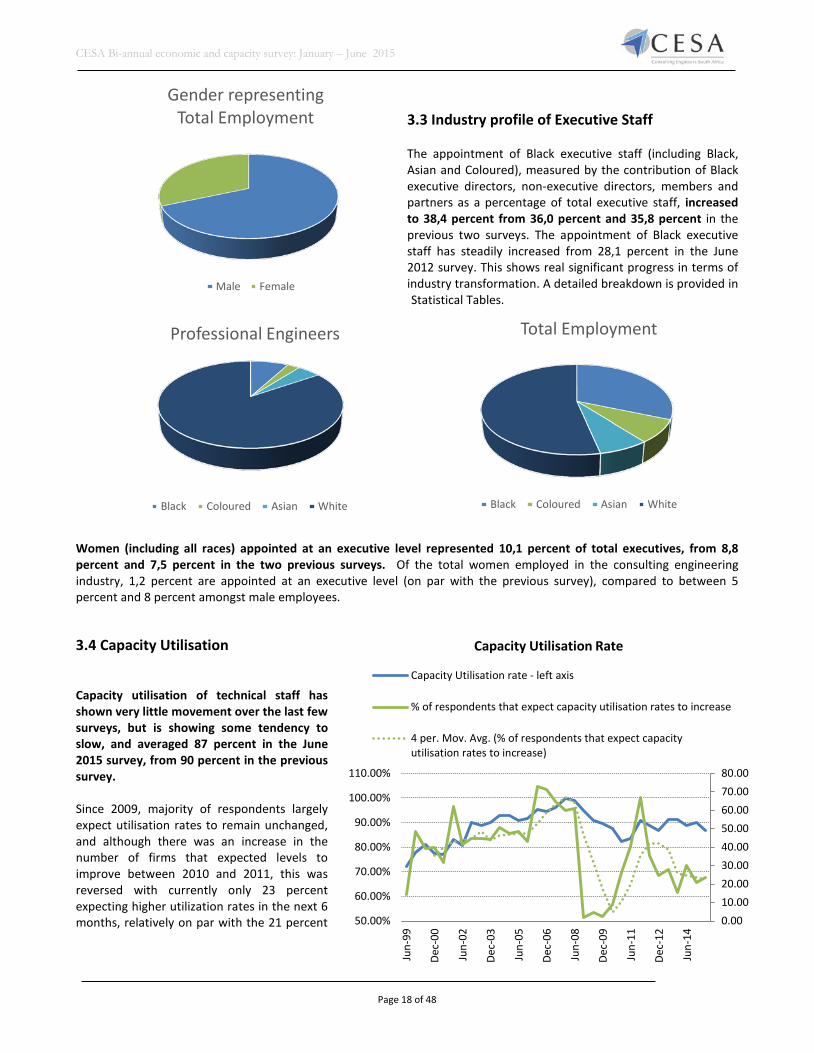
3.3 Industry profile of Executive Staff The appointment of Black executive staff (including Black, Asian and Coloured), measured by the contribution of Black executive directors, non-executive directors, members and partners as a percentage of total executive staff, increased to 38,4 percent from 36,0 percent and 35,8 percent in the previous two surveys. The appointment of Black executive staff has steadily increased from 28,1 percent in the June 2012 survey. This shows real significant progress in terms of industry transformation. A detailed breakdown is provided in Statistical Tables.
Women (including all races) appointed at an executive level represented 10,1 percent of total executives, from 8,8 percent and 7,5 percent in the two previous surveys. Of the total women employed in the consulting engineering industry, 1,2 percent are appointed at an executive level (on par with the previous survey), compared to between 5 percent and 8 percent amongst male employees. 3.4 Capacity Utilisation Capacity utilisation of technical staff has shown very little movement over the last few surveys, but is showing some tendency to slow, and averaged 87 percent in the June 2015 survey, from 90 percent in the previous survey. Since 2009, majority of respondents largely expect utilisation rates to remain unchanged, and although there was an increase in the number of firms that expected levels to improve between 2010 and 2011, this was reversed with currently only 23 percent expecting higher utilization rates in the next 6 months, relatively on par with the 21 percent
Total Employment
Black Coloured Asian White
Gender representing Total Employment
Male Female
Professional Engineers
Black Coloured Asian White
0.0010.0020.0030.0040.0050.0060.0070.0080.00
50.00%
60.00%
70.00%
80.00%
90.00%
100.00%
110.00%
Jun-
99
Dec-
00
Jun-
02
Dec-
03
Jun-
05
Dec-
06
Jun-
08
Dec-
09
Jun-
11
Dec-
12
Jun-
14
Capacity Utilisation Rate
Capacity Utilisation rate - left axis
% of respondents that expect capacity utilisation rates to increase
4 per. Mov. Avg. (% of respondents that expect capacityutilisation rates to increase)
CESA Bi-annual economic and capacity survey: January – June 2015
Page 19 of 48
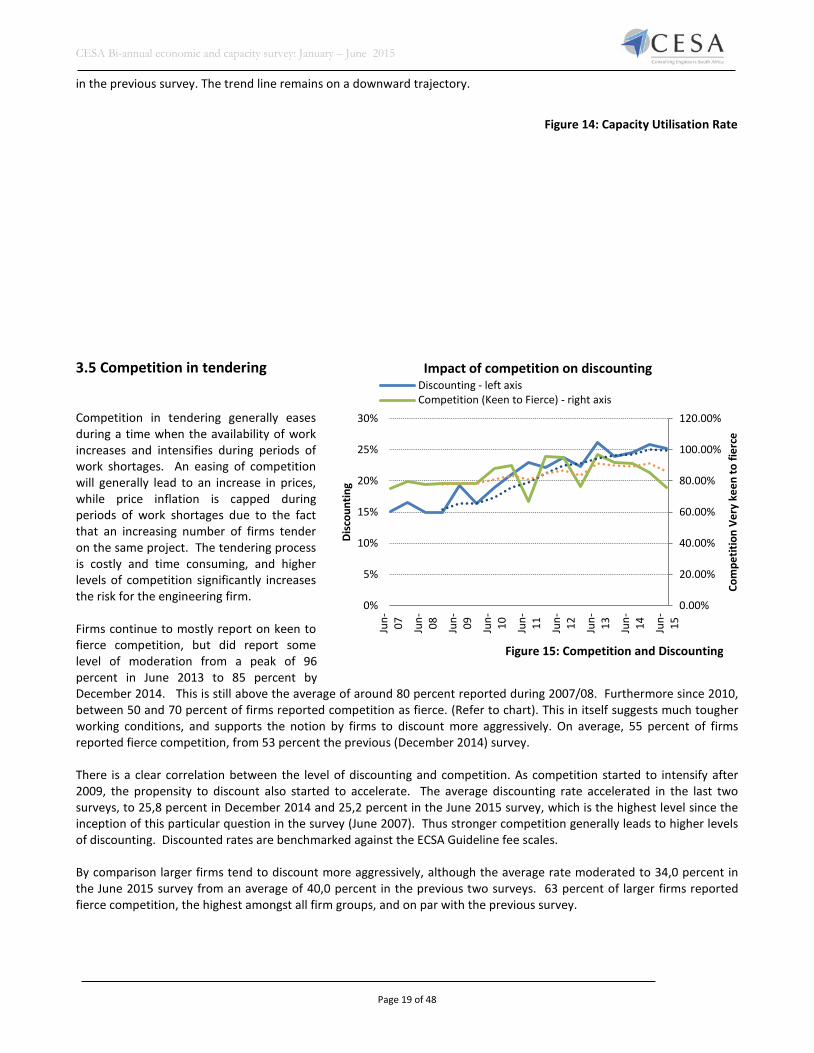
in the previous survey. The trend line remains on a downward trajectory. 3.5 Competition in tendering Competition in tendering generally eases during a time when the availability of work increases and intensifies during periods of work shortages. An easing of competition will generally lead to an increase in prices, while price inflation is capped during periods of work shortages due to the fact that an increasing number of firms tender on the same project. The tendering process is costly and time consuming, and higher levels of competition significantly increases the risk for the engineering firm. Firms continue to mostly report on keen to fierce competition, but did report some level of moderation from a peak of 96 percent in June 2013 to 85 percent by December 2014. This is still above the average of around 80 percent reported during 2007/08. Furthermore since 2010, between 50 and 70 percent of firms reported competition as fierce. (Refer to chart). This in itself suggests much tougher working conditions, and supports the notion by firms to discount more aggressively. On average, 55 percent of firms reported fierce competition, from 53 percent the previous (December 2014) survey. There is a clear correlation between the level of discounting and competition. As competition started to intensify after 2009, the propensity to discount also started to accelerate. The average discounting rate accelerated in the last two surveys, to 25,8 percent in December 2014 and 25,2 percent in the June 2015 survey, which is the highest level since the inception of this particular question in the survey (June 2007). Thus stronger competition generally leads to higher levels of discounting. Discounted rates are benchmarked against the ECSA Guideline fee scales. By comparison larger firms tend to discount more aggressively, although the average rate moderated to 34,0 percent in the June 2015 survey from an average of 40,0 percent in the previous two surveys. 63 percent of larger firms reported fierce competition, the highest amongst all firm groups, and on par with the previous survey.
Figure 14: Capacity Utilisation Rate
Figure 15: Competition and Discounting
0.00%
20.00%
40.00%
60.00%
80.00%
100.00%
120.00%
0%
5%
10%
15%
20%
25%
30%
Jun- 07 Jun- 08 Jun- 09 Jun- 10 Jun- 11 Jun- 12 Jun- 13 Jun- 14 Jun- 15
Com
petit
ion
Very
kee
n to
fier
ce
Disc
ount
ing
Impact of competition on discounting Discounting - left axisCompetition (Keen to Fierce) - right axis

CESA Bi-annual economic and capacity survey: January – June 2015
Page 20 of 48
Medium size firms discounted at an average rate of 24,6 percent, moderately lower than the 27,7 percent, reported in the December 2014 survey, against 39 percent that reported fierce competition.
3.6 Pricing
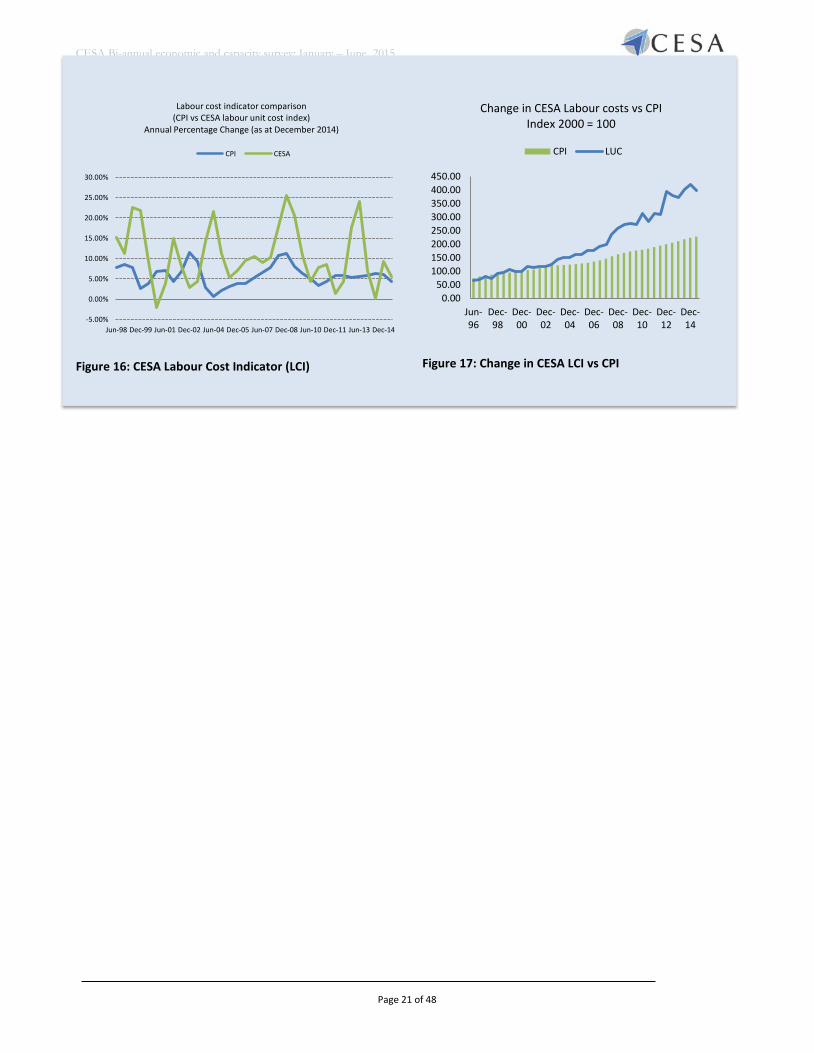
No specific escalation index is available for the consulting engineering industry. After exploring many different avenues it was proposed to calculate a CESA Cost index that is based on a “labour unit cost” and extracted directly from the CESA BECS Survey. This should accommodate at least between 60% and 65% of the firms’ costs and should therefore, in theory, be a reliable indicator of escalation. The CPI is currently used to deflate all financial information, until such time CESA officially applies the CESA Labour cost index as an industry price deflator.
The index is based on the sample of total number of employees versus the salaries and wages paid during the period under review. According to CESA’s labour cost indicator, the average unit cost of labour for the industry, increased by an average of 5,6 percent y-y in the first six months of 2015, compared to an increase of 9,3 percent in the last six months of 2014 and no change in the first six months of 2014 (averaging 4,8 percent for the year 2014). While changes in the general cost of living (as measured by the Statistics South Africa’s Consumer Price Index) are clearly not indicative of labour cost changes in the consulting engineering industry, the CPI may have a strong influence in the determination of ECSA Guideline Fees, which has shown an average increase of 4,4 percent in the first six months of 2015, vs 6,2 percent in the first half of 2014, and 5,9 percent in the second half of 2014. Consumer inflation has accelerated in recent months, largely due to a statistical correction this year, following the impact of lower oil prices on inflation last year.
Firm Size Category
Capacity Utilisation of existing technical staff
during the past 6 months
% of Respondents that expect capacity utilisation
of technical staff to increase over the next 6 months
Average discount being offered by respondents in
tendering situation to clients, benchmarked
against the ECSA guideline fee scales
% of Respondents that reported FIERCE
Competition for work during the last six
months
Large 82.3 33.6 34.1 50.4 Medium 86.5 23.3 24.6 38.9 Small 91.8 37.8 24.7 25.5 Micro 87.4 28.9 20.2 37.8 Industry Average
87.0 (Weighted) 23.0 (Weighted) 25.2 (Weighted) 55.6 (Weighted)
CESA Bi-annual economic and capacity survey: January – June 2015
Page 21 of 48
Figure 16: CESA Labour Cost Indicator (LCI)
Figure 17: Change in CESA LCI vs CPI
-5.00%
0.00%
5.00%
10.00%
15.00%
20.00%
25.00%
30.00%
Jun-98 Dec-99 Jun-01 Dec-02 Jun-04 Dec-05 Jun-07 Dec-08 Jun-10 Dec-11 Jun-13 Dec-14
Labour cost indicator comparison (CPI vs CESA labour unit cost index)
Annual Percentage Change (as at December 2014)
CPI CESA
0.0050.00
100.00150.00200.00250.00300.00350.00400.00450.00
Jun-96
Dec-98
Dec-00
Dec-02
Dec-04
Dec-06
Dec-08
Dec-10
Dec-12
Dec-14
Change in CESA Labour costs vs CPI Index 2000 = 100
CPI LUC

CESA Bi-annual economic and capacity survey: January – June 2015
Page 22 of 48
4. Industry Outlook
Explanatory note: The confidence index, as an indicator of members’ assessments regarding current and future prospects with regard to market developments, is a “weighted” index. The response of each company is weighted according to its total employment, including full and part time staff, and the index represents the net percentage of members satisfied with business conditions.2 To ensure that possible distortions stemming from ad hoc replies do not occur, only those members that have submitted returns during the last two consecutive surveys are used. The confidence index is used as a leading indicator to determine a short to medium term outlook for the consulting engineering industry. The industry satisfaction rate deteriorated to 46,3 percent in the December 2014 survey, and weakened further to 44,5 percent in the June 2015 survey, even lower than projected for the first six months of 2015, as reported by firms in the December 2014 survey. The outlook for the next 12 months remains largely depressed although the satisfaction rate improves slightly to 56,0 percent for the last six months of 2015 and to 59,4 percent for the first six months of 2016. Satisfaction amongst firms are at historically low levels, surpassed only by the 1998/99 recession caused by the Asian financial crisis. A breakdown by firm size category is provided in the table below. Table 9: Confidence as at June 2015, by firm size category (% of respondents that experienced satisfactory business conditions) Firm size category First six months of 2015 Next 6 months Next 12 months Large 35.9% 49.6% 53.1% Medium 64.8% 69.9% 74.7% Small 80.3% 86.7% 87.3%
2 The net percentage reflects only those members that expect conditions to be satisfactory, quite busy or very busy.
0.0
20.0
40.0
60.0
80.0
100.0
120.0
Jun-98 Jun-00 Jun-02 Jun-04 Jun-06 Jun-08 Jun-10 Jun-12 Jun-14 Jun-16
CESA Confidence Index Satisfaction Rate
Confidence Index 4 per. Mov. Avg. (Confidence Index)
Figure 18: Confidence Index
CESA Bi-annual economic and capacity survey: January – June 2015
Page 23 of 48
Micro 75.1% 80.5% 75.6%
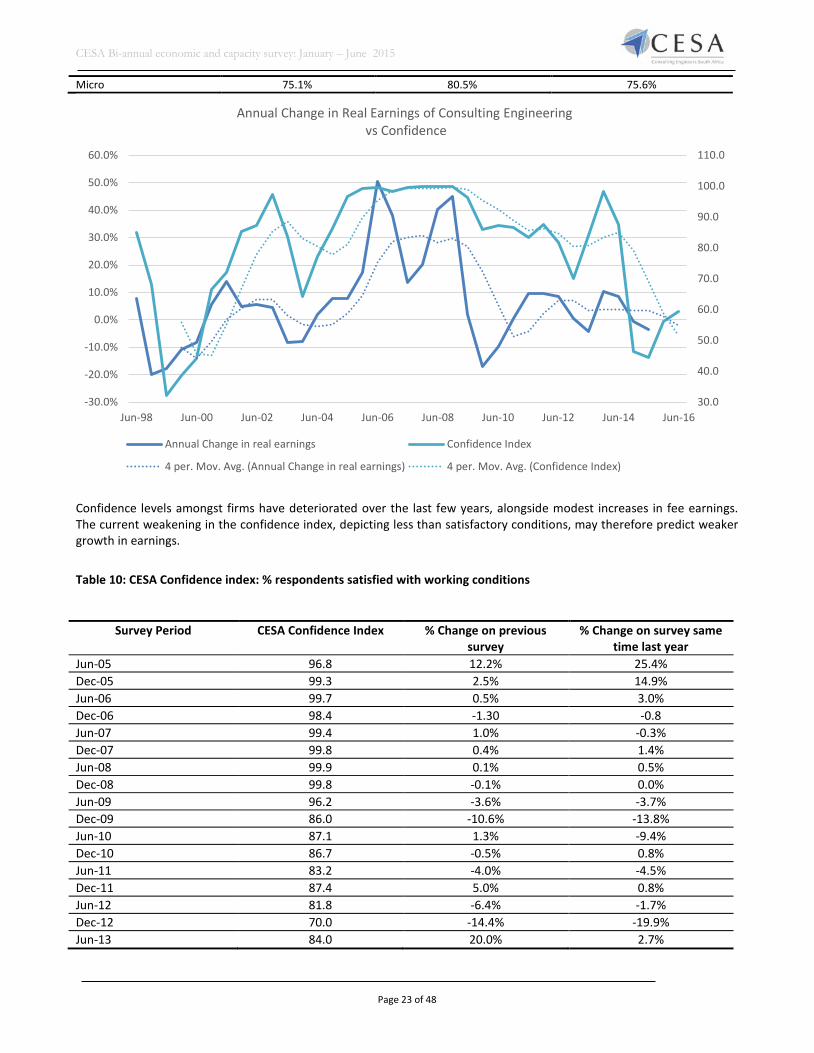
Confidence levels amongst firms have deteriorated over the last few years, alongside modest increases in fee earnings. The current weakening in the confidence index, depicting less than satisfactory conditions, may therefore predict weaker growth in earnings.
Table 10: CESA Confidence index: % respondents satisfied with working conditions
30.0
40.0
50.0
60.0
70.0
80.0
90.0
100.0
110.0
-30.0%
-20.0%
-10.0%
0.0%
10.0%
20.0%
30.0%
40.0%
50.0%
60.0%
Jun-98 Jun-00 Jun-02 Jun-04 Jun-06 Jun-08 Jun-10 Jun-12 Jun-14 Jun-16
Annual Change in Real Earnings of Consulting Engineering vs Confidence
Annual Change in real earnings Confidence Index
4 per. Mov. Avg. (Annual Change in real earnings) 4 per. Mov. Avg. (Confidence Index)
Survey Period CESA Confidence Index % Change on previous survey
% Change on survey same time last year
Jun-05 96.8 12.2% 25.4% Dec-05 99.3 2.5% 14.9% Jun-06 99.7 0.5% 3.0% Dec-06 98.4 -1.30 -0.8 Jun-07 99.4 1.0% -0.3% Dec-07 99.8 0.4% 1.4% Jun-08 99.9 0.1% 0.5% Dec-08 99.8 -0.1% 0.0% Jun-09 96.2 -3.6% -3.7% Dec-09 86.0 -10.6% -13.8% Jun-10 87.1 1.3% -9.4% Dec-10 86.7 -0.5% 0.8% Jun-11 83.2 -4.0% -4.5% Dec-11 87.4 5.0% 0.8% Jun-12 81.8 -6.4% -1.7% Dec-12 70.0 -14.4% -19.9% Jun-13 84.0 20.0% 2.7%
CESA Bi-annual economic and capacity survey: January – June 2015
Page 24 of 48
So how does the business environment perceptions in the consulting engineering
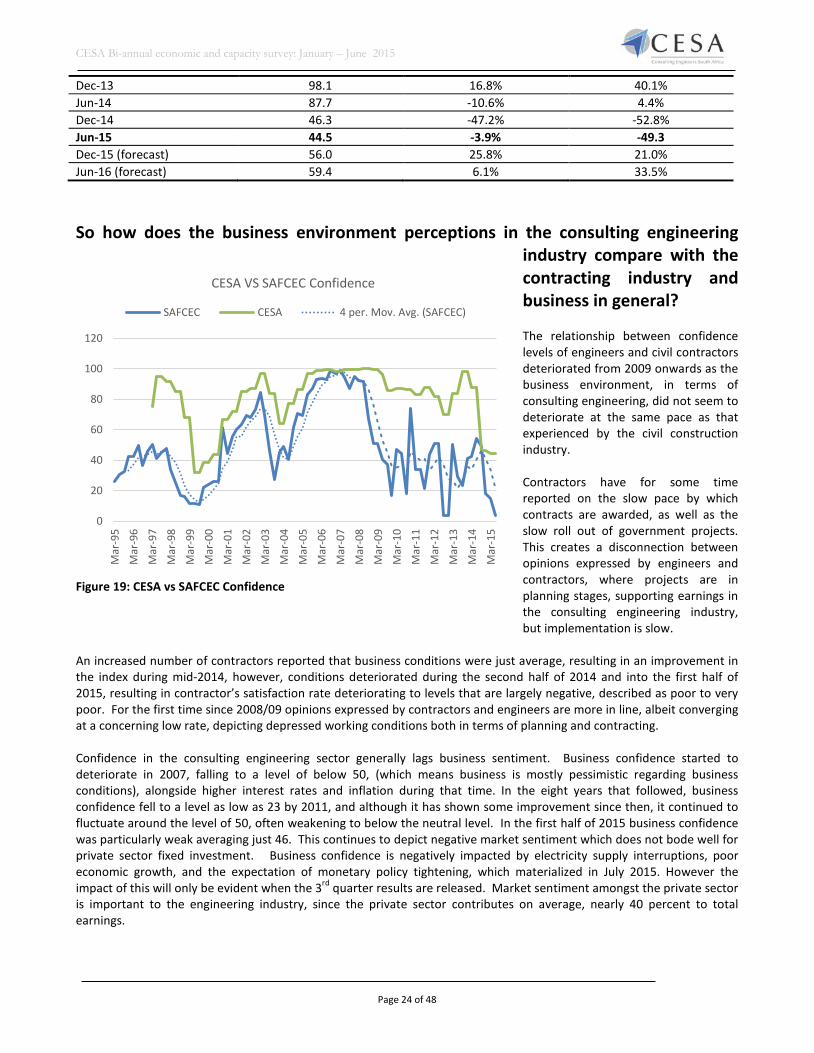
industry compare with the contracting industry and business in general? The relationship between confidence levels of engineers and civil contractors deteriorated from 2009 onwards as the business environment, in terms of consulting engineering, did not seem to deteriorate at the same pace as that experienced by the civil construction industry. Contractors have for some time reported on the slow pace by which contracts are awarded, as well as the slow roll out of government projects. This creates a disconnection between opinions expressed by engineers and contractors, where projects are in planning stages, supporting earnings in the consulting engineering industry, but implementation is slow.
An increased number of contractors reported that business conditions were just average, resulting in an improvement in the index during mid-2014, however, conditions deteriorated during the second half of 2014 and into the first half of 2015, resulting in contractor’s satisfaction rate deteriorating to levels that are largely negative, described as poor to very poor. For the first time since 2008/09 opinions expressed by contractors and engineers are more in line, albeit converging at a concerning low rate, depicting depressed working conditions both in terms of planning and contracting. Confidence in the consulting engineering sector generally lags business sentiment. Business confidence started to deteriorate in 2007, falling to a level of below 50, (which means business is mostly pessimistic regarding business conditions), alongside higher interest rates and inflation during that time. In the eight years that followed, business confidence fell to a level as low as 23 by 2011, and although it has shown some improvement since then, it continued to fluctuate around the level of 50, often weakening to below the neutral level. In the first half of 2015 business confidence was particularly weak averaging just 46. This continues to depict negative market sentiment which does not bode well for private sector fixed investment. Business confidence is negatively impacted by electricity supply interruptions, poor economic growth, and the expectation of monetary policy tightening, which materialized in July 2015. However the impact of this will only be evident when the 3rd quarter results are released. Market sentiment amongst the private sector is important to the engineering industry, since the private sector contributes on average, nearly 40 percent to total earnings.
Dec-13 98.1 16.8% 40.1% Jun-14 87.7 -10.6% 4.4% Dec-14 46.3 -47.2% -52.8% Jun-15 44.5 -3.9% -49.3 Dec-15 (forecast) 56.0 25.8% 21.0% Jun-16 (forecast) 59.4 6.1% 33.5%
Figure 19: CESA vs SAFCEC Confidence
0
20
40
60
80
100
120
Mar
-95
Mar
-96
Mar
-97
Mar
-98
Mar
-99
Mar
-00
Mar
-01
Mar
-02
Mar
-03
Mar
-04
Mar
-05
Mar
-06
Mar
-07
Mar
-08
Mar
-09
Mar
-10
Mar
-11
Mar
-12
Mar
-13
Mar
-14
Mar
-15
CESA VS SAFCEC Confidence
SAFCEC CESA 4 per. Mov. Avg. (SAFCEC)
CESA Bi-annual economic and capacity survey: January – June 2015
Page 25 of 48
5. Industry challenges as noted by respondents Many of the challenges were noted before but as they are still applicable are included again in this report.
• Regulation issues, including the procurement of consulting engineering services, remain one of the biggest challenges faced by the industry. Procurement is currently based on price and broad-based black economic empowerment (BBBEE) points, with functionality or quality having a minimum threshold, thus being largely price driven. This is affecting tender prices, as firms sometimes tender below cost in view of the diminished availability of projects.
• Unrealistic tendering fees remain a concern for members, while the extended time it takes in which to finalise a proposal is affecting profitability in the industry.
• The quality of technical personnel is argued by some firms to have deteriorated, putting greater risk on the built environment sector. Skills shortage is regarded as one the most significant institutional challenges faced by the private and the public sector. CESA has offered their services to government to procure and implement projects.
• Fraud and corruption is affecting the ethos of our society, with a lot of talk and little action accompanying the growing evidence of corruption. CESA is aware that members are under pressure from contractors and corrupt officials, to certify payment for work not completed. This is regarded as an extremely serious matter for CESA and as such will be relentless in holding those in power accountable.
• Unlocking greater private sector participation is seen as a critical element to fast track delivery which will support engineering fees and as such engineering development in the industry. Private sector participation in this context refers to involvement on a more technical level (and not as a client), to improve municipal capacity and efficiency. Government must create an environment for the private sector so that it can play a much bigger role in infrastructure delivery. Many of the projects highlighted in the NDP can be carried out by the private sector through public-private partnerships.
• Service delivery, especially at municipal level remains a critical burning issue. The consulting engineering industry is threatened by incapacitated local and provincial governments. As major clients to the industry, it is important that these institutions become more effective, more proactive in identifying needs and priorities and more efficient in project implementation and – management.
• The involvement of non-CESA members in government tenders and procurement continues to threaten the standard and performance of the industry. Non-CESA members do not seem to comply with the same standards and principles as those firms that are members of CESA. Whether this is linked to complaints of “below cost” tendering during 2009, is not certain, but CESA members should be better informed about engaging in below cost tendering.
• Firms from across South African borders are tendering at rates that are not competitive for local firms. Complaints have been received of some of these firms not producing proper drawings and not attending site visits. Clients, unfortunately, are not always properly experienced or educated to conduct proper procurement assessments and unknowingly award contracts to these “unscrupulous” firms. While these occurrences may be limited to smaller rural areas, it remains an unacceptable practice.
• Lack of attention to maintain infrastructure poses a serious problem for the industry. Not only is it much more costly to build new infrastructure, but dilapidated infrastructure hampers economic growth potential. The cost of resurfacing a road after seven years at current prices, is estimated at R175 000 per kilometer, compared to R3 million per kilometer to rebuild, less than 6% of the construction price. In many cases, infrastructure is left to deteriorate to such a state, that maintenance becomes almost impossible.
• A further challenge to the industry is to find a way to standardize the procurement procedures applied by the different government departments. Procurement procedures should be standard for the country, or at least for the specific tier of government.
• Adapting to a low growth environment as outlook for infrastructure spending is hampered by poor
CESA Bi-annual economic and capacity survey: January – June 2015
Page 26 of 48
6. Market Profile 6.1 Sub-disciplines of fee income earned
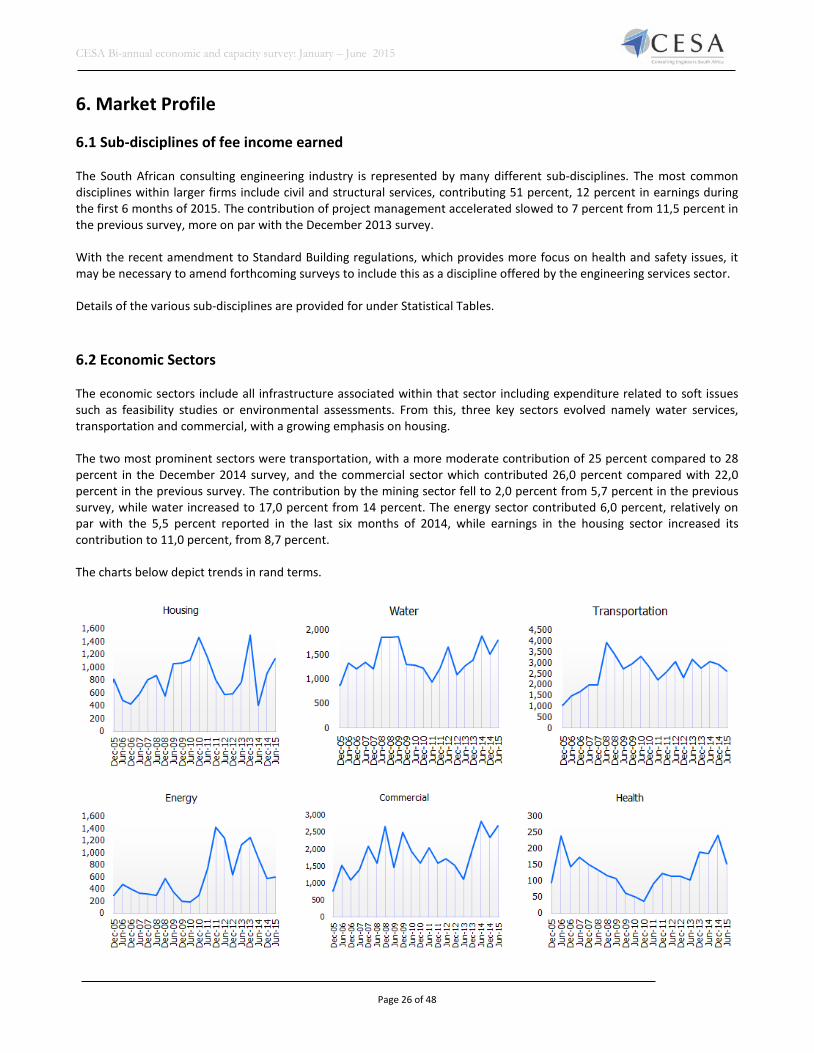
The South African consulting engineering industry is represented by many different sub-disciplines. The most common disciplines within larger firms include civil and structural services, contributing 51 percent, 12 percent in earnings during the first 6 months of 2015. The contribution of project management accelerated slowed to 7 percent from 11,5 percent in the previous survey, more on par with the December 2013 survey. With the recent amendment to Standard Building regulations, which provides more focus on health and safety issues, it may be necessary to amend forthcoming surveys to include this as a discipline offered by the engineering services sector. Details of the various sub-disciplines are provided for under Statistical Tables. 6.2 Economic Sectors The economic sectors include all infrastructure associated within that sector including expenditure related to soft issues such as feasibility studies or environmental assessments. From this, three key sectors evolved namely water services, transportation and commercial, with a growing emphasis on housing. The two most prominent sectors were transportation, with a more moderate contribution of 25 percent compared to 28 percent in the December 2014 survey, and the commercial sector which contributed 26,0 percent compared with 22,0 percent in the previous survey. The contribution by the mining sector fell to 2,0 percent from 5,7 percent in the previous survey, while water increased to 17,0 percent from 14 percent. The energy sector contributed 6,0 percent, relatively on par with the 5,5 percent reported in the last six months of 2014, while earnings in the housing sector increased its contribution to 11,0 percent, from 8,7 percent. The charts below depict trends in rand terms.
CESA Bi-annual economic and capacity survey : July – December 2013
Page 27 of 48
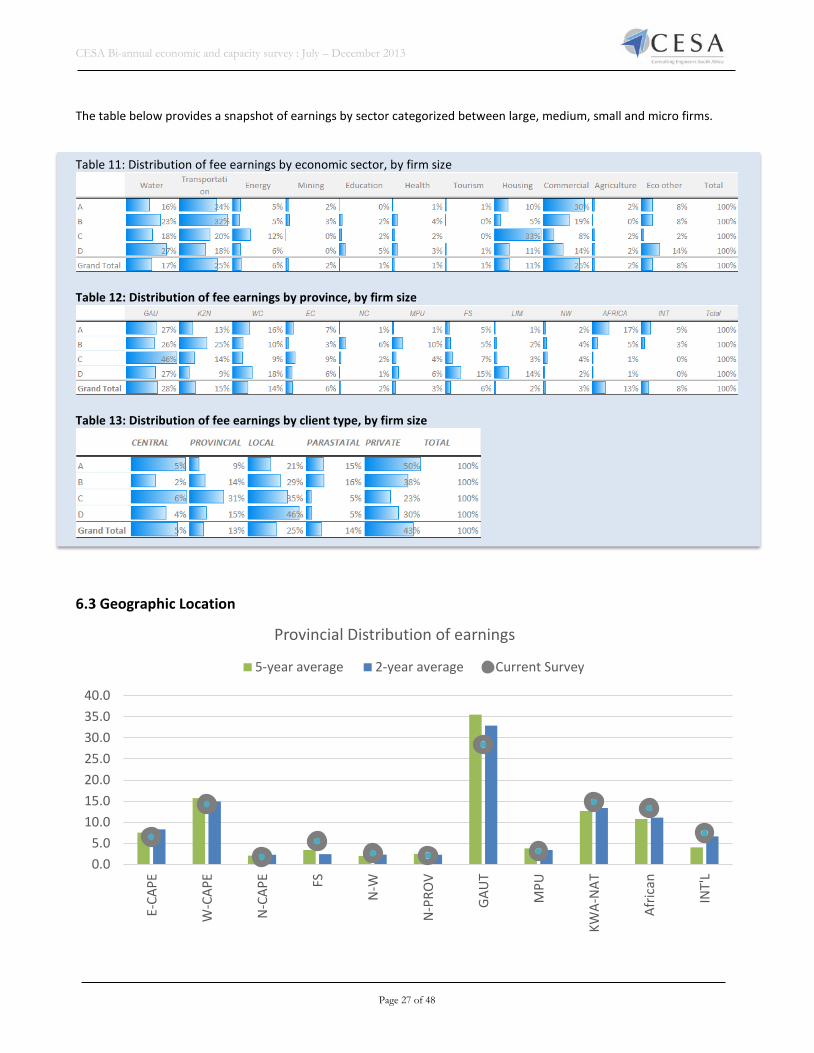
The table below provides a snapshot of earnings by sector categorized between large, medium, small and micro firms. Table 11: Distribution of fee earnings by economic sector, by firm size
Table 12: Distribution of fee earnings by province, by firm size
Table 13: Distribution of fee earnings by client type, by firm size
6.3 Geographic Location
0.05.0
10.015.020.025.030.035.040.0
E-CA
PE
W-C
APE
N-C
APE FS
N-W
N-P
ROV
GAU
T
MPU
KWA-
NAT
Afric
an
INT'
L
Provincial Distribution of earnings
5-year average 2-year average Current Survey

CESA Bi-annual economic and capacity survey : July – December 2013
Page 28 of 48
The contribution of earnings in Gauteng has slowly deteriorated when compared to the average percentage contribution over the last two and five years (refer to chart above). Gauteng contributed 28,0 percent to earnings in the first six months, from 24,6 percent in the last six months of 2014. Gauteng contributed around 40 percent during 2011/12. The contribution by the Western Cape also moderated in relation to the last two and five year averages, to 14,3 percent, although it was an improvement from the 12,4 percent reported in the previous survey. Kwazulu Natal increased its contributions to 14,8 percent, and has steadily increased its contribution over the last five years. Earnings in the Eastern Cape slowed to 6,5 percent of total earnings, also below historical averages. Earnings outside of South Africa is playing a more prominent role, and contributed 13,3 percent and 15,8 percent in terms of Africa over the last two surveys, and 11 percent and 7,5 percent internationally. 6.4 Clients
The contribution to fee earnings by the private sector rose to 43 percent, from 39 percent in the previous survey and is currently above the average contribution for the last two to five years. Earnings through local authorities also increased to 25,4 percent of total earnings, up from the previous survey and is also exceeding the average over the two to five year period. The contribution by central government and SOE’s slowed to 4,7 percent and 13,8 percent, while earnings from provincial government stabilized at around 13 percent. The public sector remains the most important client to the industry, but because of the slowdown in central government and SOE’s, its contribution has slowed to 57 percent from 61 percent in the previous survey. A breakdown of earnings by client type and firm size is provided in the table below.
Figure 20: Distribution of earnings by client type
CENTRAL, 4.7%
PROVINCIAL, 13.0%
LOCAL, 25.4%
PARASTATAL, 13.8%
PRIVATE, 43.1%
Client Distribution
0.0
10.0
20.0
30.0
40.0
50.0
Central Provincial Local Parastatals Private
Client Distribution based on fee earnings
5-Year average 2-year average Current Survey

CESA Bi-annual economic and capacity survey : July – December 2013
Page 29 of 48
Table 14: Fee earnings distribution by client by firm size Central Provincial Local Parastatals Private Total Large 5% 9% 21% 15% 50% 100.0% Medium 2% 14% 29% 16% 38% 100.0% Small 6% 31% 35% 5% 23% 100.0% Micro 4% 15% 46% 5% 30% 100.0% Total 5% 13% 25% 14% 43% 100.0% Average 2-Year
13.0 10.3 20.4 16.7 39.6 100.0%
Average 5-year
11.3 10.6 22.0 15.3 40.8 100.0%
7. Professional Indemnity Insurance The industry spends approximately between R200 million and R400 million on premiums for professional indemnity insurance, or roughly 1.2 percent of gross fee earnings. Majority of firms (64 percent) spend less than 1% of their income on insurance, but a few did report between 3 percent and 11 percent. Most of the larger firms reported a level of between 0,4 percent and 0,8 percent. Table 15: Average annual premium and limit of indemnity as percentage of gross fee income, by firm size category Firm size category
Average annual premium as percentage of gross fee income
Average Limit of Indemnity as % of gross fee income
Average deductible on PI as % of limit of indemnity
A 0.6 22.5 2.2 B 1.0 61.0 1.6 C 1.5 126.2 1.2 D 1.3 143.1 1.5 Average 1.2 99.0 1.5 Majority of firms (65%) reported a low risk exposure, while only 2,5 percent of the respondents reported to have a high risk exposure. Only a few firms reported on the value of claims paid by insurers as a percentage of premiums paid, so the results from this section of the survey is deemed unreliable and not suitable for analytical purposes. Approximately 27 percent of the responding firms, reported claims over the last five years, averaging 2,2 claims per firm, slightly lower than the 2,6 average in the previous two surveys. On average (based on limited responses), of the 73 claims reported by participating firms, 5 (or 7 percent) were not refunded, and compares well with the previous survey. The industry’s average limit of indemnity (LOI) as a percentage of gross fee income over the 12 month period increased substantially compared to previous surveys, mainly due to participation of larger firms that affected the average. The limit of indemnity averaged between 2 percent and 48 percent for larger firms, an average of 23 percent. It is much higher for medium and smaller size firms, averaging 48 and 143 percent respectively. The industry average in terms of deductibles as a percentage of the indemnity limit averaged 1,5percent in the June 2015 survey, compared to 2,2 percent in the December 2014 survey, and 2,8 percent in the previous survey. Larger firms averaged mostly between 1 percent and 3 percent, while majority of medium firms were below 2 percent.
CESA Bi-annual economic and capacity survey : July – December 2013
Page 30 of 48
8. Quality Management System A quality management system (QMS) is a control that is implemented at various stages of production process or service delivery stages. All firms are required to have a QMS as a condition of CESA membership. Majority of firms reported to have a QMS system in place (96 percent). While all the larger firms have the QMS in place, 90% of the micro enterprises currently comply. Having a QMS in place is now compulsory for all CESA members, who recognize the importance of good efficient quality control. CESA recommends the ISO:9001:2008 frame work, recognizing this framework as being comprehensive and internationally recognized. Members can, provided the correct procedures are followed, claim a portion of the skills development levy for quality management training. For more information on statutory requirements for members, please refer to the practice note released by CESA. Members are obliged to use accredited agents should they wish to obtain an ISO 9001:2008 certificate. Details of certification bodies used by Members consenting to make this information available, is published on the CESA website. On average 33 percent of the firms certified in this survey. Majority of the small to micro firms are not IS0 9001:2008 certified, compared to all of the larger firms (employing more than 100 people) and around 50 percent of the medium firms. An ISO certification is not a condition of membership at this stage.
CESA Bi-annual economic and capacity survey : July – December 2013
Page 31 of 48
Statistical Tables
CESA Bi-annual economic and capacity survey : July – December 2013
Page 32 of 48
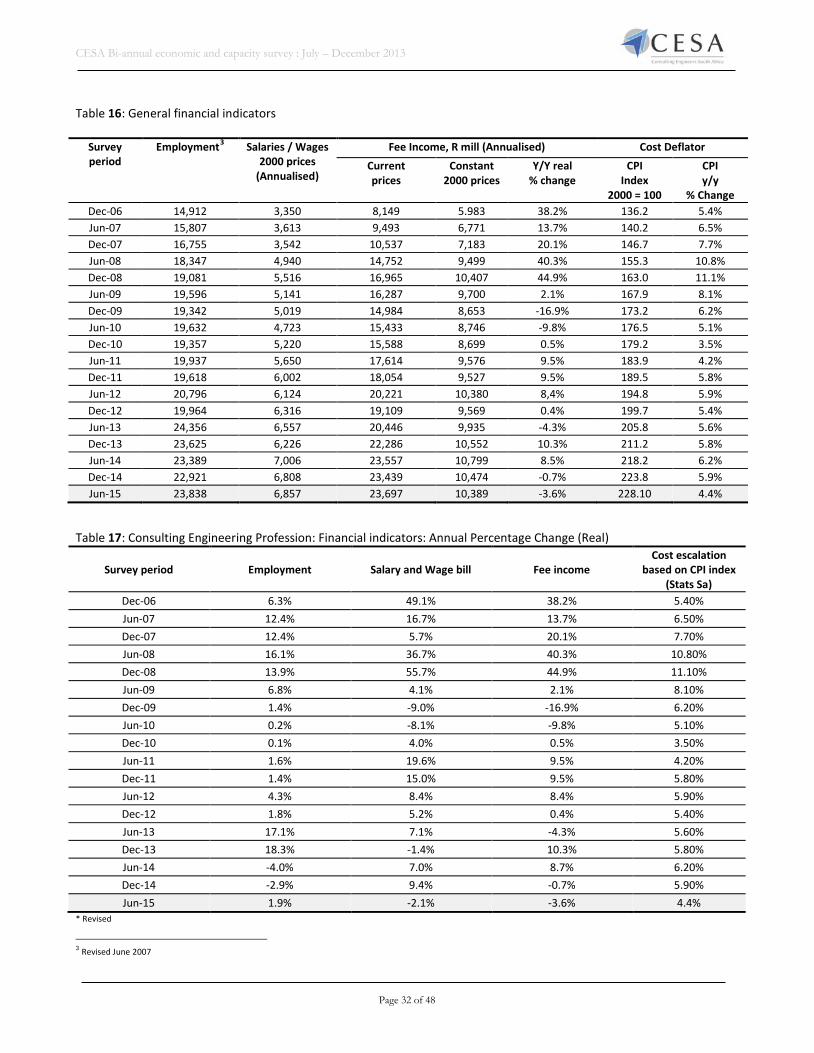
Table 16: General financial indicators
Survey period
Employment3 Salaries / Wages 2000 prices
(Annualised)
Fee Income, R mill (Annualised) Cost Deflator Current prices
Constant 2000 prices
Y/Y real % change
CPI Index
2000 = 100
CPI y/y
% Change Dec-06 14,912 3,350 8,149 5.983 38.2% 136.2 5.4% Jun-07 15,807 3,613 9,493 6,771 13.7% 140.2 6.5% Dec-07 16,755 3,542 10,537 7,183 20.1% 146.7 7.7% Jun-08 18,347 4,940 14,752 9,499 40.3% 155.3 10.8% Dec-08 19,081 5,516 16,965 10,407 44.9% 163.0 11.1% Jun-09 19,596 5,141 16,287 9,700 2.1% 167.9 8.1% Dec-09 19,342 5,019 14,984 8,653 -16.9% 173.2 6.2% Jun-10 19,632 4,723 15,433 8,746 -9.8% 176.5 5.1% Dec-10 19,357 5,220 15,588 8,699 0.5% 179.2 3.5% Jun-11 19,937 5,650 17,614 9,576 9.5% 183.9 4.2% Dec-11 19,618 6,002 18,054 9,527 9.5% 189.5 5.8% Jun-12 20,796 6,124 20,221 10,380 8,4% 194.8 5.9% Dec-12 19,964 6,316 19,109 9,569 0.4% 199.7 5.4% Jun-13 24,356 6,557 20,446 9,935 -4.3% 205.8 5.6% Dec-13 23,625 6,226 22,286 10,552 10.3% 211.2 5.8% Jun-14 23,389 7,006 23,557 10,799 8.5% 218.2 6.2% Dec-14 22,921 6,808 23,439 10,474 -0.7% 223.8 5.9% Jun-15 23,838 6,857 23,697 10,389 -3.6% 228.10 4.4%
Table 17: Consulting Engineering Profession: Financial indicators: Annual Percentage Change (Real)
Survey period Employment Salary and Wage bill Fee income Cost escalation
based on CPI index (Stats Sa)
Dec-06 6.3% 49.1% 38.2% 5.40% Jun-07 12.4% 16.7% 13.7% 6.50% Dec-07 12.4% 5.7% 20.1% 7.70% Jun-08 16.1% 36.7% 40.3% 10.80% Dec-08 13.9% 55.7% 44.9% 11.10% Jun-09 6.8% 4.1% 2.1% 8.10% Dec-09 1.4% -9.0% -16.9% 6.20% Jun-10 0.2% -8.1% -9.8% 5.10% Dec-10 0.1% 4.0% 0.5% 3.50% Jun-11 1.6% 19.6% 9.5% 4.20% Dec-11 1.4% 15.0% 9.5% 5.80% Jun-12 4.3% 8.4% 8.4% 5.90% Dec-12 1.8% 5.2% 0.4% 5.40% Jun-13 17.1% 7.1% -4.3% 5.60% Dec-13 18.3% -1.4% 10.3% 5.80% Jun-14 -4.0% 7.0% 8.7% 6.20% Dec-14 -2.9% 9.4% -0.7% 5.90% Jun-15 1.9% -2.1% -3.6% 4.4%
* Revised
3 Revised June 2007

CESA Bi-annual economic and capacity survey : July – December 2013
Page 33 of 48
Table 18: Sub-disciplines: Percentage share of earnings
Sub-discipline Jun-14 Dec-14 Jun-15 5-year
average 2-year
average Deviation 5-year
Deviation 2-year
Deviation last six months
Agricultural 2.4% 1.5% 0.4% 0.9% 1.3% -0.5% -2.4% -1.1%
Architecture 1.0% 1.2% 0.8% 0.5% 0.9% 0.3% -1.2% -0.4%
Mechanical building Services 2.3% 8.2% 3.1% 3.7% 4.8% -0.6% -9.9% -5.1%
Civil 40.0% 45.0% 50.9% 43.8% 47.8% 7.1% -41.9% 5.9%
Electrical / Electronic 10.1% 5.1% 7.7% 6.7% 7.6% 1.0% -5.0% 2.6%
Environmental 3.7% 6.1% 2.0% 4.1% 3.5% -2.2% -7.6% -4.1%
Facilities Management (New) 0.3% 0.1% 1.2% 0.8% 0.2% 0.4% 0.8% 1.0%
Geotechnical 1.3% 1.4% 1.2% 1.1% 1.2% 0.1% -1.4% -0.2%
Industrial Process / Chemical 1.8% 3.6% 0.9% 1.7% 1.5% -0.8% -4.1% -2.6%
GIS 0.6% 0.3% 0.4% 0.6% 0.5% -0.3% -0.4% 0.1%
Hydraulics (New) 1.0% 1.1% 0.8% 0.8% 1.1% 0.0% -1.4% -0.3%
Information Systems / Technology 0.0% 1.5% 2.0% 0.6% 0.6% 1.4% -0.1% 0.5%
Marine 0.0% 0.0% 1.7% 1.0% 1.1% 0.8% 0.6% 1.7%
Mechanical 7.0% 2.1% 6.5% 3.3% 3.3% 3.2% 1.1% 4.4%
Mining 0.9% 0.7% 0.2% 2.8% 0.5% -2.6% -1.0% -0.5%
Project Management 10.3% 11.5% 6.7% 10.9% 9.1% -4.2% -13.8% -4.8%
Quantity Surveying 0.4% 0.3% 0.3% 0.3% 0.5% -0.1% -0.5% -0.1%
Structural 13.2% 9.8% 11.6% 14.9% 12.0% -3.3% -10.3% 1.7%
Town planning 3.5% 0.5% 1.7% 1.4% 2.8% 0.3% -1.6% 1.2%
Total 100.0% 100.0% 100.0%

CESA Bi-annual economic and capacity survey : July – December 2013
Page 34 of 48
Table 19: Sub-disciplines, Fee income R mill, Real 2000 prices
Sub-discipline Jun-14 Dec-14 Jun-15 Change last six months
Change last 12 months
Agricultural 259 159 43 -73.1% -83.4%
Architecture 110 124 86 -30.8% -21.7%
Mechanical building Services 247 859 325 -62.2% 31.4%
Civil 4,314 4,710 5,284 12.2% 22.5%
Electrical / Electronic 1,091 539 804 49.3% -26.2%
Environmental 399 637 205 -67.9% -48.7%
Facilities Management (New) 32 13 121 817.6% 280.4%
Geotechnical 137 142 121 -14.6% -12.0%
Industrial Process / Chemical 198 373 95 -74.6% -52.1%
GIS 62 28 38 36.0% -39.0%
Hydraulics (New) 111 113 81 -28.0% -26.8%
Information Systems / Technology 1 158 208 31.1% 15265.1%
Marine 3 0 180 - 5054.8%
Mechanical 759 221 676 206.0% -11.0%
Mining 102 77 22 -71.7% -78.8%
Project Management 1,107 1,203 699 -41.9% -36.9%
Quantity Surveying 41 36 28 -21.6% -30.7%
Structural 1,427 1,031 1,201 16.4% -15.9%
Town planning 380 51 174 239.5% -54.1%
Total 10,779 10,474 10,389 -0.8% -3.6%
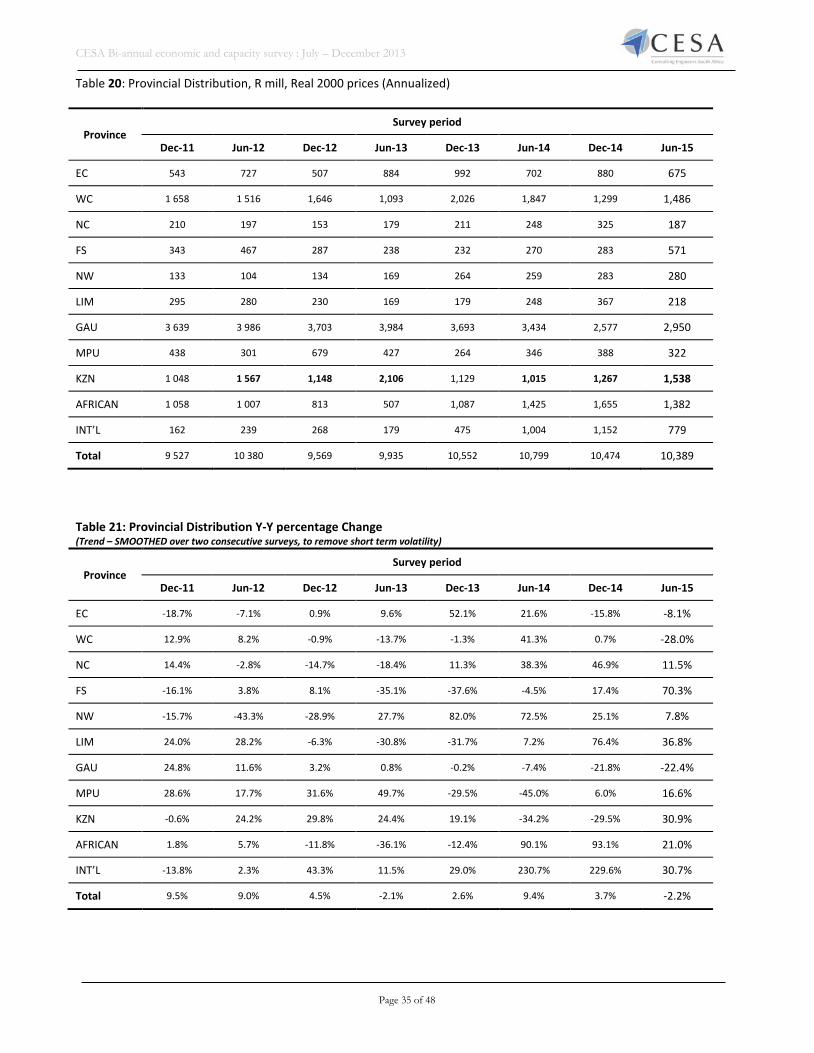
CESA Bi-annual economic and capacity survey : July – December 2013
Page 35 of 48
Table 20: Provincial Distribution, R mill, Real 2000 prices (Annualized)
Province Survey period
Dec-11 Jun-12 Dec-12 Jun-13 Dec-13 Jun-14 Dec-14 Jun-15
EC 543 727 507 884 992 702 880 675
WC 1 658 1 516 1,646 1,093 2,026 1,847 1,299 1,486
NC 210 197 153 179 211 248 325 187
FS 343 467 287 238 232 270 283 571
NW 133 104 134 169 264 259 283 280
LIM 295 280 230 169 179 248 367 218
GAU 3 639 3 986 3,703 3,984 3,693 3,434 2,577 2,950
MPU 438 301 679 427 264 346 388 322
KZN 1 048 1 567 1,148 2,106 1,129 1,015 1,267 1,538
AFRICAN 1 058 1 007 813 507 1,087 1,425 1,655 1,382
INT’L 162 239 268 179 475 1,004 1,152 779
Total 9 527 10 380 9,569 9,935 10,552 10,799 10,474 10,389
Table 21: Provincial Distribution Y-Y percentage Change (Trend – SMOOTHED over two consecutive surveys, to remove short term volatility)
Province Survey period
Dec-11 Jun-12 Dec-12 Jun-13 Dec-13 Jun-14 Dec-14 Jun-15
EC -18.7% -7.1% 0.9% 9.6% 52.1% 21.6% -15.8% -8.1%
WC 12.9% 8.2% -0.9% -13.7% -1.3% 41.3% 0.7% -28.0%
NC 14.4% -2.8% -14.7% -18.4% 11.3% 38.3% 46.9% 11.5%
FS -16.1% 3.8% 8.1% -35.1% -37.6% -4.5% 17.4% 70.3%
NW -15.7% -43.3% -28.9% 27.7% 82.0% 72.5% 25.1% 7.8%
LIM 24.0% 28.2% -6.3% -30.8% -31.7% 7.2% 76.4% 36.8%
GAU 24.8% 11.6% 3.2% 0.8% -0.2% -7.4% -21.8% -22.4%
MPU 28.6% 17.7% 31.6% 49.7% -29.5% -45.0% 6.0% 16.6%
KZN -0.6% 24.2% 29.8% 24.4% 19.1% -34.2% -29.5% 30.9%
AFRICAN 1.8% 5.7% -11.8% -36.1% -12.4% 90.1% 93.1% 21.0%
INT’L -13.8% 2.3% 43.3% 11.5% 29.0% 230.7% 229.6% 30.7%
Total 9.5% 9.0% 4.5% -2.1% 2.6% 9.4% 3.7% -2.2%
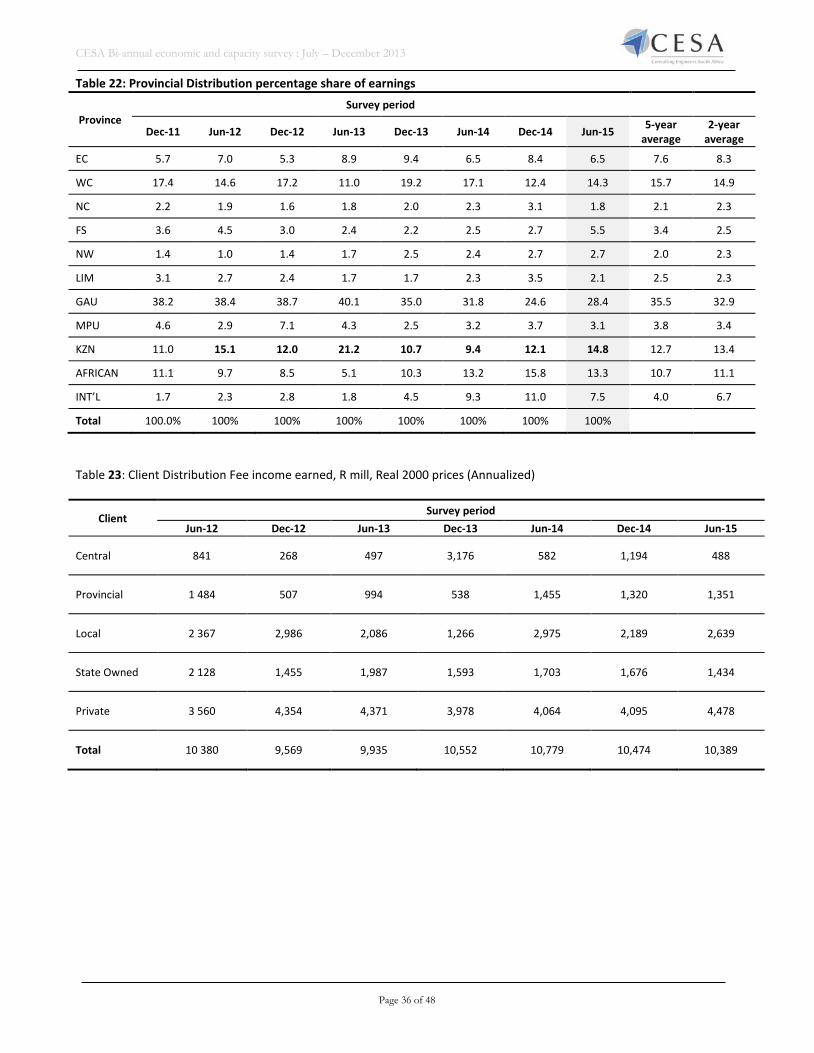
CESA Bi-annual economic and capacity survey : July – December 2013
Page 36 of 48
Table 22: Provincial Distribution percentage share of earnings
Province Survey period
Dec-11 Jun-12 Dec-12 Jun-13 Dec-13 Jun-14 Dec-14 Jun-15 5-year average
2-year average
EC 5.7 7.0 5.3 8.9 9.4 6.5 8.4 6.5 7.6 8.3
WC 17.4 14.6 17.2 11.0 19.2 17.1 12.4 14.3 15.7 14.9
NC 2.2 1.9 1.6 1.8 2.0 2.3 3.1 1.8 2.1 2.3
FS 3.6 4.5 3.0 2.4 2.2 2.5 2.7 5.5 3.4 2.5
NW 1.4 1.0 1.4 1.7 2.5 2.4 2.7 2.7 2.0 2.3
LIM 3.1 2.7 2.4 1.7 1.7 2.3 3.5 2.1 2.5 2.3
GAU 38.2 38.4 38.7 40.1 35.0 31.8 24.6 28.4 35.5 32.9
MPU 4.6 2.9 7.1 4.3 2.5 3.2 3.7 3.1 3.8 3.4
KZN 11.0 15.1 12.0 21.2 10.7 9.4 12.1 14.8 12.7 13.4
AFRICAN 11.1 9.7 8.5 5.1 10.3 13.2 15.8 13.3 10.7 11.1
INT’L 1.7 2.3 2.8 1.8 4.5 9.3 11.0 7.5 4.0 6.7
Total 100.0% 100% 100% 100% 100% 100% 100% 100%
Table 23: Client Distribution Fee income earned, R mill, Real 2000 prices (Annualized)
Client Survey period
Jun-12 Dec-12 Jun-13 Dec-13 Jun-14 Dec-14 Jun-15
Central 841 268 497 3,176 582 1,194 488
Provincial 1 484 507 994 538 1,455 1,320 1,351
Local 2 367 2,986 2,086 1,266 2,975 2,189 2,639
State Owned 2 128 1,455 1,987 1,593 1,703 1,676 1,434
Private 3 560 4,354 4,371 3,978 4,064 4,095 4,478
Total 10 380 9,569 9,935 10,552 10,779 10,474 10,389
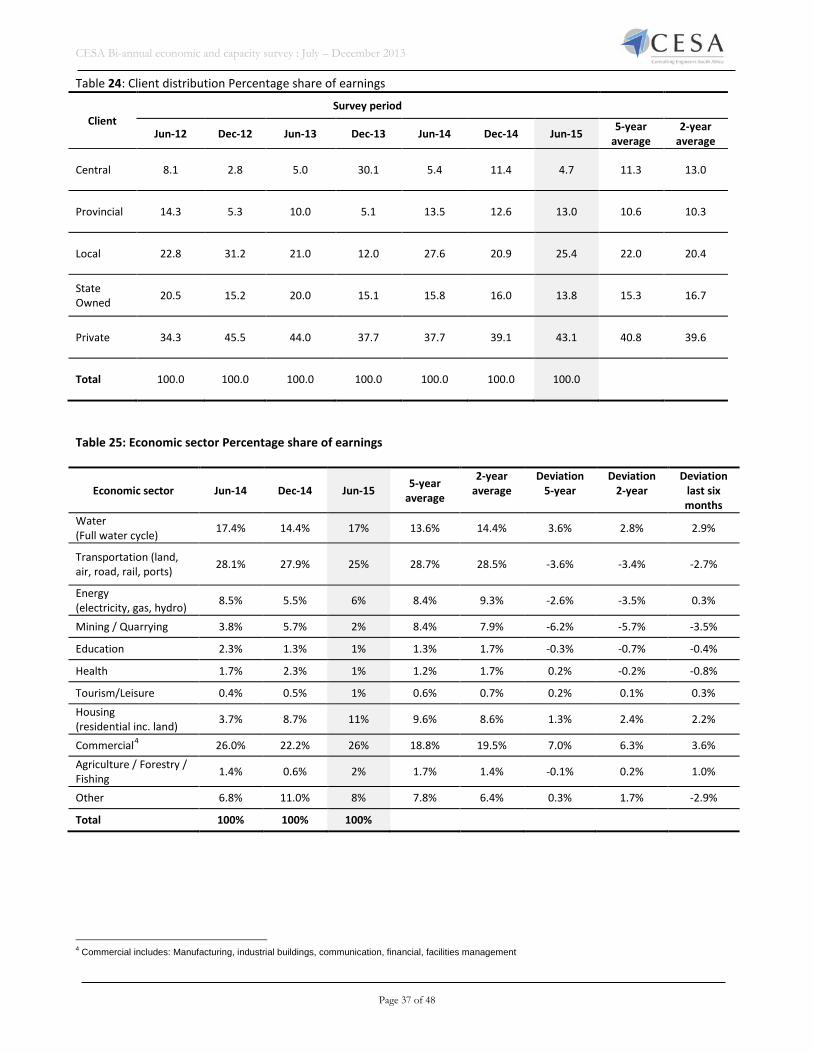
CESA Bi-annual economic and capacity survey : July – December 2013
Page 37 of 48
Table 24: Client distribution Percentage share of earnings
Client Survey period
Jun-12 Dec-12 Jun-13 Dec-13 Jun-14 Dec-14 Jun-15 5-year average
2-year average
Central 8.1 2.8 5.0 30.1 5.4 11.4 4.7 11.3 13.0
Provincial 14.3 5.3 10.0 5.1 13.5 12.6 13.0 10.6 10.3
Local 22.8 31.2 21.0 12.0 27.6 20.9 25.4 22.0 20.4
State Owned 20.5 15.2 20.0 15.1 15.8 16.0 13.8 15.3 16.7
Private 34.3 45.5 44.0 37.7 37.7 39.1 43.1 40.8 39.6
Total 100.0 100.0 100.0 100.0 100.0 100.0 100.0
Table 25: Economic sector Percentage share of earnings
Economic sector Jun-14 Dec-14 Jun-15 5-year average
2-year average
Deviation 5-year
Deviation 2-year
Deviation last six months
Water (Full water cycle) 17.4% 14.4% 17% 13.6% 14.4% 3.6% 2.8% 2.9%
Transportation (land, air, road, rail, ports) 28.1% 27.9% 25% 28.7% 28.5% -3.6% -3.4% -2.7%
Energy (electricity, gas, hydro) 8.5% 5.5% 6% 8.4% 9.3% -2.6% -3.5% 0.3%
Mining / Quarrying 3.8% 5.7% 2% 8.4% 7.9% -6.2% -5.7% -3.5%
Education 2.3% 1.3% 1% 1.3% 1.7% -0.3% -0.7% -0.4%
Health 1.7% 2.3% 1% 1.2% 1.7% 0.2% -0.2% -0.8%
Tourism/Leisure 0.4% 0.5% 1% 0.6% 0.7% 0.2% 0.1% 0.3%
Housing (residential inc. land) 3.7% 8.7% 11% 9.6% 8.6% 1.3% 2.4% 2.2%
Commercial4 26.0% 22.2% 26% 18.8% 19.5% 7.0% 6.3% 3.6%
Agriculture / Forestry / Fishing 1.4% 0.6% 2% 1.7% 1.4% -0.1% 0.2% 1.0%
Other 6.8% 11.0% 8% 7.8% 6.4% 0.3% 1.7% -2.9%
Total 100% 100% 100%
4 Commercial includes: Manufacturing, industrial buildings, communication, financial, facilities management

CESA Bi-annual economic and capacity survey : July – December 2013
Page 38 of 48
Table 26: Economic Sector Rm, Real 2000 prices, Annualized
Economic sector Jun-13 Dec-13 Jun-14 Dec-14 Jun-15
Per. Change last 6
months
Per. Change Last 12 months
Water (Full water cycle) 1,271 1,381 1,877 1,505 1,791 19.0% -4.6%
Transportation (land, air, road, rail, ports) 3,164 2,760 3,027 2,920 2,611 -10.6% -13.8%
Energy (electricity, gas, hydro) 1,123 1,255 911 571 600 5.0% -34.2%
Mining / Quarrying 1,656 564 406 594 224 -62.2% -44.8%
Education 86 237 250 140 102 -27.2% -59.1%
Health 102 189 185 241 153 -36.7% -17.5%
Tourism/Leisure 69 126 40 54 82 52.5% 103.2% Housing (residential inc. land) 762 1,501 397 908 1,134 24.9% 185.8%
Commercial 1,104 1,996 2,799 2,325 2,684 15.5% -4.1% Agriculture / Forestry / Fishing 286 70 150 67 167 149.0% 11.6%
Other 311 474 737 1,150 841 -26.8% 14.1% Total 9,935 10,552 10,779 10,474 10,389 -0.8% -3.6%
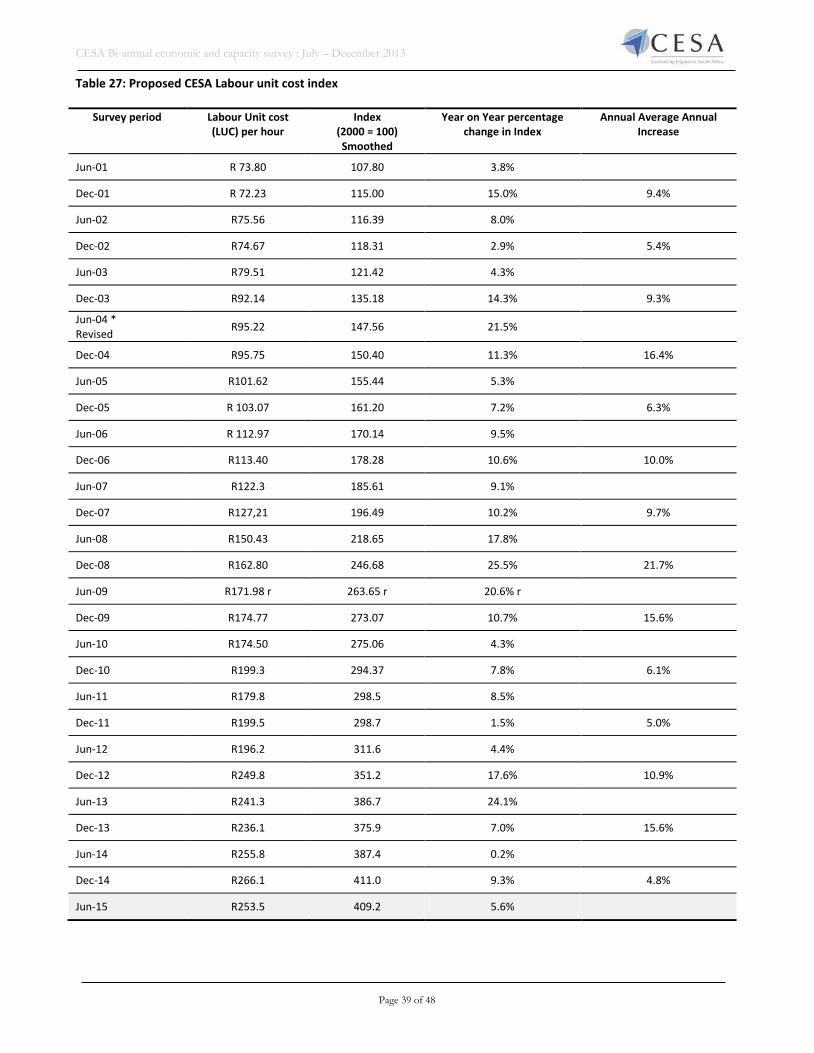
CESA Bi-annual economic and capacity survey : July – December 2013
Page 39 of 48
Table 27: Proposed CESA Labour unit cost index
Survey period Labour Unit cost (LUC) per hour
Index (2000 = 100) Smoothed
Year on Year percentage change in Index
Annual Average Annual Increase
Jun-01 R 73.80 107.80 3.8%
Dec-01 R 72.23 115.00 15.0% 9.4%
Jun-02 R75.56 116.39 8.0%
Dec-02 R74.67 118.31 2.9% 5.4%
Jun-03 R79.51 121.42 4.3%
Dec-03 R92.14 135.18 14.3% 9.3%
Jun-04 * Revised R95.22 147.56 21.5%
Dec-04 R95.75 150.40 11.3% 16.4%
Jun-05 R101.62 155.44 5.3%
Dec-05 R 103.07 161.20 7.2% 6.3%
Jun-06 R 112.97 170.14 9.5%
Dec-06 R113.40 178.28 10.6% 10.0%
Jun-07 R122.3 185.61 9.1%
Dec-07 R127,21 196.49 10.2% 9.7%
Jun-08 R150.43 218.65 17.8%
Dec-08 R162.80 246.68 25.5% 21.7%
Jun-09 R171.98 r 263.65 r 20.6% r
Dec-09 R174.77 273.07 10.7% 15.6%
Jun-10 R174.50 275.06 4.3%
Dec-10 R199.3 294.37 7.8% 6.1%
Jun-11 R179.8 298.5 8.5%
Dec-11 R199.5 298.7 1.5% 5.0%
Jun-12 R196.2 311.6 4.4%
Dec-12 R249.8 351.2 17.6% 10.9%
Jun-13 R241.3 386.7 24.1%
Dec-13 R236.1 375.9 7.0% 15.6%
Jun-14 R255.8 387.4 0.2%
Dec-14 R266.1 411.0 9.3% 4.8%
Jun-15 R253.5 409.2 5.6%
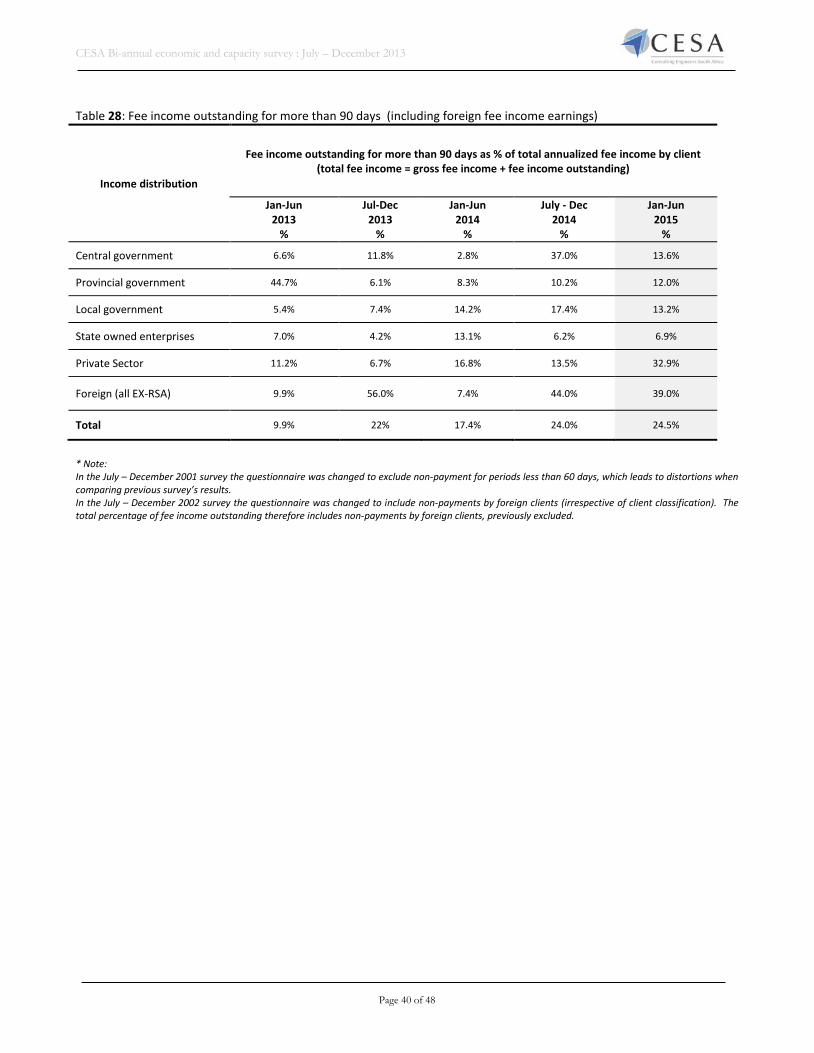
CESA Bi-annual economic and capacity survey : July – December 2013
Page 40 of 48
Table 28: Fee income outstanding for more than 90 days (including foreign fee income earnings)
* Note: In the July – December 2001 survey the questionnaire was changed to exclude non-payment for periods less than 60 days, which leads to distortions when comparing previous survey’s results. In the July – December 2002 survey the questionnaire was changed to include non-payments by foreign clients (irrespective of client classification). The total percentage of fee income outstanding therefore includes non-payments by foreign clients, previously excluded.
Income distribution
Fee income outstanding for more than 90 days as % of total annualized fee income by client (total fee income = gross fee income + fee income outstanding)
Jan-Jun 2013
%
Jul-Dec 2013
%
Jan-Jun 2014
%
July - Dec 2014
%
Jan-Jun 2015
%
Central government 6.6% 11.8% 2.8% 37.0% 13.6%
Provincial government 44.7% 6.1% 8.3% 10.2% 12.0%
Local government 5.4% 7.4% 14.2% 17.4% 13.2%
State owned enterprises 7.0% 4.2% 13.1% 6.2% 6.9%
Private Sector 11.2% 6.7% 16.8% 13.5% 32.9%
Foreign (all EX-RSA) 9.9% 56.0% 7.4% 44.0% 39.0%
Total 9.9% 22% 17.4% 24.0% 24.5%

CESA Bi-annual economic and capacity survey : July – December 2013
Page 41 of 48
Table 29: Contribution to education and training (excluding 1% CETA Levy)
5 Training now includes all training, in-house and external. Comparisons with previous surveys not compatible. – excludes costs related to salaries 6 Revised: Removed outlier questionnaire erroneously included in previous sample.
Survey Bursaries % of salary bill Bursaries R mill current prices
Training % of Salary bill5
Training R mill current prices
Dec-01 0,5% R9 1,5% R 25.7
Jun-02 0,5% R10 1,3% R 25.7
Dec-02 0,9% R19 0,7%6 R 14.6
Jun-03 0,6% R13 1,5% R 31.7
Dec-03 0,5% R11 1,3% R 28.0
Jun-04 0,6% R13 1,3% R30.0
Dec-04 0,5% R12 1,8% R44.6
Jun-05 0,6% R15 1,3% R33.7
Dec-05 0,7% R19 1,5% R44.2
Jun-06 0,9% R35 1,2% R48.5
Dec-06 0,6% R29 1,1% R49.7
Jun-07 0,9% R44 1,0% R52.2
Dec-07 0,6% R32 1,3% R67.0
Jun-08 1.1% R82 1.4% R107.4
Dec-08 0.5% R40 0.8% R70.1
Jun-09 0.6% R52 0.8% R68.2
Dec-09 0.4% R37 1.0% R88.9
Jun-10 0.9% R72 0.9% R74.2
Dec-10 0.4% R37 1.3% R121.6
Jun-11 0.5% R 53 0.3% R31.2
Dec-11 0.3% R34 1.9% R212
Jun-12 0.8% R95 1.2% R148
Dec-12 0.4% R50 0.5% R63
Jun-13 0.6% R81 1.0% R134
Dec-13 1.6% R210 0.6% R78
Jun-14 0.5% R76 0.4% R61
Dec-14 0.3% R46 0.4% R61
Jun-15 0.5% R78 0.4% R63
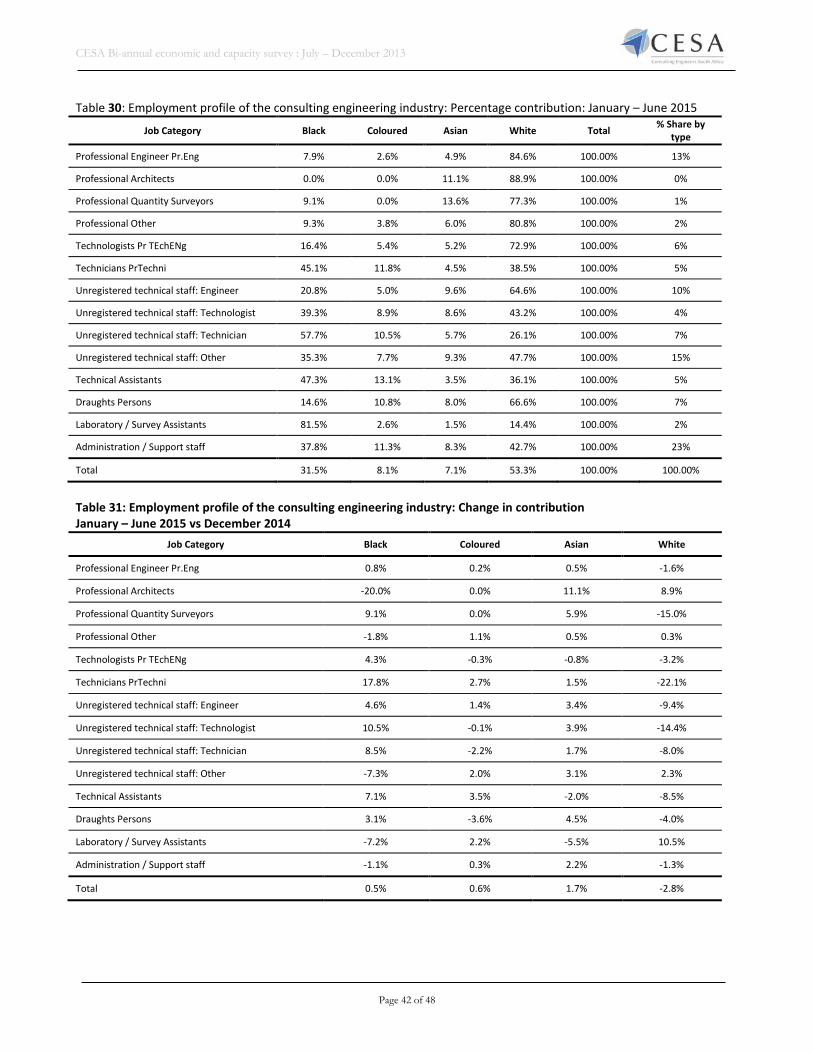
CESA Bi-annual economic and capacity survey : July – December 2013
Page 42 of 48
Table 30: Employment profile of the consulting engineering industry: Percentage contribution: January – June 2015
Job Category Black Coloured Asian White Total % Share by type
Professional Engineer Pr.Eng 7.9% 2.6% 4.9% 84.6% 100.00% 13%
Professional Architects 0.0% 0.0% 11.1% 88.9% 100.00% 0%
Professional Quantity Surveyors 9.1% 0.0% 13.6% 77.3% 100.00% 1%
Professional Other 9.3% 3.8% 6.0% 80.8% 100.00% 2%
Technologists Pr TEchENg 16.4% 5.4% 5.2% 72.9% 100.00% 6%
Technicians PrTechni 45.1% 11.8% 4.5% 38.5% 100.00% 5%
Unregistered technical staff: Engineer 20.8% 5.0% 9.6% 64.6% 100.00% 10%
Unregistered technical staff: Technologist 39.3% 8.9% 8.6% 43.2% 100.00% 4%
Unregistered technical staff: Technician 57.7% 10.5% 5.7% 26.1% 100.00% 7%
Unregistered technical staff: Other 35.3% 7.7% 9.3% 47.7% 100.00% 15%
Technical Assistants 47.3% 13.1% 3.5% 36.1% 100.00% 5%
Draughts Persons 14.6% 10.8% 8.0% 66.6% 100.00% 7%
Laboratory / Survey Assistants 81.5% 2.6% 1.5% 14.4% 100.00% 2%
Administration / Support staff 37.8% 11.3% 8.3% 42.7% 100.00% 23%
Total 31.5% 8.1% 7.1% 53.3% 100.00% 100.00%
Table 31: Employment profile of the consulting engineering industry: Change in contribution January – June 2015 vs December 2014
Job Category Black Coloured Asian White
Professional Engineer Pr.Eng 0.8% 0.2% 0.5% -1.6%
Professional Architects -20.0% 0.0% 11.1% 8.9%
Professional Quantity Surveyors 9.1% 0.0% 5.9% -15.0%
Professional Other -1.8% 1.1% 0.5% 0.3%
Technologists Pr TEchENg 4.3% -0.3% -0.8% -3.2%
Technicians PrTechni 17.8% 2.7% 1.5% -22.1%
Unregistered technical staff: Engineer 4.6% 1.4% 3.4% -9.4%
Unregistered technical staff: Technologist 10.5% -0.1% 3.9% -14.4%
Unregistered technical staff: Technician 8.5% -2.2% 1.7% -8.0%
Unregistered technical staff: Other -7.3% 2.0% 3.1% 2.3%
Technical Assistants 7.1% 3.5% -2.0% -8.5%
Draughts Persons 3.1% -3.6% 4.5% -4.0%
Laboratory / Survey Assistants -7.2% 2.2% -5.5% 10.5%
Administration / Support staff -1.1% 0.3% 2.2% -1.3%
Total 0.5% 0.6% 1.7% -2.8%
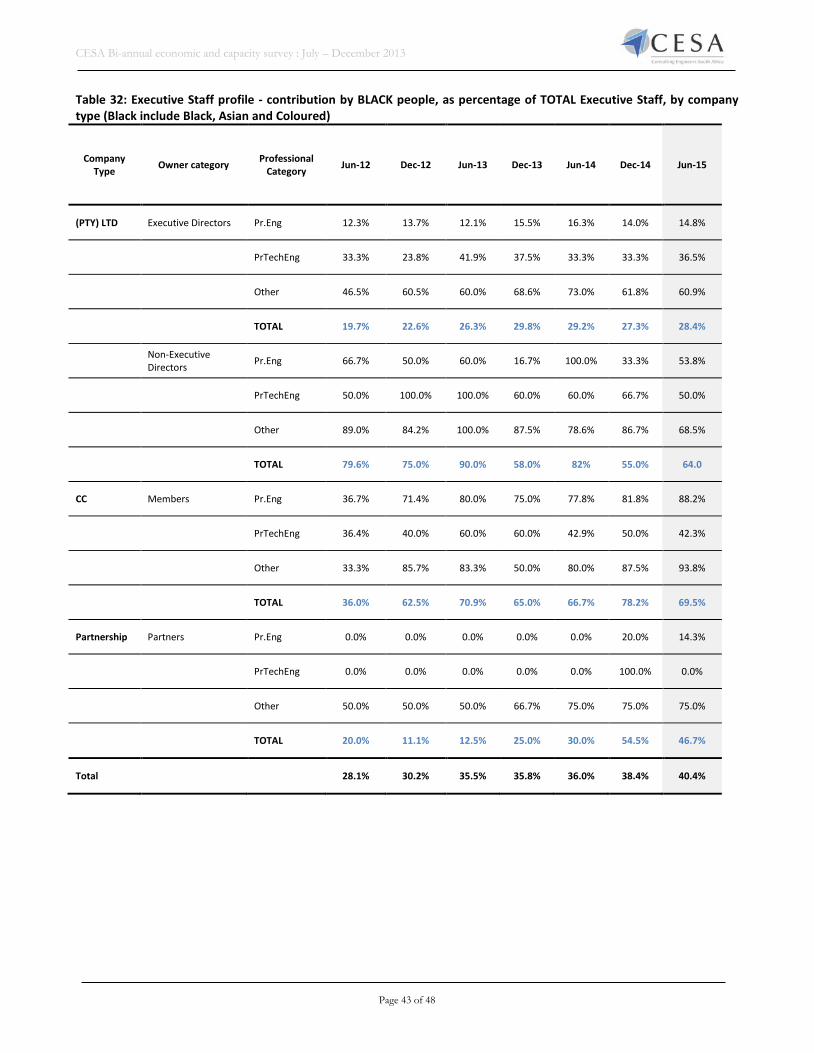
CESA Bi-annual economic and capacity survey : July – December 2013
Page 43 of 48
Table 32: Executive Staff profile - contribution by BLACK people, as percentage of TOTAL Executive Staff, by company type (Black include Black, Asian and Coloured)
Company Type Owner category Professional
Category Jun-12 Dec-12 Jun-13 Dec-13 Jun-14 Dec-14 Jun-15
(PTY) LTD Executive Directors Pr.Eng 12.3% 13.7% 12.1% 15.5% 16.3% 14.0% 14.8%
PrTechEng 33.3% 23.8% 41.9% 37.5% 33.3% 33.3% 36.5%
Other 46.5% 60.5% 60.0% 68.6% 73.0% 61.8% 60.9%
TOTAL 19.7% 22.6% 26.3% 29.8% 29.2% 27.3% 28.4%
Non-Executive Directors Pr.Eng 66.7% 50.0% 60.0% 16.7% 100.0% 33.3% 53.8%
PrTechEng 50.0% 100.0% 100.0% 60.0% 60.0% 66.7% 50.0%
Other 89.0% 84.2% 100.0% 87.5% 78.6% 86.7% 68.5%
TOTAL 79.6% 75.0% 90.0% 58.0% 82% 55.0% 64.0
CC Members Pr.Eng 36.7% 71.4% 80.0% 75.0% 77.8% 81.8% 88.2%
PrTechEng 36.4% 40.0% 60.0% 60.0% 42.9% 50.0% 42.3%
Other 33.3% 85.7% 83.3% 50.0% 80.0% 87.5% 93.8%
TOTAL 36.0% 62.5% 70.9% 65.0% 66.7% 78.2% 69.5%
Partnership Partners Pr.Eng 0.0% 0.0% 0.0% 0.0% 0.0% 20.0% 14.3%
PrTechEng 0.0% 0.0% 0.0% 0.0% 0.0% 100.0% 0.0%
Other 50.0% 50.0% 50.0% 66.7% 75.0% 75.0% 75.0%
TOTAL 20.0% 11.1% 12.5% 25.0% 30.0% 54.5% 46.7%
Total 28.1% 30.2% 35.5% 35.8% 36.0% 38.4% 40.4%

CESA Bi-annual economic and capacity survey : July – December 2013
Page 44 of 48
Table 33: CESA Confidence index: % respondents satisfied with working conditions
Survey Period CESA Confidence Index % Change on previous survey
% Change on survey same time last year
Dec-99 38.5 20.31% -43.4%
Jun-00 44.0 14.29% 37.5%
Dec-00 66.5 51.05% 72.6%
Jun-01 71.9 8.23% 63.5%
Dec-01 85.4 18.67% 28.4%
Jun-02 87.3 2.24% 21.3%
Dec-02 97.2 11.34% 13.8%
Jun-03 83.8 -13.76% -3.9%
Dec-03 64.2 -23.38% -33.9%
Jun-04 77.2 20.25% -7.9%
Dec-04 86.3 11.77% 34.4%
Jun-05 96.8 12.2% 25.4%
Dec-05 99.3 2.5% 14.9%
Jun-06 99.7 0.5% 3.0%
Dec-06 98.4 -1.30 -0.8
Jun-07 99.4 1.0% -0.3%
Dec-07 99.8 0.4% 1.4%
Jun-08 99.9 0.1% 0.5%
Dec-08 99.8 -0.1% 0.0%
Jun-09 96.2 -3.61% -3.7%
Dec-09 86.0 -10.6% -13.8%
Jun-10 87.1 1.3% -9.4%
Dec-10 86.7 -0.5% 0.8%
Jun-11 83.2 -4.0% -4.5%
Dec-11 87.4 5.0% 0.8%
Jun-12 81.8 -6.4% -1.7%
Dec-12 70.0 -14.4% -19.9%
Jun-13 84.0 20.0% 2.7%
Dec-13 98.1 16.8% 40.1%
Jun-14 87.7 -10.6% 4.4%
Dec-14 46.3 -47.2% -52.8%
Jun-15 44.5 -3.9% -49.3%
Dec-15 (forecast) 56.0 25.8% 21.0%
Jun-16 (forecast) 59.4 6.1% 33.5%
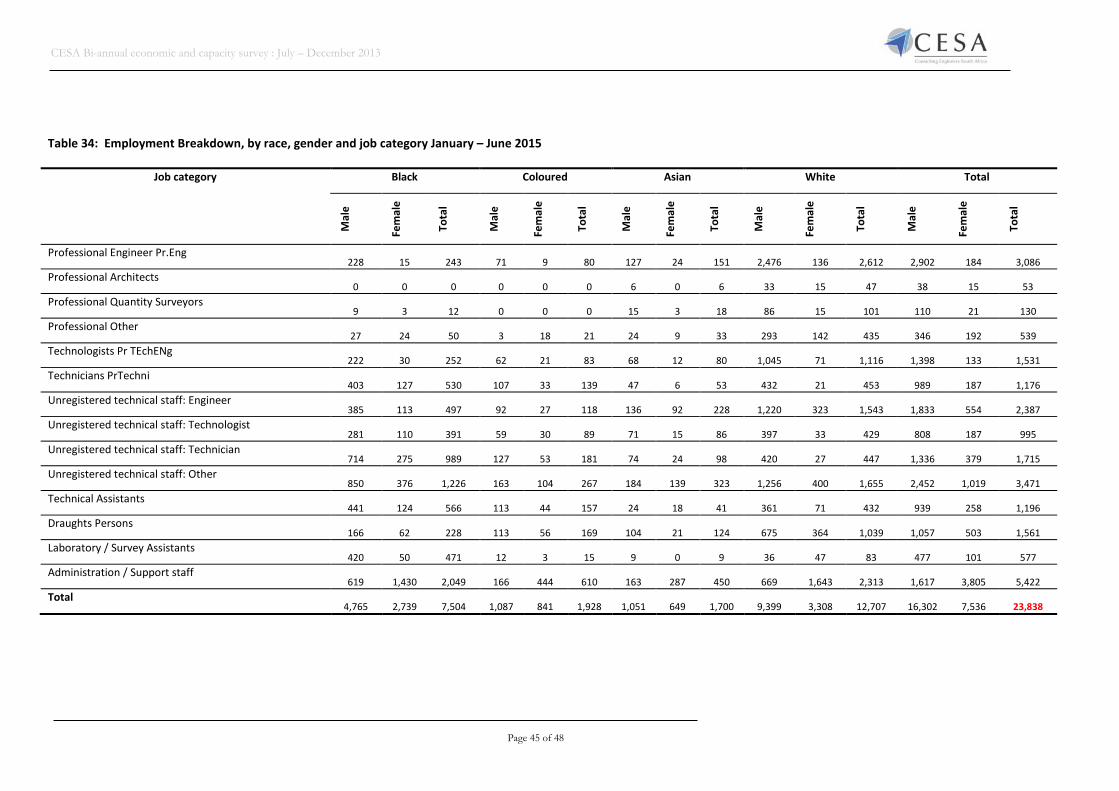
CESA Bi-annual economic and capacity survey : July – December 2013
Page 45 of 48
Table 34: Employment Breakdown, by race, gender and job category January – June 2015
Job category Black Coloured Asian White Total
Mal
e
Fem
ale
Tota
l
Mal
e
Fem
ale
Tota
l
Mal
e
Fem
ale
Tota
l
Mal
e
Fem
ale
Tota
l
Mal
e
Fem
ale
Tota
l
Professional Engineer Pr.Eng 228 15 243 71 9 80 127 24 151 2,476 136 2,612 2,902 184 3,086
Professional Architects 0 0 0 0 0 0 6 0 6 33 15 47 38 15 53
Professional Quantity Surveyors 9 3 12 0 0 0 15 3 18 86 15 101 110 21 130
Professional Other 27 24 50 3 18 21 24 9 33 293 142 435 346 192 539
Technologists Pr TEchENg 222 30 252 62 21 83 68 12 80 1,045 71 1,116 1,398 133 1,531
Technicians PrTechni 403 127 530 107 33 139 47 6 53 432 21 453 989 187 1,176
Unregistered technical staff: Engineer 385 113 497 92 27 118 136 92 228 1,220 323 1,543 1,833 554 2,387
Unregistered technical staff: Technologist 281 110 391 59 30 89 71 15 86 397 33 429 808 187 995
Unregistered technical staff: Technician 714 275 989 127 53 181 74 24 98 420 27 447 1,336 379 1,715
Unregistered technical staff: Other 850 376 1,226 163 104 267 184 139 323 1,256 400 1,655 2,452 1,019 3,471
Technical Assistants 441 124 566 113 44 157 24 18 41 361 71 432 939 258 1,196
Draughts Persons 166 62 228 113 56 169 104 21 124 675 364 1,039 1,057 503 1,561
Laboratory / Survey Assistants 420 50 471 12 3 15 9 0 9 36 47 83 477 101 577
Administration / Support staff 619 1,430 2,049 166 444 610 163 287 450 669 1,643 2,313 1,617 3,805 5,422
Total 4,765 2,739 7,504 1,087 841 1,928 1,051 649 1,700 9,399 3,308 12,707 16,302 7,536 23,838

CESA Bi-annual economic and capacity survey : July – December 2013
Page 46 of 48
Table 35: Employment Breakdown, by race, gender and job category January – June 2015: Percentage share
Job category Black Coloured Asian White Total
Mal
e
Fem
ale
Tota
l
Mal
e
Fem
ale
Tota
l
Mal
e
Fem
ale
Tota
l
Mal
e
Fem
ale
Tota
l
Mal
e
Fem
ale
Tota
l
Professional Engineer Pr.Eng 1.0% 0.1% 1.0% 0.3% 0.0% 0.3% 0.5% 0.1% 0.6% 10.4% 0.6% 11.0% 12.2% 0.8% 12.9%
Professional Architects 0.0% 0.0% 0.0% 0.0% 0.0% 0.0% 0.0% 0.0% 0.0% 0.1% 0.1% 0.2% 0.2% 0.1% 0.2%
Professional Quantity Surveyors 0.0% 0.0% 0.0% 0.0% 0.0% 0.0% 0.1% 0.0% 0.1% 0.4% 0.1% 0.4% 0.5% 0.1% 0.5%
Professional Other 0.1% 0.1% 0.2% 0.0% 0.1% 0.1% 0.1% 0.0% 0.1% 1.2% 0.6% 1.8% 1.5% 0.8% 2.3%
Technologists Pr TEchENg 0.9% 0.1% 1.1% 0.3% 0.1% 0.3% 0.3% 0.0% 0.3% 4.4% 0.3% 4.7% 5.9% 0.6% 6.4%
Technicians PrTechni 1.7% 0.5% 2.2% 0.4% 0.1% 0.6% 0.2% 0.0% 0.2% 1.8% 0.1% 1.9% 4.1% 0.8% 4.9%
Unregistered technical staff: Engineer 1.6% 0.5% 2.1% 0.4% 0.1% 0.5% 0.6% 0.4% 1.0% 5.1% 1.4% 6.5% 7.7% 2.3% 10.0%
Unregistered technical staff: Technologist 1.2% 0.5% 1.6% 0.2% 0.1% 0.4% 0.3% 0.1% 0.4% 1.7% 0.1% 1.8% 3.4% 0.8% 4.2%
Unregistered technical staff: Technician 3.0% 1.2% 4.1% 0.5% 0.2% 0.8% 0.3% 0.1% 0.4% 1.8% 0.1% 1.9% 5.6% 1.6% 7.2%
Unregistered technical staff: Other 3.6% 1.6% 5.1% 0.7% 0.4% 1.1% 0.8% 0.6% 1.4% 5.3% 1.7% 6.9% 10.3% 4.3% 14.6%
Technical Assistants 1.9% 0.5% 2.4% 0.5% 0.2% 0.7% 0.1% 0.1% 0.2% 1.5% 0.3% 1.8% 3.9% 1.1% 5.0%
Draughts Persons 0.7% 0.3% 1.0% 0.5% 0.2% 0.7% 0.4% 0.1% 0.5% 2.8% 1.5% 4.4% 4.4% 2.1% 6.5%
Laboratory / Survey Assistants 1.8% 0.2% 2.0% 0.0% 0.0% 0.1% 0.0% 0.0% 0.0% 0.1% 0.2% 0.3% 2.0% 0.4% 2.4%
Administration / Support staff 2.6% 6.0% 8.6% 0.7% 1.9% 2.6% 0.7% 1.2% 1.9% 2.8% 6.9% 9.7% 6.8% 16.0% 22.7%
Total 20.0% 11.5% 31.5% 4.6% 3.5% 8.1% 4.4% 2.7% 7.1% 39.4% 13.9% 53.3% 68.4% 31.6% 100.0%
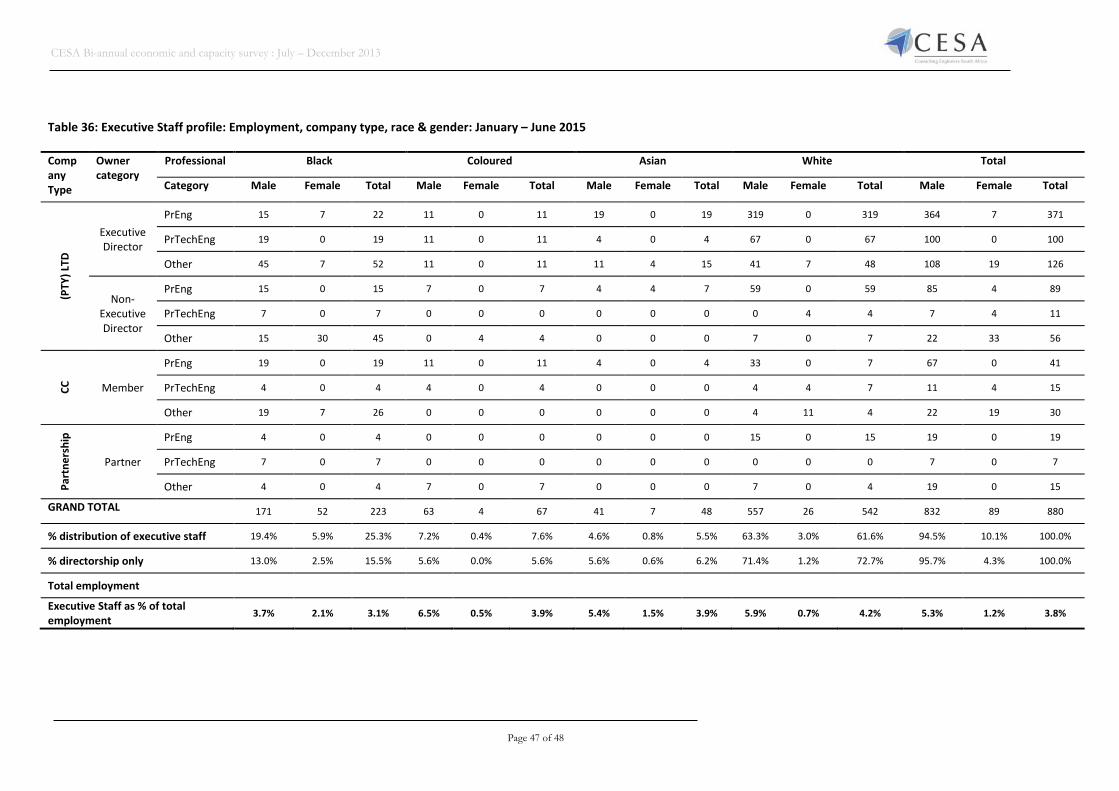
CESA Bi-annual economic and capacity survey : July – December 2013
Page 47 of 48
Table 36: Executive Staff profile: Employment, company type, race & gender: January – June 2015 Company Type
Owner category
Professional Black Coloured Asian White Total
Category Male Female Total Male Female Total Male Female Total Male Female Total Male Female Total
(PTY
) LTD
Executive Director
PrEng 15 7 22 11 0 11 19 0 19 319 0 319 364 7 371
PrTechEng 19 0 19 11 0 11 4 0 4 67 0 67 100 0 100
Other 45 7 52 11 0 11 11 4 15 41 7 48 108 19 126
Non-Executive Director
PrEng 15 0 15 7 0 7 4 4 7 59 0 59 85 4 89
PrTechEng 7 0 7 0 0 0 0 0 0 0 4 4 7 4 11
Other 15 30 45 0 4 4 0 0 0 7 0 7 22 33 56
CC
Member
PrEng 19 0 19 11 0 11 4 0 4 33 0 7 67 0 41
PrTechEng 4 0 4 4 0 4 0 0 0 4 4 7 11 4 15
Other 19 7 26 0 0 0 0 0 0 4 11 4 22 19 30
Part
ners
hip
Partner
PrEng 4 0 4 0 0 0 0 0 0 15 0 15 19 0 19
PrTechEng 7 0 7 0 0 0 0 0 0 0 0 0 7 0 7
Other 4 0 4 7 0 7 0 0 0 7 0 4 19 0 15
GRAND TOTAL 171 52 223 63 4 67 41 7 48 557 26 542 832 89 880
% distribution of executive staff 19.4% 5.9% 25.3% 7.2% 0.4% 7.6% 4.6% 0.8% 5.5% 63.3% 3.0% 61.6% 94.5% 10.1% 100.0%
% directorship only 13.0% 2.5% 15.5% 5.6% 0.0% 5.6% 5.6% 0.6% 6.2% 71.4% 1.2% 72.7% 95.7% 4.3% 100.0%
Total employment
Executive Staff as % of total employment
3.7% 2.1% 3.1% 6.5% 0.5% 3.9% 5.4% 1.5% 3.9% 5.9% 0.7% 4.2% 5.3% 1.2% 3.8%
CESA Bi-annual economic and capacity survey : July – December 2013
Page 48 of 48
End of report
For further information please contact
Consulting Engineers South Africa
Email CESA at [email protected]
CESA Head Office contact information is available below. The CESA also has branches throughout South Africa.
Telephonic Contacts
Tel: +27 (011) 463 2022 Fax: +27 (011) 463 7383
Physical Address
Fullham House, Hampton Park North, 20 Georgian Crescent
Bryanston Johannesburg, South Africa
Postal Address
PO Box 68482 Bryanston
Johannesburg, South Africa 2021