bi & epm oracle guide to management excellence v3.1.1 · bi & epm: the oracle guide to...
TRANSCRIPT
BI & EPM: The Oracle Guide to Management Excellence
September 2009
BI & EPM: The Oracle Guide to Management Excellence V3.1.1

BI & EPM: The Oracle Guide to Management Excellence
Disclaimer
The following is intended to outline our general product direction. It is intended for information purposes only, and may not be incorporated into any contract. It is not a commitment to deliver any material, code, or functionality, and should not be relied upon in making purchasing decisions. The development, release, and timing of any features or functionality described for Oracle’s products remains at the sole discretion of Oracle.
BI & EPM: The Oracle Guide to Management Excellence
Executive Overview............................................................................. 1
What Is an Enterprise Performance Management System? ............... 2
What is Enterprise Performance Management? ............................. 2
Benefits of Enterprise Performance Management .......................... 3
What is An Enterprise Performance Management System? ........... 5
What is Management Excellence?...................................................... 8
Management Excellence Defined ................................................... 8
What is the Management Excellence Framework? ........................... 12
Gain-to-Sustain ............................................................................. 14
Investigate-to-Invest...................................................................... 15
Design-to-Decide .......................................................................... 16
Plan-to-Act .................................................................................... 17
Analyze-to-Adjust .......................................................................... 19
Record-to-Report .......................................................................... 20
Management Excellence, Best Practices.......................................... 22
Gain to Sustain:............................................................................. 23
Investigate to Invest: ..................................................................... 25
Design to Decide:.......................................................................... 26
Plan to Act: .................................................................................... 28
Analyze to Adjust: ......................................................................... 30
Record to Report: .......................................................................... 32
Self-Evaluation .................................................................................. 36
BI & EPM: The Oracle Guide to Management Excellence
Overall EPM Questions................................................................. 36
External Reporting ........................................................................ 38
Strategic and Predictive Modeling................................................. 40
Integrated Business Planning ....................................................... 43
Profitability and Cost Management ............................................... 53
Scorecarding, Monitoring and Analysis ......................................... 59
Financial and Management Reporting .......................................... 65
Financial Consolidation and Reporting ......................................... 66
Bi Tools & Bi Applications, Real-Time Monitoring......................... 69
OLAP, Data Warehouse, Data Mining .......................................... 83
Data Integration, App Management & Master Data Management 89
Evaluating Current Systems and Future Needs................................ 96
External Reporting ........................................................................ 97
Strategic & Predictive Modeling .................................................. 106
Integrated Business Planning ..................................................... 107
Profitability and Cost Management ............................................. 116
Scorecarding, Monitoring and Analysis ....................................... 117
Financial and Management Reporting ........................................ 121
BI Tools & BI Applications, Read-Time Monitoring ..................... 123
OLAP, Data Warehouse, Data Mining ........................................ 127
Data Integration, App. Management & Master Data Management130
Creating an EPM “Center of Excellence” ........................................ 139
Introduction ................................................................................. 139

BI & EPM: The Oracle Guide to Management Excellence
What is an EPM Center of Excellence? ...................................... 140
Why Establish a Center of Excellence? ...................................... 141
Creating an EPM Center of Excellence....................................... 143
Roles and Responsibilities .......................................................... 145
What Can an EPM Center of Excellence Do for You? ................ 147
Reporting Structure and Organization......................................... 148
Funding an EPM Center of Excellence ....................................... 152
What Is Your Communication Plan? ........................................... 153
Best Practices in Implementation.................................................... 156
Case Studies................................................................................... 168
Valencia Regional Health Agency............................................... 168
BP ............................................................................................... 170
Doux Group................................................................................. 174
Fifth Third Bancorp...................................................................... 177
Fonterra Co-operative Group ...................................................... 182
Capabilities and Component Matrix ................................................ 186
Glossary .......................................................................................... 191
Authors and Contributors ................................................................ 195
BI & EPM: The Oracle Guide to Management Excellence
1
Executive Overview
“The Enterprise Performance Management revolution has begun, and the goal of EPM today is to extend Operational Excellence to Management Excellence,” says John Kopcke, Senior Vice President of Business Intelligence and Performance Management.
What if you could have timely, accurate, and relevant intelligence with which to plan and control your entire organization? What if you could have the most important metrics to measure the performance of the organization at your fingertips? What if all of your management systems could work together to provide what you need, when you need it?
Enterprise Performance Management (EPM) provides the answers to these questions and enables you to achieve not only Operational Excellence, but more importantly, Management Excellence.
This guide introduces concepts to help you understand EPM and the Management Excellence Framework, and leads you through considerations for applying them in your organization. These considerations include:
Evaluating your needs Selecting components of your EPM System Implementing with best practices Creating a center of excellence Learning from other customers via case studies You will find this reference helpful whether you are just starting your EPM and Management Excellence journey, or are seeking ideas to improve your current efforts.
For the purposes of this guide, an organization is defined as: companies, groups, nonprofit organizations, non-governmental organizations, governments and administrations, corporations, and associations. EPM applies to any “organization.”
BI & EPM: The Oracle Guide to Management Excellence
2
What Is an Enterprise Performance Management System?
What is Enterprise Performance Management?
Why Do I Need It Now?
The world of business has changed and continues to do so rapidly. Market dynamics today have immediate impact on a global scale, with markets showing high volatility almost cross all sectors. Organizations today are faced with higher degrees of uncertainty, forcing them to revisit management practices, and to develop superior capabilities to manage the current performance and long term sustainability of their business. Stakeholders and regulators are placing greater demands for transparency and accountability on these organizations. These new demands are added to the traditional risks faced by organizations—globalization, deregulation, technology advancements, and commoditization. Add to this the complexities of sourcing, inter-company collaboration, and trying to improve management processes to become lean. Data is also becoming increasingly more complex and voluminous to store and analyze. As a result, executives are facing more pressure to ensure that information about their operations is correct and consistent. They must have confidence in their processes and, ultimately, in the results that they are reporting.
Organizations now must scrutinize how they manage the performance of their businesses. Performance management is often defined as a combination of management methodologies, key metrics and IT applications (including tools and infrastructure) that enable employees to define the information they need, monitor it, and then work to optimize results and outcomes to achieve personal or departmental objectives. Performance management should also include aligning the organization with strategic objectives across multiple organizational levels (personal, process, group, departmental, corporate, or business. But EPM provides even more.
What is EPM?
Enterprise Performance Management (EPM) is an emerging management discipline that focuses on supporting integrated management processes on a strategic, financial and operational level enabling organizations to invest in management excellence.
These management processes include strategic ones, such as gain-to-sustain, investigate-to-invest, and design-to-decide, as well as tactical and operational management processes, such as plan-to-
1

BI & EPM: The Oracle Guide to Management Excellence
3
act, analyze-to-adjust and record-to-report. EPM creates a competitive advantage for those organizations that adopt it by enabling them to reach a state of, what we call, “management excellence”; anticipating and responding to changing business conditions faster and with more insight than their peers, improving their strategic agility to act on those insights, and improving alignment and collaboration between individual business units and external stakeholders.
EPM must help connect all the performance management processes enterprise-wide. It is no longer acceptable solely to connect the processes within an organization, because value chains often cross organizational borders and involve multiple stakeholders.
Benefits of Enterprise Performance Management
Businesses that adopt EPM can improve their competitiveness and efficiency as well as reduce their business risk and the variability of future results. Organizations also may improve their strategic alignment, agility, and collaboration between individual business units, thereby moving the power of information from a select, chosen few, to all those who can use it productively. Stakeholder alignment, governance, being better prepared for changes, and being better able to run and manage your business are also benefits of EPM.
EPM creates a competitive advantage for those organizations that adopt it by enabling them to anticipate and respond to changing business conditions faster than their peers. An increasing number of industries are subject to globalization, deregulation, re-regulation, new technologies, and e-commerce. The capabilities of EPM can make the difference between an organization’s growth or decline, profitability or loss, survival or extinction.
EPM provides this benefit by:
Pervading all aspects of decision-making and enterprise management process at all levels of the organization
Creating a collaborative, real-time management environment in which managers, staff, partners, customers, and suppliers can interact regardless of their position in the supply chain
Delivering targeted best practices and methodologies into the hands of business users where they can be most effectively employed
Being continually shaped and revised by the business users as their priorities and needs change
BI & EPM: The Oracle Guide to Management Excellence
4
Providing a standard defined repeatable process around the management of financial data, ensuring accuracy, believability, relevancy, and timeliness
Enabling all parts of the business to focus on the same corporate goals and understand how their choices, when combined with those of other business units, will improve the achievement of those goals
Empowering users with the simulation, calculation, and visualization tools that will enable them to improve their performance ability
Providing better communication functions to encourage collaboration and networking among teams
Eliminating many tedious tasks so that employees can devote more time to high-value tasks
Global compliance
An organization that adopts EPM ultimately will expect improvements in its financial performance. This is reflected in a variety of financial ratios, including return on assets (reflecting relative competitiveness), profit margin (relative efficiency), and price-to-earnings ratio (relative risk). Improvements in these financial indicators are signs of increased firm profitability, leading to a higher business valuation and higher rewards for the contributing business managers.
BI & EPM: The Oracle Guide to Management Excellence
5
What is An Enterprise Performance Management System?
Just as Enterprise Resource Planning (ERP) systems affected the way that organizations conducted and tracked day-to-day business activity, Enterprise Performance Management Systems are streamlining the way that organizations are being directed and managed.
An EPM system supports the complete management process enabling a team of business users, who participate in a business activity, to work collaboratively on shared information, rules, and logic regardless of the specific task they are undertaking at any time.
EPM systems should provide a simple way for organizations to support all components of the management process. For example, before EPM systems, it was not uncommon for a user to move back and forth between a budgeting application and a sales forecasting application to complete a “planning update” task. With an EPM system, when users move from one management “task” to another, they remain in the same system. And it should be easy to share data between the tasks. For this to be effective, the following factors must be in place:
Benefits of EPM…
Better collaboration and communication
Stakeholder alignment
Governance and compliance
Better preparation for changes
Better business management
Connected business processes
Business process framework
Better accountability and visibility
Timely information upon which to base critical decisions
Increased organizational flexibility (mergers and acquisitions, organizational changes)
Reduced risk
Ability to leverage Enterprise Resource Planning/Customer Resource Management
Increased return on investment
Decreased total cost of ownership
Better efficiency and adaptability
Standardization of management processes
Strategic, competitive advantage
Increased predictability
BI & EPM: The Oracle Guide to Management Excellence
6
Business users must have access to EPM applications specific to their needs and which are not generic management applications. They should be able to draw on domain knowledge and best practices from subject matter experts (internal or external to the organization).
Business users sharing an EPM application should be able to continually refine the application to meet their needs. If this is not the case, then business users will revert to their spreadsheets (or worse). As noted in the Best Practices section of this guide, organizations must make the EPM system as user friendly as possible to encourage adoption of the system.
It must be possible to link individual EPM applications, representing individual business activities, into a network of applications that covers the entire enterprise. This network eventually could extend beyond the organization to cover customers, suppliers, and partners in an extended supply-chain model.
It must be possible to manage data and data processes seamlessly in one system. This should include automating data refreshes, data transfer, ensuring data quality, integrity, and security/control.
EPM system deployment should be incremental, driven by business users, and focused on current business priorities, rather than as a monolithic, all-at-once enterprise application project. Otherwise, implementing an EPM system becomes an inhibiting factor in meeting its own goals of agility.
Implementing an EPM system enables organizations to:
Make aligned decisions across an enterprise based on insights derived from one version of the truth
Continuously reduce the latency between the occurrence of a business event and the realignment, communication, and execution of strategy and plans
Create transparency and visibility across the enterprise
Connect people, processes, and other systems in an optimal manner in order to become a performance-driven enterprise
Minimize the “total cost of ownership” of my Enterprise Performance Management solutions
BI & EPM: The Oracle Guide to Management Excellence
7
Be scalable in terms of data, users, and applications for future growth, including function and industry-specific reporting and analysis as well as forward-looking modeling, forecasting and performance management on a common BI foundation.
Enterprise Performance Management is an accepted discipline that enables organizations to improve their competitiveness and efficiency, reduce business risk, achieve strategic alignment, improve agility, and improve collaboration between business units. An Enterprise Performance Management System is a comprehensive set of enterprise applications and technology that support the adoption of the EPM methodology.
EPM systems are being used to create Performance-Accountable Organizations and to achieve Management Excellence.
The next section will examine the concept of Management Excellence in more detail.
BI & EPM: The Oracle Guide to Management Excellence
8
What is Management Excellence?
Management Excellence Defined
Management Excellence (ME) is the result of implementing EPM well. The three pillars (being Smart, Agile and Aligned) enable organizations to have a better and broader understanding of their business, provide the ability to react to new challenges or seize new opportunities, and ensure internal alignment, as well as synchronization, with external stakeholders’ feedback.
With EPM supporting your management processes, the next step is to use EPM to help achieve Management Excellence. For the last ten or fifteen years, organizations have spent an enormous amount of money, time and effort on achieving operational excellence; driving cost and waste out of business processes, speeding up business operations, and improving quality of products and services. This is essential and every business must do this in order to survive. Customers simply expect a business to be efficient, fast and flawless. But the more you invest in operational excellence, the harder it gets to improve even more. And the more your competitors invest in it, the less of a differentiator it becomes for you.
2

BI & EPM: The Oracle Guide to Management Excellence
9
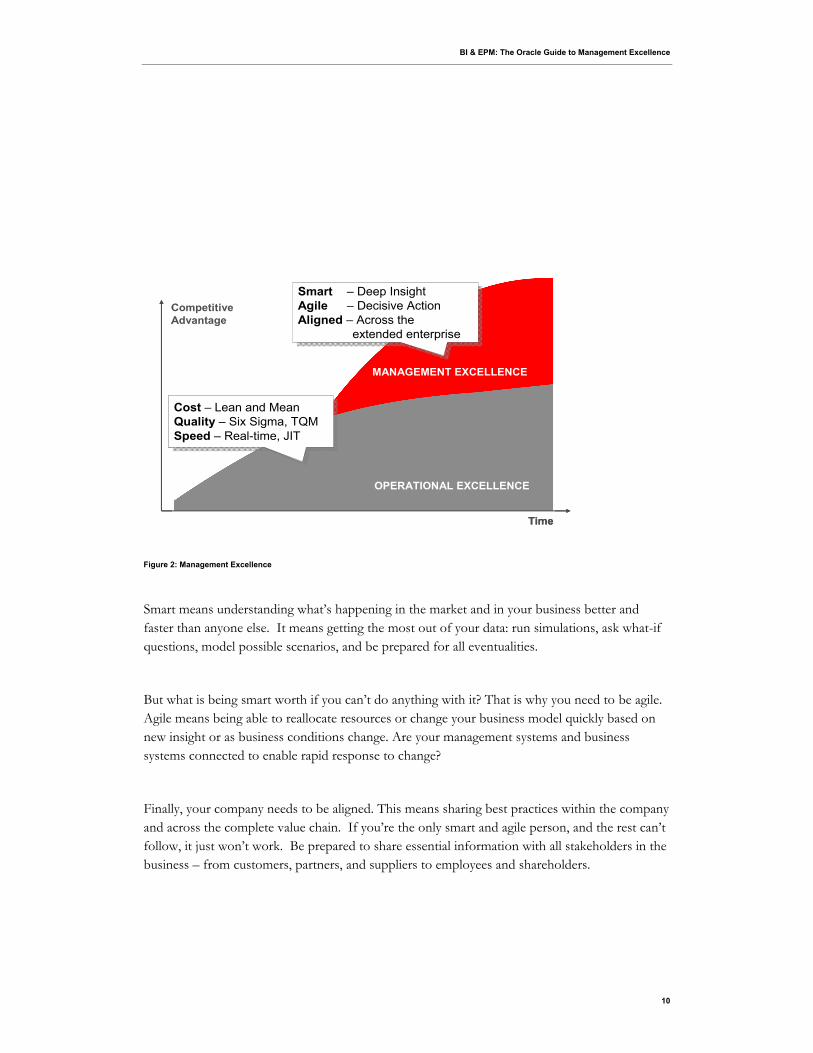
Figure 1: Operational Excellence
So what can you do to maintain your competitive edge in the coming months and years? You can take the operational excellence you have already achieved and build a new layer on top of it; a layer of management excellence. Where operational excellence is all about cost, quality and speed, management excellence is about becoming smart, agile and aligned.
Time
CompetitiveAdvantage
OPERATIONAL EXCELLENCE
MANAGEMENT EXCELLENCE
Cost – Lean and MeanQuality – Six Sigma, TQMSpeed – Real-time, JIT
Cost – Lean and MeanQuality – Six Sigma, TQMSpeed – Real-time, JIT
Time
CompetitiveAdvantage
OPERATIONAL EXCELLENCE
MANAGEMENT EXCELLENCE
Cost – Lean and MeanQuality – Six Sigma, TQMSpeed – Real-time, JIT
Cost – Lean and MeanQuality – Six Sigma, TQMSpeed – Real-time, JIT
Time
CompetitiveAdvantage
OPERATIONAL EXCELLENCE
MANAGEMENT EXCELLENCE
Cost – Lean and MeanQuality – Six Sigma, TQMSpeed – Real-time, JIT
Cost – Lean and MeanQuality – Six Sigma, TQMSpeed – Real-time, JIT
BI & EPM: The Oracle Guide to Management Excellence
10
Smart means understanding what’s happening in the market and in your business better and faster than anyone else. It means getting the most out of your data: run simulations, ask what-if questions, model possible scenarios, and be prepared for all eventualities.
But what is being smart worth if you can’t do anything with it? That is why you need to be agile. Agile means being able to reallocate resources or change your business model quickly based on new insight or as business conditions change. Are your management systems and business systems connected to enable rapid response to change?
Finally, your company needs to be aligned. This means sharing best practices within the company and across the complete value chain. If you’re the only smart and agile person, and the rest can’t follow, it just won’t work. Be prepared to share essential information with all stakeholders in the business – from customers, partners, and suppliers to employees and shareholders.
Time
CompetitiveAdvantage
OPERATIONAL EXCELLENCE
MANAGEMENT EXCELLENCE
Cost – Lean and MeanQuality – Six Sigma, TQMSpeed – Real-time, JIT
Cost – Lean and MeanQuality – Six Sigma, TQMSpeed – Real-time, JIT
Smart – Deep InsightAgile – Decisive ActionAligned – Across the
extended enterprise
Smart – Deep InsightAgile – Decisive ActionAligned – Across the
extended enterprise
Figure 2: Management Excellence

BI & EPM: The Oracle Guide to Management Excellence
11
Smart, agile and aligned companies are more confident, more trusted, and more successful. Their forecasts are more accurate, they can allocate resources more effectively, they have better control of working capital, and they can respond faster when conditions change. Not everyone loses when the economy turns.
If you can achieve management excellence on top of operational excellence, you’re in a great position to turn strategy into success.

BI & EPM: The Oracle Guide to Management Excellence
12
What is the Management Excellence Framework?
The Management Excellence Framework expands the scope of traditional performance management (which includes processes for business planning, monitoring business operations and business results reporting) to offer a framework that includes processes that link strategy to success by understanding the stakeholder environment, market model, and business model.
Now that most companies have achieved a certain level of operational excellence, it's no longer the differentiator it once was. To be successful today, you need to match operational excellence with management excellence. This is easier said than done.
Operational processes include order-to-cash, procure-to-pay, and hire-to-retire; but what are the management processes called? So far, they have not been formally identified or named. That is why we designed the Management Excellence framework, consisting of six core management processes. The Management Excellence framework is a way of understanding these critical processes, and ensuring you have them all in place to link strategy to plans and execution.
The traditional management processes give you a firm grip on the organization itself as their purpose is more internal control. We call these processes Plan-to-Act, Analyze-to-Adjust and Record-to-Report. But, good management also needs a strategic, external view, a view of what is happening out there in the market. Management needs to know what's coming and to be ready to change. These high-impact processes are called Gain-to-Sustain, Investigate-to-Invest and Design-to-Decide.
The Management Excellence framework explains each of these processes and identifies key performance indicators for each one. It also outlines the EPM techniques and technologies that you'll need to make them work for you.
3

BI & EPM: The Oracle Guide to Management Excellence
13
The Management Excellence framework expands the scope of traditional performance management to offer a framework by which companies can deliver Management Excellence. This framework expands the scope of traditional performance management to include the stakeholder environment, market model and business model.
Management Excellence consists of six core processes in which the output from one becomes the input for the next. Those processes are:
1. Gain-to-Sustain
2. Investigate-to-Invest
3. Design-to-Decide
4. Plan-to-Act
5. Analyze-to-Adjust
6. Record-to-Report
Gain to Sustain
Investigate to Invest
Designto Decide
Planto Act
Analyzeto Adjust
Recordto Report
Figure 3: Management Excellence: The Management Process Value Chain
BI & EPM: The Oracle Guide to Management Excellence
14
Gain-to-Sustain
The aim of Gain-to-Sustain is to ensure that the business gains all contributions from its stakeholders, in order to sustain business performance. To do this, you first need to understand all stakeholder contributions, and then have to make sure these contributions are aligned with corporate objectives. At the same time, you need to understand what each stakeholder expects in return, and make sure that these expectations are being met.
You could think of your company as a champion racing driver, standing on the podium, holding the trophy. But you haven't won it on your own. A huge number of people have contributed: the pit crew, the training team, the designers, and the finance people. Your business is no different.
Many stakeholders contribute to your success: employees, customers, suppliers, partners, shareholders and more. To get the most value out of these stakeholders - and to ensure they're getting what they need from you - you need to share information and maintain a continuous stakeholder dialogue. By sharing information about performance, goals and results, you can make stakeholders feel involved and valued.
You can improve your attractiveness as an employer and minimize investor turnover. You can inspire employees, keep customers informed and show partners how great you are to do business with. In turn, your stakeholders are motivated to contribute more to your success. It's a virtuous circle.
Stakeholders are vital to the success of your business. By understanding and catering to their needs, they'll work harder for you.
Gain to Sustain ensures that the business gains all the necessary contributions from its stakeholders to drive business
performance, while meeting the required stakeholder expectations.
BI & EPM: The Oracle Guide to Management Excellence
15
Other activities and Key Performance Indicators (KPIs) may include (but are not limited to):
Example activities:
Sustainability reporting
Supplier / customer scorecards
Financial reporting
Investigate-to-Invest
Investigate to Invest is the management process for identifying, evaluating and creating the market opportunities that will generate the highest returns, aligning to stakeholder expectations. It enables you to understand market dynamics and their potential. It then lets you match these market conditions with your own resources, assets and goals. You can use this information to invest - or divest - to get the right portfolio.
Imagine your company is a marathon runner. Your overall goal is to win, and your statistics show that you are heading towards a personal best. If you're in there to win, what's your personal record worth if you are overtaken by hundreds of others? Translated to business terms, your budget is a start, but your benchmark is the measure of success.
You can get a better grip on what's going on out there through activities like competitive analysis, benchmarking and scenario analysis. This will give you a better understanding of market share, market growth and capacity, brand value and buyer propensity to substitute.
Investigate to Invest is the management process for identifying, evaluating and creating the most attractive market opportunities
that generate the highest returns.

BI & EPM: The Oracle Guide to Management Excellence
16
Investigate to invest gives companies the flexibility to change tactics as market conditions change. That's a bonus at the best of times. In a world where the economic climate changes quickly, it's critical.
Other activities and KPIs may include (but are not limited to):
Example activities:
Market analysis
Benchmarking
Competitive analysis
Scenario analysis
Design-to-Decide
Design-to-Decide is the management process for creating a successful business model. It helps you to design the strategies that deliver the most value to customers and the most profit to you. In the design-to-decide process, you first explore possible scenarios by asking “what-if” questions. You then create potential strategies, also making sure that all risks are taken into account. Finally you set inspirational goals for your enterprise and decide on the right business model to achieve them.
The model will include your portfolio of products and services and the distribution channels you will use to get those products and services to customers. Developing the business model shouldn't be the responsibility of a single executive or department. Nor should it be set in stone. Instead, it should be a learning process based on continuous change, with all levels of management involved.
Design to Decide is the strategy formulation management process for designing the business infrastructure and partner network
to deliver value to customers in the most profitable way.

BI & EPM: The Oracle Guide to Management Excellence
17
A good analogy is with football/soccer. Scoring is the ultimate objective, but only a tiny fraction of goals are scored by a single player kicking the ball forward with one huge kick.
Almost all goals come out of position play, involving multiple players and using the opportunities that the game throws up. The key is to continually analyze external factors - using the investigate-to-invest process. Aim to be as flexible as possible and ready to change when new opportunities arise.
Design-to-decide is the third management process in the Management Excellence framework. Combined with gain-to-sustain and investigate-to-invest, it provides the information you need to build a successful business model and plan based on current market conditions.
Other activities and KPIs may include (but are not limited to):
Example activities:
Predictive modeling
Uncertainty management
Financial modeling, funding analysis
Portfolio analysis
Strategy mapping
Plan-to-Act
Plan-to-Act is a process for allocating capital and resources effectively across the organization. Its core elements are budgeting, planning and forecasting. A good plan has a few key aspects. It's
Plan to Act optimizes capital and resource allocations across the organization in order to effectively execute its strategy. This
process involves budgeting, planning and forecasting.
BI & EPM: The Oracle Guide to Management Excellence
18
consistent across the business, it's aligned with corporate goals, it builds commitment from stakeholders, and it makes sure the right resources are allocated.
Perhaps the most important aspect is that the plan must be flexible. It can - and should - change many times as circumstances change inside and outside the business.
Imagine your company is a mountain climber. You have an overall plan to reach the summit, but every step of the way, you have to re-assess the terrain and decide your next move. Successful business planning is just like that. You need to use the right resources at the right time, based on accurate insight into your current circumstances. In short, don't stick to the plan, stick to reality.
Use rolling forecasts to see when conditions are about to change, and then re-plan accordingly. Align operational plans with financial goals to ensure that the right budget and resources are available. Experiment continuously, but never lose sight of your overall objectives.
Plan to Act is a key management process for any business that wants to stay successful in a changing economy.
Other activities and KPIs may include (but are not limited to
Example activities:
Budgeting
Integrated financial/operational planning
Rolling forecasting
Activity-based costing
BI & EPM: The Oracle Guide to Management Excellence
19
Analyze-to-Adjust
Analyze-to-Adjust is a process that lets you analyze your performance and take appropriate action. It analyzes trends in your business and deviations from your goals and helps you identify their root causes. You can then benchmark this insight against the market, to see if it's a sector-wide trend or unique to your business. Depending on what you find, you may then decide to take appropriate preventive or corrective action. Finally, you can create a new, up to date forecast.
Analytical tools are crucial to this process. But for the process to work properly, you need to be able to analyze your entire value chain.
It's like a relay race. Each team member always runs as fast as they can. The difference lies in the way the baton is handed over. The team that does that the best usually wins the race. To make sure your value chain is working at full efficiency, you need to analyze performance across the board. A minor issue in one spot may be causing huge problems elsewhere.
But without proper analysis, you may never make the crucial connection - and the problems may just get worse. You probably already have a lot of analytics in your business. Unfortunately most analytics are fragmented. To gain true insight, you need to bring all of these together and get an accurate view of the business as a whole. That kind of insight lets you analyze and adjust performance on the fly - making your business more agile than the competition, and more successful.
Other activities and KPIs may include (but are not limited to
Example activities:
Variance analysis
Analyze to Adjust is the management process for analyzing trends and deviations -- and their root cause -- from an
organization’s goals in order to take corrective actions.
BI & EPM: The Oracle Guide to Management Excellence
20
Root-cause analysis
Line of Business specific analysis
Profitability analysis
Record-to-Report
Record-to-Report helps stakeholders inside and outside the organization to understand how the business is performing. It does this by providing them with feedback -- timely information about the strategy, finances and operations. Stakeholders can then use this information to make informed decisions. Shareholders can choose whether to increase their investment. Salespeople can see what they need to do to make their target. Regulators can decide whether the business is meeting its obligations.
To help your stakeholders make the right decisions, you need to give them good information. You must extract the right data from the right sources, transform it into meaningful information and present it in an insightful manner. If they receive meaningful data, your stakeholders will be able to make decisions that contribute to the business's success. They'll be more willing to invest their time, effort or money in ensuring that success. And they'll be more likely to provide feedback that helps you improve even more. This is why it's so important to share information and to create a dialogue with all stakeholders.
It's a bit like a scoreboard in sports: no scores, no fun and if you show your team how well you're doing against the competition and they'll be even more motivated to go for gold. But sharing information is only useful if it's accurate and timely. If it's out of date, or inaccurate, or insufficient, your stakeholders may end up making the wrong decisions, or doing nothing at all while they could be making a positive difference. Creating a transparent company builds trust, confidence and motivation.
Record to Report is the management process for providing strategic, financial and operational feedback to all stakeholders
inside and outside the organization, to understand how a business is performing.

BI & EPM: The Oracle Guide to Management Excellence
21
Studies show that the companies that provide fast, full and meaningful reports are more successful and more trusted in the marketplace. A fast financial close and detailed, accurate reporting can make a huge amount of difference to your business's reputation and standing, both internally and externally. An effective record-to-report process can help you get there.
Other activities and KPIs may include (but are not limited to)
Example activities:
Management reporting
Financial reporting
Audits
Regulatory Filings
BI & EPM: The Oracle Guide to Management Excellence
22
Management Excellence, Best Practices
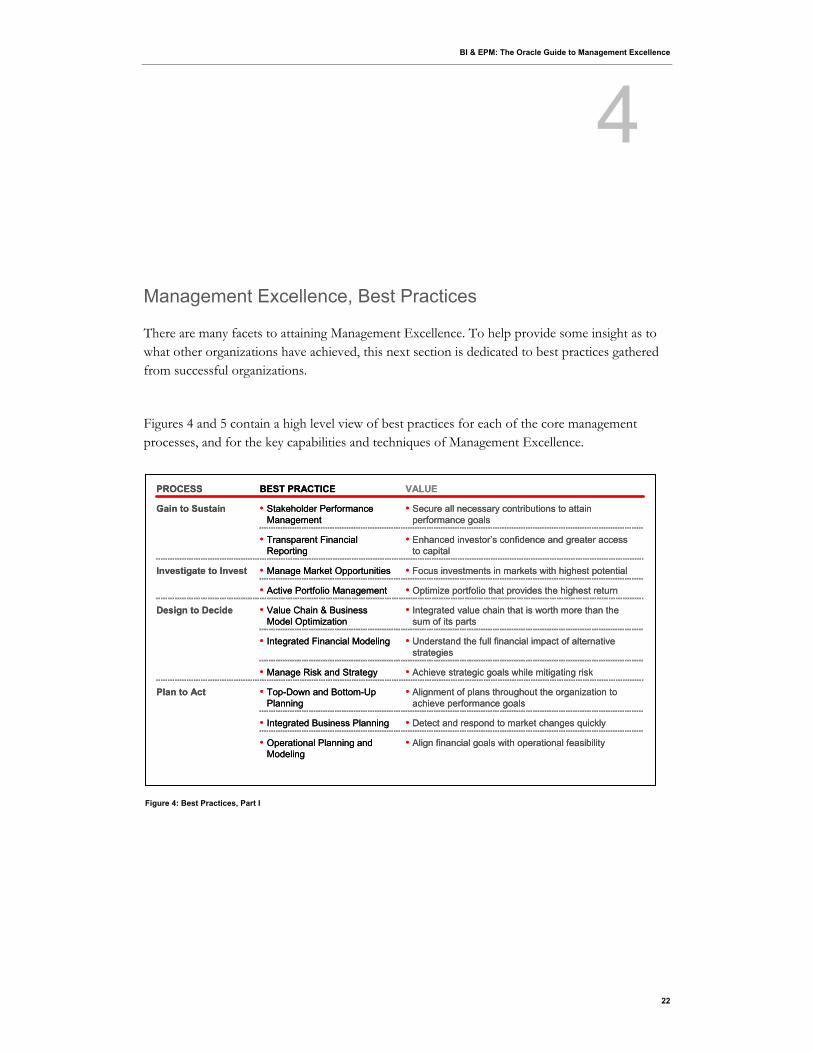
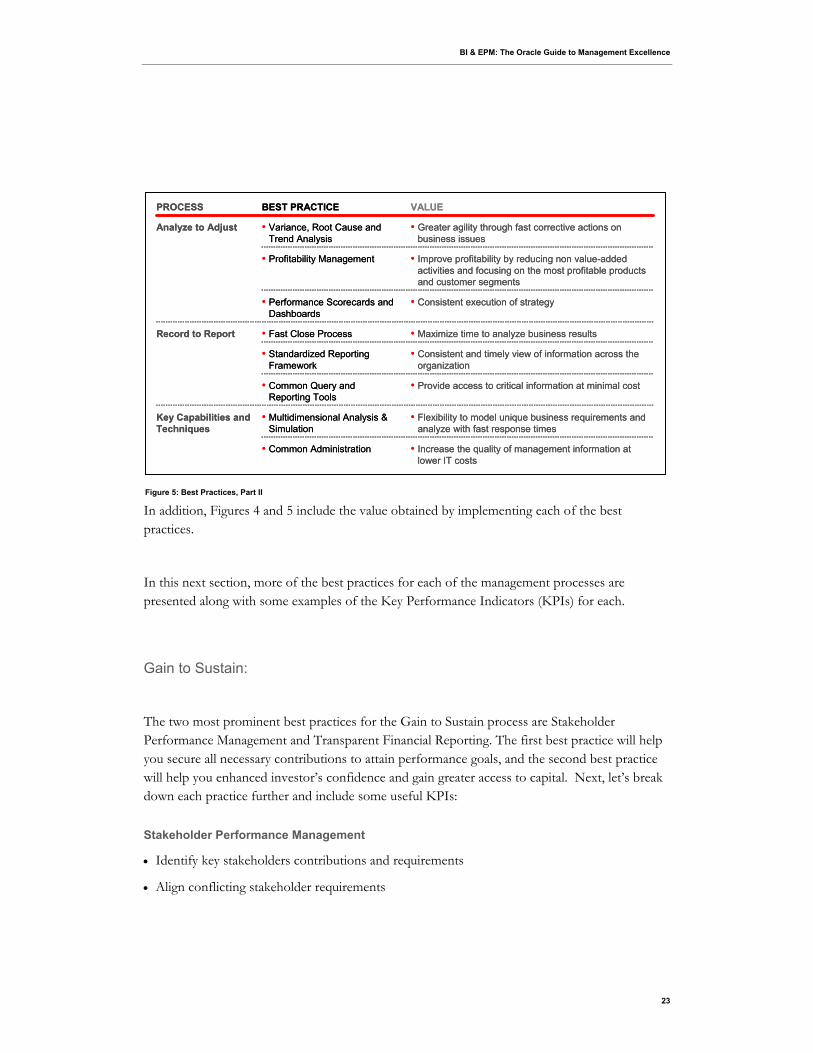
There are many facets to attaining Management Excellence. To help provide some insight as to what other organizations have achieved, this next section is dedicated to best practices gathered from successful organizations.
Figures 4 and 5 contain a high level view of best practices for each of the core management processes, and for the key capabilities and techniques of Management Excellence.
• Alignment of plans throughout the organization to achieve performance goals
• Top-Down and Bottom-Up Planning
Plan to Act
• Detect and respond to market changes quickly• Integrated Business Planning
• Align financial goals with operational feasibility• Operational Planning and Modeling
• Achieve strategic goals while mitigating risk• Manage Risk and Strategy
• Optimize portfolio that provides the highest return• Active Portfolio Management
• Integrated value chain that is worth more than the sum of its parts
• Value Chain & Business Model Optimization
Design to Decide
• Understand the full financial impact of alternative strategies
• Integrated Financial Modeling
• Enhanced investor’s confidence and greater access to capital
• Transparent Financial Reporting
• Focus investments in markets with highest potential• Manage Market OpportunitiesInvestigate to Invest
• Stakeholder Performance Management
BEST PRACTICE
• Secure all necessary contributions to attain performance goals
Gain to Sustain
VALUEPROCESS
Figure 4: Best Practices, Part I
4
BI & EPM: The Oracle Guide to Management Excellence
23
In addition, Figures 4 and 5 include the value obtained by implementing each of the best practices.
In this next section, more of the best practices for each of the management processes are presented along with some examples of the Key Performance Indicators (KPIs) for each.
Gain to Sustain:
The two most prominent best practices for the Gain to Sustain process are Stakeholder Performance Management and Transparent Financial Reporting. The first best practice will help you secure all necessary contributions to attain performance goals, and the second best practice will help you enhanced investor’s confidence and gain greater access to capital. Next, let’s break down each practice further and include some useful KPIs:
Stakeholder Performance Management
Identify key stakeholders contributions and requirements
Align conflicting stakeholder requirements
• Consistent and timely view of information across the organization
• Standardized Reporting Framework
• Improve profitability by reducing non value-added activities and focusing on the most profitable products and customer segments
• Profitability Management
• Provide access to critical information at minimal cost• Common Query and Reporting Tools
• Flexibility to model unique business requirements and analyze with fast response times
• Multidimensional Analysis & Simulation
Key Capabilities and Techniques
• Increase the quality of management information at lower IT costs
• Common Administration
• Consistent execution of strategy• Performance Scorecards and Dashboards
• Maximize time to analyze business results• Fast Close ProcessRecord to Report
• Variance, Root Cause and Trend Analysis
BEST PRACTICE
• Greater agility through fast corrective actions on business issues
Analyze to Adjust
VALUEPROCESS
Figure 5: Best Practices, Part II
BI & EPM: The Oracle Guide to Management Excellence
24
Align corporate strategy with stakeholder interests
Share performance related metrics and indicators with suppliers, channel, and business partners
Engage in a continuous stakeholder dialogue and provide continuous feedback
Provide societal, environmental, and economic metrics reporting to external and internal stakeholders
Transparent Financial Reporting
Employ XBRL to deliver financial reports fast and consistently
Embrace international reporting standards to allow investors to make better comparisons with organizations globally
Include textual information such as management discussion and analysis
Use forecast ranges instead of point estimates to guide investors on future performance
Provide a higher level of precision through advanced statistics and risk assessment techniques
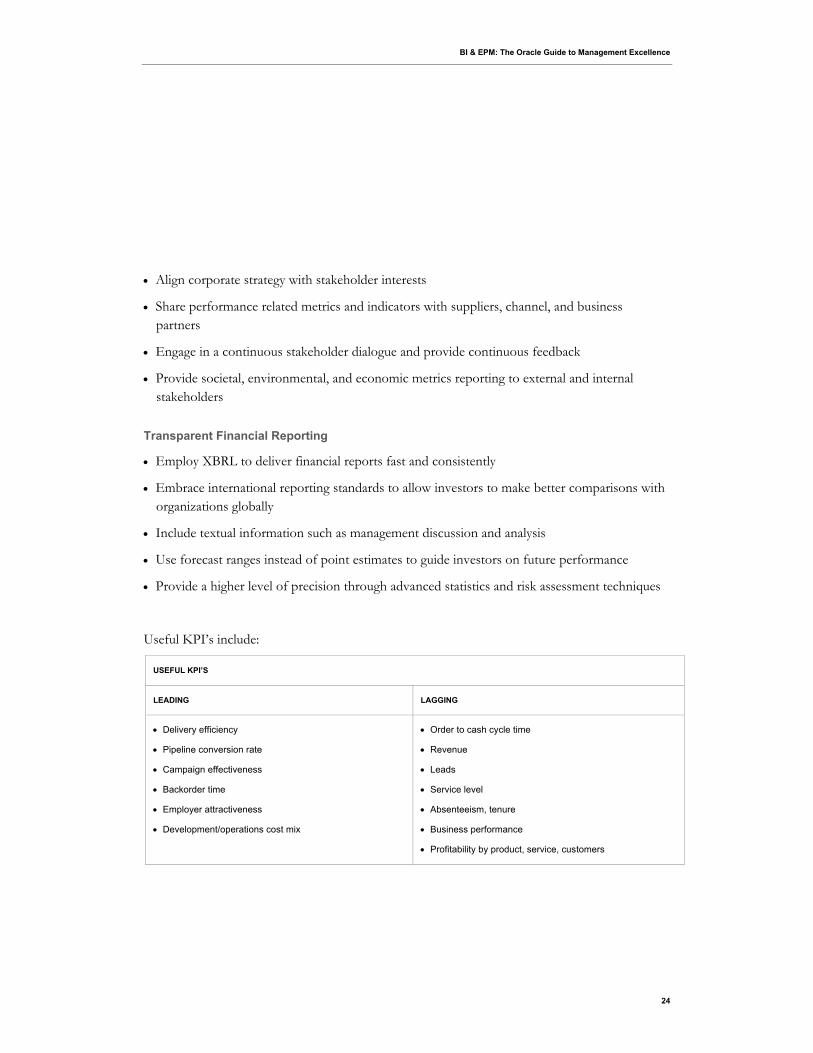
Useful KPI’s include:
USEFUL KPI’S
LEADING LAGGING
Delivery efficiency
Pipeline conversion rate
Campaign effectiveness
Backorder time
Employer attractiveness
Development/operations cost mix
Order to cash cycle time
Revenue
Leads
Service level
Absenteeism, tenure
Business performance
Profitability by product, service, customers
BI & EPM: The Oracle Guide to Management Excellence
25
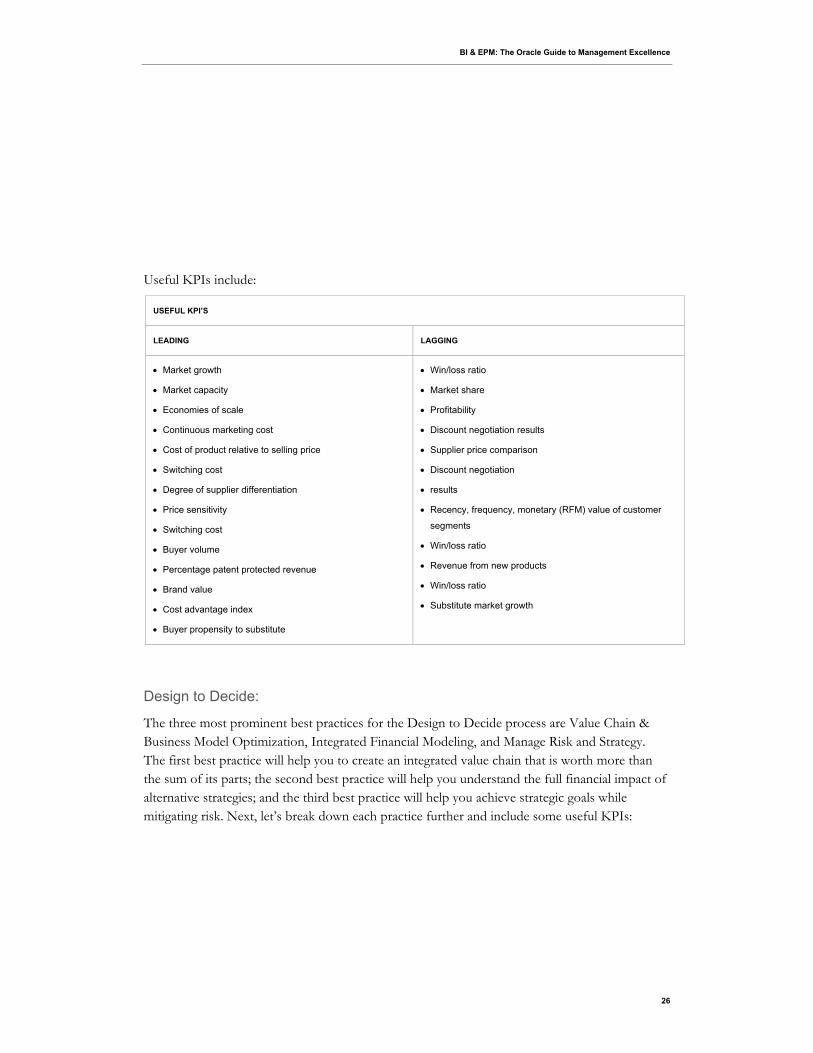
Investigate to Invest:
The two most prominent best practices for the Investigate to Invest process are Manage Market Opportunities and Active Portfolio Management. The first best practice will help you to focus your investments in markets with the highest potential, and the second best practice will help you to optimize the portfolio that provides the highest return. Next, let’s break down each practice further and include some useful KPIs:
Manage Market Opportunities
Investigate market dynamics, market drivers and customer segments
Include market sizing, market share analysis, growth projections, and competitive intelligence
Match the market potential with resources, capabilities, constraints, and goals
Size investments and divestments in selected target markets
Combine internal and external market intelligence and analysis
Active Portfolio Management
Apply optimization techniques to find the optimal combination of investment projects given capital and operational constraints
Use simulation and sensitivity analysis to evaluate portfolio in different market scenarios, and project the respective long term financial results.
Identify most competitive product and service portfolio, including rationalization of existing portfolio and diversification in new attractive segments.
BI & EPM: The Oracle Guide to Management Excellence
26
Useful KPIs include:
USEFUL KPI’S
LEADING LAGGING
Market growth
Market capacity
Economies of scale
Continuous marketing cost
Cost of product relative to selling price
Switching cost
Degree of supplier differentiation
Price sensitivity
Switching cost
Buyer volume
Percentage patent protected revenue
Brand value
Cost advantage index
Buyer propensity to substitute
Win/loss ratio
Market share
Profitability
Discount negotiation results
Supplier price comparison
Discount negotiation
results
Recency, frequency, monetary (RFM) value of customer
segments
Win/loss ratio
Revenue from new products
Win/loss ratio
Substitute market growth
Design to Decide:
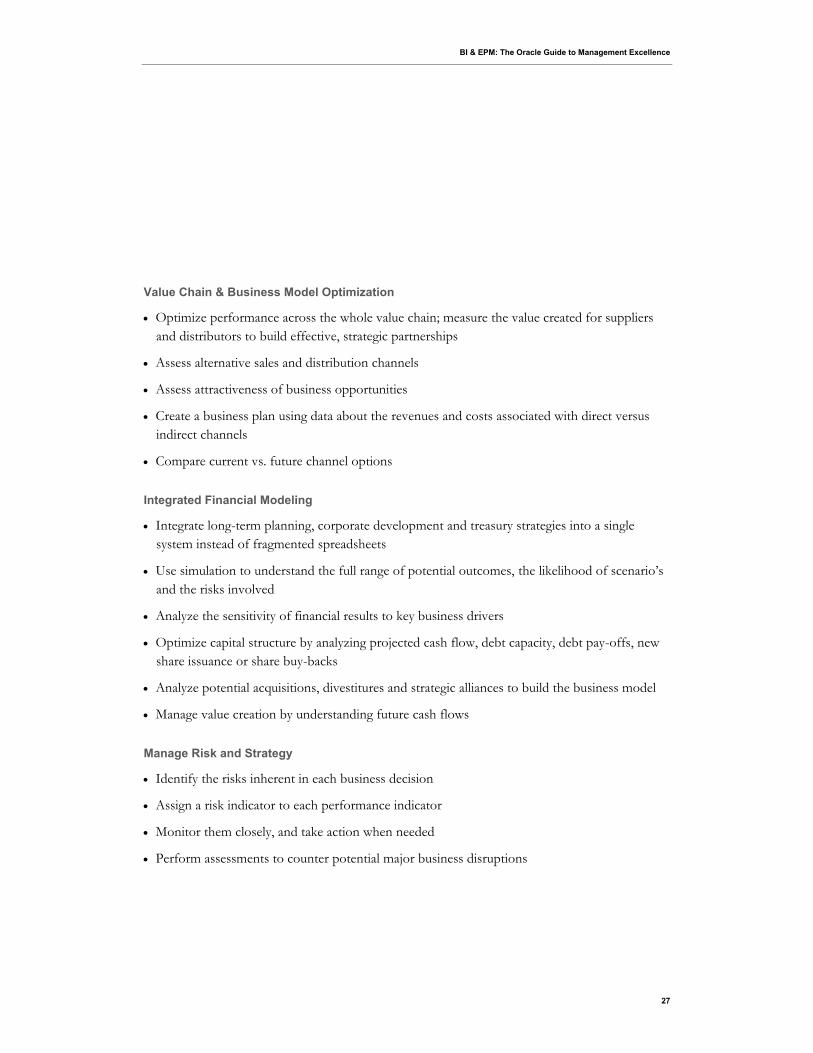
The three most prominent best practices for the Design to Decide process are Value Chain & Business Model Optimization, Integrated Financial Modeling, and Manage Risk and Strategy. The first best practice will help you to create an integrated value chain that is worth more than the sum of its parts; the second best practice will help you understand the full financial impact of alternative strategies; and the third best practice will help you achieve strategic goals while mitigating risk. Next, let’s break down each practice further and include some useful KPIs:
BI & EPM: The Oracle Guide to Management Excellence
27
Value Chain & Business Model Optimization
Optimize performance across the whole value chain; measure the value created for suppliers and distributors to build effective, strategic partnerships
Assess alternative sales and distribution channels
Assess attractiveness of business opportunities
Create a business plan using data about the revenues and costs associated with direct versus indirect channels
Compare current vs. future channel options
Integrated Financial Modeling
Integrate long-term planning, corporate development and treasury strategies into a single system instead of fragmented spreadsheets
Use simulation to understand the full range of potential outcomes, the likelihood of scenario’s and the risks involved
Analyze the sensitivity of financial results to key business drivers
Optimize capital structure by analyzing projected cash flow, debt capacity, debt pay-offs, new share issuance or share buy-backs
Analyze potential acquisitions, divestitures and strategic alliances to build the business model
Manage value creation by understanding future cash flows
Manage Risk and Strategy
Identify the risks inherent in each business decision
Assign a risk indicator to each performance indicator
Monitor them closely, and take action when needed
Perform assessments to counter potential major business disruptions
BI & EPM: The Oracle Guide to Management Excellence
28
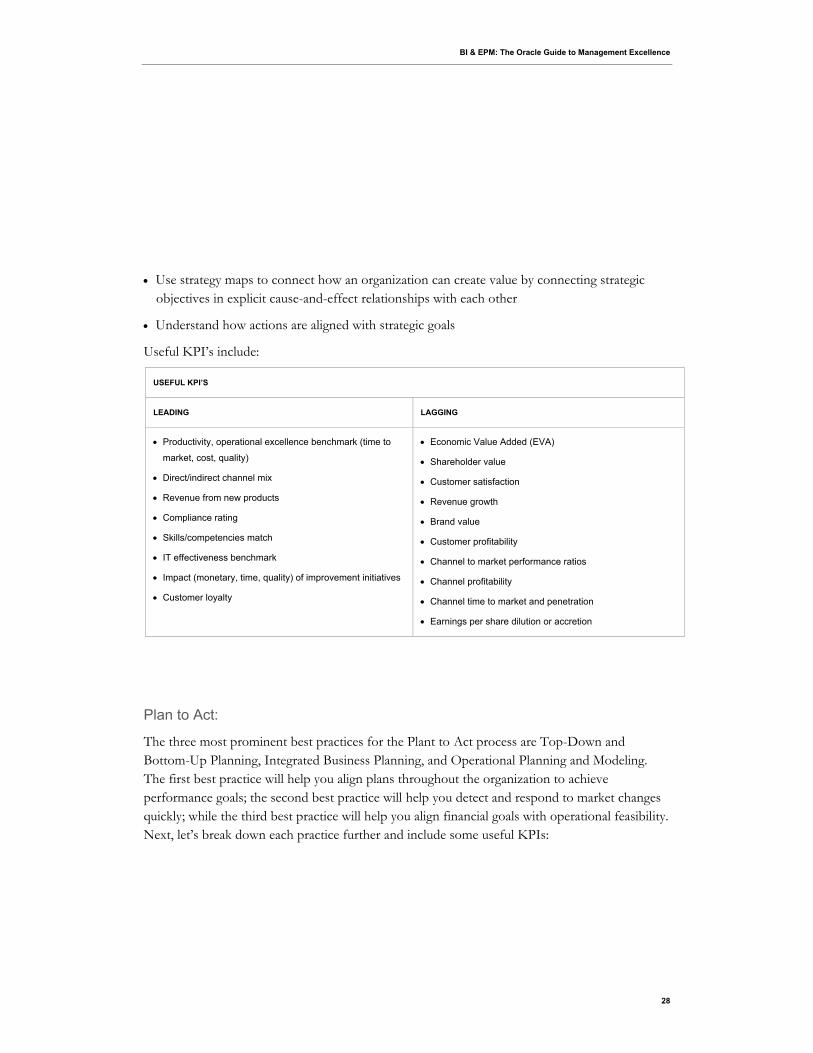
Use strategy maps to connect how an organization can create value by connecting strategic objectives in explicit cause-and-effect relationships with each other
Understand how actions are aligned with strategic goals
Useful KPI’s include:
USEFUL KPI’S
LEADING LAGGING
Productivity, operational excellence benchmark (time to
market, cost, quality)
Direct/indirect channel mix
Revenue from new products
Compliance rating
Skills/competencies match
IT effectiveness benchmark
Impact (monetary, time, quality) of improvement initiatives
Customer loyalty
Economic Value Added (EVA)
Shareholder value
Customer satisfaction
Revenue growth
Brand value
Customer profitability
Channel to market performance ratios
Channel profitability
Channel time to market and penetration
Earnings per share dilution or accretion
Plan to Act:
The three most prominent best practices for the Plant to Act process are Top-Down and Bottom-Up Planning, Integrated Business Planning, and Operational Planning and Modeling. The first best practice will help you align plans throughout the organization to achieve performance goals; the second best practice will help you detect and respond to market changes quickly; while the third best practice will help you align financial goals with operational feasibility. Next, let’s break down each practice further and include some useful KPIs:
BI & EPM: The Oracle Guide to Management Excellence
29
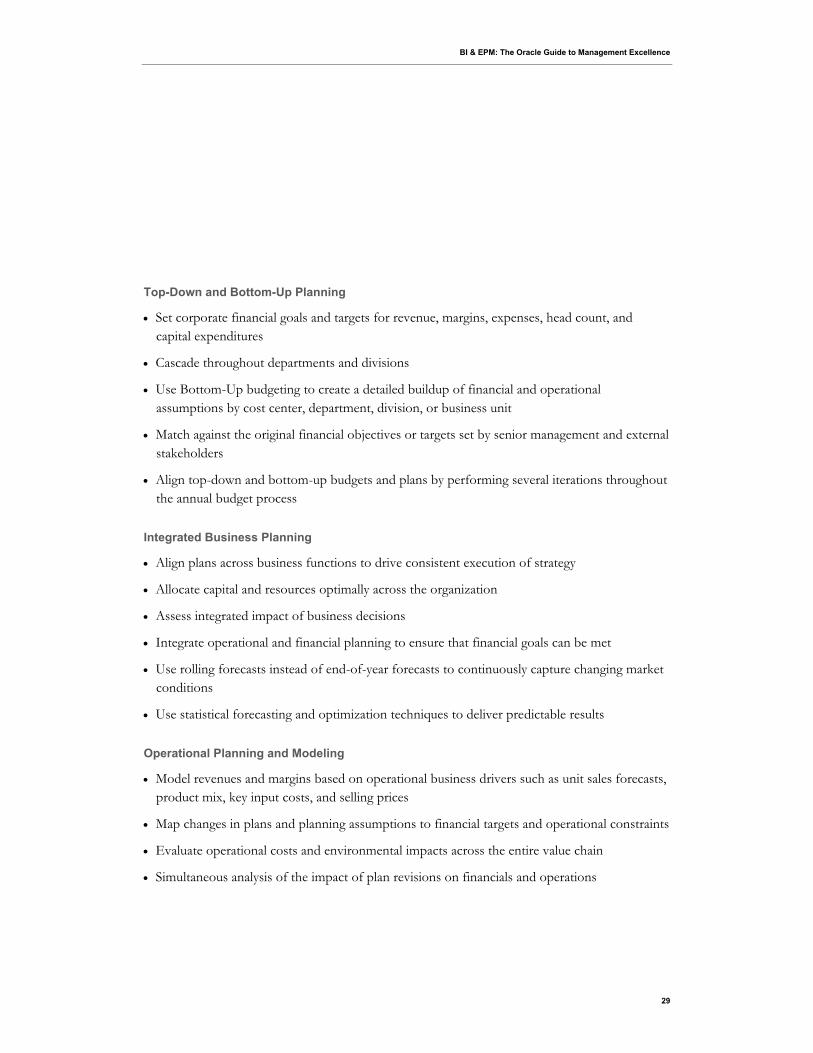
Top-Down and Bottom-Up Planning
Set corporate financial goals and targets for revenue, margins, expenses, head count, and capital expenditures
Cascade throughout departments and divisions
Use Bottom-Up budgeting to create a detailed buildup of financial and operational assumptions by cost center, department, division, or business unit
Match against the original financial objectives or targets set by senior management and external stakeholders
Align top-down and bottom-up budgets and plans by performing several iterations throughout the annual budget process
Integrated Business Planning
Align plans across business functions to drive consistent execution of strategy
Allocate capital and resources optimally across the organization
Assess integrated impact of business decisions
Integrate operational and financial planning to ensure that financial goals can be met
Use rolling forecasts instead of end-of-year forecasts to continuously capture changing market conditions
Use statistical forecasting and optimization techniques to deliver predictable results
Operational Planning and Modeling
Model revenues and margins based on operational business drivers such as unit sales forecasts, product mix, key input costs, and selling prices
Map changes in plans and planning assumptions to financial targets and operational constraints
Evaluate operational costs and environmental impacts across the entire value chain
Simultaneous analysis of the impact of plan revisions on financials and operations

BI & EPM: The Oracle Guide to Management Excellence
30
Useful KPI’s include:
USEFUL KPI’S
LEADING LAGGING
Planned contribution to company goals
Planned contribution to other business domains
Asset utilization rate (people, facilities)
Cycle time to prepare budgets
Time to re-budget
Time to identify and resolve variances and constraints
Realized contribution to company goals
Realized contribution to other business domains
Productivity
Forecast accuracy
Analyze to Adjust:
The three most prominent best practices for the Analyze to Adjust process are Perform Variance, Root Cause, and Trend Analysis; Perform Profitability Management; and Use Performance Scorecards and Dashboards to Monitor Performance. The first best practice will provide greater agility through fast corrective actions on business issues; the second best practice will help you to improve profitability by reducing non value-added activities and focusing on the most profitable products and customer segments; while the third best practice will help you with the consistent execution of strategy. Next, let’s break down each practice further and include some useful KPIs:
Perform Variance, Root Cause, and Trend Analysis
Use predefined best practice metrics by function and industry
Provide business users access to critical information for their role through personalized dashboards
Continuously monitor variances between actuals and targets
Use predefined analytical workflows to quickly find the root causes for variances
Analyze cross-functional cause and effect to determine the most effective course of action
BI & EPM: The Oracle Guide to Management Excellence
31
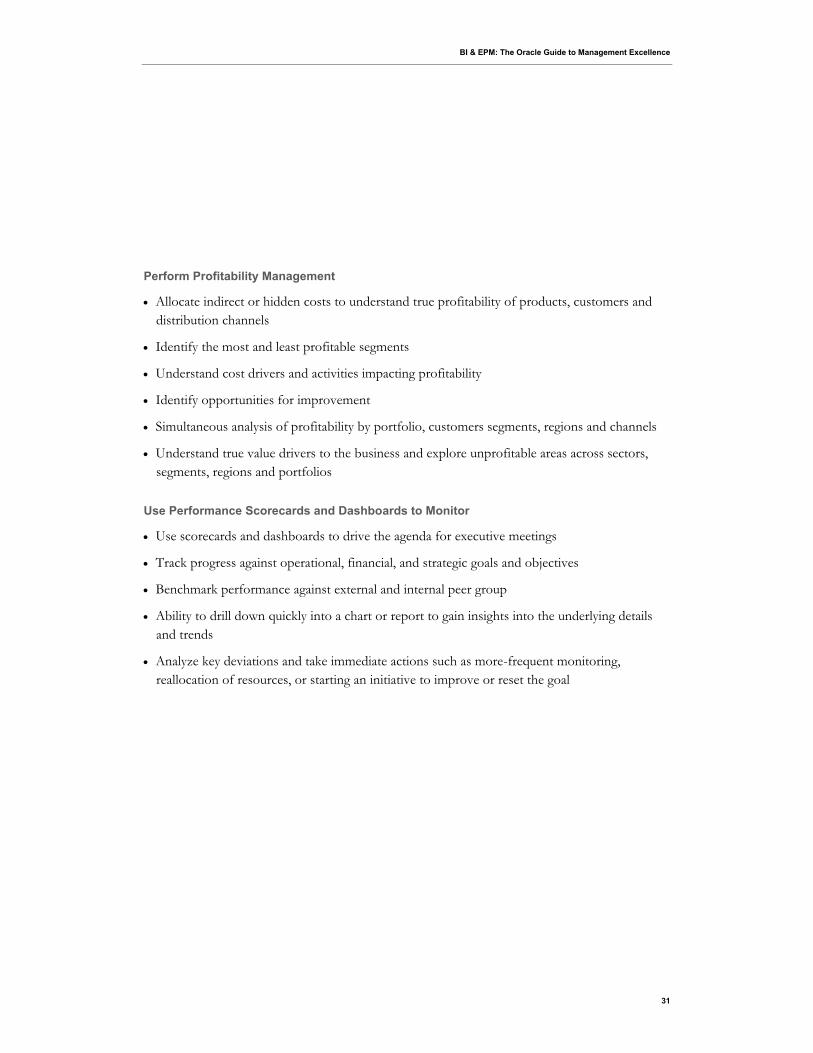
Perform Profitability Management
Allocate indirect or hidden costs to understand true profitability of products, customers and distribution channels
Identify the most and least profitable segments
Understand cost drivers and activities impacting profitability
Identify opportunities for improvement
Simultaneous analysis of profitability by portfolio, customers segments, regions and channels
Understand true value drivers to the business and explore unprofitable areas across sectors, segments, regions and portfolios
Use Performance Scorecards and Dashboards to Monitor
Use scorecards and dashboards to drive the agenda for executive meetings
Track progress against operational, financial, and strategic goals and objectives
Benchmark performance against external and internal peer group
Ability to drill down quickly into a chart or report to gain insights into the underlying details and trends
Analyze key deviations and take immediate actions such as more-frequent monitoring, reallocation of resources, or starting an initiative to improve or reset the goal
BI & EPM: The Oracle Guide to Management Excellence
32
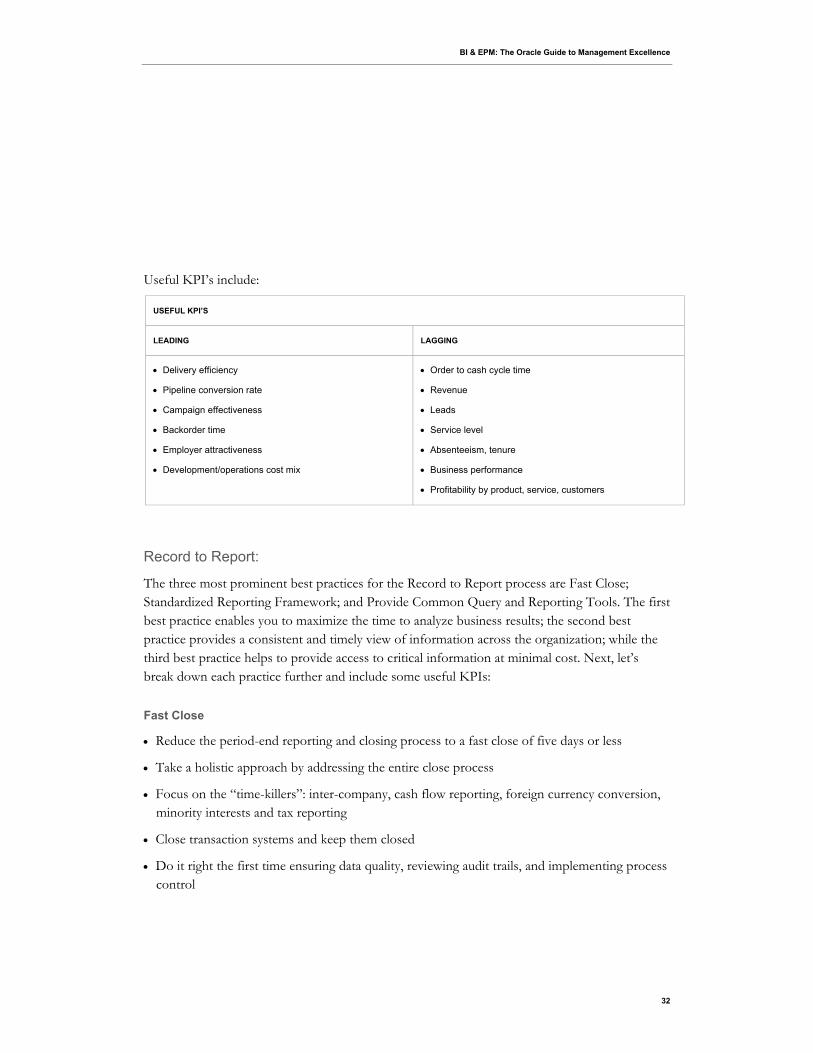
Useful KPI’s include:
USEFUL KPI’S
LEADING LAGGING
Delivery efficiency
Pipeline conversion rate
Campaign effectiveness
Backorder time
Employer attractiveness
Development/operations cost mix
Order to cash cycle time
Revenue
Leads
Service level
Absenteeism, tenure
Business performance
Profitability by product, service, customers
Record to Report:
The three most prominent best practices for the Record to Report process are Fast Close; Standardized Reporting Framework; and Provide Common Query and Reporting Tools. The first best practice enables you to maximize the time to analyze business results; the second best practice provides a consistent and timely view of information across the organization; while the third best practice helps to provide access to critical information at minimal cost. Next, let’s break down each practice further and include some useful KPIs:
Fast Close
Reduce the period-end reporting and closing process to a fast close of five days or less
Take a holistic approach by addressing the entire close process
Focus on the “time-killers”: inter-company, cash flow reporting, foreign currency conversion, minority interests and tax reporting
Close transaction systems and keep them closed
Do it right the first time ensuring data quality, reviewing audit trails, and implementing process control
BI & EPM: The Oracle Guide to Management Excellence
33
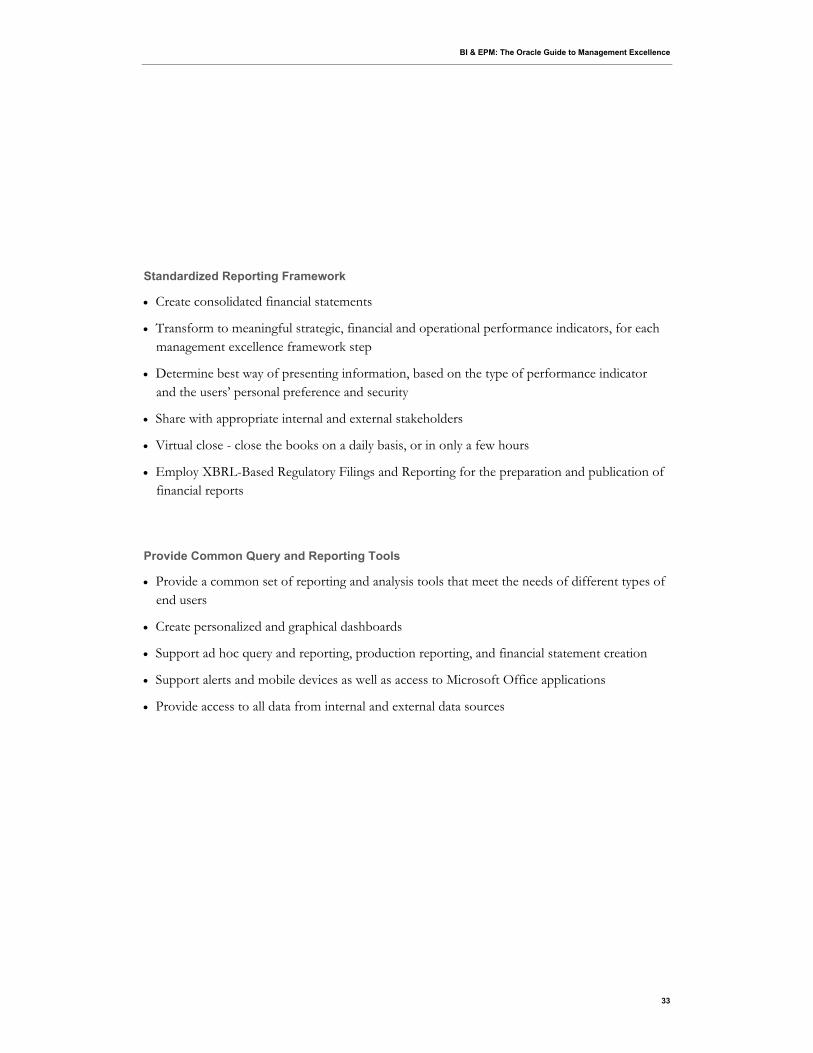
Standardized Reporting Framework
Create consolidated financial statements
Transform to meaningful strategic, financial and operational performance indicators, for each management excellence framework step
Determine best way of presenting information, based on the type of performance indicator and the users’ personal preference and security
Share with appropriate internal and external stakeholders
Virtual close - close the books on a daily basis, or in only a few hours
Employ XBRL-Based Regulatory Filings and Reporting for the preparation and publication of financial reports
Provide Common Query and Reporting Tools
Provide a common set of reporting and analysis tools that meet the needs of different types of end users
Create personalized and graphical dashboards
Support ad hoc query and reporting, production reporting, and financial statement creation
Support alerts and mobile devices as well as access to Microsoft Office applications
Provide access to all data from internal and external data sources
BI & EPM: The Oracle Guide to Management Excellence
34
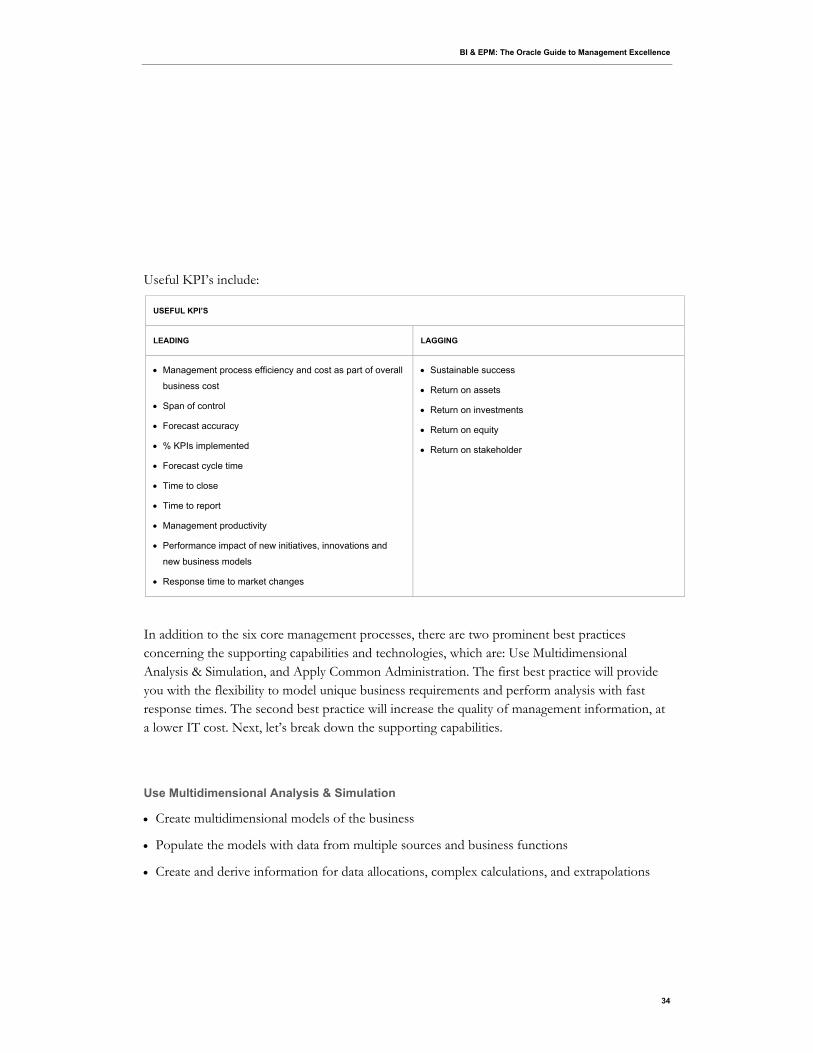
Useful KPI’s include:
USEFUL KPI’S
LEADING LAGGING
Management process efficiency and cost as part of overall
business cost
Span of control
Forecast accuracy
% KPIs implemented
Forecast cycle time
Time to close
Time to report
Management productivity
Performance impact of new initiatives, innovations and
new business models
Response time to market changes
Sustainable success
Return on assets
Return on investments
Return on equity
Return on stakeholder
In addition to the six core management processes, there are two prominent best practices concerning the supporting capabilities and technologies, which are: Use Multidimensional Analysis & Simulation, and Apply Common Administration. The first best practice will provide you with the flexibility to model unique business requirements and perform analysis with fast response times. The second best practice will increase the quality of management information, at a lower IT cost. Next, let’s break down the supporting capabilities.
Use Multidimensional Analysis & Simulation
Create multidimensional models of the business
Populate the models with data from multiple sources and business functions
Create and derive information for data allocations, complex calculations, and extrapolations

BI & EPM: The Oracle Guide to Management Excellence
35
Analyze business trends over time and across divisions, products, customer segments, and distribution channels quickly
Support read/write analytic applications such as budgeting and forecasting, scenario planning, profitability analysis, market size, and growth analysis
Apply Common Administration
Ensure consistency of management information and reporting
Increase speed of deployment by reusing common application and report constructs
Decrease the cost of deployment by using common administration
Use a single point of administration for
System installation
User provisioning
Application creation and maintenance
Metadata management
Application lifecycle management
Summary
As can be seen from this list of best practices, a fundamental business principle is that Management Excellence touches every part of the organization – from the executive board to the most junior members of the workforce. Everyone has a part to play in helping the company succeed in meeting its goals. Implementing these best practices will help ensure that with the Management Excellence framework and an EPM solution in place across the organization, companies set themselves up to win.
BI & EPM: The Oracle Guide to Management Excellence
36
Self-Evaluation
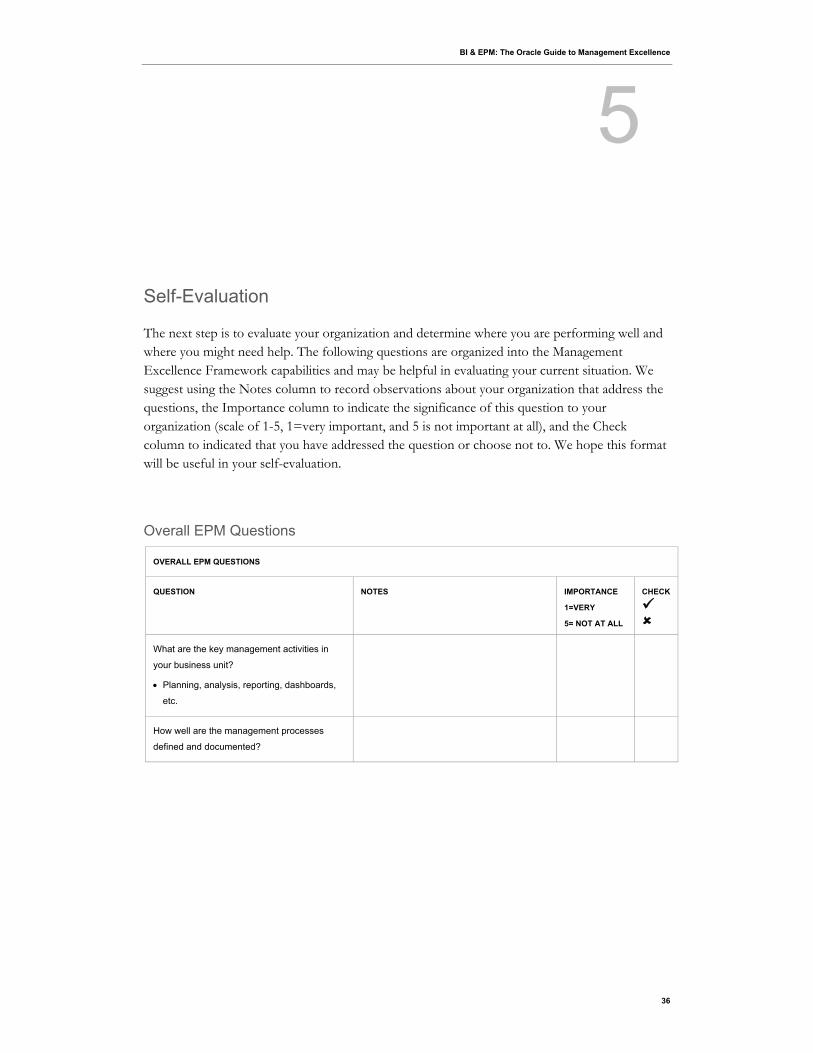
The next step is to evaluate your organization and determine where you are performing well and where you might need help. The following questions are organized into the Management Excellence Framework capabilities and may be helpful in evaluating your current situation. We suggest using the Notes column to record observations about your organization that address the questions, the Importance column to indicate the significance of this question to your organization (scale of 1-5, 1=very important, and 5 is not important at all), and the Check column to indicated that you have addressed the question or choose not to. We hope this format will be useful in your self-evaluation.
Overall EPM Questions
OVERALL EPM QUESTIONS
QUESTION NOTES IMPORTANCE
1=VERY
5= NOT AT ALL
CHECK
What are the key management activities in
your business unit?
Planning, analysis, reporting, dashboards,
etc.
How well are the management processes
defined and documented?
5

BI & EPM: The Oracle Guide to Management Excellence
37
What technology do you use to support your
management processes?
Transaction Systems
ERP System
Customer Relationship Management System
Supply Chain Management System
SRM System
PLM System
PM & BI
Performance management applications
BI Applications
Scorecard
BI tools
Department data mart
Corporate data warehouse
Custom
Personal Productivity Tools
Spreadsheets
Presentation software
Word processing
Other – Please describe
Describe the attributes of your management
system
Is it integrated?
Is it standardized?
Is it automated or is there a lot of manual
work such as the re-keying of data?
Is it flexible?
Is it easy to use?
Is it accessible?
Do you get information in a timely manner?
Is the information complete?
What are the key capabilities you are looking
for to improve your existing management
system?
Which capabilities are most immediately
needed?
How effectively do you communicate with
managers about performance related
information?
BI & EPM: The Oracle Guide to Management Excellence
38
Is there transparency in the overall
measurement process?
Which management activity most needs
immediate improvement?
Do you use your management system for
future projections and planning?
How well does your technology support
your management processes?
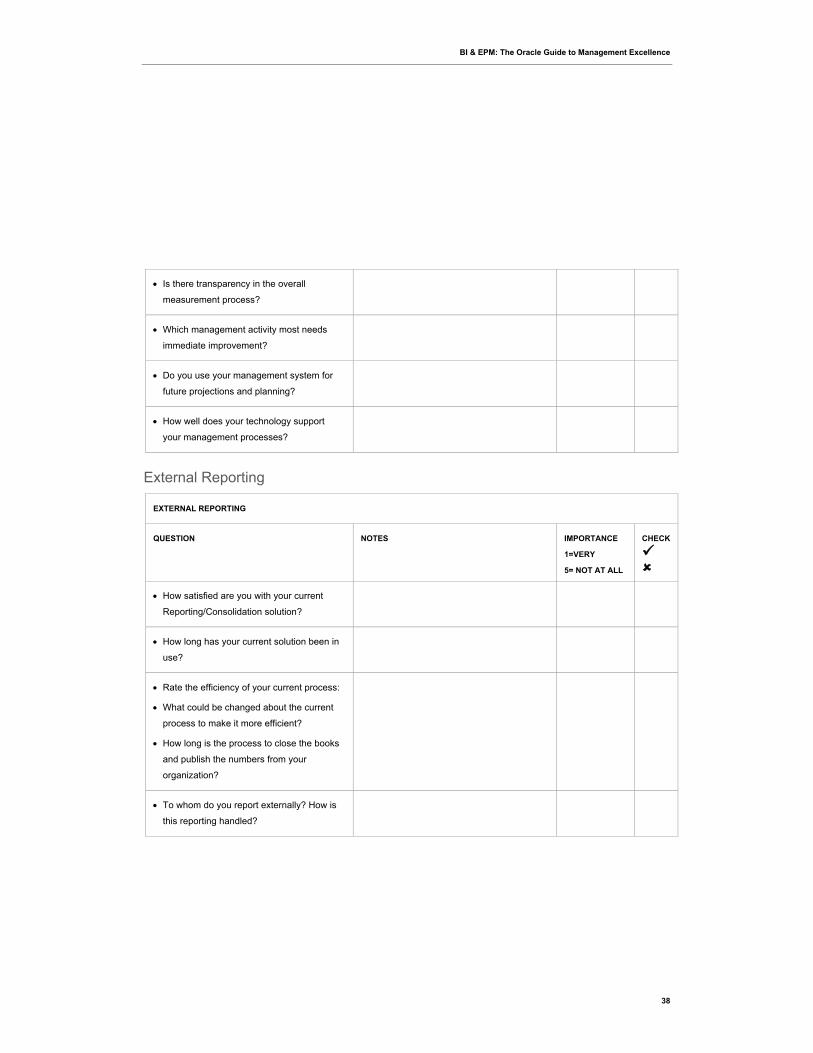
External Reporting
EXTERNAL REPORTING
QUESTION NOTES IMPORTANCE
1=VERY
5= NOT AT ALL
CHECK
How satisfied are you with your current
Reporting/Consolidation solution?
How long has your current solution been in
use?
Rate the efficiency of your current process:
What could be changed about the current
process to make it more efficient?
How long is the process to close the books
and publish the numbers from your
organization?
To whom do you report externally? How is
this reporting handled?
BI & EPM: The Oracle Guide to Management Excellence
39
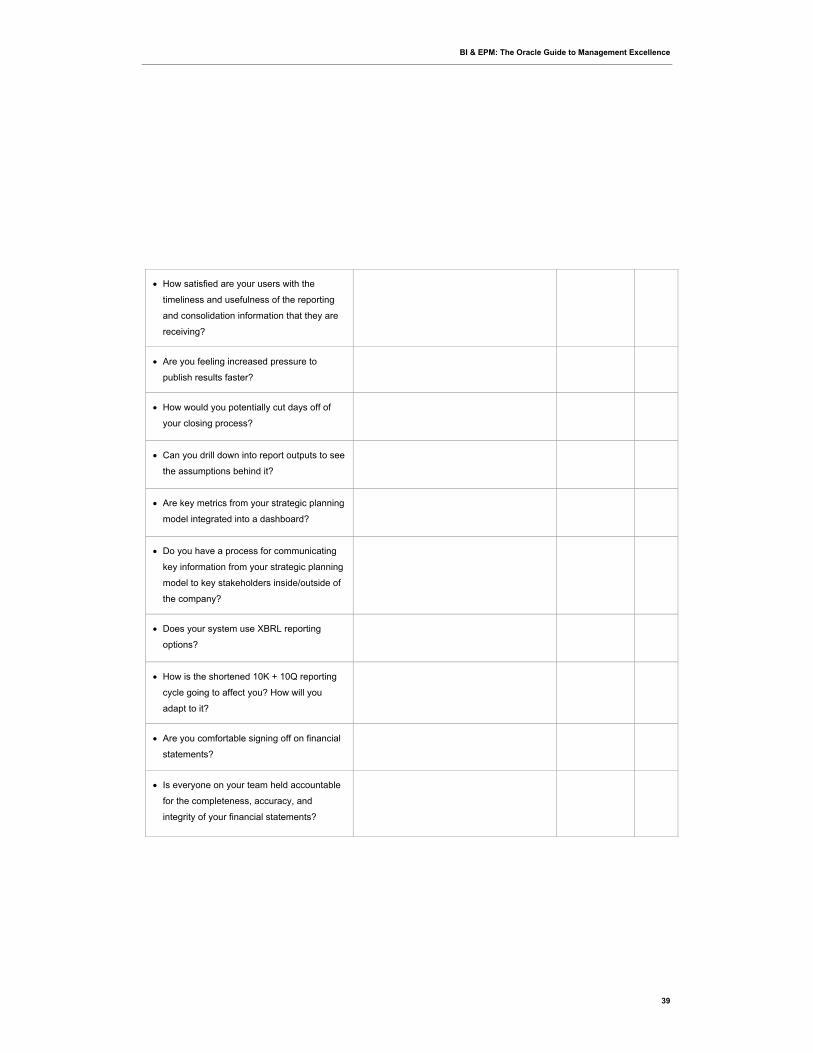
How satisfied are your users with the
timeliness and usefulness of the reporting
and consolidation information that they are
receiving?
Are you feeling increased pressure to
publish results faster?
How would you potentially cut days off of
your closing process?
Can you drill down into report outputs to see
the assumptions behind it?
Are key metrics from your strategic planning
model integrated into a dashboard?
Do you have a process for communicating
key information from your strategic planning
model to key stakeholders inside/outside of
the company?
Does your system use XBRL reporting
options?
How is the shortened 10K + 10Q reporting
cycle going to affect you? How will you
adapt to it?
Are you comfortable signing off on financial
statements?
Is everyone on your team held accountable
for the completeness, accuracy, and
integrity of your financial statements?
BI & EPM: The Oracle Guide to Management Excellence
40
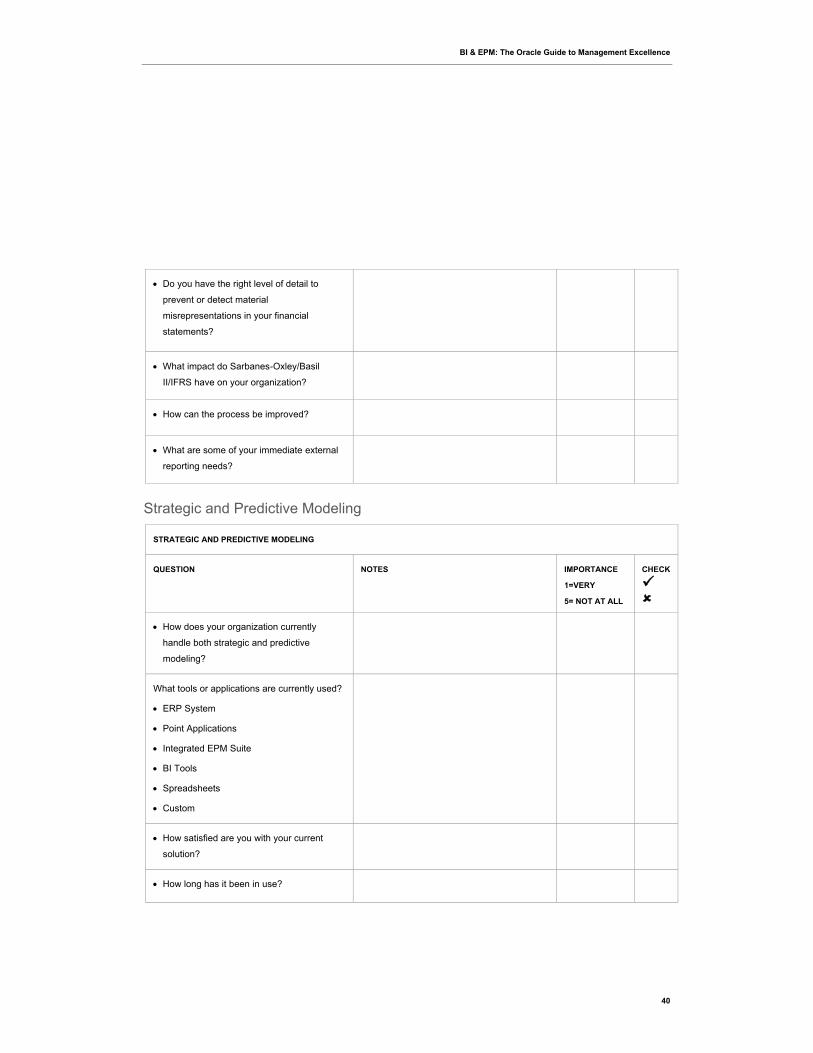
Do you have the right level of detail to
prevent or detect material
misrepresentations in your financial
statements?
What impact do Sarbanes-Oxley/Basil
II/IFRS have on your organization?
How can the process be improved?
What are some of your immediate external
reporting needs?
Strategic and Predictive Modeling
STRATEGIC AND PREDICTIVE MODELING
QUESTION NOTES IMPORTANCE
1=VERY
5= NOT AT ALL
CHECK
How does your organization currently
handle both strategic and predictive
modeling?
What tools or applications are currently used?
ERP System
Point Applications
Integrated EPM Suite
BI Tools
Spreadsheets
Custom
How satisfied are you with your current
solution?
How long has it been in use?
BI & EPM: The Oracle Guide to Management Excellence
41
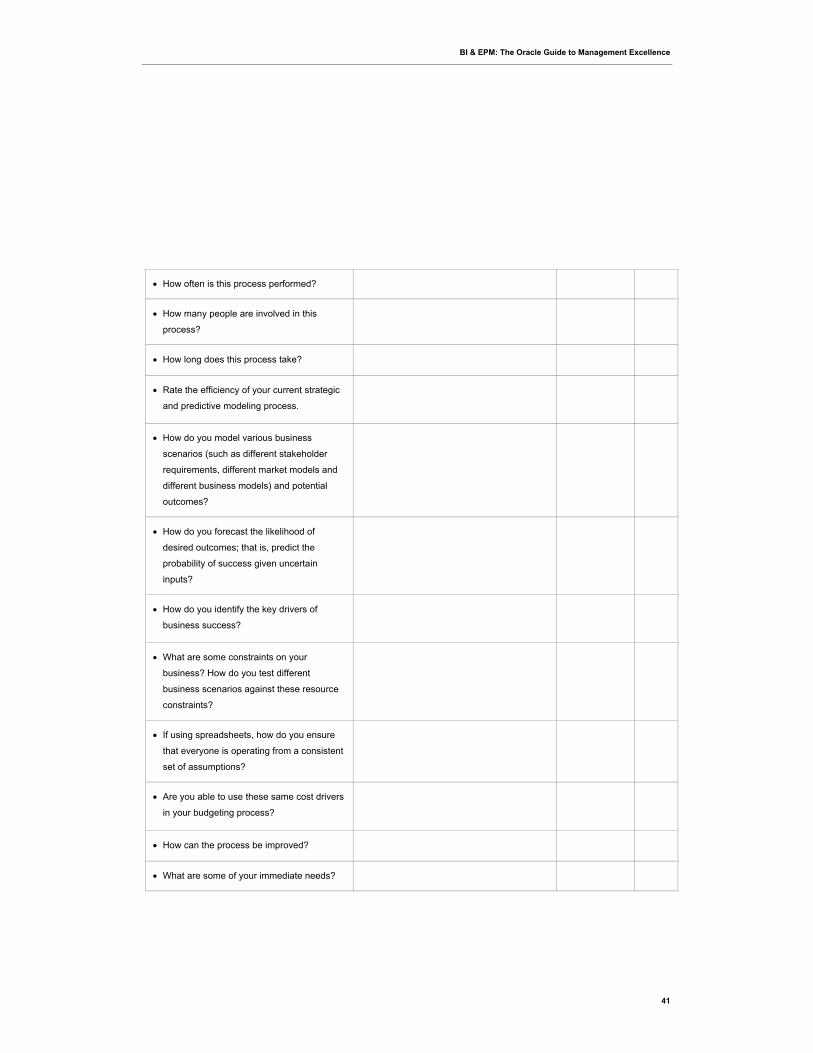
How often is this process performed?
How many people are involved in this
process?
How long does this process take?
Rate the efficiency of your current strategic
and predictive modeling process.
How do you model various business
scenarios (such as different stakeholder
requirements, different market models and
different business models) and potential
outcomes?
How do you forecast the likelihood of
desired outcomes; that is, predict the
probability of success given uncertain
inputs?
How do you identify the key drivers of
business success?
What are some constraints on your
business? How do you test different
business scenarios against these resource
constraints?
If using spreadsheets, how do you ensure
that everyone is operating from a consistent
set of assumptions?
Are you able to use these same cost drivers
in your budgeting process?
How can the process be improved?
What are some of your immediate needs?

BI & EPM: The Oracle Guide to Management Excellence
42
Treasury
STRATEGIC AND PREDICTIVE MODELING - TREASURY
QUESTION NOTES IMPORTANCE
1=VERY
5= NOT AT ALL
CHECK
Do you run a treasury model that is
separate from your strategic planning
model? How do you ensure that these
models are operating from a consistent set
of assumptions?
Does your treasury model give you options
to strengthen the Balance Sheet by
choosing how to allocate cash surpluses
and deficits among cash, debt, and equity?
Do you currently assess how key drivers in
your strategic planning model can affect
credit ratings or debt covenants?
Can you easily assess how changes to
LIBOR, credit ratings, or failing debt
covenants can affect your interest rates and
overall cost of debt?
Strategic Modeling
STRATEGIC AND PREDICTIVE MODELING – STRATEGIC MODELING
QUESTION NOTES IMPORTANCE
1=VERY
5= NOT AT ALL
CHECK
Do you have a separate model to forecast
and evaluate internal projects (NPV, IRR,
ROIC)? How do you ensure that this model
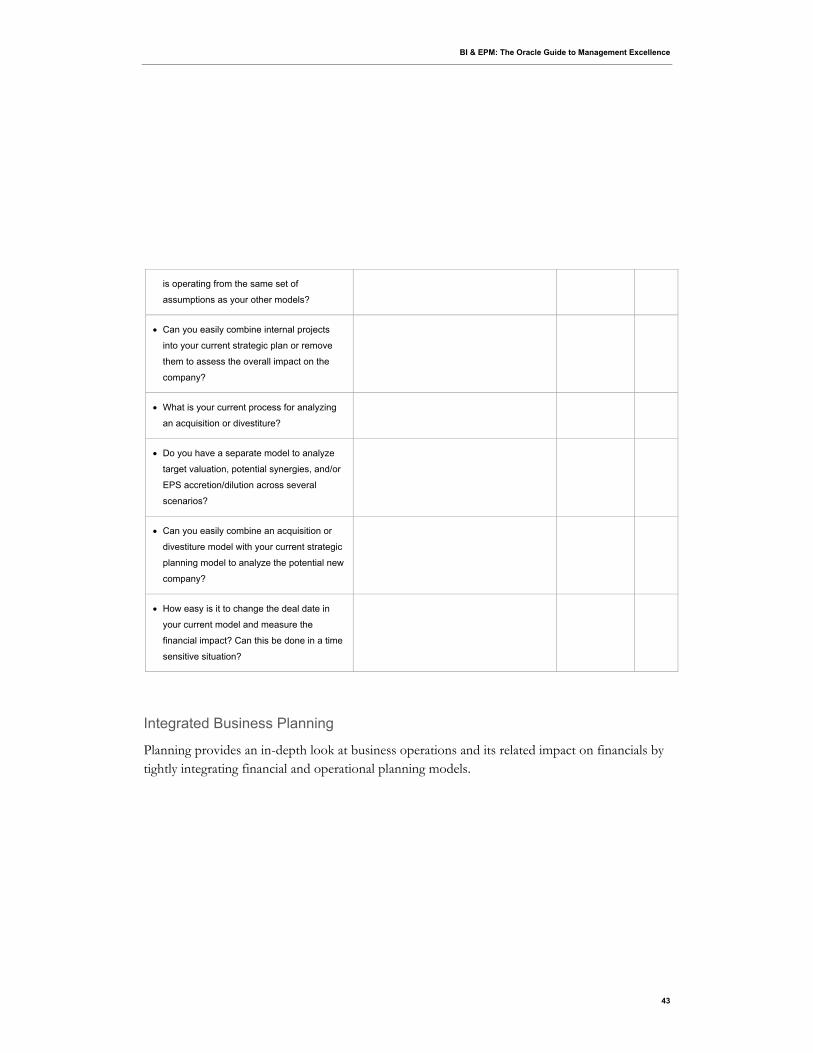
BI & EPM: The Oracle Guide to Management Excellence
43
is operating from the same set of
assumptions as your other models?
Can you easily combine internal projects
into your current strategic plan or remove
them to assess the overall impact on the
company?
What is your current process for analyzing
an acquisition or divestiture?
Do you have a separate model to analyze
target valuation, potential synergies, and/or
EPS accretion/dilution across several
scenarios?
Can you easily combine an acquisition or
divestiture model with your current strategic
planning model to analyze the potential new
company?
How easy is it to change the deal date in
your current model and measure the
financial impact? Can this be done in a time
sensitive situation?
Integrated Business Planning
Planning provides an in-depth look at business operations and its related impact on financials by tightly integrating financial and operational planning models.
BI & EPM: The Oracle Guide to Management Excellence
44
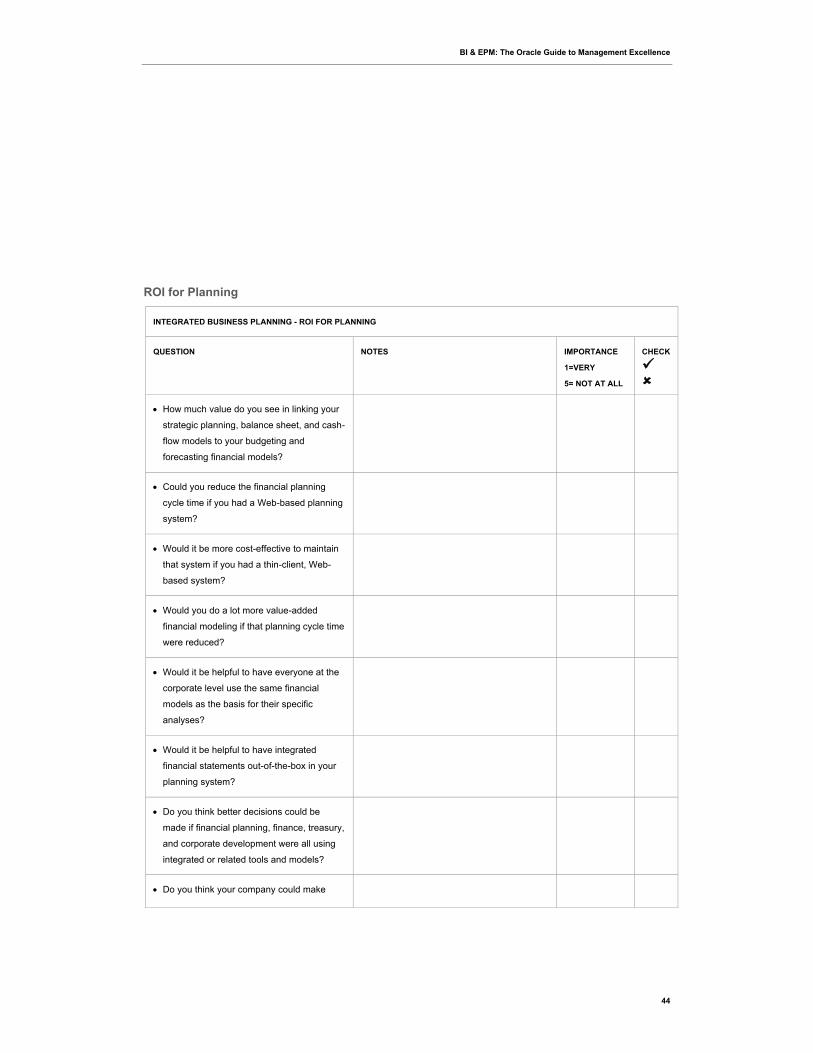
ROI for Planning
INTEGRATED BUSINESS PLANNING - ROI FOR PLANNING
QUESTION NOTES IMPORTANCE
1=VERY
5= NOT AT ALL
CHECK
How much value do you see in linking your
strategic planning, balance sheet, and cash-
flow models to your budgeting and
forecasting financial models?
Could you reduce the financial planning
cycle time if you had a Web-based planning
system?
Would it be more cost-effective to maintain
that system if you had a thin-client, Web-
based system?
Would you do a lot more value-added
financial modeling if that planning cycle time
were reduced?
Would it be helpful to have everyone at the
corporate level use the same financial
models as the basis for their specific
analyses?
Would it be helpful to have integrated
financial statements out-of-the-box in your
planning system?
Do you think better decisions could be
made if financial planning, finance, treasury,
and corporate development were all using
integrated or related tools and models?
Do you think your company could make
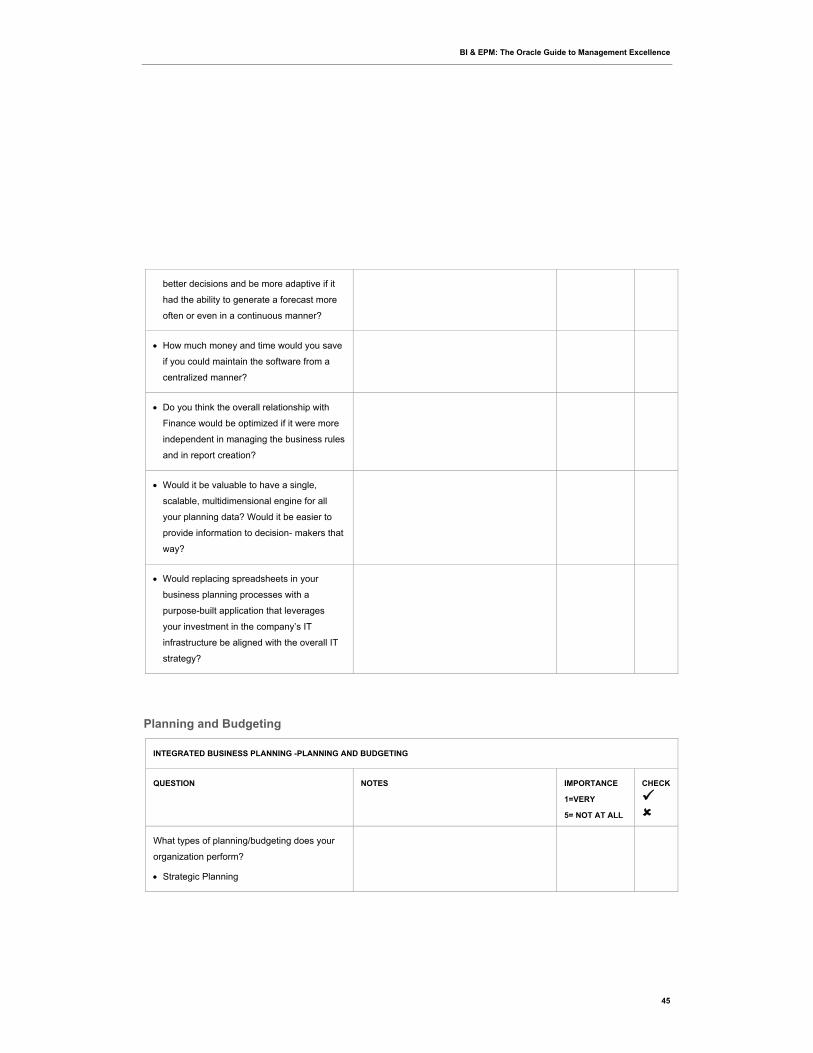
BI & EPM: The Oracle Guide to Management Excellence
45
better decisions and be more adaptive if it
had the ability to generate a forecast more
often or even in a continuous manner?
How much money and time would you save
if you could maintain the software from a
centralized manner?
Do you think the overall relationship with
Finance would be optimized if it were more
independent in managing the business rules
and in report creation?
Would it be valuable to have a single,
scalable, multidimensional engine for all
your planning data? Would it be easier to
provide information to decision- makers that
way?
Would replacing spreadsheets in your
business planning processes with a
purpose-built application that leverages
your investment in the company’s IT
infrastructure be aligned with the overall IT
strategy?
Planning and Budgeting
INTEGRATED BUSINESS PLANNING -PLANNING AND BUDGETING
QUESTION NOTES IMPORTANCE
1=VERY
5= NOT AT ALL
CHECK
What types of planning/budgeting does your
organization perform?
Strategic Planning
BI & EPM: The Oracle Guide to Management Excellence
46
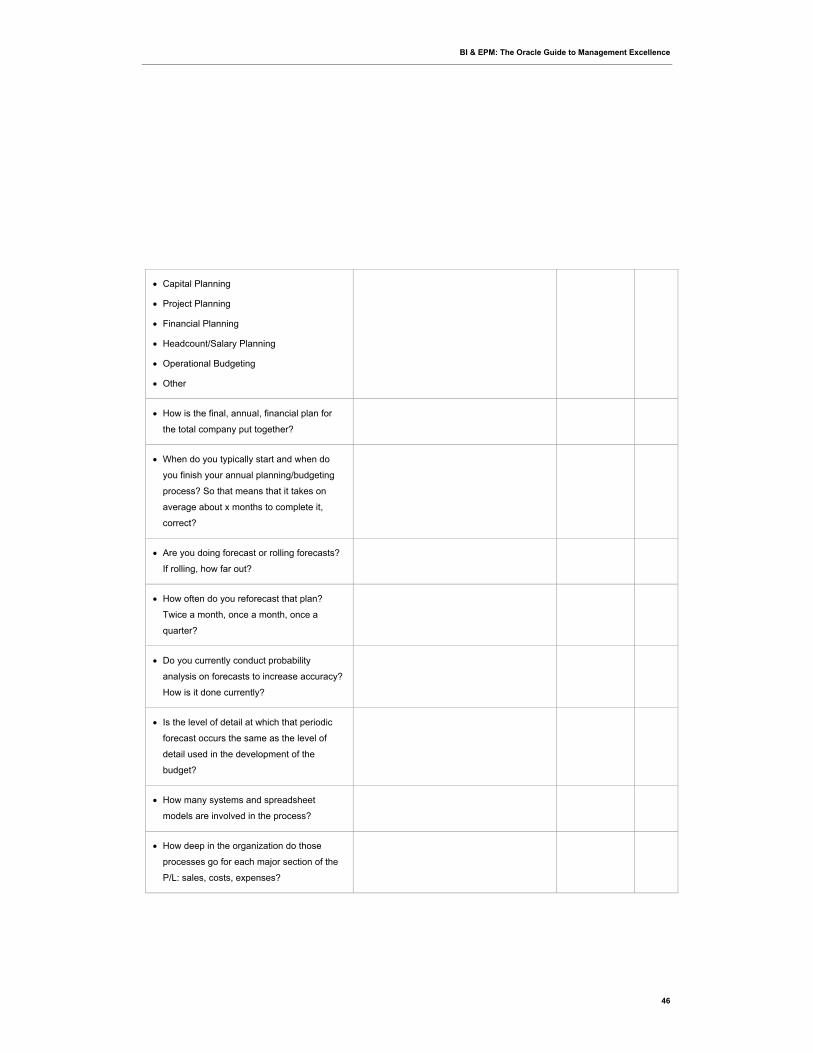
Capital Planning
Project Planning
Financial Planning
Headcount/Salary Planning
Operational Budgeting
Other
How is the final, annual, financial plan for
the total company put together?
When do you typically start and when do
you finish your annual planning/budgeting
process? So that means that it takes on
average about x months to complete it,
correct?
Are you doing forecast or rolling forecasts?
If rolling, how far out?
How often do you reforecast that plan?
Twice a month, once a month, once a
quarter?
Do you currently conduct probability
analysis on forecasts to increase accuracy?
How is it done currently?
Is the level of detail at which that periodic
forecast occurs the same as the level of
detail used in the development of the
budget?
How many systems and spreadsheet
models are involved in the process?
How deep in the organization do those
processes go for each major section of the
P/L: sales, costs, expenses?
BI & EPM: The Oracle Guide to Management Excellence
47
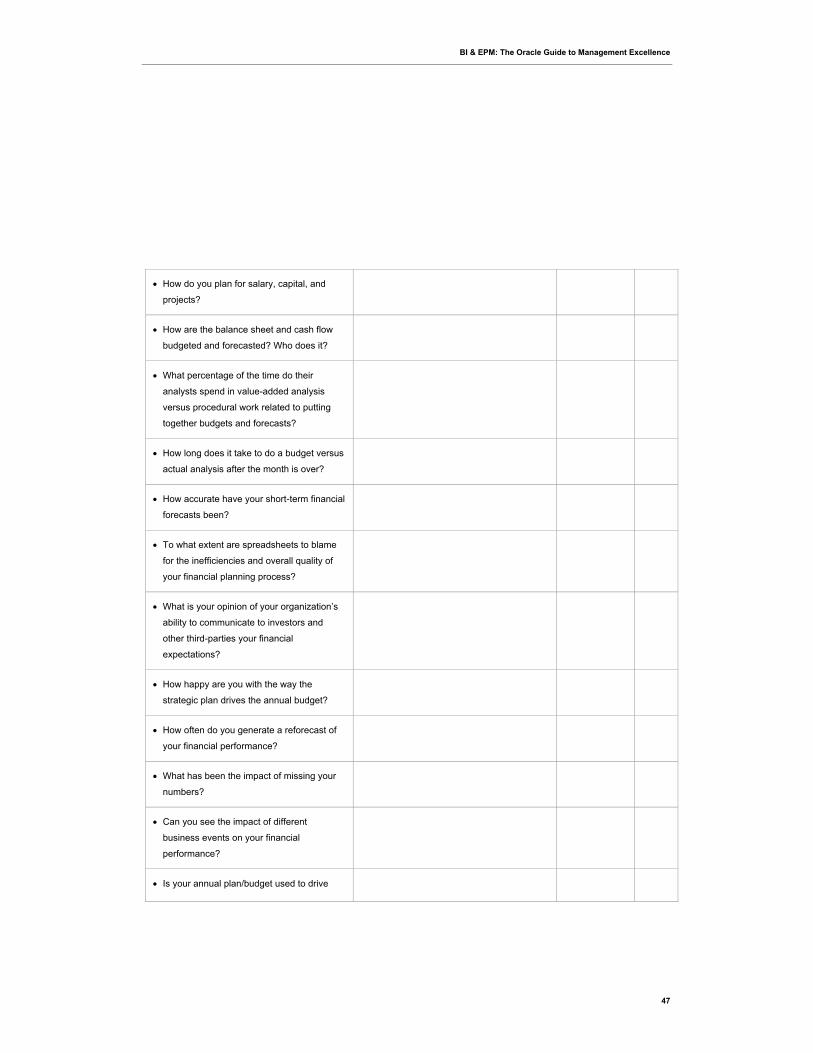
How do you plan for salary, capital, and
projects?
How are the balance sheet and cash flow
budgeted and forecasted? Who does it?
What percentage of the time do their
analysts spend in value-added analysis
versus procedural work related to putting
together budgets and forecasts?
How long does it take to do a budget versus
actual analysis after the month is over?
How accurate have your short-term financial
forecasts been?
To what extent are spreadsheets to blame
for the inefficiencies and overall quality of
your financial planning process?
What is your opinion of your organization’s
ability to communicate to investors and
other third-parties your financial
expectations?
How happy are you with the way the
strategic plan drives the annual budget?
How often do you generate a reforecast of
your financial performance?
What has been the impact of missing your
numbers?
Can you see the impact of different
business events on your financial
performance?
Is your annual plan/budget used to drive
BI & EPM: The Oracle Guide to Management Excellence
48
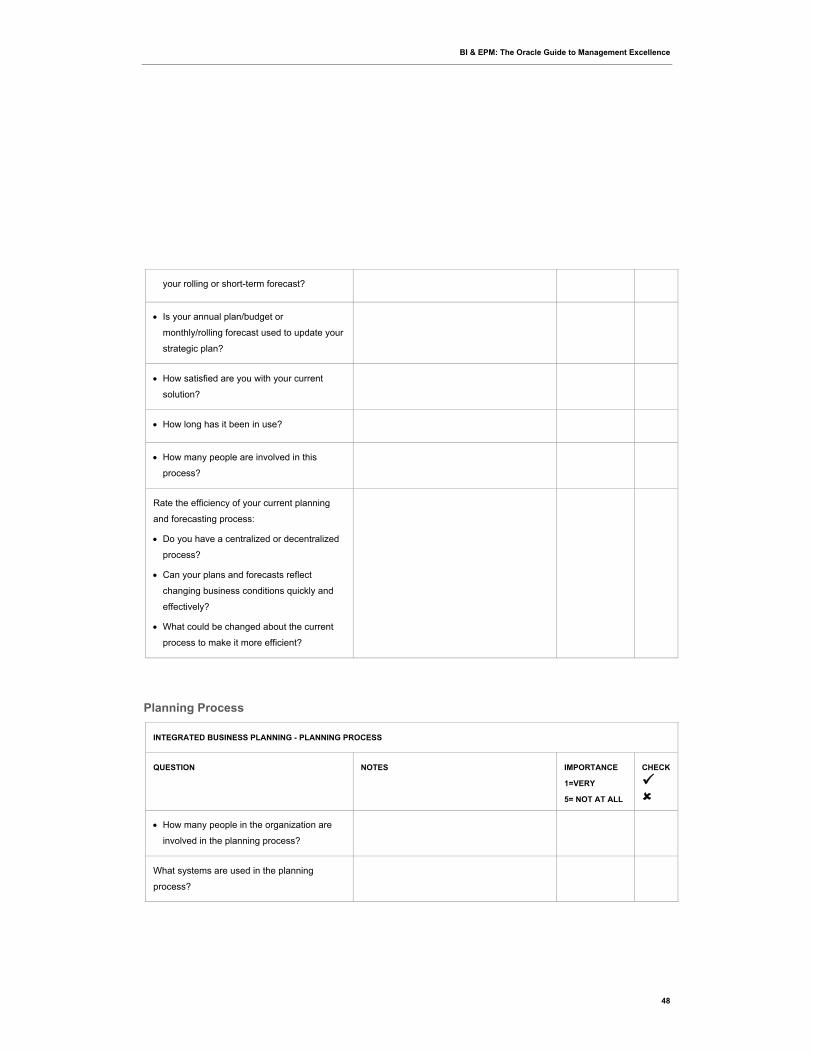
your rolling or short-term forecast?
Is your annual plan/budget or
monthly/rolling forecast used to update your
strategic plan?
How satisfied are you with your current
solution?
How long has it been in use?
How many people are involved in this
process?
Rate the efficiency of your current planning
and forecasting process:
Do you have a centralized or decentralized
process?
Can your plans and forecasts reflect
changing business conditions quickly and
effectively?
What could be changed about the current
process to make it more efficient?
Planning Process
INTEGRATED BUSINESS PLANNING - PLANNING PROCESS
QUESTION NOTES IMPORTANCE
1=VERY
5= NOT AT ALL
CHECK
How many people in the organization are
involved in the planning process?
What systems are used in the planning
process?
BI & EPM: The Oracle Guide to Management Excellence
49
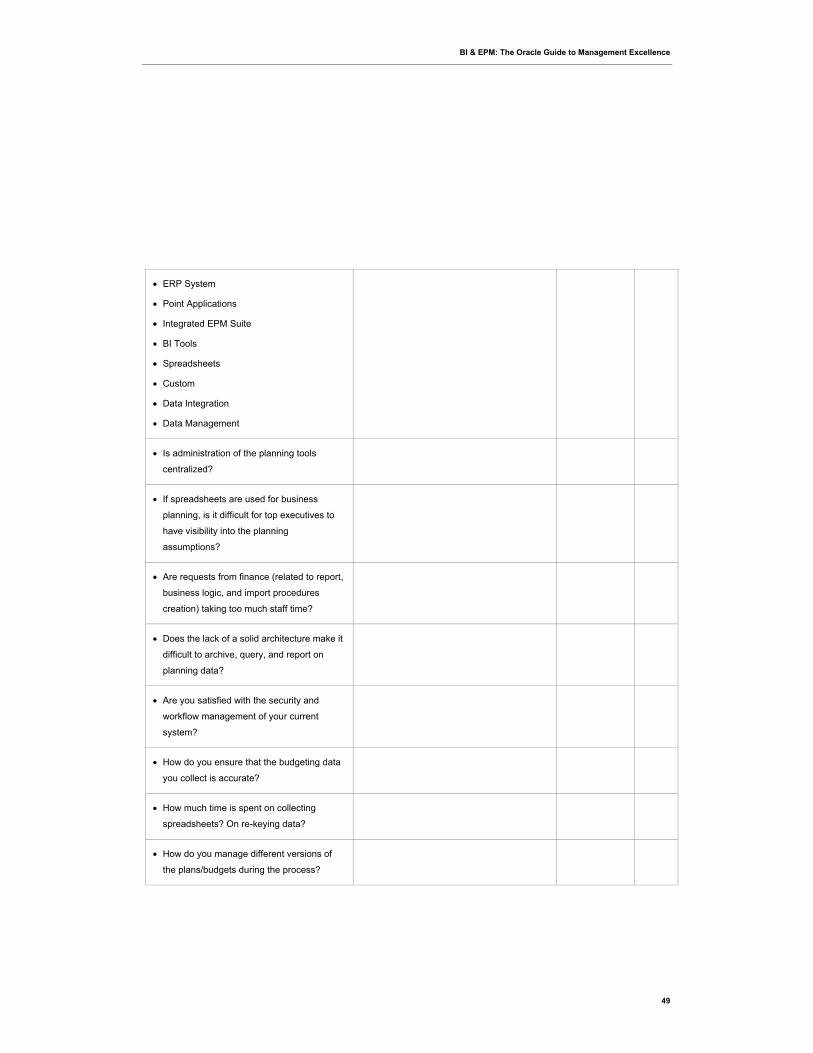
ERP System
Point Applications
Integrated EPM Suite
BI Tools
Spreadsheets
Custom
Data Integration
Data Management
Is administration of the planning tools
centralized?
If spreadsheets are used for business
planning, is it difficult for top executives to
have visibility into the planning
assumptions?
Are requests from finance (related to report,
business logic, and import procedures
creation) taking too much staff time?
Does the lack of a solid architecture make it
difficult to archive, query, and report on
planning data?
Are you satisfied with the security and
workflow management of your current
system?
How do you ensure that the budgeting data
you collect is accurate?
How much time is spent on collecting
spreadsheets? On re-keying data?
How do you manage different versions of
the plans/budgets during the process?
BI & EPM: The Oracle Guide to Management Excellence
50
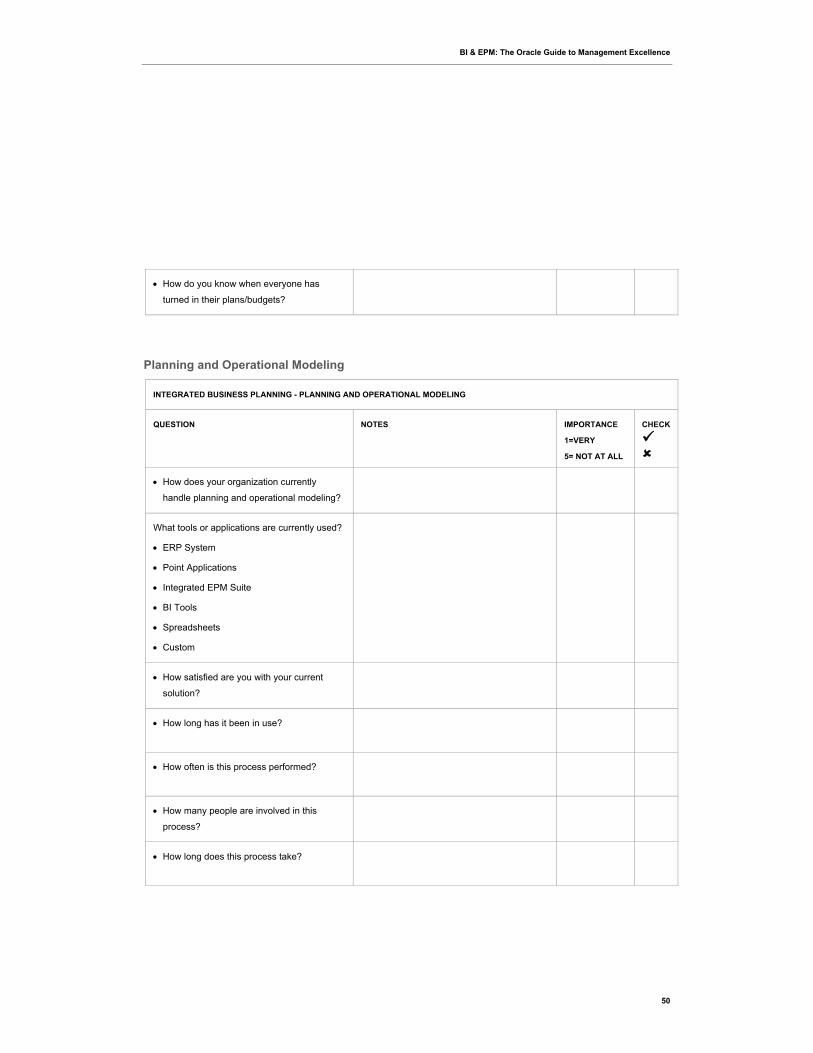
How do you know when everyone has
turned in their plans/budgets?
Planning and Operational Modeling
INTEGRATED BUSINESS PLANNING - PLANNING AND OPERATIONAL MODELING
QUESTION NOTES IMPORTANCE
1=VERY
5= NOT AT ALL
CHECK
How does your organization currently
handle planning and operational modeling?
What tools or applications are currently used?
ERP System
Point Applications
Integrated EPM Suite
BI Tools
Spreadsheets
Custom
How satisfied are you with your current
solution?
How long has it been in use?
How often is this process performed?
How many people are involved in this
process?
How long does this process take?
BI & EPM: The Oracle Guide to Management Excellence
51
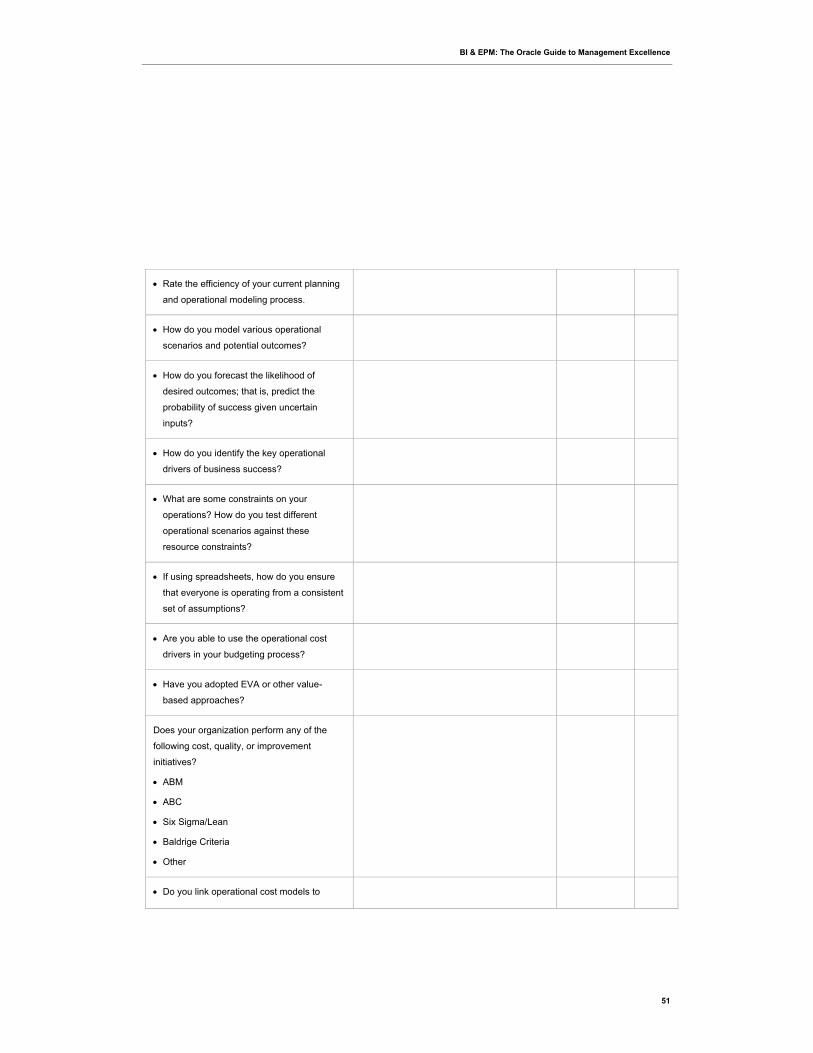
Rate the efficiency of your current planning
and operational modeling process.
How do you model various operational
scenarios and potential outcomes?
How do you forecast the likelihood of
desired outcomes; that is, predict the
probability of success given uncertain
inputs?
How do you identify the key operational
drivers of business success?
What are some constraints on your
operations? How do you test different
operational scenarios against these
resource constraints?
If using spreadsheets, how do you ensure
that everyone is operating from a consistent
set of assumptions?
Are you able to use the operational cost
drivers in your budgeting process?
Have you adopted EVA or other value-
based approaches?
Does your organization perform any of the
following cost, quality, or improvement
initiatives?
ABM
ABC
Six Sigma/Lean
Baldrige Criteria
Other
Do you link operational cost models to
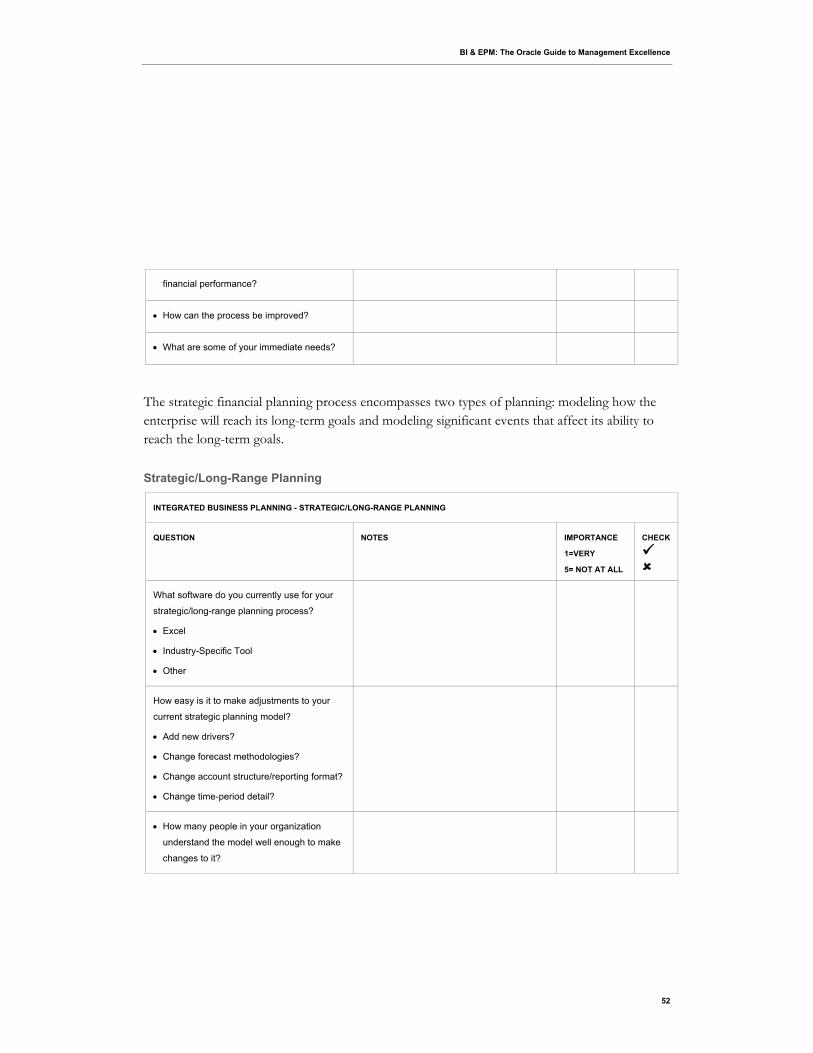
BI & EPM: The Oracle Guide to Management Excellence
52
financial performance?
How can the process be improved?
What are some of your immediate needs?
The strategic financial planning process encompasses two types of planning: modeling how the enterprise will reach its long-term goals and modeling significant events that affect its ability to reach the long-term goals.
Strategic/Long-Range Planning
INTEGRATED BUSINESS PLANNING - STRATEGIC/LONG-RANGE PLANNING
QUESTION NOTES IMPORTANCE
1=VERY
5= NOT AT ALL
CHECK
What software do you currently use for your
strategic/long-range planning process?
Excel
Industry-Specific Tool
Other
How easy is it to make adjustments to your
current strategic planning model?
Add new drivers?
Change forecast methodologies?
Change account structure/reporting format?
Change time-period detail?
How many people in your organization
understand the model well enough to make
changes to it?

BI & EPM: The Oracle Guide to Management Excellence
53
How much time is spent auditing the model
to catch significant errors?
How confident are you that all significant
errors have been caught and that you are
not making an important decision based on
faulty calculations?
What key metrics do you manage your
overall business to? Do they involve income
statement, balance sheet, and cash-flow
information?
Have you adopted EVA or other value-
based approaches?
How easy is it to run different scenarios on
key assumptions and compare results side
by side?
Does your strategic plan drive the annual
budgeting process?
How often do you reforecast your strategic
plan? Is it updated by the budget or
monthly/rolling forecast?
Profitability and Cost Management
PROFITABILITY AND COST MANAGEMENT
QUESTION NOTES IMPORTANCE
1=VERY
5= NOT AT ALL
CHECK
How happy are you with the way costs
and/or profitability is calculated today?
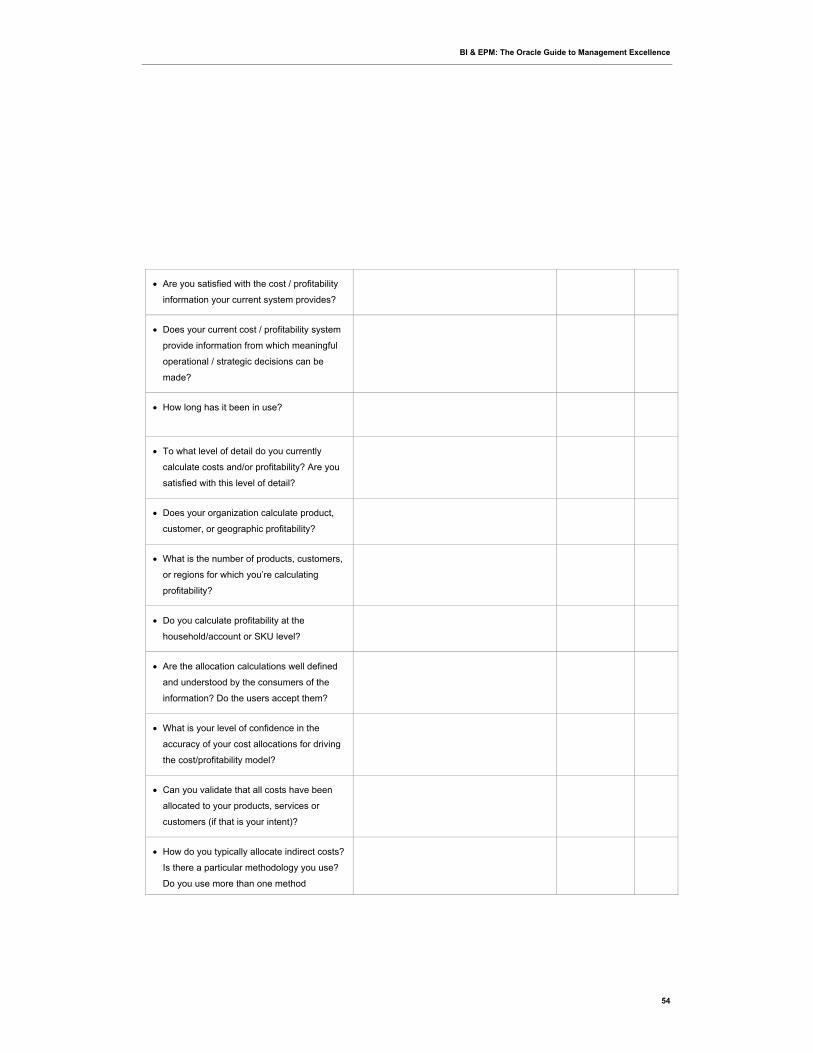
BI & EPM: The Oracle Guide to Management Excellence
54
Are you satisfied with the cost / profitability
information your current system provides?
Does your current cost / profitability system
provide information from which meaningful
operational / strategic decisions can be
made?
How long has it been in use?
To what level of detail do you currently
calculate costs and/or profitability? Are you
satisfied with this level of detail?
Does your organization calculate product,
customer, or geographic profitability?
What is the number of products, customers,
or regions for which you’re calculating
profitability?
Do you calculate profitability at the
household/account or SKU level?
Are the allocation calculations well defined
and understood by the consumers of the
information? Do the users accept them?
What is your level of confidence in the
accuracy of your cost allocations for driving
the cost/profitability model?
Can you validate that all costs have been
allocated to your products, services or
customers (if that is your intent)?
How do you typically allocate indirect costs?
Is there a particular methodology you use?
Do you use more than one method
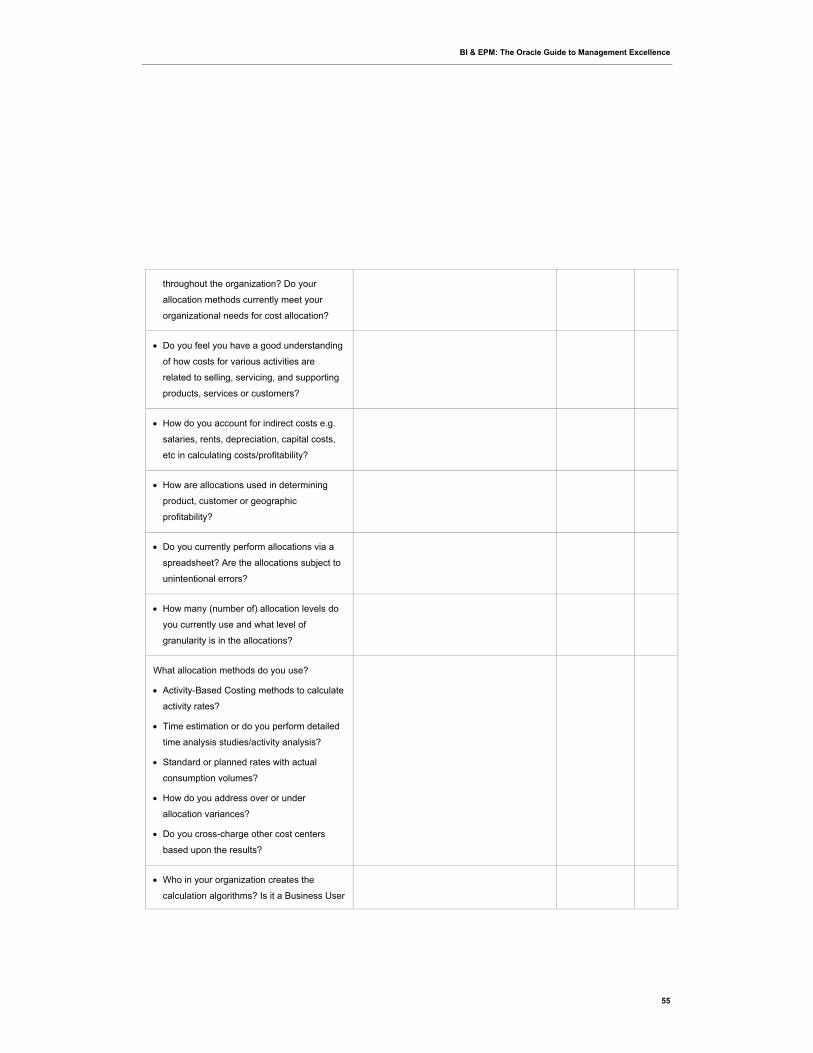
BI & EPM: The Oracle Guide to Management Excellence
55
throughout the organization? Do your
allocation methods currently meet your
organizational needs for cost allocation?
Do you feel you have a good understanding
of how costs for various activities are
related to selling, servicing, and supporting
products, services or customers?
How do you account for indirect costs e.g.
salaries, rents, depreciation, capital costs,
etc in calculating costs/profitability?
How are allocations used in determining
product, customer or geographic
profitability?
Do you currently perform allocations via a
spreadsheet? Are the allocations subject to
unintentional errors?
How many (number of) allocation levels do
you currently use and what level of
granularity is in the allocations?
What allocation methods do you use?
Activity-Based Costing methods to calculate
activity rates?
Time estimation or do you perform detailed
time analysis studies/activity analysis?
Standard or planned rates with actual
consumption volumes?
How do you address over or under
allocation variances?
Do you cross-charge other cost centers
based upon the results?
Who in your organization creates the
calculation algorithms? Is it a Business User
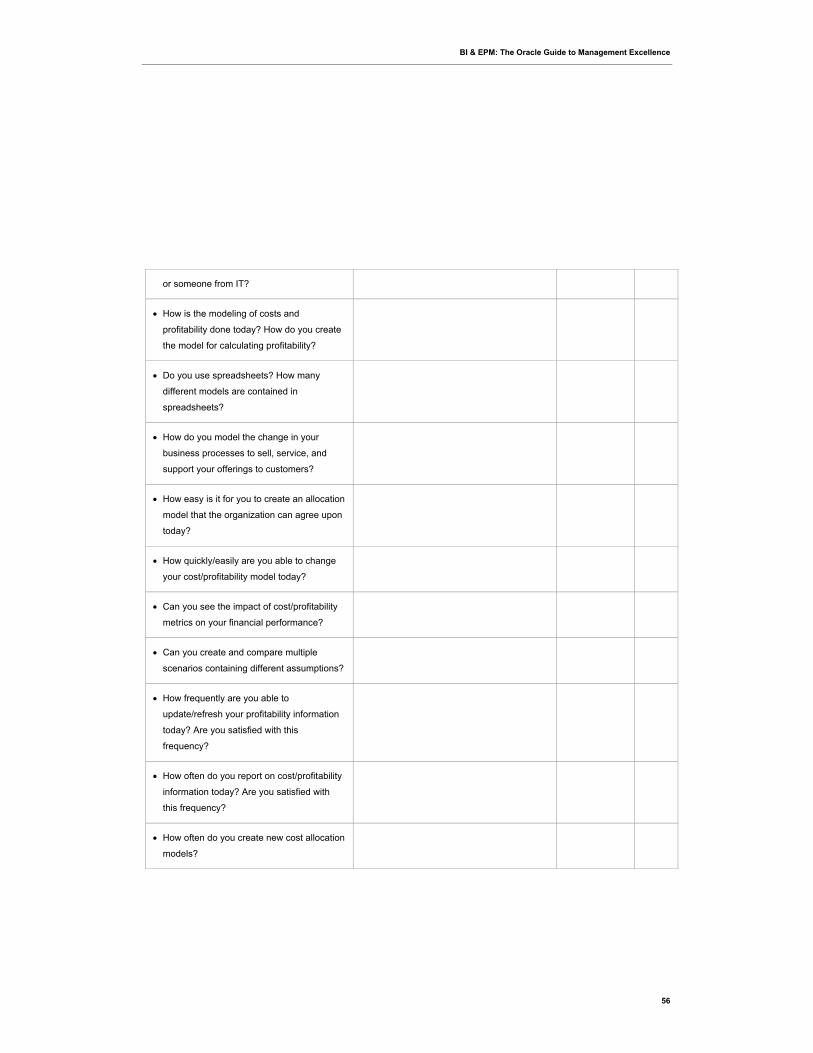
BI & EPM: The Oracle Guide to Management Excellence
56
or someone from IT?
How is the modeling of costs and
profitability done today? How do you create
the model for calculating profitability?
Do you use spreadsheets? How many
different models are contained in
spreadsheets?
How do you model the change in your
business processes to sell, service, and
support your offerings to customers?
How easy is it for you to create an allocation
model that the organization can agree upon
today?
How quickly/easily are you able to change
your cost/profitability model today?
Can you see the impact of cost/profitability
metrics on your financial performance?
Can you create and compare multiple
scenarios containing different assumptions?
How frequently are you able to
update/refresh your profitability information
today? Are you satisfied with this
frequency?
How often do you report on cost/profitability
information today? Are you satisfied with
this frequency?
How often do you create new cost allocation
models?
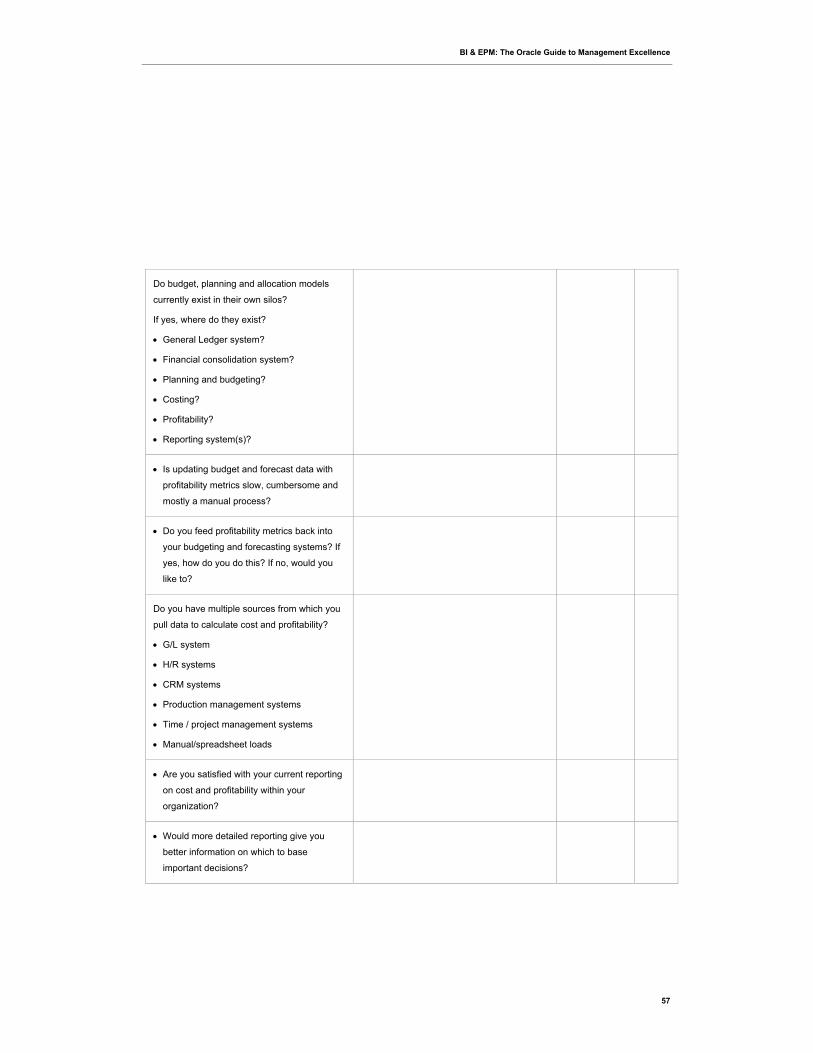
BI & EPM: The Oracle Guide to Management Excellence
57
Do budget, planning and allocation models
currently exist in their own silos?
If yes, where do they exist?
General Ledger system?
Financial consolidation system?
Planning and budgeting?
Costing?
Profitability?
Reporting system(s)?
Is updating budget and forecast data with
profitability metrics slow, cumbersome and
mostly a manual process?
Do you feed profitability metrics back into
your budgeting and forecasting systems? If
yes, how do you do this? If no, would you
like to?
Do you have multiple sources from which you
pull data to calculate cost and profitability?
G/L system
H/R systems
CRM systems
Production management systems
Time / project management systems
Manual/spreadsheet loads
Are you satisfied with your current reporting
on cost and profitability within your
organization?
Would more detailed reporting give you
better information on which to base
important decisions?
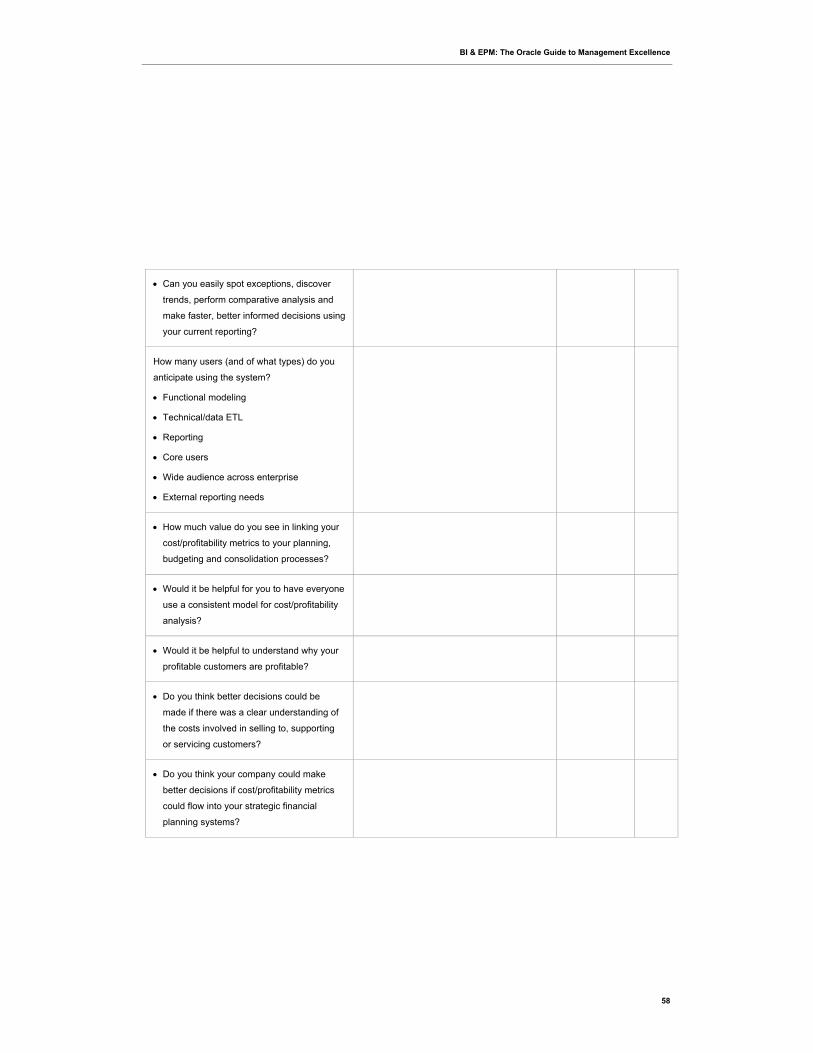
BI & EPM: The Oracle Guide to Management Excellence
58
Can you easily spot exceptions, discover
trends, perform comparative analysis and
make faster, better informed decisions using
your current reporting?
How many users (and of what types) do you
anticipate using the system?
Functional modeling
Technical/data ETL
Reporting
Core users
Wide audience across enterprise
External reporting needs
How much value do you see in linking your
cost/profitability metrics to your planning,
budgeting and consolidation processes?
Would it be helpful for you to have everyone
use a consistent model for cost/profitability
analysis?
Would it be helpful to understand why your
profitable customers are profitable?
Do you think better decisions could be
made if there was a clear understanding of
the costs involved in selling to, supporting
or servicing customers?
Do you think your company could make
better decisions if cost/profitability metrics
could flow into your strategic financial
planning systems?
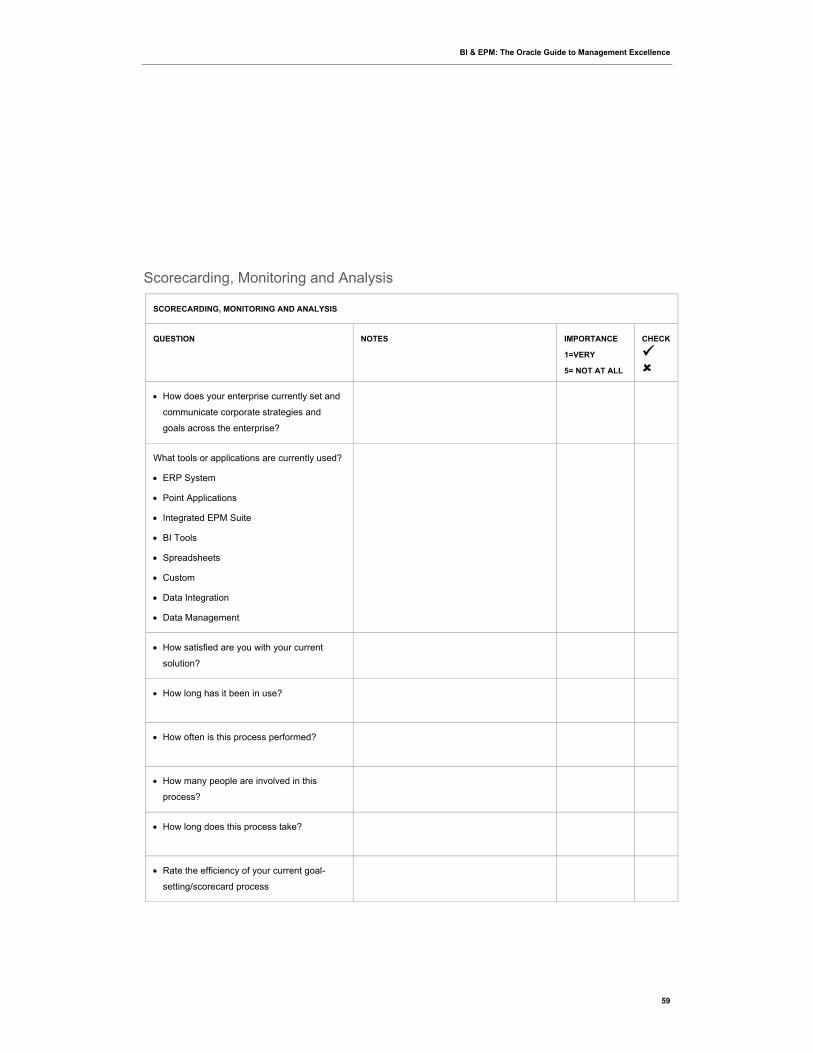
BI & EPM: The Oracle Guide to Management Excellence
59
Scorecarding, Monitoring and Analysis
SCORECARDING, MONITORING AND ANALYSIS
QUESTION NOTES IMPORTANCE
1=VERY
5= NOT AT ALL
CHECK
How does your enterprise currently set and
communicate corporate strategies and
goals across the enterprise?
What tools or applications are currently used?
ERP System
Point Applications
Integrated EPM Suite
BI Tools
Spreadsheets
Custom
Data Integration
Data Management
How satisfied are you with your current
solution?
How long has it been in use?
How often is this process performed?
How many people are involved in this
process?
How long does this process take?
Rate the efficiency of your current goal-
setting/scorecard process
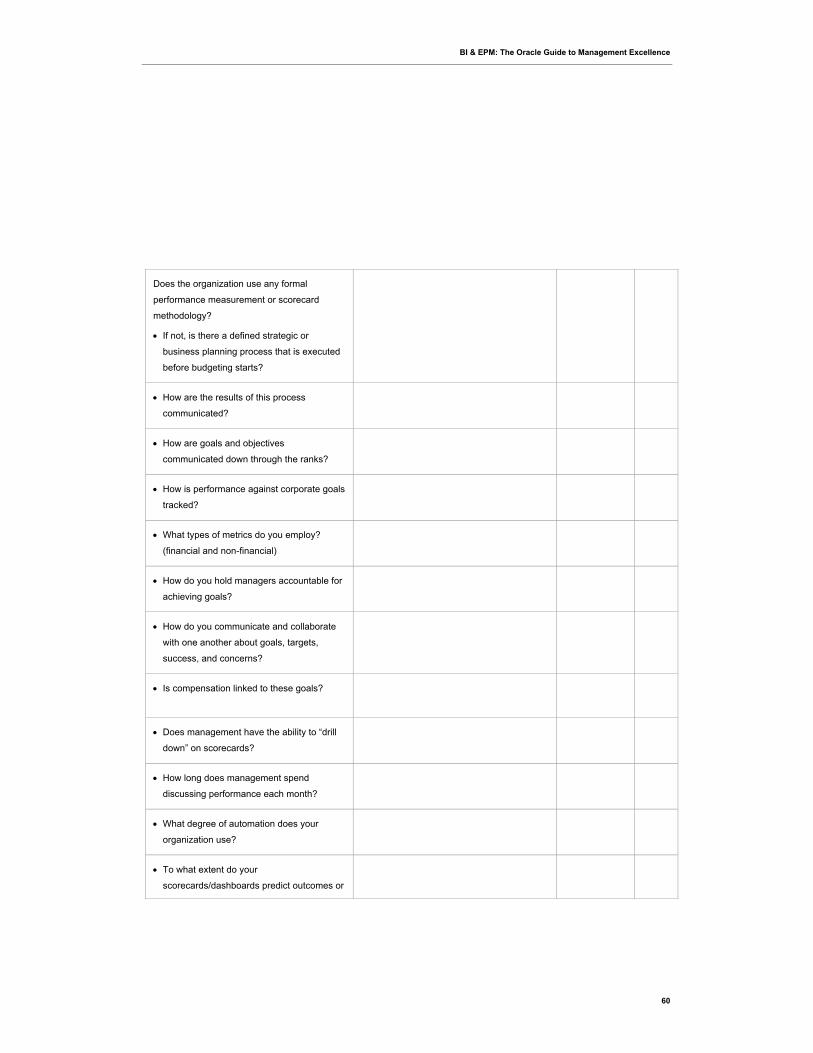
BI & EPM: The Oracle Guide to Management Excellence
60
Does the organization use any formal
performance measurement or scorecard
methodology?
If not, is there a defined strategic or
business planning process that is executed
before budgeting starts?
How are the results of this process
communicated?
How are goals and objectives
communicated down through the ranks?
How is performance against corporate goals
tracked?
What types of metrics do you employ?
(financial and non-financial)
How do you hold managers accountable for
achieving goals?
How do you communicate and collaborate
with one another about goals, targets,
success, and concerns?
Is compensation linked to these goals?
Does management have the ability to “drill
down” on scorecards?
How long does management spend
discussing performance each month?
What degree of automation does your
organization use?
To what extent do your
scorecards/dashboards predict outcomes or
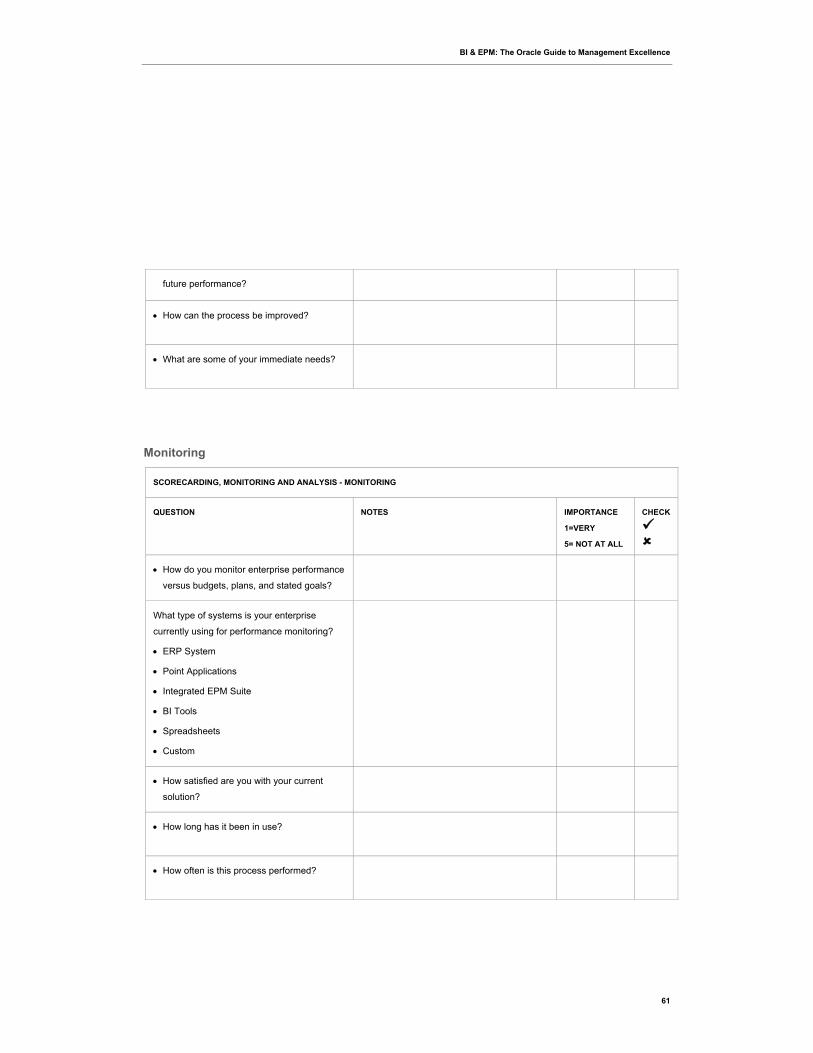
BI & EPM: The Oracle Guide to Management Excellence
61
future performance?
How can the process be improved?
What are some of your immediate needs?
Monitoring
SCORECARDING, MONITORING AND ANALYSIS - MONITORING
QUESTION NOTES IMPORTANCE
1=VERY
5= NOT AT ALL
CHECK
How do you monitor enterprise performance
versus budgets, plans, and stated goals?
What type of systems is your enterprise
currently using for performance monitoring?
ERP System
Point Applications
Integrated EPM Suite
BI Tools
Spreadsheets
Custom
How satisfied are you with your current
solution?
How long has it been in use?
How often is this process performed?
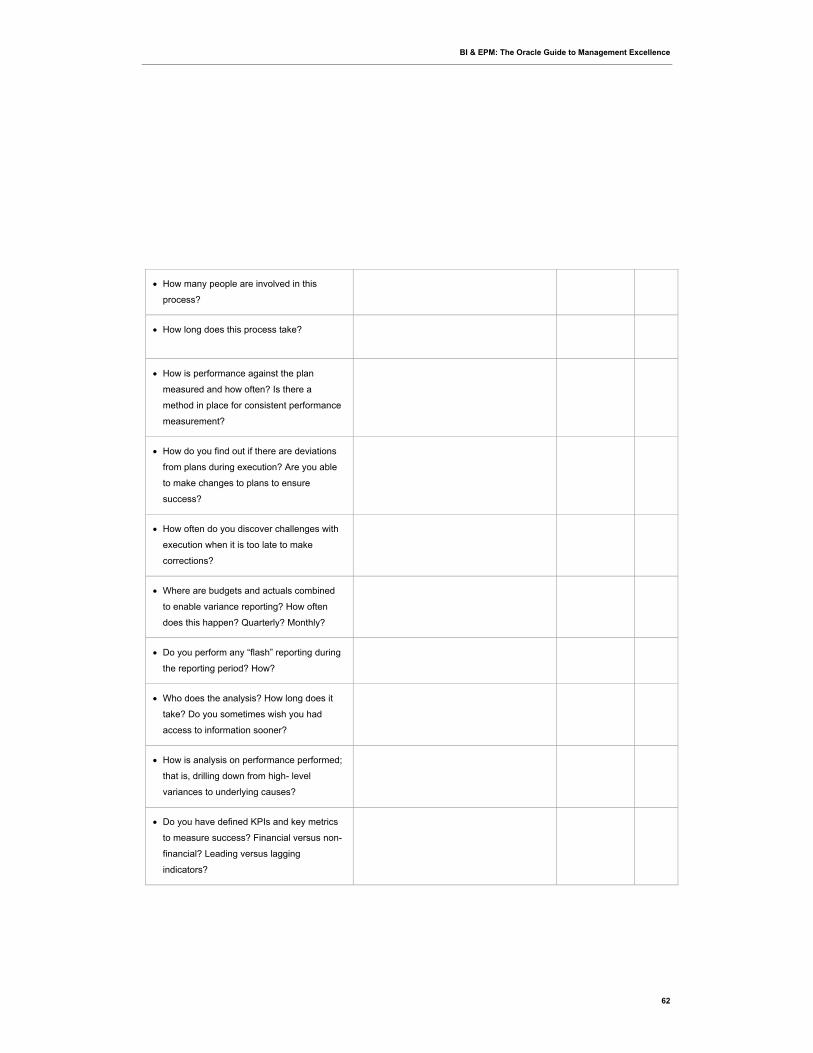
BI & EPM: The Oracle Guide to Management Excellence
62
How many people are involved in this
process?
How long does this process take?
How is performance against the plan
measured and how often? Is there a
method in place for consistent performance
measurement?
How do you find out if there are deviations
from plans during execution? Are you able
to make changes to plans to ensure
success?
How often do you discover challenges with
execution when it is too late to make
corrections?
Where are budgets and actuals combined
to enable variance reporting? How often
does this happen? Quarterly? Monthly?
Do you perform any “flash” reporting during
the reporting period? How?
Who does the analysis? How long does it
take? Do you sometimes wish you had
access to information sooner?
How is analysis on performance performed;
that is, drilling down from high- level
variances to underlying causes?
Do you have defined KPIs and key metrics
to measure success? Financial versus non-
financial? Leading versus lagging
indicators?
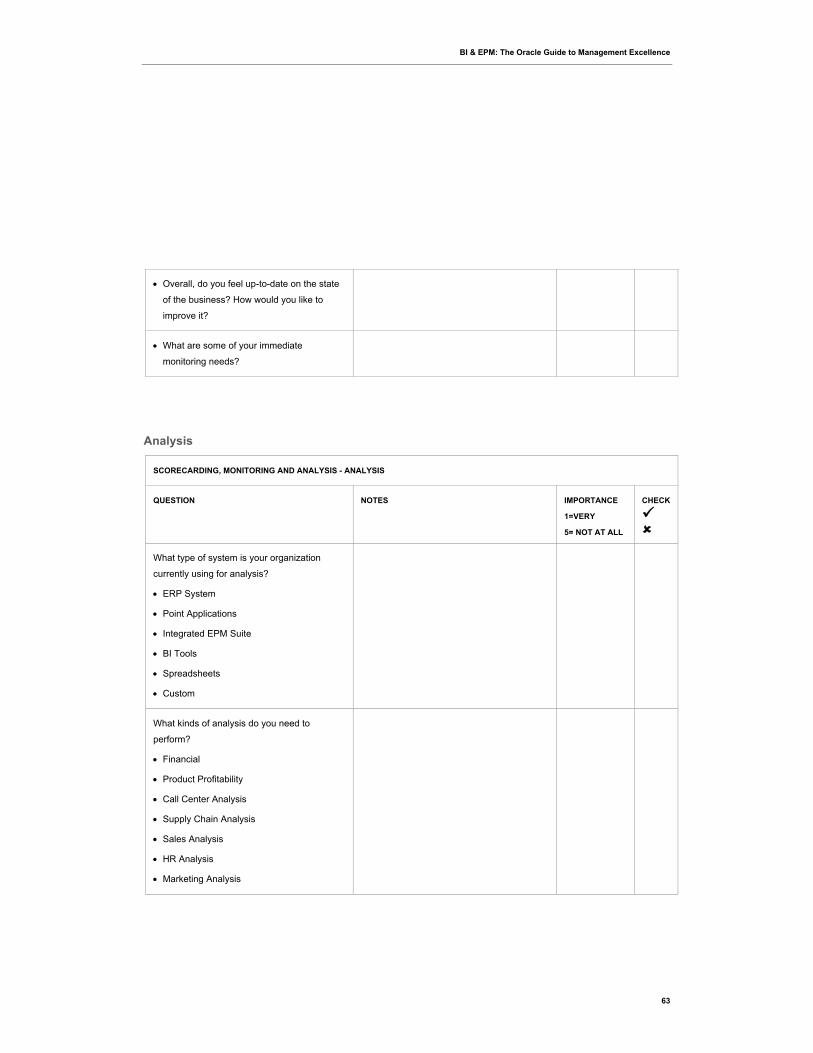
BI & EPM: The Oracle Guide to Management Excellence
63
Overall, do you feel up-to-date on the state
of the business? How would you like to
improve it?
What are some of your immediate
monitoring needs?
Analysis
SCORECARDING, MONITORING AND ANALYSIS - ANALYSIS
QUESTION NOTES IMPORTANCE
1=VERY
5= NOT AT ALL
CHECK
What type of system is your organization
currently using for analysis?
ERP System
Point Applications
Integrated EPM Suite
BI Tools
Spreadsheets
Custom
What kinds of analysis do you need to
perform?
Financial
Product Profitability
Call Center Analysis
Supply Chain Analysis
Sales Analysis
HR Analysis
Marketing Analysis
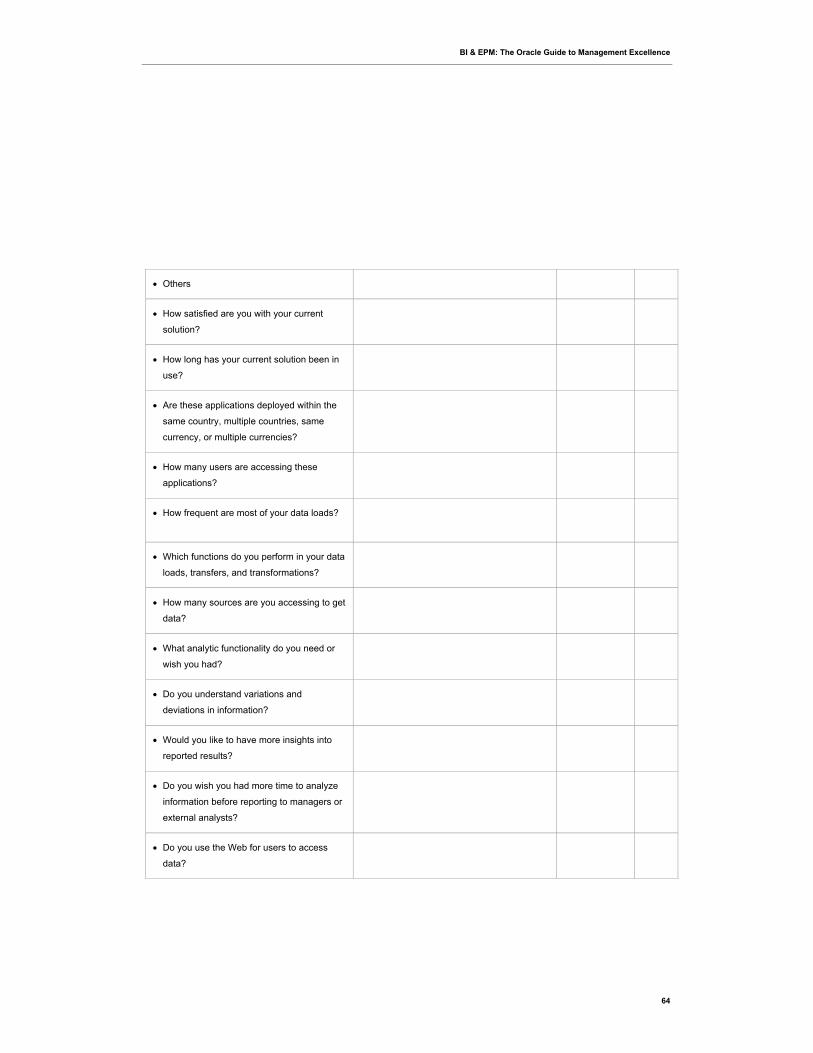
BI & EPM: The Oracle Guide to Management Excellence
64
Others
How satisfied are you with your current
solution?
How long has your current solution been in
use?
Are these applications deployed within the
same country, multiple countries, same
currency, or multiple currencies?
How many users are accessing these
applications?
How frequent are most of your data loads?
Which functions do you perform in your data
loads, transfers, and transformations?
How many sources are you accessing to get
data?
What analytic functionality do you need or
wish you had?
Do you understand variations and
deviations in information?
Would you like to have more insights into
reported results?
Do you wish you had more time to analyze
information before reporting to managers or
external analysts?
Do you use the Web for users to access
data?
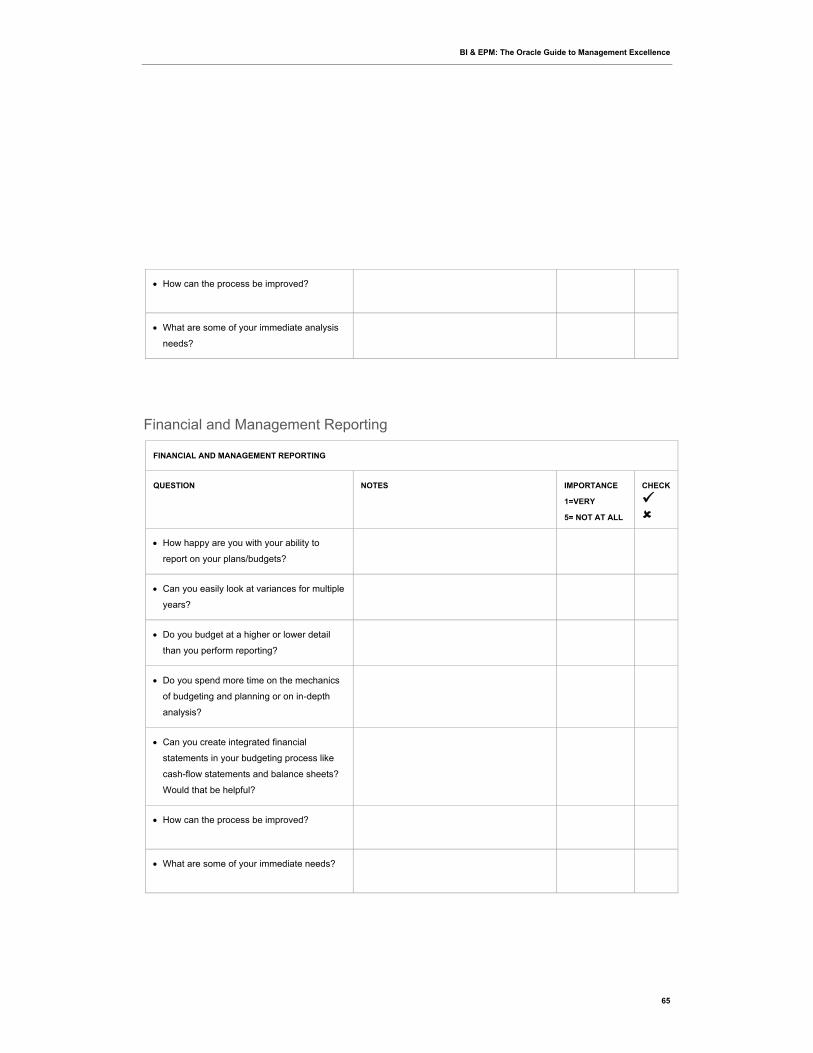
BI & EPM: The Oracle Guide to Management Excellence
65
How can the process be improved?
What are some of your immediate analysis
needs?
Financial and Management Reporting
FINANCIAL AND MANAGEMENT REPORTING
QUESTION NOTES IMPORTANCE
1=VERY
5= NOT AT ALL
CHECK
How happy are you with your ability to
report on your plans/budgets?
Can you easily look at variances for multiple
years?
Do you budget at a higher or lower detail
than you perform reporting?
Do you spend more time on the mechanics
of budgeting and planning or on in-depth
analysis?
Can you create integrated financial
statements in your budgeting process like
cash-flow statements and balance sheets?
Would that be helpful?
How can the process be improved?
What are some of your immediate needs?

BI & EPM: The Oracle Guide to Management Excellence
66
Do your analysts, internal auditors, or
external auditors ever need to reconcile
between your EPM systems and the source
system from which the data originated? If
so, how efficient is the process?
Do you have confidence in the financial
information generated by your existing EPM
system? If not, what do you suspect is the
source of that lack of confidence?
Do you feel you have 100% transparency to
the source data and any processes and
individuals that may have “manipulated”
said data?
Financial Consolidation and Reporting
FINANCIAL AND MANAGEMENT REPORTING - FINANCIAL CONSOLIDATION AND REPORTING
QUESTION NOTES IMPORTANCE
1=VERY
5= NOT AT ALL
CHECK
What type of system is your enterprise
currently using for your Reporting and
Consolidation application?
ERP System
Point Applications
Integrated EPM Suite
BI Tools
Spreadsheets
Custom

BI & EPM: The Oracle Guide to Management Excellence
67
How satisfied are you with your current
Reporting/Consolidation solution
How long has your current solution been in
use?
Rate the efficiency of your current process:
What could be changed about the current
process to make it more efficient?
How long is the process to close the books
and publish the numbers from your
organization?
Consolidation Process
FINANCIAL AND MANAGEMENT REPORTING - CONSOLIDATION PROCESS
QUESTION NOTES IMPORTANCE
1=VERY
5= NOT AT ALL
CHECK
How much time is spent on manual
processes such as collecting data, re-keying
data, and double-checking numbers?
Can you create integrated financial
statements in your reporting process, such
as like income statements, balance sheets,
and cash-flow Statements?
From how many data sources do you need
to consolidate? Which systems?
Can you easily access information from
your ERP system? Is there often a
bottleneck of requests?

BI & EPM: The Oracle Guide to Management Excellence
68
Do you trust the data being submitted by
remote operations?
Do you sometimes get conflicting answers?
Do you have one version of the truth?
How do you handle currency conversions?
Do you have complex inter-company
accounting?
Do you have any joint ventures or minority
interests?
How easily can you integrate an
organization post acquisition or merger?
Considering the number of systems your
organization is using to collect and manage
financial information, is it difficult to get
pertinent and timely answers?
Would your organization benefit from a
common place to unify the financial
information and other metrics?
How satisfied are you with your current
financial consolidation solution?
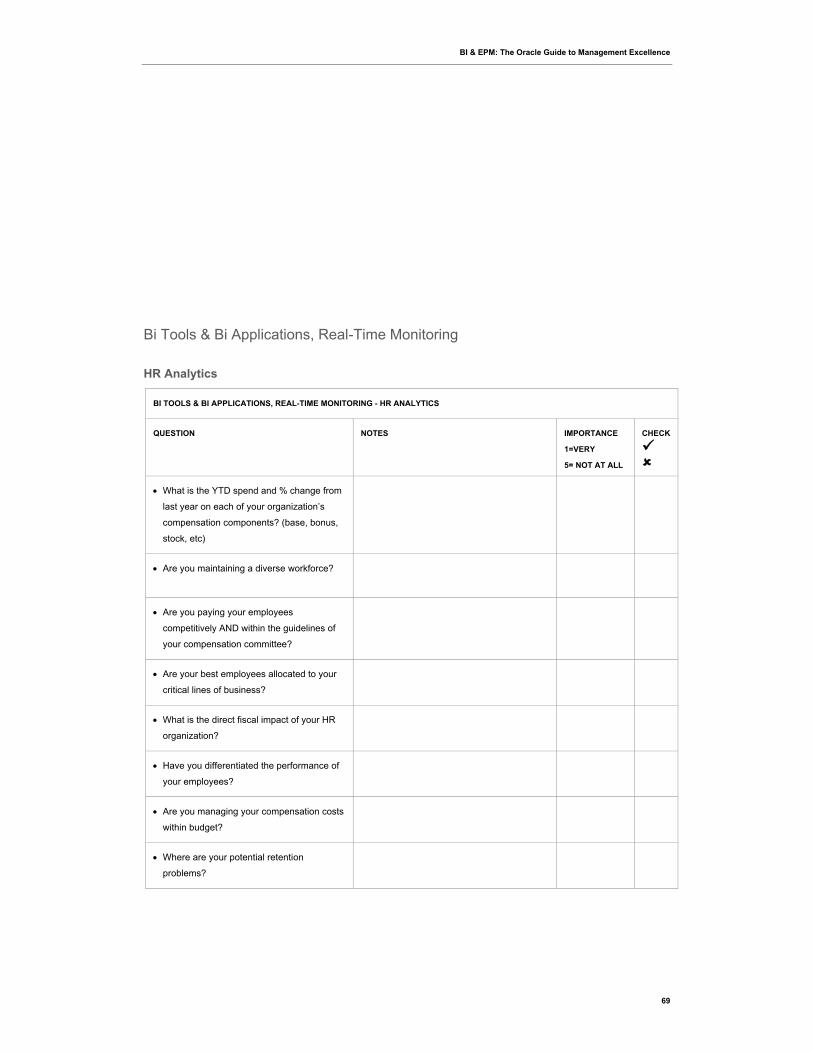
BI & EPM: The Oracle Guide to Management Excellence
69
Bi Tools & Bi Applications, Real-Time Monitoring
HR Analytics
BI TOOLS & BI APPLICATIONS, REAL-TIME MONITORING - HR ANALYTICS
QUESTION NOTES IMPORTANCE
1=VERY
5= NOT AT ALL
CHECK
What is the YTD spend and % change from
last year on each of your organization’s
compensation components? (base, bonus,
stock, etc)
Are you maintaining a diverse workforce?
Are you paying your employees
competitively AND within the guidelines of
your compensation committee?
Are your best employees allocated to your
critical lines of business?
What is the direct fiscal impact of your HR
organization?
Have you differentiated the performance of
your employees?
Are you managing your compensation costs
within budget?
Where are your potential retention
problems?
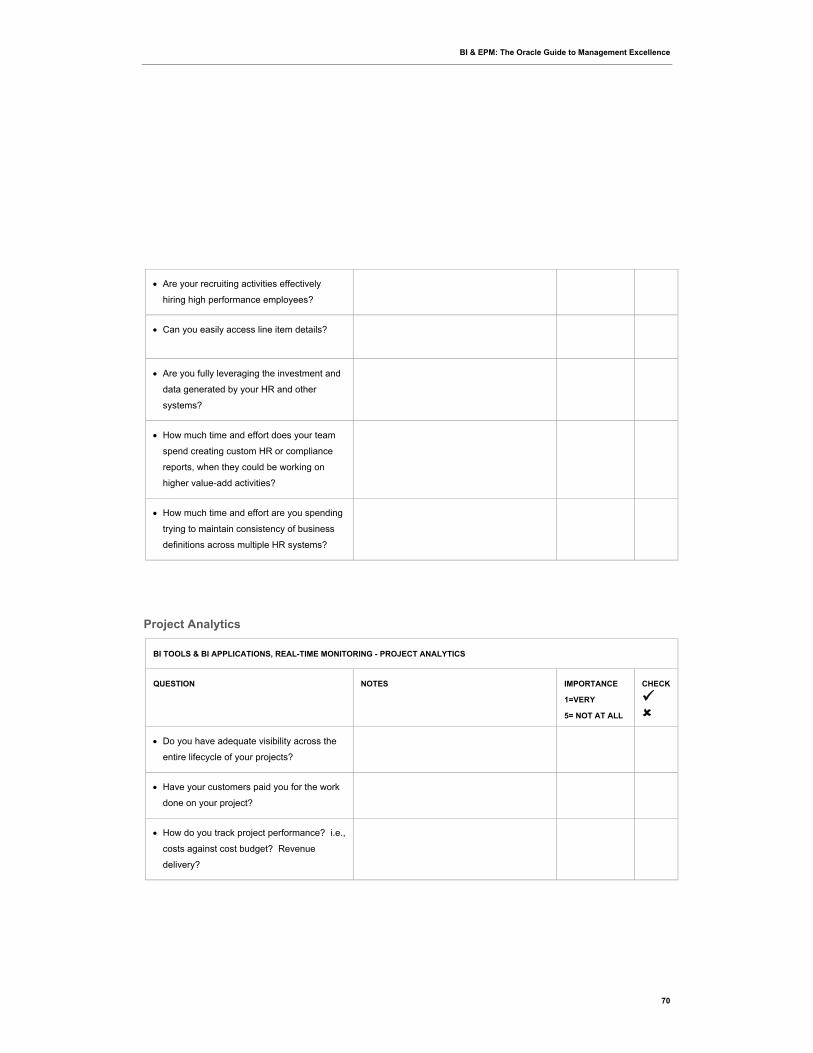
BI & EPM: The Oracle Guide to Management Excellence
70
Are your recruiting activities effectively
hiring high performance employees?
Can you easily access line item details?
Are you fully leveraging the investment and
data generated by your HR and other
systems?
How much time and effort does your team
spend creating custom HR or compliance
reports, when they could be working on
higher value-add activities?
How much time and effort are you spending
trying to maintain consistency of business
definitions across multiple HR systems?
Project Analytics
BI TOOLS & BI APPLICATIONS, REAL-TIME MONITORING - PROJECT ANALYTICS
QUESTION NOTES IMPORTANCE
1=VERY
5= NOT AT ALL
CHECK
Do you have adequate visibility across the
entire lifecycle of your projects?
Have your customers paid you for the work
done on your project?
How do you track project performance? i.e.,
costs against cost budget? Revenue
delivery?
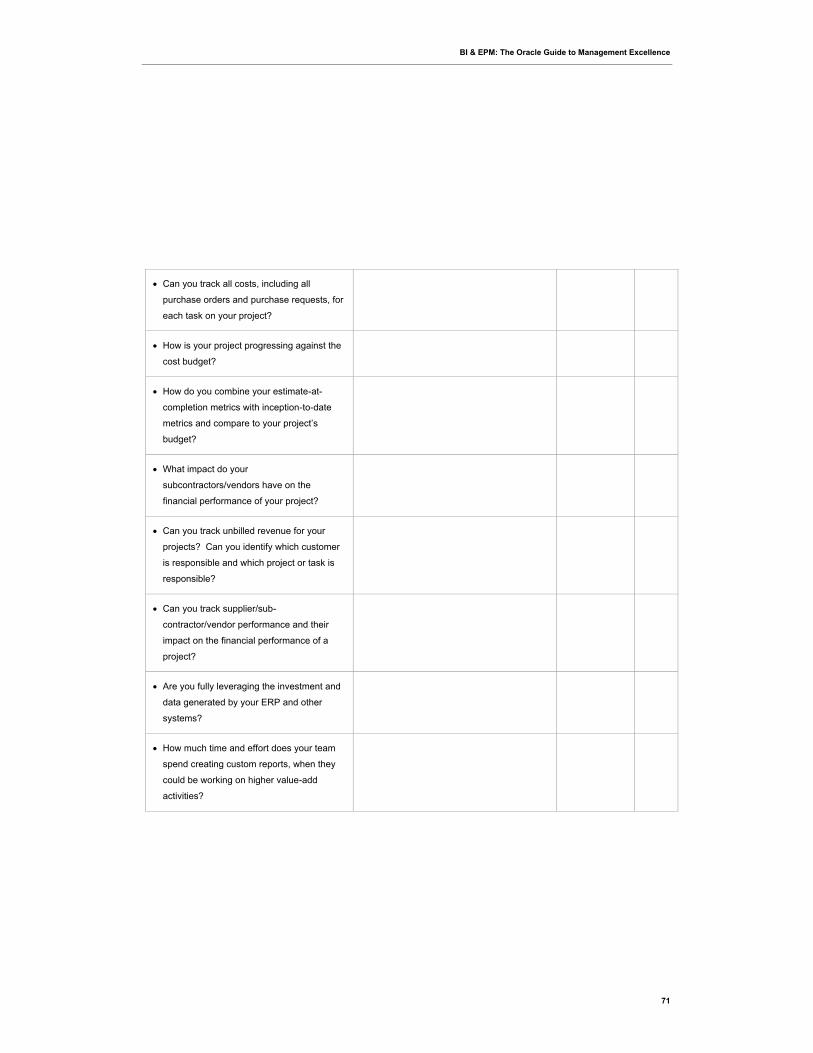
BI & EPM: The Oracle Guide to Management Excellence
71
Can you track all costs, including all
purchase orders and purchase requests, for
each task on your project?
How is your project progressing against the
cost budget?
How do you combine your estimate-at-
completion metrics with inception-to-date
metrics and compare to your project’s
budget?
What impact do your
subcontractors/vendors have on the
financial performance of your project?
Can you track unbilled revenue for your
projects? Can you identify which customer
is responsible and which project or task is
responsible?
Can you track supplier/sub-
contractor/vendor performance and their
impact on the financial performance of a
project?
Are you fully leveraging the investment and
data generated by your ERP and other
systems?
How much time and effort does your team
spend creating custom reports, when they
could be working on higher value-add
activities?

BI & EPM: The Oracle Guide to Management Excellence
72
Procurement and Spend Analytics
BI TOOLS & BI APPLICATIONS, REAL-TIME MONITORING - PROCUREMENT AND SPEND ANALYTICS
QUESTION NOTES IMPORTANCE
1=VERY
5= NOT AT ALL
CHECK
Do you have adequate visibility into your
entire procure-to-pay process?
Do you know direct and indirect spend
trends for each part of your business?
Can you identify and exploit opportunities to
reduce costs and consolidate suppliers?
Do you know how well your strategic
suppliers are contributing to supply line
health?
How well do you understand employee
expense trends compared to budget?
Are strategic contracts being utilized
properly to get the best business value?
Can you effectively monitor supplier quality
and on-time delivery performance?
How well can you monitor how spend is
distributed across suppliers and contracts?
Do you know your top 10 suppliers by on-
time, and your worst 10 suppliers by price
variance?
Can you track your payment performance
versus contract terms?
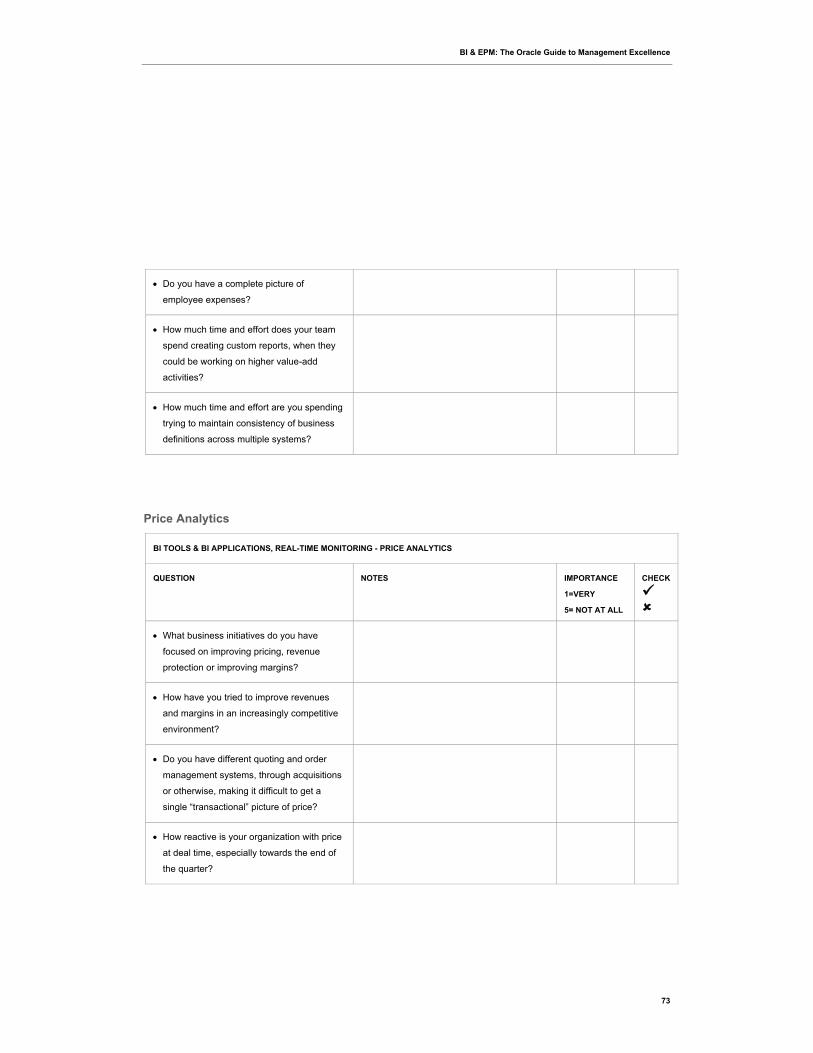
BI & EPM: The Oracle Guide to Management Excellence
73
Do you have a complete picture of
employee expenses?
How much time and effort does your team
spend creating custom reports, when they
could be working on higher value-add
activities?
How much time and effort are you spending
trying to maintain consistency of business
definitions across multiple systems?
Price Analytics
BI TOOLS & BI APPLICATIONS, REAL-TIME MONITORING - PRICE ANALYTICS
QUESTION NOTES IMPORTANCE
1=VERY
5= NOT AT ALL
CHECK
What business initiatives do you have
focused on improving pricing, revenue
protection or improving margins?
How have you tried to improve revenues
and margins in an increasingly competitive
environment?
Do you have different quoting and order
management systems, through acquisitions
or otherwise, making it difficult to get a
single “transactional” picture of price?
How reactive is your organization with price
at deal time, especially towards the end of
the quarter?
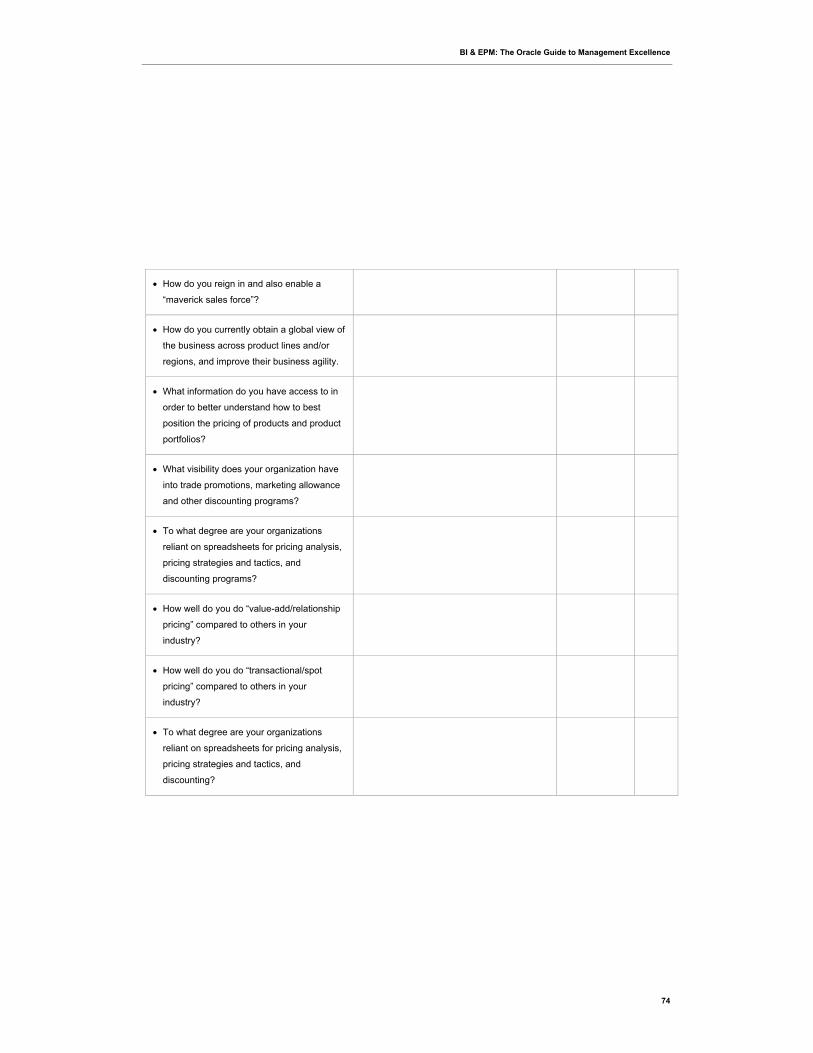
BI & EPM: The Oracle Guide to Management Excellence
74
How do you reign in and also enable a
“maverick sales force”?
How do you currently obtain a global view of
the business across product lines and/or
regions, and improve their business agility.
What information do you have access to in
order to better understand how to best
position the pricing of products and product
portfolios?
What visibility does your organization have
into trade promotions, marketing allowance
and other discounting programs?
To what degree are your organizations
reliant on spreadsheets for pricing analysis,
pricing strategies and tactics, and
discounting programs?
How well do you do “value-add/relationship
pricing” compared to others in your
industry?
How well do you do “transactional/spot
pricing” compared to others in your
industry?
To what degree are your organizations
reliant on spreadsheets for pricing analysis,
pricing strategies and tactics, and
discounting?
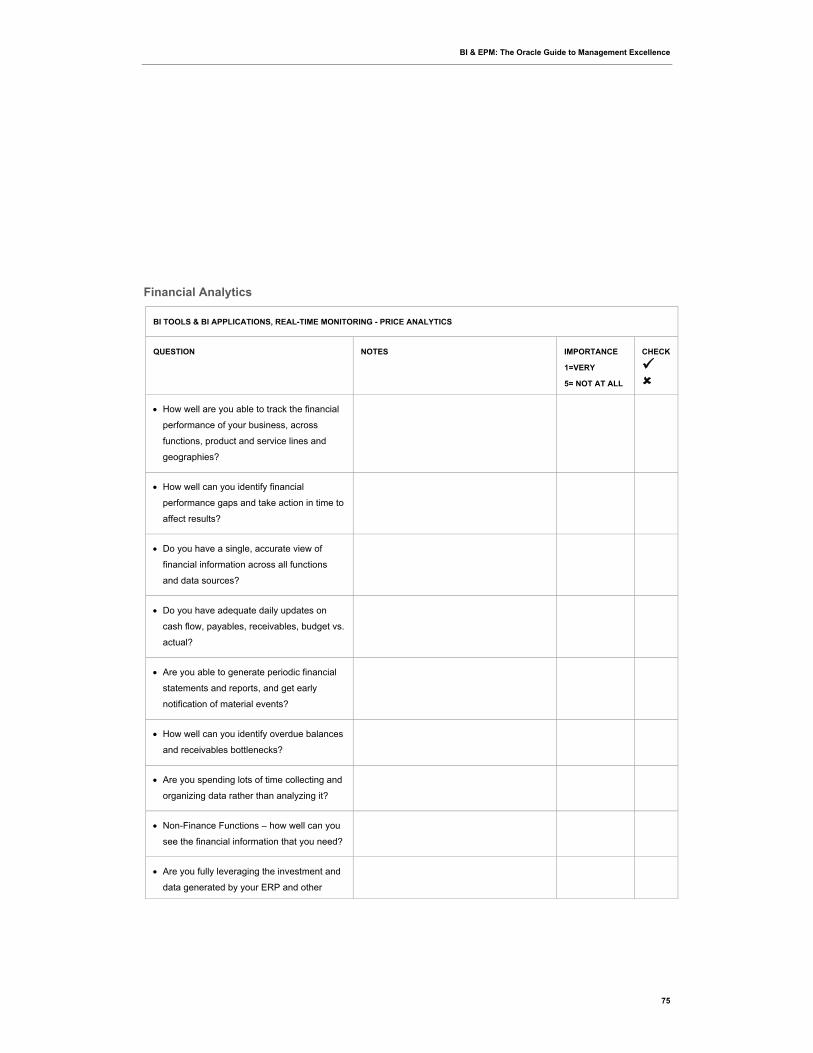
BI & EPM: The Oracle Guide to Management Excellence
75
Financial Analytics
BI TOOLS & BI APPLICATIONS, REAL-TIME MONITORING - PRICE ANALYTICS
QUESTION NOTES IMPORTANCE
1=VERY
5= NOT AT ALL
CHECK
How well are you able to track the financial
performance of your business, across
functions, product and service lines and
geographies?
How well can you identify financial
performance gaps and take action in time to
affect results?
Do you have a single, accurate view of
financial information across all functions
and data sources?
Do you have adequate daily updates on
cash flow, payables, receivables, budget vs.
actual?
Are you able to generate periodic financial
statements and reports, and get early
notification of material events?
How well can you identify overdue balances
and receivables bottlenecks?
Are you spending lots of time collecting and
organizing data rather than analyzing it?
Non-Finance Functions – how well can you
see the financial information that you need?
Are you fully leveraging the investment and
data generated by your ERP and other
BI & EPM: The Oracle Guide to Management Excellence
76
systems?
How much time and effort does your team
spend creating custom reports, when they
could be working on higher value-add
activities?
How much time and effort are you spending
trying to maintain consistency of business
definitions across multiple systems?
Loyalty Analytics
BI TOOLS & BI APPLICATIONS, REAL-TIME MONITORING - LOYALTY ANALYTICS
QUESTION NOTES IMPORTANCE
1=VERY
5= NOT AT ALL
CHECK
How do you measure trend in customer loyalty
over a period of time?
What are the levers of customer loyalty in
your business?
Why do customers defect in your industry?
How do you measure effectiveness of your
Loyalty Program?
Are you able to measure ROI on your
program investment?
How do you leverage your loyalty program
in driving your customer strategy?
How do you measure effectiveness of
promotion in driving profitable customer
behavior?
BI & EPM: The Oracle Guide to Management Excellence
77
How do you decide your target audience for
promotions?
How do you relate sales lift to loyalty
promotions?
How do you track membership lifecycle?
How do you track customer behavior
(especially of your high value customers) or
identify churn risk?
How do you measure profitability of
partners?
How do you measure popularity of
partners?
How do you manage financial transactions
(billing, invoicing, etc.) with partners?
Are you able to measure both the revenue,
cost and point liability associated with each
partner?
What do you measure overall effectiveness
of partners?
Supply Chain and Order Management Analytics
BI TOOLS & BI APPLICATIONS, REAL-TIME MONITORING - SUPPLY CHAIN AND ORDER MANAGEMENT ANALYTICS
QUESTION NOTES IMPORTANCE
1=VERY
5= NOT AT ALL
CHECK
What is the order to ship cycle for your top
products?

BI & EPM: The Oracle Guide to Management Excellence
78
What type of operational backlog is the
largest?
How much revenue was lost due to order
cancellations or returns?
What are the top reasons for cancellations?
Which of the top customers have unfulfilled
orders?
What products has this customer purchased
from us in the past?
What inventory do you have available for
sale at each location?
Do you have enough finished goods to fill
your booked orders?
What products are experiencing lower
inventory turns than last quarter?
What is the overall status of your on-hand
inventory, finished goods, and WIP?
Are you fully leveraging the investment and
data generated by your ERP and other
systems?
How much time and effort does your team
spend creating custom reports, when they
could be working on higher value-add
activities?
How much time and effort are you spending
trying to maintain consistency of business
definitions across multiple systems?

BI & EPM: The Oracle Guide to Management Excellence
79
Sales Analytics
BI TOOLS & BI APPLICATIONS, REAL-TIME MONITORING - SALES ANALYTICS
QUESTION NOTES IMPORTANCE
1=VERY
5= NOT AT ALL
CHECK
Do you know what your win/loss trend is
against your key competitors?
Is your overall pipeline healthy enough to
meet sales objectives?
What is the trend in your average sales
cycle length?
What are the top reasons that sales
opportunities are not moving through your
pipeline?
How do you know if your sales force is
adhering to best practices within the sales
cycle?
What are your top stalled opportunities and
what is the associated revenue exposure?
How does your current sales forecast
compare with your pipeline?
How do you determine opportunity revenue
by sales stage for each of your sales reps?
Are you able to triangulate your sales
forecasts? How do you accomplish this?
How do you do “White Space” analysis and
determine sales potential within your install
base?

BI & EPM: The Oracle Guide to Management Excellence
80
What are the candidates for up/cross-sell
within your key accounts?
How do you ensure the accuracy of the
forecasts you submit to management?
What are the top 3 metrics you need to
know to better manage your business?
Service and Contact Center Analytics
BI TOOLS & BI APPLICATIONS, REAL-TIME MONITORING - SERVICE AND CONTACT CENTER ANALYTICS
QUESTION NOTES IMPORTANCE
1=VERY
5= NOT AT ALL
CHECK
How do you segment and service profitable
customers within the contact center?
What processes are in place to profile your
unprofitable customers and make them
profitable?
How do you control staffing costs without
having a negative affect on customer
satisfaction?
What is the correct balance of support for
the IVR versus a live call agent?
How do you plan for staffing levels in
relation to contact volumes?
What are the processes to ensure that the
best qualified agent is handling the correct
call?
BI & EPM: The Oracle Guide to Management Excellence
81
What affect does agent training and
turnover have on your customer satisfaction
levels?
Are customers satisfied with the level of
service you are providing, and are service
issues being brought to resolution in a
timely manner?
What causes your average call handling
time to go up?
What are the key metrics that you need to
know to better service your customers?
What can you do to influence your one-and-
done rate?
What techniques do you use to cross/up-
sell a customer?
Marketing Analytics
BI TOOLS & BI APPLICATIONS, REAL-TIME MONITORING - MARKETING ANALYTICS
QUESTION NOTES IMPORTANCE
1=VERY
5= NOT AT ALL
CHECK
How do you determine how effectively the
marketing budget is being consumed?
How do you determine the allocation of
marketing budget resources to generate the
best results?
What areas or programs in your marketing
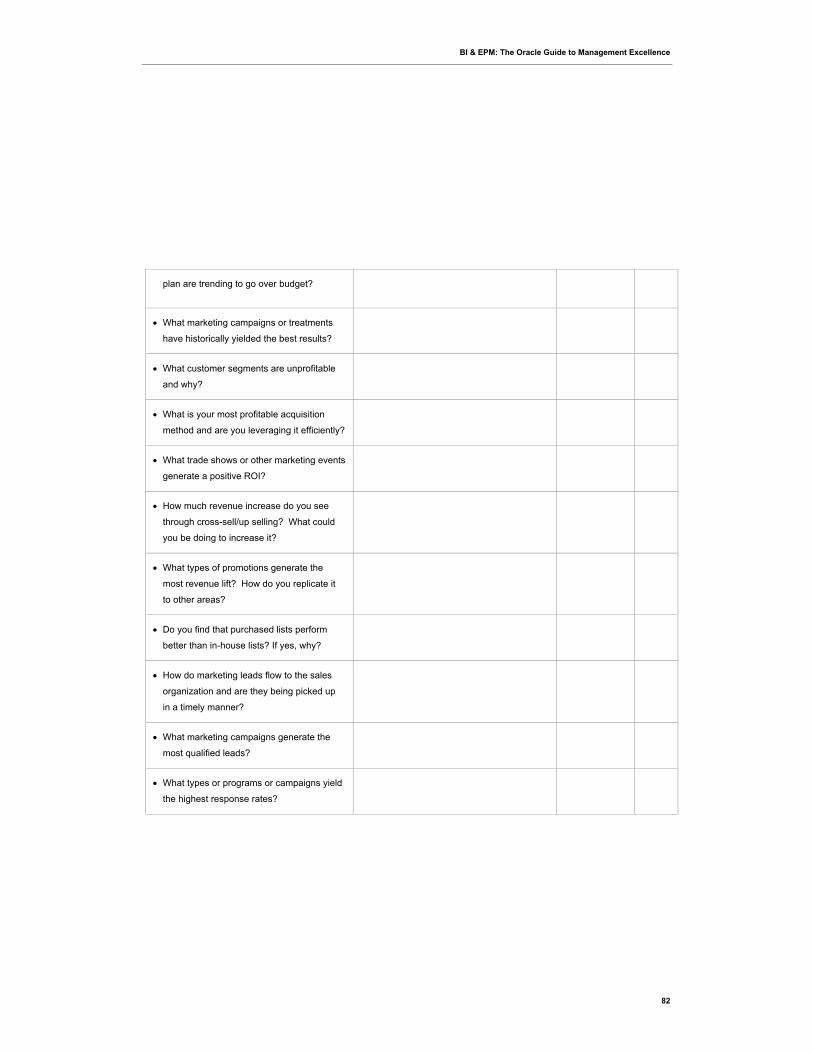
BI & EPM: The Oracle Guide to Management Excellence
82
plan are trending to go over budget?
What marketing campaigns or treatments
have historically yielded the best results?
What customer segments are unprofitable
and why?
What is your most profitable acquisition
method and are you leveraging it efficiently?
What trade shows or other marketing events
generate a positive ROI?
How much revenue increase do you see
through cross-sell/up selling? What could
you be doing to increase it?
What types of promotions generate the
most revenue lift? How do you replicate it
to other areas?
Do you find that purchased lists perform
better than in-house lists? If yes, why?
How do marketing leads flow to the sales
organization and are they being picked up
in a timely manner?
What marketing campaigns generate the
most qualified leads?
What types or programs or campaigns yield
the highest response rates?
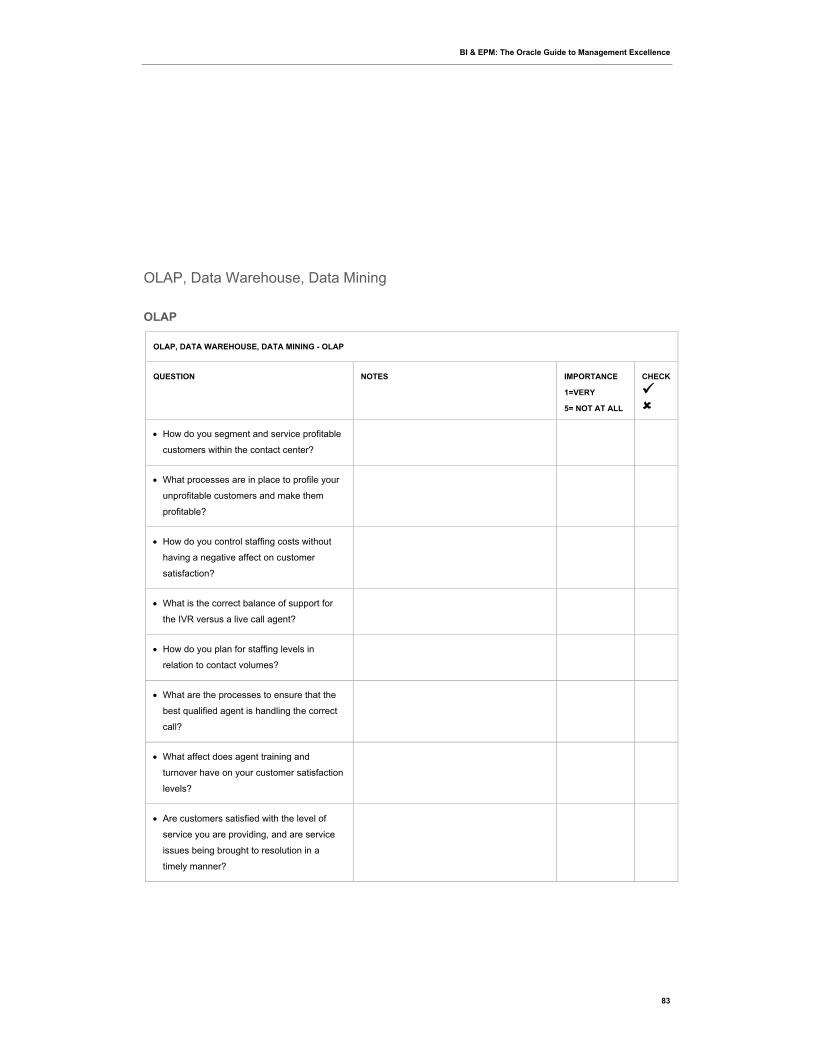
BI & EPM: The Oracle Guide to Management Excellence
83
OLAP, Data Warehouse, Data Mining
OLAP
OLAP, DATA WAREHOUSE, DATA MINING - OLAP
QUESTION NOTES IMPORTANCE
1=VERY
5= NOT AT ALL
CHECK
How do you segment and service profitable
customers within the contact center?
What processes are in place to profile your
unprofitable customers and make them
profitable?
How do you control staffing costs without
having a negative affect on customer
satisfaction?
What is the correct balance of support for
the IVR versus a live call agent?
How do you plan for staffing levels in
relation to contact volumes?
What are the processes to ensure that the
best qualified agent is handling the correct
call?
What affect does agent training and
turnover have on your customer satisfaction
levels?
Are customers satisfied with the level of
service you are providing, and are service
issues being brought to resolution in a
timely manner?
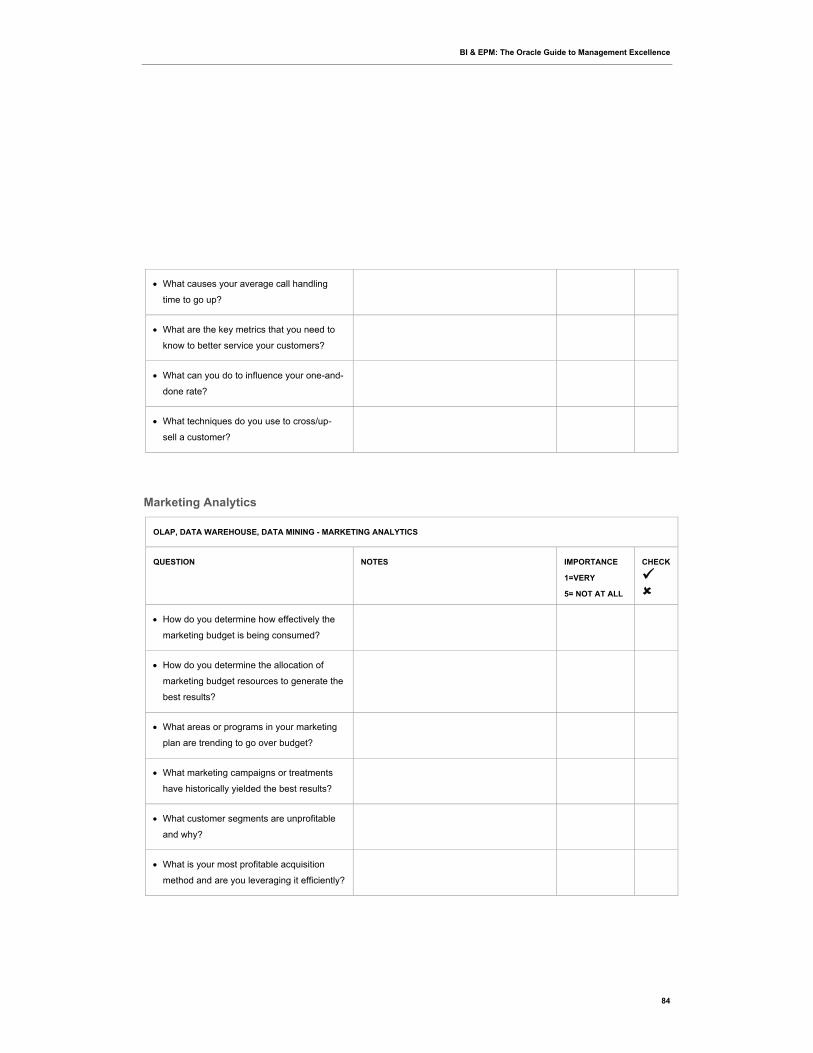
BI & EPM: The Oracle Guide to Management Excellence
84
What causes your average call handling
time to go up?
What are the key metrics that you need to
know to better service your customers?
What can you do to influence your one-and-
done rate?
What techniques do you use to cross/up-
sell a customer?
Marketing Analytics
OLAP, DATA WAREHOUSE, DATA MINING - MARKETING ANALYTICS
QUESTION NOTES IMPORTANCE
1=VERY
5= NOT AT ALL
CHECK
How do you determine how effectively the
marketing budget is being consumed?
How do you determine the allocation of
marketing budget resources to generate the
best results?
What areas or programs in your marketing
plan are trending to go over budget?
What marketing campaigns or treatments
have historically yielded the best results?
What customer segments are unprofitable
and why?
What is your most profitable acquisition
method and are you leveraging it efficiently?

BI & EPM: The Oracle Guide to Management Excellence
85
What trade shows or other marketing events
generate a positive ROI?
How much revenue increase do you see
through cross-sell/up selling? What could
you be doing to increase it?
What types of promotions generate the
most revenue lift? How do you replicate it
to other areas?
Do you find that purchased lists perform
better than in-house lists? If yes, why?
How do marketing leads flow to the sales
organization and are they being picked up
in a timely manner?
What marketing campaigns generate the
most qualified leads?
What types or programs or campaigns yield
the highest response rates?
OLAP
OLAP, DATA WAREHOUSE, DATA MINING - OLAP
QUESTION NOTES IMPORTANCE
1=VERY
5= NOT AT ALL
CHECK
What are some of your immediate reporting
and analysis needs?
How quickly can you respond to user
requests for new reports or views of
information?

BI & EPM: The Oracle Guide to Management Excellence
86
Do you wish you had more time to analyze
information?
Do you have a common point of truth for
your shared financial information? If so, how
accessible is the information?
Are there several disparate data sources
required for an enterprise view of a subject
area; i.e. product profitability?
Do your business analysts use
spreadsheets to create their own analytic
views or standard reports?
How often do you find errors in the
spreadsheets?
What impact have these spreadsheet errors
had on your business?
Do you find that information does not come
quickly enough for timely action?
Does executive management feel that
reporting and analysis could be improved?
How often do your analysts perform what-if
scenarios? What do you use to facilitate this
process?
How many spreadsheets are used for
critical business information or standard
reporting today?
Are many of your workbooks filled with
spreadsheets that look alike, save the
header or point-of-view information?
How are you integrating standard data with
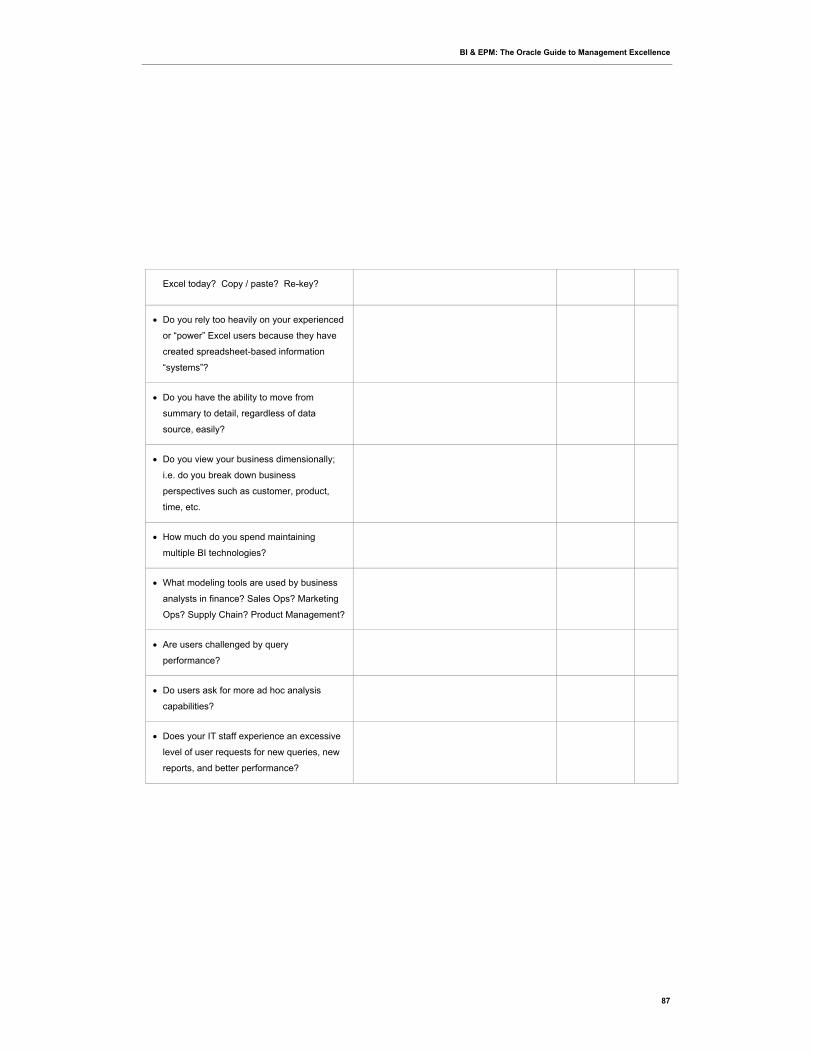
BI & EPM: The Oracle Guide to Management Excellence
87
Excel today? Copy / paste? Re-key?
Do you rely too heavily on your experienced
or “power” Excel users because they have
created spreadsheet-based information
“systems”?
Do you have the ability to move from
summary to detail, regardless of data
source, easily?
Do you view your business dimensionally;
i.e. do you break down business
perspectives such as customer, product,
time, etc.
How much do you spend maintaining
multiple BI technologies?
What modeling tools are used by business
analysts in finance? Sales Ops? Marketing
Ops? Supply Chain? Product Management?
Are users challenged by query
performance?
Do users ask for more ad hoc analysis
capabilities?
Does your IT staff experience an excessive
level of user requests for new queries, new
reports, and better performance?
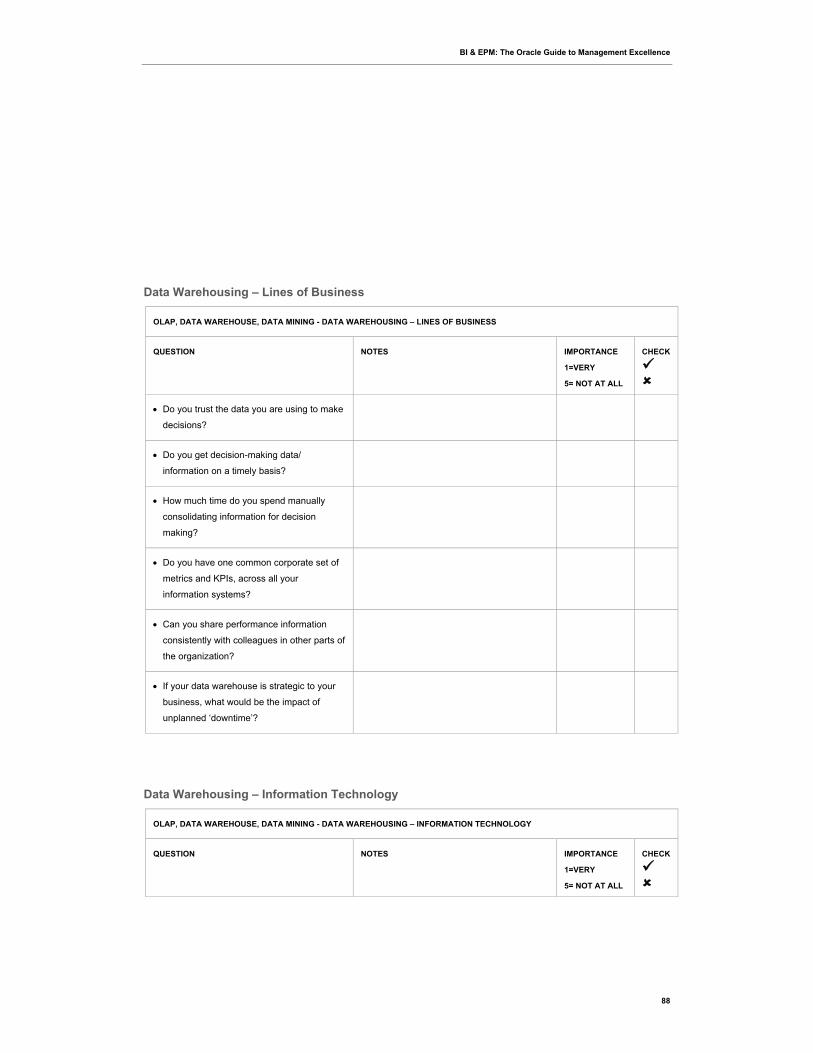
BI & EPM: The Oracle Guide to Management Excellence
88
Data Warehousing – Lines of Business
OLAP, DATA WAREHOUSE, DATA MINING - DATA WAREHOUSING – LINES OF BUSINESS
QUESTION NOTES IMPORTANCE
1=VERY
5= NOT AT ALL
CHECK
Do you trust the data you are using to make
decisions?
Do you get decision-making data/
information on a timely basis?
How much time do you spend manually
consolidating information for decision
making?
Do you have one common corporate set of
metrics and KPIs, across all your
information systems?
Can you share performance information
consistently with colleagues in other parts of
the organization?
If your data warehouse is strategic to your
business, what would be the impact of
unplanned ‘downtime’?
Data Warehousing – Information Technology
OLAP, DATA WAREHOUSE, DATA MINING - DATA WAREHOUSING – INFORMATION TECHNOLOGY
QUESTION NOTES IMPORTANCE
1=VERY
5= NOT AT ALL
CHECK
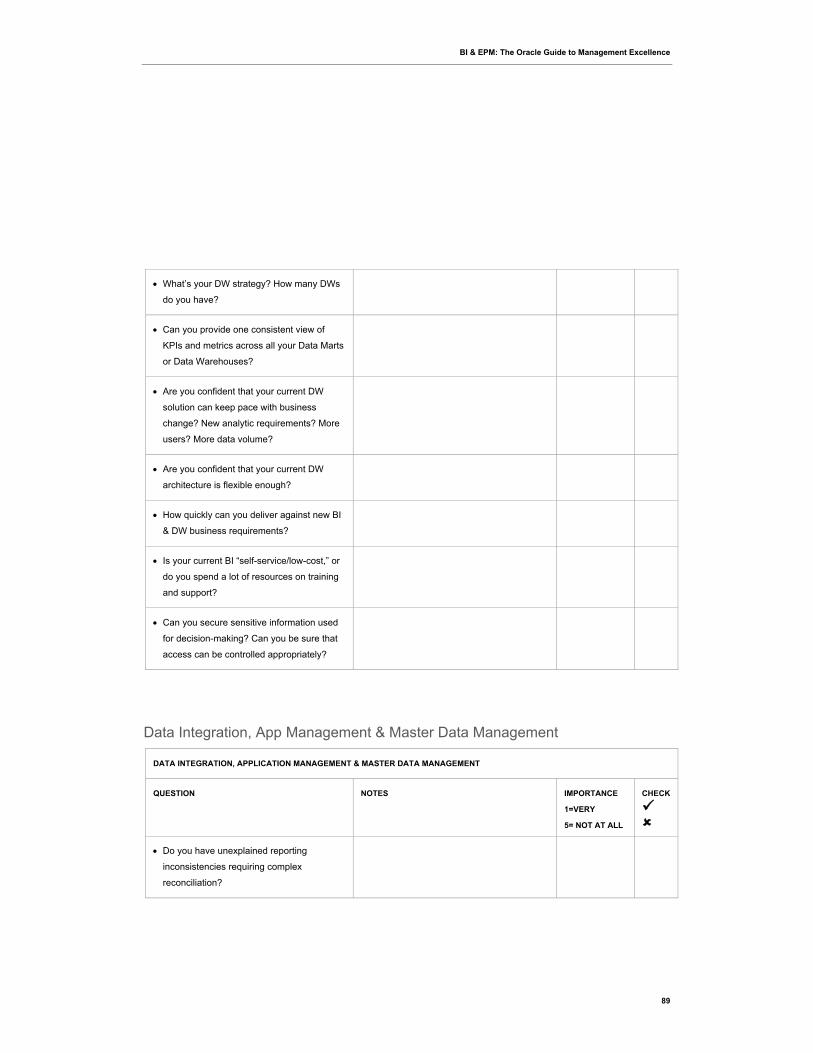
BI & EPM: The Oracle Guide to Management Excellence
89
What’s your DW strategy? How many DWs
do you have?
Can you provide one consistent view of
KPIs and metrics across all your Data Marts
or Data Warehouses?
Are you confident that your current DW
solution can keep pace with business
change? New analytic requirements? More
users? More data volume?
Are you confident that your current DW
architecture is flexible enough?
How quickly can you deliver against new BI
& DW business requirements?
Is your current BI “self-service/low-cost,” or
do you spend a lot of resources on training
and support?
Can you secure sensitive information used
for decision-making? Can you be sure that
access can be controlled appropriately?
Data Integration, App Management & Master Data Management
DATA INTEGRATION, APPLICATION MANAGEMENT & MASTER DATA MANAGEMENT
QUESTION NOTES IMPORTANCE
1=VERY
5= NOT AT ALL
CHECK
Do you have unexplained reporting
inconsistencies requiring complex
reconciliation?
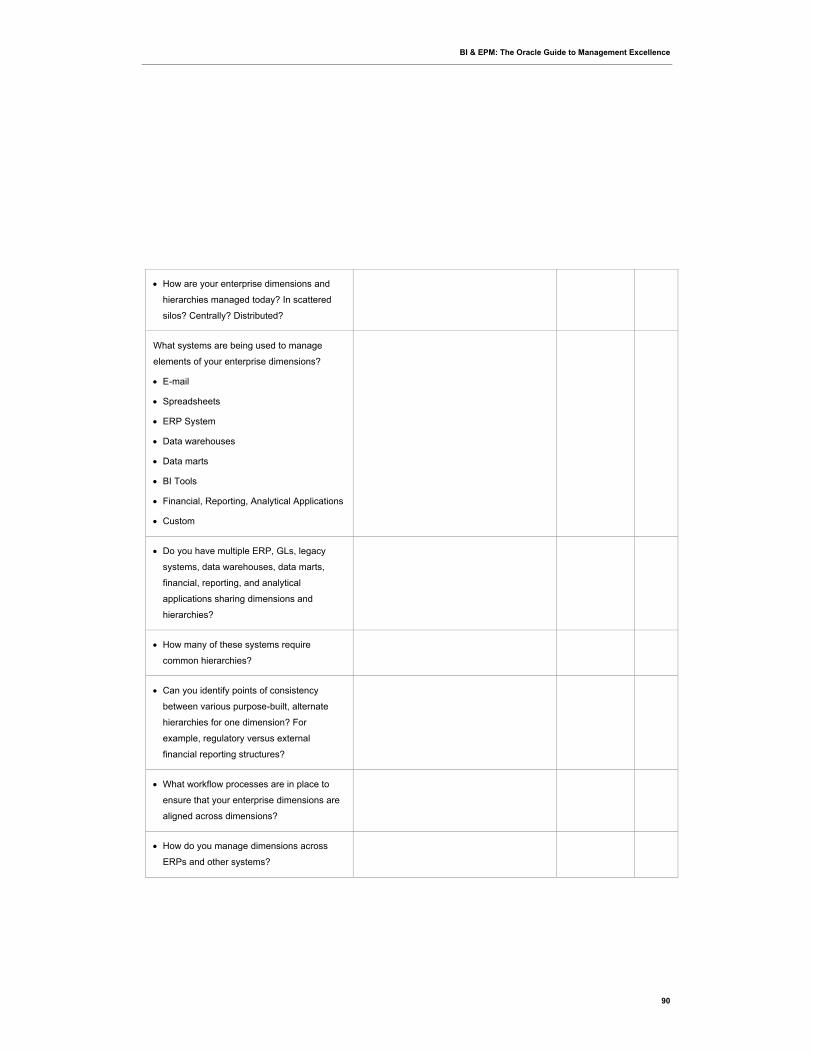
BI & EPM: The Oracle Guide to Management Excellence
90
How are your enterprise dimensions and
hierarchies managed today? In scattered
silos? Centrally? Distributed?
What systems are being used to manage
elements of your enterprise dimensions?
Spreadsheets
ERP System
Data warehouses
Data marts
BI Tools
Financial, Reporting, Analytical Applications
Custom
Do you have multiple ERP, GLs, legacy
systems, data warehouses, data marts,
financial, reporting, and analytical
applications sharing dimensions and
hierarchies?
How many of these systems require
common hierarchies?
Can you identify points of consistency
between various purpose-built, alternate
hierarchies for one dimension? For
example, regulatory versus external
financial reporting structures?
What workflow processes are in place to
ensure that your enterprise dimensions are
aligned across dimensions?
How do you manage dimensions across
ERPs and other systems?
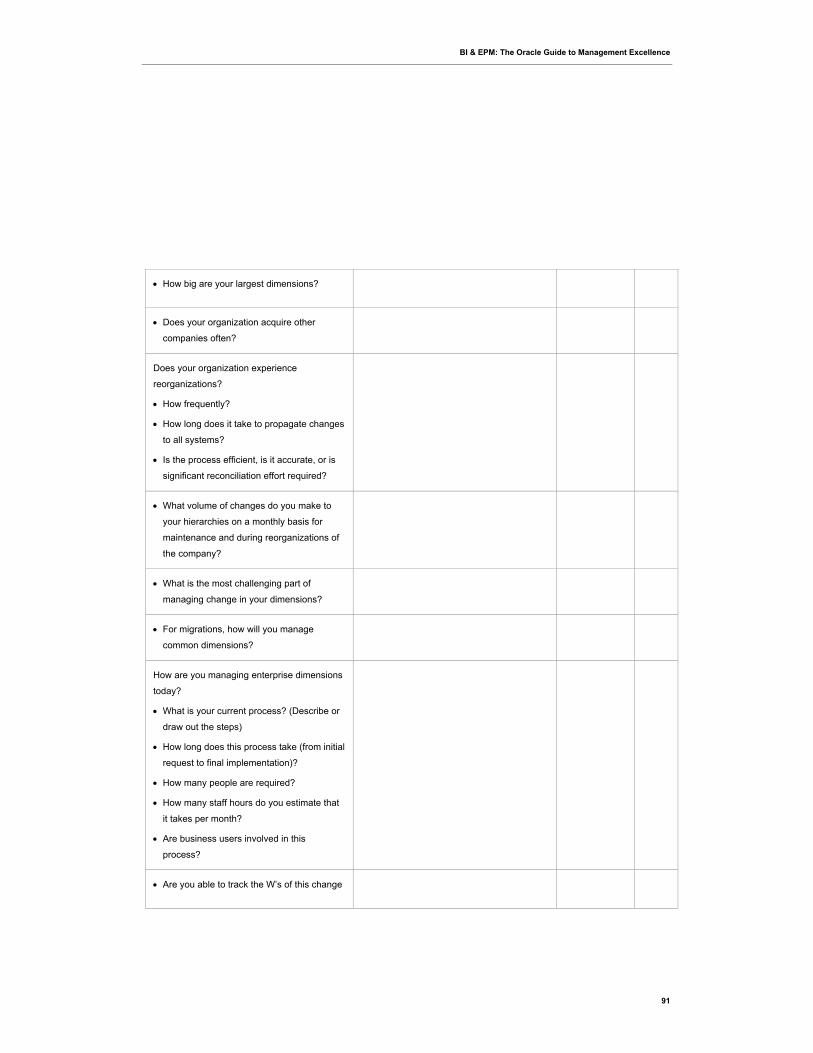
BI & EPM: The Oracle Guide to Management Excellence
91
How big are your largest dimensions?
Does your organization acquire other
companies often?
Does your organization experience
reorganizations?
How frequently?
How long does it take to propagate changes
to all systems?
Is the process efficient, is it accurate, or is
significant reconciliation effort required?
What volume of changes do you make to
your hierarchies on a monthly basis for
maintenance and during reorganizations of
the company?
What is the most challenging part of
managing change in your dimensions?
For migrations, how will you manage
common dimensions?
How are you managing enterprise dimensions
today?
What is your current process? (Describe or
draw out the steps)
How long does this process take (from initial
request to final implementation)?
How many people are required?
How many staff hours do you estimate that
it takes per month?
Are business users involved in this
process?
Are you able to track the W’s of this change
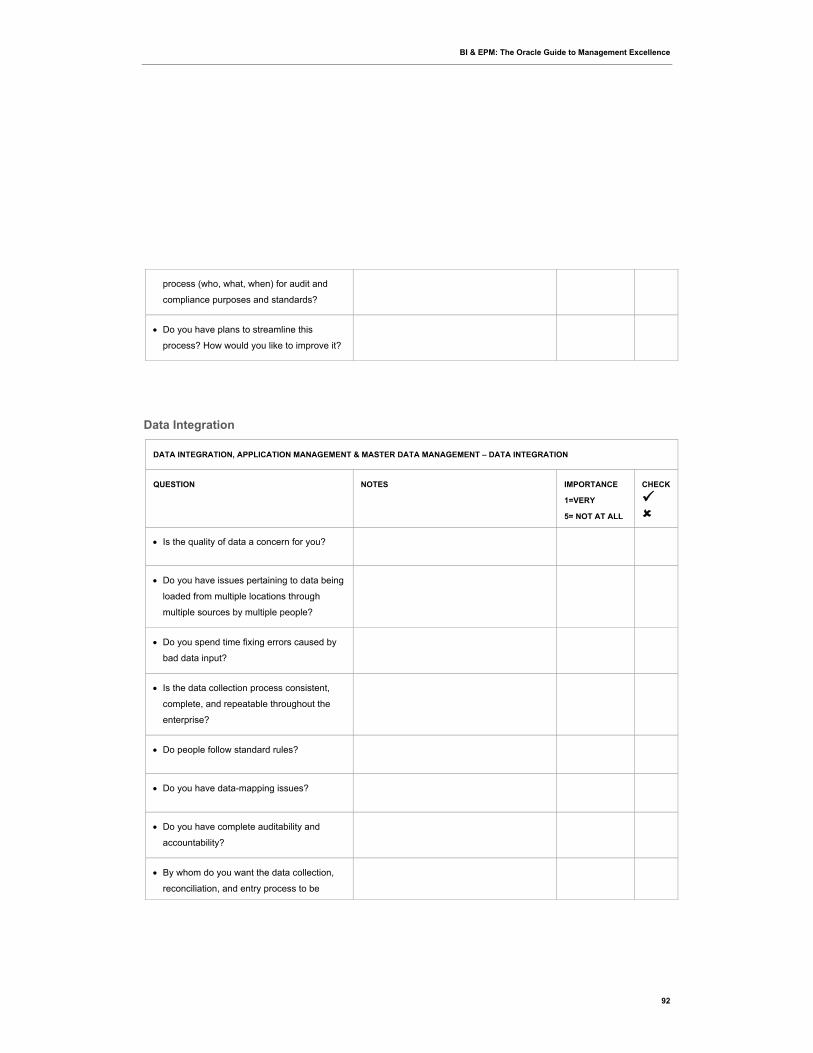
BI & EPM: The Oracle Guide to Management Excellence
92
process (who, what, when) for audit and
compliance purposes and standards?
Do you have plans to streamline this
process? How would you like to improve it?
Data Integration
DATA INTEGRATION, APPLICATION MANAGEMENT & MASTER DATA MANAGEMENT – DATA INTEGRATION
QUESTION NOTES IMPORTANCE
1=VERY
5= NOT AT ALL
CHECK
Is the quality of data a concern for you?
Do you have issues pertaining to data being
loaded from multiple locations through
multiple sources by multiple people?
Do you spend time fixing errors caused by
bad data input?
Is the data collection process consistent,
complete, and repeatable throughout the
enterprise?
Do people follow standard rules?
Do you have data-mapping issues?
Do you have complete auditability and
accountability?
By whom do you want the data collection,
reconciliation, and entry process to be
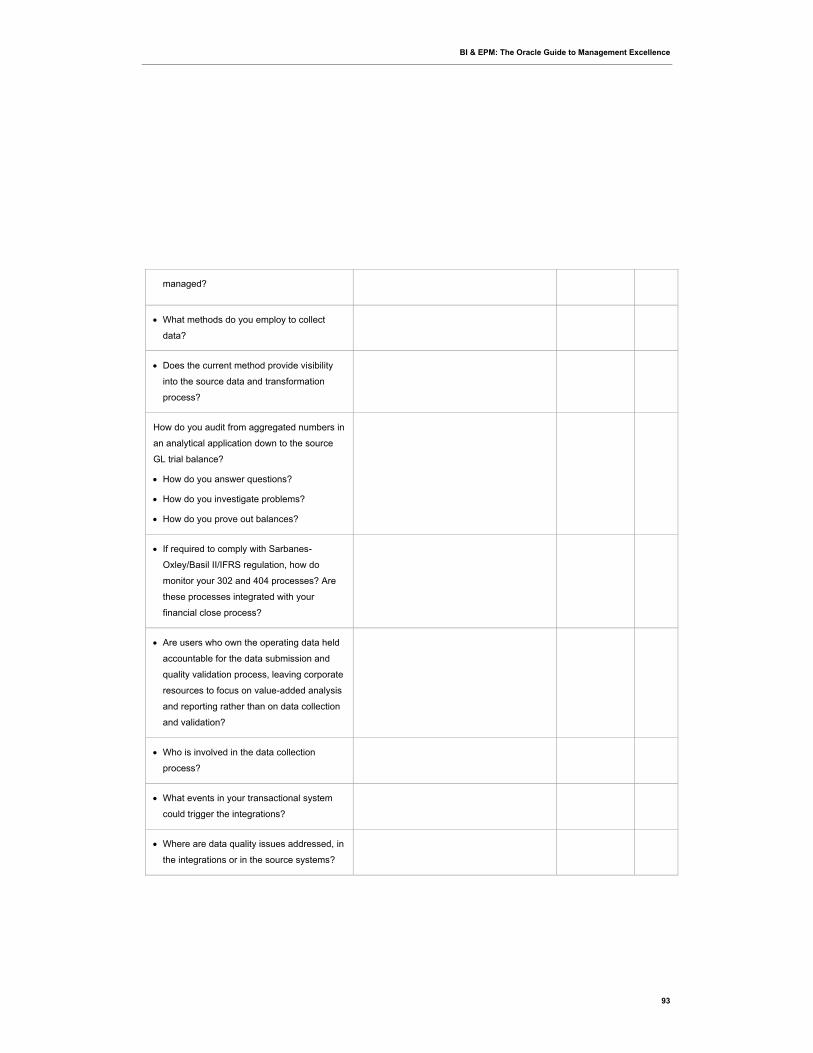
BI & EPM: The Oracle Guide to Management Excellence
93
managed?
What methods do you employ to collect
data?
Does the current method provide visibility
into the source data and transformation
process?
How do you audit from aggregated numbers in
an analytical application down to the source
GL trial balance?
How do you answer questions?
How do you investigate problems?
How do you prove out balances?
If required to comply with Sarbanes-
Oxley/Basil II/IFRS regulation, how do
monitor your 302 and 404 processes? Are
these processes integrated with your
financial close process?
Are users who own the operating data held
accountable for the data submission and
quality validation process, leaving corporate
resources to focus on value-added analysis
and reporting rather than on data collection
and validation?
Who is involved in the data collection
process?
What events in your transactional system
could trigger the integrations?
Where are data quality issues addressed, in
the integrations or in the source systems?
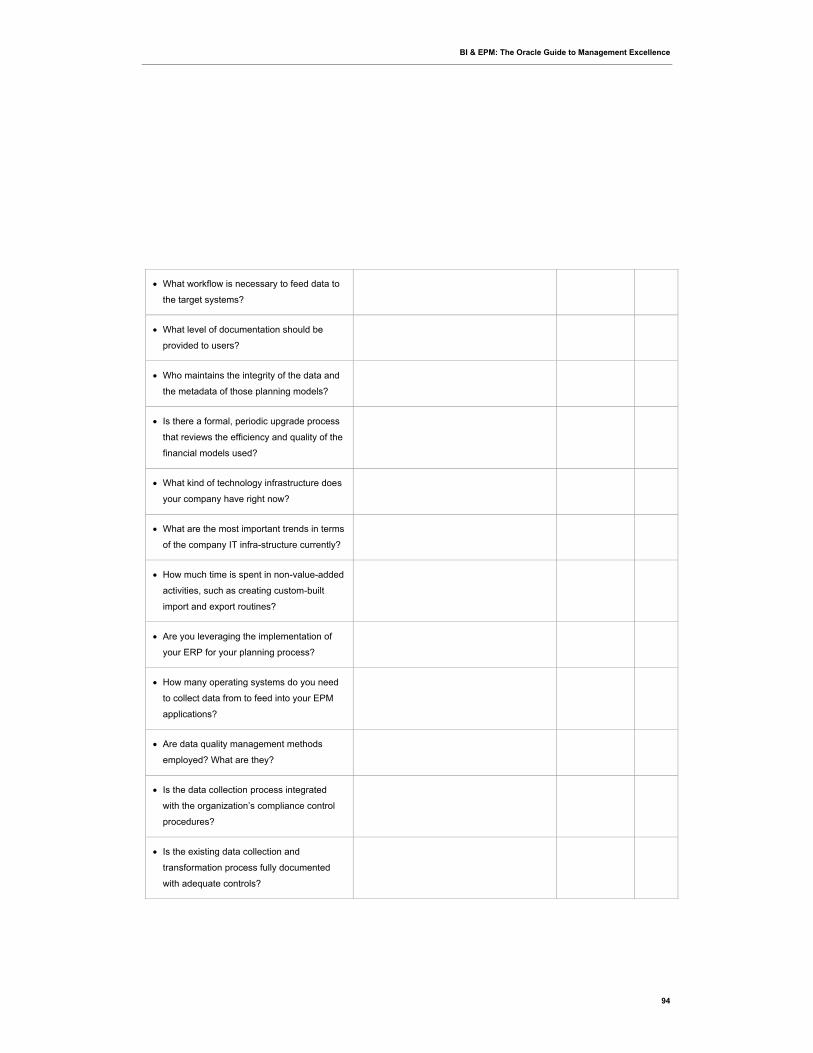
BI & EPM: The Oracle Guide to Management Excellence
94
What workflow is necessary to feed data to
the target systems?
What level of documentation should be
provided to users?
Who maintains the integrity of the data and
the metadata of those planning models?
Is there a formal, periodic upgrade process
that reviews the efficiency and quality of the
financial models used?
What kind of technology infrastructure does
your company have right now?
What are the most important trends in terms
of the company IT infra-structure currently?
How much time is spent in non-value-added
activities, such as creating custom-built
import and export routines?
Are you leveraging the implementation of
your ERP for your planning process?
How many operating systems do you need
to collect data from to feed into your EPM
applications?
Are data quality management methods
employed? What are they?
Is the data collection process integrated
with the organization’s compliance control
procedures?
Is the existing data collection and
transformation process fully documented
with adequate controls?

BI & EPM: The Oracle Guide to Management Excellence
95
This self-evaluation should demonstrate where you believe you are excelling, where you might improve, and where you need immediate assistance.
BI & EPM: The Oracle Guide to Management Excellence
96
Evaluating Current Systems and Future Needs
Each Management Excellence capability, although integrated in a best practices environment, can be evaluated individually. Consider using the following set of key questions to assist you in the evaluation of your current environment. Use these questions to determine what you may need to add to your Management Excellence environment in the future, and to help improve and fill important gaps in your Management Excellence system.
The capabilities can be separated and combined as needed for each organization. For the purposes of this guide, they are categorized as follows:
External Reporting
Strategic & Predictive Modeling
Integrated Business Planning
Profitability & Cost Management
Scorecarding, Monitoring & Analysis
Financial & Management Reporting
BI Tools & BI Applications, Real-Time Monitoring
OLAP, Data Warehouse, Data Mining
Data Integration, Application Management & Master Data Management
Let’s examine each fundamental capability and a set of key questions in more detail. Keep in mind that the set of questions presented is not exhaustive, and consideration for each organization and its specific needs should be taken.
7
BI & EPM: The Oracle Guide to Management Excellence
97
External Reporting
Financial Consolidation and Compliance
Financial Consolidation can be defined as the process of consuming data from different financial systems and entities combining that information through aggregation to create financial analytic views and comprehensive financial statements, which are compliant with accounting and financial reporting standards.
Currently, organizations accomplish this task through methods including everything from purpose-built Excel templates, mainframe consolidation systems, and ERP systems, to comprehensive consolidation and report packages.
The enforcement of Sarbanes-Oxley regulations and IFRS (International Financial Reporting Standards) are driving change rapidly in this area. The demand for transparency, auditability, and specific information processing are calling for more cautious choices around consolidation applications.
Consider the following questions when evaluating your system or when evaluating the purchase of one:
Organizations
Can organizations be created and maintained in the system in a hierarchical (tree) structure so it can be easily understood and facilitate easy selection by the users and result in automatic drill down capability?
Is the number of levels (layers) in the hierarchy limited?
Can each branch of a hierarchy have a different number of layers, or must they all be the same depth?
BI & EPM: The Oracle Guide to Management Excellence
98
Can an unlimited number of alternate hierarchies of your organization (Legal, Management, Geographic, Tax, What If, and so on) be maintained without loading data twice or copying data to and from different areas in the system?
Does all data consolidate to a single entity or just the top-level entities, or do you require comprehensive consolidated levels across the organization?
Can currencies be assigned to each entity for foreign exchange translation to happen automatically and follow standard accounting practices in the system without customization?
Can specific entities be graphically designated as valid for inter-company activity? Can accounts be graphically designated as valid for inter-company activity and automatically matched in the system without building or hard-coding system logic?
Can an ownership percentage for less than 100% owned subs be assigned to properly consolidate without having to change system logic or hard-code values or entities after every change?
Can organization structures that change by scenarios and by time periods be handled in the system?
Can the system handle the need to measure separate accounts by different measures (for example, Sales by Product and Headcount by Job Grade) and without having to redefine the intersections of separate dimensions with business rules or complex system maintenance?
Can the system automatically calculate appropriate consolidation methods, such as minority interest consolidations or associates consolidations?
Can the consolidation of entities create automatic adjustments based on the ownership parameters?
Accounts
Does the system have out-of-the-box account intelligence? Can accounts be designated as Income, Expense, Asset, Liability, Flow, Balance, and so on, and have the system recognize the account type throughout (for example, no subtotaling logic, dynamic financially intelligent variance reporting)?
Does the system enable graphical setup, and does it support/handle account intelligence and exchange rate types to properly translate different accounts at their appropriate rates (for
BI & EPM: The Oracle Guide to Management Excellence
99
example, Closing Rate for Balance Sheet account types and Average Rate for Income Statement account types)?
Can the chart of accounts be created and maintained in a hierarchical (tree) structure so it can be easily understood, facilitate easy selection by users, and result in automatic drill-down capability? Is system logic for subtotaling required for accounts?
Is the number of account hierarchy levels (layers) limited?
Can each branch of the account hierarchy have a different number of layers, or must they be the same depth?
Can alternate roll-ups of the account structure be created so that, for instance, Corporate Income Statement as well as a Divisional Income Statements could be handled uniquely within one system?
Can non-financial (statistical) as well as financial accounts be maintained? Can system rules be applied to non-financial accounts for assistance in reporting and calculations or forecasting drivers?
Can inter-company accounts be created graphically, including the system rules for defining matching accounts?
Can accounts that are calculated and accounts that should not consolidate be graphically maintained in the system?
Can accounts be set up in the system so that a user can add or load free-form line items, such as other expenses (for example, enabling each entity to add their unique line items that add up to the other expense total)?
Can accounts be created that are associated with calculations that operate differently based on YTD or periodic views?
Dimensionality
Can dimensions be created and maintained in a hierarchical (tree) structure so that it can be understood and facilitate easy selection by the users and result in automatic drill-down capability?
Is the number of levels (layers) in any dimension hierarchy limited?

BI & EPM: The Oracle Guide to Management Excellence
100
Can each branch of a hierarchy have a different number of layers, or must they be the same depth?
Can unlimited alternate hierarchies within a dimension be created?
Can specific dimensional detail be assigned to specific accounts, or when you add a dimension, is it automatically assigned to all accounts?
What must be done to limit the use of a dimension by an account? For example, Product and Customer dimensions that were added should be valid only for Sales and Cost of Sales accounts.
Can detail be assigned specifically to these accounts?
What are the system performance considerations for adding dimensions and limiting their use?
What are the user considerations when adding dimensions?
Are dimensions reusable so that multiple nodes of detail can be handled in a single dimension, but the appropriate node is assigned to the appropriate account?
Foreign Currency Translation
Can all the currencies that you will need for translation, including average, month end, historical, special, override rates, and so on, be defined within the system and dynamically utilized?
Can monthly currency rates be loaded automatically from another system?
Can exchange rates be maintained differently by scenarios and time periods?
Can default translations be easily overridden using either override currency rates or historic currency values?
Does the Currency Translation Adjustment calculate automatically during consolidation and will it flow to the proper account (Income Statement or Balance Sheet) for hyperinflationary versus non-hyperinflationary locations?
Can default parameters be defined graphically for currency translation, such as all Income Statement type accounts using the Average Rate and all Balance Sheet type accounts using the Closing Rate? Does a calculation have to be created in the system for each account to handle translation dynamically?
BI & EPM: The Oracle Guide to Management Excellence
101
Can both hyperinflationary and non-hyperinflationary entities be handled easily?
Can entities be easily changed from hyperinflationary to non-hyperinflationary and from non-hyperinflationary to hyperinflationary?
Can any entity be translated into any currency in the system on the fly without having to create additional calculations to properly handle foreign exchange?
Inter-Company Eliminations
Can inter-company accounts and matching accounts be graphically defined?
Can inter-company matching be defined as many to many, many to one, one to many, one to none, and so on in the inter-company matching group?
Is an inter-company matching report created for inter-company reconciliations?
Do calculations for inter-company eliminations have to be created in system logic, or does the system handle them automatically during the consolidation process based on the account and organization setup?
Are the inter-company eliminations in alternate organization hierarchies calculated automatically?
If organizational hierarchies are changed and reconsolidated, will the inter-company eliminations be properly restated automatically? Can all history and other scenarios be restated automatically as well?
Are the eliminated values stored so that you can view and report on them?
Is there full audit trail visibility into the elimination detail so that users can see exactly where the eliminated values came from?
Adjustments
Is there a Journal Entry capability for users to create audited adjustments?
Can adjustments be made between balance sheet and income statement accounts?
Can statistical adjustments be made in voucher format?
Can it be required that adjustments be reviewed before being posted?
BI & EPM: The Oracle Guide to Management Excellence
102
Can journal templates be created to be used for creating journals?
Can auto-reversing journals be created?
Can recurring journals be created so that identical journals are automatically created each month?
Is there a journal reporting capability?
Can journals be exported to a general ledger or other source system?
Time
Does the system have out-of-the-box time intelligence?
Does the system have multiple frequencies: Periodic, QTD, HTD, YTD? How are these frequencies achieved? Any setup or coding required?
Can the system handle the loading of data in one frequency and automatically derive the others, or must a calculation be created?
Are time periods in the system automatically linked? Can you take advantage of dynamic functions to get prior, future or relative period values without writing complex rules or hard-coding values; for example, Current Period Opening Balance = Prior Period Closing Balance (and across years dynamically)?
Are years automatically linked? Can you take advantage of dynamic functions to get prior year values, such as in cash-flow calculations without writing complex rules or hard-coding values; for example, Cash Change in AR = Prior Year Closing Balance - Current Period Balance?
Scenarios
Does the system enable users to create an unlimited number of scenarios, such as Actual, BudgetV1, BudgetV2…., JanFcst, FebFcst….?
Can data easily be copied between scenarios within the system?
Can modeling or what-if scenarios be created in the system that use different business rules and rates, such as Actual at Budget, Budget at Actual, Actual at Forecast, Actual at Standard, and so on, so that operational and foreign exchange variance analyses can be performed easily?

BI & EPM: The Oracle Guide to Management Excellence
103
Can modeling scenarios be created in the system that use driver-based calculations to project future values and have them separate from as-reported numbers?
Microsoft Office
Can data be exported to Excel?
Is data exported to Excel dynamically with the underlying database?
Can data be pulled to Excel through the use of a formula?
Can Excel Pivot tables that are a live link to the underlying data be created?
Can the current calculation state of the data be viewed in Excel?
Can the current Review state of the data be viewed in Excel?
Can server-side calculations, such as consolidation, be launched/executed in Excel?
Can textual commentary be entered for numbers in Excel and submitted to the database?
Can formatted reports be imported into Excel without losing formatting?
Can imported reports be dynamic with the underlying data?
Can data, charts, and other data representations be imported into PowerPoint?
Can data representations imported into PowerPoint be refreshed with current data?
Can a reporting pack created in PowerPoint one month be automatically updated the following month by changing only the period parameter?
Can formatted data-entry templates be imported into Excel and used offline?
Can supplementary Excel schedules be imported into the system and attached as supporting documentation to numbers?
Can Microsoft Word commentary be attached to data?
Can the attached Word commentary be viewed in the reporting mechanism?
Can access to applications and application data be associated with Microsoft Office Smart Tags?
Which technology is used for the Excel Add In? ActiveX? Other?
BI & EPM: The Oracle Guide to Management Excellence
104
What is required to install user functionality at the Excel client?
When in Excel are calculations performed locally on the desktop or on the server?
How large is the installation routine on the client machine?
Technology
How does the system scale?
At what level of the system architecture is hardware added to achieve the scalability?
Where are the potential bottlenecks for multi-user activity?
What third-party benchmarks are available on the scalability of your system?
Which components of the system are most heavily tasked by heavy user activity?
The desktop?
The Web server?
The database?
The application server?
At what level of customer usage does each of the components hit a bottleneck?
How is this bottleneck overcome?
Other
Is all data loaded, consolidated, and viewed/reported from the same database?
Is graphical analytics enabled on live data, or must the data be exported to another mechanism?
Where are calculations (returns, ratios, cash flow, allocations, etc.) being calculated? In the database? In the report?
Can data be directly integrated from multiple-source systems into the application easily without having to create extract files and then load them?
Can remote sites enter their own data file and consolidate their branch of the organization, or does this require some batch processing? Can this be done through the Web?
BI & EPM: The Oracle Guide to Management Excellence
105
Does the system have process management capability so that, as data is loaded, it must pass validation checks (out of balance, roll forwards, and so on) before it is flagged as submitted? This includes requirements for further signoffs and approval, with a complete audit trail before it is considered published. Can this functionality be integrated with security to ensure that information-consumers see only published numbers and that numbers signed off on are not then changed by the user?
Does the system have alerting capability to notify users of key criteria triggers, such as an out-of-balance condition or variances to budget/thresholds?
Can the solution support global compliance initiatives, such as Sarbanes-Oxley, IAS, IFRS 2005?
Can users easily see the status of data in the system, such as no data, changed, needs consolidation?
Is the system easily linked to other applications in your EPM environment?
Reporting
What reporting options are available (Production Report Writer, Graphical Analyzer, Excel, and so on)? Are they desktop or Web-based without “publishing” content?
Can ad-hoc type analysis be done graphically on the Web (for example, slice and dice dimensions, drill down, define calculations, and so on)?
Can formatted production reporting be handled within the system (month-end statements)? Can these production reports be scheduled to be sent in PDF to information consumers by e-mail or printed to the printer overnight out-of-the-box?
Are reports dynamic so that a single report format can be created and all users can run it for their business unit dynamically?
Can charts and organization logos be added to reports?
How are reports created (for example, is it coding or is it drag and drop)?
Can users create reports that include embedded functions to automatically add hierarchy members to reports as the system structures change (for example, when an account is added in the system, do users need to change every report)?
BI & EPM: The Oracle Guide to Management Excellence
106
Do built-in functions exist to handle Better/Worse Variance without writing cell-level logic to create proper account variance; for example, Sales greater than budget is a positive variance, but Cost of Sales greater than budget is a negative variance?
Can conditional formatting be done on reports (for example, if a number is above a threshold, show it in red and bold on the report)?
Can report sections be linked? For example, a common row or column layout that is to be used in multiple reports must be created and maintained only in one place. Every time the template is updated, all reports linked to it are automatically updated.
Can report sections and data be linked so that one piece of a report can be linked to other reports and pass criteria, such as the current reporting entity of account for analysis (for example, linking and drill-down)? Is this process graphical?
Can a dynamic consolidating report be created so that a user can see all detail of the consolidation based on the business unit being reported?
Can books of reports be created (Blue Book, Controller’s Book, etc.)?
Are books of reports dynamic, so that if a new business unit is added, the book will automatically produce statements for the new unit without any maintenance?
Can users view reports through a browser without any vendor software installed on their workstation?
Does the report writer support XBRL (Extensible Enterprise Reporting Language) to easily create an XBRL extract for filing with external stakeholders (SEC, EDGAR, etc.)?
How is graphical analysis performed on the Web (for example, Dashboard, calculations, creating custom views graphically, and so on)? How are these views created by users?
Strategic & Predictive Modeling
Corporate Development
Can you build separate models for acquisitions or internal development projects?
Can you run scenarios with these models, such as layering on synergies or determining the valuation impact of changing the cost of capital or multiple used?
BI & EPM: The Oracle Guide to Management Excellence
107
Can these models be easily consolidated into the strategic plan, even if account and reporting structures are different? Can the consolidation automatically reflect purchase accounting rules?
Is there an option to include or exclude these models into separate scenarios within the strategic plan?
Can you quickly change the deal date and automatically capture the proper reporting effects on cash flows and valuation?
Foreign Currency Translation
Can all the currencies that you will need for translation, including average, month-end, historical, special, override rates, and so on, be defined within the system and dynamically utilized?
Can monthly currency rates be automatically loaded from another system?
Can exchange rates be maintained differently by scenarios and time periods?
Can default translations easily be overridden using either override currency rates or historic currency values?
How does your software support currency translation in a hyper-inflationary economy?
Can any entity be translated into any currency in the system on the fly without having to create additional calculations to properly handle foreign exchange, and so on?
Integrated Business Planning
Planning & Budgeting
The budget of an organization is compiled annually. A finished budget usually requires considerable effort and can be seen as a financial plan for the new financial year. While traditionally the Finance department compiles the organization's budget, modern software enables hundreds or even thousands of people in the various departments (operations, human resources, IT, and so on) to contribute their expected revenues and expenses to the final budget.
BI & EPM: The Oracle Guide to Management Excellence
108
When actual results are communicated to the outside community, they should be in close alignment with the guidance and projections that were provided from using the annual budgeting and monthly forecasting processes. When projections are not met, the outside community may perceive this as a negative indicator that you do not have “control” of your business, and your stock share price could suffer.
The strategic plan of an organization is updated and finalized before the annual budget cycle to establish the strategic direction and generate high-level targets. These targets are the basis of the annual budget process and can be allocated down to lower levels of the organization. The strategic plan is continually adjusted throughout the year to analyze changing economic conditions, new investment, acquisitions, and any other strategic decisions as they arise. A flexible modeling tool for strategic planning provides an organization with the ability to quickly adapt to a changing environment and make sound decisions based on the most up-to-date information.
Consider the following questions when evaluating your financial budgeting and planning system, or when evaluating the purchase of one:
Product Architecture
Describe the architecture of your financial budgeting and strategic planning solution, including the technologies used and the industry standards employed and supported.
What are the system requirements (hardware and additional software needed) for the solution?
Does the solution enable access to large numbers of multiple concurrent users?
Is the solution a centralized one that is accessible for input and for review by various users?
Is your solution Web-architected? Does it have a thin-client interface?
Does your financial budgeting and strategic planning solution integrate with other EPM modules?
Does your solution offer direct links to ERP solutions?
Describe your types of protection for applications; for example, firewalls and protocols.
BI & EPM: The Oracle Guide to Management Excellence
109
Administration
Is your tool accessible to worldwide locations?
Can remote sites perform data entry, reporting, and analysis over the Web?
What other Web capabilities does the solution offer; for example, process management?
Does your solution enable data-entry form creation and data entry and review?
Can you provide an out-of-the-box financial budgeting and strategic planning solution?
Is your financial budgeting solution easy to maintain?
Can applications be updated easily when organizational changes occur?
Can you lock out users for system maintenance?
Can the administrator see users connected to the application?
Can the administrator disconnect users from the application?
Can the administrator send messages to users connected to the application?
Describe the application’s ability to handle data reconciliation and validation.
How is security handled? What are the different types of access rights?
Can different user profiles be set up? Is security user- or group-based?
Can messages be broadcast to users?
Can security be imported and exported between applications?
Are backup and recovery provided?
Describe the audit features available for data and application changes.
Can historical data be retained? Is archived data readily accessible to users?
Web Functionality
Is your product Web-based? Does it offer server-based application functionality (thin client)?
Can you customize the home page?
Can you customize the look and feel of the interface?

BI & EPM: The Oracle Guide to Management Excellence
110
Integration and Linking to other Tools
Does your solution integrate with external source systems and leading ERP/CRM systems; that is, Oracle, ADP’s HR/Payroll or other Oracle products?
Does your solution integrate with Microsoft Office products?
Can data be directly and easily integrated from the multiple source systems into the application? Are mapping tools provided?
Can errors be tracked during data loads?
Do e-mail capabilities exist?
Do alerting capabilities exist?
Forecasting and Strategic Planning
Can forecasts be built and viewed across multiple dimensions; for example, legal entity, customer, product, geography, management unit?
Does your tool include robust out-of-the-box forecast calculation capabilities and enable unique customization of the out-of-the-box calculation capabilities by each of the business units or departments?
What types of features are available for quickly building a forecast and conducting “what-if” analyses?
Are user-defined allocations and calculations supported?
Can you create multi-step allocations and order steps so that later steps can be based on the results of earlier steps?
Can complex calculation formulas be applied?
Are statistical data and global assumptions supported? Can key performance indicators be calculated?
Does your system enable actuals to feed into system and enable re-forecasts throughout the fiscal year?
BI & EPM: The Oracle Guide to Management Excellence
111
Does your solution have commentary (text) input, including the following: at individual entry fields, at a summary level for individual sections of a submission, at a summary level for the entire process submission?
Can new and existing users easily request, retrieve, and access data from your solution?
Does your solution provide real-time analysis, review, approval, and consolidation of forecasts without closing users out of the system?
Does your solution have a unique approval process established for each business unit or department, based on the requirements of each unit?
Are both top-down and bottom-up planning processes supported by your solution?
Can your system conduct real-time “what-if” analysis on data, including either global or local changes to assumptions, such as rate increases, sales trends, and/or operating costs?
Can you goal-seek to key metrics throughout your forecast horizon by having the model automatically change key variables to hit those metrics?
Can departments create their own versions of the budget without affecting the central budget?
How many scenarios or versions of a forecast can be stored and reported within a corporate version cycle?
Are all versions of the model available for reviewing at any time during the cycle?
Can your solution support monthly and quarterly forecasting?
Can your solution create long-term forecasts? For how many years can you create forecasts?
Can your solution provide real-time results?
Can users create a base forecast by copying prior forecasts or budgets? Can multiple forecasts/plans be easily reconciled?
Can your system support activity-based forecasting?
Can the solution accommodate the planning needs of different departments, such as operational and financial areas?
How does your solution support collaborative planning?
BI & EPM: The Oracle Guide to Management Excellence
112
Does your solution provide the capability to manage workflow and reduce the planning cycle time?
Can remote users access the system?
Organizations
Can organizations be created and maintained in a hierarchical (tree) structure to facilitate easy selection by users, resulting in automatic drill-down capability?
Can each branch of a hierarchy in your system have a different number of layers, or must they all be the same depth?
Can an unlimited number of alternate hierarchies of your organization (Legal, Management, Geographic, Tax, What If, and so on) be maintained in the system without loading data twice or copying data to and from different areas in the system?
Can you input data in local currency for each entity?
Can the system consolidate at different levels and across different dimensions of the organization?
Accounts
Does your system have out-of-the-box account intelligence?
Can accounts be designated as income, expense, asset, liability, flow, balance, and so on and have the system pick up on the account type throughout; for example, no subtotaling logic, intelligent variance reporting (that is, no requirement to flip signs for variances between revenue and expenses) and how to handle calculations based on the account types.?
Do these accounts automatically flow to the proper spots on an integrated set of financials so that the income statement, balance sheet, and cash-flow statements always tie out to one another?
Can users add line-item detail on the fly to accounts?
Can alternate roll-ups of the account structure be created so that corporate income statement as well as a divisional income statements, for example, could be handled uniquely within one system?
BI & EPM: The Oracle Guide to Management Excellence
113
Can non-financial (statistical) and financial accounts be maintained?
Can system rules be applied to non-financial accounts for assistance in reporting and calculations or forecasting drivers?
Treasury Analysis
Can you choose how to allocate cash surpluses on the balance sheet? For instance, set up an order for paying back debt instruments early or execute a share buy-back?
Can you quickly structure new debt and related components (for example, current portion, accrued interest, amortization of premiums and debt costs), or restructure existing debt?
Can you choose how to fund additional cash deficits on the balance sheet? For instance, use existing cash or set up revolving lines of credit?
Are there built-in interest rate options that allow you to spread variable rates over published rates, such as LIBOR or Prime and adjust the spread based on forecast credit ratings and covenants?
Dimensionality
Can data be maintained across multiple dimensions?
Can additional organization-specific dimensions be easily created and maintained?
Can you assign attributes to each dimension for further classification?
Can each dimension have a unique identifier?
Can alternate names be assigned to a member?
What types of features are available to ensure that dimensional data can maximize performance and disk space?
Foreign Currency Translation
Can all the currencies that you will need for translation, including average, month-end, historical, special, override rates, and so on, be defined within the system and dynamically utilized?
Can monthly currency rates be automatically loaded from another system?
BI & EPM: The Oracle Guide to Management Excellence
114
Can exchange rates be maintained differently by scenarios and time periods?
Can default translations easily be overridden using either override currency rates or historic currency values?
How does your software support currency translation in a hyper-inflationary economy?
Can any entity be translated into any currency in the system on the fly without having to create additional calculations to properly handle foreign exchange, and so on?
Scenarios and Versions
Does the system enable users to create an unlimited number of scenarios, such as Actual, BudgetV1, BudgetV2…., JanFcst, FebFcst…,1st Draft, 2nd Draft…., and so on?
Can each scenario follow its own time span and review cycle?
Can data easily be copied between scenarios within the system?
Can modeling or what-if versions be created in the system that use different business rules and rates, such as Best Case versus Worst Case, 2nd Draft versus 1st Draft, Plan versus Forecast, Actual versus Plan, and so on, so that you can easily perform operational and foreign exchange variance analysis?
What does setting up various scenarios and versions entail, and what maintenance must be performed to handle these calculations?
Does the system have out-of-the-box time intelligence; for example, quarter-to-date and year-to-date performance—or a rolling time sequence, such as current month plus three months in the future)?
Does the system have multiple frequencies—Periodic, QTD, HTD, YTD?
Reporting and Analysis
What reporting options are available (Production Report Writer, Graphical Analyzer, Excel, and so on)?
Is there a drill-down capability to support investigation?
Can you drill down to source data?
BI & EPM: The Oracle Guide to Management Excellence
115
Can ad hoc analysis be done graphically on the Web; for example, slice and dice dimensions, define calculations, layouts, formatting, fonts, and color; suppression options, dynamic member selection, asymmetric layouts, and auto calculations? Are templates available to create reports?
Does your solution provide report elements, such as data, text, charts, graphs and images, and drag-and-drop placement of data objects?
How are reports stored in the proposed solution?
Can formatted production reporting be handled within the system (month- end statements)?
Can you schedule these production reports to be sent in PDF to information consumers by e-mail or printed to the printer overnight out of the box?
Are reports dynamic, so a report format can be created and all users can run it for their business unit dynamically?
Can charts and organization logos be added to reports?
Can you create reports in multiple currencies?
How are reports created (for example, is it coding or drag-and-drop)?
Can you create reports that include embedded functions to automatically add hierarchy members to reports as the system structures change (for example, when an account is added in the system, do you need to change every report)?
Can report calculations be defined?
Do built-in functions exist?
Is there an ability to input variance explanations in reports?
Can conditional formatting be done on reports; for example, if a number is above a threshold, show it in bold red on the report?
Can report sections and data be linked so one piece of a report can be linked to other reports and pass criteria, such as the current reporting entity of account for analysis (for example, linking and drill-down)? Is this process graphical?
BI & EPM: The Oracle Guide to Management Excellence
116
Can a dynamic consolidating report be created so that you can see details of the consolidation based on the business unit?
Can books of reports be created (Blue Book, Controller’s Book, and so on)?
Can users view reports through a browser?
Does the report writer support XBRL (Extensible Enterprise Reporting Language)?
How is graphical analysis performed on the Web (for example, Dashboard, calculations, creating custom views graphically, and so on)? How are these views created by users?
Does your tool have e-mail alerts?
What types of output options exist for reports?
Can you create reports from multiple data sources?
Can the proposed reporting tool place URLs within the system to enable the users to easily obtain information from the referenced Internet site?
Profitability and Cost Management
Does the system enable a business user to create calculation algorithms?
Can you have different allocation methods for different parts of the organization?
Does the system enable you to develop costs down to the SKU or individual customer level?
Does the system provide validation reports to ensure all costs have been allocated?
Does the system support all costing methods and the ability to use more than one in an application? (e.g., Activity-Based, time estimation, standard or planned rates, with actual consumption volumes etc).
Is the application spreadsheet based?
Is the database open or proprietary?
Does the system enable you to play scenarios based on expected conditions?
BI & EPM: The Oracle Guide to Management Excellence
117
Does the system enable you to change allocation methods easily?
Can you feed profitability metrics back into your planning and budgeting system?
Can the system pull data from multiple data sources?
Can you easily create reports?
Can you easily spot exception, discover trends, perform comparative analysis and make faster, better informed decisions using this system?
Do you think you will be able to make better and more informed decisions faster using this new system?
Can the average person use this system to create better cost and profitability information?
Scorecarding, Monitoring and Analysis
Scorecards “are a strategic management tool that helps measure, monitor and communicate your strategic plan and goals throughout the organization, in a way that is understood by everyone”—July 3, 2003, The Financial Gazette.
Many companies currently use homegrown solutions (using Microsoft Excel, PowerPoint, or Access), or off-the-shelf software to get started. In many cases, as the organization begins to roll out this management tool, many homegrown initiatives and smaller software packages are quickly outgrown because of the expanding need for features, for links between measures and scorecards, the sheer number of scorecards and key performance measures (KPIs) being tracked, and the number of users wanting to access the reports.
Consider the following questions when evaluating your system or when evaluating the purchase of one:
BI & EPM: The Oracle Guide to Management Excellence
118
High-Level Capabilities
Do you provide a Balanced Scorecard Collaborative (Palladium) certified scorecard solution?
What types of scorecard frameworks do you support? Can they be customized?
Is your scorecard solution intuitive for users?
Can users customize their home pages and reports that they view?
How much IT assistance is required to set up the application? To maintain it?
Does your solution support sourcing data from multiple sources (relational databases, ERP systems, OLAP, Excel, and so on)?
Does your solution require the use of a data warehouse or data mart?
What are the system requirements (hardware and additional software needed) for the solution?
Does the solution enable access to large numbers of multiple concurrent users?
Strategy and Accountability
How does your scorecard solution promote accountability?
How is the system used to communicate an organization’s strategy?
Does your solution offer strategy maps? Are the measure results on strategy maps interactive or static?
Are organization scorecards supported for different hierarchies (products, organization, geographies, business units, and so on)? Are personal scorecards supported?
Does your solution support ownership of measures and strategy elements as well as for scorecards?
Measures and Scoring
How are data/results presented?
Can measures be maintained and analyzed from different views or dimensions?
BI & EPM: The Oracle Guide to Management Excellence
119
Can each measure have a different data collection period (some daily, some weekly, some monthly, and so on)?
Can your scorecard solution track initiatives?
Can initiatives have sub-initiatives? How many levels?
Can measures be tracked against multiple targets?
Does the solution enable scoring over 100%?
Can you apply weights to measures and scorecards?
Does your solution support Web-based, manual data entry as well as electronic data loading?
Does your solution provide measure templates for easy development and maintenance?
Does your solution provide scorecard templates?
Does your solution show status symbols? Can you choose whether to show status based on score, results, or period-to-date results?
What status indicators are provided? Can you customize the indicators?
Does your solution use ranges to calculate status, or is it based on subjective assessment?
If you can use ranges, does your solution allow multiple ranges for different time periods?
Does your solution have one or more people associated to each measure as target collector, owner, or result collector?
Does your solution enable the use of complex formulas for results and targets? Can you have multiple targets?
In your solution, can each measure have its own frequency of collection, or must they all share the same frequency?
Reporting and Analysis
Does your scorecard solution support drill-down?
Describe the available reporting features

BI & EPM: The Oracle Guide to Management Excellence
120
Can your scorecard solution integrate with existing systems or an overall Enterprise Performance Management solution?
Is your scorecard solution accessible from the Web?
What types of features are available for additional analysis?
Can users customize their reports?
Can users create custom or partial scorecards?
Can users filter their measures or reports?
Can users export results to any Microsoft Office products?
Collaboration and Communication
What types of communication features are available to enforce collaboration? Are alerts supported? E-mail?
Does your solution support notes and attachments for different objects in the application (for measures, for strategy, for scorecards, and so on)?
Does your solution provide the abilities to track initiatives and write period- related annotations?
Security and Other
Are different user roles supported?
Does your solution support the concept of domains (grouping objects or measures for security and ease of viewing)?
What are some user settings and preferences?
What type of security is there within the system? Does the solution integrate with external authentication providers?
What administrative reports are provided (audit trails and so on)?
Does your solution sit on a common relational or multidimensional database, or is it proprietary?
BI & EPM: The Oracle Guide to Management Excellence
121
Financial and Management Reporting
Reporting and Analysis is a key portion of a Business Intelligence system. The spectrum is wide, from transactional and operational reporting to ad hoc analysis against multiple data sources. Organizations are currently using many separate reporting tools. Today, however, most are still horribly underutilized:
Consider the following questions when evaluating your system, or when evaluating the purchase of one.
High Level
Does your system provide access through desktop and remote facilities? Are predefined dashboards part of your standard solution?
What capacity does your system have to integrate with Portals? Custom integration versus out-of-the-box support via Portlets?
Does your solution provide an intuitive interface that will enable report development to occur at the functional user level? Does this include a range of templates, as well as the ability to create reports from scratch?
Can users integrate multiple data sources into one report? Can they integrate them into one dashboard?
Can users integrate multiple data sources on the same page or dashboard, with multiple data sources combined into the same grid or graph? What facilitates this integration?
What kinds of formula functions do you provide that users can use in either the query or report?
Does your solution use standard drag-and-drop and right-click features throughout for ease of use?
“BI tool usage rates have increased slightly since 2005, from 18% to 24%. This is progress, but there is still work to do.”
TDWI best practices Report: Pervasive Business Intelligence: Techniques and Technologies to Deploy
BI on an Enterprise Scale, Third quarter 2008.
BI & EPM: The Oracle Guide to Management Excellence
122
Functionality
Does your solution provide high-quality formatting options (fonts, page layouts, conditional formatting and so on) similar to Microsoft Office products?
Does your solution provide high-performance charting features and functions?
Does your solution provide the ability to create dashboards and scorecards using features, such as automatic traffic lighting and maps?
What ad hoc capabilities are available? Can you pivot, drill down on data, and summarize data easily?
Does your solution provide the ability to drill down from summary to detail and drill up from detail to summary? How do you drill down, and are there restrictions on the number of levels?
Does your solution provide sorting? For example, can you select the top or bottom 10 or 20 items and sort them? Can you query by level, generation, or parent/child references, member name, or aliases? Can you query using commands, such as bring back all children, descendants, siblings, and subsets?
Does your solution provide the ability to drill through from the analytic measures to the underlying transactional detail?
Are on-demand performance-monitoring facilities provided? Can authorized users gain on demand access to performance data—review previous, current, and future information? How is this monitoring achieved?
What facilities are provided for the exporting and distribution of reports? Can reports be distributed through a range of facilities, including HTML reports, DHTML reports, Java applet, and through a Windows client?
Other
Describe the product/platform/solution’s ability to push reports to users based on exception criteria or thresholds.
Can values be supplied at runtime through parameterized reporting?
BI & EPM: The Oracle Guide to Management Excellence
123
Can the system perform “batch bursting” of reports? (Enabling secure delivery of hundreds or thousands of individual reports using one template and running it for only the portion allowed to a particular user, instead of having to build multiple reports and multiple books.)
Does the proposed solution support real-time monitoring? Does it specifically help identify system and environmental bottlenecks, identify challenges resulting from access control configuration, and track user behavior and the use of content throughout the system?
Does your system provide a way to automatically identify and update reports that may be affected by a change in a supporting data model, table, or view?
Describe any governing capabilities provided by the solution.
Scheduling
Is there a graphical scheduler to define schedules and job dependencies? Can users schedule by time, event, interval, or condition (for example, Boolean rules)?
Can the solution integrate with third-party schedulers? Which ones?
BI Tools & BI Applications, Read-Time Monitoring
Business Intelligence
Business intelligence (BI) is a broad category of application programs and technologies for gathering, storing, analyzing, and providing access to data to help enterprise users make better business decisions. BI applications include the activities of decision support, query and reporting, and data mining. Many companies are managing these different capabilities on an individual basis. Although this strategy can generate small but very successful implementations that meet user needs, it drives the overall cost of maintaining BI systems quite high across an organization. Many companies are looking to consolidate this functionality to positively affect the total cost of ownership.
BI itself is evolving. Historically, BI focused on reporting and information delivery. We still need query and reporting capabilities; however, the focus has shifted to solving business problems. BI is being used to underpin both strategic and operational decision-making processes across the enterprise.
BI & EPM: The Oracle Guide to Management Excellence
124
Technology is merely an enabler. The goal of BI has evolved to support the business user with actionable insight. This means that we must change the focus to move users toward performance management and get more eyes on key metrics.
BI extends the information management and production abilities of an organization to new and more sophisticated levels. The strong analytical capabilities that BI brings to the table can provide the competitive advantage necessary for organizations to be successful.
Consider the following questions when evaluating your own system, or when evaluating the purchase of a system:
Product Architecture
Describe the architecture of your solution. Does it use an SOA (Service Oriented Architecture)?
What are the system requirements (hardware and additional software needed) for the solution?
What industry standards are supported? For example, major OS environments, such as Windows 2000/Windows XP; Sun, HP, and AIX UNIX; Linux and information delivery standards, such as J2EE, Web Services (XML/SOAP), HTML?
If custom development is required, is it web client server-centric?
What APIs (Application Programming Interfaces) or SDKs (Software Development Kits) are available?
Can the solution run behind a firewall?
“Virtually all organizations we identified as aggressive analytics competitors are clear leaders in their fields, and they attribute
their success to the masterful exploitation of data.”—Thomas H. Davenport, Harvard Business Review, January ‘06

BI & EPM: The Oracle Guide to Management Excellence
125
What Web protocols are supported? (Can information be safely accessed from outside the firewall using Web protocols, such as HTTPS/SSL and DMZ)?
Does the solution enable multiple concurrent users to access data from one or more sources and run reports?
Will the solution scale up for additional users as required? How is this done? Through scalable core services?
Does your solution integrate with EPM modules, such as financial planning, consolidation, scorecards, and financial and operational modeling as well as with the ERP and other key data sources in your organizations?
Does your solution enable you to “start anywhere” and then grow to more robust reporting or even into specific EPM applications without having to introduce new training, new interfaces, new content creation GUI, and separate integration tools?
Does your system have fault tolerances, such as server clustering, load balancing, failover support, and server connection pooling to help create a reliable infrastructure and to maximize performance under all system conditions?
Are all products within your solution integrated, and do they use a unified metadata repository or semantic layer for all types of BI functionality provided? Does it include a services offering for defining, sharing, updating, versioning, and synchronizing metadata across user interfaces and applications?
Describe how reusable components can be created by or within the product/ platform/solution.
How does your system enable users to easily customize their desktop?
How does your system enable users to share query results with other users?
Does your system enable users to access all tools from a single workspace (meaning less training and maintenance)?
What protection features are provided to ensure that data access can be limited to users with the correct authorizations?
How is data protected and secured while in transit and once it has been passed to the solution’s repositories?
BI & EPM: The Oracle Guide to Management Excellence
126
What security protocols are supported (for example, LDAP, ADS, NTLM, NIS, and Oracle Access Manager) to enable remote users to access data, and what authentication facilities exist?
Can the repository of reports be maintained to meet lifecycle management requirements: import and export for backup, movement of all content from development to test to production?
Integration and Linking to Other Tools
How is system integration handled? For example, operational links to and from key back-office systems ERP, CRM, and so on?
Is two-way integration supported; that is, the ability to directly write data back into source operational applications? If yes, how is this integration achieved, and which applications are supported?
Describe the mechanisms available for the retrieval, gathering, and storage of information from disparate data sources. Please indicate those data sources/applications that can be accessed directly and how this is managed within the solution.
How does the product interoperate with Oracle Data Integrator (ODI), Informatica, and Oracle Warehouse Builder and other best practice ETL tools?
Is legacy integration possible? If so, how is this achieved?
Which presentation formats are supported (HTML, PDF, XML, MS Office, etc.)?
What use is made of wizards and drag-and-drop technology for the rapid construction of queries?
Do you support complex queries and the ability to run procedural calculations? Please elaborate.
Does your solution have graphical data mining capabilities? (Data mining is the process of searching through large amounts of data in a database to find hidden relationships and patterns. Results can be descriptive, providing additional information about existing data; or predictive, forecasting trends.) Does data mining enable you to register and use new algorithms created by third-party vendors, such as RightPoint Software and SPSS?
BI & EPM: The Oracle Guide to Management Excellence
127
Does your solution enable writeback to the BI platform, enabling sophisticated what-if modeling?
Does your solution provide you with the ability to build complex business logic and business rules easily and quickly?
Does your repository have built-in mathematical functional capability that covers basic functions and more complex calculations, such as IRR, NPV, and allocations?
Does your system provide the ability to performance-tune members or groups of members so that certain data is pre-calculated and additional data is calculated in memory? Please explain.
Are statistical data and global assumptions supported? Can key performance indicators be calculated? Please explain.
Does your system have an open architecture? Do you have an open API, partner tools, and so on?
Does your system have time series intelligence; that is, can it calculate period-to-date values for your data? Does it do this in a batch or dynamically (or both)?
Does your system have financial intelligence? Does it have a library of built-in formulas that have been extended to be OLAP-aware (calculations across all combinations of all dimensions)?
OLAP, Data Warehouse, Data Mining
OLAP
Advanced analytic solutions provide business users insight into tough business problems that require the application of sophisticated calculations to massive amounts of data, across multiple dimensions. It allows organizations to deliver immediate feedback on complex analysis, such as customer profitability or engagement risk assessment at both high and very granular levels.
Consider the following questions when evaluating your system, or when evaluating the purchase of one:
BI & EPM: The Oracle Guide to Management Excellence
128
Performance and Scalability
Will your solution scale to thousands of users? Is there any mechanism to determine at what point degradation will occur? Any rules of thumb or examples?
Can you provide independent benchmarks on query performance?
Can your solution handle “near-real-time” application requirements?
What is the largest number of items in a single dimension that is currently in production?
Can you deploy on multiple platforms? UNIX/Windows?
Can you deploy your solution on 64-bit hardware?
Do you to accelerate your data warehouse queries?
Do you need to add analytic content via SQL-based BI Tools
Calculation Breadth and Sophistication
Does your solution require specialized or multiple calendars?
Fiscal
Gregorian
Retail
Manufacturing
ISO 8601
Can your solution automatically handle “to-date” type values (quarter-to-date, season-to-date, year-to-date)?
Will your solution easily compute “time balance” items, such as inventory or headcounts that do not naturally aggregate over time?
BI & EPM: The Oracle Guide to Management Excellence
129
Will your solution easily compute “flash metrics” that require restricted computation, such as discount percent? Or that require two-pass computation, such as percent of total? Or measures that do not aggregate, such as price?
Will your solution naturally compute variances and variance percents across both revenue and expense items?
Does the tool support currency conversion?
Are all calculations allowed across all dimensions?
Does your solution have a library of pre-built functions to accelerate application development?
Does your solution allow specialized calculations to be imported and executed inside your OLAP tool?
Can your tool create procedural logic?
Forward-Looking
Does the tool support multi-user writeback under security? Is it real-time or batched?
Can your solution perform trending based on historical values?
Does your solution allow the creation of multiple scenarios within one cube?
Can your solution store “drivers” for scenario modeling?
Can you perform “goal seeking” with your solution?
Does your OLAP engine have imbedded data-mining capabilities?
Reporting
Does your solution provide an Excel interface for online ad-hoc analysis? Does this interface:
Require a query language?
Require programming?
Have a rapid response time on data retrievals?
Enable customized views of enterprise data?
Enable the use of all standard formatting features of Excel?
BI & EPM: The Oracle Guide to Management Excellence
130
Does your solution have full integration to the other modules in Office? PowerPoint and Word? How are they integrated? Is there a single add-in for all modules?
What other types of reporting tools can access your OLAP tool?
Boardroom-quality formatted financial reports
Dashboards
Ad hoc query
Visualization of massive data sets
Can you drill through the OLAP source to transaction data?
What APIs does your tool have for custom report/application development?
Can you use MDX to query your OLAP data?
Other
How does your On-Line Analytical Processing (OLAP) solution integrate with other tools?
Does your solution integrate with one of the major search engines, such as Google?
Does your OLAP tool support alternative hierarchies within a dimension?
How does your OLAP tool support asymmetric hierarchies?
Can your tool define and filter security access by user or group down to the cell level?
Can transaction detail reside in a relational data store and the aggregates in your OLAP cube?
Can the tool build cubes directly from relational tables/star schemas?
Data Integration, App. Management & Master Data Management
Enterprise Performance Management requires seamless and reliable data exchanges in its processes. Excellence will be achieved by ensuring:
Fast data transfers and preparation between solution components
Harmonization of the hierarchies and rules that structure data
Quality control throughout the process
BI & EPM: The Oracle Guide to Management Excellence
131
Data Integration
Data Integration will move your data from a solution to another and process the necessary transformation to it, whether to adapt it to the required format, or to pre-process calculations and aggregation to save CPU in the receiving application.
Consider the following questions when evaluating the purchase of a new system
Volume of data to transfer
Does your process requires thousands or millions of lines of information to be transferred
How often do you need to run the process?
How much time do you have to run the process?
Complexity of data preprocessing
How much aggregation does your information need to receive to be included in your targeted repository or application?
How complex are the calculations and transformations to be applied?
Evolution pace
How often do you need to adapt to systems or data structure changes?
How often do you integrate new domains and data into your EPM spectrum?
Data sources and targets availability
How many different sources and targets do you need to deal with?
Are they proprietary or standard databases?
Setup and maintenance
Do you know the source and target data management language?
Do you have access to the right support for maintenance and corrections?
BI & EPM: The Oracle Guide to Management Excellence
132
Master Data Management
Master data is data that is shared across systems (such as lists or hierarchies of customers, suppliers, accounts, or organizational units) and is used to classify and define transactional data [Source: IDC]. Many companies currently attempt to align their enterprise dimensions in a very manual fashion (in spreadsheets), or in a homegrown system. In some cases, they are not aligned or managed it at all.
Consider the following questions when evaluating your own system, or when evaluating the purchase of a new system:
High-Level Capabilities
Does your application/tool enable business users to directly manage enterprise dimension changes out of the box?
Does your application/tool offer features and functions for supporting a master data change process?
Does your application/tool support different hierarchical dimensional data structures and data models for the various organizational applications that you might have?
Versioning
Does your application/tool enable versioning of enterprise dimensions and hierarchies? A version represents a single, independent set of related master data. Versions usually are structured by time period or function (examples: 2006 January, 2007 Reorg, Planning). Versioning enables lifecycle management of dimensions as well as modeling of dimensions for such events as reorganizations, planning efforts, and mergers and acquisitions.
What types of version rollback does your application/tool offer? Version rollback creates a copy of a version for a specific time in that version’s history. Rollback may be based upon a particular date and time, the number of days back in time, or even a particular dimensional change that occurred in the history of that version.
BI & EPM: The Oracle Guide to Management Excellence
133
Attributes
Does your application/tool support derived attributes? What steps are required to implement? Derived attributes are those that return a value based upon a particular formula or position of a node within a hierarchy. The management of dimensional attributes and their values may be automated by using derived or inheritance properties.
Can the default value for an attribute be different based on hierarchy position or other attribute values? What steps are required to implement? For example, if a member of hierarchy A also exists in hierarchy B, can that member have one value for attribute 1 based upon its position in hierarchy A, and another value for attribute 1 based upon its position in hierarchy B? In other words, can properties be either locally applied (particular to each separate hierarchy in which the member exists) or globally applied to all (same value is returned for the member no matter where it exists in a version)? An example of a globally applied property could be currency: After a member is marked with a particular currency, no matter which hierarchy it is in, it should likely have the same currency. However, on hierarchy A, that member may have a percent consolidation of 100%, and in hierarchy B, a percent consolidation of 50%, an attribute that is local to each hierarchy.
Compare/Query
What types of comparison capabilities does your application/tool offer? For example, can you compare hierarchies between versions to distinguish the changes between versions—for lifecycle management, to advise systems or users of soon-to-be-published dimensional changes? Can you compare hierarchies within the same version or across versions to identify differences in such aspects as the lowest level members, for example, or those members with a currency of USD? Can you compare attribute values for members across hierarchies?
Can your application/tool compare two hierarchies for structure differences? What steps are required? For example, for lifecycle management and user/system notification, can you identify additions, deletions, moves, and attribute differences between two hierarchies?
Can your application/tool compare attributes for members across hierarchies within the same version or in different versions? For example, if an office moved and changed currency, could you compare currency values between last period and the current period to determine which offices had currency differences?
BI & EPM: The Oracle Guide to Management Excellence
134
How are business rules created and applied in your application/tool? For example, how can you ensure that correct formatting is adhered to when adding an entity that should start with the same numeric first digit as its parent, have numeric digits in positions two and three and, in positions four through eight, have characters? How can you enforce that an office has only 10 employees reporting into it at a time?
Inheritance
Within a hierarchy, can elements inherit attribute values from their ancestors? For example, if entity New York exists under country USA, along with the other 50 states, can you assign currency of USD to USA and push that value down to all 50 states through inheritance? This ability eliminates the maintenance of applying the value of USD currency to each of the 50 states manually. Should one of those states, such as Alaska, be overtaken by Canada, and therefore moved under Canada in the hierarchy, would Alaska’s currency value be updated automatically from USD to CAD, due to the currency attribute being applied at Country level and pushed down the hierarchy through inheritance?
Business Rules
Can business rules be selectively enforced in different sections of a hierarchy? What steps are required? For example, within a geographical hierarchy, can a business rule that limits offices to 10 employees be applied to European countries only and not to the USA or any other countries outside of Europe?
API (Application Programming Interface)
How do external applications automate and use the API? Do they use a SOAP interface, a COM interface, or both?
Are 100% of the features and functions of your application/tool exposed by an API?
Can you provide the API documentation and sample code that use the API?
Can you provide at least two customer references that have used your API in a production environment?
BI & EPM: The Oracle Guide to Management Excellence
135
Automation of Master Data Updates
Does your application/tool support bulk changes to dimensional data? What steps are required? For example, how would 10,000 dimensional data changes (that could be due to a re-organization or an acquisition) be applied to the existing dimensions, across all applications that leverage them? These changes could be additions, deletions, attribute updates, and moves.
Can bulk changes to dimensions be initiated from an Excel spreadsheet? For example, can bulk updates—such as 3,000 new accounts—be captured in an Excel spreadsheet (either manually or system-generated) and then directly applied, from that spreadsheet, to the current dimensions in order to add those 3,000 new accounts—with the appropriate attribute values—to existing account hierarchies? What steps are required?
Version/Hierarchy Blending
Can changes in one version be automatically replicated to other versions based on rules? What steps are required? For example, can changes be modeled in a reorganization version of production dimensions over several months, from September through November, and then be pushed into December’s production dimensions?
Data Quality Management
Data Quality Management will help you not only confirm the reliability of your data in your process from one end to the other but also will help you drill back to the sources to audit the collected figures and will perform integrity controls to make sure the data handled matches the shared rules and structures.
Evaluating the purchase of a new system for Data Quality Management brings similar questions as the ones for Data Integration (see the list in the Data Integration paragraph above). In addition, here are the points that need to be looked at:
Risk Assessment of Poor Data Quality
What is the human factor in the information collection (manual inputs in spreadsheets, inputs in transactional systems, copy-paste from a system to another)?
How heterogeneous are the systems people are reporting from?
BI & EPM: The Oracle Guide to Management Excellence
136
How heterogeneous are the cultural, technical, and educational backgrounds of the information providers?
Financial Data Quality Management
Financial Data Quality Management is the practice by which companies can effectively and consistently
Collect and transform data from multiple data sources in multiple formats
Develop repeatable financial data management processes
Document internal controls
Access audit trails from source to report
Financial data quality management helps finance users increase their confidence in the numbers and reduces their cost of compliance by eliminating data integrity risks associated with collecting, mapping, validating, and moving critical financial data from across the enterprise.
Consider the following questions when evaluating your system, or when evaluating the purchase of one:
Data Collection
Can data be collected from numerous, heterogeneous source systems?
Are import profiles defined and stored centrally for each source system?
Can data be imported from any text file in any format, eliminating the need to reformat the file first?
Can data be imported seamlessly from any relational database?
Can high-volume data be imported within a “reasonable” amount of time?
Are import failures quickly detected, logged, and easy to resolve?

BI & EPM: The Oracle Guide to Management Excellence
137
Are the data collection tools used consistent with a common interface throughout the organization?
Transformation
Is imported data staged in a centralized database before transformation rules are applied?
Are transformation rules stored separately by source system or location?
Can transformation rules be defined using multiple methods (for example, one-to-one, ranges, wildcarding, if...then conditional mapping?
Are users given access to mapping rules and held accountable for updating mapping tables when necessary?
Can mapping changes be documented, and are they understandable?
Can mapping errors be quickly detected, logged, and easily resolved?
Business Rules Validation
Can relevant business rules be defined and applied to data during the migration process to ensure that the highest level of data integrity and quality is being achieved?
Are business rules easy to define by non-technical resources?
Is a validation-check report displayed for the user to provide confirmation that data was loaded into the target system and consolidated properly?
Are business validation rules easily detected and easy to understand so that corrections can be made?
Can you define a process to make adjustments to submitted data?
Target System Integration
Can you integrate directly with a target EPM system?
Are pre-built adapters available that make system integration quick and easy?
BI & EPM: The Oracle Guide to Management Excellence
138
Are advanced integration functions available, such as metadata recognition, data load, calculations, process workflow integration, journal module integration, and so on?
Can you integrate with multiple target systems?
Internal Controls
How do you audit from aggregated numbers in an analytical application down to the source GL Trial Balance?
To comply with Sarbanes-Oxley/Basil II/IFRS regulations, how are Section 302 and 404 processes monitored? Are these processes integrated with the financial close process?
Can every step of the data migration process be documented by user, event, time, and so on?
BI & EPM: The Oracle Guide to Management Excellence
139
Creating an EPM “Center of Excellence”
Introduction
From the telecommunications and retail industries to financial services and pharmaceutical manufacturing, management teams are discovering the power of enterprise performance management (EPM) to improve transparency, insight, and decision-making. But, it’s difficult to manage performance when you have a dozen different systems in place to gather and analyze business data. To get the most out of an EPM investment, you have to align management processes, rationalize information systems, and unify key performance indicators – steps that are often much easier said than done.
More commonly, a variety of solutions are deployed as pilot projects in different departments and then spread ad-hoc to other parts of the business. It takes persistent outreach, evangelism, and training to convince others to embrace a preferred program.
How do you overcome the challenges of decentralized management, multiple business intelligence systems, and fragmented implementations? Organizations that have achieved this usually have one thing in common – they created an EPM Center of Excellence.
Known also as EPM Competency Centers, EPM Centers of Excellence bring together the people, processes, and technologies necessary to promote collaboration and the use of best practices throughout an organization. They consist of cross-functional teams whose mission is to drive the adoption of technologies and related best practices in a cost-effective way by leveraging points of synergy among EPM initiatives. They may provide consulting, and/or implementation services to ensure consistency and efficiency in the company’s use of its EPM system.
Although the establishment of EPM Centers of Excellence is in the early stages of adoption in most industries, the concept is familiar – particularly in IT environments. For example, many companies have set up similar centers dedicated to integration technologies, or have a strategic center of excellence for all of their Oracle applications. These centers serve as central repositories of knowledge and resources, and they assist other groups in deploying the technology in their respective areas of the business.
When equipped with a clearly defined role and the right mix of business, analytical, and IT skills, an EPM Center of Excellence can help companies achieve top- and bottom-line improvements
8
BI & EPM: The Oracle Guide to Management Excellence
140
across all lines of business while reducing the cost of their EPM efforts. Implementations go faster and success rates improve as the roll-out process is documented and repeated. And the faster the EPM implementation, the more quickly managers are able to adopt best practices in decision-making. Improved efficiency, effectiveness, and quality lead to a better bottom-line. These same improvements often translate to increased customer satisfaction which can positively affect your top-line. As EPM is deployed more widely and successfully, the company will be able to transform itself into a more strategic and competitive entity.
What is an EPM Center of Excellence?
An EPM Center of Excellence is an organizational entity that groups interrelated skills, experience, and domain expertise together to promote and deliver technology through a consistent set of skills, standards, and best practices. It delivers repeatable, successful deployments in a way that is beneficial to the entire organization rather than just a single project.
Implementing EPM in an organization is not a one time project but an ongoing business process. As organizations refine and improve the process, significant benefits are realized. Managers, acting on information provided by the EPM information system, make better-informed decisions, leading to better performance and greater profitability for their enterprise.
Yet the improvements in performance achieved as a result of these efforts may be only a fraction of the potential benefits to an organization from implementing an EPM system. One best practice we have seen in organizations seeking to maximize the benefit from their EPM efforts is the creation of an EPM Center of Excellence (CoE). An EPM Center of Excellence solves many challenges faced by organizations implementing EPM. It is an internal group that provides consulting services and oversees the EPM efforts within an organization. The Center of Excellence helps standardize tools, procedures, and best practices, enabling companies to leverage their experiences across projects to achieve scalable (enterprise-spanning) results and reduce the cost of their EPM efforts.
BI & EPM: The Oracle Guide to Management Excellence
141
Why Establish a Center of Excellence?
Centers of Excellence typically are formed to address the short-term needs of one or more projects, but they can have far-reaching effects over time in terms of both efficiency and effectiveness. An EPM system delivers the most value to an organization when it is able to measure the performance of every significant business function. By increasing EPM usage across the organization, a Center of Excellence can help a company realize the full potential of its EPM investment.
Here are some of the benefits that an EPM Center of Excellence can deliver:
Potential Effectiveness Benefits
Share EPM knowledge: By consolidating expertise and documenting best practices, the center facilitates knowledge sharing. It can create reusable assets and build competencies that extract maximum value from the organization’s EPM investment.
Centralize performance management: An EPM Center of Excellence provides the entire enterprise with a central platform for managing performance, creating visibility into key indicators, and aligning the application with business objectives.
Manage information to gain a competitive advantage: By enabling a company to share relevant information with customers, the EPM Center of Excellence strengthens customer relationships while creating a more customer-centric organization. By sharing information with
Financial Institution
One of the world’s largest financial institutions began its EPM journey in 2003 with an initiative driven by the finance department
to transform the company’s finance organization into one that would be considered best-of-class in its industry. Finance thought
at first that it would implement its EPM reporting and analysis project by designing and implementing one standard approach
and system for all of the company’s lines of business. But the requirements of the various lines of business were so different
that the project leaders quickly concluded each business would have to be tackled individually.
When it became obvious that this one large-scale EPM project was more realistically a series of smaller EPM projects, the
challenge became how to ensure an infrastructure, consistent methodology and best practices that could be leveraged across
all projects while meeting the specific needs of each line of business in each individual project. The answer was to establish an
EPM Center of Excellence.
BI & EPM: The Oracle Guide to Management Excellence
142
key suppliers and business partners, the EPM Center of Excellence promotes value chain integration, enhancing operational excellence and enabling new sources of innovation.
Strengthen compliance: By promoting best practices for EPM, the Center of Excellence may ensure ready access to data required for complying with government regulations, such as Sarbanes Oxley, Basel II and HIPAA.
Potential Efficiency Benefits
Control costs: A Center of Excellence reduces costs by acting as a central source of EPM optimization expertise and ensuring that skills and processes developed for one project can be applied to the next.
Consolidate infrastructure: When the Center of Excellence features a test lab for research, proof of concept, prototyping, and advanced training, these tools become accessible to all project teams, eliminating the need to duplicate scarce and expensive resources.
Standardize the IT infrastructure: By endorsing specific solutions, the center can discourage the use of alternate tools, ensuring consistent, cost-effective, and fast implementations of the right systems and processes.
Unify business data: A Center of Excellence brings order to data by aligning different projects that use similar information and eliminating the problem of fragmented data infrastructure, which can prevent organizations from monitoring enterprise performance.
Establish an enterprise-wide framework: With a proven model for deploying EPM applications, the company can accelerate future development initiatives, resulting in lower costs, improved delivery times, and more effective implementations.
A company’s ability to realize these benefits will depend on the maturity of the Center of Excellence and the resources available to it. One healthcare industry EPM Center of Excellence was able to improve the ratio of time that its financial analysts spend gathering data versus analyzing and reporting, which in turn created more time for activities that add value to the business. Initially created by the finance department, the center is funded and used by every line of business today.
BI & EPM: The Oracle Guide to Management Excellence
143
By focusing on objectives that address the company’s greatest needs, the center will be able to establish a track record for success and win the confidence of management across the organization.
Creating an EPM Center of Excellence
Now that you know what it can accomplish, how do you go about creating an EPM Center of Excellence? Although it may sound like a major undertaking, it is possible—and advisable—to start small over the course of a few months and expand over time as the center proves its value.
For starters, a senior management mandate is essential to ensure a cross-functional approach. With executive support in place, the company will need to identify skilled people, a standard model for governance and processes, a coherent architecture, and marketing and communications capabilities.
There are several key considerations for planning an EPM Center of Excellence:
Governance: Defining a clear charter for the Center of Excellence.
Center of Excellence type: Defining which type of Center of Excellence is right for you.
Objectives: Define objectives that align with the needs of individual business units and development teams, as well as those of the overall enterprise. Consider the perspectives of executives, users, and IT staff in the EPM deployment.
Strategy: Present a coherent strategy for the design of EPM within the organization.
Services: Define the services and deliverables the center will provide, recognizing that the list will change over time as the center matures and funding either goes up or down.
Communication plan: Develop a communication plan that informs the rest of the organization of the center’s services, as well as the successes it achieves over time.
M&A Example
Whenever a global holding company in the telecommunications industry acquires a new business, it inherits a portfolio of legacy
technology and an arduous process of data integration ensues. How does management get a view of the performance of the
combined companies? Only by deploying a standard EPM system each time it closes a deal. For companies of this size and
scale, EPM strategy and training are not one-time projects, but ongoing initiatives. An EPM Center of Excellence can help to
consolidate resources, share EPM experiences, and recommend best practices.
BI & EPM: The Oracle Guide to Management Excellence
144
Staff: Develop a staff capable of delivering services to its internal customers. The plan may include hiring and training internal staff and/or procuring outside consulting services.
Metrics: Identify metrics to monitor the ongoing performance of the center.
Getting Started
If you already have a number of EPM initiatives in progress, follow these nine steps to help initiate and establish an EPM Center of Excellence in your organization:
Take stock of your performance management programs and skills.
Identify areas of duplication and deficiency.
Develop a vision and business case for the center that articulates benefits to stakeholders.
Recruit an executive sponsor for the center.
Define a launch plan that addresses priorities, technologies, standards, methodologies, and skills.
“Sell” the center to teams that want to launch new EPM initiatives.
Pilot and market the EPM Center of Excellence.
Expand the scope and sponsorship of the center.
Look for ways to turn the center into a revenue stream.
The following sections address seven important questions that arise when forming an EPM Center of Excellence:
How do you define the center’s role and responsibilities?
Should you establish a Governance Committee?
To whom does the Center of Excellence report?
What skills are required and where do you find them?
From where will the center’s funding come?
What is your communication plan?

BI & EPM: The Oracle Guide to Management Excellence
145
Roles and Responsibilities
The EPM Center of Excellence typically has the following areas of responsibility:
Establish requirements for EPM projects and initiatives that meet the needs of users and the organization.
Train users on EPM tools, including how to access and leverage the data provided by the EPM system.
Provide analytical expertise by performing complex, ad hoc analysis for business units.
Ensure uniformity of analytical approaches used to address common business issues across the enterprise.
Coordinate the definition of enterprise dimensions and metadata in the enterprise, including the definition of common business terms.
Establish standards for EPM tools used throughout the enterprise.
Develop prototypes of EPM applications as proofs of concepts.
Different EPM initiatives will require varying levels of governance and involvement by the Center of Excellence. For example, corporate initiatives should be fully governed by the center (regulated). It should determine standard processes, performance indicators, and the systems to be used for the project. However, using this governance approach for all EPM initiatives would limit the center’s acceptance and effectiveness.
Some performance management initiatives support line-of-business (LOB) performance rather than corporate performance. When various lines of business share a performance management initiative, the center could govern by coordinating the cross-LOB activities (mandated). And when a specific business unit or function initiates an EPM project, the center can govern by serving as an internal consultant, bringing along its best practices and methodologies, but implementing EPM based on the unit’s specific requirements (standardized).
Lastly, most organizations will also have a few special-purpose applications that target a few “super-users.” The center should not try to fully govern those, but should simply keep in touch
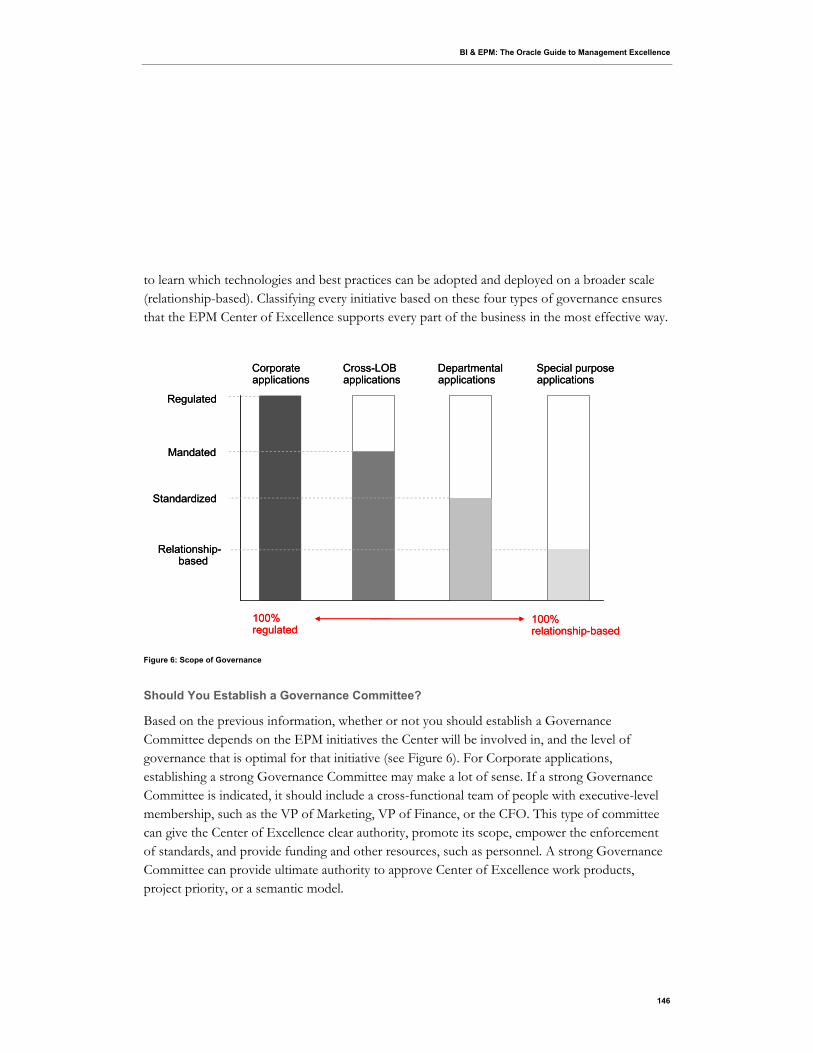
BI & EPM: The Oracle Guide to Management Excellence
146
to learn which technologies and best practices can be adopted and deployed on a broader scale (relationship-based). Classifying every initiative based on these four types of governance ensures that the EPM Center of Excellence supports every part of the business in the most effective way.
Regulated
Mandated
Standardized
Relationship-based
100%regulated
100%relationship-based
Special purposeapplications
Departmentalapplications
Cross-LOBapplications
Corporateapplications
Regulated
Mandated
Standardized
Relationship-based
100%regulated
100%relationship-based
Special purposeapplications
Departmentalapplications
Cross-LOBapplications
Corporateapplications
Figure 6: Scope of Governance
Should You Establish a Governance Committee?
Based on the previous information, whether or not you should establish a Governance Committee depends on the EPM initiatives the Center will be involved in, and the level of governance that is optimal for that initiative (see Figure 6). For Corporate applications, establishing a strong Governance Committee may make a lot of sense. If a strong Governance Committee is indicated, it should include a cross-functional team of people with executive-level membership, such as the VP of Marketing, VP of Finance, or the CFO. This type of committee can give the Center of Excellence clear authority, promote its scope, empower the enforcement of standards, and provide funding and other resources, such as personnel. A strong Governance Committee can provide ultimate authority to approve Center of Excellence work products, project priority, or a semantic model.
BI & EPM: The Oracle Guide to Management Excellence
147
With an established charter, the Center of Excellence is well positioned to carry out its mandate, which may include providing standards, promoting best practices, implementation help, or developing work products. As always, without a clear charter, the Governance Committee would not have the authority to perform its duties, and there would likely be confusion of functions and responsibilities. This confusion could possibly lead to in-fighting between departments, and eventually to the failure of the Center of Excellence.
What Can an EPM Center of Excellence Do for You?
With its role and responsibilities broadly defined, the EPM Center of Excellence can perform a variety of specific tasks, which can be grouped into four main categories:
Self-service: Many of the center’s tasks will help guide users toward self-service performance management. It might offer training on tools for querying, reporting, and analysis, as well as how to interpret data and how to reuse reports and systems. Example tasks:
Report writing assistance
On-the-job training for business unit “power users”
Promoting the reuse of applications, rules, and reports
Analysis: The EPM Center of Excellence can design dashboards and scorecards and offer assistance for writing rules and reports. The center might also develop analytic frameworks and perform ad hoc analysis for users until they learn to do these tasks themselves. Example tasks:
Dashboard and scorecard creation
Rule writing
Performing ad hoc analysis
EPM custodian: As the company’s EPM custodian, the center oversees EPM vision, design, and application development, as well as promotes a common business language and set of enterprise dimensions. Example tasks:
EPM vision management
EPM design ownership
Data and metadata mapping
BI & EPM: The Oracle Guide to Management Excellence
148
Enterprise dimension management support
Financial data quality management
Analytic frameworks, including profitability analysis, customer churn analysis, cross-sell and up-sell analysis, and visualization techniques
Promoting a common business language, including definition of terms; for example, a customer, or a full-time equivalent (FTE)
Technology management: The IT experts in the EPM Center of Excellence oversee the various tools and technologies and optimize the use of the technology:
Planning application development, updates and changes, including:
Corporate security (for example, LDAP) integration
Performance tuning and optimization
Reporting Structure and Organization
Management teams have several options for where to position the EPM Center of Excellence within the organization. The center can report to the operations, finance, or IT departments. If the center is closely connected to the company’s core business, then the operations department is often the best fit. (This can be marketing, manufacturing, or another business function, depending on the type of organization.) This reporting structure only succeeds if the executive in charge also sees value in the center supporting other business domains. The finance department may be a better option for ensuring cross-functional support, as it is usually the most obvious department that oversees all other business departments. This structure only works, however, if the finance department owns all of the EPM initiatives within the organization.

BI & EPM: The Oracle Guide to Management Excellence
149
The IT department provides another logical host for the EPM Center of Excellence, particularly if the center’s tasks focus more on building and running systems than coordinating management processes. This model only works if IT is seen as a partner rather than just a service provider.
Some EPM Centers of Excellence are set up as centralized departments. If there is a clear mandate, the department will have a manager and dedicated staff. The department then reports into one of the operational areas listed above. This approach requires a strong commitment as EPM becomes institutionalized.
Many centers start as virtual structures, in which members remain part of their own departments, but collaborate within the center. This approach often proves unsuccessful, as it lacks a strong mandate from the top and a commitment from its members. The most successful EPM Centers of Excellence operate under a distributed or federated structure with a small and dedicated team for each line of business, and a small and dedicated team on the corporate level—all working closely together.
Retailer
One retailer created its EPM Center of Excellence initially as part of the finance department, but once the center was
established and on firm footing, it was moved outside of finance and into a shared corporate services organization that
managed a number of different competency centers. While each competency center within the bank is run by its own manager,
all of the centers report to a single executive, ensuring that potential conflicts are more quickly and easily resolved and that
centers are not working at cross purposes.
Because the company’s EPM Center of Excellence is now staffed and run by an unbiased corporate team—as opposed to a
finance team—more functional areas within the company are using the center for their own EPM initiatives. This has enabled it
to fulfill its charter as an organization designed to establish standards and best practices for all the company’s EPM projects.
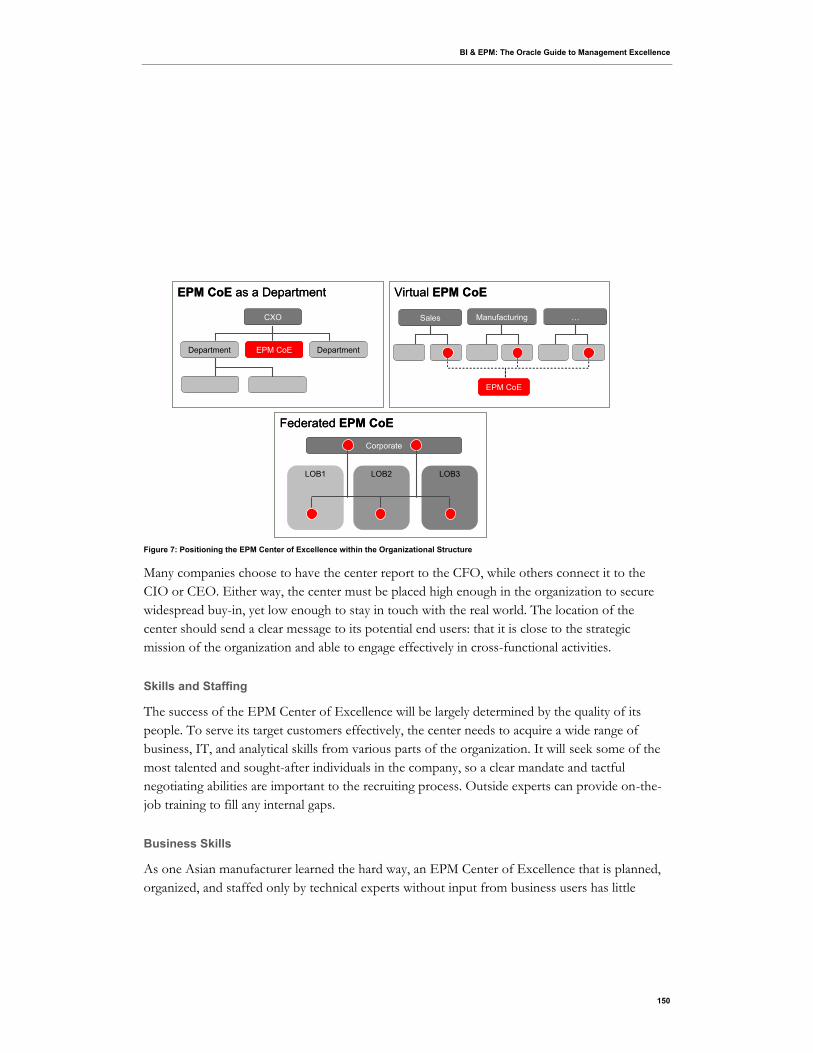
BI & EPM: The Oracle Guide to Management Excellence
150
Figure 7: Positioning the EPM Center of Excellence within the Organizational Structure
Many companies choose to have the center report to the CFO, while others connect it to the CIO or CEO. Either way, the center must be placed high enough in the organization to secure widespread buy-in, yet low enough to stay in touch with the real world. The location of the center should send a clear message to its potential end users: that it is close to the strategic mission of the organization and able to engage effectively in cross-functional activities.
Skills and Staffing
The success of the EPM Center of Excellence will be largely determined by the quality of its people. To serve its target customers effectively, the center needs to acquire a wide range of business, IT, and analytical skills from various parts of the organization. It will seek some of the most talented and sought-after individuals in the company, so a clear mandate and tactful negotiating abilities are important to the recruiting process. Outside experts can provide on-the-job training to fill any internal gaps.
Business Skills
As one Asian manufacturer learned the hard way, an EPM Center of Excellence that is planned, organized, and staffed only by technical experts without input from business users has little
LOB2 LOB3LOB1
Corporate
EPM CoE as a Department Virtual EPM CoE
Federated EPM CoE
EPM CoEDepartment Department
CXO Sales Manufacturing …
EPM CoE
LOB2 LOB3LOB1
Corporate
EPM CoE as a Department Virtual EPM CoE
Federated EPM CoE
EPM CoEDepartment Department
CXO Sales Manufacturing …
EPM CoE
BI & EPM: The Oracle Guide to Management Excellence
151
chance of succeeding in the long term. This company’s center delivered on its initial project of building a data warehouse but was unable to adapt its model to provide sustainable value to the organization.
The EPM Center of Excellence needs to understand line-of-business needs in the context of the company’s overall business objectives, as well as cross-line-of-business issues. For example, in order to conduct collaborative planning, a retail company needs to align its marketing and sales plans (How much can we sell?) with its manufacturing plans (How much can we produce?) and its logistical plans (How much can we ship?).
Its business representatives must be able to communicate and persuade at the executive level while helping business managers set and balance priorities. As EPM evangelists, they will drive standardization, adoption, and acceptance of approved technologies and processes.
More experienced business people can bring an understanding of established business processes, what can be improved, and how valuable those improvements would be to the company. They will know what types of improvements can be supported by data analysis and be able to develop an analysis of ROI from a financial perspective.
Analytic Skills
In order extract information from data, the EPM Center of Excellence needs sophisticated statistical analytical skills to research business challenges, explore data using a variety of data analysis techniques, develop models that analyze the challenges, and produce recommendations based on the analyses.
IT Skills
In order to deploy EPM technology effectively, the Center of Excellence must recruit staff who know how to access and manage the data needed to support business and analysis requirements; understand IT tools and technology, the data warehouse and data administration; and understand the EPM infrastructure implications of business and analytical requirements. Accordingly, the center will want to recruit a mix of information architects, data modelers, database administrators, metadata specialists, data-quality specialists, data stewards who interface with the company’s data governance committee, and data-integration specialists.

BI & EPM: The Oracle Guide to Management Excellence
152
Ideally, each EPM Center of Excellence staff member will contribute at least two of the three necessary skill sets. Potential sources for these experts include existing IT professionals with a strong understanding of the business and business users who are well-versed in EPM technology and concepts.
Funding an EPM Center of Excellence
As a cross-functional entity, the EPM Center of Excellence needs a means of allocating its cost to the business groups that it serves. Companies have three options for funding the center: overhead, pay-per-use and subscription-based.
Overhead
In this model, the executive sponsor of the center underwrites all of its costs, and business units may consult the center free of charge. Although this funding method eliminates barriers to entry by allowing any part of the company to use the center’s services, it also fails to establish an economic value for the services that are provided and may not ensure long-term success for the center.
Pay-per-use
Some Centers of Excellence charge business units a fee for each project or activity they request, which ensures that heavy users pay a larger share of the overall cost. Although this approach seems rational at the outset, the downside is that over time, high project fees may discourage users from approaching the center for help. Again, the long-term viability of the center becomes questionable under this funding model.
Subscription-based
A third approach charges user groups according to a predetermined allocation that corresponds to their objectives. This approach is preferred, as it combines the best of both models, by eliminating barriers to entry while still putting a price tag on the center’s services.
Most companies begin with CFO-sponsored funding for a period of three to five quarters, at no cost to the business units, as a way of establishing value and credibility. After this period, they
BI & EPM: The Oracle Guide to Management Excellence
153
adopt a charge-back or cost recovery method. Whichever method you choose, it’s important to set the expectation early that the service is valuable and will carry a cost once it is established.
To ensure its long-term success, any EPM Center of Excellence must operate as a business within the business and remain aware of its ROI at all times. The center should measure its financial performance in terms of both cost savings and other intangible efficiencies, and communicate its progress throughout the organization to ensure continued use and support.
What Is Your Communication Plan?
Lack of communication is a major reason for a Center of Excellence to fail. How will your Center of Excellence communicate with the rest of the organization? Standards may need to be communicated to business users, and if a software standards list exists, they must understand why software makes the list and how to propose a new one be added or removed. Typically, a Center of Excellence will have a designated communications officer or director assigned to it.
Often we see Center of Excellence architects leading educational sessions for business users, and posters placed in lunchrooms or in elevators as methods of communication. Architects must establish credibility with the business users and must develop a good working relationship to enable good communication. Publishing papers, or speaking at outside conferences, are good methods for architects to establish credibility.
Whichever methods are employed, a formalized communication plan is critical to the success of a Center of Excellence.
Manufacturing Company
One manufacturing company’s EPM Center of Excellence operates as a profit center, on the belief that it must generate funds
of its own to ensure continued investment in advanced technologies. But the center sets pricing fairly and transparently, so
users always know what they are being charged and why. The center also focuses on delivering the highest possible value
while keeping costs low.
Today, the company is successfully implementing automated reporting and analysis projects throughout each of its lines of
business and hosting other projects throughout the organization through its EPM Center of Excellence.
BI & EPM: The Oracle Guide to Management Excellence
154
Maintaining an EPM Center of Excellence
Centers of Excellence are often conceived as a result of issues that arise from a company’s early EPM initiatives. In such cases, the center must address implementation challenges right away for highly visible projects. As the center matures, its staff must embrace longer-term goals, which may include reducing organizational costs, providing direction for the organization’s EPM efforts, and providing the organization with a central platform for performance management, as well as many of the other potential benefits described above.
Don’t Make These Mistakes
The effort involved in setting up an EPM Center of Excellence should not be underestimated, but it can deliver significant long-term value to the organization in terms of a more coherent approach to EPM. Avoiding these common pitfalls will help you maximize the potential of your EPM initiatives:
Relation to Other Initiatives
An issue related to an EPM Center of Excellence is how it relates to other organizational initiatives, especially in IT. Establishing an EPM Center of Excellence must be coordinated with the other initiatives that an organization is planning, and such coordination should be ongoing. For example, an organization may plan to establish a data warehouse. If the EPM Center of Excellence is established before the warehouse, adequate information may not be available for the center to perform its job effectively. However, the expertise contained in the Center of
Mistake #1: Evolve an EPM project team into a defacto Center of Excellence without giving it a clear charter and formal
reporting structure.
Mistake #2: Plan and staff the center with technical experts without consulting business decision-makers.
Mistake #3: Fail to establish an economic value for the services the center provides.
Mistake #4: Create a center with a management mandate but without buy-in from the business units it will support.
Mistake #5: Provide the same level of governance for all EPM initiatives, rather than allowing more flexibility for applications that
will serve individual business units versus the corporation as a whole.
Mistake #6: Create an EPM Center of Excellence without coordinating with related IT initiatives, such as plans to establish a
data warehouse.
Mistake #7: Overlook the need to document the center’s ROI, and measure its financial performance.
Mistake #8: Do not have a communication plan in place to effectively communicate with Business Users.
BI & EPM: The Oracle Guide to Management Excellence
155
Excellence may help in planning the data warehouse implementation and ensuring that it is adequate for the organization’s needs. Careful consideration and integration of an organization’s initiatives is essential to ensure that it leverages its IT investments and achieves the maximum possible return on its investment.
Conclusion
Implementing EPM in an organization is not a one-time project but an ongoing business process. Many companies invest heavily in the right tools only to face the challenge of getting people to use them. A Center of Excellence can be a valuable resource for connecting pockets of knowledge and sharing them throughout the company to ensure effective EPM deployments. These centers provide technical assistance, coordinate EPM efforts and reduce the cost of EPM implementations through knowledge- and resource-sharing. Above all, they can play an essential role in keeping business and IT aligned on the goal of achieving effective enterprise performance management.

BI & EPM: The Oracle Guide to Management Excellence
156
Best Practices in Implementation
Best practices in implementing an EPM solution fall into two categories: those that deal with setting the stage for the implementation, and those that deal with the implementation itself.
Setting the Stage
Organizations implementing an EPM solution must understand that change management is critical. An organization may change the content or format of information provided to employees, its business processes and/or the expected behavior of employees, and possibly change the metrics for evaluating employees’ performance. To successfully manage these changes, an organization must plan to cope with them. By following the best practices below, companies can increase the likelihood of success of their EPM implementations.
Develop Objectives for Each Part of the EPM Deployment Process
Deploying an EPM solution involves eight steps (analyze, plan, design, build, test, roll out, review, and change management). An organization implementing an EPM solution must develop objectives for each of these steps, align incentives to accomplishment of these goals, and monitor progress of the implementation.
Ensure a Supportive Organizational Environment
No matter how technically proficient an organization’s EPM implementation is, it will not be successful without a supportive organizational environment. To achieve this environment:
Build a broad-based consensus in advance of the implementation for a change in technology and culture
Align strategic goals with operational objectives.
Shift business paradigms based on the EPM solution.
Align the EPM solution with business strategy.
Have the business areas partner with IT departments in ownership and help guide IT project teams.
9
BI & EPM: The Oracle Guide to Management Excellence
157
Communicate with and engage all relevant business areas.
Ensure that the EPM Imitative Has Sufficient Resources and Backing
Implementing EPM requires an appropriate financial budget and human resources, which often are underestimated because some mistakenly view EPM as merely a different reporting method. As such, they expect the cost to approximate that of a reporting tool rather than an enterprise-wide system. To ensure success, funds must be secured with an enterprise-based implementation/deployment in mind—which includes enterprise-wide software.
If the EPM project has begun, and you have inadequate funds to complete the project successfully, viable options exist. Success is often measured in terms of user-adoption of the EPM system, so you could consider focusing on specific functionality that will help more users (say budgeting and planning functions) solve a broad business pain (more accurate and timely budgets). Once the pain is resolved and adoption is successful, you can use that success to garner additional funds to add more functionality to solve another business pain (for example, scorecards). This type of phased approach breeds a loyal following that makes moving to the next phase easier. This phased approach is sometimes referred to as the “Start Anywhere” approach.
Employee Buy-in
Deployment of an EPM system is not successful until it is widely used. As part of its EPM implementation plan, an organization must be sure that user acceptance is considered. Such buy-in can be accomplished by these actions:
Demonstrating executive sponsorship. Getting users to accept the solution often requires a culture change that should begin at the top. Strong executive support is critical to success.
Setting compensation plans that reinforce use of the system
Marketing and selling the new EPM environment and providing requisite training
Making the system easy to use. This can include use of graphical dashboards and scorecards.
Ensuring a smooth transition to the EPM system and enabling increased efficiency
BI & EPM: The Oracle Guide to Management Excellence
158
Resistance to a new tool or performance methodology is to be expected; we often fear the unknown. Expect the strongest resistance among those with the most invested in the old methodology. These people often have valuable IT skills and organizational knowledge. To greatly reduce resistance when replacing a BI tool, enlist the assistance of these employees in migrating to the new system.
Implementing the EPM Solution
It is usually best to start with a pilot EPM project, one that is relatively small and can be implemented quickly but which can deliver substantial benefits to the organization. In selecting the initial project, discover and focus on an organization’s biggest planning pain points first.
Many organizations initially focus on the finance function when deploying an EPM solution. Doing so gives the wider corporate culture time to adjust to the philosophical shifts that an EPM initiative entails. Most organizations that have deployed an EPM system in the finance function choose CRM (customer relationship management) as the next area for implementation. EPM systems can help companies extract maximum value from their CRM software assets. Using the understanding of the key metrics provided from EPM will help you focus on the important CRM metrics and how they drive the business.
Many companies contemplating the implementation of an EPM solution must incorporate many applications from assorted vendors. When addressing this situation, most companies take a go-slow approach. Many “grandfather” existing tools and enforce the new EPM only in new projects.
Master Data Management
Implementing an EPM solution is more than just implementing a set of BI tools. The first steps are getting the data right and standardizing the delivery method by centralizing the management and administration of enterprise dimensions, data warehouses, and transactional systems.
BI & EPM: The Oracle Guide to Management Excellence
159
Best-of-Breed Applications versus Integrated Packages
Many organizations have implemented individual, isolated, BI applications. The advantage to this approach is that users have applications that precisely meet their needs. However, while each of these applications provides local benefit, they may provide little global value, resulting in suboptimal benefits. The individual applications also may have distinct information requirements, leading to an inability to run them off a common data warehouse. It is better in most cases to have a single, integrated EPM solution with a single database and architecture that provides a single version of “the truth.” It is also usually most cost-effective to run an integrated suite of Web-based tools running on a common set of application servers.
The more an organization standardizes on all components of an EPM system—data, metrics, models, architecture, technologies, and processes—the more benefits it reaps. These benefits consist of reduced costs and increased information consistency. Without a common toolset and data source, delivering consistent reports and information; that is, having a single version of the “truth,” is difficult.
Deploying the EPM System
When planning the deployment of an EPM system, it is important to follow a process that helps ensure successful implementation. One approach to defining this process is depicted in Figure 8.
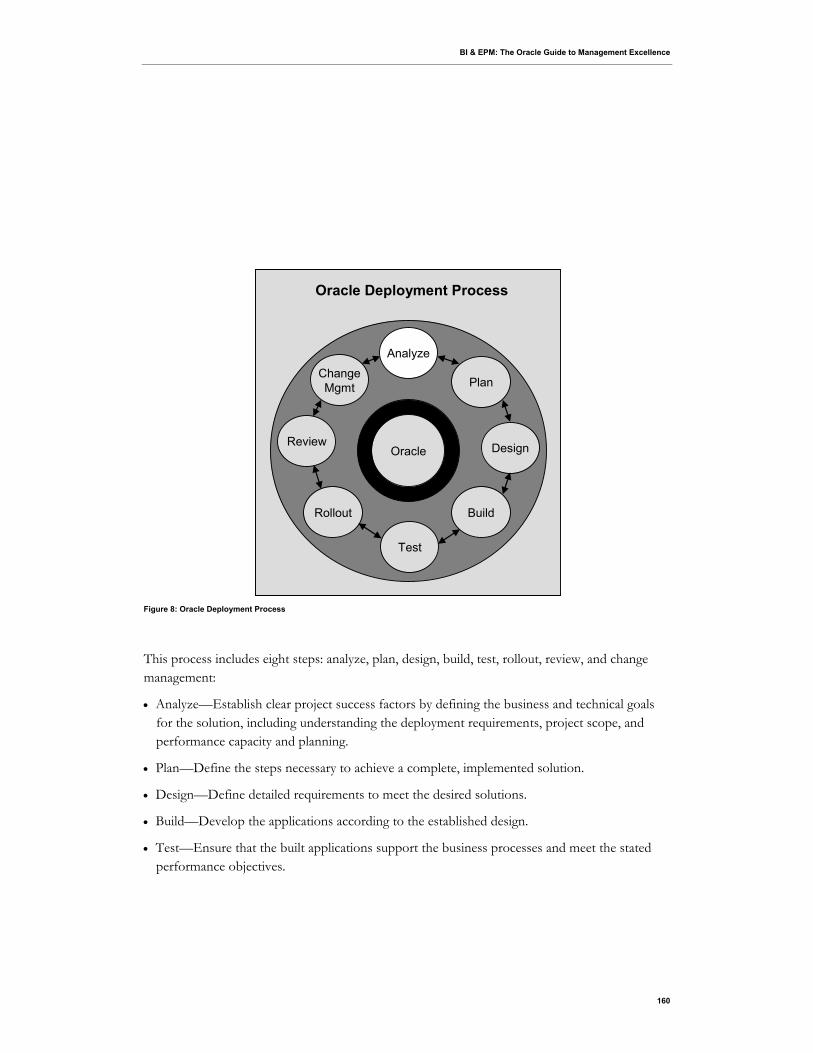
BI & EPM: The Oracle Guide to Management Excellence
160
Oracle Deployment Process
Analyze
Plan
Design
Build
Test
Rollout
Review
ChangeMgmt
Oracle
Oracle Deployment Process
Analyze
Plan
Design
Build
Test
Rollout
Review
ChangeMgmt
Oracle
Figure 8: Oracle Deployment Process
This process includes eight steps: analyze, plan, design, build, test, rollout, review, and change management:
Analyze—Establish clear project success factors by defining the business and technical goals for the solution, including understanding the deployment requirements, project scope, and performance capacity and planning.
Plan—Define the steps necessary to achieve a complete, implemented solution.
Design—Define detailed requirements to meet the desired solutions.
Build—Develop the applications according to the established design.
Test—Ensure that the built applications support the business processes and meet the stated performance objectives.
BI & EPM: The Oracle Guide to Management Excellence
161
Rollout—Move the applications from a test or development environment to a production environment.
Review—Ensure that the solution continues to support the stated business objectives
Change management—Define a process for handling changes related to the EPM solution.
Analyze and Plan
The analysis and planning phases of the EPM implementation process are necessary to prepare for a detailed design session. It is essential that adequate time be spent on these phases to streamline the deployment. Factors to consider include the business’ strategy and vision, its technical vision, the user community, and how the EPM system will be used.
Understand and Define the End Goals
It is critical to begin your EPM implementation with the end goals in mind. A clearly articulated strategy, with ties to the departmental and individual goals, is the roadmap required to enable a successful implementation. If each department is enabled to drive its own part of the implementation without a tie to the overall corporate vision, the departmental agendas may be achieved, but the overall achievement of strategy likely will fail. Tying day-to-day operations to the organization’s strategy is critical to the success of the EPM initiative.
Stakeholders and executive sponsors working with EPM initiative leaders can help to ensure that the vision and strategy have been clearly visualized and articulated, enabling leaders to prioritize the phases of implementation to ensure the largest payback and adoption rate while addressing the most pressing business issues.
Know Your Systems: Apply Technology with Wisdom
Implementing an EPM system is more than just buying technology. If the implementation is viewed as strictly a technology exercise, it likely will fail. If the initiative leaders and/or their IT partners have not done their homework, they might try to take this path and simply call on their favorite vendors to be sold the systems that they do not have.
The importance of technology is not to be understated, however. A paper-based or nonintegrated EPM system also likely will fail. A better approach: assess your existing systems and match them to your EPM requirements (detailed in the project plan). Where you lack the
BI & EPM: The Oracle Guide to Management Excellence
162
necessary technology to enable a performance-based culture, consider purchasing new technology.
Numerous technology companies have many solutions to fit countless situations. Research them thoroughly and ensure that they and their solutions are sound and proven.
EPM System Selection
System integration versus ease of use and functionality is the typical balancing act that business users and IT grapple with daily. For EPM to be successful, both must be considered and implemented equally.
Best-of-breed software typically has the best depth of functionality and pleasing user interfaces. But the big ERP systems tend to have tighter integration. So which is the right choice? EPM-focused vendors can provide both—and provide them in balance. These vendors also tend to empower business users by enabling them to do more-complex tasks through an end-user interface, reducing dependency on IT for mundane and time-consuming tasks and freeing up IT for more strategically focused initiatives.
But selecting the right EPM tool is critical. An organization must consider organizational/strategic and technical requirements and follow a selection process to ensure that it makes a good choice of vendors based on a broad view of the organization and its needs. The tool selected must offer the breadth, depth, and scalability necessary for the organization’s users to carry on its business. For most organizations, the next-generation planning technology must possess the following attributes:
Dynamic/real-time updates
Multi-tiered aggregation and granularity
Integration with enterprise applications and data sources
Translation between financial and non-financial metrics
Enhanced creation and management of what-if models
BI & EPM: The Oracle Guide to Management Excellence
163
Real-time display and communication of information.
The rapid adoption of EPM is fueled by a drive to empower the masses with powerful planning, reporting, and analysis tools. The EPM system should leverage the Web to provide a scalable, secure, and reliable EPM infrastructure.
Design
In the design phase, you should create design documents that summarize your organization’s business and technical vision as well as your deployment strategy. Because those responsible for building the application are usually different from those responsible for designing the system, the documentation (including detailed dimension architecture, detailed calculation design, project path with time line and resources) should be as comprehensive as possible.
The main components of the design phase:
An EPM component checkpoint
Designing the plan and environment for testing
Designing security
Designing the migration plan
Designing the training plan
Establishing rollout criteria
Build
After a complete design is discussed and documented, the next step is implementing the design:
EPM component checkpoint—Designing the deployment while considering all solutions being implemented
Implementing the application—Implement the design of the application detailed in the design phase
BI & EPM: The Oracle Guide to Management Excellence
164
Developing proof of concept (where it makes sense) —Create a proof of concept to validate certain functionality and distribute to a subset of the user community for testing and feedback. The conceptual proof can also be used for preliminary performance and scalability testing.
Implementing security—Implement the user setup and security assignments that were detailed in the design phase.
Developing support processes—Develop support processes to document the use of the application for users and administrative processes that help update and maintain the solution. The main components of the support processes are application, user, administrator, maintenance of hardware, and maintenance of software.
Create testing scripts—Create the testing scripts for the various types of testing scenarios that will be performed for functional, system, and performance testing.
Developing a training program—Identify resources and specifics for training and coordinate the training process.
Test
After building the application, you can start validating the solution to ensure that it meets the needs of the business and that the architecture of the environment can support the solution. You can use different types of tests to validate the solution. This phase must be completed so that the rollout phase can be initiated with full knowledge of the performance testing results. The main components of the testing phase:
EPM Communication Checkpoint—Designing the deployment while considering all solutions being implemented
Functional Testing—Ensuring that correct results are provided when executing calculations, data entry, report retrieval, consolidation, and so on.
System Testing—Performing an end-to-end process test to ensure that all of the individual components are compatible.
User Acceptance Testing (UAT) —Ensuring that the solution has met the needs of the users from a functional and performance perspective.
BI & EPM: The Oracle Guide to Management Excellence
165
Performance Testing—Determine whether the solution meets the performance goals that were highlighted in the design phase and ensuring that the appropriate hardware architecture has been implemented to support the solution.
Rollout
After the system has been tested to validate sizing and performance, it can be rolled out into production. To maintain optimal performance, the following must be monitored:
EPM Communication Checkpoint—Design the deployment while considering all solutions being implemented.
Training of End Users—Run the training scripts identified in the design and build phases.
Completing and Communicating Support Processes—Implement the support processes designed in the Build phase and communicate these processes to users and administrators.
Go Live Acceptance—Use the checklist in Table 1 for going live in the production environment.
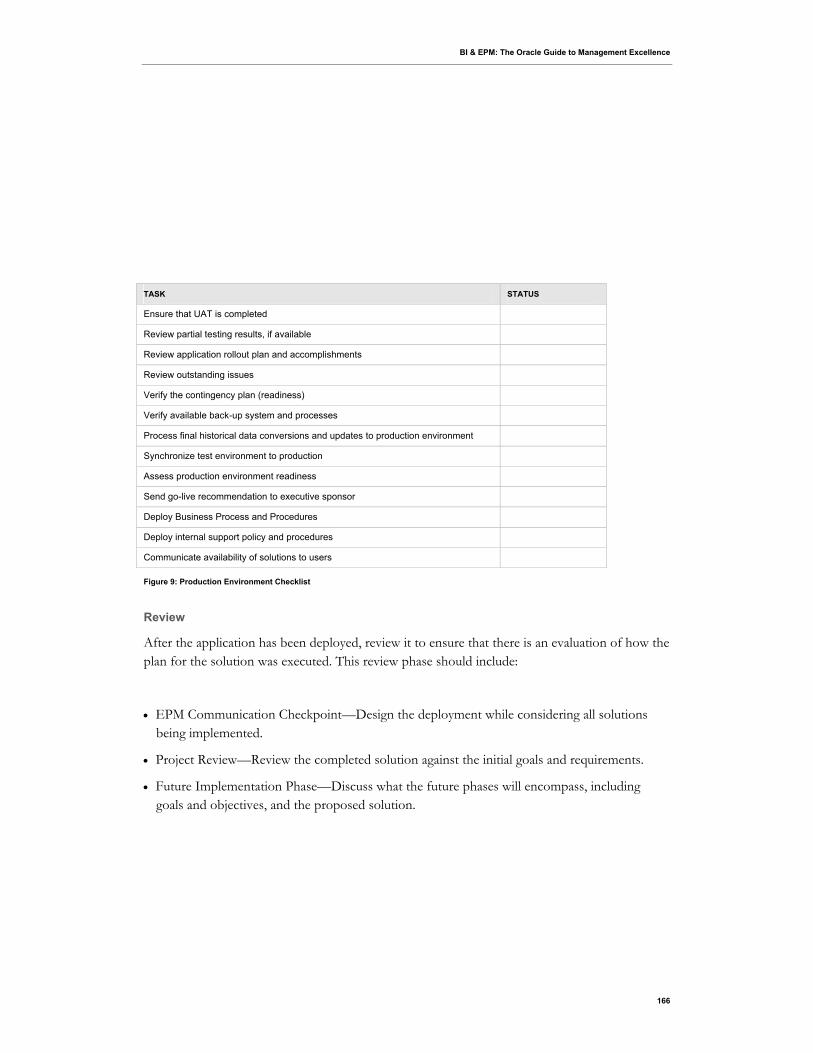
BI & EPM: The Oracle Guide to Management Excellence
166
Figure 9: Production Environment Checklist
Review
After the application has been deployed, review it to ensure that there is an evaluation of how the plan for the solution was executed. This review phase should include:
EPM Communication Checkpoint—Design the deployment while considering all solutions being implemented.
Project Review—Review the completed solution against the initial goals and requirements.
Future Implementation Phase—Discuss what the future phases will encompass, including goals and objectives, and the proposed solution.
TASK STATUS
Ensure that UAT is completed
Review partial testing results, if available
Review application rollout plan and accomplishments
Review outstanding issues
Verify the contingency plan (readiness)
Verify available back-up system and processes
Process final historical data conversions and updates to production environment
Synchronize test environment to production
Assess production environment readiness
Send go-live recommendation to executive sponsor
Deploy Business Process and Procedures
Deploy internal support policy and procedures
Communicate availability of solutions to users
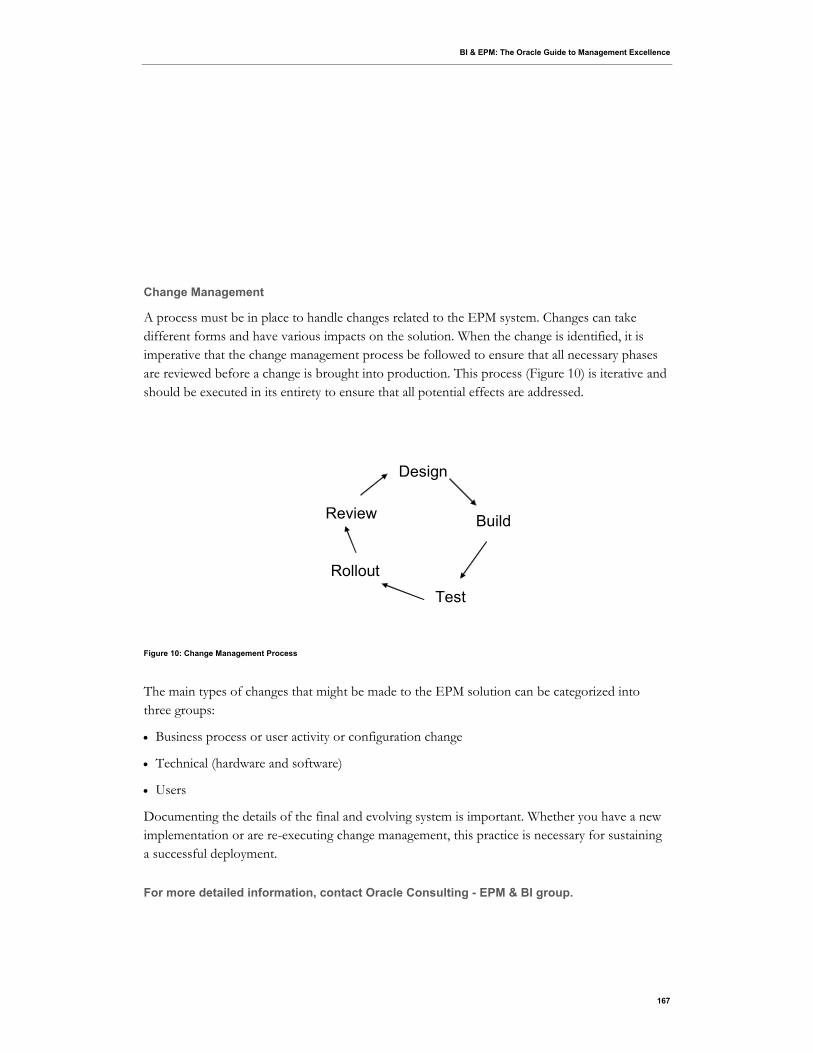
BI & EPM: The Oracle Guide to Management Excellence
167
Change Management
A process must be in place to handle changes related to the EPM system. Changes can take different forms and have various impacts on the solution. When the change is identified, it is imperative that the change management process be followed to ensure that all necessary phases are reviewed before a change is brought into production. This process (Figure 10) is iterative and should be executed in its entirety to ensure that all potential effects are addressed.
Figure 10: Change Management Process
The main types of changes that might be made to the EPM solution can be categorized into three groups:
Business process or user activity or configuration change
Technical (hardware and software)
Users
Documenting the details of the final and evolving system is important. Whether you have a new implementation or are re-executing change management, this practice is necessary for sustaining a successful deployment.
For more detailed information, contact Oracle Consulting - EPM & BI group.
Design
Build
Test
Rollout
Review
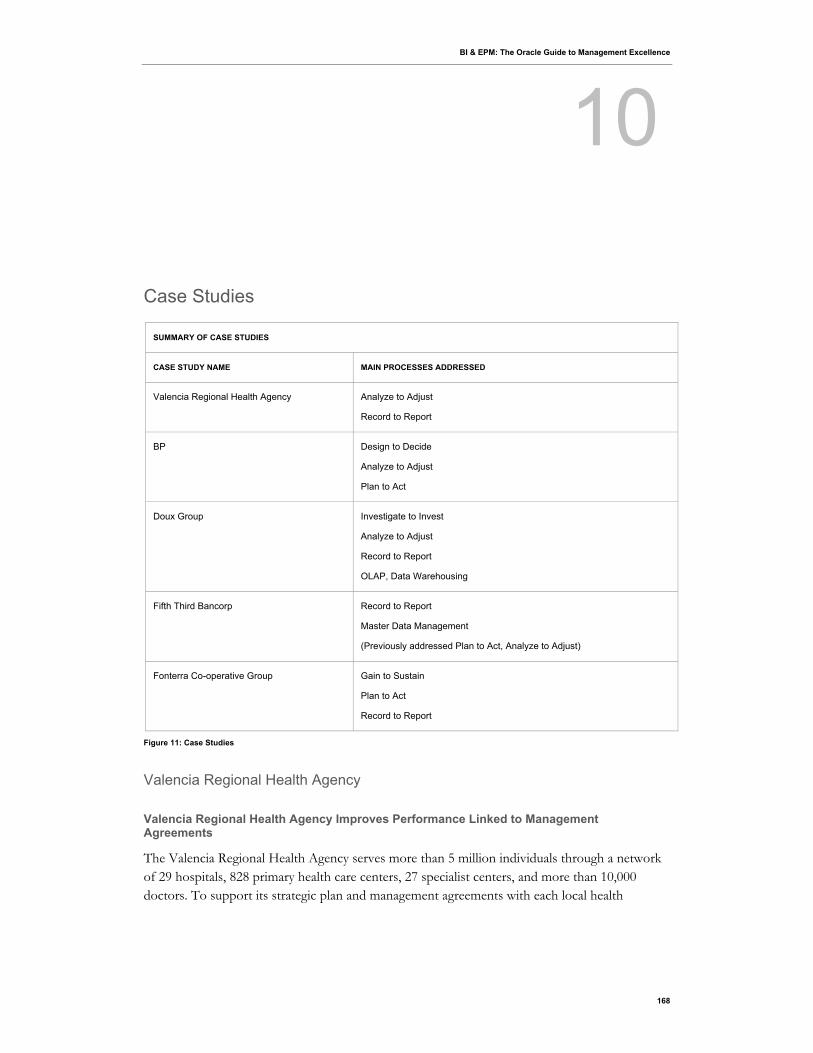
BI & EPM: The Oracle Guide to Management Excellence
168
Case Studies
SUMMARY OF CASE STUDIES
CASE STUDY NAME MAIN PROCESSES ADDRESSED
Valencia Regional Health Agency Analyze to Adjust
Record to Report
BP Design to Decide
Analyze to Adjust
Plan to Act
Doux Group Investigate to Invest
Analyze to Adjust
Record to Report
OLAP, Data Warehousing
Fifth Third Bancorp Record to Report
Master Data Management
(Previously addressed Plan to Act, Analyze to Adjust)
Fonterra Co-operative Group Gain to Sustain
Plan to Act
Record to Report
Figure 11: Case Studies
Valencia Regional Health Agency
Valencia Regional Health Agency Improves Performance Linked to Management Agreements
The Valencia Regional Health Agency serves more than 5 million individuals through a network of 29 hospitals, 828 primary health care centers, 27 specialist centers, and more than 10,000 doctors. To support its strategic plan and management agreements with each local health
10
BI & EPM: The Oracle Guide to Management Excellence
169
department, the agency created the Integrated Management System by Objectives (SIDO22) project, supported on its corporate data warehouse—which is the central repository for health department data.
Challenges
Provide the 22 local health departments with the means to track and monitor compliance of the management and development objectives
Align strategy between agency central services, the agency’s 22 decentralized departments, and their employees
Standardize sets of comparable indicators for key processes
Facilitate improved employee performance, and gain the ability to link to performance to pay
Obtain a single overview of the state of the agency through reports and balanced scorecards for directives
Solutions
Worked with a consultant to implement Oracle’s Hyperion enterprise performance management applications to enable each department to manage its own objectives, as well as agency-wide objectives
Developed 104 management indicators
Enabled development of 87 balanced scorecards and dynamic reports and their integration with 15 of the agency’s information systems
Enabled the agency to track management agreement indicators to assess compliance with objectives, and facilitated decision-making and the adoption of corrective measures
Increased workforce equality by facilitating alignment between departments and comparing each department’s results
Enabled a management-by-objectives system with associated evaluation mechanisms that serves as a basis for an effectively differentiated pay scale
Facilitated internal transparency and competition between departments, fostering performance improvement
BI & EPM: The Oracle Guide to Management Excellence
170
BP
Probabilistic Forecasting Solution Helps BP Manage Oil Field Costs and Risks
Founded 100 years ago this year, BP is both a pioneer of the oil industry and one of its leading innovators. The UK-based company has active exploration and production projects in 25 countries, and pumps about 5% of the world’s oil production. It owns 18 refineries and more than 24,600 service stations in 100 countries. While launching some of the most technically ambitious oil and gas projects anywhere, it’s also going ‘Beyond Petroleum’ by forging new markets in alternative energy and green technologies. Oil and energy markets have been going through dramatic changes in recent years. Crude supplies are becoming harder to find outside areas controlled by national oil companies, forcing private-sector oil companies like BP to reach into some of the most remote corners of the earth, and drill to depths never thought possible before. New technologies have been deployed to exploit hard-to-reach reservoirs and to increase recovery rates at existing fields.
The more adventurous projects, however, also come with steeper price tags and longer lead times. Offshore platforms, for example, can cost US$1 billion or more to bring online, and take from five to 10 years to go from discovery to production. Given the enormous capital at stake, it’s not surprising that BP invests heavily in systems and tools that help the company get a handle on oil field costs and timelines, and better understand and manage the risks involved. One of the company’s most important tools employs state-of-the-art probabilistic techniques – also known as Monte Carlo analysis – that predict costs and time with remarkable effectiveness.
BI & EPM: The Oracle Guide to Management Excellence
171
Probabilistic Forecasting Solution
After experimenting with a number of probabilistic forecasting solutions, BP adopted an easy-to-use application called Crystal Ball, one of a suite of business intelligence applications from Oracle. Today, roughly 500 engineers in more than 20 countries use the application to forecast time and costs for the vast majority of its big oil projects (approximately 90% of all new wells by overall value). BP spends upwards of US$5 billion each year on oil and gas well development projects.
According to Hugh Williamson, Risk and Cost Advisor in BP’s Drilling and Completions function, the application, along with the collaboration it fosters, plays a crucial role in the early and middle phases of an oil field’s development, giving BP a competitive edge in financial planning, project scheduling and above all, risk management. “Probabilistic forecasting is involved in every major investment decision that we make for wells,” Williamson says. “What’s more, it increases our ability to deliver projects on time and on budget – a big plus when partnering with governments of oil-producing countries or with other operators.”
How It Works
Crystal Ball software works in combination with a conventional Excel spreadsheet to help users develop sophisticated time-and-cost estimates. The key is the application’s probabilistic or Monte Carlo statistical methods that quantify uncertainty by incorporating expert judgments about the range and likelihood of outcomes in the real world.
Key Benefits
Gained clear understanding of oil field costs and schedule risks
Enabled productive conversations among engineers about likely project outcomes
Enabled company to focus on risk areas that can generate the greatest cost and time overruns
Protected reputation of company for delivering projects on time
Supported accurate financial planning at the corporate level
BI & EPM: The Oracle Guide to Management Excellence
172
The probabilistic techniques embedded in the application are uniquely suited to capturing the range of variables that oil projects face – from bad weather and equipment malfunctions to surprises in geology and in the number and types of wells needed to fully exploit a reservoir. “It’s a method that allows us to incorporate our understanding of risk and uncertainty directly into the estimate,” says Williamson. “So if we think there’s a 20% chance of a drilling operation being hit by a hurricane – which might cost us between 10 and 50 days per well – we can put this information directly into the estimate.
Spreadsheet Approach
BP’s spreadsheet-based approach appeals to the hundreds of engineers who build the forecasts. “Engineers love spreadsheets,” Williamson says. “This application is intuitive and engineers can pick it up quickly. I can teach people the fundamentals of how it works in less than 20 minutes.”
Focusing on the Right Risks
Punching numbers into a Crystal Ball-powered spreadsheet is only one part of an estimation project, Williamson adds. The overall process or “roadmap” encompasses a series of tasks, including initial planning, data gathering and computing, and finally validating and using the results.
BP engineers often perform several estimates in the course of an oil field development project: an early forecast that necessarily contains higher degrees of uncertainty; and several follow-ups that are more accurate as engineers eliminate many of the unknowns, such as daily rates for rigs and boats.
BP’s estimators often make use of data on the past performance of similar wells – but that’s not always possible. Cutting edge projects may involve new technologies and techniques that lack precedents.
The advantage of this technology lies in helping estimators home-in on risks that could deliver the biggest surprises. To help isolate major risk areas, BP engineers utilize ‘Sensitivity Chart’

BI & EPM: The Oracle Guide to Management Excellence
173
function. “It identifies which risks add the most uncertainty in outcome,” Williamson says. “These are the ones we should pay the most attention to.”
Stimulating Conversations
Despite the temptation, Williamson is careful not to automate the forecasting process too much. “Outputs are worthless if the inputs haven’t been properly thought through,” he says. Using the probabilistic approach, by requiring estimators to gauge the likelihood and range of outcomes, stimulates productive dialogues among engineers and other experts. “We want those conversations to happen,” he says. “The results of those conversations can be input directly into the front end of the application.”
Lately those conversations have revealed the growing complexity of the oil exploration and development business. Says Williamson: “There’s not much easy oil left, and to get at it, we need to develop some pretty complex, pretty risky projects, and our goal is to execute them better than the competition.” Risks can emerge from places that are hard to predict, he adds. “It’ll be hurricanes in one place, steel prices in another place, and a change of scope in a third place.”
When the time-and-cost estimates have been finalized, they are typically incorporated into a management report known as a “decision support package” which is scrutinized by key decision-makers in the company. On the basis of the report, the company may order more studies on the field, or green light further drilling and development. “Senior management wants to know how much projects are going to cost and how soon they’re going to get their money back,” he says.
With oil and gas only getting tougher to find, Williamson sees continued robust demand for sophisticated estimation solutions. “Projects are going to continue getting more complex and more expensive and more challenging,” he says, “and we have to be up for that challenge and find ways of understanding and communicating that risk and complexity up front.”

BI & EPM: The Oracle Guide to Management Excellence
174
Advice from BP
Keep it simple: “One of the challenges is to not let the spreadsheet template get too complicated, making it unusable by most engineers.”
Offer continuous training and support, and tool development
BP is one of the world’s largest energy companies, providing its customers with fuel for transportation, energy for heat and light, retail services and petrochemicals products for everyday items.
Doux Group
Doux Group Accelerates Global Expansion through Enhanced Business Analysis
An expert in poultry since its founding in 1955, Doux Group and its subsidiaries offer poultry products in more than 130 countries. The group owns a portfolio of globally recognized brands, including Doux, Frangosul, Lebon, Père Dodu, Supreme, Le Janzé, Alsabia, and Guts-Gold.
With more than 14,500 employees and 12 food factories in five countries, Doux operates and oversees the processing of more than 1.1 million tons of bird and poultry-based processed goods annually.
In the midst of corporate diversification–and fighting the ill effects of a global bird flu scare–Doux needed to analyze the profitability of its entire enterprise on a monthly basis. Doux implemented Oracle’s Hyperion Financial Management to completely redesign its reporting and consolidation systems. Using consistent, reliable financial data, Doux can now make faster, more accurate decisions about growing its global business.
BI & EPM: The Oracle Guide to Management Excellence
175
Complex Processes Require Robust Solution
Doux is the only poultry product manufacturer in recent years to successfully diversify its range, expand its global presence, and enhance its supply and distribution network. To support its diversification, Doux must closely monitor its economic and financial performance.
Doux initially attempted to meet its analytical needs by building an Excel-based reporting tool. But the group’s complex processes made it impossible to conduct profitability analysis more than twice a year. Meanwhile, a global bird flu scare sent Doux’s profits tumbling– creating additional pressure to analyze and enhance group profitability.
“We needed to answer questions about the profitability of our product ranges, customers, and countries,” said Marc Diot, corporate controlling director, Doux Group. “But our Excel-based system couldn’t handle the complexities of our product codes, countries, data sources, allocation rules, and intra-group exchanges.”
Monthly Profitability Reports Now Available
By synchronizing operational analysis and financial reporting, Doux’s new solutions enable the group to communicate accurate, consistent monthly performance information across the enterprise. Every six months, Doux reconciles management data with financial data resulting from legal consolidation. During this process, their new system helps ensure consistency across all reporting.
Doux has also implemented a multi-dimensional application that links to its reporting solution and generates weekly analyses of key indicators, such as stock and sales. “Automating our processes has allowed us to create a comprehensive monthly analysis of our gross profit and EBITDA per product range, market, and key account,” said Diot. “The results from these analyses allow us to define target groups for newly launched products and new markets.” “Automating our processes has allowed us to create a comprehensive monthly analysis of our gross profit and EBITDA per product range, market, and key account,” said Diot. “The results
BI & EPM: The Oracle Guide to Management Excellence
176
from these analyses allow us to define target groups for newly launched products and new markets.”
Saving Time, Improving Credibility
Doux has now built a solution that fulfills operational needs while also integrating powerful financial intelligence features. The system’s Web architecture increases efficiency by allowing Doux’s branches to analyze data for local decision-making processes. This new system has enhanced the accuracy of Doux’s financial information by letting the group manage document creation centrally.
Implementation Process
Within six months, Doux redesigned its reporting tool and consolidation tool by going live on the financial management module. Consultants facilitated the implementation and helped Doux’s employees become productive on the new solutions within a short timeframe.
Doux feeds its new solutions with information from multiple sources. Financial data comes from accounting tools across the group, for example. Doux has synchronized this data to enable consistent analysis at the group level, which is essential in monthly management reporting and quarterly legal consolidation. Operational data flows in from a newly-consolidated data warehouse that allows Doux to segment its data for more precise analysis.
“Hyperion software helps our management team devote more time to data analysis, rather than data production,” said Diot. “We
also have greater confidence in our decision-making data. That’s part of the reason we were able to recover quickly from bird flu
and defend our industry lead.”
“Oracle’s Hyperion software enabled us to form a new data group so that we can analyze our profitability by brand,” said Diot.
“We’ve also automated our data interfaces with Oracle’s Hyperion Financial Management, which means we have eliminated the
manual data capture activities we previously had to perform.”
BI & EPM: The Oracle Guide to Management Excellence
177
The Doux Group provides poultry and processed poultry products, including fresh and frozen products, whole or cut-up poultry, and processed products. The company sells its products in more than 130 countries in five continents.
Fifth Third Bancorp
Fifth Third Bancorp Increases Financial Visibility across Businesses for Increased Efficiency
Fifth Third Bancorp is a Fortune 500 company and diversified financial services company headquartered in Cincinnati, Ohio. The company has provided quality financial products and services to its customers for almost 150 years. One of the largest banks in the United States by asset size and market capitalization, Fifth Third Bancorp operates five main businesses: Commercial Banking, Branch Banking, Consumer Lending, Investment Advisors, and Fifth Third Processing Solutions.
The company drives revenue and quality loan and deposit growth by adding new customers, increasing market share, and striving to meet the financial services needs of its six million customers. As a result, the company has grown to almost $100 billion in assets and operates 18 affiliates with 1,161 full-service banking centers primarily in the Midwest and Florida– including 109 Bank Mart locations inside select grocery stores and 2,104 Jeanie ATMs.
Faced with the need to improve decision making, reporting, and planning during a period of rapid expansion via organic growth and acquisition, Fifth Third Bancorp turned to Oracle’s Hyperion applications to build an Enterprise Performance Management (EPM) infrastructure solution to accommodate growth. Thanks to Hyperion products, the company is improving its processes while increasing accountability and transparency, revenue and costs predictability, flexibility, and scalability.

BI & EPM: The Oracle Guide to Management Excellence
178
Ensuring Data Management Consistency
Acquisitions can wreak havoc on a company’s data consistency. For example, Fifth Third Bancorp’s 2001 Old Kent Bank acquisition, which was approximately a third of Fifth Third Bancorp’s size, caused a massive explosion in the number of general ledger data points. At one time, Fifth Third Bancorp had more than 2.5 million data points, along with 30 to 40 new financial accounts per month. With no single group overseeing master data hierarchy consistency across all systems, employees manually entered master data hierarchy changes monthly–a costly and time-consuming process.
In addition, the company’s data environment contained vast interdependencies and implications among individual systems. The general ledger included more than 11,000 cost centers and 2,500 accounts that represented more than one million open relationships and more than 100 companies. Within Hyperion business intelligence applications, this translated to approximately 20,000 entities–more than one million entities when including duplicate hierarchies.
Senior management recognized the need to address the inconsistencies and established a new Financial Systems Support Group. In addition to managing master data hierarchies, the group oversees new cost centers, companies, and accounts added to the general ledger or other financial systems.
The group developed a rigorous workflow-based submission and review process, which included a formal review board – with representatives from the regulatory, tax, general accounting,
Key Benefits
Provided consistent dimensional data across various systems
Reduced costs via centralized maintenance of enterprise dimension changes across systems
Enabled consistent and timely enterprise reporting
Made officers more accountable via increased data transparency
Provided platform to accommodate growth and manage change easily
Eliminated inconsistencies throughout integrated system applications

BI & EPM: The Oracle Guide to Management Excellence
179
finance, and financial systems groups–to eliminate duplicate, immaterial, or inappropriate cost centers and accounts. The group also ensures approved accounts and cost centers are managed in the correct hierarchies. This process reduced account additions 75%.
The group used Hyperion Data Relationship Management as the catalyst for establishing and improving processes. The application infrastructure is significant, as the group uses the technology to manage change across all financial master data hierarchies–including cost centers, entities, companies, as well as their respective relationships, attributes, and properties.
Addressing Data Hierarchy Challenges
The reporting and consolidation system served three significant but separate purposes (internal management reporting, external reporting, and regulatory reporting) with only one application. Each purpose had diverse functional requirements. As a result, the effort to meet each functional requirement through only one application failed to meet any one purpose effectively.
Additionally, there were multiple master data owners and versions. No single group owned management of the data hierarchies, making it impossible to ensure data consistency through single cost center and account definitions. In addition, the data-capturing methodology favored a general ledger orientation, which eliminated the ability to provide background details regarding key drivers and assumptions.
An affiliate might invest time into modeling how many new loans needed to be generated with specific rate assumptions to calculate a commercial loan portfolio general ledger number. However, there was no way to retain the assumptions that went into the planning calculation.
Without the ability to capture such information, it was difficult to compare affiliates.
BI & EPM: The Oracle Guide to Management Excellence
180
Automated Master Data Synchronization across Multiple Systems
Numerous systems share master data, including the SAP human resources system, multiple Hyperion Essbase cubes, Oracle financial services applications (FTP and allocation system), several Hyperion business intelligence applications, and three Hyperion Planning applications. Master data is also fed indirectly into an IBM DB2 data warehouse and into the Westport compensation system. Hyperion Data Relationship Management enables Fifth Third Bancorp to manage monthly data updates across multiple systems easily.
Fifth Third Bancorp has more than 80 master data hierarchies with more than 450 applicable attributes, which one or more downstream systems may use. The data relationship management’s robust business rules engine, inheritance, and derived calculation capabilities makes it easier for Fifth Third Bancorp to maintain those attributes consistently across all hierarchies.
“We had more than two million data points in our chart of accounts. If you’re familiar with trying to manage that size of an
accounting structure, it was unwieldy,” said Bret Furtwengler, vice president, Financial Systems, Fifth Third Bancorp. “So the
first thing that we did was to put in a formalized process just to request new accounts. We put in an actual board of review if you
wanted to have a new account added. And it was great for Sarbanes Oxley. On top of that, we created one version of the truth
on our metadata. Everyone comes to our data relationship management product to get the financial hierarchy.”
“We manage arduously to ensure there is consistency across all systems from our general ledger to business intelligence
applications, to our planning application, to our dashboards that link to SAP and Oracle data,” Furtwengler said. “All these
systems use the standard hierarchy. From my past experience, Hyperion Data Relationship Management makes my life 10
times easier.”
BI & EPM: The Oracle Guide to Management Excellence
181
Centralized Master Data, Distributed Change Management
Having a data relationship management tool enables Fifth Third Bancorp to empower business users and distribute responsibilities for managing master data change, making the process much more efficient, while the Financial Systems Support Group maintains process control. There are three central administrators, approximately 40 “light” administrators, and 20 view-only users.
For example, the Retail group has 19 administrators each manage master data structures from remote locations. Some master data changes–such as sales organization changes– originate in the different business areas, not the Financial Systems Support Group.
Improved data duality and consistency are key new system benefits. Previously, different groups presented the same information types, but reports were not consistent because the data originated from different sources. The Financial Systems Support Group forced a common answer among the groups to the same set of questions by using Hyperion Data Relationship Management to implement common definition sets and data views.
Achieving a Closed Loop Performance Process
Fifth Third Bancorp’s enterprise performance management vision is the integration of operational analytics and financial analytics (and eventually the incorporation of workforce analytics, sales force analytics, and marketing analytics) with the objective of monitoring, measuring, and improving its overall performance.
“Of those 450 plus attributes, we now only need to enter less than ten of them manually. All the rest are derived, defaulted, or
inherited, which is pretty incredible when you think about it,” Furtwengler said.
“The whole bottoms-up top-down process is integrated like never before,” Furtwengler said. “When we present information to
the various affiliate presidents and to corporate, we are not presenting two different stories. Now, all groups, whether they are
the lines of business, human resources, corporate, or treasury, look at and see the same numbers. Hyperion provides Fifth
Third Bancorp with a single version of the truth, which gives us a holistic look at our business. This is huge.”
BI & EPM: The Oracle Guide to Management Excellence
182
Fifth Third Bancorp is a Fortune 500 diversified financial services company that manages $99.8 billion in assets. Headquartered in Cincinnati, Ohio, Fifth Third Bancorp operates 18 affiliates with 1,161 full-service Banking Centers primarily in the Midwest and Florida– including 109 Bank Mart® locations inside select grocery stores and 2,104 Jeanie® ATMs.
Fonterra Co-operative Group
Fonterra Co-operative Group Establishes Global Financial Visibility, Enhances Strategic Planning
Fonterra Co-operative Group is a leading multinational dairy company owned by 11,600 New Zealand dairy farmers. Its global supply chain connects shareholders’ farms in New Zealand to customers and consumers in 140 countries.
Collecting approximately 3.4 billion gallons of milk per year, Fonterra manufactures and markets more than two million tons of dairy products annually, making it the world’s leader in large-scale milk procurement, processing, and management.
Fonterra needed a financial system that could increase efficiency across its rapidly expanding operations. Oracle’s Hyperion Financial Management enables Fonterra’s global employees to
“In my opinion, there is no such thing as an IT project–there are only business initiatives that are supported by technology
solutions,” Furtwengler said. “Our aim is to get to a truly closed loop performance process, which means translating executive-
level goals into department-level metrics. Metrics cannot be effectively defined or at a minimum be enforced unless there is
executive buy-in to the definition process coupled with technology to enforce standardization. Many technology solutions
support the measurement, however, business performance management is about moving from measurement toward
management. Integration of existing systems is a key component of this effort. Hyperion applications are at the center of our
plans toward closed loop performance management.”
BI & EPM: The Oracle Guide to Management Excellence
183
save results to a centralized database–eliminating the need to e-mail files. Fonterra now creates multiple budget and forecast scenarios that help project and enhance future performance. Moreover, all employees are now working on the same system, looking at the same data, at the same time.
One Database for Greater Visibility
Powered by thousands of small dairies, Fonterra is a rapidly growing multinational company with hundreds of financial entities and dozens of company accounts. Recognizing its need to eliminate the inefficient manual tasks associated with its legacy financial system, in 2003 Fonterra set forth to simplify and standardize its business systems. A key step to achieving this priority was the development of a single, global chart of accounts and a centralized Web-based system.
Flexible Forecasting, Stable Reporting
Soon after implementing our financial management system, Fonterra prepared its 2005 budget with a minimal learning curve. From there, the company progressed to actuals reporting, statutory reporting, and forecasting. Fonterra’s new forecast model gives the company the flexibility to copy year-to-date actuals into the forecast scenario and then let business units populate the forecast for remaining periods of the year.
“Prior to Hyperion, our financial system operated on a distributed database, which meant that to update the numbers at our
headquarters, we had to send in files from all of our regions,” said Grant Foster, system lead, Fonterra Co-operative Group. “As
our company grew, this process became convoluted and time-consuming. We wanted to transition to a solution that would work
in all regions but let us maintain a single, centralized database in New Zealand.”
“We now create multiple budget and forecast versions,” Foster said. “Our people have the flexibility to take the original numbers
the board has approved and build different scenarios based on changing exchange rates or business restructuring. Once we
have all versions loaded, we can see one reporting total in the new system.”

BI & EPM: The Oracle Guide to Management Excellence
184
Fonterra is now rolling out a three-year business plan that will take the latest data for all business entities and copy it into the first quarter of the year to establish opening balances. Starting with that data, the entities will then forecast the next three years to show where the business is heading.
Live Data Streamlines Closing Process
Fonterra is now reaping the benefits of using a single, centralized financial system. Fonterra’s legacy system required employees to wait for files to be sent back to New Zealand before anyone could view inter-company mismatches. The new system makes mismatches visible around the world as soon as data is submitted.
Award Winning Efficiency and Results
Having accelerated the consolidation process, Fonterra now delivers higher quality information to management in less time. The organization produces board reports with Hyperion Financial Management Excel add-in functionality and employees use Hyperion Reports formats to drill down and analyze the data. Meanwhile, the company has reduced the accounting workload at its headquarters.
“We now have multiple versions of budget and forecast, actuals, and fixed year reporting,” Foster said. “We also have a module
that will help us transition to IFRS reporting. As we’ve progressed, Hyperion has proven to be a stable reporting platform.
Whether you press ‘consolidate’ once or 100 times, it always comes back with the same correct answer.”
“With Hyperion Financial Management, we have much greater visibility into our balances, Foster said. “Users can fix their own
mismatches and resubmit the numbers. We’ve knocked at least two or three days off the month-end timetable while increasing
data quality at the same time.”
BI & EPM: The Oracle Guide to Management Excellence
185
After transforming business processes in a relatively short period of time, Fonterra’s
Hyperion Financial Management team received the company’s CEO award for delivering uncompromised results. All of Fonterra’s 17,000 global employees are eligible for the CEO award, which highlights notable improvements in efficiency, processes, time savings, and related areas.
Implementation Process
To ensure a successful implementation, key employees from Fonterra held critical positions on the project team, enabling them to provide input that ensured the solution would meet Fonterra’s business needs.
Fonterra tackled the challenge of training a far-flung workforce by gathering “super-users” in New Zealand for training sessions. From there, the super-users returned to their home regions to train their staff. Today, employees can turn to these local experts for speedy, knowledgeable answers–easing the burden on Fonterra’s IT staff.
Fonterra Co-operative Group is an international dairy company responsible for more than one third of international dairy trade. The company, owned by 11,600 New Zealand dairy farmers, generates nearly US$10 billion in annual revenue.
The case studies in this section were all adapted from the Oracle Reference Guide Information for Success: Enterprise Performance Management & Business Intelligence, December 2008.
“We haven’t increased the size of our team, but we’ve increased the functionality we use within the system,” Foster said. “As a
result, we’re providing information more efficiently with value-added analysis. That is having a significant impact on our
company.”
BI & EPM: The Oracle Guide to Management Excellence
186
Capabilities and Component Matrix
Management Excellence Capabilities
Now that each process has been explained, let’s look at the capabilities needed to achieve each process. As can be seen in Figure 12, each management process often requires more than one capability since there are multiple, possible steps within each process. This is why there are overlapping capabilities in Figure 12. Also, for each organization, the requirements likely vary slightly causing even more capabilities to overlap. In the example shown in Figure 12, the management process Gain to Sustain requires the capabilities of “External reporting” and “Strategic and Predictive Modeling”. Investigate to Invest requires “Strategic and Predictive Modeling” capabilities as well, and also “Integrated Business planning”. The process Design to Decide has the same requirements as Investigate to Invest – although perhaps in different amounts and in a different order.
The next two processes, Plan to Act and Analyze to Adjust both make use of “Profitability and Cost Management” capabilities as well as “Scorecarding, Monitoring and Analysis”. In addition, Plan to Act makes use of “Integrated Business planning” capabilities where Analyze to Adjust needs “Financial and Management Reporting”. Finally, the Record to Report process typically needs heavy use of “Financial and Management Reporting” capabilities, but often also uses “Scorecarding, Monitoring and Analysis”.
Supporting all of the management processes, are the underlying capabilities of: Governance, Risk, and Compliance; BI Tools and BI Applications, Real-Time Monitoring; OLAP, Data Warehouse, Data Mining; Data Integration, Application Management and Master Data Management. These supporting capabilities typically span all of the management processes.
11

BI & EPM: The Oracle Guide to Management Excellence
187
Figure 12: Management Excellence Capabilities
Keep in mind, different organizations may need additional capabilities for some of the management processes. For example, the scorecarding capability might be used in the Gain to Sustain process in order to create stakeholder or supplier scorecard reporting. The capability matrix shown is meant only as a guideline as each organization has unique requirements.
EPM is widely positioned as a management discipline of strategic importance. But it cannot serve a strategic role if it is confined to the back office. In order to be effective, EPM must be applied throughout the organization. It should support strategic decision making, not just tactical management execution. It should reach beyond providing internal management information to support stakeholder management. It should encompass operations as well as finance; and all of these steps must be taken together. In this way, EPM becomes the glue that aligns the Management Excellence framework.
In figure 13, the core capabilities of the Management Excellence framework are listed, as well as a high-level breakdown of the capabilities and a list of possible Oracle/Hyperion EPM modules
Gain to Sustain
Investigate to Invest
Design to Decide
Plan to Act
Analyze to Adjust
Record to Report
EXTERNAL REPORTING
INTEGRATED BUSINESS PLANNING
PROFITABILITY & COST MANAGEMENT
SCORECARDING, MONITORING & ANALYSIS
FINANCIAL & MGMT REPORTING
OLAP, DATA WAREHOUSE, DATA MINING
DATA INTEGRATION, APPLICATION MANAGEMENT & MASTER DATA MANAGEMENT
STRATEGIC & PREDICTIVE MODELING
BI TOOLS & BI APPLICATIONS, REAL-TIME MONITORING
Gain to Sustain
Investigate to Invest
Design to Decide
Plan to Act
Analyze to Adjust
Record to Report
GOVERNANCE, RISK & COMPLIANCE
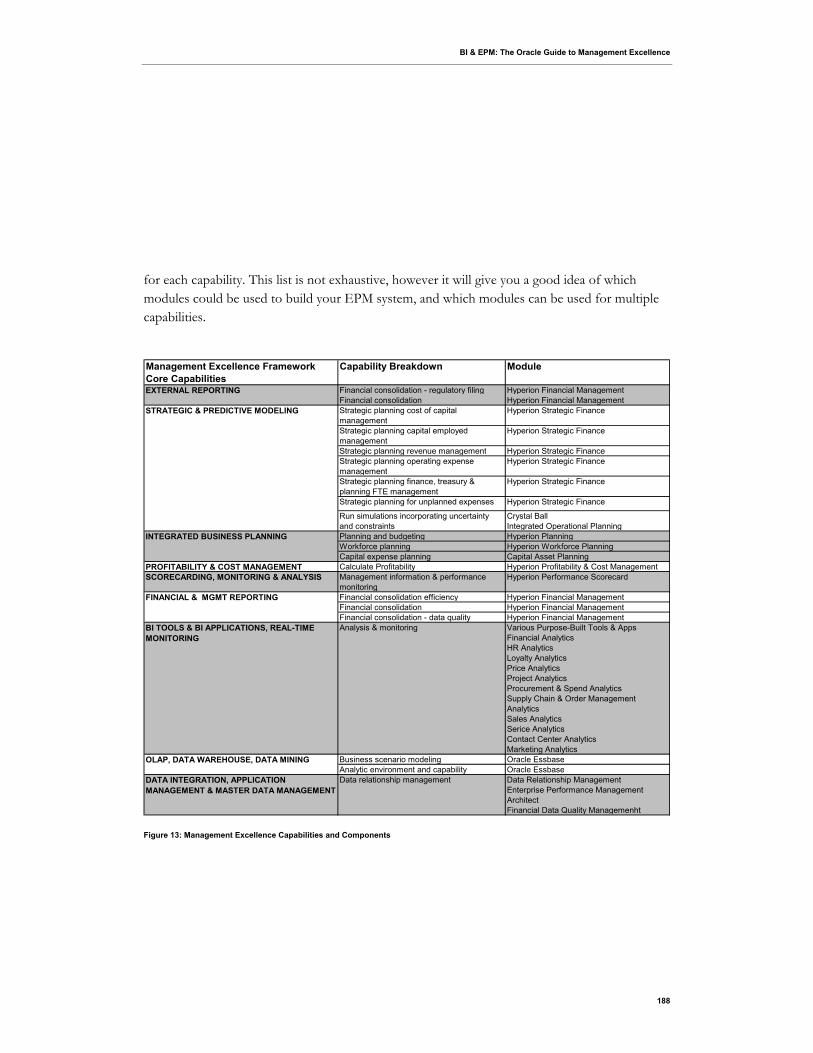
BI & EPM: The Oracle Guide to Management Excellence
188
for each capability. This list is not exhaustive, however it will give you a good idea of which modules could be used to build your EPM system, and which modules can be used for multiple capabilities.
Management Excellence Framework Core Capabilities
Capability Breakdown Module
EXTERNAL REPORTING Financial consolidation - regulatory filing Hyperion Financial ManagementFinancial consolidation Hyperion Financial Management
STRATEGIC & PREDICTIVE MODELING Strategic planning cost of capital management
Hyperion Strategic Finance
Strategic planning capital employed management
Hyperion Strategic Finance
Strategic planning revenue management Hyperion Strategic FinanceStrategic planning operating expense management
Hyperion Strategic Finance
Strategic planning finance, treasury & planning FTE management
Hyperion Strategic Finance
Strategic planning for unplanned expenses Hyperion Strategic Finance
Run simulations incorporating uncertainty and constraints
Crystal BallIntegrated Operational Planning
INTEGRATED BUSINESS PLANNING Planning and budgeting Hyperion PlanningWorkforce planning Hyperion Workforce PlanningCapital expense planning Capital Asset Planning
PROFITABILITY & COST MANAGEMENT Calculate Profitability Hyperion Profitability & Cost ManagementSCORECARDING, MONITORING & ANALYSIS Management information & performance
monitoringHyperion Performance Scorecard
FINANCIAL & MGMT REPORTING Financial consolidation efficiency Hyperion Financial ManagementFinancial consolidation Hyperion Financial ManagementFinancial consolidation - data quality Hyperion Financial Management
BI TOOLS & BI APPLICATIONS, REAL-TIME MONITORING
Analysis & monitoring Various Purpose-Built Tools & AppsFinancial AnalyticsHR AnalyticsLoyalty AnalyticsPrice AnalyticsProject AnalyticsProcurement & Spend AnalyticsSupply Chain & Order Management AnalyticsSales AnalyticsSerice AnalyticsContact Center AnalyticsMarketing Analytics
OLAP, DATA WAREHOUSE, DATA MINING Business scenario modeling Oracle EssbaseAnalytic environment and capability Oracle Essbase
DATA INTEGRATION, APPLICATION MANAGEMENT & MASTER DATA MANAGEMENT
Data relationship management Data Relationship ManagementEnterprise Performance Management ArchitectFinancial Data Quality Managemenht
Figure 13: Management Excellence Capabilities and Components
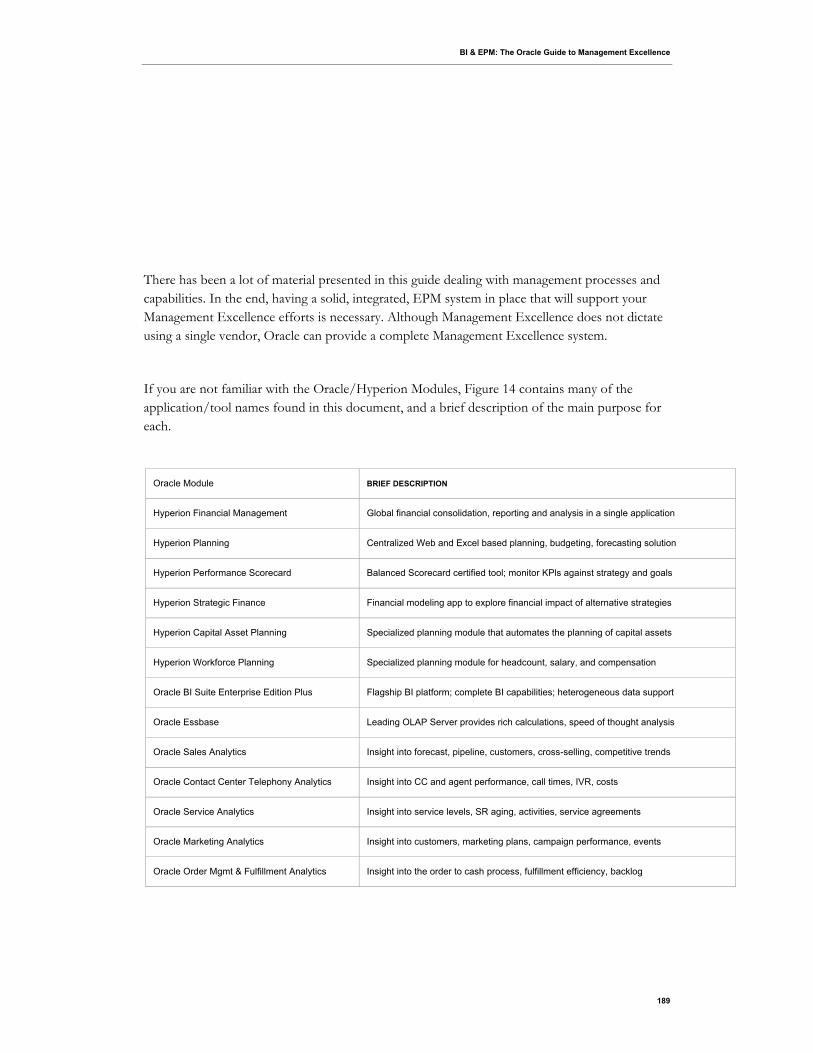
BI & EPM: The Oracle Guide to Management Excellence
189
There has been a lot of material presented in this guide dealing with management processes and capabilities. In the end, having a solid, integrated, EPM system in place that will support your Management Excellence efforts is necessary. Although Management Excellence does not dictate using a single vendor, Oracle can provide a complete Management Excellence system.
If you are not familiar with the Oracle/Hyperion Modules, Figure 14 contains many of the application/tool names found in this document, and a brief description of the main purpose for each.
Oracle Module BRIEF DESCRIPTION
Hyperion Financial Management Global financial consolidation, reporting and analysis in a single application
Hyperion Planning Centralized Web and Excel based planning, budgeting, forecasting solution
Hyperion Performance Scorecard Balanced Scorecard certified tool; monitor KPls against strategy and goals
Hyperion Strategic Finance Financial modeling app to explore financial impact of alternative strategies
Hyperion Capital Asset Planning Specialized planning module that automates the planning of capital assets
Hyperion Workforce Planning Specialized planning module for headcount, salary, and compensation
Oracle BI Suite Enterprise Edition Plus Flagship BI platform; complete BI capabilities; heterogeneous data support
Oracle Essbase Leading OLAP Server provides rich calculations, speed of thought analysis
Oracle Sales Analytics Insight into forecast, pipeline, customers, cross-selling, competitive trends
Oracle Contact Center Telephony Analytics Insight into CC and agent performance, call times, IVR, costs
Oracle Service Analytics Insight into service levels, SR aging, activities, service agreements
Oracle Marketing Analytics Insight into customers, marketing plans, campaign performance, events
Oracle Order Mgmt & Fulfillment Analytics Insight into the order to cash process, fulfillment efficiency, backlog
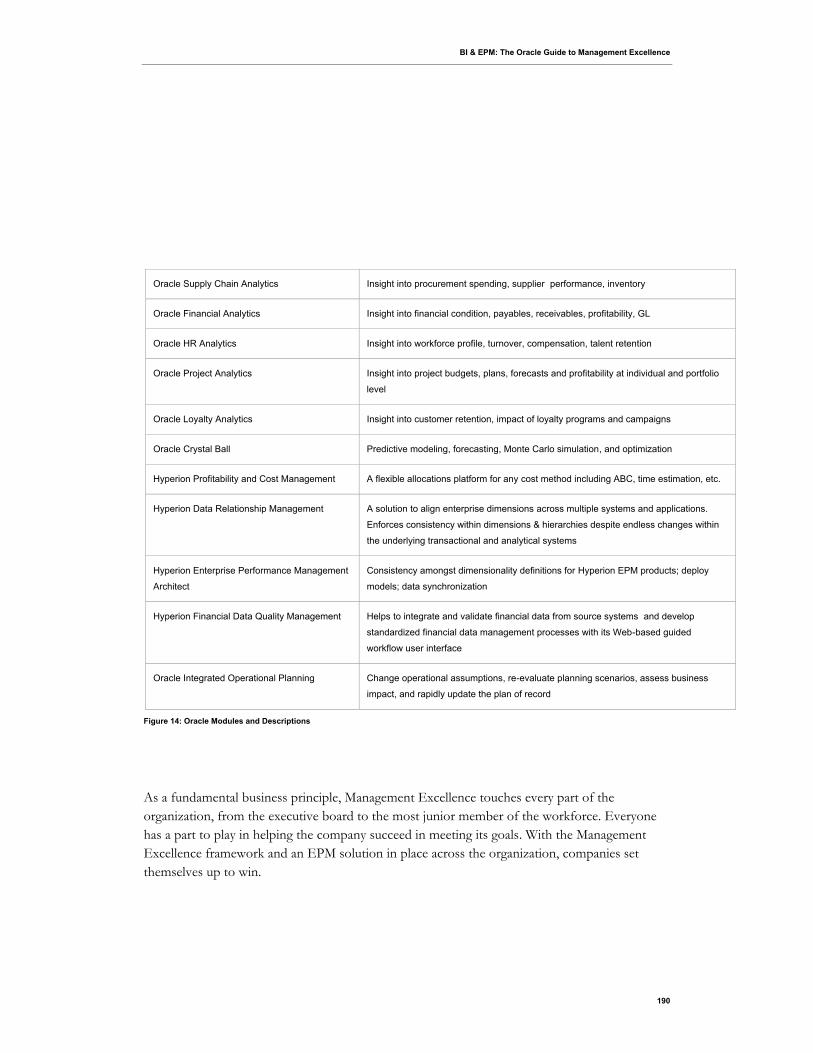
BI & EPM: The Oracle Guide to Management Excellence
190
Oracle Supply Chain Analytics Insight into procurement spending, supplier performance, inventory
Oracle Financial Analytics Insight into financial condition, payables, receivables, profitability, GL
Oracle HR Analytics Insight into workforce profile, turnover, compensation, talent retention
Oracle Project Analytics Insight into project budgets, plans, forecasts and profitability at individual and portfolio
level
Oracle Loyalty Analytics Insight into customer retention, impact of loyalty programs and campaigns
Oracle Crystal Ball Predictive modeling, forecasting, Monte Carlo simulation, and optimization
Hyperion Profitability and Cost Management A flexible allocations platform for any cost method including ABC, time estimation, etc.
Hyperion Data Relationship Management A solution to align enterprise dimensions across multiple systems and applications.
Enforces consistency within dimensions & hierarchies despite endless changes within
the underlying transactional and analytical systems
Hyperion Enterprise Performance Management
Architect
Consistency amongst dimensionality definitions for Hyperion EPM products; deploy
models; data synchronization
Hyperion Financial Data Quality Management Helps to integrate and validate financial data from source systems and develop
standardized financial data management processes with its Web-based guided
workflow user interface
Oracle Integrated Operational Planning Change operational assumptions, re-evaluate planning scenarios, assess business
impact, and rapidly update the plan of record
Figure 14: Oracle Modules and Descriptions
As a fundamental business principle, Management Excellence touches every part of the organization, from the executive board to the most junior member of the workforce. Everyone has a part to play in helping the company succeed in meeting its goals. With the Management Excellence framework and an EPM solution in place across the organization, companies set themselves up to win.
BI & EPM: The Oracle Guide to Management Excellence
191
Glossary
Ad-hoc Analysis An online analytical query created on-the-fly by an end user.
Balanced Scorecard A performance achievement framework developed by Robert S. Kaplan and David P.
Norton that required performance measurement systems to identify measures and
objectives related to four perspectives: financial, customer, internal process and leaning
and growth.
Business Intelligence Knowledge gained through the analysis of business information
Business Intelligence Tools The tools and technologies used to access and analyze business information. They
include tools for query and reporting; OLAP (online analytical processing); data mining
and advanced analytics; end-user tools for ad hoc query and analysis; and enterprise-
class query, analysis, and reporting, including dashboards, for performance monitoring
and production reporting against all enterprise data sources.
Consolidation
Process takes data from different systems and entities and possibly disparate formats,
and combines and aggregates that information to create a unified view.
Dashboard Application or custom user interface organizes and presents information in a graphical,
easy-to-read format. The information may be integrated from multiple components into a
unified display. A dashboard metaphor is useful for conveying the idea. The difference is
that in Enterprise Performance Management, the dashboard is interactive. A dashboard
helps monitor individual, business unit, and organizational performance and processes for
a greater understanding of the business.
Data Mart Data collection and organization system designed to work on a departmental level.
12

BI & EPM: The Oracle Guide to Management Excellence
192
Decision Support Business analytics presented in a format appropriate for use by executives in making
decisions; also called a decision support system.
Data Warehouse Data collection and organization system designed to work on an enterprise level.
Enterprise Performance
Management (EPM)
EPM is a management discipline that embraces and combines all management
processes.
EPM Center of Excellence
(CoE)
An EPM Center of Excellence is an organizational entity that groups interrelated skills,
experience, and domain expertise together to promote and deliver technology through a
consistent set of skills, standards, and best practices. It delivers repeatable, successful
deployments in a way that is beneficial to the entire organization rather than just a single
project.
ETL (Extract, Transform and
Load)
Technologies that extract raw data from a company’s data sources (for example,
transactional systems, databases, and so on) transform it into business terms and load it
into a data warehouse or equivalent system, where it can be accessed by end users to
analyze the business.
KPI (Key Performance
Indicator)
A measurement, or metric, that is included on a scorecard because it drives performance
achievement. Key performance indicators express objectives in financial units for
comparative purposes. Financial information can be used to compare results and thus
measure performance.
Management Excellence Management Excellence is a framework of defined management processes that, when
implemented well, achieves EPM.
Management Excellence
Framework
The Management Excellence framework is a conceptual structure designed to explain
each of the six core management processes spanning the strategic, operational and
financial levels of the organization. Those processes are; Gain to Sustain, Investigate to
Invest, Design to Decide, Plan to Act, Analyze to Adjust, and Record to Report.
Master Data Data that is shared across systems (such as lists or hierarchies of customers, suppliers,
accounts, or organizational units) and is used to classify and define transactional data.
Many companies currently manage their master data in a very manual fashion (via
spreadsheets), in a homegrown system, or in some cases they are not managing it at all.
Monte Carlo Simulation Mathematical technique that uses random numbers to measure the effects of uncertainty.
Model inputs (for example, costs and revenues) are defined as probability distributions
BI & EPM: The Oracle Guide to Management Excellence
193
(for example, the normal distribution, or bell curve), and these are repeatedly sampled to
forecast their effect on model outputs (for example, Net Present Value, Earnings per
Share). Simulation results provide a level or risk or probability that guides business
decisions.
OLAP (Online Analytical
Processing)
Manipulating large chunks of data in response to analytical queries by end users. OLAP
data is organized by dimensions (for example, time, products, geographies, measures,
scenarios, and so on) that include hierarchies, which support drilling down from higher
levels to more-detailed views. OLAP gives analysts, managers, and executives insight
into data through fast, consistent interactive access to a wide variety of possible views of
information. OLAP technology enables data to be explored well beyond the capabilities of
traditional reporting systems.
OLAP Model In Essbase Integration Services, an OLAP model is a logical model (star schema) that is
created from tables and columns in a relational database. The OLAP model is then used
to generate the structure of a multidimensional database.
Performance-Accountable
Organization
Organization that delivers continuous performance improvement and accountability in all
of its activities, from all of its employees, across the enterprise. When an organization is
truly performance accountable, CEOs and CFOs can report openly and comprehensively
on performance and set expectations with confidence.
Performance Scorecard Strategic management tool designed to translate an organization’s mission statement and
overall business strategy into specific, quantifiable goals and to monitor the organization’s
overall performance—not just financial returns —so that future performance can be
predicted and proper actions taken to create the desired future.
Rolling Forecast Forecasting method that shifts planning away from historic budgeting and forecasting and
moves it toward a continuous predictive modeling method. It requires access to relevant
information from multiple data sources as well as business processes throughout the
enterprise.
Sarbanes-Oxley Act that changed the corporate landscape in the United States with regard to financial
reporting and auditing for publicly traded companies. Written to address many of the
issues brought to light during the incidents involving Enron and Arthur Andersen, the law,
which went into effect July 30, 2002, establishes stringent financial reporting requirements
for companies doing business in the U.S.
Scorecard Application or custom user interface that helps manage enterprise performance by
optimizing and aligning organizational units, business processes, and individuals. It also
should provide internal and industry benchmarks, as well as goals and targets that help
individuals understand their contributions to the organization. The use of scorecards
spans the operational, tactical, and strategic aspects of the business and its decisions.
Often, methodologies derived from internal best practices, or an external industry
methodology, are used for scorecards. (For example, the term “The Balanced Scorecard”

BI & EPM: The Oracle Guide to Management Excellence
194
specifically refers to the Kaplan and Norton methodology.)
Six Sigma Rigorous and disciplined methodology that uses data and statistical analysis to measure
and improve a company’s operational performance by identifying and eliminating “defects”
(driving toward six standard deviations between the mean and the nearest specification
limit) in manufacturing and service-related processes. Six Sigma, in many organizations,
simply means a measure of quality that strives for near-perfection.
BI & EPM: The Oracle Guide to Management Excellence
195
Authors and Contributors
Principal Author
Toby Hatch, Senior Strategist, Enterprise Performance Management
Contributing Authors
Many people contributed their time and expertise to create this guide. Thanks and appreciation goes out to, but is not limited to:
Frank Buytendijk, Vice President and Fellow, Enterprise Performance Management
Jim Campbell, Technology Sales Representative, FDM
Mitch Campbell, Director, Business Intelligence
Dave Collins, Director, Analytics
Floyd Conrad, Senior Director, Enterprise Planning
Mark Conway, Director, EPM Alliances & Research
Gilles Demarquet, Manager, BI and PM Enabling Technologies
Denis Desroches, Principal, Enterprise Planning
Dan Mitzner, Product Marketing Manager, Crystal Ball
John Hite, Senior Director, EPM Enabling Technologies
Kathy Horton, Senior Director, Solution Specialists
Will Kaffenberger, Manager, Enterprise Planning, Strategic Planning
John Kopcke, SVP, Business Intelligence and Performance Management
Jake Krakauer, Senior Director, BI Applications
Michael van der Merwe, Manager, BI & PM Enabling Technologies
BI & EPM: The Oracle Guide to Management Excellence
196
Malou Nicklow, Manager, Enabling technologies
Paul Peters, Director, Business Intelligence
Allen Prattis, Director, Enabling technologies
Thomas Oestreich, Chief EPM Strategist
John O’Rourke, Vice President, EPM Product Marketing
Robin Peel, Manager, BI & PM Enabling Technologies
Stephane Ribault, Director, Enterprise Planning
Jennifer Stout, Senior Technical Editor
Christian Wetterwald, Director, Financial Consolidation & Reporting
Loretta Zingone, Manager, Commercial and NASA Tech Proposal Services
Special thanks go to Dr. Raef Lawson, Vice President of Research and Professor-in-Residence for the Institute of Management Accountants for his contributions to the section on Creating an EPM Center of Excellence.

BI & EPM: The Oracle Guide to Management Excellence
197

BI & EPM: The Oracle Guide to Management Excellence
198
Please direct any comments or suggestions for future revisions to [email protected]
BI & EPM Oracle Guide to Management Excellence V3.1 September 2009 Principal Author: Toby Hatch Contributing Authors: Many, see listing Oracle Corporation World Headquarters 500 Oracle Parkway Redwood Shores, CA 94065 U.S.A. Worldwide Inquiries: Phone: +1.650.506.7000 Fax: +1.650.506.7200 oracle.com
Copyright © 2009, Oracle and/or its affiliates. All rights reserved. This document is provided for information purposes only and the contents hereof are subject to change without notice. This document is not warranted to be error-free, nor subject to any other warranties or conditions, whether expressed orally or implied in law, including implied warranties and conditions of merchantability or fitness for a particular purpose. We specifically disclaim any liability with respect to this document and no contractual obligations are formed either directly or indirectly by this document. This document may not be reproduced or transmitted in any form or by any means, electronic or mechanical, for any purpose, without our prior written permission.
Oracle is a registered trademark of Oracle Corporation and/or its affiliates. Other names may be trademarks of their respective owners.
0909