bicol regional statistical development programrsso05.psa.gov.ph/sites/default/files/rsdp...
TRANSCRIPT
Bicol Regional Statistical Development Program
2018-2023

Bicol Regional Statistical Development Program 2018-2023 ii
Bicol Regional Statistical Development Program
2018-2023 is a publication prepared by the Philippine Statistics Authority Regional Statistical Services Office V
in coordination with various regional line agencies, local government units, state universities and colleges, higher educational institutions and the private sector in the Regional Statistical System
TERMS OF USE AND DISCLAIMER The PSA reserves its exclusive right to reproduce all its publication in whatever form. Any part of this publication cannot be reproduced, recopied, lent or repackaged for any commercial purposes without written permission from the PSA. Any part of this publication may only be reproduced for personal or internal use. Should any portion, data or information in this publication be included in a report, paper,
article or statement, the title of the publication and the PSA as publisher should be cited as the source. Any information derived from the processing of data contained in this publication shall not be the
responsibility of the PSA.
ISSN: 2619-8258
Published by the
Philippine Statistics Authority Regional Statistical Services Office V
2nd Flr. Albay Capitol Building Annex No.1 Old Albay District, Legazpi City, 4500
Philippines
June 2018
The Bicol Regional Statistical Development Program 2018-2023 is available in print and CD ROM (pdf) formats on the PSA RSSO V website at
www.rsso05.psa.gov.ph
For inquiries, please contact us at: (052) 481-7479 and (052) 742-0337, or email us at [email protected]

Bicol Regional Statistical Development Program 2018-2023 iii
MESSAGE RSC V CHAIR
The Bicol Regional Statistical Development Program (RSDP) 2018-2023 sets the medium-term directions, strategies and priorities of the regional statistical system for the generation and dissemination of statistical information to be used in policy analysis and formulation, planning and programming, decision-making, and monitoring and evaluation. As we draw the Bicol RSDP for the next six years, we are guided by the long-term vision of the Filipinos, the Ambisyon Natin 2040: matatag, maginhawa at panatag na buhay para sa lahat. The Bicol RSDP 2018-2023 includes the strategic planning framework and the priority statistical development programs to address the data requirements of the Bicol Regional Development Plan 2017-2022. The latter aims to lay down the foundation for inclusive growth, a high-trust and resilient society and a globally competitive knowledge economy. In 2023, Bicol Region envisions to have a harmonized, responsive, and efficient statistical system that provides quality statistics towards the attainment of regional development goals. The program will also serve as a guide in monitoring the Core Regional Indicators and the contribution of the regional line agencies, local government units, state universities and colleges, and other entities in achieving the international commitments to sustainable development goals. The Bicol RSDP 2018-2023 is a product of series of workshops and consultations among various stakeholders in the region. As the chairperson of the Regional Statistics Committee, I would like to extend our sincere gratitude to all the line agencies, local government units, state universities and colleges, and other entities who provided inputs and collaborated with the Philippine Statistics Authority Regional Statistical Services Office V in formulating the Bicol RSDP 2018-2023.

Bicol Regional Statistical Development Program 2018-2023 iv
MESSAGE
RSC V VICE CHAIR The Bicol Regional Statistical Development Program (RSDP) 2018-2023 is the local version of the Philippine Statistical Development Program (PSDP), which provides a mechanism for setting the directions, thrusts and strategies in the Regional Statistical System (RSS). It serves as a blueprint of priority statistical development programs and activities to be under-taken by the region for the medium term in addressing data requirements of the Regional Development Plan and various stakeholders. The formulation of the maiden edition of the Bicol RSDP was not easy but was a result of convergence and synergy of all those involved in the RSS in the Region. It was formatted through a series of consultations with regional line agencies, local government units, academe and implementing institutions where knowledge, ideas, experiences and expertise were harmonized to find appropriate policies, strategies and solutions to the issues and challenges besetting the RSS.
For 2018-2023, we expand our reach to improve the RSS in the region to be responsive to the emerging data needs for local development plans and programs of the Bicol Region and this requires stronger partnership and new collaborations with various partners. On behalf of PSA V, we would like to express our sincerest gratitude to the support extended by the Regional Statistics Committee V and all those who were part in formulating the Bicol RSDP 2018-2023. Onwards we march for the betterment of our regional statistical system!
CYNTHIA L. PERDIZ
RSC Vice-Chair PSA RSSO V Regional Director


Bicol Regional Statistical Development Program 2018-2023 v
EXECUTIVE SUMMARY
The Bicol Regional Statistical Development Program (RSDP) 2018 – 2023 which is the local version of the Philippine Statistical Development Program (PSDP) 2018-2023 serves as a mechanism for setting the directions, thrusts and strategies in the Regional Statistical System (RSS) and for defining the priority statistical development programs and activities to be undertaken in the medium term. It also serves as the blueprint of statistical activities in the region that produces the necessary data to design, implement and monitor sub-national development policies, plans, programs, and activities. The Bicol RSDP 2018-2023 will address the statistical needs of the Bicol Regional Development Plan 2017-2022 and its accompanying results matrices.
The Bicol RSDP serves as a guide in monitoring the Core Regional Indicators (CoRe-Is) which are the key indicators that are available at the region. The CoRe-Is aims to: (1) monitor the social, economic, political, cultural, and environmental developments in the local communities; (2) aid the government in understanding the needs of the local communities; and (3) enable both the national and local governments make the right policies, decisions, and actions. The Bicol RSDP is a tool for integrating and coordinating the statistical activities of the government, enjoining compliance and cooperation among various agencies, as well promoting efficiency of statistical operations through an optimum use of available resources and adoption of cost effective measures. It supplements the statistical data and information needed in the implementation, monitoring and evaluation of programs, the CoRe-Is, and the region’s international commitment to achieving the Sustainable Development Goals, for integrating the statistical activities of government and promoting institutional building and cooperation among stakeholders in the RSS.

Bicol Regional Statistical Development Program 2018-2023 vi
Republic of the Philippines REGIONAL STATISTICS COMMITTEE
Region V
Resolution No. 02-2018 APPROVING & ADOPTING THE REGIONAL STATISTICAL DEVELOPMENT PROGRAM
2018-2023 OF REGION V
WHEREAS, Republic Act No. 10625, also known as the “Philippine Statistical Act of 2013” mandates the Philippine Statistics Authority (PSA) to prepare, in consultation with the PSA Board, a Philippine Statistical Development Program (PSDP); WHEREAS, the PSDP sets the strategic directions, thrusts, and priorities of the Philippine Statistical System (PSS) in the medium term to provide vital information support to national, sectoral and local development plans, and international commitments; WHEREAS, the PSDP provides the necessary framework for the development, generation, and dissemination of statistics and indicators needed in evidence-based policies, plans, and decisions of government and other key stakeholders and data users at the local and national levels; WHEREAS, the PSDP is a tool integrating and coordinating the statistical activities of the government to ensure that the emerging and evolving needs of the data users and stakeholders are addressed; WHEREAS, one chapter of the PSDP focuses on Local Statistics Development; WHEREAS, the Regional Statistics Committee V was asked to provide inputs to the Local Statistics Development chapter of the PSDP 2018-2023 by crafting its own Regional Statistical Development Program (RSDP); WHEREAS, the Regional Statistics Committee V, as the highest policy-making body on statistical matters of the region, spearheaded the preparation of the RSDP 2018-2023 of Bicol Region; WHEREAS, consultation workshops were conducted by the RSC V to generate inputs for the formulation of the RSDP 2018-2023; WHEREAS, the RSDP 2018-2023 takes into consideration the key information requirements of the Bicol Regional Development Plan 2017-2022 and the Sustainable Development Goals as well as other essential data needs of government, business, and society; WHEREAS, the RSDP 2018-2023 consists of key developments in the Regional Statistical System (RSS), major issues and challenges on statistical matters which need to be addressed by the RSS and the statistical development programs addressing the issues and challenges which need to be implemented during the period 2018-2023;

Bicol Regional Statistical Development Program 2018-2023 vii
WHEREAS, the final draft of the RSDP was completed and presented to the RSC V on March 15, 2018 for approval and adoption by the RSC V and endorsement to the PSDP Secretariat; NOW, THEREFORE, BE IT RESOLVED, AS IT IS HEREBY RESOLVED, that the Committee approves the Regional Statistical Development Program 2018-2023 of Region V subject to enhancement based on the final comments, suggestions and recommendations from the Committee members. RESOLVED FURTHER, that the Committee shall endorse Region V’s RSDP 2018-2023 to the PSDP Secretariat as input to the Local Statistics Development Chapter of the PSDP 2018-2023. RESOLVED FINALLY, to endorse the same to the RDC V to enjoin support for its adoption and implementation in the region. APPROVED, this 18th day of May 2018, at the NEDA V, Legazpi City.
Attested by: CYNTHIA L. PERDIZ RSC Vice-Chair PSA RSSO V Regional Director

Bicol Regional Statistical Development Program 2018-2023 viii
Bicol Regional Statistical Development Program 2018-2023 ix
Republic of the Philippines REGIONAL STATISTICS COMMITTEE
Region V
Resolution No. 01-2018
APPROVING THE CREATION OF THE TECHNICAL WORKING GROUP FOR THE FORMULATION OF THE REGIONAL STATISTICAL DEVELOPMENT PROGRAM
(RSDP) 2018-2023 FOR REGION V
WHEREAS, PSA Resolution No. 05, s.2015 established the Regional Statistics Committees (RSCs) to provide direction and guidance to regional/local statistical development activities and serve as venue for discussion and resolution of statistical issues at the local level;
WHEREAS, Article III of the above-cited resolution, mandates the RSC to institute measures to
strengthen the statistical capability of the local statistical system and its personnel and create inter-agency statistical working groups, as the need arise, that could attend to technical issues and problems;
WHEREAS, Republic Act No. 10625 provides the preparation of the Philippine Statistical
Development Program (PSDP) by the Philippine Statistics Authority (PSA); WHEREAS, the PSDP is a mechanism for setting the directions, thrusts, and strategies in the
Philippine Statistical System (PSS) and for defining the priority statistical development programs and activities to be undertaken in the medium term;
WHEREAS, the PSDP 2017-2023 guides the statistical development of the PSS and furnishes
the Philippine Development Plan (PDP) 2017-2022 with vital statistical information necessary in measuring country's progress and formulating policies, taking into account the priority strategies, targets and activities for development in medium term;
WHEREAS, the Regional Statistical Development Program (RSDP) is the regional counterpart of
the PSDP; WHEREAS, the formulation of the RSDP 2018-2023 will lay the necessary framework for
generating and disseminating statistics and indicators needed in the policy formulation, development planning and decision making by various stakeholders and data users in the region;
WHEREAS, the involvement of various Regional Line Agencies, Local Government Untis,
academe, private sector and other data producers and users in fundamental in the formulation of solid, comprehensive, responsive and attainable statistical programs for medium term;
WHEREAS, the PSA Board through PSA Board Resolution No. 4, series of 2017, has approved
the creation of Steering Committee for the formulation of the PSDP 2017-2023; WHEREAS, the Resolution identified the Select Group as the RSDP Steering Committee at the
regional level, to wit: NEDA, PSA, DOT, DENR, BSP, DSWD, DepEd, DOLE, DILG, DTI, DOST, BLGF, DILG, DA, PASUC, PPDO Camarines Norte, CPDO Legazpi, CPDO Naga, and CPDO Tabaco.

Bicol Regional Statistical Development Program 2018-2023 x
WHEREAS, the RSDP Steering Committee will have the following functions:
1. Provide guidance and direction in the formulation of the strategic planning framework to include the overall vision, goals, policy directions, and thrusts and strategies, aimed at further enhancing and developing the capacity of the RSS to deliver quality statistical products and services;
2. Provide guidance in the identification and validation of key statistical issues, challenges, and concerns of the RSS that should be addressed in the RSDP 2017-2023;
3. Review and approve the general guidelines for the formulation of the RSDP 2018-2023 to ensure consistency among the IACs, TFs, TWG, and SWGs in the identification and prioritization of statistical programs, projects and activities as well as in the preparation of statistical budgets of the PSS for the medium term;
4. Review and approve the proposed RSS-wide and sectoral statistical programs, projects, activities and budget, prepared and submitted by the IACs, TFs, TWGs, and SWGs and recommend improvements where necessary; and
5. Review and approve the final draft of the RSDP 2018-2023 and endorse the final output to the PSA Secretariat for approval.
WHEREAS, RSDP Technical Working Group may be created and shall undertake the following
activities:
1. Evaluate accomplishments/milestones, identify issues and challenges, and prepare reports on the statistical development by sector/concern during the period 2018-2023;
2. Formulate thrusts and strategies for statistical development by sector/concern for the medium term;
3. Identify, review and finalize priority statistical programs and activities including financial requirements of the sector based on the thrusts of the PSS for the medium term;
4. Submit final draft of the sectoral statistical programs, activities and budget to the PSA for consolidation
WHEREAS, the PSA Regional Statistical Service Office V shall be responsible for the overall
coordination and organization of activities in line with the formulation of the RSDP 2018-2023 and shall be the technical and secretariat arm of the RSDP Steering Committee;
NOW THEREFORE, ON MOTION DULY SECONDED, be it: RESOLVED, AS IT IS HEREBY RESOLVED, to approve the creation of the RSDP TWG with the
following composition of member-agencies, to wit: Social Sector Economic Sector Environment Sector
1. POPCOM 1. NEDA 1. PIA 2. HLURB 2. PSA 2. PSA 3. PSA 3. DTI 3. NEDA 4. DOLE 4. DA 4. DENR 5. DepEd 5. Water Districts 5. NNC 6. DOH 6. CAAP 6. DILG 7. DSWD 7. DPWH 7. DOH 8. DOJ 8. MARINA 8. PPDO Albay 9. PNP 9. LTFRB 9. CPDO Legazpi 10. AFP 10. LTO 10. CPDO Iriga 11. BJMP 11. DOT 11. CPDO Sorsogon 12. DILG 12. Electric Coops 12. PPDO Catanduanes 13. NCIP 13. DOST 13. PPDO Sorsogon 14. CHED 14. BSP 15. TESDA 15. CPDO Naga 16. PASUC 17. BLGF 18. CPDO Tabaco

Bicol Regional Statistical Development Program 2018-2023 xi
19. CPDO Ligao 20. CPDO Masbate 21. CPDO Camarines Norte 22. PPDO Masbate
RESOLVED, that representatives of the member-agencies of the TWG will meet to discuss plans
and strategies for the forum at such date, time, and place it may decide, as the need arises;
RESOLVED FURTHER, that the RSC TWG may be modified to include agencies and institutions
that are necessary in the formulation of the RSDP 2018-2023; RESOLVED FINALLY, that copies of this Resolution be disseminated to all concerned for their
information and guidance.
Approved and signed on this 15th of March, 2018 at the NEDA V, Arimbay, Legazpi City.
Attested by:
CYNTHIA L. PERDIZ RSC Vice-Chair PSA RSSO V Regional Director

Bicol Regional Statistical Development Program 2018-2023 xii
ABOUT THE RSDP
Republic Act No. 10625, otherwise known as the "Philippine Statistical Act of 2013" was signed into law by President Benigno Simeon Aquino III on 12 September 2013. Sections 3 and 5 of RA 10625 mandated the reorganization of the Philippine Statistical System (PSS) and the creation of the Philippine Statistics Authority (PSA).
The Republic Act was basically enacted to support decentralization through the establishment of the statistical infrastructure necessary to service the statistical needs for local development planning wherein demand for data to support development planning, implementation and monitoring of programs and projects at the local level has increased in view of the decentralization thrust of the government. There is also a need to enhance the subnational statistical system to address more effectively the statistical requirements and take into account the peculiarities of each region and local government unit, and those of the policy makers and the private sector at the local levels.
Moreover, it also created the PSA Board as the highest policy-making body on statistical matters and one of its functions is to prescribe appropriate frameworks for the improvement of statistical coordination and establish mechanisms for statistical coordination at the national and subnational levels. Thus, it mandated to formulate the Philippine Statistical Development Program at the national level that will serve as mechanism for setting directions, thrusts and strategies of the PSS and define the priority statistical development programs and activities. Likewise, it mandated to formulate the Regional Statistical Development Program (RSDP) at the subnational level.
The conceptualization of the Bicol RSDP 2018-2023 started with the conduct of the Workshop on the Formulation of the Regional Statistical Development Program (RSDP) 2018-2013 last November 15-16, 2017 at Casa Lorenzo, Tagas, Daraga Albay. The outputs of the workshop were the following: (1) vision, mission and goals; (2) strengths, weaknesses, opportunities and threats analysis; and (3) strategies concerning the coordination of the Regional Statistical System (RSS), data collection, data dissemination, and use. During the fourth quarter 2017 meeting of the Regional Statistics Committee (RSC), the steering committee and the technical working group for the Bicol RSDP 2018-2023 were identified. The RSS of Bicol necessitates a solid relationship among the institutions, data producers, data users and notwithstanding the data suppliers or respondents. The PSA and National Economic and Development Authority through the RSC, along with the different regional line agencies and local government units, provided directions and guidance in the formulation of the RSDP 2018-2023.

Bicol Regional Statistical Development Program 2018-2023 xiii
Figure 1. Strategic Planning Network


Bicol Regional Statistical Development Program 2018-2023 xiv
Figure 1 shows the Strategic Planning Framework of the Bicol Regional Statistical Development Program 2018-2023. The reorganization of the Philippine Statistical System is anchored on Republic Act 10625, otherwise known as the Philippine Statistical Act of 2013. It states that “The PSS shall consist of statistical organizations at all administrative levels, the personnel therein and the national statistical program,” thus leading to the creation of the Philippine Statistics Authority (PSA) which is comprised of the PSA Board and offices on sectoral statistics, censuses and technical coordination, civil registration and central support and field statistical services. Through PSA Resolution No. 05, Series of 2015, the Regional Statistical Committee was formed and is tasked to oversee the implementation of the policy decisions of the Philippine Statistics Authority (PSA) in the region as well as the adoption of the prescribed statistical standard methodologies and classification systems. The RSCs also serve as the link between the PSA and the Local Government Units (LGUs) on statistical matters and statistical activities that shall be planned and implemented in coordination with the RSCs. The Sustainable Development Goals (SDGs) which are attained through specific indicators are also affixed on the formulation of the Bicol RSDP 2018-2023. The validated results matrix of the Bicol Regional Development Plan 2017-2022 functions as the guide to formulating the Bicol RSDP 2018-2023 for it contains programs and activities as well as issues and concerns regarding certain sectors. It serves as the guide towards a more sustainable and attainable RSDP. Other new and emerging statistical demands with the use of admin-based data and registers also contributed to the formulation of the RSDP for it identifies the statistical demands, which need assessment, and action plans. Social Statistics, Economic Statistics, Environment and Multi-domain Statistics are the main chapters of the Bicol RSDP 2018-2023. With the interaction of the management and coordination of the RSS, Statistical Capacity Development both on Human Resource Development and Statistical Research and Development, Statistical Information Management and Dissemination, statistical information are attained and appropriate development programs are established.


Bicol Regional Statistical Development Program 2018-2023 xiv
VISION
A harmonized, responsive, and efficient statistical system for the Bicol Region that provides relevant and quality statistics towards attainment of regional development
goals.
MISSION
To be responsive to the emerging data needs for local development plans and
programs and to formulate mechanism that would ensure inter-operability of data for inclusive growth and development of the Region.
GOAL AND OBJECTIVES
RSDP 2018-2023 GOAL
Make accessible credible statistics in different levels of disaggregation in the region.
OBJECTIVES 1
To institutionalize CBMS as the standard format for cities,
municipalities and barangays.
2 Improve inter-agency access to quality
statistics.
3 Continually provide the data
requirements for monitoring on implementation of the RDP.
4 Achieve functional professional literacy in statistical processing and analysis data
banking and technical writing and reporting.

Bicol Regional Statistical Development Program 2018-2023 xv
TABLE OF CONTENTS
Page
Message - RSC Chair iii
Message - RSC Vice Chair iv
Executive Summary v
RSC Resolution No. 02-2018: Approving and Adopting the RSDP
Program 2018-2023 of Region V
vi
RSC Resolution No. 01-2018: Approving the Creation of the TWG for
Formulation of the RSDP 2018-2023 for Region V
viii
About the Bicol Regional Statistical Development Program xi
Strategic Planning Network xii
Vision, Mission, Goal and Objectives xiv
List of Figures xvii
List of Acronyms and Abbreviations xviii
References xxi
Cluster I: Regional Statistical System (RSS) – Wide Concerns
Chapter 1 Management and Coordination of the RSS 1
Chapter 2 Statistical Capacity Development 7
2.1 Human Resource Development 7
2.2 Statistical Research and Development 9
Chapter 3 Statistical Information Management and Dissemination 11
Cluster II: Sectoral Statistics
Chapter 4 Social Statistics 14
4.1 Population and Housing 14
Bicol Regional Statistical Development Program 2018-2023 xvi
4.2 Civil Registration and Vital Events 15
4.3 Labor and Employment 15
4.4 Education and Culture 16
4.5 Health and Nutrition 16
4.6 Social Protection 18
4.7 Security, Justice and Peace 18
4.8 Governance 19
Chapter 5 Economic Statistics 22
5.1 Macroeconomic Accounts 22
5.2 Industry, Trade, Services and Investment 23
5.3 Agriculture, Livestock and Fisheries 23
5.4 Energy, Gas and Water 23
5.5 Transport and Infrastructure 23
5.6 Tourism 23
5.7 Monetary, Price and Finance 23
5.8 Science, Technology and Innovation 24
Chapter 6 Environment and Multi-Domain Statistics 26
6.1 Environment and Natural Resources 27
6.2 Income, Poverty and Hunger 28
6.3 Gender and Development 29
6.4 Sustainable Development Goals 33
Acknowledgment 50
Appendix 51
A. Workshop 2.1: SWOT Analysis 52
B. Workshop 2.2: Strategy Formulation 55
C. Workshop 2.3: Strategies and PAPs for the Objectives 56
D. Bicol Region Regional Development Plan
Results Matrices 2017-2022 57

Bicol Regional Statistical Development Program 2018-2023 xvii
LIST OF FIGURES
Page
Figure 1 Strategic Planning Network xii
Figure 2 Regional Statistical Framework 3
Bicol Regional Statistical Development Program 2018-2023 xix
LIST OF ACRONYMS AND ABBREVIATIONS
ANACONDA Analysis of Causes of National Deaths for Action AHFF Agriculture, Hunting, Forestry and Fishing ALS Agricultural Labor Survey APIS Annual Poverty Indicators Survey ASPBI Annual Survey of Philippine Business and Industry AWRS Agricultural Wage Rate Survey BCRS Barangay Civil Registry System BIR Bureau of Internal Revenue BFP Bureau of Fire Protection BHS Barangay Health Station BLGF Bureau of Local Government Finance BREQS Batch Request System BSP Bangko Sentral ng Pilipinas CAAP Civil Aviation Authority of the Philippines CAF Census of Agriculture and Fisheries CAPI Computer Aided Personal Interview CBMS Community Based-Monitoring System CHED Commission on Higher Education CoRe-Is Core Regional Indicators CRASM Certificate for Registration of the Authority to Solemnize Marriage CRS Civil Registry System CSS Customer Satisfaction Survey CVS Crime Victimization Survey CWC Council for the Welfare of Children DA Department of Agriculture DBM Department of Budget and Management DepEd Department of Education DOH Department of Health DOLE Department of Labor and Employment DOST Department of Science and Technology DOT Department of Tourism DPWH Department of Public Works and Highways DSWD Department of Social Welfare and Development DVSS Decentralize Vital Statistics System EBEIS Enhanced Basic Education Information System
Bicol Regional Statistical Development Program 2018-2023 xx
ENR Environment and Natural Resources FHSIS Field Health Service Information System PhilCRIS Philippines Civil Registry Information System FIES Family Income and Expenditures Survey FLEMMS Functional Literacy, Education and Mass Media Survey GAD Gender and Development GATS Global Adult Tobacco Survey GIS Geographic Information System GRDP Gross Regional Domestic Product HCs Health Centers HRD Human Resource Development IACGovStat Interagency Committee on Governance Statistics iClinicSys Integrated Clinic Information System IEC Information and Education Campaign IES Impact Evaluation Study ISLE Integrated Survey on Labor and Employment LFH Listing of Farm Households LFS Labor Force Survey LGU Local Government Unit LTFRB Land Transportation Franchising and Regulatory Board LTO Land Transportation Office LTS Labor Turnover Survey NDHS National Demographic and Health Survey NDPS National Disability Prevalence Survey NHTS-PR National Household Targeting System for Poverty Reduction NMS National Migration Survey NTC National Telecommunications Commission NSM National Statistics Month OWS Occupational Wages Survey PHIC Philippine Health Insurance Corporation PHIE Philippine Health Information Exchange PhilCRIS Philippines Civil Registry Information System PNP Philippine National Police POPCEN Census of Population PSA Philippine Statistics Authority PSAI Philippine Statistical Association, Inc
Bicol Regional Statistical Development Program 2018-2023 xxi
PSDP Philippines Statistical Development Program PSIC Philippine Standard Industrial Classification PSOC Philippine Standard Occupational Classification PSOs Provincial Statistical Offices QSPBI Quarterly Survey of Philippine Business and Industry RDP Regional Development Plan RHUs Rural Health Units RLAs Regional Line Agencies RSC Regional Statistics Committee RSDP Regional Statistical Development Program RSET Regional Social and Economic Trend RSSOs Regional Statistical Service Offices RSS Regional Statistical System SAE Small Area Estimation SEEA System of Environmental Economic Accounting SDG Sustainable Development Goals SECPA Security Paper SICT Survey on Information and Communication Technology SOF Survey on Overseas Filipinos SSRCS Statistical Survey Review and Clearance System SSSP Subnational Statistical Strategic Program TVET Technical Vocational Education and Training UHMIS Unified Health Management Information System ULAF Updating of the List of Aquaculture Farms

Bicol Regional Statistical Development Program 2018-2023 xxii
REFERENCES
Philippine Development Plan 2017-2022 Bicol Regional Development Plan 2017-2022 Philippine Statistical Development Plan 2018-2023 Sustainable Development Goals (SDG) http://rsso05.psa.gov.ph http://www.psa.gov.ph


Bicol Regional Statistical Development Program 2018-2023 1
Chapter 1 – Management and Coordination of the RSS
Introduction
This chapter features the management and coordination mechanism of the Regional
Statistical System (RSS) particularly in planning, coordination, program implementation and monitoring and evaluation to assure timely, precise, steadfast, pertinent and acceptable data needed by the government and non-government institutions and other sector at the sub national level.
Among the essential elements of an effective and efficient RSS are institutional mechanisms designed to manage and coordinate statistical operations in the local government. Statistical mechanisms such as policies, strategic plans and programs, and advocacy strategies are crucial in coordinating and facilitating the generation and dissemination of timely, relevant and reliable statistics in support of local development. Emerging developments in the economy and society bring about new demands for more relevant, useful, and quality data. In order for the RSS to effectively address persistent data gaps as well as growing and diversifying data needs, it must continuously strive to proactively coordinate stakeholders and effectively manage statistical and business processes. Managing the RSS entails a number of processes—planning, program implementation, coordination, monitoring and evaluation—to ensure the delivery of timely, relevant and reliable statistics.
The RSS in Bicol Region is a network of the regional line agencies (RLAs) that generates
and provides official statistics in the region. The RSS also serves as a forum to address various concerns and issues on statistical matters and to harmonize data collection and dissemination activities at the regional level.
Data on various economic and social indicators are compiled and generated by
agencies other than the Philippine Statistics Authority (PSA), either from censuses and surveys or from their administrative recording systems. Some of the major statistical agencies in the region are:
Bangko Sentral ng Pilipinas (BSP) Bureau of Fire Protection (BFP)

Bicol Regional Statistical Development Program 2018-2023 2
Bureau of Internal Revenue (BIR) Bureau of Local Government Finance (BLGF) Civil Aviation Authority of the Philippines (CAAP) Commission on Higher Education (CHED) Department of Agriculture (DA) Department of Budget and Management (DBM) Department of Education (DepEd) Department of Health (DOH) Department of Labor and Employment (DOLE) Department of Public Works and Highways (DPWH) Department of Social Welfare and Development (DSWD) Department of Tourism (DOT) Land Transportation Franchising and Regulatory Board (LTFRB) Land Transportation Office (LTO) National Telecommunications Commission (NTC) Philippine National Police (PNP) and Other major data producers in the region.
Most of the RLAs collect and maintain their databases in accordance with their
respective mandates. Local government units (LGUs) also generate administrative data about their respective areas or constituents.

Bicol Regional Statistical Development Program 2018-2023 3
Figure 2. Regional Statistical Framework
Figure 2 shows the interrelationships and flows between the Regional Statistics
Committee (RSC), PSA Central Office and the Local Chief Executive Offices. Other contributing factors such as data users, data producers and data providers or respondents greatly contribute to policy-making and serve as a coordinating body. Statistical agencies and other RLAs, LGUs and government-owned or controlled corporations and their subsidiaries that engage in statistical activities as their primary function or as part of their administrative and regulatory roles are also part of the immense providers of the necessary data needed by the PSA Regional and Provincial Offices. Further, it is imperative for the RSS to be more responsive to the government and to the general statistical needs of the region and the country.

Bicol Regional Statistical Development Program 2018-2023 4
Situational Analysis
Key Developments in 2015-2017
The following are the key developments in terms of Management and Coordination in the RSS for the period 2015-2017:
Creation of the Regional Statistics Committee (RSC) through PSA Resolution No. 5., s.2015
RA No. 10625 created the PSA Board as the highest policy-making body on statistical matters. One of the functions of the PSA Board is to prescribe appropriate frameworks for the improvement of statistical coordination and establish mechanisms for statistical coordination at the regional and LGU levels. The demand for data to support development planning, implementation and monitoring of programs and projects at the local level has increased in view of the decentralization thrust of the government.
In the creation of the RSCs, the following factors were taken into account: 1) the need to enhance the subnational statistical system to address more effectively the statistical requirements; and 2) the peculiarities of each region and LGUs, and those of the policy makers and the private sector at the local levels.
Through PSA Resolution No. 05 Series of 2015, the PSA Board approved the establishment of the RSC across the regions to provide direction and guidance to regional/local statistical development activities. The RSCs shall also serve as the policymaking body on statistical matters and shall be the venue for discussion and resolution of statistical issues at the local level.
The RSC in Region V was organized on June 23, 2015 and was reconstituted on July 26, 2017 in accordance with PSA Board Resolution No. 03, Series of 2017 as approved by the PSA Board on February 14, 2017 which provides for the reconstitution of the RSCs superseding all intents and purposes in PSA Resolution No. 05 s.2015. The Chair of the RSCs is the Regional Director of the NEDA and the Vice Chair is the Regional Director of the PSA.
The RSC is responsible for the following: (1) oversee the implementation in the regions of policy decisions made by the PSA Board and the adoption of prescribed statistical standard methodologies and classification systems; (2) formulate statistical policies designed to resolve local statistical issues and recommend workable schemes towards the improvement of local level statistics; (3) institute measures to strengthen the statistical capability of the local statistical system including the personnel thereof; (4) elevate to the PSA Board, statistical matters which cannot be resolved at the local level; (5) create interagency statistical working groups, as the need arises, that could attend to technical issues and problems and supervise the activities of these working groups; (6) oversee the implementation and adoption of the Core Regional Indicators (CoRe-Is) in the region; (7) provide guidance in the continuous improvement and updating of the CoRe-Is; (8) identify additional indicators to the CoRe-Is as needed to monitor the attainment of the region’s development goals and targets; and (9) elevate

Bicol Regional Statistical Development Program 2018-2023 5
to the PSA Board, any issue/matter regarding the compilation of the CoRe-Is which cannot be resolved at the subnational level. With regard to the formulation of the Bicol Regional Statistical Development Program (RSDP), the RSC shall: (1) spearhead the formulation of the RSDP for the region; (2) address evolving and emerging statistical requirements of stakeholders in the RSS; and (3) perform such other functions as may be deemed necessary/critical for the RSS.
National Strategy for Development Statistics
A workshop was organized to formulate the Subnational Statistical Strategic Program (SSSP). Specifically, the activity identified and developed the following: 1) outline and contents of the SSSP; 2) guidelines for the formulation of the SSSP; 3) core provincial indicators and discussed regional indicators vis-à-vis Regional Development Plan (RDP) and the Philippine Development Plan (PDP) Results Matrices (RMs) and Sustainable Development Goals (SDGs); 4) indicators to monitor the progress/success of the SSSP and ; 5) good practices on subnational statistical activities from PSA Regional Statistical Service Offices (RSSOs) and Provincial Statistical Offices (PSOs). Through this workshop, the RSSOs were guided in the preparation and identification of the statistical needs, strategies and programs of the subnational statistical system.
Joint Adherence of the National Statistics Month (NSM) Celebration
NSM was first observed in 1990 pursuant to Presidential Proclamation No. 647
signed by President Corazon Aquino on September 20, 1990, declaring the month of October of every year as the NSM. The NSM celebration aims to: (1) promote, enhance and instill awareness and appreciation of the importance of value of statistics to the different sectors of the society; and (2) elicit the cooperation and support of the general public in upgrading the quality and standards of statistics in the country.
In 2015, the activities of the NSM focused on the theme “Pagyamanin at Gamitin
ang Estadistika, kalusugan para sa lahat ay Abot-Kamay Na” with DOH as the host agency. In 2016, the theme of the NSM is “Sustainable Development: Making Statistics Count” wherein the host agency is the PSA. In 2017, the 28th NSM’s theme is “Facts and Figures for the Future: Statistics for Evidence-Based Decisions towards Ambisyon Natin 2040” wherein the host agency is the NEDA. From 2015-2017, the Bicol Region conducted 79, 14 and 88 activities for the NSM celebration, respectively.

Bicol Regional Statistical Development Program 2018-2023 6
Issues and Concerns
Notwithstanding the key developments in the RSS for 2015-2017, there are various issues and concerns in the management and coordination of the RSS. One of the issues is underqualified personnel who have inadequate competency for statistical analysis and other related tasks perform the statistical tasks in agencies. The region lacks manpower to respond to the increasing demand for statistics due to limited plantilla positions related to statistics.
There is a high labor turnover rate of personnel with statistics-related position. Most
agencies especially in provincial offices do not have statistician item. Thus, data utilization is not maximized and there is lack of statistical data appreciation.
In Region V, the Philippine Statistical Association, Inc (PSAI) Chapter is not yet organized.
Harmonization of the statistical information system and concepts/definition on some statistical terminologies can be addressed by the PSAI Chapter.
Peace and order problems in some areas of the region affect the data collection of field
staff. In some instances, the strong political will among local officials can have negative impact on data generation and collection.
Statistical, Projects Activities and Programs (PAPs) for 2018-2023 The government implements the following statistical projects, activities, and programs to improve the management and coordination of the RSS:
• Sustained strong partnership among and between members of RSC through the conduct of regular quarterly meetings;
• Collaboration of Overseas Workers Welfare Administration (OWWA) with the PSA on the vital documents;
• Giving awards and recognition to member agencies;
• Strong political will among local officials;
• Affiliation of the RSC as one committee of the Regional Development Council (RDC);
• Bill on the institutionalization of Community Based Monitoring System (CBMS) by the LGUs;
• Collaboration with national and international stakeholders
Bicol Regional Statistical Development Program 2018-2023 7
++
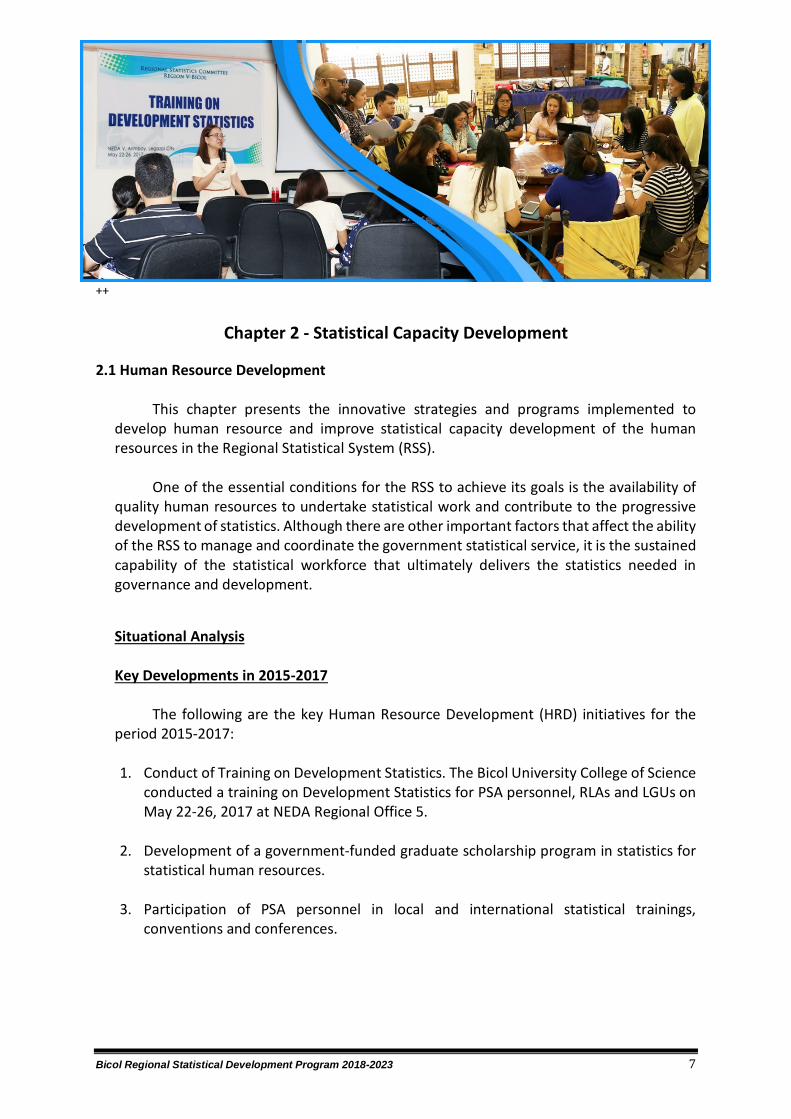
Chapter 2 - Statistical Capacity Development 2.1 Human Resource Development
This chapter presents the innovative strategies and programs implemented to
develop human resource and improve statistical capacity development of the human resources in the Regional Statistical System (RSS).
One of the essential conditions for the RSS to achieve its goals is the availability of
quality human resources to undertake statistical work and contribute to the progressive development of statistics. Although there are other important factors that affect the ability of the RSS to manage and coordinate the government statistical service, it is the sustained capability of the statistical workforce that ultimately delivers the statistics needed in governance and development.
Situational Analysis Key Developments in 2015-2017
The following are the key Human Resource Development (HRD) initiatives for the period 2015-2017:
1. Conduct of Training on Development Statistics. The Bicol University College of Science
conducted a training on Development Statistics for PSA personnel, RLAs and LGUs on May 22-26, 2017 at NEDA Regional Office 5.
2. Development of a government-funded graduate scholarship program in statistics for
statistical human resources.
3. Participation of PSA personnel in local and international statistical trainings, conventions and conferences.
Bicol Regional Statistical Development Program 2018-2023 8
Issues and Concerns
Notwithstanding the key developments in the human resource development initiatives for 2015-2017, there are various issues and concerns in the statistical capacity development. First, statistics courses are only offered in universities outside of the Bicol Region. Students who wish to major in Statistics have no other recourse but to move outside of the region to pursue the course. The De La Salle University, University of Sto. Tomas and the University of the Philippines are some of the universities that offer BS Statistics courses. The Polytechnic University of the Philippines, Mindanao State University, University of the Philippines, Benguet State University and De La Salle University are some of the universities that offer MA and MA Statistics courses. Considering the distance of these universities, Bicolano students are forced to consider other courses that are available in the region.
The available statistical trainings are also too expensive. Statistical trainings are offered to the different levels of personnel involved in research, data management, planning, data analysis, report preparation and administration. However, these trainings require financial capacity for the persons involved. The registration fees for the personnel from the government agencies and private sectors and international organizations vary as well thus hindering the development of the skills and knowledge needed in the actual field of work.
There is a budget constraint especially for capacity building. Capacity building is an important aspect of the development and improvement of the human resources in the Regional Statistical System. However, financial constraints impede in this important developmental feature. Human resources, while aiming for their personal financial growth, choose to dwell on other occupations because such occupations do not require extensive capacity building.
Human resources seek better opportunities outside the country due to low salary and the lack of training in the country. According to the former National Statistical Coordination Board (NSCB), Chief Statisticians in the Philippines are among the lowest paid statisticians in the tiger economies within the Association of Southeast Asian nation (ASEAN). Their monthly income of less than $2,000 a month is only equal to the salary of starting statisticians in Brunei and Malaysia. Considering the salary difference within the ASEAN nations, Filipino Statisticians seek for statistical positions outside the country.
Statistical Projects, Activities and Programs (PAPs) for 2018-2023
The government implements some statistical projects, activities, and programs to improve human resource development, to wit:
• Continuous training and capacity building program;
• Conduct data appreciation seminar;
Bicol Regional Statistical Development Program 2018-2023 9
• Harmonization of statistical tools;
• Development on the research on forecasting the Gross Regional Domestic Product (GRDP) and provincial income accounts using quarterly indicator; and
• Continuous collaboration with the academes regarding statistical trainings.
2.2 Statistical Research and Development
The availability of timely, relevant, and reliable statistics enables both government and the private sector to address a wide range of policy issues amidst an ever evolving social, economic, and political landscape in the country and increasing global competitiveness. Making statistics available and accessible to those who need them has however remained a challenge in the RSS. Concerted efforts by government, as primary data producer, and the private sector and the public, as users and data providers, must be sustained to ensure the collection and production of quality general-purpose statistics that could address data gaps of the economy and society. Situational Analysis Key Developments in 2015-2017
The following are some of the statistics-related activities that support effective and efficient data collection, processing and production in the region: (1) use of Geographic Information System (GIS)-based maps in designing master sample frame for census and surveys; (2) adoption/application of technological innovation such as the use of Computer Aided Personal Interview (CAPI) in data collection processes in censuses and surveys; (3) implementation of web-based surveys/online questionnaires/reporting; (4) use of mobile and handheld devices and other data capture technology, etc. and; (5) improvement of systems for data pre-processing, validation and documentation
Issues and Concerns
Notwithstanding the key developments in the statistical research and development for 2015-2017, there are various issues and concerns in the statistical capacity development. First, there are budget constraints to purchase modern or improved system like ArcGIS. ArcGIS is a software designed to work with maps and other geographic information. Such system and other relevant systems are important in the production and management of data. Unfortunately, there have been a budget constraint in buying advanced and enhanced system and this hinders the capacity of research and development.
There is an increasing demand for statistics but with limited manpower. Limited
manpower is a big concern especially for the increasing demand for statistics. Persons that take interest with statistics are limited since most of the universities and colleges that offer

Bicol Regional Statistical Development Program 2018-2023 10
statistics courses are outside the region. Statistical trainings are also expensive and only few financially capable persons can afford such trainings. These factors hinder the growth of manpower in the statistical activities.
There are budget constraints for statistical research and development. Statistical research and development is a continuous development that requires sustainable financial support. With budget constraints, statistical research and development is hindered and human resource become scarce because of financial limits.
The labor turnover rate for statistics personnel is high. Statistics entails more manpower to generate enough data for a specific purpose. However, with the labor turnover in its personnel, it becomes harder to produce the necessary data on time. The labor turnover makes it harder for its remaining personnel to generate specific data and as a result, some statistical needs are not met. Statistical Projects, Activities and Programs (PAPs) for 2018-2023
The government implements the following statistical projects, activities, and programs to improve statistical research development, such as the following:
1. Continuous conduct of training and capacity building program for research and
development;
2. Come up with proposed agenda to be submitted and evaluated by the R & D Committee;
3. Allocation of budget for statistical activities; and
4. Recommendation for the creation of statistical plantilla position.

Bicol Regional Statistical Development Program 2018-2023 11
Chapter 3 - Statistical Information Management and Dissemination
Introduction
This chapter offers a range of approaches for a well-organized management and dissemination of statistical information towards extensive utilization of statistics. It emphases on rising the users’ understanding, and upsurge application of statistics and indicators in evidence-based policy and decision making.
Effective information management and dissemination are crucial to getting statistics
into the policies and decisions of government, business, and civil society to facilitate the delivery of relevant and appropriate programs and services to the public.
Dissemination of information should cover a wide range of audience and should not
discriminate among users. Certain information may, however, need to be more directed to its primary stakeholders to maximize its use. After all, the value of information is measured by its ability to be translated into knowledge and utilized fully by its users. Situational Analysis Key Developments for 2015-2017
Below are the statistics-related activities that support development and improvement of the statistical processes in the Regional Statistical System (RSS) for better information dissemination and use of timely, relevant and reliable general-purpose official statistics:
1. Annual publication of the Regional Social and Economic Trends (RSET);
2. Establishment of statistical information centers/libraries at the Philippine
Statistics Authority (PSA) regional and provincial offices in the Bicol Region; 3. Establishment of the PSA Regional Statistical Service Office (RSSO) V website
that serves as hub for relevant statistical information;

Bicol Regional Statistical Development Program 2018-2023 12
4. Observance of the National Statistics Month (NSM) celebration during the month of October;
5. Establishment of statistical exhibits showcasing statistical publications and other
statistical information sheets;
6. Publication of the PSA RSSO V Annual Report; and
7. Conduct of data dissemination fora featuring relevant statistics Issues and Concerns
Restriction of data accessibility due to Republic Act No. 10173 also known as “Data Privacy Act of 2012”. The law aims to “protect the fundamental human right of privacy, of communication while ensuring the free flow of information to promote innovation and growth” (RA no. 10173. Chap. 1, Sec. 2) While the goal is for the common good, the Statistical data dissemination is affected. It further encourages the data subjects to exercise their rights to privacy. They can order or request the removal of his/her personal data from the filing system thus restricting the data accessibility and accuracy of the data gathered.
Poor internet connectivity. The Philippines continues to have one of the slowest internet connection speeds in Asia Pacific. The Philippines is the second lowest in terms of average peak connection speeds. Poor internet connectivity hinders dissemination of statistical information and obstructs the extensive utilization of statistics.
Lack of statistical data appreciation. The publication of the RSET is one of PSA’s mode for information dissemination. Dissemination of statistical information is very important however; the lack of statistical data appreciation may lead to misinterpretation of statistics.
Not updated sectoral data. Sectoral data pertains to the data related with the areas of agriculture, natural resources, agrarian reform, mining and quarrying, manufacturing, electricity, gas and water, energy, construction, foreign and domestic trade, services, science and technology, finance, investment, population, women and gender, health, nutrition, education, labor and employment, social welfare, governance, public order and justice. Inefficient sectoral data may delay the information dissemination of relevant statistical information which are important in the development of each sector.
Delay in the processing and release of data. The data needs to be processed and released on time. When data is delayed, the whole process is affected. The problems and issues which are to be resolved with the help of the generated data is delayed and solutions are not proposed and initiated.
Most available data to support local development planning are at the national and
regional level. Local development planning requires certain data to support the issues which are to be resolved. Unfortunately, the most available data to support local development are

Bicol Regional Statistical Development Program 2018-2023 13
only at the national and regional level. Local units lack the necessary data to support the development planning in the local level.
Lack of offsite data back-up. The digital age marks the importance of having a backup of the most important information and files. Offsite data can be accessed from any location when needs arise. It is also a convenient way to secure the information stored in it. The lack of offsite data back-up is an unsafe option for it does not keep all information safe. In an event of a technical malfunction, data and other necessary information may not be able to be restored.
Absence of data repository system. A data repository system allows the access and storage of data in a system. It is a convenient way to disseminate important statistics to the concerned personnel.
Lack of data with granular disaggregation. Disaggregation of data is important in the local development. Regional and National Statistics data have been made for the sake of national and regional development. There is still a need for local units to have access to data in the local level therefore data must be properly disaggregated solely for the purpose of having national, regional and local developments. Statistical Projects, Activities and Programs (PAPs) for 2018-2023
The government implements the following statistical projects, activities, and programs to improve statistical information management and dissemination, such as the following:
1. Conduct of dissemination fora;
2. Advocacy of tri-media data dissemination;
3. Conduct of periodic inter-agency information caravan;
4. Conduct of training on data review and analysis;
5. Provision of incentives or awards to local government units (LGUs) that conducts Community Based Monitoring System (CBMS); and
6. Adherence to Gender and Development (GAD) in terms of disaggregation of data.


Bicol Regional Statistical Development Program 2018-2023 14
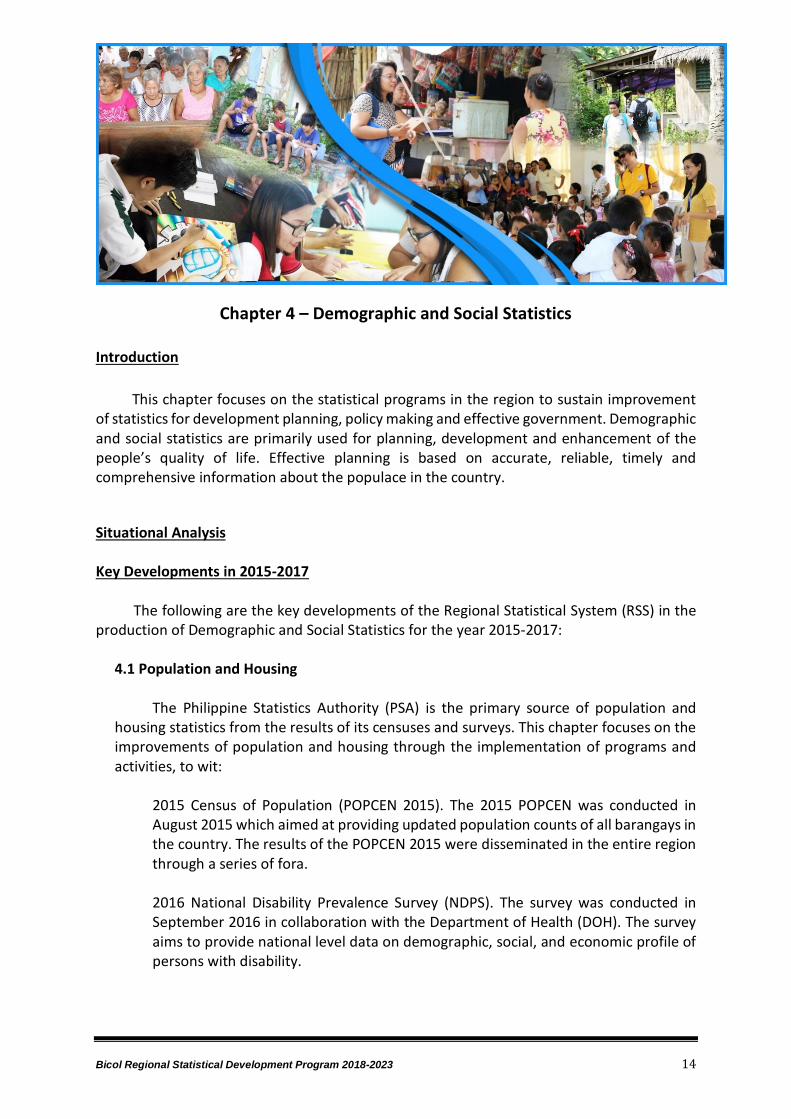
Chapter 4 – Demographic and Social Statistics
Introduction
This chapter focuses on the statistical programs in the region to sustain improvement of statistics for development planning, policy making and effective government. Demographic and social statistics are primarily used for planning, development and enhancement of the people’s quality of life. Effective planning is based on accurate, reliable, timely and comprehensive information about the populace in the country.
Situational Analysis Key Developments in 2015-2017
The following are the key developments of the Regional Statistical System (RSS) in the production of Demographic and Social Statistics for the year 2015-2017:
4.1 Population and Housing
The Philippine Statistics Authority (PSA) is the primary source of population and housing statistics from the results of its censuses and surveys. This chapter focuses on the improvements of population and housing through the implementation of programs and activities, to wit:
2015 Census of Population (POPCEN 2015). The 2015 POPCEN was conducted in August 2015 which aimed at providing updated population counts of all barangays in the country. The results of the POPCEN 2015 were disseminated in the entire region through a series of fora. 2016 National Disability Prevalence Survey (NDPS). The survey was conducted in September 2016 in collaboration with the Department of Health (DOH). The survey aims to provide national level data on demographic, social, and economic profile of persons with disability.

Bicol Regional Statistical Development Program 2018-2023 15
2017 National Demographic and Health Survey (NDHS). It was conducted from August to October 2017 to respond to the need for baseline data in support of the Sustainable Development Goals (SDGs). A computer-aided personal interview (CAPI) was utilized during the data collection. Yearly conduct of the Survey on Overseas Filipinos (SOF). The SOF is conducted every year as a rider to the October round of the Labor Force Survey. This survey aims to gather information on Filipino citizens who left for abroad during the last five years. 2010 CPH based Population projections at sub-national levels. The 2010 Census-Based Regional and provincial projected populations by five-year age group, by sex and by five-calendar year was released in 2016
4.2 Civil Registration and Vital Statistics
Civil registration is the main source of vital statistics such as births, deaths, fetal deaths and marriages which are significant inputs for monitoring the country's population growth. This chapter focuses on the improvements in civil registration and vital statistics through the implementation of programs and activities, to wit:
Conduct of Customer Satisfaction Survey (CSS) in the Civil Registry System (CRS) outlet Conduct of mobile registration. This activity is conducted by the Local Civil Registry Office in cooperation with the PSA Civil Registration Month celebration in February. Activities initiated includes mass wedding, mobile registration with the local civil registry office, free issuance of security paper (SECPA) among others Conduct of CRVS Trainings and Seminars, Information Dissemination and Advocacy Campaign thru Information and Education Campaign (IEC) Implementation of the Batch Request System (BREQS), Decentralize Vital Statistics System (DVSS), Barangay Civil Registry System (BCRS), Philippines Civil Registry Information System (PhilCRIS), Analysis of Causes of National Deaths for Action (ANACONDA), and Issuance of Certificate for Registration of the Authority to Solemnize Marriage (CRASM).
4.3 Labor and Employment
As the primary statistical arm of the government by virtue of the RA 10625, labor and
employment statistics pertaining to labor market situation are done by the PSA thru regular surveys. This chapter focuses on the improvements of labor and employment through the implementation of the following programs and activities:
Bicol Regional Statistical Development Program 2018-2023 16
Conduct of the Quarterly Labor Force Survey (LFS) using the new Master Sample Design, the Philippine Standard Occupational Classification (PSOC) and the Philippine Standard Industrial Classification (PSIC). Agricultural Wage Rate Survey (AWRS) formerly named Agricultural Labor Survey (ALS), it focuses mainly on generating information on cost of farm labor. Inclusion of agricultural sector in the PSA’s establishment-based surveys such as the Occupational Wages Survey (OWS), Integrated Survey on Labor and Employment (ISLE) and Labor Turnover Survey (LTS). Quarterly Survey of Philippine Business and Industry (QSPBI) and the Annual Survey of Philippine Business and Industry (ASPBI).
4.4 Education and Culture
The following presents statistical development programs that address issues and
demands for education and cultural statistics. Several programs and undertakings to generate designated statistics on education and culture were fulfilled by various agencies in the region, to wit:
Implementation and continuous improvement of the Enhanced Basic Education Information System (EBEIS) and Learner Information System (LIS), to establish accurate and reliable registries of learners and schools which will ensure availability of data and information needed for planning and budgeting, allocation of resources and setting operational targets to provide access to complete quality basic education. Updating of the Impact Evaluation Study (IES) of Technical Vocational Education and Training (TVET) Programs to capture information on the graduates and their absorption and employability in the labor market. Implementation of the CHED Electronic Collection and Knowledge System (CHECKS) which improves the availability of data for making informed decisions and efficient generation of reports and other data requirements. The regular conduct of the Functional Literacy, Education and Mass Media Survey (FLEMMS) by the PSA which presents comprehensive statistics on the latest status of literacy, education, and mass media exposure of Filipinos.
4.5 Health and Nutrition
Timely, comprehensive and reliable statistics is the most effective means in addressing issues and concerns on Health and Nutrition. This chapter summarizes the key statistical programs meant to improve the quality of existing health and nutrition statistics as well as to develop new and more relevant critical statistics and indicators, to wit:
Bicol Regional Statistical Development Program 2018-2023 17
Periodic conduct of surveys of PSA such as National Demographic and Health Survey (NDHS), National Disability Prevalence Survey (NDPS) and Global Adult Tobacco Survey (GATS) – in collaboration with Department of Health (DOH). Compilation of the Philippine Health Statistics and Local Health Accounts Implementation of the Field Health Service Information System (FHSIS) which is a major component of the network information sources developed by the DOH to enable it to better manage the nationwide health service delivery activities. It is intended to address the short-term data needs of DOH staff with managerial/supervisory functions in DOH facilities and in each of the program areas. The Unified Health Management Information System (UHMIS) of the DOH collection, processing, reporting and use of the information is necessary for improving health service efficiency and effectiveness. It will assist in the management and planning of health programs. Specifically, the development of the UHMIS will put in place standards related to policy formulation, data collection and transmission, data analysis, presentation, reporting and utilization. The integrated clinic information system (iClinicSys) is primarily designed to generate the required national health statistical requirements such as Field Health Services Information System (FHSIS), Disease Registry Reports and etc. It is an electronic medical record and health information system that supports the function of primary health care facilities including Rural Health Units (RHUs), Health Centers (HCs) and Barangay Health Station (BHS). It aims to automate service delivery processes to efficiently and effectively monitor patient care in the health facility. It is a hybrid software that can run in an offline and online environment. It generates electronic medical record of patients that allow health care providers to track patient’s data. The system is designed, compliant to national health data standards for systems interoperability with the Department of Health, Philippine Health Insurance Corporation and other government agencies reporting requirements. iClinicSys is one of the ehealth solution that supports health information exchange and sharing of data using nationally defined interoperability standards. Through iClinicSys, health information is within your reach and gives you real time data. Further, the said software is given to the LGUs for free. 2015 Updating of Nutritional Status of Filipino Children and Other Population Groups of FNRI. The partnership forged among the Department of Science and Technology (DOST), Philippine Health Insurance Corporation (PHIC) and Department of Health (DOH) to come out with the Philippine Health Information Exchange (PHIE) is an initiative that would ensure accurate and timely health information exchange that can be instrumental in improving the services of these three agencies as well as the other organizations that could use the said data.

Bicol Regional Statistical Development Program 2018-2023 18
4.6 Social Protection
Social protection consists of policies and programs designed to reduce poverty and vulnerability by promoting efficient labor markets, diminishing people's exposure to risks, and enhancing their capacity to manage economic and social risks, such as unemployment, exclusion, sickness, disability and old age. The following features the statistical programs conducted to improve collection and compilation of social protection statistics and indicators towards better surveillance and monitoring, to wit:
Implementation of the Listahanan or the National Household Targeting System for Poverty Reduction (NHTS-PR) of the Department of Social Welfare and Development (DSWD) which is an information management system that identifies who and where the poor are in the country. The system makes available to national government agencies and other social protection stakeholders a database of poor families as reference in identifying potential beneficiaries of social protection programs. The regular conduct of the Family Income and Expenditures Survey (FIES) and Annual Poverty Indicators Survey (APIS) of the PSA includes an item referring to the survivor's benefit received by the respondent. Implementation of the Community-Based Monitoring System (CBMS) of the NAPC which aims to design and pilot community-based systems for monitoring poverty in its multidimensional sense. It is an organized way of collecting information at the local level for use of local government units, national government agencies, non-government organizations, civil society and development partner agencies for planning, program implementation and monitoring.
4.7 Security, Justice and Peace
Without peace, stability and effective governance based on the rule of law,
sustainable development cannot be achieved. Seemingly endless cycles of violence have a destructive impact on a country’s development, with citizens bearing the burden of insecurity and injustice. Security and Justice enable peaceful, just and inclusive societies. The various statistical development programs that address issues and concerns for security, justice and peace, are as follows:
Regular conduct of the Crime Victimization Survey (CVS) of the PSA. It is an ad-hoc activity that aims to provide information on victimization risks, safety measures of victims and the community and crime reporting. Implementation of the e-Blotter System of the PNP which sets a standard crime recording procedures wherein all crime incidents are reported to the police stations and stored electronically in a database system. Third round of Listahanan which is being conducted every four years by the DSWD.

Bicol Regional Statistical Development Program 2018-2023 19
4.8 Governance
Governance is the systems and processes that ensure the overall effectiveness of an entity – whether a business, government or multilateral institution. Promoting good governance is a multi-dimensional challenge, which requires efforts that are mutually reinforcing. This covers development programs and activities to generate statistics on governance, such as, Interagency Committee on Governance Statistics (IACGovStat).
Issues and Concerns
Few students specialize in Statistics because Statistics courses are not offered in Region V. Students in Region V who wish to major in Statistics and other statistics-related courses and tracks are restrained from taking such courses because the institutions which offer such courses are outside of the region. The University of the Philippines, De La Salle University, and University of Sto. Tomas are only some of the higher institutions outside the region that offer Statistics courses.
Different concepts are used between the administrative data and the PSA. Concepts
between the administrative data and the PSA are used differently, however, there is a need to centralize these concepts to gain similar outcomes and results.
There is an increase demand for statistics but with limited manpower to respond to the
growth of demand. The demand for economic and overall development of the country continually increases thus leading to the multiplication of statistical demands. However, this growing demand in statistics requires more manpower to generate data from the concerned respondents. With the limited manpower, statistical data cannot be generated as soon as it is needed by the government and as a consequence, the country’s overall development is delayed.
Training packages for statistical trainings are not affordable. Thus, limit the number of
those who has access to the trainings. Trainings are important to the growth and development of human resource. Such trainings guide and prepare the persons responsible for generating, interpreting, and disseminating statistical data. Since statistical trainings are too expensive and only financially capable persons are able to afford them, the number of participating persons is limited and human resource growth is obstructed.
Processing and release of data are delayed. When data processing and release are
delayed, appropriate actions and solutions towards steering issues and concerns are also delayed. The whole process of finding solutions to issues that may arise is postponed and such issues cannot be resolved immediately.
Lack of updated and local-level disaggregated data to support local development
planning (poverty; Income). Local development planning entails data that would prove its need for development. Unfortunately, data are only available in the national and regional level leaving the local level with insufficient data to start on.
Bicol Regional Statistical Development Program 2018-2023 20
Lack of regular updated sectoral data. The regular update of sectoral data can help in the monitoring of the developments and concerns among the different sectors. Even the slightest change can be monitored, and immediate solutions can be made relevant to the needs. The lack of regular updated sectoral data can impede immediate response to these changes.
Lack of harmonized information system. Decentralized information system can be
inconvenient. The access to a harmonized information system can be a great convenience to those who need such access. While information is included in a harmonized information system, it would be easy to gain information from the same information system when it is highly essential.
Absence of a policy on the regular conduct and complete coverage among LGUs of
CBMS. The Community-Based Monitoring System (CBMS) has been adapted by the Philippines since 2000. It aims to provide policymakers and program implementers with a good information support for tracking various changes and impacts of macroeconomic reforms. The LGUs monitor CBMS however there is a lack of policy on its regular conduct and its complete coverage.
Slow Internet connectivity in Bicol which hamper the services to the clients. Institutions
and agencies that are reliant to internet connectivity is concerned about the slow internet connectivity in the region. The Civil Registration Services which is hampered by the poor internet connectivity, results to longer period of transactions and limited number of clients attended.
Statistical Projects, Activities and Programs (PAPs) for 2018-2023
The government implements the following statistical projects, activities, and programs to improve demographic and social statistics:
• Conduct of the periodic censuses and surveys;
o 2020 Census of Population and Housing (CPH) o Household Population by Single Year Age Classification by Province, City and
Municipality. This survey is being used by Department of Education (DepEd) to identify how many are not in school and also as basis to compute the participation rate.
o 2022 Census of Agriculture and Fisheries (CAF) o 2018 National Migration Survey (NMS) o 2018 Family Income and Expenditure Survey (FIES) o Survey on Overseas Filipinos (SOF) o Labor Force Survey (LFS) o Agricultural Wage Rate Survey (AWRS) o Integrated Survey on Labor and Employment (ISLE) o National Demographic and Health Survey (NDHS)
Bicol Regional Statistical Development Program 2018-2023 21
o Global Adult Tobacco Survey (GATS)
• Data dissemination of the results of the census and surveys are being conducted by PSA through fora;
• Continuous monitoring and implementation of the Civil Registration and Vital Statistics activities and programs to enhance and improve the level of registration of all vital events thru conduct of trainings and registration and information dissemination activities like CRVS trainings/mobile registration and Advocacy Campaign thru Information and Education Campaign (IEC);
• Regular updating of the database of workers in the informal sector; • Regular compilation and improvement of the Philippine National Health Accounts
(PNHA); • Regular conduct of Customer Satisfaction Survey (CSS); • Improvement and updating of information systems (CHECKS, EBEIS, LIS, FHSIS, UHMIS,
CHITS, e-Blotter System); • Institutionalization of Crime Victimization Survey (CVS); and • Improvement and enhancement of the Batch Request System (BREQS), Decentralize
Vital Statistics System (DVSS), Barangay Civil Registry System (BCRS), Philippines Civil Registry Information System (PhilCRIS), Analysis of Causes of National Deaths for Action (ANACONDA) and Issuance of Certificate for Registration of the Authority to Solemnize Marriage (CRASM).
Bicol Regional Statistical Development Program 2018-2023 22
Chapter 5 – Economic Statistics
Introduction
This chapter presents the strategic plan for the generation of economic statistics on macroeconomic accounts, industry, trade, services, investment, agriculture and fisheries, energy, gas, water, transport and infrastructure, tourism, monetary, price and finance, science and technology and innovation. Timely, accurate, complete, and reliable Economic Statistics play a crucial role in the development of programs and policies that would facilitate economic production, consumption and investments. Situational Analysis Key Developments in 2015-2017
The following are the key developments of the RSS in the generation of statistics on
economics from 2015 to 2017.
5.1 Macroeconomic Accounts
Publication of the RSET. RSET is a publication of local level statistics and presents annual time series data on various sectors of the region and its component provinces, cities, and municipalities. It also contains data that are disaggregated in different dimensions and includes a glossary of terms of official concepts and definitions for statistical purposes. Stakeholders use RSET in the formulation of their policies and programs.
GRDP Estimation. The GRDP measures the economic performance of a region through goods and services produced by all households and establishments domestically. The GRDP is subdivided into three major economic sectors: (1) Agriculture, Hunting, Forestry and Fishing (AHFF); (2) Industry; and (3) Services.

Bicol Regional Statistical Development Program 2018-2023 23
5.2 Industry, Trade, Services and Investment
Conduct of ASPBI from 2015-2017. The Annual Survey of Philippine Business and Industry was conducted yearly. This survey aims to provide planners and policy-makers in government, as well as the private sector, with information on the levels and structure of economic activities. It generates data on number of establishments, employment, compensation, revenue, costs, fixed assets, capital expenditures, inventories, and value added by industry classification for easy reference by data users.
5.3 Agriculture, Livestock and Fisheries
2017 Listing of Farm Households. The PSA conducted the 2017 Listing of Farm
Households (LFH) in September 2017. It aims to update the sampling frame for agricultural based surveys. The survey is part of a comprehensive effort of the PSA to improve agricultural statistics data systems.
Updating of List of Aquaculture Farms. The Updating of the List of Aquaculture
Farms (ULAF) is concerned of updating the sampling frame of the aquaculture subsector. The updated sampling frame will be used in the quarterly survey of aquaculture farms.
5.4 Energy, Gas, Water
Conduct of Water Quality Testing. In 2017, the Water Quality Testing was conducted as a rider survey to the 2017 APIS. It aimed to provide a nationally-representative assessment of the quality of water that people drink in their homes and the quality of water from their drinking sources. The questions were intended to respond to some of the data requirements of the Sustainable Development Goal 6 – ensure access to water and sanitation for all.
5.5 Transport and Infrastructure
Availability of regional and provincial data on modes of transportation and road
length in the Regional Social and Economic Trends.
5.6 Tourism
Conduct of 2014 STEP. The 2014 STEP was conducted in 2015 to gather data on tourism characteristic establishments in the country. It collected information on the available supply of tourism goods, products and services, which are valuable inputs in the compilation of the PSTA (Philippine Tourism Satellite Accounts).
5.7 Monetary, Price and Finance
Statement of Income and Expenditure of Local Governments. This presents data
on the average income of provincial, city and municipal LGUs and their income classification. It also includes data on internal revenue collections of LGUs, and data

Bicol Regional Statistical Development Program 2018-2023 24
pertaining to the annual statement of receipts and expenditures classified by level of government. The sources of data are the Bureau of Internal Revenue and the Bureau of Local Government Finance of the Department of Finance.
Electronic Statement of Receipts and Expenditure Version 3
Availability of Data on Money and Banking. This presents data on the number of offices of the financial system in Bicol Region, total deposits by type and financial institution, operating income, loan portfolio and combined resources of banking offices. The source of data is the Bangko Sentral ng Pilipinas.
5.8 Science and Technology and Innovation
Availability of Science and Technology and Innovation (STI) related data. Data on
STI are mostly produced through the administrative based data reporting systems of DOST and its attached agencies. The PSA conducts some statistical surveys such as the Survey on Information and Communication Technology (SICT).
Issues and Concerns
There is a lack of disaggregated data relevant to provincial, city, municipal, and barangay levels to support local development planning. Most of the surveys conducted by the PSA relative to economic statistics have sample size enough to generate statistics on the regional level. Disaggregated data pertinent to the local development planning in the provincial, city, municipal and barangay levels are not produced. Since the generated statistics is only relevant to the regional level, local units become dependent to the regional development and local-level developments are overlooked.
Line agencies who conduct these surveys have limited manpower to respond to the increasing demand for statistics. The increasing demand for statistics requires more manpower to respond to this growth. Surveys and other statistics related data gathering methods require manpower to generate important data on economic statistics however the delimited number of persons that conduct such surveys is one of the major issues in the growth and development of the economy.
Slow Internet connectivity in Bicol hampers the services to the clients. Services dependent on internet connectivity are affected because of the slow internet connection. As a result, limited number of clients are served and communication to other concerned agencies are also affected.

Bicol Regional Statistical Development Program 2018-2023 25
Statistical Projects Activities and Programs (PAPs) for 2018-2023
The government implements the following statistical projects, activities, and programs to improve economic statistics: • Line agencies producing these economic statistics will continue to conduct statistical
surveys and activities to meet up with the demand for these statistics;
• To keep up with the demand for economic statistics, line agencies especially the PSA plans to develop and launch automated statistical reporting system for a more effective and efficient generation of statistics.; and
• Harmonization of Statistical Tools.

Bicol Regional Statistical Development Program 2018-2023 26
Chapter 6 – Environment and Multi-Domain Statistics
Introduction
This chapter aims to discuss the framework and system for the generation and dissemination of environment and natural resources (ENR) statistics in support of the country’s social and economic development goals.
The development of environmental statistics goes hand in hand with the development of environmental management and technology. The absence of environment information systems would make it impossible to define and describe the environmental-economic and social interrelations that highly influence other facets of human development such as economic activities, investments, labor and employment, foreign trade, price levels and others, in a more comprehensive aspect- all the factors that determine the welfare of an individual, every community, province, region and the welfare of the nations as well. This was the very reason for an increasing interest among decision-makers in a higher quality and complex environment statistics, suitable for developing the nation’s policy therein.
The Bicol region in the next five years gears toward an environment that is conducive to the life at present and the future generations of the Filipinos. Likewise, our pursuit towards sustainable development is constantly being challenged by disasters which affect the environment and living conditions of Bicolanos. The existing natural and human-induced hazards and the region’s vulnerabilities expose Bicolanos to higher degree of disaster risks.
The evolution on the environmental concern has increased tremendously and swiftly because of the effect of environmental issues on the significance of social and economic significance
Situational Analysis
Key developments in 2015-2017
The following are key developments of the RSS in the generation of Environment and Multi-Domain Statistics for the period 2015-2017:
Bicol Regional Statistical Development Program 2018-2023 27
6.1 Environment and Natural Resources
Data on ENR statistics is primarily obtained from DENR and its various bureaus and attached agencies and are generated from a mix of statistical surveys, field assessments, monitoring stations, scientific measurements and administrative based data reporting systems.
Compilation of ENR Statistics for Operations and Management. The DENR released two editions of the Compilation of ENR statistics for Operations and Management. The compilations comprised statistics on the following topics: forest management; biodiversity management; mines and geosciences; land management; environmental management; water resource; and gender and development. Generation of Updated ENR data with more area-specific disaggregation through surveys, assessments, inventory, and environmental monitoring stations. This involves: • In-depth assessment of selected watersheds and coastal areas in the region
to climate change • Monitoring and constant assessment of air quality under the “Clean Air Act”. • Monitoring and assessment of principal rivers and water bodies under the
“Clean Water Program.” • Classification of water bodies under the Clean Water Program • Monitoring of hazardous waste generation under the Hazardous Waste
Management Program Conduct of Biodiversity Monitoring System (BMS). Conducted on quarterly basis using the four methods namely; field diary, transect walk/swim, photo documentation and focus group discussion to monitor the trends in biodiversity and uses to guide action in protected area management.
Conduct on Orientation on 2013 Framework for the Development of Environment Statistics (2013 FDES in 2016). The FDES is a multi-purpose conceptual and statistical framework that is comprehensive and integrative in nature and mark out the scope of environment statistics. It provides an organizing structure to guide the collection to guide the collection and compilation of environment statistics at the national and regional levels. The Orientation was attended by PSA staff and representatives from different RLAs where data producers and users of environment statistics are.

Bicol Regional Statistical Development Program 2018-2023 28
6.2 Income, Poverty and Hunger There are many inter-related issues causing hunger, which are related to
economics and other factors that cause poverty. Solving poverty and hunger in the conventional sense will not tackle poverty that leads to hunger in the first place. Further, there is a risk of continuing the poverty and dependency without realizing it, because the act of attempting to provide more food etc. can appear so altruistic in motive. To solve poverty and hunger in the long run, poverty alleviation is required. Poverty is the result of mainly from people’s insufficient resources, income, or means to be able to survive or live a decent life. While in a more real world, these concepts are much more complex. The interrelationship points to a simple realization that in order to address poverty and hunger, there should be at least reasonable income to satisfy human basic needs.
For government and stakeholders of poverty alleviation to better monitor
outcomes of anti-poverty programs, including progress towards the SDGs, a compressive poverty monitoring and indicator system is needed to ensure the production and analysis of timely and quality statistics on income, poverty, hunger, and other human development statistics.
This chapter tackles key strategies that are aimed to ensure the availability of quality income, poverty and hunger statistics in support of society’s efforts to reduce poverty and achieve human development for all, to wit:
Use of 2013 Master Sample on Surveys of PSA. The number of samples in the household surveys of the PSA increased in order to generate estimates on poverty, income and hunger at the regional and provincial level.
Conduct of Social Welfare Development Indicators (SWDI). SWDI is a tool that aims to determine the level of well-being of Pantawid Beneficiaries so that appropriate interventions will be provided to them not just by DSWD, but the other Social Protection Programs Implementers as well. It also serves as the reference in the case management of beneficiaries-to help them gain their fighting chance against poverty.
Successful launching of LISTAHANAN 2 Database of poor households. The Listahanan is an information management system that identifies who and where the poor are. It makes available to national government agencies and other social-protection stakeholders a socio-economic database as basis for identifying beneficiaries of their programs and services like the 4Ps and PhilHealth Indigent Program.
Incorporation of rider questions related to various programs and services on income, poverty and hunger alleviation in surveys conducted by PSA. This includes Pantawid Pamilyang Pilipino Program (4Ps), Sustainable Livelihood Program,
Bicol Regional Statistical Development Program 2018-2023 29
Social Pension Program, Supplementary Feeding Program, Residential and Non-Residential Facilities, among others.
6.3 Gender and Development
To have a profound child development and gender equality are one of society’s
moral obligations, one that transcends political, economic, and social boundaries to continually strive for. The SDGs rightly emphasize the need for concerted efforts to improve the plight of children and to address gender inequalities towards reducing poverty and the worst forms of human deprivation. Specific targets and milestones for children and gender and development (GAD) include universal primary education child mortality and improved maternal health.
A lot of programs have been focused on welfare of the Children to protect them from abuse, neglect, exploitation and violence in all regions of the country. Reliable statistics on children and gender is very much essential in planning and program implementation to assess whether interventions made were effective or not sourced out from:
Conduct of National Baseline Survey on Violence Against Children. The Council for the Welfare of Children (CWC) conducted the National Baseline Survey on Violence against Children in August 2015. This is the first time that a survey was conducted to measure violence against children. The results of the survey were released in 2016.
Data appreciation and proper dissemination of statistics on children and GAD. Generation of data through the following surveys: (1) 2015 Census of Population (POPCEN); (2) 2015 Family Income and Expenditure Survey (FIES); (3) 2017 National Demographic and Health Survey (NDHS); (4) Quarterly Labor Force Survey (LFS); and (5) Agricultural Wage Rate Survey (AWRS).
Regional Social and Economic Trends (RSET publication). Among the key statistical tables and indicators found in this publication related to children and GAD are: (1) Household Population by sex and Age group; (2) Household Population 10 years Old and over by sex, Age group and Marital Status; (3) Live Births in Bicol Region, Place of Occurrence and sex; and (4) Deaths in Bicol Region by place of occurrence and sex.
Quarterly Quickstat. Quickstat is PSA’s most requested statistics. Published every month and in quarterly basis, it contains the previous month’s estimates of CPI and inflation rate plus the most recent foreign and domestic trade figures. It also contains statistics on labor and employment, manufacturing indices, family income and expenditures, population statistics and private building construction. All various census and surveys conducted, and administrative forms processed by the PSA. The Quarterly publication of Quickstat includes gender statistics.

Bicol Regional Statistical Development Program 2018-2023 30
Quarterly data of Import/Export (Foreign Trade Statistics)
MSMEs assisted data from DTI
Issues and Concerns
Although the ENR sector completed activities for the improvement and development of ENR statistics, the persistent issues and challenges hereunder hinder the sector’s full potential to generate and disseminate statistics.
There is a need on: (1) Modernizing data collection on infrastructure and technology to address user’s demand for timely, relevant and accurate ENR data; (2) Constructing mechanisms to assess and review data quality and methodologies; (3) Strengthening communication tools and strategies in order to facilitate data usage of stakeholders; (4) Increasing human and financial resources in order to address the demand for more and improved ENR statistics; and (5) Strengthening the skills and capabilities of personnel producing ENR data.
Generation and production of ENR data remain fragmented and uncoordinated.
There is a need to formulate on the measure and assessment of the environmental concerns, specifically;
Clean air monitoring. Fair to good air quality index was noted. The 2015 assessment results of LGUs were able to formulate the air quality condition in the cities of Legazpi, Iriga, and Naga where sample filters were taken and analyzed, showed fair to good quality index that is compliant to the National Ambient Quality Guideline Values. The major sources of air pollution are mobile source, area source, and stationary source.
Forest and Watershed. Reforestation and rehabilitation of degraded forestlands including critical watershed shall be given priority.
Water Quality Management. RA 9275 or the Clean Water Act of 2004 shall be strictly enforced.
Land Quality Management. One of the key strategies to ensure land quality is the promotion of sustainable land management (SLM).

Bicol Regional Statistical Development Program 2018-2023 31
Statistical Projects Activities and Programs (PAPs) for 2018-2023
The government implements the following statistical projects, activities, and programs to improve environment and multi-domain statistics:
• The conduct of PSA of the following regular surveys; - Labor Force Survey (LFS) - Family Income and Expenditures Survey (FIES) - Annual Poverty Indicators Survey (APIS) - Agricultural Wage Rate Survey (AWRS) • Provincial Level estimation of data results for FIES; • Enhancement of Information dissemination of statistical data and the proper way of
interpreting the data; • Provincial, City or Municipal Statistics Committee must also be established to support
the Regional Statistics Committee; • Grassroots level advocacy through the preparation and dissemination of local statistical
publications and other forms of media; • Establishment of Small Area Estimation (SAE) technique to generate provincial or even
municipal level data disaggregation; • Statistical compiling of different environment and economic through the System of
Environmental Economic Accounting (SEEA); • Commitment to strengthen partners in ensuring timely and complete data necessary in
monitoring SDGs; • Establishment of the Regional Environmental Committee that will oversee and monitor
government agencies, LGUs programs and projects pertaining to the environmental issues and concerns;
• Generation of updated ENR data with more area-specific disaggregation through
surveys, assessments, inventory, and environmental monitoring stations;
• Generation of data from administrative-based information systems; • Development of statistical reports, publications and analytical papers on ENR and
related concerns; • Closely coordinate with the Regional Offices of Department of Natural Resources and
Environmental Management Bureau to conduct more awareness regarding environmental issues and programs;
Bicol Regional Statistical Development Program 2018-2023 32
• Environmental-economic accounts provide the conceptual framework for integrated
statistics on the environment and its relationship with the economy, including the impacts of the economy on the environment and the contribution of the environment to the economy. A coherent set of indicators and descriptive statistics can be derived from the accounts that inform a wide range of policies, including, but not limited to, green economy/green growth, natural resource management and sustainable development.
The System of Environmental-Economic Accounting (SEEA) contains the internationally
agreed standard concepts, definitions, classifications, accounting rules and tables for producing internationally comparable statistics on the environment and its relationship with the economy. The SEEA is a flexible system in the sense that its implementation can be adapted to countries' specific situations and priorities.
In Bicol Region, this includes clean air monitoring, forest and watershed rehabilitation, water quality management and land quality management which specifically being monitored and to continuously improve air quality condition, various capacitate the faculty members of the interventions were conducted in the region. Pursuant to RA 8749 or Philippine Clean Air Act of 1999, the DENR -EMB continuously implemented the Bantay Tambutso Program, intensified the anti-smoke belching campaign and conducted roadside monitoring apprehension to ensure compliance with motor vehicle emission standards.
Three airsheds were also designated in Naga City, Legazpi City, and Bacon-Manito, to
implement an effective air quality management in their respective areas. Forest and watershed protection will be supported by protecting and conserving the existing forest ecosystem particularly its biodiversity to ensure the sustainability of forest services. Land administration and management shall be improved by strengthening the partnership between and among various agencies of the government. Water quality monitoring shall be enhanced by maintaining the number of water monitoring stations and establishing the required number of water quality management areas. The improvement of sewage and septage facilities in the urban areas, and establishment of waste water and septage treatment facility in firms and manufacturing industries shall be observed. The major programs, activities and projects to be implemented in support to these strategies include Adopt- an-Estero Program, Sagip-Ilog Program and IEC campaigns, among others. Activities such as capacity building of LGUs on planning and management of land resources, as well as integration of SLM into sectoral, national, and local development plans shall be given priority. The management of solid, toxic and hazardous waste shall be enhanced. Compliance of LGUs to RA 9003 or the Ecological Solid Waste Management Act of 2000 in relation to the establishment of MRFs and sanitary landfills shall be enforced. Practice of 3Rs (reduce, reuse, recycle) and proper waste management, particularly in the local and household level, shall be strengthened. Agricultural waste disposal shall be improved, and green manuring and composting shall be promoted.

Bicol Regional Statistical Development Program 2018-2023 33
6.4. Sustainable Development Goals
The Sustainable Development Goals (SDGs) which is also known as the Global Goals, Transforming our World: The 2030 Agenda for Sustainable Development” are new, universal set of goals, targets and indicators the UN members states will be expected to use to frame country agendas and policies over the next 15 years. It consists of 17 goals, 169 targets and 232 unique indicators.
In consonance with the commitment of the Philippines to achieve the SDGs, the PSA Board issued a Resolution no. 04 series of 2016, Enjoining Government Agencies to Provide Data Support to the SDGs. Likewise, another PSA Board Resolution No. 9 series of 2017 was issued, approving the initial list of Sustainable Development Goals for monitoring in the Philippines.
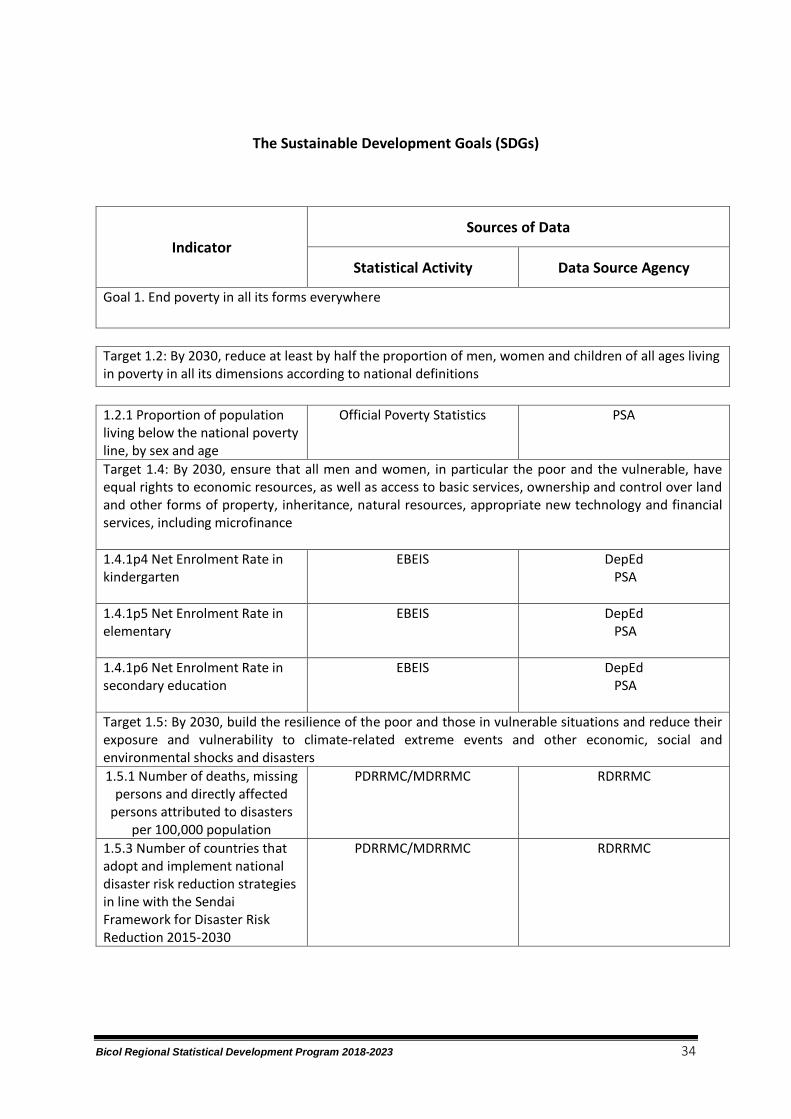
Bicol Regional Statistical Development Program 2018-2023 34
The Sustainable Development Goals (SDGs)
Indicator Sources of Data
Statistical Activity Data Source Agency
Goal 1. End poverty in all its forms everywhere
Target 1.2: By 2030, reduce at least by half the proportion of men, women and children of all ages living in poverty in all its dimensions according to national definitions
1.2.1 Proportion of population living below the national poverty line, by sex and age
Official Poverty Statistics
PSA
Target 1.4: By 2030, ensure that all men and women, in particular the poor and the vulnerable, have equal rights to economic resources, as well as access to basic services, ownership and control over land and other forms of property, inheritance, natural resources, appropriate new technology and financial services, including microfinance 1.4.1p4 Net Enrolment Rate in kindergarten
EBEIS
DepEd PSA
1.4.1p5 Net Enrolment Rate in elementary
EBEIS
DepEd PSA
1.4.1p6 Net Enrolment Rate in secondary education
EBEIS
DepEd PSA
Target 1.5: By 2030, build the resilience of the poor and those in vulnerable situations and reduce their exposure and vulnerability to climate-related extreme events and other economic, social and environmental shocks and disasters 1.5.1 Number of deaths, missing
persons and directly affected persons attributed to disasters
per 100,000 population
PDRRMC/MDRRMC
RDRRMC
1.5.3 Number of countries that adopt and implement national disaster risk reduction strategies in line with the Sendai Framework for Disaster Risk Reduction 2015-2030
PDRRMC/MDRRMC
RDRRMC

Bicol Regional Statistical Development Program 2018-2023 35
Indicator Sources of Data
Statistical Activity Data Source Agency
1.5.4 Proportion of local governments that adopt and implement local disaster risk reduction strategies in line with national disaster risk reduction strategies
PDRRMC/MDRRMC
RDRRMC
Target 1.a: Ensure significant mobilization of resources from a variety of sources, including through enhanced development cooperation, in order to provide adequate and predictable means for developing countries, in particular least developed countries, to implement programmes and policies to end poverty in all its dimensions 1.a.1.p1 Proportion of CCT budget/expenditure as direct poverty reduction program to the national budget/expenditure
DSWD
DSWD, COA, DBM
1.a.2 Proportion of total government spending on essential services
DBM
COA, DOF-BLGF (for IRA/local govt spending)
Goal 3: Ensure healthy lives and promote wellbeing for all at all ages
Target 3.1: By 2030, reduce the global maternal mortality ratio to less than 70 per 100,000 live births
3.1.2 Proportion of births attended by skilled health personnel
NDHS, Vital Statistics Report PSA
3.1.s1 Proportion of births delivered in a health facility
NDHS Admin Data
PSA
Target 3.2: By 2030, end preventable deaths of newborns and children under 5 years of age, with all countries aiming to reduce neonatal mortality to at least as low as 12 per 1,000 live births and under-5 mortality to at least as low as 25 per 1,000 live births 3.2.1 Under-five mortality rate
NDHS Vital Statistics Report
PSA
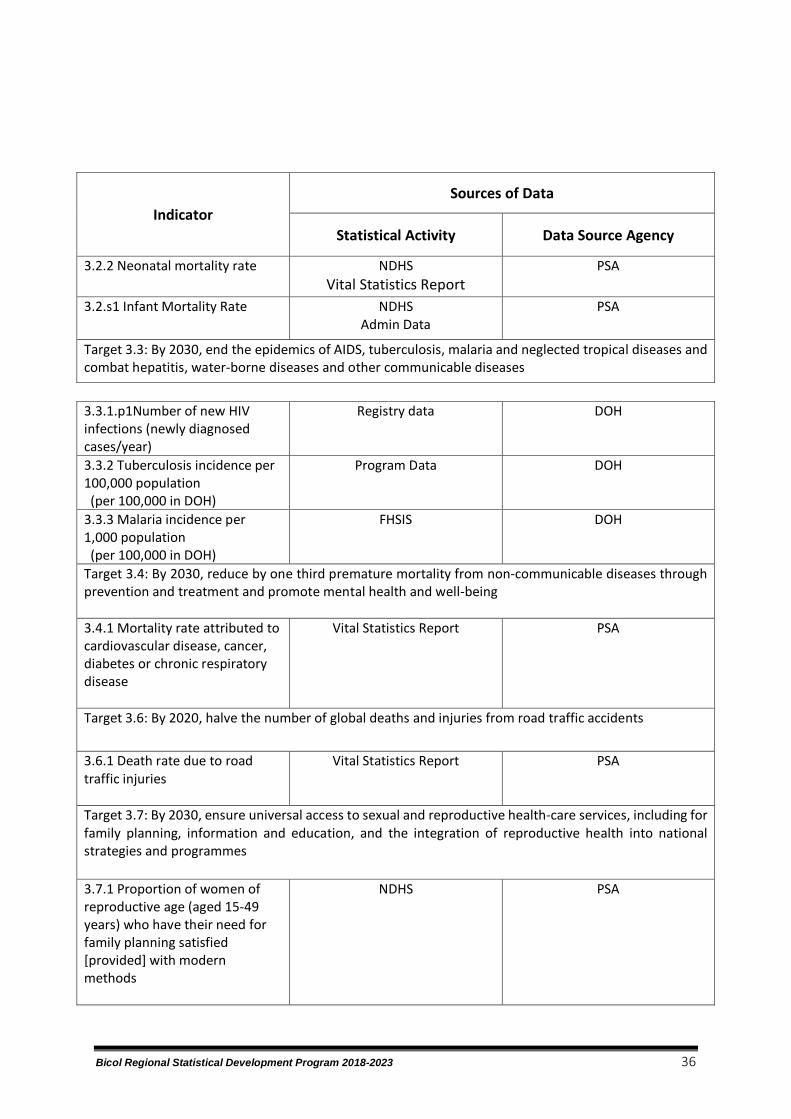
Bicol Regional Statistical Development Program 2018-2023 36
Indicator Sources of Data
Statistical Activity Data Source Agency
3.2.2 Neonatal mortality rate NDHS Vital Statistics Report
PSA
3.2.s1 Infant Mortality Rate NDHS Admin Data
PSA
Target 3.3: By 2030, end the epidemics of AIDS, tuberculosis, malaria and neglected tropical diseases and combat hepatitis, water-borne diseases and other communicable diseases
3.3.1.p1Number of new HIV infections (newly diagnosed cases/year)
Registry data DOH
3.3.2 Tuberculosis incidence per 100,000 population (per 100,000 in DOH)
Program Data
DOH
3.3.3 Malaria incidence per 1,000 population (per 100,000 in DOH)
FHSIS
DOH
Target 3.4: By 2030, reduce by one third premature mortality from non-communicable diseases through prevention and treatment and promote mental health and well-being
3.4.1 Mortality rate attributed to cardiovascular disease, cancer, diabetes or chronic respiratory disease
Vital Statistics Report
PSA
Target 3.6: By 2020, halve the number of global deaths and injuries from road traffic accidents
3.6.1 Death rate due to road traffic injuries
Vital Statistics Report
PSA
Target 3.7: By 2030, ensure universal access to sexual and reproductive health-care services, including for family planning, information and education, and the integration of reproductive health into national strategies and programmes 3.7.1 Proportion of women of reproductive age (aged 15-49 years) who have their need for family planning satisfied [provided] with modern methods
NDHS
PSA
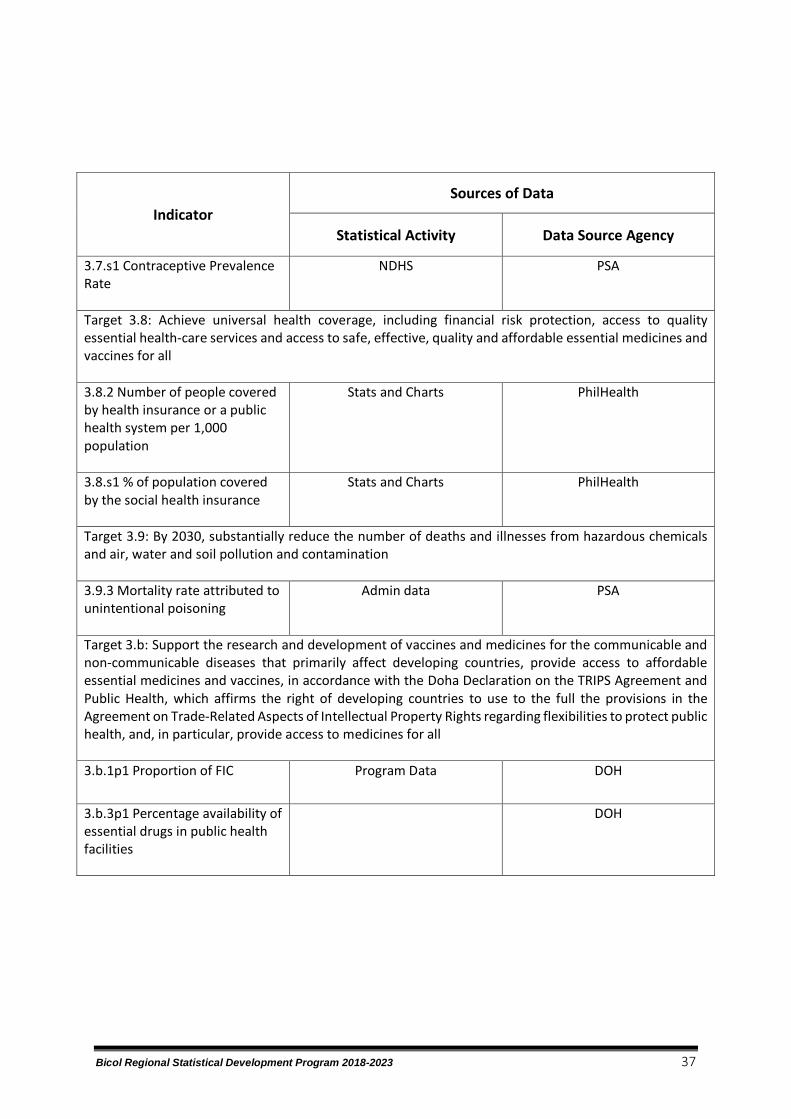
Bicol Regional Statistical Development Program 2018-2023 37
Indicator Sources of Data
Statistical Activity Data Source Agency
3.7.s1 Contraceptive Prevalence Rate
NDHS
PSA
Target 3.8: Achieve universal health coverage, including financial risk protection, access to quality essential health-care services and access to safe, effective, quality and affordable essential medicines and vaccines for all 3.8.2 Number of people covered by health insurance or a public health system per 1,000 population
Stats and Charts
PhilHealth
3.8.s1 % of population covered by the social health insurance
Stats and Charts
PhilHealth
Target 3.9: By 2030, substantially reduce the number of deaths and illnesses from hazardous chemicals and air, water and soil pollution and contamination 3.9.3 Mortality rate attributed to unintentional poisoning
Admin data
PSA
Target 3.b: Support the research and development of vaccines and medicines for the communicable and non-communicable diseases that primarily affect developing countries, provide access to affordable essential medicines and vaccines, in accordance with the Doha Declaration on the TRIPS Agreement and Public Health, which affirms the right of developing countries to use to the full the provisions in the Agreement on Trade-Related Aspects of Intellectual Property Rights regarding flexibilities to protect public health, and, in particular, provide access to medicines for all 3.b.1p1 Proportion of FIC
Program Data
DOH
3.b.3p1 Percentage availability of essential drugs in public health facilities
DOH
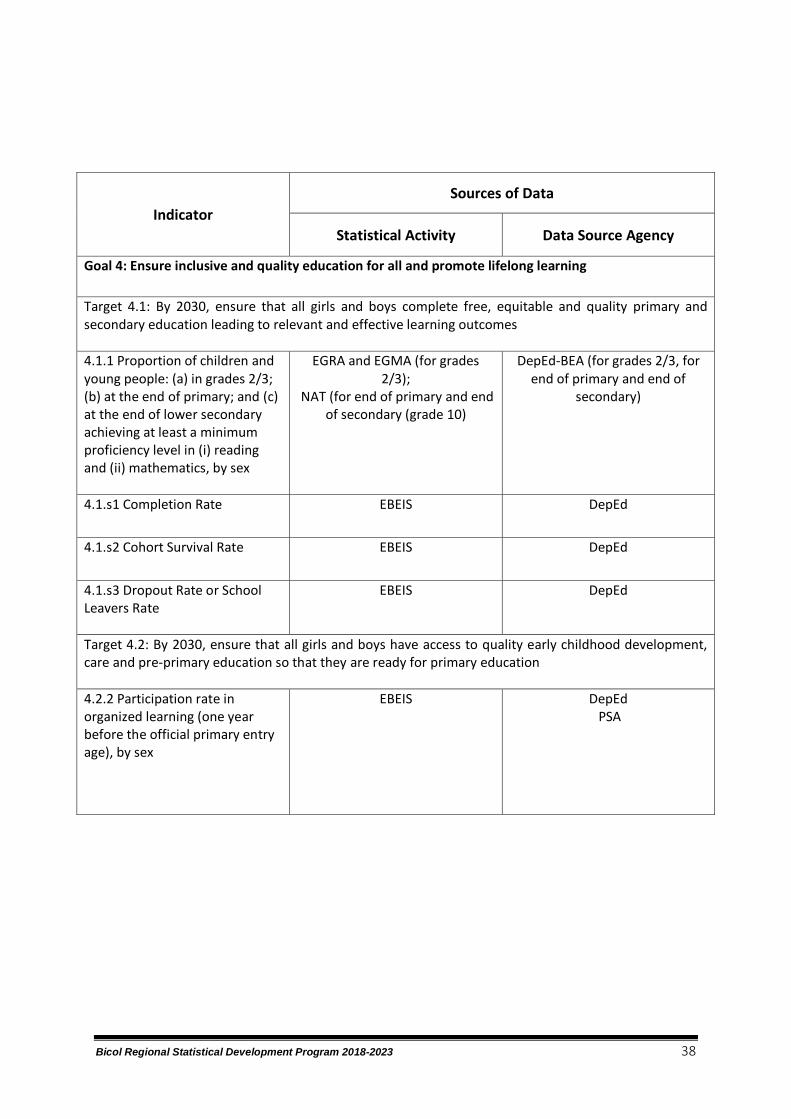
Bicol Regional Statistical Development Program 2018-2023 38
Indicator Sources of Data
Statistical Activity Data Source Agency
Goal 4: Ensure inclusive and quality education for all and promote lifelong learning
Target 4.1: By 2030, ensure that all girls and boys complete free, equitable and quality primary and secondary education leading to relevant and effective learning outcomes 4.1.1 Proportion of children and young people: (a) in grades 2/3; (b) at the end of primary; and (c) at the end of lower secondary achieving at least a minimum proficiency level in (i) reading and (ii) mathematics, by sex
EGRA and EGMA (for grades 2/3);
NAT (for end of primary and end of secondary (grade 10)
DepEd-BEA (for grades 2/3, for end of primary and end of
secondary)
4.1.s1 Completion Rate
EBEIS
DepEd
4.1.s2 Cohort Survival Rate
EBEIS
DepEd
4.1.s3 Dropout Rate or School Leavers Rate
EBEIS
DepEd
Target 4.2: By 2030, ensure that all girls and boys have access to quality early childhood development, care and pre-primary education so that they are ready for primary education 4.2.2 Participation rate in organized learning (one year before the official primary entry age), by sex
EBEIS
DepEd PSA

Bicol Regional Statistical Development Program 2018-2023 39
Indicator Sources of Data
Statistical Activity Data Source Agency
Target 4.3: By 2030, ensure equal access for all women and men to affordable and quality technical, vocational and tertiary education, including university
4.3.1 Participation rate of youth and adults in formal and non-formal education and training in the previous 12 months, by sex
EBEIS (for senior high school)
DepEd PSA
4.3.s1 Net Enrolment Rate in elementary education
EBEIS
DepEd PSA
4.3.s2 Net Enrolment Rate in secondary education
EBEIS
DepEd PSA
4.3.s3 Passing rate in licensure exam (HEd)
PRC
4.3.s4 Certification rate (TVET)
Admin data
TESDA
Target 4.5: By 2030, eliminate gender disparities in education and ensure equal access to all levels of education and vocational training for the vulnerable, including persons with disabilities, indigenous peoples and children in vulnerable situations 4.5.1 Parity indices (female/male, rural/urban, bottom/top wealth quintile and others such as disability status, indigenous peoples and conflict-affected, as data become available) for all education indicators on this list that can be disaggregated
EBEIS
CHECKS T2MIS
DepEd, CHED and TESDA
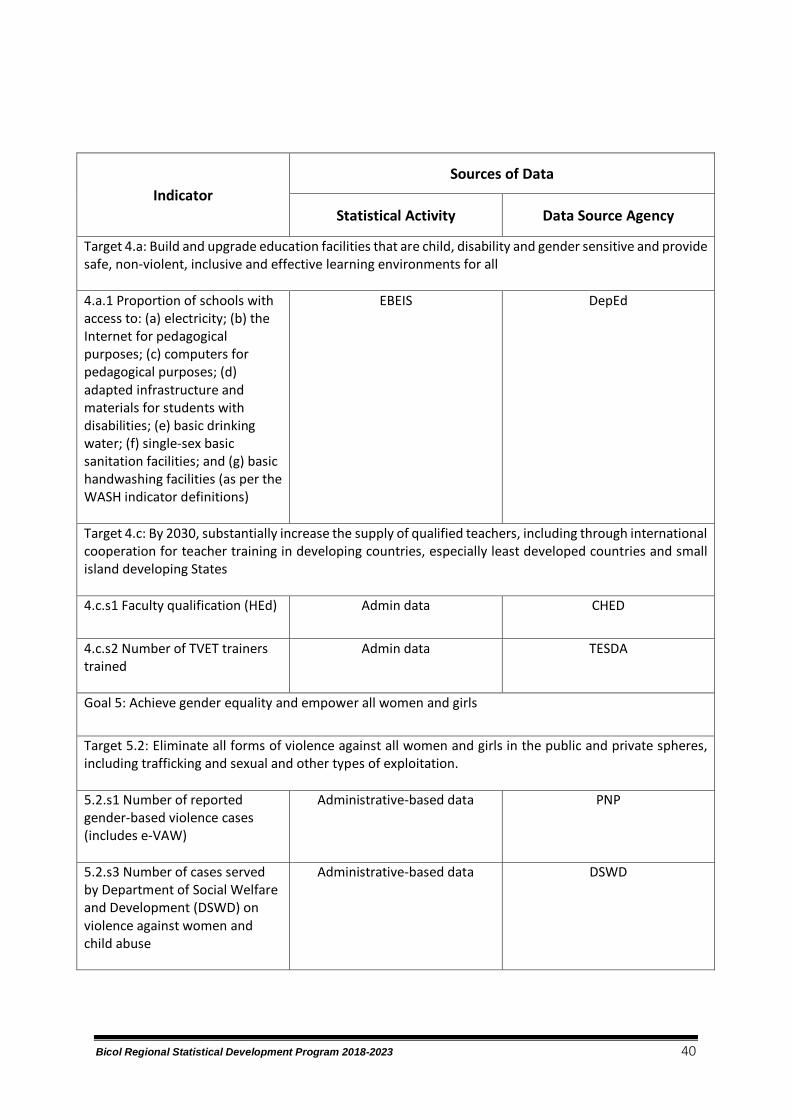
Bicol Regional Statistical Development Program 2018-2023 40
Indicator Sources of Data
Statistical Activity Data Source Agency
Target 4.a: Build and upgrade education facilities that are child, disability and gender sensitive and provide safe, non-violent, inclusive and effective learning environments for all
4.a.1 Proportion of schools with access to: (a) electricity; (b) the Internet for pedagogical purposes; (c) computers for pedagogical purposes; (d) adapted infrastructure and materials for students with disabilities; (e) basic drinking water; (f) single-sex basic sanitation facilities; and (g) basic handwashing facilities (as per the WASH indicator definitions)
EBEIS
DepEd
Target 4.c: By 2030, substantially increase the supply of qualified teachers, including through international cooperation for teacher training in developing countries, especially least developed countries and small island developing States 4.c.s1 Faculty qualification (HEd)
Admin data
CHED
4.c.s2 Number of TVET trainers trained
Admin data
TESDA
Goal 5: Achieve gender equality and empower all women and girls
Target 5.2: Eliminate all forms of violence against all women and girls in the public and private spheres, including trafficking and sexual and other types of exploitation. 5.2.s1 Number of reported gender-based violence cases (includes e-VAW)
Administrative-based data
PNP
5.2.s3 Number of cases served by Department of Social Welfare and Development (DSWD) on violence against women and child abuse
Administrative-based data
DSWD

Bicol Regional Statistical Development Program 2018-2023 41
Indicator Sources of Data
Statistical Activity Data Source Agency
Target 5.3: Eliminate all harmful practices, such as child, early and forced marriage and female genital mutilation
5.5.2 Proportion of women in managerial positions
Labor Force Survey (LFS) Administrative-based data
PSA Civil Service Commission (CSC), Career Executive Service Board
(CESB) - for public sector
5.5.s1 Percentage of firms owned by women (through business permits and licences system)
Administrative-based data
DTI
Target 5.a: Undertake reforms to give women equal rights to economic resources, as well as access to ownership and control over land and other forms of property, financial services, inheritance and natural resources, in accordance with national laws
5.a.1p1Number agricultural and residential land free patents issued to women and men
Administrative-based data
Department of Agrarian Reform (DAR), Department of
Environment and Natural Resources (DENR), Land
Registration Authority (LRA)
5.a.1p3 Number of women beneficiaries with secured land tenure in Residential areas
DENR-CENRO/ PENRO/ REGIONAL OFFICE
Goal 6: Ensure availability and sustainable management of water and sanitation for all
Target 6.3: By 2030, improve water quality by reducing pollution, eliminating dumping and minimizing release of hazardous chemicals and materials, halving the proportion of untreated wastewater and substantially increasing recycling and safe reuse globally 6.3.1.p1 Volume of wastewater treated (industries)
Self-Monitoring Reports database
DENR-EMB,
6.3.2.p1 Proportion of monitored bodies of water with good ambient water quality
National Water Quality Status Report EMB Water Quality
Assessment Report
EMB Water Quality Assessment Report
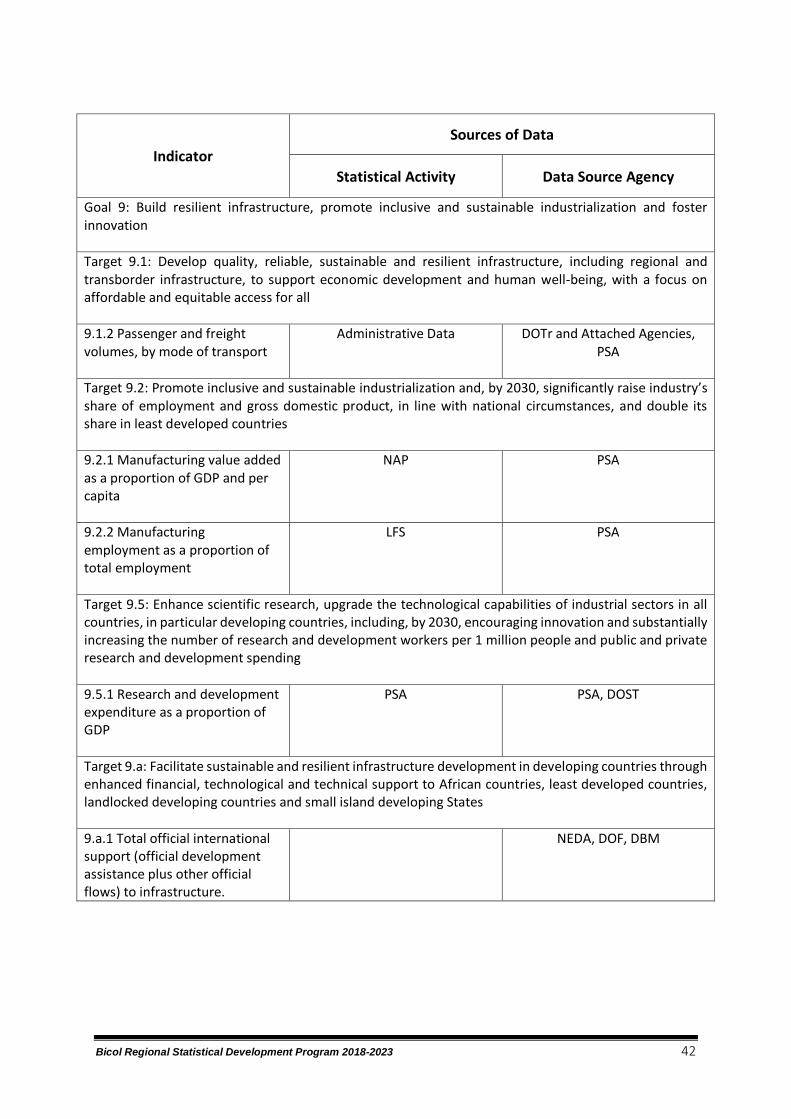
Bicol Regional Statistical Development Program 2018-2023 42
Indicator Sources of Data
Statistical Activity Data Source Agency
Goal 9: Build resilient infrastructure, promote inclusive and sustainable industrialization and foster innovation Target 9.1: Develop quality, reliable, sustainable and resilient infrastructure, including regional and transborder infrastructure, to support economic development and human well-being, with a focus on affordable and equitable access for all 9.1.2 Passenger and freight volumes, by mode of transport
Administrative Data
DOTr and Attached Agencies, PSA
Target 9.2: Promote inclusive and sustainable industrialization and, by 2030, significantly raise industry’s share of employment and gross domestic product, in line with national circumstances, and double its share in least developed countries
9.2.1 Manufacturing value added as a proportion of GDP and per capita
NAP
PSA
9.2.2 Manufacturing employment as a proportion of total employment
LFS
PSA
Target 9.5: Enhance scientific research, upgrade the technological capabilities of industrial sectors in all countries, in particular developing countries, including, by 2030, encouraging innovation and substantially increasing the number of research and development workers per 1 million people and public and private research and development spending 9.5.1 Research and development expenditure as a proportion of GDP
PSA
PSA, DOST
Target 9.a: Facilitate sustainable and resilient infrastructure development in developing countries through enhanced financial, technological and technical support to African countries, least developed countries, landlocked developing countries and small island developing States
9.a.1 Total official international support (official development assistance plus other official flows) to infrastructure.
NEDA, DOF, DBM
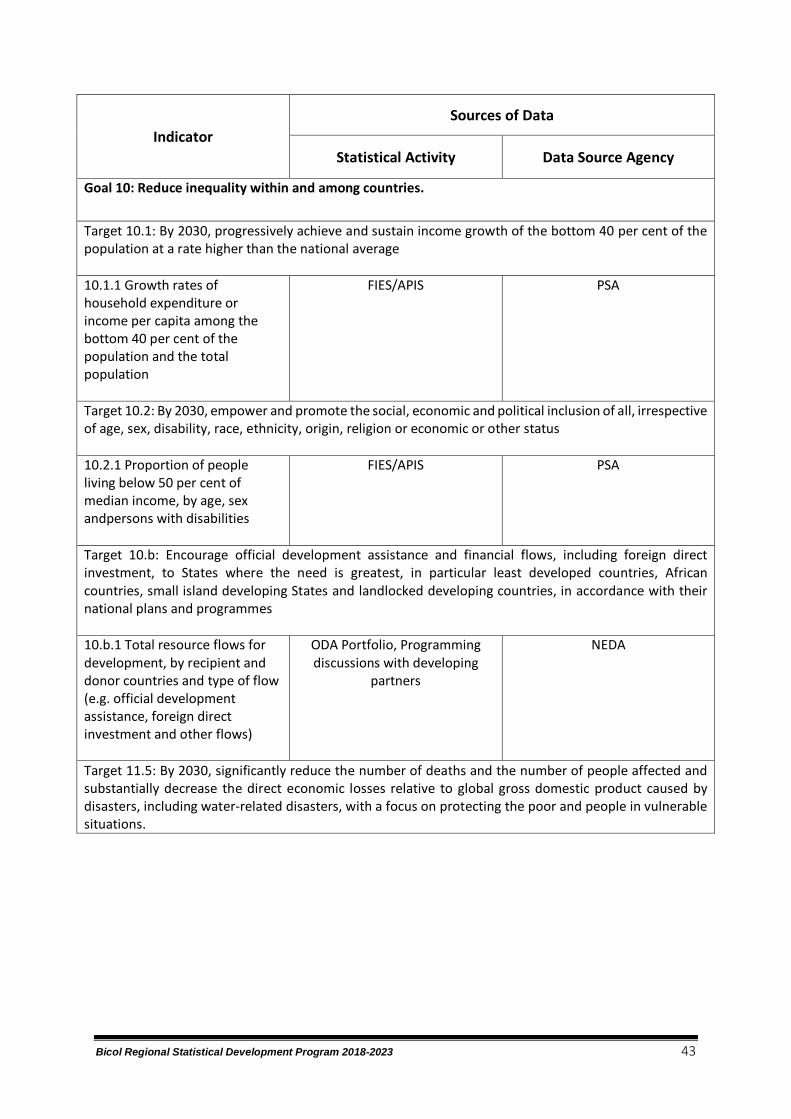
Bicol Regional Statistical Development Program 2018-2023 43
Indicator Sources of Data
Statistical Activity Data Source Agency
Goal 10: Reduce inequality within and among countries.
Target 10.1: By 2030, progressively achieve and sustain income growth of the bottom 40 per cent of the population at a rate higher than the national average 10.1.1 Growth rates of household expenditure or income per capita among the bottom 40 per cent of the population and the total population
FIES/APIS
PSA
Target 10.2: By 2030, empower and promote the social, economic and political inclusion of all, irrespective of age, sex, disability, race, ethnicity, origin, religion or economic or other status 10.2.1 Proportion of people living below 50 per cent of median income, by age, sex andpersons with disabilities
FIES/APIS
PSA
Target 10.b: Encourage official development assistance and financial flows, including foreign direct investment, to States where the need is greatest, in particular least developed countries, African countries, small island developing States and landlocked developing countries, in accordance with their national plans and programmes
10.b.1 Total resource flows for development, by recipient and donor countries and type of flow (e.g. official development assistance, foreign direct investment and other flows)
ODA Portfolio, Programming discussions with developing
partners
NEDA
Target 11.5: By 2030, significantly reduce the number of deaths and the number of people affected and substantially decrease the direct economic losses relative to global gross domestic product caused by disasters, including water-related disasters, with a focus on protecting the poor and people in vulnerable situations.

Bicol Regional Statistical Development Program 2018-2023 44
Indicator Sources of Data
Statistical Activity Data Source Agency
Target 11.b: By 2020, substantially increase the number of cities and human settlements adopting and implementing integrated policies and plans towards inclusion, resource efficiency, mitigation and adaptation to climate change, resilience to disasters, and develop and implement, in line with the Sendai Framework for Disaster Risk Reduction 2015-2030, holistic disaster risk management at all levels 11.b.1 Number of countries that adopt and implement national disaster risk reduction strategies in line with the Sendai Framework for Disaster Risk Reduction 2015-2030
DSWD/ RDRRMC
Goal 14: Conserve and sustainable use the oceans, seas and marine resources for sustainable development Target 14.5: By 2020, conserve at least 10 per cent of coastal and marine areas, consistent with national and international law and based on the best available scientific information 14.5.1 Coverage of protected areas in relation to marine areas
1.) Statistics of Philippine Protected Areas and Wildlife Resources 2.) 5th NR to CBD
DENR-BMB, LGU, UP-MSI
Target 15.7: Take urgent action to end poaching and trafficking of protected species of flora and fauna and address both demand and supply of illegal wildlife products 15.7.1 Proportion of traded wildlife that was poached or illicitly trafficked Indicator is also found in SDG 15.c.1.
National Report on wildlife trade
DENR Regional Offices and BMB
Target 16.7: Ensure responsive, inclusive, participatory and representative decision-making at all levels
16.7.1 Proportions of positions (by sex, age, persons with disabilities and population groups) in public institutions (national and local legislatures, public service, and judiciary) compared to national distributions.
Inventory of Government Personnel
CSC

Bicol Regional Statistical Development Program 2018-2023 45
Indicator Sources of Data
Statistical Activity Data Source Agency
Goal 10: Reduce inequality within and among countries.
Target 10.1: By 2030, progressively achieve and sustain income growth of the bottom 40 per cent of the population at a rate higher than the national average 10.1.1 Growth rates of household expenditure or income per capita among the bottom 40 per cent of the population and the total population
FIES/APIS
PSA
Target 10.2: By 2030, empower and promote the social, economic and political inclusion of all, irrespective of age, sex, disability, race, ethnicity, origin, religion or economic or other status 10.2.1 Proportion of people living below 50 per cent of median income, by age, sex and persons with disabilities
FIES/APIS
PSA
Target 10.b: Encourage official development assistance and financial flows, including foreign direct investment, to States where the need is greatest, in particular least developed countries, African countries, small island developing States and landlocked developing countries, in accordance with their national plans and programmes
10.b.1 Total resource flows for development, by recipient and donor countries and type of flow (e.g. official development assistance, foreign direct investment and other flows)
ODA Portfolio, Programming discussions with developing
partners
NEDA
Target 11.5: By 2030, significantly reduce the number of deaths and the number of people affected and substantially decrease the direct economic losses relative to global gross domestic product caused by disasters, including water-related disasters, with a focus on protecting the poor and people in vulnerable situations.

Bicol Regional Statistical Development Program 2018-2023 46
Indicator Sources of Data
Statistical Activity Data Source Agency
Target 11.b: By 2020, substantially increase the number of cities and human settlements adopting and implementing integrated policies and plans towards inclusion, resource efficiency, mitigation and adaptation to climate change, resilience to disasters, and develop and implement, in line with the Sendai Framework for Disaster Risk Reduction 2015-2030, holistic disaster risk management at all levels 11.b.1 Number of countries that adopt and implement national disaster risk reduction strategies in line with the Sendai Framework for Disaster Risk Reduction 2015-2030
DSWD/ RDRRMC
Goal 14: Conserve and sustainable use the oceans, seas and marine resources for sustainable development Target 14.5: By 2020, conserve at least 10 per cent of coastal and marine areas, consistent with national and international law and based on the best available scientific information 14.5.1 Coverage of protected areas in relation to marine areas
1.) Statistics of Philippine Protected Areas and Wildlife Resources 2.) 5th NR to CBD
DENR-BMB, LGU, UP-MSI
Target 15.7: Take urgent action to end poaching and trafficking of protected species of flora and fauna and address both demand and supply of illegal wildlife products 15.7.1 Proportion of traded wildlife that was poached or illicitly trafficked Indicator is also found in SDG 15.c.1.
National Report on wildlife trade
DENR Regional Offices and BMB
Target 16.7: Ensure responsive, inclusive, participatory and representative decision-making at all levels
16.7.1 Proportions of positions (by sex, age, persons with disabilities and population groups) in public institutions (national and local legislatures, public service, and judiciary) compared to national distributions.
Inventory of Government Personnel
CSC

Bicol Regional Statistical Development Program 2018-2023 47
Indicator Sources of Data Statistical Activity Data Source Agency
Target 16.9: By 2030, provide legal identity for all, including birth registration
16.9.1 Proportion of children under 5 years of age whose births have been registered
with a civil authority, by age
Number of Registered Live Births in the Philippines
PSA
Target 17.8: Fully operationalize the technology bank and science, technology and innovation capacity-building mechanism for least developed countries by 2017 and enhance the use of enabling technology, in particular information and communications technology 17.8.1 Proportion of individuals using the Internet
FLEMMS Population Projections
PSA
Target 17.9: Enhance international support for implementing effective and targeted capacity-building in developing countries to support national plans to implement all the sustainable development goals, including through North-South, South-South and triangular cooperation 17.9.1 Dollar value of financial and technical assistance (including through North-South, South and triangular cooperation) committed to developing countries
NEDA
17.19.1 Dollar value of all resources made available to strengthen statistical capacity in developing countries
Philippine Statistical Development Program
PSA
Bicol Regional Statistical Development Program 2018-2023 48
Situational Analysis
Key Developments for 2015-2017
The following are key developments of the RSS in monitoring the attainment of the SDGs for the period 2015-2017:
Formulation of the Local Statistical Development Program and Core Regional Indicators conducted during the RSC 3rd Quarter 2016 Meeting on Sept 5, 2016. The CoRE-Is is a minimum set of indicators at the regional level to monitor the social, economic, political, cultural and environmental development in the local communities; aids the government in understanding the needs of the local communities and enable both the national and local government make the right policies, decision and action.
Formulation of the Core Regional Indicator System. CoRE-Is List of Indicators discussed during the 4th Quarter 2016 Meeting.
Establishment of the initial list of Core Regional Indicators (CoRE-Is). Ensuring the PSA Board Resolution No. 10, Approving and Adopting the Core Regional Indicators, the RSC validated the CoRE-Is for the region.
Workshop on Regional Strategic Priorities and Sustainable Development Goals Alignment. This is a regionwide workshop attempting to align project and programs of the local government units in SDGs.
Regional Assessment/Workshop (Luzon Cluster) on SDGs in Le Monet Hotel, Baguio City, on October 17-18, 2017 which assesses indicators available in the region and identified proxy and supplemental indicators
Workshop on the Assessment of Regional SDGs at Casa Lorenzo, Tagas, Daraga, Albay on November 15-16, 2017. This activity cascaded the SGD assessment in Baguio City and was able to validate regional SDG indicators.
Issues and Concerns
Issues on the level of data disaggregation. The level of data disaggregation is enough to provide for the information needed in the regional level. The data necessary for the provincial, city, municipal, and barangay levels are not given enough attention.
Different data collection activities in the region. Data collection activities in the region
vary. This leads to different results and conclusions thus, there must be a harmonized data collection activity to establish a unified and centralized data and information.
Unavailability of the statistical data to measure SDG indicators. SDG indicators specify
definite goals through various statistical activities however, statistical data are unavailable,

Bicol Regional Statistical Development Program 2018-2023 49
and some SDG indicators are not measured. To achieve the goals indicated in the SDG, relevant statistical data is needed.
Insufficient indicators at the local level to monitor regional SDGs. Regional SDGs aim
for the development and growth of the different statistical activities and concerned agencies. They must be specific and certain indicators must coincide with specific goals for the attainment and realization of such targets. The indicators on the other hand are inadequate especially at the local level hence leading to unmonitored regional SDGs.
Necessity for technical and financial sustenance to monitor the numerous indicators
in the SDGs. Technical and financial sustenance is needed to monitor various indicators specified in the SDGs. Goals are to be achieved through the different statistical activities provided to respond to the specific goals. There is also a need for technical and financial sustenance in order to make sure that each indicator is obtained and SDGs are attained.
Lack of statistical data appreciation. Statistical data appreciation is important in the
process of information dissemination and public awareness. The lack of statistical data appreciation may lead to false knowledge especially about the ENR. Certain changes in the ENR if applicable, may not be known by the concerned public if statistical data is not appreciated.
Statistical Projects Activities and Programs (PAPs) for 2018-2023
The government implements the following statistical projects, activities, and programs to monitor the attainment of the SDGs:
• Strengthening the use of administrative data;
• Advocacy on the implementation of Statistical Survey Review and Clearance System (SSRCS) which is a mechanism institutionalized by the PSA which involves the process of evaluating the design and instrument of statistical surveys or censuses sponsored and/or to be conducted by government agencies including government corporations;
• Improved level of data disaggregation; • Harmonization of different data collection activities in the region; and • Solidification of the obligation of partner agencies in providing timely and complete
data necessary in monitoring SDGs.

Bicol Regional Statistical Development Program 2018-2023 50
ACKNOWLEDGMENT
The Philippine Statistics Authority RSSO V would like to extend our gratitude and special thanks to all RSC members and to the RSDP Technical Working Group (TWG) who devoted their time and shared their knowledge in the formulation of the Bicol Regional Statistical Development Program 2018-2023.
Our profound appreciation to all support extended by the regional line agencies, the academe, local government units and the private sector through their invaluable support, cooperation, suggestions and recommendations during the RSDP workshop conducted by PSA RSSO V.
To everyone who contributed in the formulation of the Bicol Regional Statistical Development Program 2018-2023, a sincere thanks.


Appendix


Bicol Regional Statistical Development Program 2018-2023 51
Workshop 2.1 SWOT Analysis Areas of Concern
Strengths Weaknesses Opportunities Threats
1. Coordination of the Regional/Local Statistical System (R/LSS)
• Organized RSC in the Region
• Strong partnership among and between members of RSC
• Strong linkages and coordination
• Collaboration of OWWA with the PSA on the vital documents (Birth/Death/Marriage)
• Strong linkages between and among shelter agencies
• Giving awards and recognition to member agencies
• Strong political will among local officials
• No Available Statistician /Item/Plantilla in most Agencies especially In Provincial Level
• Limited manpower to respond to the increasing demand for statistics
• No organized PSAI Chapters in Region 5
• Absence of a policy on the regular conduct of CBMS
• Lack of Permanent/ Alternate Of The Attending Focal Person
• Lack of harmonized information system
• No harmonized concepts on some statistical definition
• Data Privacy Act
• RSC as affiliate committee of the RDC
• CBMS in the LGUs/RAPID CBMS
• Bill on the Institutionalization of the CBMS by the LGUs.
• Cross posting of PSA employees to other agencies
• Collaboration with National and International stakeholders
• Availability of Administrative Data
• Right sizing • Profiles of all
Government Employees are being inputted by agencies
• Harmonization of Statistical Tools
• Best practices of other
RSCs that can be adopted/replicate by
RSC V/LGUs • Federalism
Having permanent employee in the office who had graduated BS in Statistics
• Presence of inventory of government human resource system
• Federalism • Labor turnover of
stat personnel • Right sizing • Force majeure • Implementation
of Data Privacy Act
• Lack of statistical data appreciation
• Conflict related between the government troops and the Rebel Soldiers which affect the data collection of field personnel
• High risk on the safety of DOJ personnel
• Historical and human interests features in the province and change in government policies and leadership
• Strong political will among local officials (negative impact)
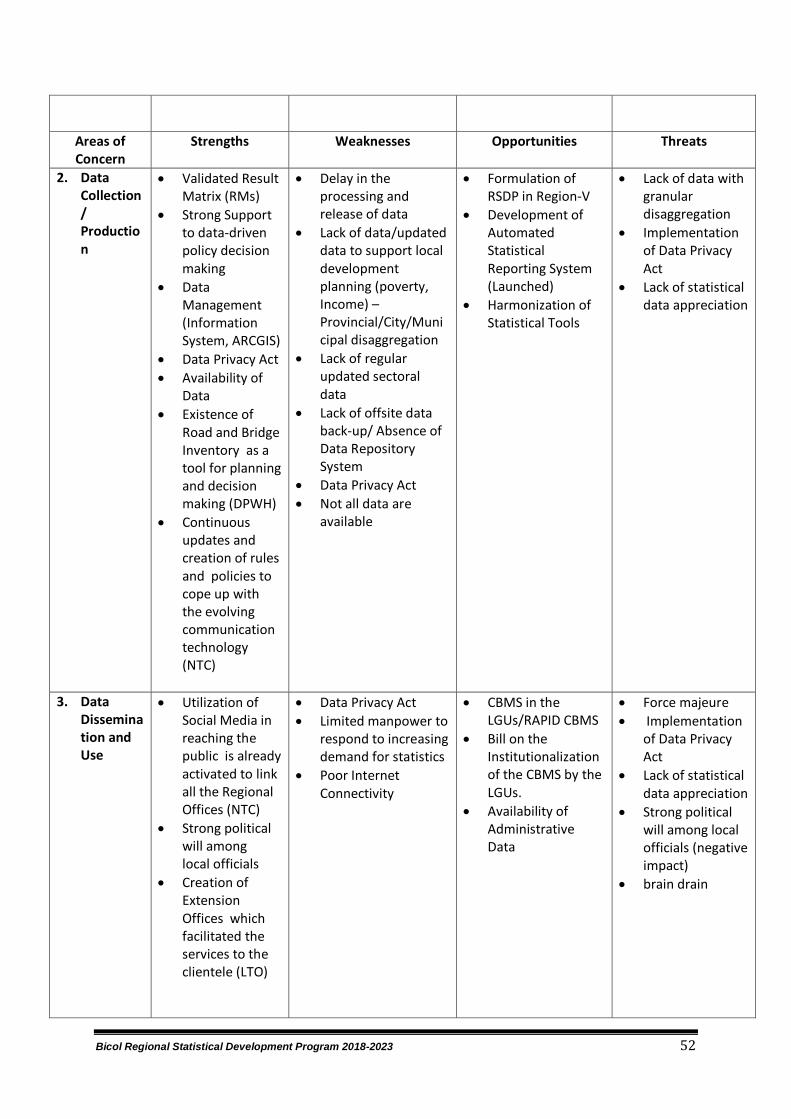
Bicol Regional Statistical Development Program 2018-2023 52
Areas of Concern
Strengths Weaknesses Opportunities Threats
2. Data Collection/ Production
• Validated Result Matrix (RMs)
• Strong Support to data-driven policy decision making
• Data Management (Information System, ARCGIS)
• Data Privacy Act • Availability of
Data • Existence of
Road and Bridge Inventory as a tool for planning and decision making (DPWH)
• Continuous updates and creation of rules and policies to cope up with the evolving communication technology (NTC)
• Delay in the processing and release of data
• Lack of data/updated data to support local development planning (poverty, Income) – Provincial/City/Municipal disaggregation
• Lack of regular updated sectoral data
• Lack of offsite data back-up/ Absence of Data Repository System
• Data Privacy Act • Not all data are
available
• Formulation of RSDP in Region-V
• Development of Automated Statistical Reporting System (Launched)
• Harmonization of Statistical Tools
• Lack of data with granular disaggregation
• Implementation of Data Privacy Act
• Lack of statistical data appreciation
3. Data Dissemination and Use
• Utilization of Social Media in reaching the public is already activated to link all the Regional Offices (NTC)
• Strong political will among local officials
• Creation of Extension Offices which facilitated the services to the clientele (LTO)
• Data Privacy Act • Limited manpower to
respond to increasing demand for statistics
• Poor Internet Connectivity
• CBMS in the LGUs/RAPID CBMS
• Bill on the Institutionalization of the CBMS by the LGUs.
• Availability of Administrative Data
• Force majeure • Implementation
of Data Privacy Act
• Lack of statistical data appreciation
• Strong political will among local officials (negative impact)
• brain drain

Bicol Regional Statistical Development Program 2018-2023 53
Areas of Concern
Strengths Weaknesses Opportunities Threats
4. Research and Capacity Building
• Availability of Data
• No schools offering Statistics courses in Region 5
• Not affordable training packages for statistical training/Budget constraints for training packages
• Member Agencies' lack of budget for capability building especially on Statistical trainings, ICT
• Allocate Funds To Statistical Activities And Projects
• No career pathing among employee
• Low salary and lack of training might lead personnel/employees to seek better opportunities outside the country (NTC)s
5. Resources in the Regional Statistical System
• Availability of Data
• Lack of Funds to buy modern or improved system like ARCGIS to be used by Agencies.
• Not affordable training packages for statistical training/Budget constraints for training packages
• Limited manpower to respond to increasing demand for statistics
• Availability of Administrative Data
• Development Of Automated Statistical Reporting System (Launched)
• Allocate Funds To Statistical Activities And Projects
• Harmonization of Statistical Tools
• Labor turnover of stat personnel

Bicol Regional Statistical Development Program 2018-2023 54
Workshop 2.2: Strategy Formulation Areas of Concern Strategies
1. Coordination of the Regional/Local Statistical System (R/LSS)
• Strengthen the RSC by enjoining the permanent members to attend the regular RSC meeting through recognition/award system
• Creation of TWGs on a case-to-case basis/as need arises
• Creation of PSC in the 6 provinces of Region V • Harmonize the survey tool • Centralize data at PSA
2. Data Collection/ Production • Conduct capacity building on SAE and
generation statistics from admin data • Creation of RSC TWG on SDG and other
indicator frameworks • Conduct of data appreciation seminar • Infographics/visualization of data • Recommend to the PSA Board the review of
existing policy issuances on the generation/collection of admin data
• Recommend tools/methodologies in the regular generation of data
• Adopt Cloud Data System • MOA/MOU re data sharing • Data Tool Harmonization
3. Data Dissemination and Use • Conduct of dissemination fora
• Advocacy of trimedia data dissemination • Conduct of periodic inter-agency information
caravan • Conduct of training of data review and analysis • Provision of incentives/awards to LGUs which
conducts CBMS • Adherence to GAD in terms of disaggregation
of data • Regular Fora/ Advocacy
4. Research and Capacity Building • Continuous training/capacity building program
• Come up with proposed research agenda to be submitted/evaluated by the R & D Committee
• Development on the research on forecasting the GRDP/provincial income accounts using quarterly indicator
• Collaboration with the Academes, re: statistical trainings
5. Resources in the Regional Statistical System
• Allocate budget for statistical activities • Recommend for statistical plantilla position • Creation of plantilla positions

Bicol Regional Statistical Development Program 2018-2023 55
Workshop 2.3: Strategies and PAPs for the Objectives
OBJECTIVE STRATEGY PROGRAMS, ACTIVITIES AND
PROJECTS 1
To institutionalize CBMS as the
standard format for cities, municipalities and
barangays.
• CBMS as a criterion for Seal of Good Local Governance award
• demonstrate how it is used c/o Legazpi City, Ligao City and Tabaco City
• compliance certificate from DILG
• recommend to DBM the mandatory requirement for budget release
• Socialized advertisement/advocacy for CBMS c/o DILG, PPDOs and C/MPDOs
• Declaration of awards and incentives c/o RSC V
2 Improve inter-agency
access to quality statistics.
• Recognize and develop best practices in data use optimization
• Data reconciliation • Strong collaboration
with the SUCs, RLAs, LGUs, specifically for the development of Statistics
• Inventory of all available data from RLAs/LGUs by RSC V
• Update data at agency website
• Data festival • Declaration of awards and
incentives for best website
3 Continually provide the data requirements for
monitoring on implementation of the
RDP.
• Develop the checklist of indicators
• Conduct workshop to determine how to generate the unavailable data c/o RSC V
• Establish Integrated database c/o DOST/DICT
4 Achieve functional
professional literacy in statistical processing and analysis data banking and
technical writing and reporting.
• Training Needs Assessment • Scholarship • Statistical Quiz • NC accreditation for
statistical researchers c/o TESDA
• Professionalizing C/MCRs • Conduct of Regional Statistics
Convention • Conduct special training on
modularized statistics c/o RSC V

BICOL REGION REGIONAL DEVELOPMENT PLAN RESULTS MATRICES
2017-2022

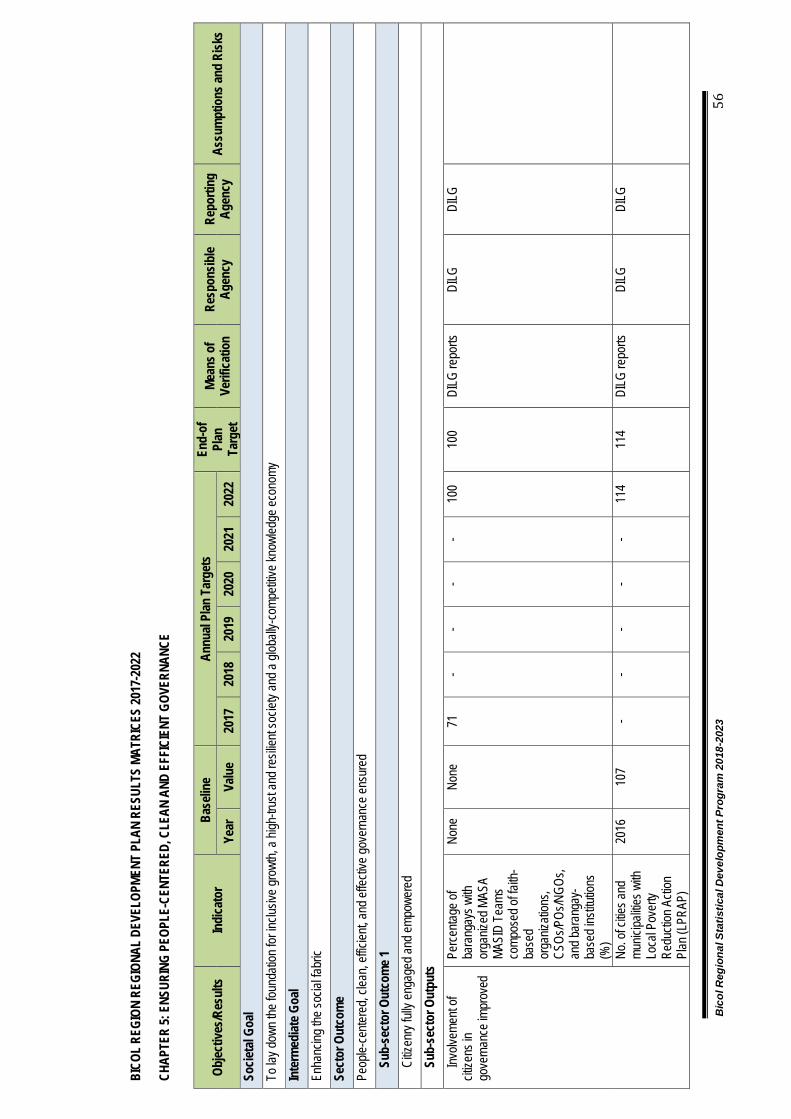
Bic
ol R
egio
nal S
tatis
tical
Dev
elop
men
t Pro
gram
201
8-20
23
56
BICO
L RE
GION
REG
IONA
L DE
VELO
PMEN
T PL
AN R
ESUL
TS M
ATRI
CES
2017
-202
2
CHAP
TER
5: E
NSUR
ING
PEOP
LE-C
ENTE
RED,
CLE
AN A
ND E
FFIC
IENT
GOV
ERNA
NCE
Objec
tives
/Res
ults
In
dica
tor
Base
line
Annu
al Pl
an T
arge
ts
End-
of
Plan
Ta
rget
Me
ans o
f Ve
rifica
tion
Resp
onsib
le Ag
ency
Re
porti
ng
Agen
cy
Assu
mpt
ions
and
Risk
s Ye
ar
Valu
e 20
17
2018
20
19
2020
20
21
2022
So
cieta
l Goa
l To
lay d
own t
he fo
unda
tion f
or in
clusiv
e gro
wth,
a high
-trus
t and
resil
ient s
ociet
y and
a glo
bally
-comp
etitiv
e kno
wled
ge ec
onom
y In
term
ediat
e Goa
l En
hanc
ing th
e soc
ial fa
bric
Sect
or O
utco
me
Peop
le-ce
ntere
d, cle
an, e
fficien
t, and
effec
tive g
over
nanc
e ens
ured
Su
b-se
ctor
Out
com
e 1
Citiz
enry
fully
enga
ged a
nd em
powe
red
Sub-
sect
or O
utpu
ts
Involv
emen
t of
citize
ns in
go
vern
ance
impr
oved
Perc
entag
e of
bara
ngay
s with
or
ganiz
ed M
ASA
MASI
D Te
ams
comp
osed
of fa
ith-
base
d or
ganiz
ation
s, CS
Os/P
Os/N
GOs,
and b
aran
gay-
base
d ins
titutio
ns
(%)
None
No
ne
71
- -
- -
100
100
DILG
repo
rts
DILG
DI
LG
No. o
f citie
s and
mu
nicipa
lities
with
Lo
cal P
over
ty Re
ducti
on A
ction
Pl
an (L
PRAP
)
2016
10
7 -
- -
- -
114
114
DILG
repo
rts
DILG
DI
LG

Bic
ol R
egio
nal S
tatis
tical
Dev
elop
men
t Pro
gram
201
8-20
23
57
Feed
back
and
resp
onse
me
chan
isms
institu
tiona
lized
Perc
entag
e of
agen
cies a
sses
sed
pass
ing th
e Anti
-Re
d Tap
e Act
Repo
rt Ca
rd S
urve
y (A
RTA
-RCS
) (%
)
2016
98
65
10
0 10
0 10
0 10
0 10
0 10
0 CS
C AR
TA
RCS
repo
rt CS
C CS
C
Acce
ss to
inf
orma
tion o
n go
vern
ment
oper
ation
s imp
rove
d
Perc
entag
e of
prov
inces
, citie
s, mu
nicipa
lities
(P
CMs)
fully
co
mplia
nt wi
th the
Fu
ll Disc
losur
e Po
licy (
FDP)
(%)
2015
76
80
82
84
86
88
90
90
DI
LG re
ports
DI
LG
DILG
Sub-
sect
or O
utco
me 2
Ad
minis
trativ
e gov
erna
nce e
nhan
ced
Sub-
sect
or O
utpu
ts
Publi
c Fina
ncial
Ma
nage
ment
(PFM
) sy
stems
and
proc
edur
es im
prov
ed
and s
treng
thene
d
Perc
entag
e of
prov
inces
, citie
s an
d mun
icipa
lities
tra
cked
with
PFM
Im
prov
emen
t Plan
s (P
FMIP
) (%
)
- -
70-8
0 70
-80
70-8
0 70
-80
70-8
0 70
-80
70-8
0 PF
MIP
valid
ation
re
ports
DBM
DBM
LGUs
comp
ly wi
th the
re
quire
ments
for P
FM
syste
m.
Perfo
rman
ce
monit
oring
, ev
aluati
on, a
nd
repo
rting s
ystem
s im
prov
ed
Numb
er of
pr
ovinc
es, c
ities
and m
unici
paliti
es
(PCM
s) c
onfer
red
with
the S
eal o
f Go
od Lo
cal
Gove
rnan
ce
(SGL
G)
2016
10
qu
alifed
PC
Ms
20
25
30
35
40
All
quali
fied
PC
Ms
All
quali
fied
PCMs
DILG
repo
rts
DILG
DI
LG
LGUs
are c
ompla
int to
SG
LG re
quire
ments
.

Bic
ol R
egio
nal S
tatis
tical
Dev
elop
men
t Pro
gram
201
8-20
23
58
Nu
mber
of ag
encie
s wi
th ap
prov
ed
Stra
tegic
Pefor
manc
e Ma
nage
ment
Syste
m (S
PMS)
2016
16
7 ag
encie
s wi
th ap
prov
ed
SPMS
Incre
asing
CS
C SP
MS
monit
oring
re
ports
CSC
CSC
Sub-
sect
or O
utco
me 3
Se
amles
s ser
vice d
elive
ry ac
hieve
d Su
b-se
ctor
Out
puts
Bu
sines
s pro
cess
str
eaml
ined
Numb
er of
citie
s an
d mun
icipa
lities
(C
Ms) w
ith
strea
mline
d BPL
S (u
nder
JMC
2016
)
- -
29
40
58
76
94
112
114
DILG
repo
rts
DILG
DI
LG
LGUs
are c
ompli
ant to
the
requ
ireme
nts fo
r str
eaml
ining
BPL
S.
Dome
stic r
esou
rce
mobil
izatio
n str
ength
ened
Total
gove
rnme
nt re
venu
e by s
ource
(P
)
2016
P
4.22
billio
n Inc
reas
ing
BLGF
repo
rts
BLGF
PS
A LG
Us' in
come
gene
ratin
g ca
pabil
ity is
str
eang
thene
d.
Sub-
sect
or O
utco
me 4
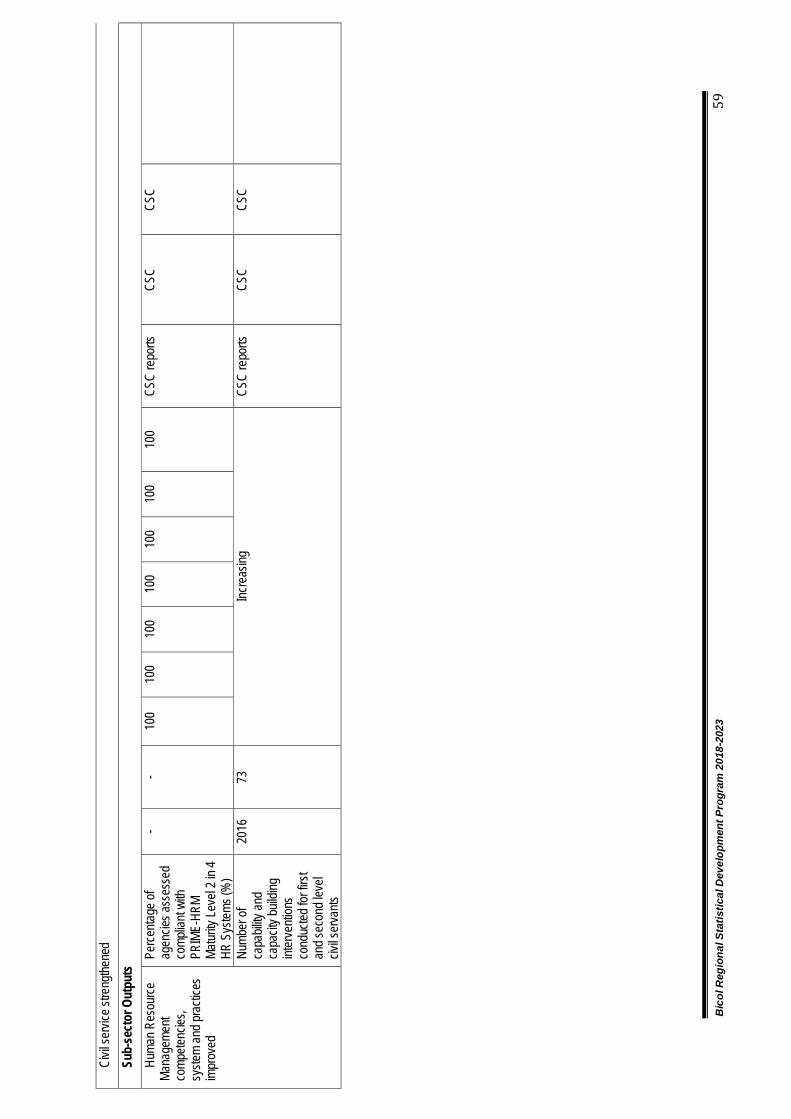
Bic
ol R
egio
nal S
tatis
tical
Dev
elop
men
t Pro
gram
201
8-20
23
59
Civil
servi
ce st
reng
thene
d Su
b-se
ctor
Out
puts
Hu
man R
esou
rce
Mana
geme
nt co
mpete
ncies
, sy
stem
and p
racti
ces
impr
oved
Perc
entag
e of
agen
cies a
sses
sed
comp
liant
with
PRIM
E-HR
M Ma
turity
Leve
l 2 in
4 HR
Sys
tems (
%)
- -
100
100
100
100
100
100
100
CSC
repo
rts
CSC
CSC
Numb
er of
ca
pabil
ity an
d ca
pacit
y buil
ding
inter
venti
ons
cond
ucted
for f
irst
and s
econ
d lev
el civ
il ser
vants
2016
73
Inc
reas
ing
CSC
repo
rts
CSC
CSC

Bic
ol R
egio
nal S
tatis
tical
Dev
elop
men
t Pro
gram
201
8-20
23
60
BICO
L RE
GION
REG
IONA
L DE
VELO
PMEN
T PL
AN R
ESUL
TS M
ATRI
CES
2017
-202
2
CHAP
TER
6: P
URSU
ING
SWIF
T AN
D FA
IR A
DMIN
ISTR
ATIO
N OF
JUST
ICE
Objec
tives
/Res
ults
In
dica
tor
Base
line
Annu
al Ta
rget
s En
d-of
Pl
an
Targ
et
Mean
s of
Verif
icatio
n Re
spon
sible
Agen
cy
Repo
rting
Ag
ency
As
sum
ptio
ns an
d Ri
sks
Year
Va
lue
2017
20
18
2019
20
20
2021
20
22
Socie
tal G
oal
To la
y dow
n the
foun
datio
n for
inclu
sive g
rowt
h, a h
igh-tr
ust a
nd re
silien
t soc
iety a
nd a
globa
lly-co
mpeti
tive k
nowl
edge
econ
omy
Inte
rmed
iate G
oal
Enha
ncing
the s
ocial
fabr
ic Se
ctor
Out
com
e Sw
ift an
d fair
admi
nistra
tion o
f justi
ce
Sub-
sect
or O
utco
me 1
Ac
cess
to ci
vil an
d cr
imina
l justi
ce sy
stems
en
hanc
ed
Perc
entag
e of c
ases
dis
pose
d ove
r the
tot
al nu
mber
of
case
s rec
eived
(%)
2011
87
88
89
90
91
92
93
90
DO
J Pe
rform
ance
Ev
aluati
on
DOJ
DOJ
Key i
nstitu
tiona
l poli
cy
refor
ms on
re
cruitm
ent a
nd fil
ling
up of
vaca
nt po
sition
s ar
e in p
lace.
Perc
entag
e of
quali
fied i
nmate
s re
lease
d on t
ime (
%)
2016
54
10
0 10
0 10
0 10
0 10
0 10
0 10
0 BJ
MP m
onthl
y re
port
BJMP
BJ
MP
Docu
ments
for t
he
imme
diate
relea
se
are c
omple
te an
d pr
oces
sed a
s sc
hedu
led.
Perc
entag
e of
inmate
s re
lease
d/tra
nsfer
red
to oth
er pe
nal
institu
tions
(%)
2016
83
78
80
82
85
88
90
92
BJ
MP m
onthl
y re
port
BJMP
BJ
MP
Docu
ments
for t
he
imme
diate
relea
se
are c
omple
te an
d pr
oces
sed a
s sc
hedu
led
Sub-
sect
or O
utco
me 2
Se
ctor E
fficien
cy an
d Ac
coun
tabilit
y Imp
rove
d To
tal nu
mber
of
child
ren i
n con
flict
with
the la
w (C
ICL)
se
rved
2016
85
75
80
60
60
45
30
30
DS
WD
repo
rt DS
WD
PNP
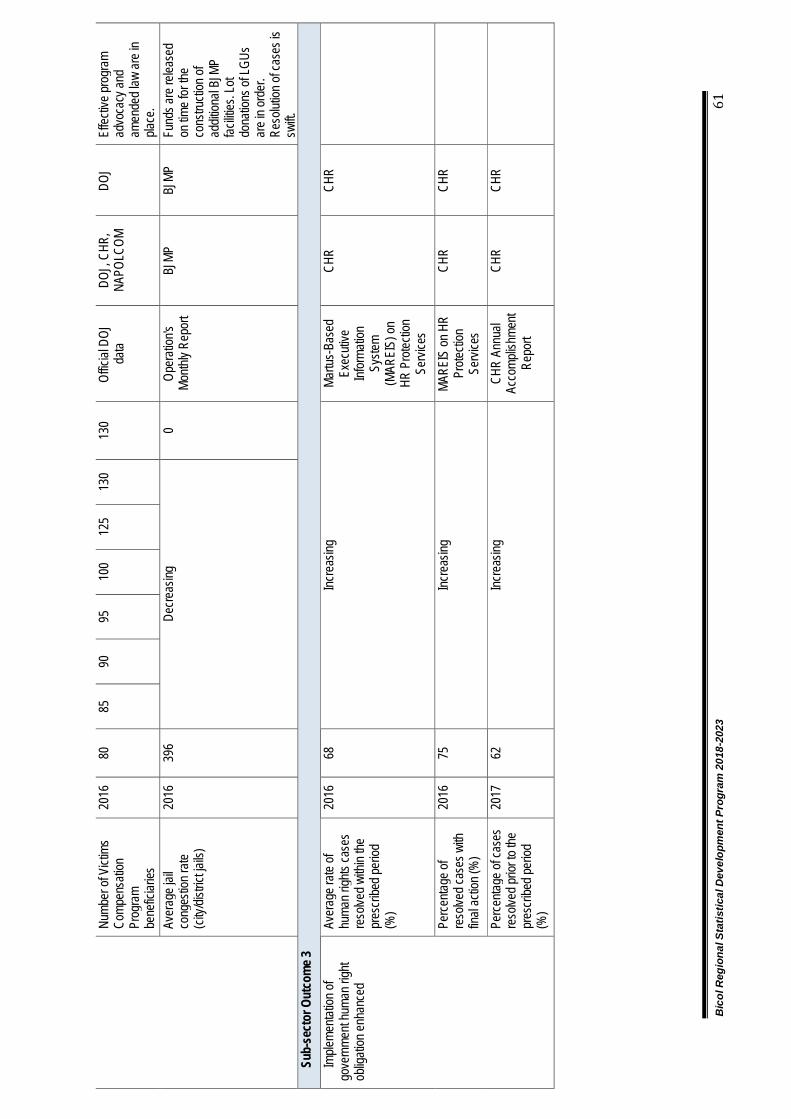
Bic
ol R
egio
nal S
tatis
tical
Dev
elop
men
t Pro
gram
201
8-20
23
61
Numb
er of
Vict
ims
Comp
ensa
tion
Prog
ram
bene
ficiar
ies
2016
80
85
90
95
10
0 12
5 13
0 13
0 Of
ficial
DOJ
da
ta DO
J, CH
R,
NAPO
LCOM
DO
J Ef
fectiv
e pro
gram
ad
voca
cy an
d am
ende
d law
are i
n pla
ce.
Aver
age j
ail
cong
estio
n rate
(c
ity/di
strict
jails
)
2016
39
6 De
creas
ing
0 Op
erati
on's
Month
ly Re
port
BJMP
BJ
MP
Fund
s are
relea
sed
on tim
e for
the
cons
tructi
on of
ad
dition
al BJ
MP
facilit
ies. L
ot do
natio
ns of
LGUs
ar
e in o
rder
. Re
solut
ion of
case
s is
swift.
Su
b-se
ctor
Out
com
e 3
Imple
menta
tion o
f go
vern
ment
huma
n righ
t ob
ligati
on en
hanc
ed
Aver
age r
ate of
hu
man r
ights
case
s re
solve
d with
in the
pr
escr
ibed p
eriod
(%
)
2016
68
Inc
reas
ing
Martu
s-Ba
sed
Exec
utive
Inf
orma
tion
Syste
m (M
AREI
S) on
HR
Pro
tectio
n Se
rvice
s
CHR
CH
R
Pe
rcen
tage o
f re
solve
d cas
es w
ith
final
actio
n (%
)
2016
75
Inc
reas
ing
MARE
IS on
HR
Prote
ction
Se
rvice
s
CHR
CHR
Pe
rcen
tage o
f cas
es
reso
lved p
rior t
o the
pr
escr
ibed p
eriod
(%
)
2017
62
Inc
reas
ing
CHR
Annu
al Ac
comp
lishm
ent
Repo
rt
CHR
CHR

Bic
ol R
egio
nal S
tatis
tical
Dev
elop
men
t Pro
gram
201
8-20
23
62
BICO
L RE
GION
REG
IONA
L DE
VELO
PMEN
T PL
AN R
ESUL
TS M
ATRI
CES
2017
-202
2
CH
APTE
R 7:
PRO
MOTI
NG P
HILI
PPIN
E CU
LTUR
E AN
D VA
LUES
Objec
tives
/Res
ults
In
dica
tor
Base
line
Annu
al Ta
rget
s En
d-of
Plan
Ta
rget
Me
ans o
f Ve
rifica
tion
Resp
onsib
le Ag
ency
Re
porti
ng
Agen
cy
Assu
mpt
ions
and
Risk
s Ye
ar
Valu
e 20
17
2018
20
19
2020
20
21
2022
So
cieta
l Goa
l To
lay d
own t
he fo
unda
tion f
or in
clusiv
e gro
wth,
a high
-trus
t and
resil
ient s
ociet
y and
a glo
bally
-comp
etitiv
e kno
wled
ge ec
onom
y In
term
ediat
e Goa
l En
hanc
ing th
e soc
ial fa
bric
Sect
or O
utco
me
Philip
pine c
ultur
e and
value
s pro
moted
1
Sub-
sect
or O
utco
me 1
Va
lues f
or th
e co
mmon
good
inc
ulcate
d
Regio
nal a
vera
ge
grad
e on E
duka
syon
sa
Pagp
apak
atao2
2016
87
.23
88.97
90
.75
92.56
94
.4 1 96
.3 98
.26
98.26
Su
mmar
y of
Lear
ners
' Ac
hieve
ment
DepE
d 5
DepE
d 5
Regio
nal a
vera
ge
grad
e on M
APEH
20
16
88
89.76
91
.56
93.39
95
.2 6 97
.16
99.1
99.1
Summ
ary o
f Le
arne
rs'
Achie
veme
nt
DepE
d 5
DepE
d 5
Su
b-se
ctor
Out
com
e 2
Our d
iverse
cu
lture
s valu
ed
Numb
er of
deve
loped
co
nser
vatio
n ma
nage
ment
plans
ac
ross
all le
vels
of go
vern
ment4
2016
TB
D thr
u inv
entor
y
Repo
rts fr
om
LGUs
Pr
ovinc
ial
gove
rnme
nts
Prov
incial
go
vern
ment
s/PSA

Bic
ol R
egio
nal S
tatis
tical
Dev
elop
men
t Pro
gram
201
8-20
23
63
Sub-
sect
or
Outp
uts
Numb
er of
cond
ucted
re
sear
ch on
indig
enou
s kn
owled
ge sy
stems
an
d pra
ctice
s5
2016
TB
D thr
u inv
entor
y
Repo
rts fr
om
NCIP
, CHE
D,
SUCs
and
HEIs
NCIP
, CHE
D,
SUCs
, HEI
s NC
IP,
CHED
Nu
mber
of
docu
menta
tion
activ
ities o
n ind
igeno
us
politi
cal s
tructu
res
cond
ucted
*
2016
0
1
1
2 NC
IP R
epor
t NC
IP 5
NCIP
5 Fu
nds a
re al
locate
d by
centr
al off
ice fo
r re
gion 5
for s
aid
activ
ities
Numb
er of
do
cume
ntatio
n ac
tivitie
s on i
ndige
nous
pe
oples
custo
mary
laws c
ondu
cted
2016
0
1
1 2
NCIP
Rep
ort
NCIP
5 NC
IP 5
Fund
s are
alloc
ated
by ce
ntral
office
for
regio
n 5 fo
r said
ac
tivitie
s
2 pro
xy in
dicato
r of "
posit
ive fe
edba
ck on
the v
alues
form
ation
initia
tives
"
3 B
ased
on th
e Edu
kasy
on sa
Pag
papa
katao
curri
culum
, inde
pend
ent o
f the e
xtra-
curri
cular
corp
us of
value
s to b
e de
velop
ed
4 Num
ber o
f cult
ural
cente
rs/hu
bs es
tablis
hed a
nd co
nser
vatio
n mas
terpla
ns fo
r cult
ural
treas
ures
in th
e reg
ion to
be co
nsult
ed w
ith N
CCA;
TBD
in tim
e for
the m
idter
m up
date.
5 C
HED
will i
ssue
a re
giona
l mem
oran
dum
to HE
Is re
base
line a
nd ta
rgets
; TBD
in tim
e for
the m
idter
m up
date
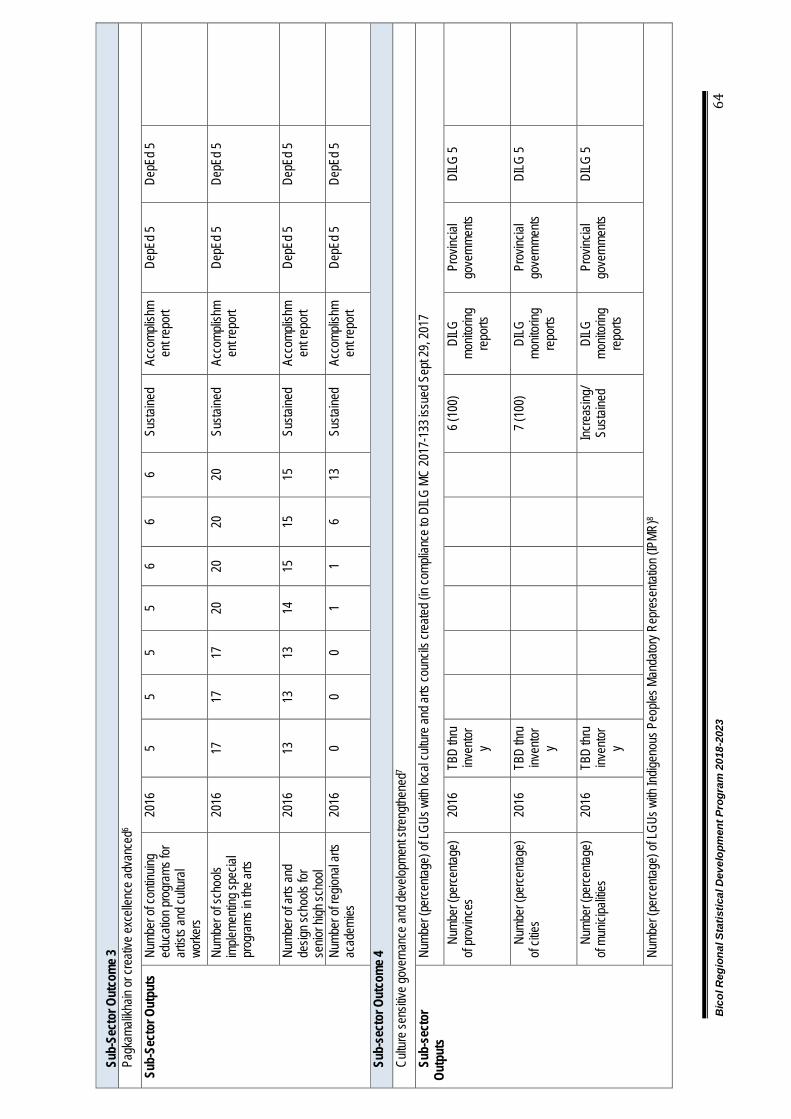
Bic
ol R
egio
nal S
tatis
tical
Dev
elop
men
t Pro
gram
201
8-20
23
64
Sub-
Sect
or O
utco
me 3
Pa
gkam
alikh
ain or
crea
tive e
xcell
ence
adva
nced
6 Su
b-Se
ctor
Out
puts
Nu
mber
of co
ntinu
ing
educ
ation
prog
rams
for
artis
ts an
d cult
ural
worke
rs
2016
5
5 5
5 6
6 6
Sus
taine
d Ac
comp
lishm
ent r
epor
t De
pEd 5
De
pEd 5
Numb
er of
scho
ols
imple
menti
ng sp
ecial
pr
ogra
ms in
the a
rts
2016
17
17
17
20
20
20
20
S
ustai
ned
Acco
mplis
hmen
t rep
ort
DepE
d 5
DepE
d 5
Numb
er of
arts
and
desig
n sch
ools
for
senio
r high
scho
ol
2016
13
13
13
14
15
15
15
S
ustai
ned
Acco
mplis
hmen
t rep
ort
DepE
d 5
DepE
d 5
Numb
er of
regio
nal a
rts
acad
emies
20
16
0 0
0 1
1 6
13
Sus
taine
d Ac
comp
lishm
ent r
epor
t De
pEd 5
De
pEd 5
Sub-
sect
or O
utco
me 4
Cu
lture
sens
itive g
over
nanc
e and
deve
lopme
nt str
ength
ened
7 Su
b-se
ctor
Ou
tput
s Nu
mber
(per
centa
ge) o
f LGU
s with
loca
l cult
ure a
nd ar
ts co
uncil
s cre
ated (
in co
mplia
nce t
o DILG
MC
2017
-133
issu
ed S
ept 2
9, 20
17
Numb
er (p
erce
ntage
) of
prov
inces
20
16
TBD
thru
inven
tory
6 (10
0)
DILG
mo
nitor
ing
repo
rts
Prov
incial
go
vern
ments
DI
LG 5
Numb
er (p
erce
ntage
) of
cities
20
16
TBD
thru
inven
tory
7 (10
0)
DILG
mo
nitor
ing
repo
rts
Prov
incial
go
vern
ments
DI
LG 5
Numb
er (p
erce
ntage
) of
munic
ipaliti
es
2016
TB
D thr
u inv
entor
y
Incre
asing
/ Su
staine
d DI
LG
monit
oring
re
ports
Prov
incial
go
vern
ments
DI
LG 5
Nu
mber
(per
centa
ge) o
f LGU
s with
Indig
enou
s Peo
ples M
anda
tory R
epre
senta
tion (
IPMR
)8
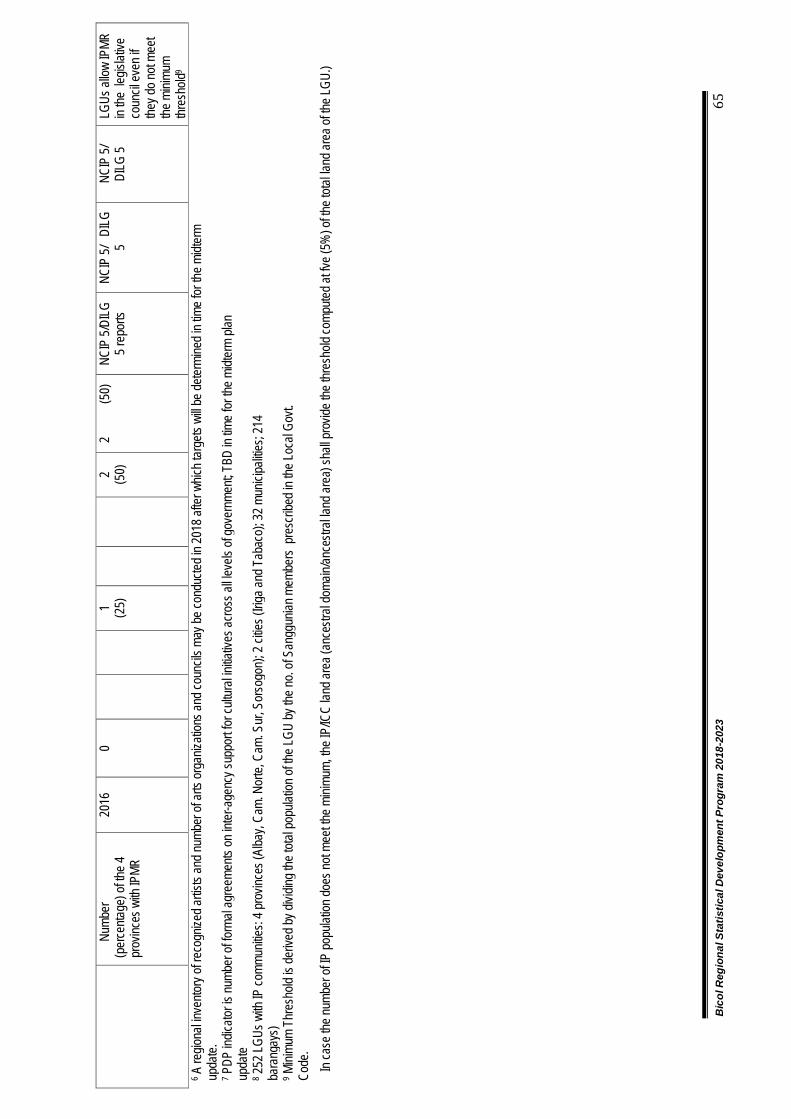
Bic
ol R
egio
nal S
tatis
tical
Dev
elop
men
t Pro
gram
201
8-20
23
65
Num
ber
(per
centa
ge) o
f the 4
pr
ovinc
es w
ith IP
MR
2016
0
1
(25)
2
(5
0)
2
(5
0)
NCIP
5/DI
LG
5 rep
orts
NCIP
5/ D
ILG
5 NC
IP 5/
DI
LG 5
LGUs
allow
IPMR
in
the le
gislat
ive
coun
cil ev
en if
they d
o not
meet
the m
inimu
m thr
esho
ld9 6 A
regio
nal in
vento
ry of
reco
gnize
d artis
ts an
d num
ber o
f arts
orga
nizati
ons a
nd co
uncil
s may
be co
nduc
ted in
2018
after
whic
h tar
gets
will b
e dete
rmine
d in t
ime f
or th
e midt
erm
upda
te.
7 PDP
indic
ator is
numb
er of
form
al ag
reem
ents
on in
ter-a
genc
y sup
port
for cu
ltura
l initia
tives
acro
ss al
l leve
ls of
gove
rnme
nt; T
BD in
time
for th
e midt
erm
plan
upda
te
8 252
LGUs
with
IP co
mmun
ities:
4 pro
vince
s (Al
bay,
Cam.
Nor
te, C
am. S
ur, S
orso
gon)
; 2 ci
ties (
Iriga a
nd T
abac
o); 3
2 mun
icipa
lities
; 214
ba
rang
ays)
9 Mini
mum
Thre
shold
is de
rived
by di
viding
the t
otal p
opula
tion o
f the L
GU by
the n
o. of
San
ggun
ian m
embe
rs p
resc
ribed
in th
e Loc
al Go
vt.
Code
.
I
n cas
e the
numb
er of
IP po
pulat
ion do
es no
t mee
t the m
inimu
m, th
e IP/
ICC
land a
rea (
ance
stral
doma
in/an
cestr
al lan
d are
a) sh
all pr
ovide
the t
hres
hold
comp
uted a
t fve (
5%) o
f the t
otal la
nd ar
ea of
the L
GU.)

Bic
ol R
egio
nal S
tatis
tical
Dev
elop
men
t Pro
gram
201
8-20
23
66
BICO
L RE
GION
REG
IONA
L DE
VELO
PMEN
T PL
AN R
ESUL
TS M
ATRI
CES
2017
-202
2
CH
APTE
R 8:
EXP
ANDI
NG E
CONO
MIC
OPPO
RTUN
ITIES
IN A
GRIC
ULTU
RE, F
ORES
TRY,
AND
FIS
HERI
ES
Objec
tives
/Res
ults
In
dica
tor
Base
line
Annu
al Ta
rget
s En
d-of
Pl
an
Targ
et
Mean
s of
Verif
icatio
n Re
spon
sible
Agen
cy
Repo
rting
Ag
ency
As
sum
ptio
ns
and
Risk
s Ye
ar
Valu
e 20
17
2018
20
19
2020
20
21
2022
So
cieta
l Goa
l To
lay d
own t
he fo
unda
tion f
or in
clusiv
e gro
wth,
a high
-trus
t and
resil
ient s
ociet
y and
a glo
bally
-comp
etitiv
e kno
wled
ge ec
onom
y In
term
ediat
e Goa
l Re
ducin
g ine
quali
ty in
econ
omic
oppo
rtunit
ies
Sect
or O
utco
me 1
Ec
onom
ic op
portu
nities
in
agric
ultur
e and
fis
herie
s exp
ande
d
Grow
th of
Gros
s Va
lue
Adde
d (G
VA) in
Ag
ricult
ure, Fo
restr
y an
d Fis
herie
s (in
real
terms
, in
perc
ent)
2015
0.1
2.5
-3.5
2.5-3
.5 2.5
-3.5
2.5-3
.5 2.5
-3.5
2.5-3
.5 2.5
-3.5
PSA
repo
rt DA
PS
A So
und
macr
oeco
nomi
c and
re
forms
in
food s
ecur
ity
polic
ies
institu
ted
a. Cr
ops
2015
-1
.8 2.0
-3.0
2.0-3
.0 2.0
-3.0
2.0-3
.0 2.0
-3.0
2.0-3
.0 2.0
-3.0
PSA
repo
rt DA
PS
A Go
od
agric
ultur
al an
d clim
ate
chan
ge
adap
tation
pr
actic
es
adop
ted by
far
mers
b. Liv
estoc
k 20
15
3.8
3.0-4
.0 3.0
-4.0
3.0-4
.0 3.0
-4.0
3.0-4
.0 3.0
-4.0
3.0-4
.0 PS
A re
port
DA
PSA
c. Po
ultry
20
15
5.7
3.0-4
.0 3.0
-4.0
3.0-4
.0 3.0
-4.0
3.0-4
.0 3.0
-4.0
3.0-4
.0 PS
A re
port
DA
PSA
d. Fo
restr
y 20
15
-26.7
2.0
-3.0
2.0-3
.0 2.0
-3.0
2.0-3
.0 2.0
-3.0
2.0-3
.0 2.0
-3.0
PSA
repo
rt DE
NR
PSA
Grow
th in
Value
of P
rodu
ction
of F
isher
ies (a
t con
stant
price
s, in
perc
ent)

Bic
ol R
egio
nal S
tatis
tical
Dev
elop
men
t Pro
gram
201
8-20
23
67
a. Co
mmer
cial
2015
-3
.3 25
.0 25
.0 25
.0 25
.0 25
.0 25
.0 25
.0 PS
A re
port
DA-B
FAR
PSA
Good
fishe
ry an
d clim
ate
chan
ge
adap
tation
pr
actic
es
adop
ted by
fis
herfo
lk
b. Mu
nicipa
l 20
15
-2.2
1.0
1.0
1.0
1.0
1.0
1.0
1.0
PSA
repo
rt DA
-BFA
R PS
A
c. Aq
uacu
lture
2015
0.8
5.0
5.0
5.0
5.0
5.0
5.0
5.0
PS
A re
port
DA-B
FAR
PSA
Sub-
sect
or O
utco
me 1
AF
prod
uctiv
ity
impr
oved
Yi
eld o
f majo
r com
modit
ies (in
metr
ic ton
s per
hecta
re)
a. Pa
lay
2016
3.6
0 3.8
0 3.9
0 4.0
0 4.0
0 4.1
0 4.1
0 4.1
0 PS
A re
port
DA
PSA
Irriga
tion
facilit
ies
prov
ided;
favor
able
cond
ition
b. W
hite
Corn
2016
1.1
5 1.3
1 1.4
4 1.5
8 1.7
0 1.8
0 2.0
1 2.0
1 PS
A re
port
DA
PSA
c. Ye
llow
Corn
2016
3.5
3 3.5
5 3.5
9 3.7
0 3.8
2 4.0
0 4.1
8 4.1
8 PS
A re
port
DA
PSA
d.
Bana
na
2016
0.5
0 4.0
0 4.2
0 4.5
0 5.0
0 5.5
0 5.7
0 5.7
0 PS
A re
port
DA
PSA
e. Pi
neap
ple
2016
5.7
0 30
.00
32.30
32
.48
32.40
33
2.49
32.50
32
.50
PSA
repo
rt DA
PS
A
f. Ma
ngo
2016
12
.10
PS
A re
port
DA
PSA
g. Ca
ssav
a 20
16
-2.60
15
.10
15.90
16
.70
17.70
18
.40
19.30
19
.30
PSA
repo
rt DA
PS
A
h. Co
ffee
2016
-9
.80
0.40
0.47
0.56
0.61
0.63
0.64
0.64
PSA
repo
rt DA
PS
A
i. Ca
cao
2016
6.2
0 7.6
1 8.0
4 8.3
4 9.0
5 10
.36
11.23
11
.23
PSA
repo
rt DA
PS
A
Volum
e of p
rodu
ction
of st
aple
crop
s (in
metric
tons
) a.
Pa
lay
2016
1,275
,492
.00
1,3
59,56
1.00
1,4
41,86
2.00
1,5
35,85
0.00
1,5
47,78
0.00
1,5
68,03
6.00
1,5
91,24
1.00
1,5
91,24
1.00
PSA
repo
rt DA
PS
A Irr
igatio
n fac
ilities
pr
ovide
d; fav
orab
le co
nditio
n b.
W
hite
corn
2016
57,88
5.00
68
,521.0
0
77,46
1.00
86
,772.0
0
96,17
9.00
105,2
47.0
0
117,0
94.0
0
117,0
94.0
0
PSA
repo
rt DA
PS
A
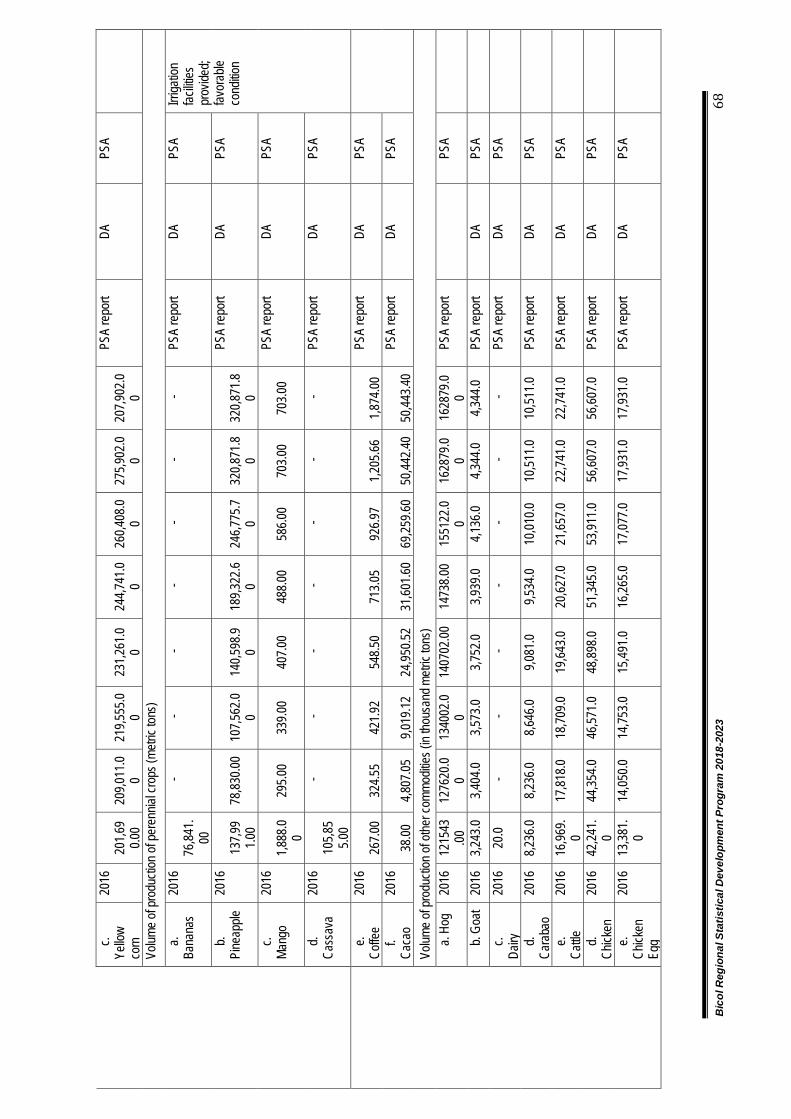
Bic
ol R
egio
nal S
tatis
tical
Dev
elop
men
t Pro
gram
201
8-20
23
68
c.
Yello
w co
rn
2016
20
1,69
0.00
209,0
11.0
0
219,5
55.0
0
231,2
61.0
0
244,7
41.0
0
260,4
08.0
0
275,9
02.0
0
207,9
02.0
0
PSA
repo
rt DA
PS
A
Volum
e of p
rodu
ction
of pe
renn
ial cr
ops (
metric
tons
) a.
Ba
nana
s 20
16
76
,841.
00
-
-
-
-
-
-
-
PSA
repo
rt DA
PS
A Irr
igatio
n fac
ilities
pr
ovide
d; fav
orab
le co
nditio
n b.
Pi
neap
ple
2016
13
7,99
1.00
78
,830.0
0
10
7,562
.00
140,5
98.9
0
189,3
22.6
0
246,7
75.7
0
320,8
71.8
0
320,8
71.8
0
PSA
repo
rt DA
PS
A
c.
Mang
o 20
16
1,8
88.0
0
295.0
0
33
9.00
407.0
0
48
8.00
586.0
0
70
3.00
703.0
0 PS
A re
port
DA
PSA
d. Ca
ssav
a 20
16
105,8
55.0
0
-
-
-
-
-
-
-
PSA
repo
rt DA
PS
A
e.
Co
ffee
2016
26
7.00
324.5
5
42
1.92
548.5
0
71
3.05
926.9
7
1,205
.66
1,8
74.00
PS
A re
port
DA
PSA
f. Ca
cao
2016
38.00
4,807
.05
9,0
19.12
24,95
0.52
31
,601.6
0
69,25
9.60
50
,442.4
0
50,44
3.40
PSA
repo
rt DA
PS
A
Volum
e of p
rodu
ction
of ot
her c
ommo
dities
(in th
ousa
nd m
etric
tons)
a.
Hog
2016
12
1543
.00
1276
20.0
0 13
4002
.00
1407
02.00
14
738.0
0 15
5122
.00
1628
79.0
0 16
2879
.00
PSA
repo
rt
PSA
b. Go
at
2016
3,2
43.0
3,4
04.0
3,5
73.0
3,7
52.0
3,9
39.0
4,1
36.0
4,3
44.0
4,3
44.0
PS
A re
port
DA
PSA
c.
Dairy
20
16
20.0
-
-
-
-
-
-
-
PS
A re
port
DA
PSA
d.
Cara
bao
2016
8,2
36.0
8,2
36.0
8,6
46.0
9,0
81.0
9,5
34.0
10
,010.0
10
,511.0
10
,511.0
PS
A re
port
DA
PSA
e.
Cattle
20
16
16,96
9.0
17,81
8.0
18,70
9.0
19,64
3.0
20,62
7.0
21,65
7.0
22,74
1.0
22,74
1.0
PSA
repo
rt DA
PS
A
d. Ch
icken
20
16
42,24
1.0
44,35
4.0
46,57
1.0
48,89
8.0
51,34
5.0
53,91
1.0
56,60
7.0
56,60
7.0
PSA
repo
rt DA
PS
A
e. Ch
icken
Eg
g
2016
13
,381.
0 14
,050.0
14
,753.0
15
,491.0
16
,265.0
17
,077.0
17
,931.0
17
,931.0
PS
A re
port
DA
PSA

Bic
ol R
egio
nal S
tatis
tical
Dev
elop
men
t Pro
gram
201
8-20
23
69
f. Ve
getab
les
2016
1,6
53.0
3,0
22.0
4,6
50.0
6,2
77.0
8,4
75.0
11
,017.0
14
,874.0
14
,874.0
PS
A re
port
DA
PSA
Posth
arve
st los
ses o
f key
agric
lutur
al co
mmod
ities (
in pe
rcen
t) a.
Ri
ce
2016
14
.0
14-1
2 14
-12
14-1
2 14
-12
14-1
2 12
.0
12.0
DA
-PH
ILMEC
H Lo
ss
Asse
ssme
nt St
udy
DA
DA-
PHILM
ECH
b.
Corn
2016
6.6
6.6
16-5
.2 6.6
1-5.2
6.6
1-5.2
6.6
1-5.2
6.6
1-5.2
5.2
5.2
DA
-PH
ILMEC
H Lo
ss
Asse
ssme
nt St
udy
DA
DA-
PHILM
ECH
Sub-
sect
or
Outc
ome 2
AF ba
sed
enter
prise
s Inc
reas
ed
Numb
er
of AF
ba
sed
enter
prise
s (bar
anga
y an
d mu
nicipa
l foo
d ter
mina
ls)
monit
ored
2016
65
65
65
65
65
65
65
65
DA
Rep
ort
DA
DA
Numb
er
of prop
onen
t gr
oups
as
sisted
an
d
2016
2
13
10
6 -
- -
- DA
Rep
ort
DA
DA P
RDP

Bic
ol R
egio
nal S
tatis
tical
Dev
elop
men
t Pro
gram
201
8-20
23
70
funde
d (P
RDP)
Subs
ecto
r Out
com
e 3
Adap
tation
to
clima
te ch
ange
and
disas
ter ris
ks
incre
ased
Area
of
crop
s ins
ured
(h
as.)
TB
D Al
l farm
ers e
nroll
ed w
ith th
e RSB
SA fo
r cro
ps an
d live
stock
DA
-PCI
C Re
port
DA
DA-P
CIC
Area
s tar
geted
for
seed
bu
ffers
tockin
g (h
as.)
2016
TB
D 10
% of
prog
ram
area
s DA
Rice
An
nual
DA
DA
Sect
or O
utco
me 2
Ac
cess
to ec
onom
ic op
portu
nities
of
farme
rs an
d fis
herfo
lks in
crea
sed
Grow
th in
the va
lue
of ou
tput
of AF
F-ba
sed
enter
prise
s in r
eal
terms
(in
perc
ent)
2015
4.6
5.0
-6.0
5.0-6
.0 5.0
-6.0
5.0-6
.0 5.0
-6.0
5.0-6
.0 5.0
-6.0
PSA
repo
rt DA
PS
A
Subs
ecto
r Out
com
e 1

Bic
ol R
egio
nal S
tatis
tical
Dev
elop
men
t Pro
gram
201
8-20
23
71
Acce
ss to
value
ch
ains i
ncre
ased
Nu
mber
of co
mmod
ity pr
oduc
ts wi
th ap
prov
ed
inves
tme
nts in
PC
IP
2016
5
6 7
11
18
18
18
18
DA P
RDP
IPLA
N PC
IP
Inves
tmen
t Tr
ackin
g
DA P
RDP
DA
Subs
ecto
r Out
com
e 2
Acce
ss to
tec
hnolo
gy in
crea
sed
Prog
ram
area
s for
pere
nnial
crop
s pro
vided
with
tech
nical
supp
ort s
ervic
es (in
has.)
a.
Ba
nana
20
16
670
1138
16
77
1679
16
80
1682
16
84
1684
DA
Rep
ort
DA
DA
b.
Pine
apple
20
16
38
2561
33
29.2
4328
.09
5842
.09
7594
.78
9873
.14
9873
.14
DA R
epor
t DA
DA
c.
Coffe
e 20
16
5980
80
9 88
4 97
4 11
74
1474
18
74
1874
DA
Rep
ort
DA
DA
d. C
acao
20
16
5448
63
2 11
22
2990
34
90
3990
44
90
4490
DA
Rep
ort
DA
DA
Nu
mber
of
farme
rs
adap
ting
farm
mech
aniz
ation
2016
TB
D
DA R
epor
t DA
PS
A
Numb
er
of ne
w far
ming
tec
hnolo
gies
ad
opted
2016
TB
D
DA R
epor
t DA
, PHI
LFID
A,
PCA,
BFA
R PS
A
Subs
ecto
r Out
com
e 3

Bic
ol R
egio
nal S
tatis
tical
Dev
elop
men
t Pro
gram
201
8-20
23
72
Acce
ss to
finan
cing
incre
ased
Pe
rcen
t of far
mers
, fis
herfo
lks
using
the
servi
ces
of an
y for
mal
finan
cial
institu
tion
2016
TB
D
DA R
epor
t DA
, PHI
LFID
A,
PCA,
BFA
R,
CDA,
Micr
o fin
ance
ins
titutio
ns
PSA
Subs
ecto
r Out
com
e 4
Acce
ss by
farm
ers
and f
isher
folk t
o lan
d an
d wate
r res
ource
s inc
reas
ed
Shar
e of
actua
l AR
Bs
with
EP/C
LOA
s to t
otal
poten
tial
ARBs
(in
perc
ent)
2016
89
.1 90
.0 91
.0 93
.2 95
.5 97
.7 10
0.0
100.0
DA
R An
nual
Repo
rt DA
R DA
R Al
l "p
roble
matic
" CA
RP-
cove
red
landh
olding
s tra
nsfor
med
into "
worka
ble
landh
olding
s; LA
D CI
As
deliv
er th
eir
resp
ectiv
e tar
gets/
comm
itm
ents.

Bic
ol R
egio
nal S
tatis
tical
Dev
elop
men
t Pro
gram
201
8-20
23
73
Area
dis
tribute
d und
er
CARP
(in
hecta
res)
2016
2,389
6,100
5,754
5,0
48
5,170
5,2
93
5,415
5,4
15
DAR
Annu
al Re
port
DAR
DAR
Gros
s are
a co
vere
d (ma
y inc
lude n
on-
CARP
able
lands
). Al
l "p
roble
matic
" CA
RP-
cove
red
landh
olding
s tra
nsfor
med
into "
worka
ble
landh
olding
s; LA
D CI
As
deliv
er th
eir
resp
ectiv
e tar
gets/
comm
itm
ents.

Bic
ol R
egio
nal S
tatis
tical
Dev
elop
men
t Pro
gram
201
8-20
23
74
BICO
L RE
GION
REG
IONA
L DE
VELO
PMEN
T PL
AN R
ESUL
TS M
ATRI
CES
2017
-202
2
CH
APTE
R 9:
EXP
ANDI
NG E
CONO
MIC
OPPO
RTUN
ITIES
IN IN
DUST
RY A
ND S
ERVI
CES
THRO
UGH
TRAB
AHO
AND
NEGO
SYO
Objec
tives
/Res
ult
s In
dica
tor
Base
line
Annu
al Ta
rget
s En
d- of
Plan
Ta
rget
Mean
s of
Verif
icatio
n Re
spon
sible
Agen
cy
Repo
rtin
g Ag
ency
As
sum
ptio
ns an
d Ri
sks
Year
Va
lue
2017
20
18
2019
20
20
2021
20
22
Socie
tal G
oal
To la
y dow
n the
foun
datio
n for
inclu
sive g
rowt
h, a h
igh-tr
ust a
nd re
silien
t soc
iety a
nd a
globa
lly-co
mpeti
tive k
nowl
edge
econ
omy
Inte
rmed
iate G
oal
Redu
cing i
nequ
ality
in ec
onom
ic op
portu
nities
Se
ctor
Out
com
e 1
Econ
omic
oppo
rtunit
ies in
ind
ustry
and
servi
ces e
xpan
ded
GVA
grow
th of
the in
dustr
y se
ctor (
at co
nstan
t 200
0 pr
ices)
2015
8.0
0 6.7
-7.7
8.4-
9.4
7.7-
8.7
8.2-
9.2
7.9-
8.9
8.4-
9.4
8.4-
9.4
PSA
Repo
rt DT
I PS
A
GVA
grow
th of
the se
rvice
s se
ctor (
at co
nstan
t 200
0 pr
ices)
2015
7.5
0 6.7
-7.7
6.9-
7.9
7.0-
8.0
7.1-
8.1
7.0-
8.0
6.9-
7.9
6.9-
7.9
PSA
Repo
rt DT
I PS
A
Sub-
sect
or O
utco
me 1
Inv
estm
ents
incre
ased
Pa
id up
Cap
ital
of Co
oper
ative
s 20
16
P1.87
bil
lion
Incre
asing
CD
A Re
port
CDA
CDA
Loan
Por
tfolio
(fo
r inve
stmen
t pu
rpos
es)
2016
P6
.23
billio
n Inc
reas
ing
Porto
flio
monit
oring
re
port
BSP
BSP
BOI a
ppro
ved
inves
tmen
ts 20
16
P4.5
billio
n Inc
reas
ing
BOI R
epor
t DT
I-BOI
DT
I-BOI
Paid
up C
apita
l of
Corp
orati
ons
TB
D
SEC
repo
rt SE
C SE
C
Sub-
sect
or O
utco
me 2

Bic
ol R
egio
nal S
tatis
tical
Dev
elop
men
t Pro
gram
201
8-20
23
75
Comp
etitiv
enes
s, inn
ovati
vene
ss, a
nd re
silien
ce in
creas
ed
Sub-
sect
or O
utco
me 3
Ac
cess
to
mark
et im
prov
ed
Value
of ex
ports
(fo
reign
) ( in
US
D)
TB
D
DT
I PS
A,
BOC
Fore
ign to
urist
ar
rival
(in m
illion
) 20
16
1.042
1.0
73
1.105
1.1
38
1.172
1.2
08
1.244
1.2
44
A/D
Card
s an
d sea
ma
nifes
t
DOT
DOT
ASEA
N Int
egra
tion i
s full
y im
pleme
nted i
n se
ctors/
indus
tries
inter
twini
ng w
ith to
urism
Dome
stic t
ouris
t ar
rival
(in m
illion
) 20
16
4.366
Inc
reas
ing
DOT
Repo
rt DO
T DO
T
Sect
or O
utco
me 2
Ac
cess
to
Econ
omic
oppo
rtunit
ies of
MS
MEs a
nd
coop
erati
ve
expa
nded
Prop
ortio
n of
MSME
s valu
e ad
ded t
o tota
l ind
ustry
value
ad
ded
TB
D
DT
I PS
A
Prop
ortio
n of
coop
erati
ves
value
adde
d to
total
indus
try
value
adde
d
TB
D
CD
A PS
A

Bic
ol R
egio
nal S
tatis
tical
Dev
elop
men
t Pro
gram
201
8-20
23
76
Su
b-se
ctor
Out
com
e 1
Acce
ss to
pr
oduc
tion
netw
orks
impr
oved
Acce
ss ro
ad to
ec
ozon
es/in
dustr
y
-
-
-
24
.58
14.83
12
.14
51.55
DPW
H DP
WH
Sub-
sect
or O
utco
me 2
Ac
cess
to
finan
cing i
ncre
ased
Pe
rcen
tage o
f MS
MEs p
rovid
ed
with
finan
cing
Incre
asing
DTI
BSP
Perc
entag
e of
coop
erati
ves
prov
ided w
ith
finan
cing
Incre
asing
CDA
CDA
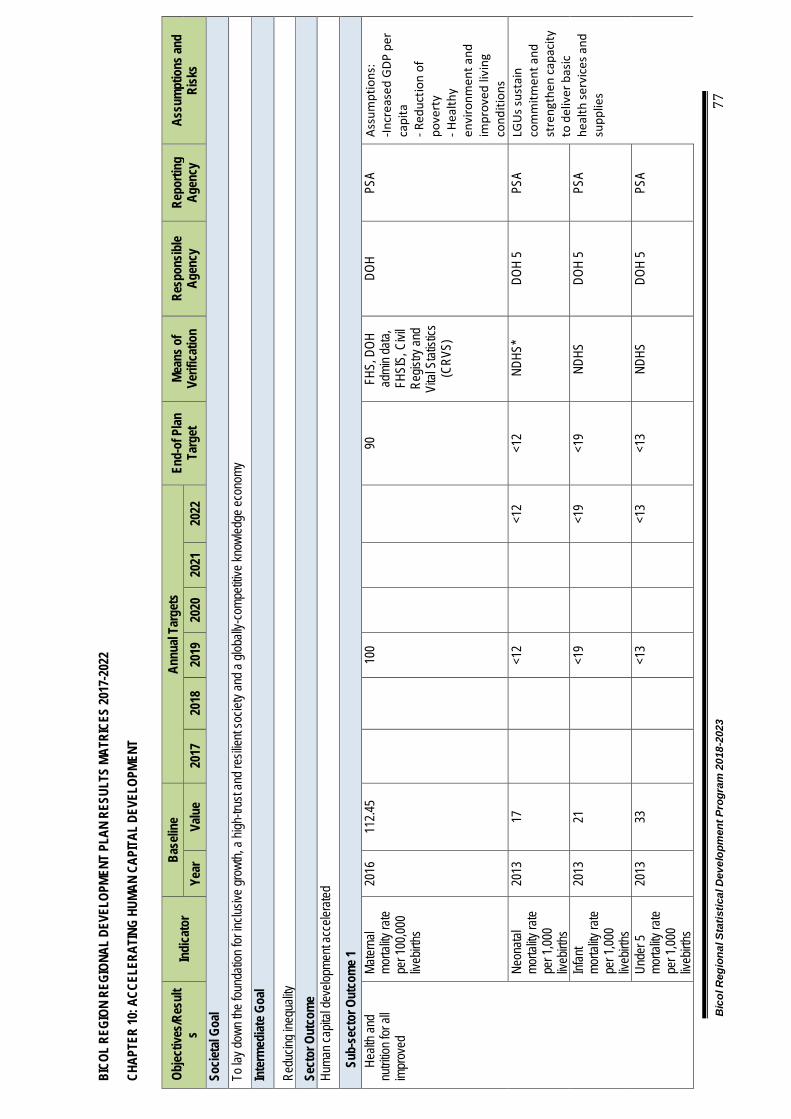
Bic
ol R
egio
nal S
tatis
tical
Dev
elop
men
t Pro
gram
201
8-20
23
77
BICO
L RE
GION
REG
IONA
L DE
VELO
PMEN
T PL
AN R
ESUL
TS M
ATRI
CES
2017
-202
2
CH
APTE
R 10
: ACC
ELER
ATIN
G HU
MAN
CAPI
TAL
DEVE
LOPM
ENT
Objec
tives
/Res
ult
s In
dica
tor
Base
line
Annu
al Ta
rget
s En
d-of
Plan
Ta
rget
Me
ans o
f Ve
rifica
tion
Resp
onsib
le Ag
ency
Re
porti
ng
Agen
cy
Assu
mpt
ions
and
Risk
s Ye
ar
Valu
e 20
17
2018
20
19
2020
20
21
2022
So
cieta
l Goa
l To
lay d
own t
he fo
unda
tion f
or in
clusiv
e gro
wth,
a high
-trus
t and
resil
ient s
ociet
y and
a glo
bally
-comp
etitiv
e kno
wled
ge ec
onom
y In
term
ediat
e Goa
l
Redu
cing i
nequ
ality
Sect
or O
utco
me
Huma
n cap
ital d
evelo
pmen
t acc
elera
ted
Sub-
sect
or O
utco
me 1
He
alth a
nd
nutrit
ion fo
r all
impr
oved
Mater
nal
morta
lity ra
te pe
r 100
,000
liveb
irths
2016
11
2.45
100
90
FH
S, D
OH
admi
n data
, FH
SIS,
Civi
l Re
gistry
and
Vital
Stat
istics
(C
RVS)
DOH
PSA
Assu
mpt
ions
: -In
crea
sed
GDP
per
ca
pita
- R
educ
tion
of
pove
rty
- Hea
lthy
envi
ronm
ent a
nd
impr
oved
livi
ng
cond
ition
s Ne
onata
l mo
rtality
rate
per 1
,000
liveb
irths
2013
17
<1
2
<1
2 <1
2 ND
HS*
DOH
5 PS
A LG
Us s
usta
in
com
mitm
ent a
nd
stre
ngth
en c
apac
ity
to d
eliv
er b
asic
he
alth
serv
ices
and
su
pplie
s Inf
ant
morta
lity ra
te pe
r 1,00
0 liv
ebirth
s
2013
21
<1
9
<1
9 <1
9 ND
HS
DOH
5 PS
A
Unde
r 5
morta
lity ra
te pe
r 1,00
0 liv
ebirth
s
2013
33
<1
3
<1
3 <1
3 ND
HS
DOH
5 PS
A
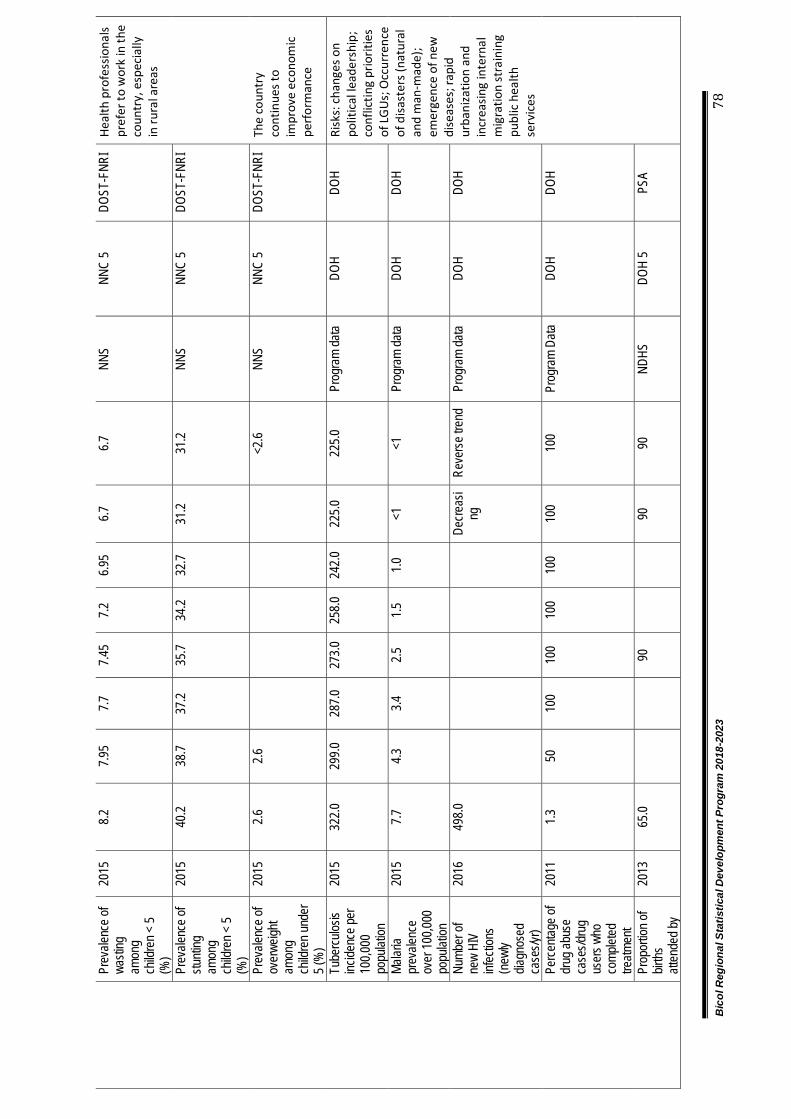
Bic
ol R
egio
nal S
tatis
tical
Dev
elop
men
t Pro
gram
201
8-20
23
78
Prev
alenc
e of
wasti
ng
amon
g ch
ildre
n < 5
(%)
2015
8.2
7.9
5 7.7
7.4
5 7.2
6.9
5 6.7
6.7
NN
S NN
C 5
DOST
-FNR
I He
alth
pro
fess
iona
ls pr
efer
to w
ork
in th
e co
untr
y, e
spec
ially
in
rura
l are
as
Prev
alenc
e of
stunti
ng
amon
g ch
ildre
n < 5
(%)
2015
40
.2 38
.7 37
.2 35
.7 34
.2 32
.7 31
.2 31
.2 NN
S NN
C 5
DOST
-FNR
I
Prev
alenc
e of
over
weigh
t am
ong
child
ren u
nder
5 (
%)
2015
2.6
2.6
<2.6
NNS
NNC
5 DO
ST-F
NRI
The
coun
try
cont
inue
s to
impr
ove
econ
omic
pe
rfor
man
ce
Tube
rculos
is inc
idenc
e per
10
0,000
po
pulat
ion
2015
32
2.0
299.0
28
7.0
273.0
25
8.0
242.0
22
5.0
225.0
Pr
ogra
m da
ta DO
H DO
H Ri
sks:
cha
nges
on
polit
ical
lead
ersh
ip;
conf
lictin
g pr
iorit
ies
of L
GU
s; O
ccur
renc
e of
disa
ster
s (na
tura
l an
d m
an-m
ade)
; em
erge
nce
of n
ew
dise
ases
; rap
id
urba
niza
tion
and
incr
easin
g in
tern
al
mig
ratio
n st
rain
ing
publ
ic h
ealth
se
rvic
es
Malar
ia pr
evale
nce
over
100,0
00
popu
lation
2015
7.7
4.3
3.4
2.5
1.5
1.0
<1
<1
Pr
ogra
m da
ta DO
H DO
H
Numb
er of
ne
w HI
V inf
ectio
ns
(new
ly dia
gnos
ed
case
s/yr)
2016
49
8.0
De
creas
ing
Re
vers
e tre
nd
Prog
ram
data
DOH
DOH
Perc
entag
e of
drug
abus
e ca
ses/d
rug
user
s who
co
mplet
ed
treatm
ent
2011
1.3
50
10
0 10
0 10
0 10
0 10
0 10
0 Pr
ogra
m Da
ta DO
H DO
H
Prop
ortio
n of
births
att
ende
d by
2013
65
.0
90
90
90
ND
HS
DOH
5 PS
A
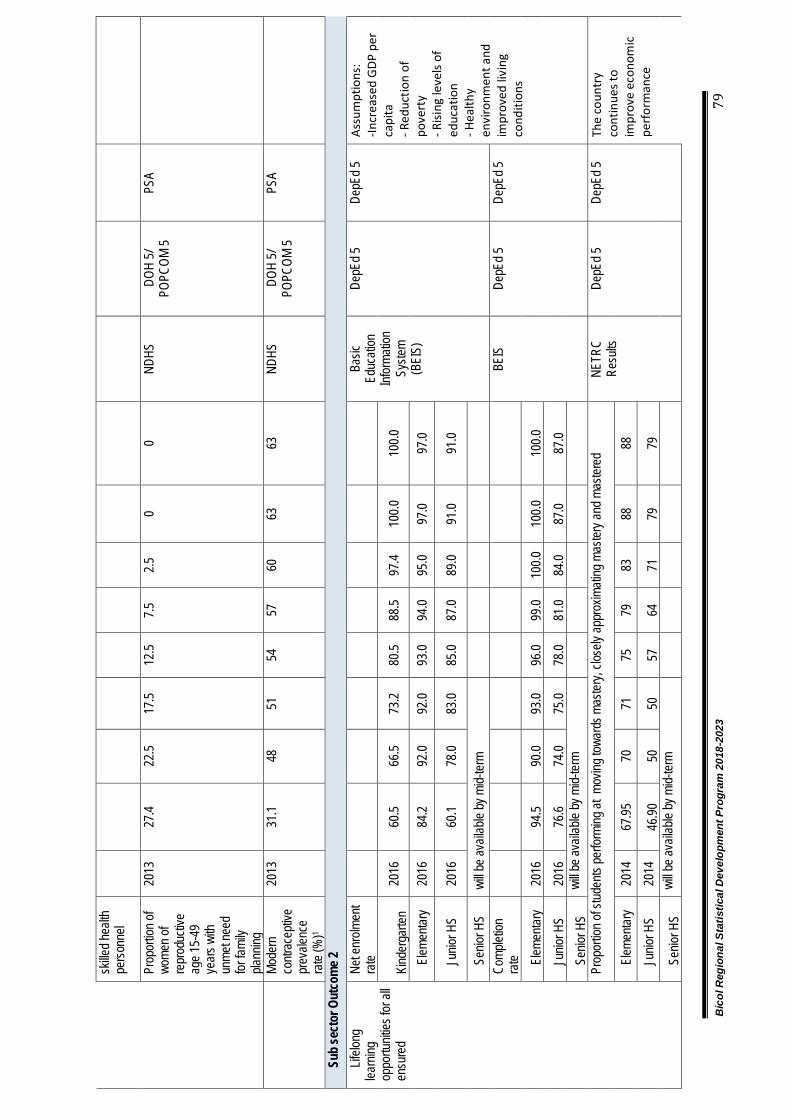
Bic
ol R
egio
nal S
tatis
tical
Dev
elop
men
t Pro
gram
201
8-20
23
79
skille
d hea
lth
pers
onne
l
Prop
ortio
n of
wome
n of
repr
oduc
tive
age 1
5-49
ye
ars w
ith
unme
t nee
d for
fami
ly pla
nning
2013
27
.4 22
.5 17
.5 12
.5 7.5
2.5
0
0 ND
HS
DOH
5/ PO
PCOM
5 PS
A
Mode
rn
contr
acep
tive
prev
alenc
e ra
te (%
)1
2013
31
.1 48
51
54
57
60
63
63
ND
HS
DOH
5/ PO
PCOM
5 PS
A
Su
b se
ctor
Out
com
e 2
Lifelo
ng
learn
ing
oppo
rtunit
ies fo
r all
ensu
red
Net e
nrolm
ent
rate
Ba
sic
Educ
ation
Inf
orma
tion
Syste
m (B
EIS)
DepE
d 5
DepE
d 5
Assu
mpt
ions
: -In
crea
sed
GDP
per
ca
pita
- R
educ
tion
of
pove
rty
- Risi
ng le
vels
of
educ
atio
n
- Hea
lthy
envi
ronm
ent a
nd
impr
oved
livi
ng
cond
ition
s
Kind
erga
rten
2016
60
.5 66
.5 73
.2 80
.5 88
.5 97
.4 10
0.0
100.0
Elem
entar
y 20
16
84.2
92.0
92.0
93.0
94.0
95.0
97.0
97.0
Jun
ior H
S 20
16
60.1
78.0
83.0
85.0
87.0
89.0
91.0
91.0
Sen
ior H
S wi
ll be a
vaila
ble by
mid-
term
Co
mplet
ion
rate
BE
IS
DepE
d 5
DepE
d 5
Elem
entar
y 20
16
94.5
90.0
93.0
96.0
99.0
100.0
10
0.0
100.0
J
unior
HS
2016
76
.6 74
.0 75
.0 78
.0 81
.0 84
.0 87
.0 87
.0 S
enior
HS
will b
e ava
ilable
by m
id-ter
m
Prop
ortio
n of s
tuden
ts pe
rform
ing at
mov
ing to
ward
s mas
tery,
close
ly ap
prox
imati
ng m
aster
y and
mas
tered
NE
TRC
Resu
lts
DepE
d 5
DepE
d 5
The
coun
try
cont
inue
s to
impr
ove
econ
omic
pe
rfor
man
ce
Elem
entar
y 20
14
67.95
70
71
75
79
83
88
88
J
unior
HS
2014
46
.90
50
50
57
64
71
79
79
Sen
ior H
S wi
ll be a
vaila
ble by
mid-
term
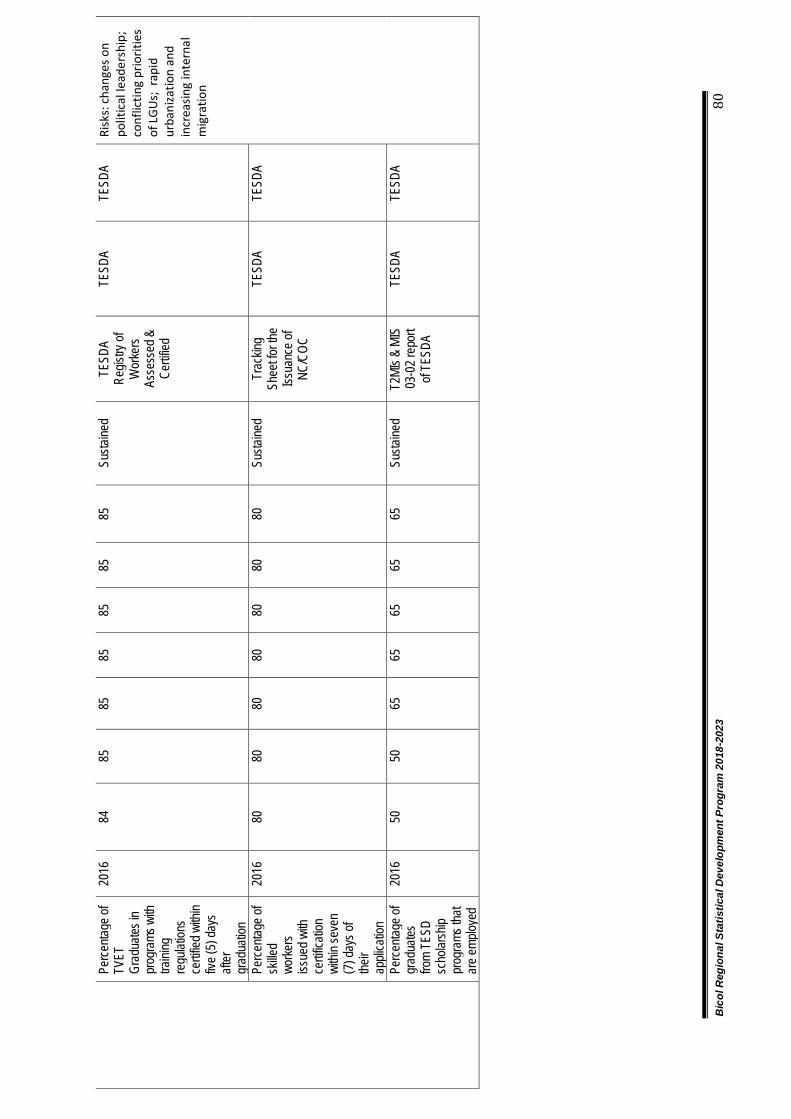
Bic
ol R
egio
nal S
tatis
tical
Dev
elop
men
t Pro
gram
201
8-20
23
80
Perc
entag
e of
TVET
Gr
adua
tes in
pr
ogra
ms w
ith
traini
ng
regu
lation
s ce
rtified
with
in fiv
e (5)
days
aft
er
grad
uatio
n
2016
84
85
85
85
85
85
85
Su
staine
d TE
SDA
Regis
try of
W
orke
rs
Asse
ssed
&
Certif
ied
TESD
A TE
SDA
Risk
s: c
hang
es o
n po
litic
al le
ader
ship
; co
nflic
ting
prio
ritie
s of
LG
Us;
rap
id
urba
niza
tion
and
incr
easin
g in
tern
al
mig
ratio
n
Perc
entag
e of
skille
d wo
rkers
iss
ued w
ith
certif
icatio
n wi
thin s
even
(7
) day
s of
their
appli
catio
n
2016
80
80
80
80
80
80
80
Su
staine
d Tr
ackin
g Sh
eet fo
r the
Iss
uanc
e of
NC/C
OC
TESD
A TE
SDA
Perc
entag
e of
grad
uates
fro
m TE
SD
scho
larsh
ip pr
ogra
ms th
at ar
e emp
loyed
2016
50
50
65
65
65
65
65
Su
staine
d T2
MIs &
MIS
03
-02 r
epor
t of
TESD
A
TESD
A TE
SDA
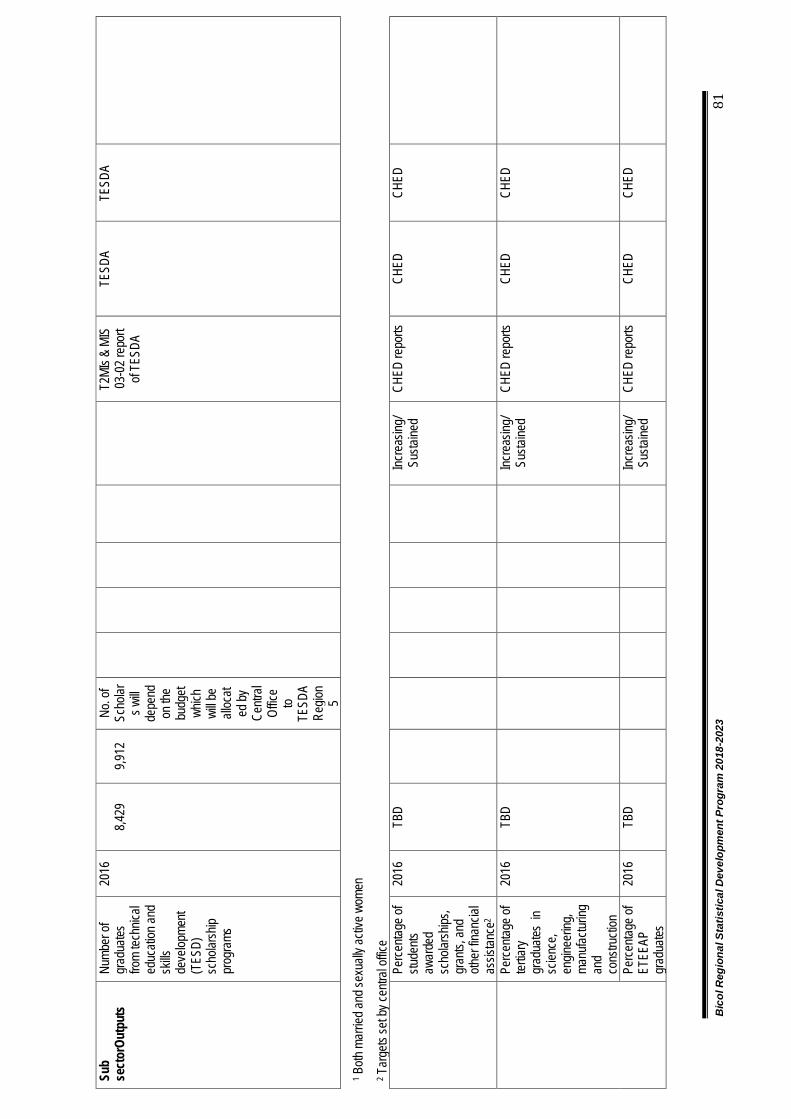
Bic
ol R
egio
nal S
tatis
tical
Dev
elop
men
t Pro
gram
201
8-20
23
81
Sub
sect
orOu
tput
s Nu
mber
of
grad
uates
fro
m tec
hnica
l ed
ucati
on an
d sk
ills
deve
lopme
nt (T
ESD)
sc
holar
ship
prog
rams
2016
8,429
9,912
No
. of
Scho
lars w
ill de
pend
on
the
budg
et wh
ich
will b
e all
ocat
ed by
Ce
ntral
Offic
e to
TESD
A Re
gion
5
T2
MIs &
MIS
03
-02 r
epor
t of
TESD
A
TESD
A TE
SDA
1 Both
mar
ried a
nd se
xuall
y acti
ve w
omen
2 Tar
gets
set b
y cen
tral o
ffice
Pe
rcen
tage o
f stu
dents
aw
arde
d sc
holar
ships
, gr
ants,
and
other
finan
cial
assis
tance
2
2016
TB
D
Inc
reas
ing/
Susta
ined
CHED
repo
rts
CHED
CH
ED
Pe
rcen
tage o
f ter
tiary
gr
adua
tes in
sc
ience
, en
ginee
ring,
manu
factur
ing
and
cons
tructi
on
2016
TB
D
Inc
reas
ing/
Susta
ined
CHED
repo
rts
CHED
CH
ED
Pe
rcen
tage o
f ET
EEAP
gr
adua
tes
2016
TB
D
Inc
reas
ing/
Susta
ined
CHED
repo
rts
CHED
CH
ED

Bic
ol R
egio
nal S
tatis
tical
Dev
elop
men
t Pro
gram
201
8-20
23
82
Numb
er of
cu
rricu
la an
d pr
ogra
ms
deve
loped
/ re
vised
base
d on
mult
i-dis
ciplin
al pla
tform
s tha
t fos
ter 21
st ce
ntury
comp
etenc
ies
2016
TB
D
Inc
reas
ing/
Susta
ined
CHED
repo
rts
CHED
CH
ED
Nu
mber
of
paten
ts,
licen
ses,
and
roya
lties
issue
d to
HEIs
2016
TB
D thr
u inv
entor
y
Inc
reas
ing/
Susta
ined
CHED
repo
rts
CHED
CH
ED
Nu
mber
of
rese
arch
ers
and s
cienti
sts
2016
TB
D thr
u inv
entor
y
Inc
reas
ing/
Susta
ined
DOST
Data
CH
ED
DOST
Nu
mber
of
grad
uate
educ
ation
gr
adua
tes
(MA/
PhD)
en
gage
d in
origi
nal
rese
arch
of
crea
tive w
ork
2016
TB
D
Inc
reas
ing/
Susta
ined
High
er
Educ
ation
Da
ta
CHED
CH
ED
Numb
er of
inn
ovati
on
hubs
es
tablis
hed
withi
n HEI
s
2016
TB
D thr
u inv
entor
y
Inc
reas
ing/
Susta
ined
CHED
repo
rts
CHED
CH
ED
Numb
er of
HE
Is en
gage
d in
local
and
globa
l pa
rtner
ships
2016
TB
D thr
u inv
entor
y
Inc
reas
ing/
Susta
ined
MOAs
/MOU
s CH
ED
CHED

Bic
ol R
egio
nal S
tatis
tical
Dev
elop
men
t Pro
gram
201
8-20
23
83
and
colla
bora
tions
Sub
sect
or O
utco
me 3
Inc
ome e
arnin
g abil
ity in
creas
ed
Su
b se
ctor
Ou
tput
s Yo
uth pl
aced
in em
ploym
ent,
educ
ation
or
traini
ng ('0
00)
2016
TB
D
Incre
asing
/ Su
staine
d Pr
ogra
m da
ta DO
LE
DOLE
SPES
GIP
Jo
bstar
t
PESF
A
TWSP
Emplo
yme
nt Fa
cilita
tion
(EF)
Tra
ck
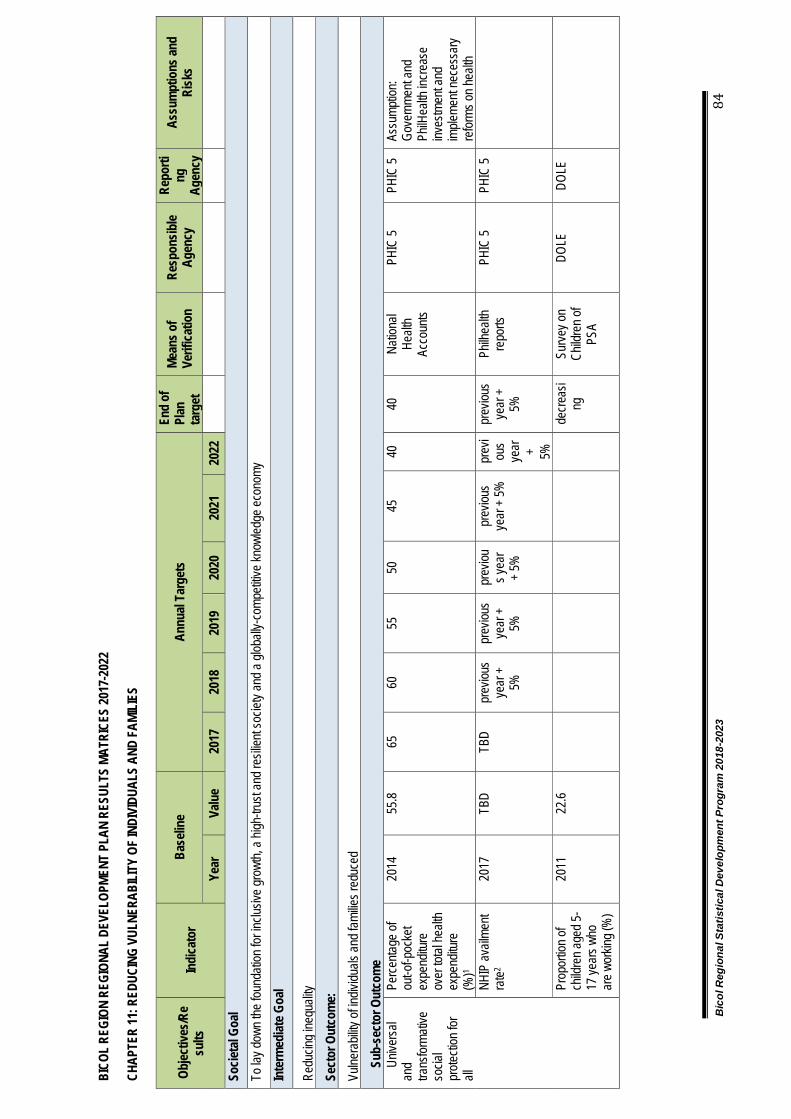
Bic
ol R
egio
nal S
tatis
tical
Dev
elop
men
t Pro
gram
201
8-20
23
84
BICO
L RE
GION
REG
IONA
L DE
VELO
PMEN
T PL
AN R
ESUL
TS M
ATRI
CES
2017
-202
2
CHAP
TER
11: R
EDUC
ING
VULN
ERAB
ILIT
Y OF
INDI
VIDU
ALS
AND
FAMI
LIES
Objec
tives
/Re
sults
In
dica
tor
Base
line
Annu
al Ta
rget
s En
d of
Pl
an
targ
et
Mean
s of
Verif
icatio
n Re
spon
sible
Agen
cy
Repo
rting
Ag
ency
As
sum
ptio
ns an
d Ri
sks
Year
Va
lue
2017
20
18
2019
20
20
2021
20
22
So
cieta
l Goa
l To
lay d
own t
he fo
unda
tion f
or in
clusiv
e gro
wth,
a high
-trus
t and
resil
ient s
ociet
y and
a glo
bally
-comp
etitiv
e kno
wled
ge ec
onom
y In
term
ediat
e Goa
l
Redu
cing i
nequ
ality
Se
ctor
Out
com
e:
Vulne
rabil
ity of
indiv
iduals
and f
amilie
s red
uced
Su
b-se
ctor
Out
com
e Un
ivers
al an
d tra
nsfor
mativ
e so
cial
prote
ction
for
all
Perc
entag
e of
out-o
f-poc
ket
expe
nditu
re
over
total
healt
h ex
pend
iture
(%
)1
2014
55
.8 65
60
55
50
45
40
40
Na
tiona
l He
alth
Acco
unts
PHIC
5 PH
IC 5
Assu
mptio
n: Go
vern
ment
and
PhilH
ealth
incr
ease
inv
estm
ent a
nd
imple
ment
nece
ssar
y re
forms
on he
alth
NHIP
avail
ment
rate2
2017
TB
D TB
D pr
eviou
s ye
ar +
5%
prev
ious
year
+
5%
prev
ious y
ear
+ 5%
prev
ious
year
+ 5%
pr
evi
ous
year
+ 5%
prev
ious
year
+
5%
Philh
ealth
re
ports
PH
IC 5
PHIC
5
Pr
opor
tion o
f ch
ildre
n age
d 5-
17 ye
ars w
ho
are w
orkin
g (%
)
2011
22
.6
de
crea
sing
Su
rvey
on
Child
ren o
f PS
A
DOLE
DO
LE

Bic
ol R
egio
nal S
tatis
tical
Dev
elop
men
t Pro
gram
201
8-20
23
85
Numb
er of
de
aths d
ue to
dis
aster
s (n
atura
l and
hu
man-
induc
ed)
2016
9
0 0
0 0
0 0
0 RD
RRMC
re
ports
OC
D 5
OCD
5 As
sump
tion:
1. LD
RRMC
s/LGU
s are
ca
pacit
ated f
or bo
th na
tural
and h
uman
-ind
uced
disa
sters
2. Ea
rly w
arnin
g sy
stems
rega
rding
an
incom
ing di
saste
r are
pr
ovide
d
Numb
er of
mi
ssing
perso
ns
due t
o disa
sters
(n
atura
l and
hu
man-
induc
ed)
2016
0
0 0
0 0
0 0
0 RD
RRMC
re
ports
OC
D 5
OCD
5
Sub
sect
or O
utpu
ts
Indivi
dual
Risk
s Pe
rcen
tage o
f po
pulat
ion
cove
red b
y Ph
ilHea
lth
insur
ance
(%)
2015
92
≥
93
≥ 95
10
0 10
0 10
0 10
0 10
0 PH
IC
datab
ase
PHIC
5 PH
IC 5
Assu
mptio
n: - C
oord
inatio
n betw
een
local
gove
rnme
nts,
DSW
D, an
d Phil
Healt
h in
prov
iding
cove
rage
Ri
sks:
- Lac
k of lo
cal fu
nding
an
d com
petin
g LGU
pr
ioritie
s - L
ow ut
ilizati
on of
be
nefits
Prop
ortio
n of
poor
senio
r cit
izens
cove
red
by S
ocial
Pe
nsion
(%)3
2015
10
0 10
0 10
0 10
0 10
0 10
0 10
0 10
0 DS
WD
Admi
n da
ta DS
WD;
DI
LG/LG
Us
DSW
D
Numb
er of
Pa
ntawi
d ho
useh
old
bene
ficiar
ies4
2016
37
5,374
37
5,374
37
5,374
37
5,374
37
5,374
37
5,374
37
5,37
4 37
5,374
Pa
ntawi
d Pa
milya
Inf
orma
tion
Syste
m
DSW
D DS
WD

Bic
ol R
egio
nal S
tatis
tical
Dev
elop
men
t Pro
gram
201
8-20
23
86
Econ
omic
Risk
s Nu
mber
of O
FW
memb
ers t
o OW
WA*
2016
T
BD
TBD
incre
asi
ng/su
staine
d
OWW
A Re
port
OWW
A OW
WA
Assu
mptio
n: Nu
mber
of
OWW
A me
mber
s in
2019
will
decre
ase a
s an
after
math
of ec
onom
ic re
cess
ion in
ma
jor co
untry
de
stina
tions
, but
will
even
tually
pick
-up i
n 20
20 an
d gro
w ste
adily
un
til 20
22;
Limite
d pre
senc
e of
OWW
A off
ices i
n pos
ts ov
erse
as (3
2 offic
es);
Risk
s: Pa
ymen
t of
OWW
A me
mber
ship
contr
ibutio
n is n
ot ma
ndato
ry fo
r reh
ires.
Prop
ortio
n of
displa
ced
worke
rs
prov
ided w
ith
assis
tance
2016
10
0 10
0 10
0 10
0 10
0 10
0 10
0 10
0 DO
LE /
OWW
A Re
ports
DOLE
/ OW
WA
DOLE
/ OW
WA
Numb
er of
fam
ilies w
ith
child
labo
rers
pr
ovide
d with
liv
eliho
od
asist
ance
2016
75
0 60
4
decr
easi
ng
Admi
n data
DO
LE
DOLE
Envir
onme
ntal
Risk
s Pe
rcen
tage o
f fam
ilies a
ffecte
d by
natur
al an
d hu
man-
induc
ed
calam
ities
prov
ided w
ith
relie
f ass
istan
ce
(%)
2016
10
0 10
0 10
0 10
0 10
0 10
0 10
0 10
0 DS
WD/
OCD
repo
rts
DSW
D DS
WD

Bic
ol R
egio
nal S
tatis
tical
Dev
elop
men
t Pro
gram
201
8-20
23
87
Perc
entag
e of
familie
s affe
cted
by na
tural
and
huma
n-ind
uced
ca
lamitie
s pr
ovide
d em
erge
ncy
shelt
er
assis
tance
(%)
2016
10
0 10
0 10
0 10
0 10
0 10
0 10
0 10
0 DS
WD/
OCD
repo
rts / L
GU
Calam
ity
Repo
rts
DSW
D DS
WD
Pe
rcen
tage o
f wo
rkers
aff
ected
by
calam
ities
prov
ided w
ith
emer
genc
y em
ploym
ent (
%)
2016
10
0 10
0 10
0 10
0 10
0 10
0 10
0 10
0 DO
LE
Repo
rts
DOLE
DO
LE
Pe
rcen
tage o
f ho
useh
olds
affec
ted by
dis
aster
s pr
ovide
d with
HO
MA
2016
10
.7 NH
A tar
gets
for H
OMA
rely
only
on th
e occ
urre
nce o
f cala
mity
withi
n a sp
ecific
area
inc
reas
ing
NH
A Ho
using
As
sistan
ce
Prod
uctio
n Re
ports
/ OC
D Re
ports
/ L
GU
Calam
ity
Repo
rts
NHA
5 / O
CD 5
/ LGU
s NH
A 5 /
OC
D 5 /
LG
Us
Assu
mptio
ns: T
here
is
year
ly fun
d allo
catio
n for
HOM
A;
Docu
menta
ry
requ
ireme
nts fo
r HOM
A co
mplie
d. Ri
sks:
Circ
umsta
nces
do no
t qu
alify
for H
OMA
imple
menta
tion;
Non-
avail
able
or in
suffic
ient
funds
to ca
ter to
HOM
A re
ques
ts; ch
ange
of
prog
ram
prior
itizati
on;
LGUs
use 5
% ca
lamity
fun
d for
HOM
A
1 Cor
pora
te-wi
de pr
ojecti
ons b
ased
on al
l filed
claim
s for
the s
pecif
ied pe
riod;
the O
OP is
not a
s pr
opor
tion t
o sup
port
value
for a
ll cate
gorie
s; PH
IC us
es O
OP fo
r the
no ba
lance
billin
g ind
icator
as
per G
CG co
mmitm
ent.
2 Mea
sure
d as t
otal n
umbe
r of b
enefi
ciarie
s who
avail
ed ov
er th
e tota
l num
ber o
f ben
eficia
ries.
3 Num
ber o
f poo
r sen
ior ci
tizen
s is b
ased
on th
e List
ahan
an 20
15

Bic
ol R
egio
nal S
tatis
tical
Dev
elop
men
t Pro
gram
201
8-20
23
88
BICO
L RE
GION
REG
IONA
L DE
VELO
PMEN
T PL
AN R
ESUL
TS M
ATRI
CES
2017
-20
22
CHAP
TER
12: B
UILD
ING
SAFE
AND
SEC
URE
COMM
UNIT
IES
Ob
jectiv
es/R
esu
lts
Indi
cato
r Ba
selin
e An
nual
Targ
ets
End-
of P
lan
Targ
et
Mean
s of
Verif
icatio
n Re
spon
sible
Agen
cy
Repo
rting
Ag
ency
As
sum
ptio
ns an
d Ri
sks
Year
Va
lue
2017
20
18
2019
20
20
2021
20
22
Socie
tal G
oal
To la
y dow
n the
foun
datio
n for
inclu
sive g
rowt
h, a h
igh-tr
ust a
nd re
silien
t soc
iety a
nd a
globa
lly-co
mpeti
tive k
nowl
edge
econ
omy
Inte
rmed
iate G
oal
Redu
cing i
nequ
ality
Se
ctor
Out
com
e Sa
fe an
d sec
ure c
ommu
nities
built
Sub-
sect
or O
utco
me
Acce
ss to
aff
orda
ble,
adeq
uate,
safe
and s
ecur
e sh
elter
expa
nded
No. o
f so
cializ
ed
hous
ing
units
* pr
oduc
ed/ta
ken
out (
lot
only)
2016
76
9 64
7 12
73
- -
- -
Pr
ogra
m da
ta NH
A, S
HFC,
HD
MF
HUDC
C As
sump
tions
: 1. S
uitab
le la
nd
for so
cializ
ed ho
using
is
avail
able;
2. F
rontl
ine se
rvice
s ar
e stre
amlin
ed; 3
. Insta
llatio
n of
basic
serv
ices/u
tilitie
s (i.e
. wate
r &
powe
r sup
ply) a
re on
time
No. o
f so
cializ
ed
hous
ing
units
* pr
oduc
ed/ta
ken
out
(hou
se on
ly)
2016
2
158
6,2
54
8,1
04
6,2
19
4,2
97
3,5
45
Pr
ogra
m da
ta NH
A, S
HFC,
HD
MF
HUDC
C
No. o
f so
cializ
ed
hous
ing un
its
prod
uced
/tak
en ou
t
2016
13
2
82
2
5,142
13,83 9
8,6
85
6,5
66
5,1
92
Pr
ogra
m da
ta NH
A, S
HFC,
HD
MF
HUDC
C R
isks:
1. Bu
dgeta
ry co
nstra
ints;
2. Na
tural
and m
an-m
ade
disas
ters

Bic
ol R
egio
nal S
tatis
tical
Dev
elop
men
t Pro
gram
201
8-20
23
89
(hou
se an
d lot
pack
age)
*
No. o
f fam
ilies l
iving
in su
bstan
dard
dw
elling
units
TBD
TBD
HUDC
C PS
A
* Tar
gets
set w
ere p
rovid
ed by
HUD
CC in
cons
ultati
on w
ith ho
using
agen
cies;
these
will
be re
vised
in th
e mi
dterm
upda
te

Bic
ol R
egio
nal S
tatis
tical
Dev
elop
men
t Pro
gram
201
8-20
23
90
BICO
L RE
GION
REG
IONA
L DE
VELO
PMEN
T PL
AN R
ESUL
TS M
ATRI
CES
2017
-202
2
CH
APTE
R 13
: REA
CHIN
G FO
R TH
E DE
MOGR
APHI
C DI
VIDE
ND
Objec
tives
/Res
ults
In
dica
tor
Base
line
Annu
al Ta
rget
s En
d-of
Pl
an
Targ
et
Mean
s of
Verif
icatio
n Re
spon
sible
Agen
cy
Repo
rting
Ag
ency
As
sum
ptio
ns an
d Ri
sks
Year
Va
lue
2017
20
18
2019
20
20
2021
20
22
Socie
tal G
oal
To la
y dow
n the
foun
datio
n for
inclu
sive g
rowt
h, a h
igh-tr
ust a
nd re
silien
t soc
iety a
nd a
globa
lly-co
mpeti
tive k
nowl
edge
econ
omy
Inte
rmed
iate G
oal
Incre
asing
grow
th po
tentia
l Se
ctor
Out
com
e:
Gains
from
de
mogr
aphic
div
idend
max
imize
d
Total
fertil
ity ra
te 20
13
4.1
2.1
NDHS
DO
H/
POPC
OM
PSA
Assu
mptio
ns:
-Fam
ilies p
racti
ce he
althy
life
style
-LGU
s sus
tain c
ommi
tmen
t an
d stre
ngthe
n cap
acitie
s to
deliv
er ba
sic se
rvice
s an
d sup
plies
-C
ountr
y con
tinue
s to
impr
ove e
cono
mic
perfo
rman
ce
-Stak
ehold
ers c
oope
rate
-A
supp
ortiv
e poli
cy
envir
onme
nt in
legisl
ature
an
d jud
iciar
y is i
n plac
e Ri
sks:
-C
hang
es in
politi
cal
leade
rship
-Com
petin
g prio
rities
of
LGUs
Numb
er of
liveb
irths o
f yo
ung m
other
s und
er
15
2014
72
De
creas
ing
CRVS
(PSA
) DO
H,
PopC
om,
prov
inces
PSA
Numb
er of
liveb
irths o
f yo
ung m
other
s 15-
19
year
s
2014
12
,719
Decre
asing
CR
VS
DOH,
Po
pCom
, pr
ovinc
es
PSA
Prop
ortio
n of w
omen
of
repr
oduc
tive a
ge 15
-49
year
s with
unme
t nee
d for
fami
ly pla
nning
2013
27
.4 22
.5 17
.5 12
.5 7.5
2.5
0
0 ND
HS
DOH
5/ PO
PCOM
5 PS
A
Mode
rn co
ntrac
eptiv
e pr
evale
nce r
ate (%
) 20
13
31.1
48
51
54
57
60
63
63
NDHS
DO
H 5/
POPC
OM 5
PSA

Bic
ol R
egio
nal S
tatis
tical
Dev
elop
men
t Pro
gram
201
8-20
23
91
Mater
nal m
ortal
ity ra
te pe
r 100
,000 l
ivebir
ths
2016
11
2.45
100
90
FH
S, D
OH
admi
n data
, FH
SIS,
Civi
l Re
gistry
and
Vital
St
atisti
cs
(CRV
S)
DOH
PSA
-Occ
urre
nce o
f natu
ral
disas
ters a
nd ar
med
confl
icts
-Rap
id ur
baniz
ation
and
incre
asing
inter
nal
migr
ation
stra
ining
publi
c he
alth a
nd ot
her s
ervic
es
Unde
r 5 m
ortal
ity ra
te pe
r 1,00
0 live
births
* 20
13
33
<13
<13
<13
NDHS
DO
H 5
PSA
Prev
alenc
e of s
tuntin
g am
ong c
hildr
en <
5 (%
) 20
15
40.2
38.7
37.2
35.7
34.2
32.7
31.2
31.2
NNS
NNC
5 DO
ST-
FNRI

Bic
ol R
egio
nal S
tatis
tical
Dev
elop
men
t Pro
gram
201
8-20
23
92
BICO
L RE
GION
REG
IONA
L DE
VELO
PMEN
T PL
AN R
ESUL
TS M
ATRI
CES
2017
-202
2
CH
APTE
R 14
: VIG
OROU
SLY
ADVA
NCIN
G SC
IENC
E, T
ECHN
OLOG
Y, A
ND IN
NOVA
TION
Objec
tives
/Res
ults
In
dica
tor
Base
line
Annu
al Ta
rget
s En
d-of
Pl
an
Targ
et
Mean
s of
Verif
icatio
n Re
spon
sible
Agen
cy
Repo
rting
Ag
ency
As
sum
ptio
ns an
d Ri
sks
Year
Va
lue
2017
20
18
2019
20
20
2021
20
22
Socie
tal G
oal
To la
y dow
n the
foun
datio
n for
inclu
sive g
rowt
h, a h
igh-tr
ust a
nd re
silien
t soc
iety a
nd a
globa
lly-co
mpeti
tive k
nowl
edge
econ
omy
Inte
rmed
iate G
oal
Incre
asing
grow
th po
tentia
l Se
ctor
Out
com
e 1
Tech
nolog
y ado
ption
pr
omote
d and
ac
celer
ated
Numb
er of
estab
lishe
d inn
ovati
on hu
bs
2016
1
Incre
asing
DO
ST R
epor
t DO
ST an
d HE
Is DO
ST an
d HE
Is
Sub-
sect
or O
utco
me 1
Ma
instre
amed
STI
in th
e nati
onal
and l
ocal
agen
da
Sub-
sect
or O
utco
me 2
Ac
celer
ated
techn
ology
tran
sfer,
comm
ercia
lizati
on
and u
tiliza
tion
Numb
er of
STI
tra
nferre
d, co
mmer
cializ
ed an
d uti
lized
TB
D
DO
ST
PSA
Sect
or O
utco
me 2
Inn
ovati
on tti
mulat
ed
Sub-
sect
or O
utco
me 1

Bic
ol R
egio
nal S
tatis
tical
Dev
elop
men
t Pro
gram
201
8-20
23
93
Enha
nced
capa
city
for te
chno
logy
gene
ratio
n, ac
quisi
tion a
nd
adop
tion
Publi
c exp
endit
ures
on
R&D
TBD
DB
M Re
port
DBM
DBM
Sub-
sect
or O
utco
me 2
St
reng
thene
d pa
rtner
ship
and
linka
ges
Numb
er of
SET
-UP
bene
ficiar
ies
2016
54
44
48
48
50
50
52
DOST
Rep
ort
DOST
DO
ST

Bic
ol R
egio
nal S
tatis
tical
Dev
elop
men
t Pro
gram
201
8-20
23
94
BICO
L RE
GION
REG
IONA
L DE
VELO
PMEN
T PL
AN R
ESUL
TS M
ATRI
CES
2017
-202
2
CH
APTE
R 15
: SOU
ND M
ACRO
ECON
OMIC
POL
ICY
Objec
tives
/Res
ults
In
dica
tor
Base
line
Annu
al Ta
rget
s En
d-of
Pl
an
Targ
et
Mean
s of
Verif
icati
on
Resp
onsi
ble
Agen
cy
Repo
rting
Ag
ency
As
sum
ptio
ns an
d Ri
sks
Year
Va
lue
2017
20
18
2019
20
20
2021
20
22
Socie
tal G
oal
To la
y dow
n the
foun
datio
n for
inclu
sive g
rowt
h, a h
igh-tr
ust a
nd re
silien
t soc
iety a
nd a
globa
lly-co
mpeti
tive k
nowl
edge
econ
omy
Inte
rmed
iate G
oal
Redu
cing i
nequ
ality
and i
ncre
asing
grow
th po
tentia
l Se
ctor
Out
com
e So
und,
stable
an
d sup
portiv
e ma
croe
cono
mic
envir
onme
nt su
staine
d
GRDP
grow
th ra
te (%
) 20
15
8.9
8.4
9.2
8.7
9.1
9.6
10.3
11.2
Repo
rt on
the
ec
onom
y
PSA
PSA
Gene
rally
good
we
ather
cond
ition
prev
ails t
hrou
gh th
e ye
ars.
AFF
outpu
t gro
wth r
ate
(%)
2015
-2
.3 -2
.3 1.2
1.3
1.4
1.5
1.6
1.6
Ind
ustry
outpu
t gro
wth
rate
(%)
2015
25
.0 23
. 7 18
.0 14
.0 14
.0 15
.0 16
.0 17
Se
rvice
s outp
ut gr
owth
rate
(%)
2015
7.9
7.5
8.0
8.5
9.0
9.0
9.3
10
Su
b-se
ctor
Out
com
e 1
Resp
onsib
le,
strate
gic an
d su
ppor
tive f
iscal
secto
r
LGUs
' ave
rage
IRA
depe
nden
cy
DOF-
BLGF
re
ports
DOF-
BLGF
DO
F-BL
GF
Alba
y 20
14
90
Decre
asing
Leg
azpi
City
2014
63
De
creas
ing
L
igao C
ity
2014
90
De
creas
ing
T
abac
o City
20
14
82
Decre
asing
Cam
arine
s Nor
te 20
14
86
Decre
asing

Bic
ol R
egio
nal S
tatis
tical
Dev
elop
men
t Pro
gram
201
8-20
23
95
Cam
arine
s Sur
20
14
94
Decre
asing
Nag
a City
20
14
51
Decre
asing
Irig
a City
20
14
84
Decre
asing
Cata
ndua
nes
2014
85
De
creas
ing
M
asba
te 20
14
95
Decre
asing
Mas
bate
City
2014
70
De
creas
ing
S
orso
gon
2014
89
De
creas
ing
S
orso
gon C
ity
2014
85
De
creas
ing
Su
b-se
ctor
Out
com
e 2
Resil
ient a
nd
inclus
ive
mone
tary a
nd
finan
cial s
ector
s
Low
and s
table
Inflat
ion
rate
achie
ved
2016
1.1
2.0 0 -
4.0 0
2.00 -
4.0
0 2.0
0 -
4.00
2.00 -
4.0
0 2.0
0 -
4.00*
2.00 -
4.0
0* 2.0
0 -
4.00*
Inflat
ion
Repo
rt BS
P PS
A Mo
netra
y poli
cies a
re
in pla
ce.
Numb
er of
bank
s per
pr
ovinc
e and
city
2016
42
2 Inc
reas
ing
BS
P Re
port
BSP
BSP
Macr
oeco
nomi
c en
virom
ent is
stab
le
Alba
y 20
16
116
Incre
asing
Leg
azpi
City
2016
48
Inc
reas
ing
L
igao C
ity
2016
7
Incre
asing
Tab
aco C
ity
2016
16
Inc
reas
ing
Cam
arine
s Nor
te 20
16
39
Incre
asing
BSP
Repo
rt BS
P BS
P Ma
croe
cono
mic
envir
omen
t is st
able
Cam
arine
s Sur
20
16
160
Incre
asing
Nag
a City
20
16
69
Incre
asing
Irig
a City
20
16
13
Incre
asing
Cata
ndua
nes
2016
15
Inc
reas
ing

Bic
ol R
egio
nal S
tatis
tical
Dev
elop
men
t Pro
gram
201
8-20
23
96
Mas
bate
2016
48
Inc
reas
ing
M
asba
te Ci
ty 20
16
15
Incre
asing
Sor
sogo
n 20
16
44
Incre
asing
Sor
sogo
n City
20
16
23
Incre
asing
Numb
er of
bank
s by t
ype:
BS
P Re
port
BSP
BSP
U
niver
sal/C
omme
rcial
bank
s 20
16
139
Incre
asing
Thr
ift Ba
nks
2016
85
Inc
reas
ing
R
ural
& Co
oper
ative
ba
nks
2016
19
8 Inc
reas
ing
Numb
er of
borro
wers
from
micr
ofina
nce-
orien
ted ba
nks
2016
30
,901
Incre
asing
BSP
Repo
rt BS
P BS
P Fin
ancia
l poli
cies a
re in
pla
ce.
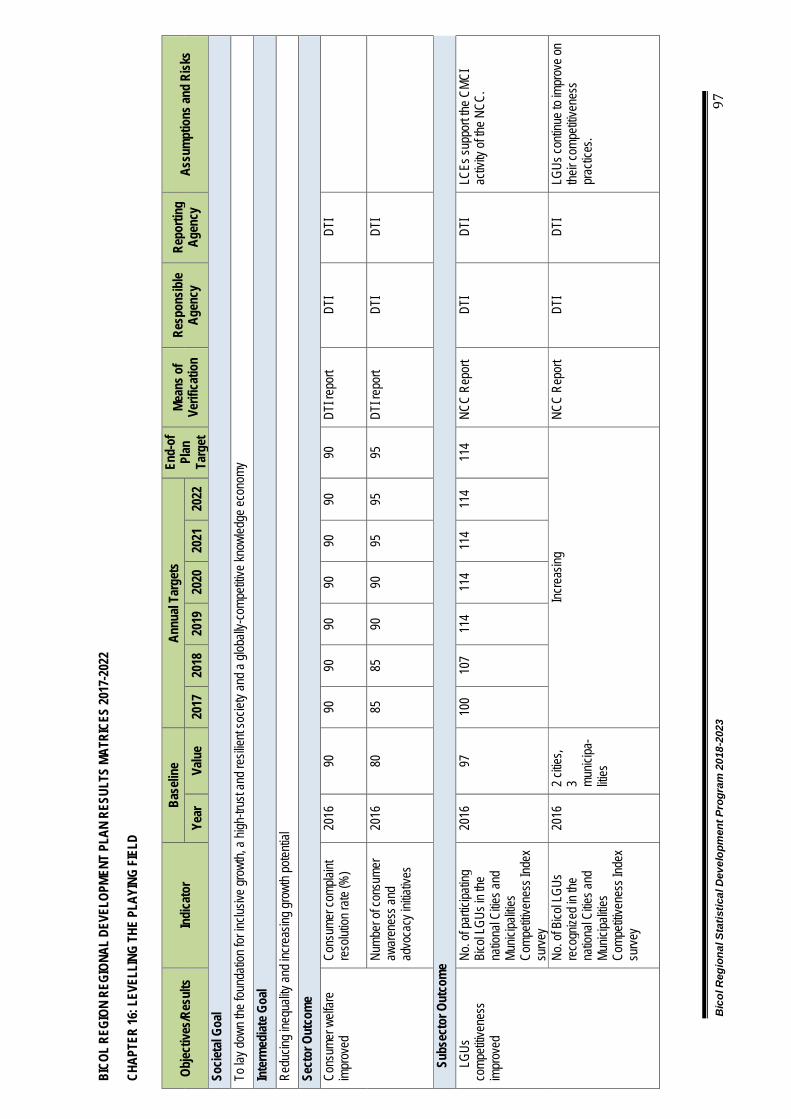
Bic
ol R
egio
nal S
tatis
tical
Dev
elop
men
t Pro
gram
201
8-20
23
97
BICO
L RE
GION
REG
IONA
L DE
VELO
PMEN
T PL
AN R
ESUL
TS M
ATRI
CES
2017
-202
2
CH
APTE
R 16
: LEV
ELLI
NG T
HE P
LAYI
NG F
IELD
Objec
tives
/Res
ults
In
dica
tor
Base
line
Annu
al Ta
rget
s En
d-of
Pl
an
Targ
et
Mean
s of
Verif
icatio
n Re
spon
sible
Agen
cy
Repo
rting
Ag
ency
As
sum
ptio
ns an
d Ri
sks
Year
Va
lue
2017
20
18
2019
20
20
2021
20
22
Socie
tal G
oal
To la
y dow
n the
foun
datio
n for
inclu
sive g
rowt
h, a h
igh-tr
ust a
nd re
silien
t soc
iety a
nd a
globa
lly-co
mpeti
tive k
nowl
edge
econ
omy
Inte
rmed
iate G
oal
Redu
cing i
nequ
ality
and i
ncre
asing
grow
th po
tentia
l Se
ctor
Out
com
e Co
nsum
er w
elfar
e im
prov
ed
Cons
umer
comp
laint
reso
lution
rate
(%)
2016
90
90
90
90
90
90
90
90
DT
I rep
ort
DTI
DTI
Numb
er of
cons
umer
aw
aren
ess a
nd
advo
cacy
initia
tives
2016
80
85
85
90
90
95
95
95
DT
I rep
ort
DTI
DTI
Subs
ecto
r Out
com
e LG
Us
comp
etitiv
enes
s im
prov
ed
No. o
f par
ticipa
ting
Bico
l LGU
s in t
he
natio
nal C
ities a
nd
Munic
ipaliti
es
Comp
etitiv
enes
s Ind
ex
surve
y
2016
97
10
0 10
7 11
4 11
4 11
4 11
4 11
4 NC
C Re
port
DTI
DTI
LCEs
supp
ort th
e CMC
I ac
tivity
of th
e NCC
.
No. o
f Bico
l LGU
s re
cogn
ized i
n the
na
tiona
l Citie
s and
Mu
nicipa
lities
Co
mpeti
tiven
ess I
ndex
su
rvey
2016
2 c
ities,
3 mu
nicipa
-liti
es
Incre
asing
NC
C Re
port
DTI
DTI
LGUs
conti
nue t
o imp
rove
on
their c
ompe
titive
ness
pr
actic
es.

Bic
ol R
egio
nal S
tatis
tical
Dev
elop
men
t Pro
gram
201
8-20
23
98
BICO
L RE
GION
REG
IONA
L DE
VELO
PMEN
T PL
AN R
ESUL
TS M
ATRI
CES
2017
-202
2
CH
APTE
R 17
: ATT
AINI
NG JU
ST A
ND L
ASTI
NG P
EACE
Objec
tives
/Res
ults
In
dica
tor
Base
line
Annu
al Ta
rget
s En
d-of
Pl
an
Targ
et
Mean
s of
Verif
icatio
n Re
spon
sible
Agen
cy
Repo
rting
Ag
ency
As
sum
ptio
ns an
d Ri
sks
Year
Va
lue
2017
20
18
2019
20
20
2021
20
22
Socie
tal G
oal
To la
y dow
n the
foun
datio
n for
inclu
sive g
rowt
h, a h
igh-tr
ust a
nd re
silien
t soc
iety a
nd a
globa
lly-co
mpeti
tive k
nowl
edge
econ
omy
Inte
rmed
iate G
oal
Enha
ncing
the s
ocial
fabr
ic, re
ducin
g ine
quali
ty, an
d inc
reas
ing gr
owth
poten
tial
Sect
or O
utco
me
Just
and l
astin
g pea
ce at
taine
d Su
b-se
ctor
Out
com
e 1
Peac
e agr
eeme
nt wi
th all
inter
nal
arme
d con
flict
grou
ps su
cces
sfully
ne
gotia
teed a
nd
imple
mente
d
Sub-
sect
or O
utco
me 2
Co
mmun
ities i
n con
flict-a
ffecte
d and
confl
ict-v
ulner
able
area
s pro
tected
and d
evelo
ped
Arme
d con
flicts
are a
ddre
ssed
and
comm
unity
vu
lnera
bilitie
s are
re
duce
d
No. o
f con
flict-
affec
ted ba
rang
ays
2016
68
De
creas
ing
Decre
asing
PA
repo
rts
PA, L
GUs
PA

Bic
ol R
egio
nal S
tatis
tical
Dev
elop
men
t Pro
gram
201
8-20
23
99
Comm
unitie
s are
em
powe
red,
prote
cted a
nd
deve
loped
No. o
f rem
aining
LG
Us de
clare
d as
confl
ict m
anag
eable
an
d rea
dy fo
r dur
ther
deve
lopme
nt (C
MRFD
)
2016
2
2 0
0 0
0 0
0 PA
repo
rts,
SP
reso
lution
PA, L
GUs
PA
Regio
nal d
evelo
pmen
t ad
voca
cies a
re pr
ovide
d
No. o
f con
flict-p
rone
ba
rang
ays w
ith
peac
e-pr
omoti
ng
socio
econ
omic
inter
venti
ons (
i.e.,
PAMA
NA)
2016
29
41
24
20
22
21
19
19
DI
LG,
OPAP
P re
ports
OPAP
P AF
P De
pend
s on t
he vu
lnera
bilty
of the
recip
ient/g
radu
ated b
rgys

Bic
ol R
egio
nal S
tatis
tical
Dev
elop
men
t Pro
gram
201
8-20
23
100
BI
COL
REGI
ON R
EGIO
NAL
DEVE
LOPM
ENT
PLAN
RES
ULTS
MAT
RICE
S 20
17-2
022
CHA
PTER
18:
ENSU
RING
SEC
URIT
Y, P
UBLI
C OR
DER
AND
SAFE
TY
Objec
tives
/Res
ults
In
dica
tor
Base
line
Annu
al Ta
rget
s En
d-of
Pl
an
Targ
et
Mean
s of
Verif
icatio
n Re
spon
sible
Agen
cy
Repo
rting
Ag
ency
As
sum
ptio
ns an
d Ri
sks
Year
Va
lue
2017
20
18
2019
20
20
2021
20
22
Socie
tal G
oal
To la
y dow
n the
foun
datio
n for
inclu
sive g
rowt
h, a h
igh-tr
ust a
nd re
silien
t soc
iety a
nd a
globa
lly-co
mpeti
tive k
nowl
edge
econ
omy
Inte
rmed
iate G
oal
Enha
ncing
the s
ocial
fabr
ic, re
ducin
g ine
quali
ty, an
d inc
reas
ing gr
owth
poten
tial
Sect
or O
utco
me
Secu
rity, p
ublic
orde
r and
safet
y ens
ured
Su
b-se
ctor
Out
com
e 1
Publi
c ord
er an
d sa
fety e
nsur
ed
Crim
e Volu
me
2016
38
,042
3766
2 37
097
3644
7 35
719
3491
5 34
042
3404
2 PN
P re
ports
PN
P PN
P St
rict e
nforc
emen
t of th
e ru
les of
law.
Fu
ll coo
pera
tion o
f the
LGUs
and c
ommu
nity.
Index
Crim
e Vo
lume
2016
9,6
14
9133
86
77
8243
78
31
7439
70
67
7067
PN
P cr
ime
statis
tics
PNP
PNP
Aver
age m
onthl
y cr
ime r
ate pe
r 10
0,000
popu
lation
2016
52
.24
Decre
asing
PN
P re
ports
PN
P PN
P
Polic
e-to
popu
lation
ra
tio
2016
1:7
80
1:750
1:7
30
1:600
1:5
80
1:540
1:5
00
1:500
PN
P re
ports
PN
P PN
P
Jail p
erso
nnel-
to-inm
ate ra
tio
2016
1:9
1:9
1:7
1:7
1:7
1:7
1:7
1:7
BJ
MP re
port
BJMP
BJ
MP
Pe
rcen
tage o
f LG
Us w
ith fir
e sta
tions
(%)
2016
85
88
90
93
96
98
99
10
0 BF
P re
ports
BF
P BF
P Fu
ll sup
port
of the
LGUs
.
Sub-
sect
or O
utco
me 2
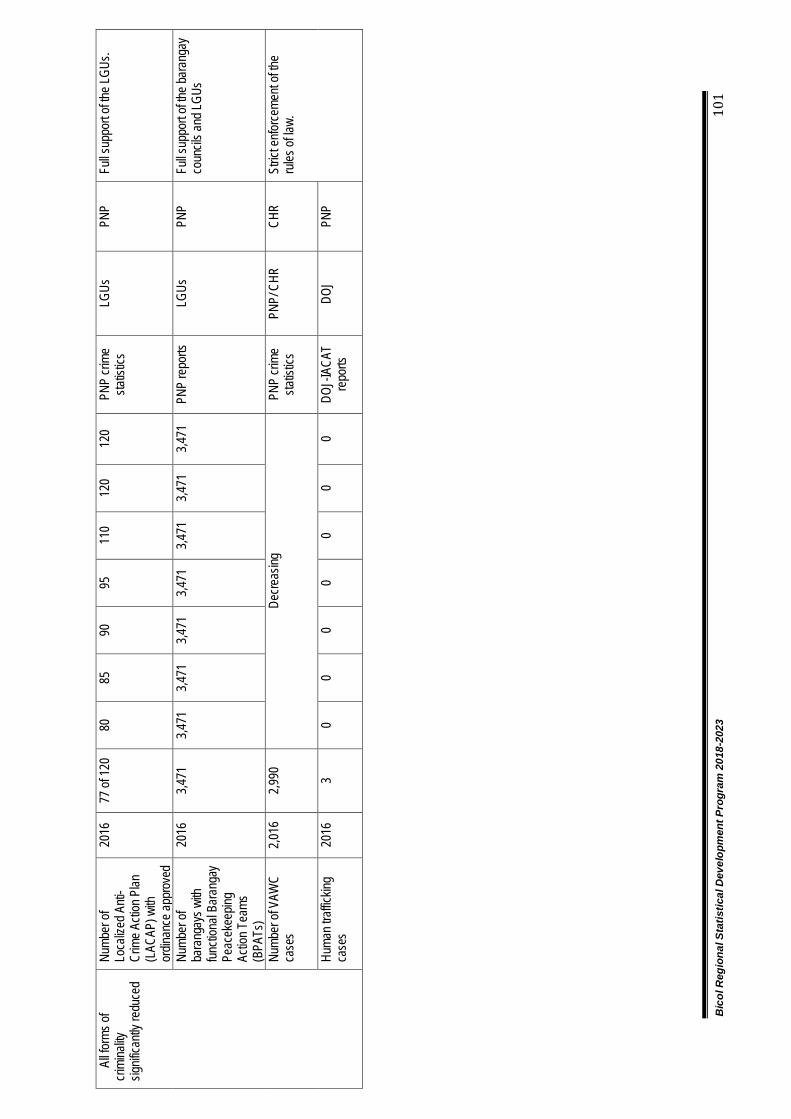
Bic
ol R
egio
nal S
tatis
tical
Dev
elop
men
t Pro
gram
201
8-20
23
101
All fo
rms o
f cr
imina
lity
signif
icantl
y red
uced
Numb
er of
Lo
caliz
ed A
nti-
Crim
e Acti
on P
lan
(LAC
AP) w
ith
ordin
ance
appr
oved
2016
77
of 12
0 80
85
90
95
11
0 12
0 12
0 PN
P cr
ime
statis
tics
LGUs
PN
P Fu
ll sup
port
of the
LGUs
.
Numb
er of
ba
rang
ays w
ith
functi
onal
Bara
ngay
Pe
acek
eepin
g Ac
tion T
eams
(B
PATs
)
2016
3,4
71
3,471
3,4
71
3,471
3,4
71
3,471
3,4
71
3,471
PN
P re
ports
LG
Us
PNP
Full s
uppo
rt of
the ba
rang
ay
coun
cils a
nd LG
Us
Numb
er of
VAW
C ca
ses
2,016
2,9
90
Decre
asing
PN
P cr
ime
statis
tics
PNP/
CHR
CH
R St
rict e
nforc
emen
t of th
e ru
les of
law.
Huma
n tra
ffickin
g ca
ses
2016
3
0 0
0 0
0 0
0 DO
J-IA
CAT
repo
rts
DOJ
PNP

Bic
ol R
egio
nal S
tatis
tical
Dev
elop
men
t Pro
gram
201
8-20
23
102
BI
COL
REG
ION
REG
IONA
L DE
VELO
PMEN
T PL
AN R
ESUL
TS M
ATRI
CES
2017
-202
2
Year
Valu
e20
1720
1820
1920
2020
2120
22
Sect
or O
utco
me
2016
2247
.88
17.5
07.
0128
.32
28.3
228
.32
28.3
213
7.78
DPW
H Re
port
DPW
HDP
WH
2016
137.
7812
0.28
113.
2784
.95
56.6
328
.31
0.00
0.00
DPW
H Re
port
DPW
HDP
WH
0.00
DPW
H Re
port
DPW
HDP
WH
DPW
H Re
port
DPW
HDP
WH
TBD
DPW
H Re
port
DPW
HDP
WH
TBD
DPW
H Re
port
DPW
HDP
WH
2016
48.3
42.1
64.4
117.
810
4.8
110.
990
.690
.6Ac
tual
surve
ysDA
; DPW
HDA
; DPW
HSu
bjec
t to a
vaila
bility
of
fund
s
2016
TBD
DPW
HPS
A20
16TB
DDP
WH
PSA
2016
70.3
422
.29
50.0
955
.160
.61
66.6
772
.87
327.
63Ac
tual
surve
ysDP
WH
DPW
H
2016
0-
12
12
410
Actu
al su
rveys
DPW
HDP
WH
2016
3.96
89.
1314
.216
15.4
313
.37.
5675
.62
Actu
al su
rveys
DPW
HDP
WH
2016
2225
910
890
--
--
198
Actu
al su
rveys
DPW
HDP
WH
Tota
l roa
d le
ngth
(km
)
Prov
inci
al ro
ad le
ngth
(km
)
Leng
th o
f per
man
ent b
ridge
s al
ong
natio
nal r
oads
, in
linea
r met
er (l
.m.)
New
road
s con
struc
ted
to
clos
e th
e ga
ps in
the
natio
nal
road
net
work
, in la
ne km
Pav
ed
Unp
aved
Unp
aved
Road
s wid
ened
with
co
mpl
eted
feat
ures
to a
t leas
t 4
lane
s alo
ng th
e ke
y co
rrido
rs, in
km
Natio
nal r
oad
dens
ity (k
m/h
a)
Num
ber o
f By
pass
es/D
ivers
ion
Road
an
d in
terc
hang
e pr
ojec
ts co
mpl
eted
alo
ng N
1 an
d pr
imar
y cor
ridor
s with
co
mpl
eted
feat
ures
to a
t leas
t 4
lane
s
Obj
ectiv
es/R
esul
tsIn
dica
tor
End-
of-P
lan
Targ
etM
eans
of
Verif
icat
ion
Resp
onsi
ble
Agen
cyRe
porti
ng
Entit
yAs
sum
ptio
ns a
nd R
isk
Soci
etal
Goa
lTo
lay d
own
the
foun
datio
n fo
r inc
lusiv
e gr
owth
, a h
igh-
trust
and
resil
ient
soci
ety a
nd a
glo
bally
-com
petiti
ve kn
owle
dge
econ
omy
Inte
rmed
iate
Goa
l
CHAP
TER
19: A
CCEL
ERAT
ING
INFR
ASTR
UCTU
RE D
EVEL
OPM
ENT
Mod
ern,
seam
less
and
ef
ficie
nt tr
ansp
orta
tion
Safe
, effic
ient
, rel
iabl
e, c
ost-e
ffect
ive a
nd su
stain
able
infra
struc
ture
faci
lities
and
servi
ces a
re u
sed
by th
e po
pula
tion
Enha
ncin
g th
e so
cial
fabr
ic, r
educ
ing
ineq
uality
, and
incr
easin
g gr
owth
pot
entia
l
Subs
ecto
r Out
com
e 1
Tran
spor
t Inf
rast
ruct
ure
Road
Tra
nspo
rt
Farm
-to-m
arke
t roa
ds
open
ed/ im
prov
ed/
reha
bilita
ted,
in km
Pav
ed
Tota
l roa
d de
nsity
(km
/ha)
Leng
th o
f nat
iona
l roa
d (k
m)
Base
line
Annu
al P
lan
Targ
ets

Bic
ol R
egio
nal S
tatis
tical
Dev
elop
men
t Pro
gram
201
8-20
23
103
--
113
--
--
-
2016
34
22
33
317
Actua
l sur
veys
DPW
HDP
WH
2016
216.3
21,7
01.32
3,154
.64
3,7
11.64
3,711
.64
3,7
11.64
3,711
.64
3,7
11.64
Actua
l sur
veys
DPW
HDP
WH
2016
2159
748
,188.0
0
72,80
4.00
89
,425.0
0
102,1
68.00
30
0.00
-
312,8
85.00
Ba
sed f
rom
An
nual
GAA
DPW
HDP
WH
2016
211.4
6
14
4.82
10
4.57
13
4.61
12
0.00
12
2.13
-
626.1
3
DPW
HDP
WH
2017
33.13
-
14
.05
--
--
-DP
WH
Mon
itorin
g Re
port
DPW
HDP
WH
2017
30.73
49.52
11
4.18
-
--
--
DPW
H M
onito
ring
Repo
rt
DPW
HDP
WH
2017
-
-
24.58
14
.83
12.14
51
.55
DPW
HDP
WH
2015
13,84
9
14
,680
15
,268
15
,878
16
,672
17
,339
17
,859
17
,859
CA
AP R
epor
tCA
APCA
AP
2015
18.37
19.29
20
.06
20.66
21
.49
22.35
22
.79
22.79
CA
AP R
epor
tCA
APCA
AP
2015
745
79
8
83
0
86
3
90
6
94
2
97
0
97
0
CA
AP R
epor
tCA
APCA
AP
2015
1
1
2
2
2
2
2
2
CA
AP R
epor
tCA
APCA
AP
Linea
l mete
rs of
slope
pr
otecti
on co
mple
ted an
d co
mpli
ant w
ith th
e late
st DP
WH
stand
ards
and
spec
ificati
ons a
long t
he
prim
ary r
oads
To S
eapo
rts
Air ca
rgo t
raffic
, (dom
estic
), in
metr
ic ton
s (M
T)
Num
ber o
f nigh
t-rate
d air
ports
, in nu
mbe
r of a
irpor
ts
(
)
Air pa
ssen
ger tr
affic
(dom
estic
), in n
umbe
r of
pass
enge
rs
Linea
l mete
rs of
slope
pr
otecti
on co
mple
ted an
d co
mpli
ant w
ith th
e late
st DP
WH
stand
ards
and
spec
ificati
ons a
long t
he
seco
ndar
y and
tertia
ry ro
ads
To D
eclar
ed T
ouris
m
T
o Ec
ozon
es/In
dustr
y
To A
irpor
ts
Num
ber o
f roun
d-trip
fligh
ts (d
omes
tic)
Acce
ss R
oads
Pav
ed (k
m)
Air T
rans
port
Num
ber o
f brid
ges a
long
prim
ary r
oads
mad
e res
ilient
Num
ber o
f New
cons
tructe
d pe
rman
ent b
ridge
s alon
g na
tiona
l road
s

Bic
ol R
egio
nal S
tatis
tical
Dev
elop
men
t Pro
gram
201
8-20
23
104
2016
27,8
8983
786
288
891
494
197
097
0PP
A Re
port
PPA
PPA
2016
5,36
9,94
416
1,09
916
5,93
017
0,90
917
6,03
818
1,31
718
6,75
718
6,75
7PP
A Re
port
PPA
PPA
2016
2,76
8,19
2.57
83,0
45.7
885
,537
.15
88,1
03.2
790
,746
.35
93,4
68.7
696
,272
.82
96,2
72.8
2PP
A Re
port
PPA
PPA
2016
457,
111
13,7
1414
,124
14,5
4814
,985
15,4
3515
,898
15,8
98PP
A Re
port
PPA
PPA
2016
32.7
132
.95
33.6
034
.67
36.2
337
.97
39.9
739
.97
DILG
, LW
UA
Repo
rtDI
LG, W
ater
di
stric
ts,
LWUA
, BI
WAD
A
PSA
20.8
4
21
.91
22
.69
24
.70
27
.59
29
.05
31
.10
31
.10
NIS
2016
150.
92
15
4.73
15
9.99
17
0.08
18
2.26
18
4.21
18
5.79
18
5.79
CI
S20
1612
8.39
130.
42
128.
25
131.
50
143.
28
143.
75
154.
33
154.
33
TOTA
L13
5.32
139.
42
142.
70
149.
76
158.
92
161.
93
165.
06
165.
06
NIS
2016
1,69
5.00
11
8.00
78
0.00
50
.00
17
0.00
10
0.00
90
.00
1,3
08.0
0 CY
201
6 Pr
ojec
t St
atus
as o
f Dec
. 20
16
NIA
NIA
CIS
2016
999.
00
1,
074.
00
5,
924.
00
3,
351.
00
1,
606.
00
3,
198.
00
90
9.00
16,0
62.0
0 10
Yea
r Ro
adm
ap C
Y 20
17-2
026
(dat
a us
ed: r
ehab
)
NIA
NIA
TOTA
L2,
694.
00
1,19
2.00
6,70
4.00
3,40
1.00
1,77
6.00
3,29
8.00
999.
00
17
,370
.00
Exist
ing
area
s, in
he
ctar
es (h
a)NI
S20
1617
,290
.28
17,9
34.0
0
18,5
44.0
0
19,7
12.0
0
21,1
23.0
0
21,3
49.0
0
21,5
32.0
0
21,5
32.0
0
O&M
Pe
rform
ance
of
NIS
& CI
S CY
20
16
NIA
NIA
CIS
2016
32,6
45.0
0
34
,586
.00
35
,833
.00
39
,478
.00
44
,995
.00
48
,263
.00
53
,007
.00
53
,007
.00
TO
TAL
49,9
35.2
8
52
,520
.00
54
,377
.00
59
,190
.00
66
,118
.00
69
,612
.00
74
,539
.00
74
,539
.00
Carg
o sh
ippe
d in
crea
sed
(inte
rnat
iona
l and
dom
estic
), in
MT
Num
ber o
f shi
pcal
ls in
crea
sed
Wat
er se
curit
y ens
ured
, life
and
pro
perty
pr
otec
ted
from
flood
s.
Avai
labi
lity o
f fund
s ; ri
ght
of w
ay &
pea
ce a
nd o
rder
pr
oble
ms ;
adv
erse
we
athe
r con
ditio
n
Annu
al P
lan
NIA
NIA
Ratio
of a
ctua
l irrig
ated
are
a an
d ar
ea re
quire
d fo
r ar
gric
ultu
ral d
evel
opm
ent, %
(N
IA A
SSIS
TED)
Vehi
cles
car
ried
by ro
ll on-
roll o
ff (RO
RO) v
esse
ls in
crea
sed
Num
ber o
f pas
seng
ers
trans
porte
d via
sea
incr
ease
d
Wat
er T
rans
port
Crop
ping
inte
nsity
, in
%
Irrig
atio
n Se
rvice
Re
habi
litate
d
Subs
ecto
r Out
com
e 2W
ater
Sup
ply
Irrig
atio
n
% o
f tota
l pop
ulat
ion
with
ac
cess
to sa
fe a
nd p
otab
le
wate
r

Bic
ol R
egio
nal S
tatis
tical
Dev
elop
men
t Pro
gram
201
8-20
23
105
NIS
2016
896.
52
10
4.62
35
.42
-
-
-
-
1
40.0
4 NI
ANI
ACI
S20
162,
045.
40
93.9
4
32.5
9
-
-
-
-
126
.53
10 Y
ear
Road
map
CY
2017
-202
6
NIA
NIA
TOTA
L2,
941.
92
198.
56
68.0
1
-
-
-
-
266
.57
NIS
2016
1
42.0
0
6
10.0
0
1,1
68.0
0
1,4
11.0
0
2
26.0
0
1
83.0
0
88.0
0
3,6
86.0
0 CY
201
6 Pr
ojec
t St
atus
as o
f Dec
. 20
16
NIA
NIA
CIS
2016
93.
00
372
.00
804
.00
1
,350
.00
499
.00
402
.00
1
,207
.00
4
,634
.00
10 Y
ear
Road
map
CY
2017
-202
6 (d
ata
used
: res
tore
)
NIA
NIA
TOTA
L
235
.00
982
.00
1
,972
.00
2
,761
.00
725
.00
585
.00
1
,295
.00
8
,320
.00
NIS
2016
90.
00
-
-
-
-
-
-
-
CY 2
016
Proj
ect
Stat
us a
s of D
ec.
2016
NIA
NIA
CIS
2016
5
05.0
0
8
75.0
0
2,8
41.0
0
4,1
67.0
0
2,7
69.0
0
4,3
42.0
0
1,5
53.0
0
16,5
47.0
0 10
Yea
r Ro
adm
ap C
Y 20
17-2
026
(dat
a us
ed: n
ew)
NIA
NIA
TOTA
L
595
.00
875
.00
2
,841
.00
4
,167
.00
2
,769
.00
4
,342
.00
1
,553
.00
16
,547
.00
NIS
2016
23,2
52.1
9
23
,277
.19
23
,277
.19
23
,277
.19
23
,277
.19
23
,277
.19
23
,277
.19
23
,277
.19
CY
201
6 In
vent
ory o
f Irr
igat
ion
Syste
ms
NIA
NIA
CIS
2016
74,4
06.0
0
77
,332
.00
78
,207
.00
81
,048
.00
85
,215
.00
87
,984
.00
92
,326
.00
92
,326
.00
10
Yea
r Ro
adm
ap C
Y 20
17-2
026
NIA
NIA
TOTA
L97
,658
.19
100,
609.
19
101,
484.
19
104,
325.
19
108,
492.
19
111,
261.
19
115,
603.
19
115,
603.
19
Irrig
atio
n se
rvice
ar
eas r
esto
red,
in
ha New
Servi
ce a
reas
de
velo
ped,
in h
a
Risk
s: Ef
fect
s of c
limat
e ch
ange
; Ava
ilabi
lity o
f fu
nds ;
righ
t of w
ay &
pe
ace
and
orde
r pr
oble
ms ;
adv
erse
we
athe
r con
ditio
n
Cove
rage
are
a of
irr
igat
ion
faci
lities
, in
ha
Cana
ls, in
km
Avai
labi
lity o
f fund
s ; ri
ght
of w
ay &
pea
ce a
nd o
rder
pr
oble
ms ;
adv
erse
we
athe
r con
ditio
n

Bic
ol R
egio
nal S
tatis
tical
Dev
elop
men
t Pro
gram
201
8-20
23
106
2731
4.76
933.9
888
21.18
1040
0.00
1210
0.00
1470
6.00
1246
4.08
5942
5.24
DPW
H Re
port,
LGU
Repo
rtsDP
WH,
LGUs
DPW
H
2017
1310
.0076
0.00
1500
.0020
00.00
3000
.0032
02.00
1046
2.00
DPW
H Re
port,
LGU
Repo
rtsDP
WH,
LGUs
DPW
H
2017
2419
.0089
0.00
1500
.0020
00.00
3000
.0030
00.00
1039
0.00
DPW
H Re
port,
LGU
Repo
rtsDP
WH,
LGUs
DPW
H
2017
5583
.0024
32.00
3000
.0035
00.00
4000
.0037
02.00
1663
4.00
DPW
H Re
port,
LGU
Repo
rtsDP
WH,
LGUs
DPW
H
DPW
H Re
port,
LGU
Repo
rtsDP
WH,
LGUs
DPW
H
2017
1066
6.45
749.9
826
00.57
2200
.0022
00.00
2206
.000.0
099
56.55
DPW
H Re
port,
LGU
Repo
rtsDP
WH,
LGUs
DPW
H
2017
7336
.3118
4.00
2138
.6122
00.00
2400
.0025
00.00
2560
.0811
982.6
9DP
WH
Repo
rt, LG
U Re
ports
DPW
H, LG
UsDP
WH
2017
0.00
156.0
024
0.00
396.0
0DP
WH
Repo
rt, LG
U Re
ports
DPW
H, LG
UsDP
WH
TBD
DPW
H Re
port,
DP
WH,
LGUs
DPW
HTB
DDP
WH
Repo
rt, LG
U Re
ports
DPW
H, LG
UsDP
WH
TBD
DPW
H Re
port,
LGU
Repo
rtsDP
WH,
LGUs
DPW
H
Leng
th of
dikes
, rive
rwall
s, wa
terwa
ys an
d main
s
Quina
le Ri
ver (
Left S
ide =
20,62
3 lm
)
Quina
le Ri
ver (
Libon
, Po
lnagu
i, Oas
and L
igao)
Quina
le Ri
ver (
Righ
t Side
= 19
.319 l
m)
Leng
th of
dikes
, rive
rwall
s, wa
terwa
ys an
d main
s co
nstru
cted/r
ehab
ilitate
d
Floo
d Co
ntro
l
Num
ber F
lood C
ontro
l pr
ojects
cons
tructe
d
Leng
th of
flood
contr
ol str
uctur
es co
nstru
cted
Bas
ud R
iver (
Leng
th =
10,46
2 lm
.)
Num
ber o
f dre
dging
proje
cts
Labo
Rive
r (Le
ngth
= 41
,781 l
m.)
Daet
Rive
r (Le
ngth
= 16
,634 l
m.)
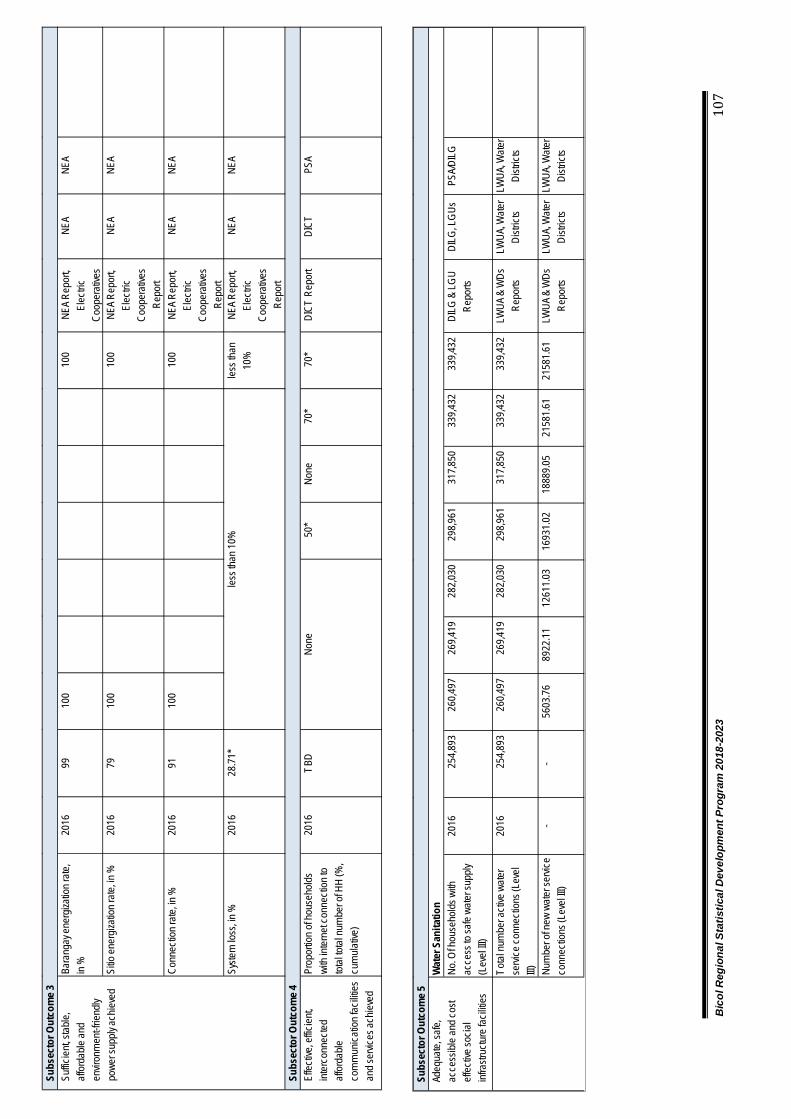
Bic
ol R
egio
nal S
tatis
tical
Dev
elop
men
t Pro
gram
201
8-20
23
107
2016
254,
893
26
0,49
7
26
9,41
9
28
2,03
0
29
8,96
1
31
7,85
0
33
9,43
2
33
9,43
2
DI
LG &
LG
U Re
ports
DILG
, LG
UsPS
A/DI
LG
2016
254,
893
26
0,49
7
26
9,41
9
28
2,03
0
29
8,96
1
31
7,85
0
33
9,43
2
33
9,43
2
LW
UA &
WDs
Re
ports
LWUA
, Wat
er
Distr
icts
LWUA
, Wat
er
Distr
icts
--
5603
.76
8922
.11
1261
1.03
1693
1.02
1888
9.05
2158
1.61
2158
1.61
LWUA
& W
Ds
Repo
rtsLW
UA, W
ater
Di
stric
tsLW
UA, W
ater
Di
stric
ts
No. O
f hou
seho
lds w
ith
acce
ss to
safe
wat
er su
pply
(Lev
el III
) To
tal n
umbe
r act
ive w
ater
se
rvice
con
nect
ions
(Lev
el
III) Num
ber o
f new
wat
er se
rvice
co
nnec
tions
(Lev
el III
)
Adeq
uate
, saf
e,
acce
ssib
le a
nd c
ost
effe
ctive
soci
al
infra
struc
ture
faci
lities
Subs
ecto
r Out
com
e 5
Wat
er S
anita
tion
2016
9910
010
0NE
A Re
port,
El
ectri
c Co
oper
ative
s
NEA
NEA
2016
7910
010
0NE
A Re
port,
El
ectri
c Co
oper
ative
s Re
port
NEA
NEA
2016
9110
010
0NE
A Re
port,
El
ectri
c Co
oper
ative
s Re
port
NEA
NEA
2016
28.7
1*le
ss th
an
10%
NEA
Repo
rt,
Elec
tric
Coop
erat
ives
Repo
rt
NEA
NEA
Effe
ctive
, effic
ient
, in
terc
onne
cted
af
ford
able
co
mm
unic
atio
n fa
ciliti
es
and
servi
ces a
chie
ved
2016
TBD
50*
None
70*
70*
DICT
Rep
ort
DICT
PSA
None
Subs
ecto
r Out
com
e 3
Subs
ecto
r Out
com
e 4Pr
opor
tion
of h
ouse
hold
s wi
th in
tern
et c
onne
ctio
n to
to
tal to
tal n
umbe
r of H
H (%
, cu
mul
ative
)
Bara
ngay
ene
rgiza
tion
rate
, in
%
Sitio
ene
rgiza
tion
rate
, in %
Conn
ectio
n ra
te, in
%
Syste
m lo
ss, in
%
Suffic
ient
, sta
ble,
af
ford
able
and
en
viron
men
t-frie
ndly
powe
r sup
ply a
chie
ved
less
than
10%

Bic
ol R
egio
nal S
tatis
tical
Dev
elop
men
t Pro
gram
201
8-20
23
108
1:25
1:25
1:25
1:25
1:25
1:25
1:25
1:25
DepE
d Re
port
DepE
dDe
pEd
1:53
1:48
1:43
1:38
1:33
1:30
1:30
1:30
DepE
d Re
port
DepE
dDe
pEd
1:32
1:30
1:28
1:26
1:25
1:25
1:25
1:25
DepE
d Re
port
DepE
dDe
pEd
1:47
1:42
1:37
1:35
1:35
1:35
1:35
1:35
DepE
d Re
port
DepE
dDe
pEd
3153
3153
3155
3157
3159
3161
3163
3163
DepE
d Re
port
DepE
dDe
pEd
692
692
702
712
721
731
741
741
DepE
d Re
port
DepE
dDe
pEd
87.4
190
9510
010
010
010
010
0De
pEd
Repo
rtDe
pEd
DepE
d
99.3
910
010
010
010
010
010
010
0De
pEd
Repo
rtDe
pEd
DepE
d
2014
5.94
6.35
6.76
8.13
8.54
8.96
9.37
9.37
DepE
d Re
port
DepE
dDe
pEd
2014
49.9
252
.33
54.2
656
.24
58.2
060
.15
62.1
162
.11
DepE
d Re
port
DepE
dDe
pEd
2014
26.4
828
.62
30.7
632
.89
35.0
337
.17
39.3
139
.31
DepE
d Re
port
DepE
dDe
pEd
2016
1020
3550
8010
010
010
0De
pEd
Repo
rtDe
pEd
DepE
d20
1650
6070
8095
100
100
100
DepE
d Re
port
DepE
dDe
pEd
2016
-10
3050
9010
010
010
0De
pEd
Repo
rtDe
pEd
DepE
d
2016
5075
8090
9910
010
010
0De
pEd
Repo
rtDe
pEd
DepE
d20
1650
6575
8099
100
100
100
DepE
d Re
port
DepE
dDe
pEd
2016
-20
3050
9010
010
010
0De
pEd
Repo
rtDe
pEd
DepE
d
Prim
ary (
Kind
erga
rten
- G
rade
6)
Prim
ary (
Kind
erga
rten
- G
rade
6)
Prim
ary (
K to
6)
Jun
ior H
S S
enio
r HS
Prim
ary (
Kind
erga
rten
- G
rade
6)
JHS
JHS
Perc
enta
ge o
f sch
ools
with
com
pute
r pac
kage
s
Prim
ary K
to 6
Jun
ior H
S
Sen
ior H
S
Prim
ary K
to 6
Jun
ior H
S
Sen
ior H
S
Perc
enta
ge o
f sch
ools
with
libra
rySY 2
017-
2018
Tota
l No.
of S
choo
ls
Perc
enta
ge o
f sch
ools
with
inte
rnet
acc
ess i
ncre
ased
Perc
enta
ge o
f Sch
ools
with
con
nect
ion
to e
lect
ricity
Prim
ary (
Kind
erga
rten
- G
rade
6)
SY 2
013-
2014
Clas
sroo
m to
pup
il rat
io
Educ
atio
nW
ater
and
San
itatio
n (W
atSa
n) F
acilit
y to
pupi
l rat
io (t
oile
ts)
JHS
SY 2
013-
2014
JHS
SY 2
014-
2015
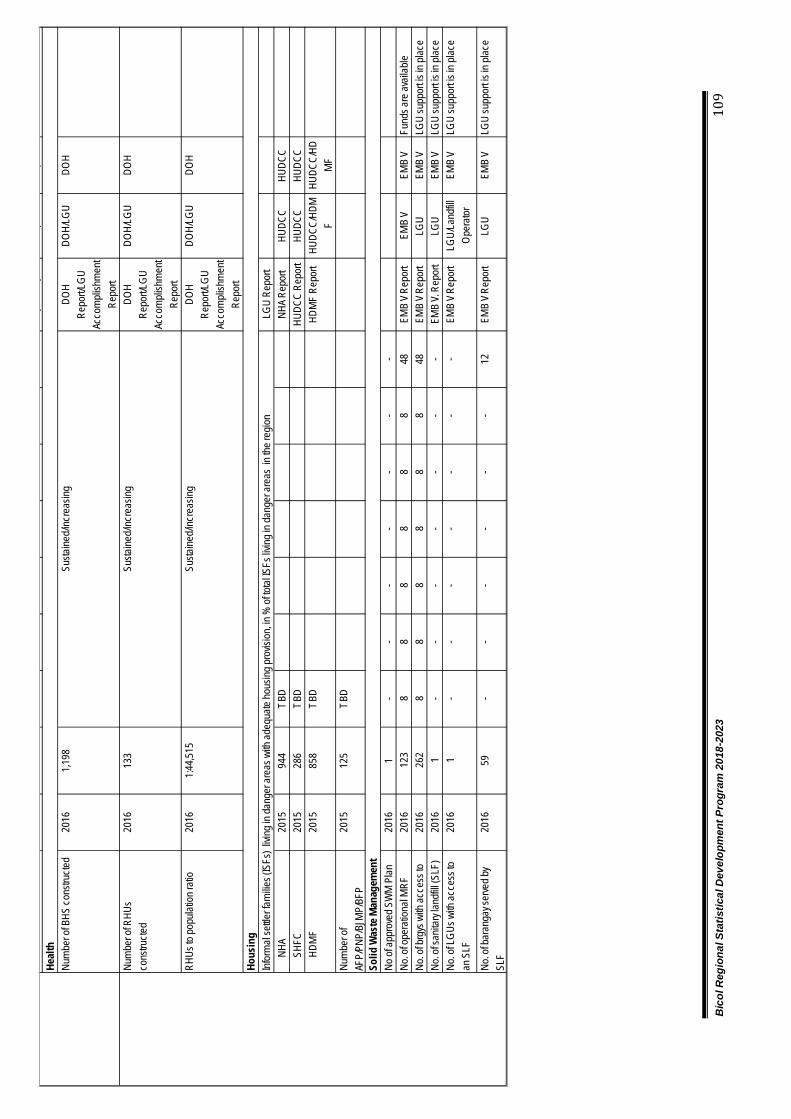
Bic
ol R
egio
nal S
tatis
tical
Dev
elop
men
t Pro
gram
201
8-20
23
109
p
p
pp
2016
1,19
8DO
H Re
port/
LGU
Acco
mpl
ishm
ent
Repo
rt
DOH/
LGU
DOH
2016
133
DOH
Repo
rt/LG
U Ac
com
plish
men
t Re
port
DOH/
LGU
DOH
2016
1:44
,515
DOH
Repo
rt/LG
U Ac
com
plish
men
t Re
port
DOH/
LGU
DOH
LGU
Repo
rt20
1594
4TB
DNH
A Re
port
HUDC
CHU
DCC
2015
286
TBD
HUDC
C Re
port
HUDC
CHU
DCC
2015
858
TBD
HDM
F Re
port
HUDC
C/HD
MF
HUDC
C/HD
MF
2015
125
TBD
2016
1-
--
--
--
2016
123
88
88
88
48EM
B V
Repo
rtEM
B V
EMB
VFu
nds a
re a
vaila
ble
2016
262
88
88
88
48EM
B V
Repo
rtLG
UEM
B V
LGU
supp
ort is
in p
lace
2016
1-
--
--
--
EMB
V. R
epor
tLG
UEM
B V
LGU
supp
ort is
in p
lace
2016
1-
--
--
--
EMB
V Re
port
LGU/
Land
fill
Ope
rato
rEM
B V
LGU
supp
ort is
in p
lace
2016
59-
--
--
-12
EMB
V Re
port
LGU
EMB
VLG
U su
ppor
t is in
pla
ce
Solid
Was
te M
anag
emen
t
Susta
ined
/incr
easin
g
Susta
ined
/incr
easin
g
Susta
ined
/incr
easin
gRH
Us to
pop
ulat
ion
ratio
Heal
th
S
HFC
H
DMF
Num
ber o
f AF
P/PN
P/BJ
MP/
BFP
No o
f app
rove
d SW
M P
lan
No. o
f san
itary
land
fill (S
LF)
N
HA
Num
ber o
f RHU
s co
nstru
cted
No. o
f bar
anga
y ser
ved
by
SLF
No. o
f ope
ratio
nal M
RFNo
. of b
rgys
with
acc
ess t
o
Num
ber o
f BHS
con
struc
ted
No. o
f LG
Us w
ith a
cces
s to
an S
LF
Info
rmal
settle
r fam
ilies (
ISFs
) liv
ing
in d
ange
r are
as w
ith a
dequ
ate
hous
ing
prov
ision
, in %
of to
tal IS
Fs liv
ing
in d
ange
r are
as in
the
regi
onHo
usin
g

Bic
ol R
egio
nal S
tatis
tical
Dev
elop
men
t Pro
gram
201
8-20
23
110
BI
COL
REGI
ON R
EGIO
NAL
DEVE
LOPM
ENT
PLAN
RES
ULTS
MAT
RICE
S 20
17-2
022
CHAP
TER
20:
ENSU
RING
ECO
LOGI
CAL
INTE
GRIT
Y, C
LEAN
AND
HEA
LTH
ENVI
RONM
ENT
Objec
tives
/Res
ults
In
dica
tor
Base
line
Annu
al Ta
rget
s En
d-of
Pl
an
Targ
et
Mean
s of
Verif
icatio
n Re
spon
sible
Agen
cy
Repo
rtin
g Ag
ency
As
sum
ptio
ns an
d Ri
sks
Year
Va
lue
2017
20
18
2019
20
20
2021
20
22
Socie
tal G
oal
To la
y dow
n the
foun
datio
n for
inclu
sive g
rowt
h, a h
igh-tr
ust a
nd re
silien
t soc
iety a
nd a
globa
lly-co
mpeti
tive k
nowl
edge
econ
omy
Inte
rmed
iate G
oal
Enha
ncing
the s
ocial
fabr
ic, re
ducin
g ine
quali
ty, an
d inc
reas
ing gr
owth
poten
tial
Sect
or O
utco
me
Ecolo
gical
integ
rity en
sure
d and
socio
econ
omic
cond
ition o
f com
munit
ies im
prov
ed
Sub-
sect
or O
utco
me 1
Su
staine
d fun
ction
ing of
ecos
ystem
servi
ces (
adop
tion o
f ridg
e-to-
reef
appr
oach
)
Sub-
sect
or O
utpu
ts
Prote
ction
and
susta
inable
ma
nage
ment
of for
est
and w
atersh
ed
impr
oved
Fore
st co
ver (
in he
ctare
s)
20
10
202,4
45
Incre
asing
Inc
reas
e in
fores
t co
ver
Philip
pine
Fore
stry
Stati
stics
DENR
DE
NR
Defor
estat
ion is
co
ntroll
ed.
Open
and d
enud
ed
fores
t are
a re
habil
itated
/ plan
ted
(in he
ctare
s)
2016
13
,545
19,78
4 19
,332
10,00
0 TB
D TB
D TB
D Op
en
and
denu
ded f
ores
t ar
eas
reha
bilit
ated
NGP
Valid
ation
Re
port
DENR
DE
NR
Risk
: Occ
urre
nce o
f ex
treme
wea
ther e
vents
; As
sump
tion:
Fund
s are
re
lease
d on t
ime.
Reha
bilita
ted m
angr
ove
area
(in he
ctare
s) 20
16
75
70
70
70
70
70
70
420
Monit
oring
/ Pr
ogre
ss
repo
rt
BFAR
BF
AR

Bic
ol R
egio
nal S
tatis
tical
Dev
elop
men
t Pro
gram
201
8-20
23
111
Coas
tal an
d ma
rine r
esou
rces
mana
geme
nt im
prov
ed
Perc
entag
e imp
rove
ment
on th
e con
dition
of co
astal
habit
ats w
ithin
NIPA
S-MP
As*/L
MMPA
s** (
%)
Impr
ove
d co
nditio
n of
coas
tal
habit
ats
by at
lea
st 1%
ea
ch
year
Asse
ssme
nt Re
port
DENR
DE
NR
Risk
: Occ
urre
nce o
f ex
treme
wea
ther e
vents
. As
sump
tions
: Coa
stal
Reso
urce
Ass
essm
ent
comp
leted
; Illeg
al ac
tivitie
s and
pollu
tion
are c
ontro
lled
Bung
sang
lay
2016
Co
ral -
19
1 1
1 1
1 1
Sea
gras
s -
33
1 1
1 1
1 1
Mang
rove
- 29
1 1
1 1
1 1
Tacd
unga
n Ree
f 20
16
Cora
l - 26
1
1 1
1 1
1
Sea
gras
s-
58
1 1
1 1
1 1
Mang
rove
- 29
1 1
1 1
1 1
Numb
er of
estab
lishe
d ma
rine p
rotec
ted ar
eas
(MPA
s)/ s
anctu
aries
2016
10
10
10
10
10
10
10
60
Mo
nitor
ing
Repo
rt BF
AR
BFAR
Av
ailab
ility o
f bud
get a
nd
manp
ower
; With
LGU
supp
ort
Resp
onsib
le mi
ning e
nsur
ed
No. o
f Mina
hang
Bay
an
endo
rsed
2016
0
1 1
1 1
1 1
6 En
dors
emen
t me
mo/ le
tter
MGB
Av
ailab
ility o
f bud
get a
nd
manp
ower
; With
LGU
supp
ort
Othe
r indic
ators
Numb
er of
cave
with
ca
ve m
anag
emen
t pla
ns
2016
15
/298
5 5
5 5
5 6
31
Monit
oring
re
port
DENR
, LG
Us
DENR
W
ith LG
U su
ppor
t
Su
b-se
ctor
Out
com
e 2
Impr
oved
envir
onme
ntal q
uality
Su
b-se
ctor
Out
puts
W
ater q
uality
co
nform
ing w
ithin
envir
onme
ntal
Wate
r clas
sifica
tion
stand
ard o
f prio
rity
water
bodie
s
Maint
ained
/ Impr
oved
A
genc
y WQ
Mo
nitor
ing
Repo
rts
EMB
EMB
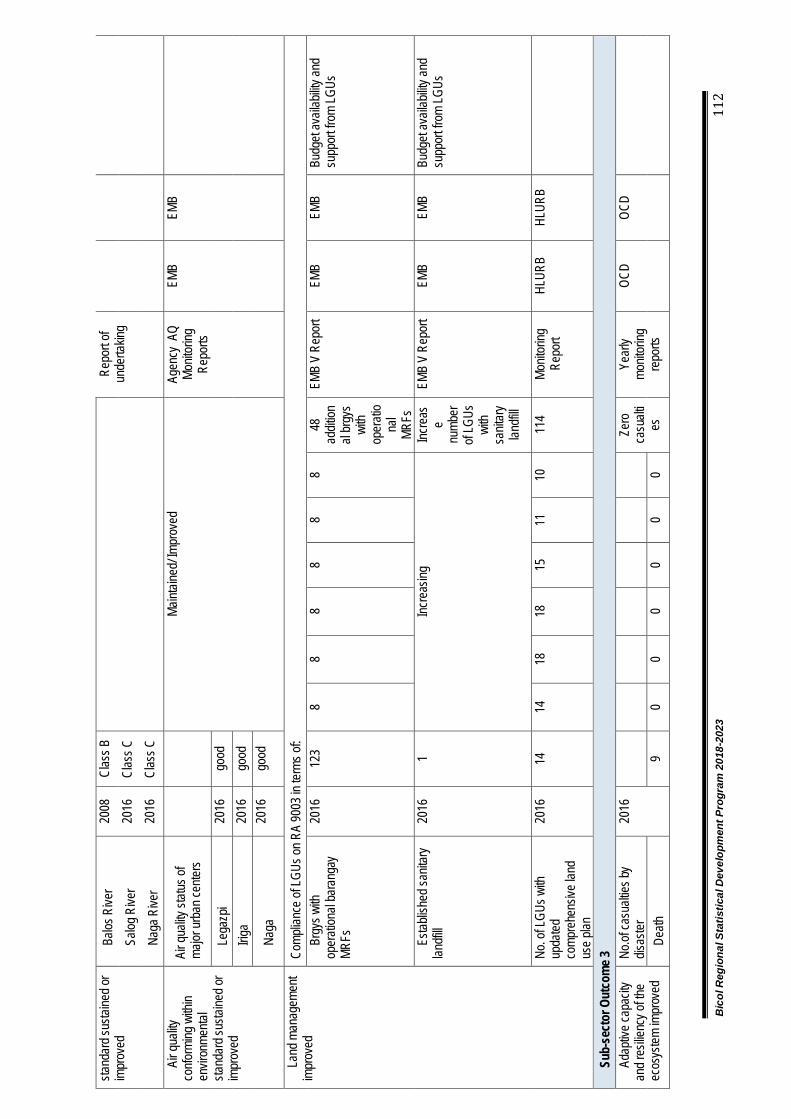
Bic
ol R
egio
nal S
tatis
tical
Dev
elop
men
t Pro
gram
201
8-20
23
112
sta
ndar
d sus
taine
d or
impr
oved
Ba
los R
iver
2008
Cl
ass B
Re
port
of un
derta
king
Sa
log R
iver
2016
Cl
ass C
Naga
Rive
r 20
16
Clas
s C
Air q
uality
co
nform
ing w
ithin
envir
onme
ntal
stand
ard s
ustai
ned o
r im
prov
ed
Air q
uality
statu
s of
major
urba
n cen
ters
Maint
ained
/ Impr
oved
Ag
ency
AQ
Monit
oring
Re
ports
EMB
EMB
Lega
zpi
2016
go
od
Iriga
2016
go
od
Naga
20
16
good
Land
man
agem
ent
impr
oved
Co
mplia
nce o
f LGU
s on R
A 90
03 in
term
s of:
Brgy
s with
op
erati
onal
bara
ngay
MR
Fs
2016
12
3 8
8 8
8 8
8 48
ad
dition
al br
gys
with
oper
atio
nal
MRFs
EMB
V Re
port
EMB
EM
B
Budg
et av
ailab
ility a
nd
supp
ort fr
om LG
Us
Estab
lishe
d san
itary
lan
dfill
2016
1
Incre
asing
Inc
reas
e nu
mber
of
LGUs
wi
th sa
nitar
y lan
dfill
EMB
V Re
port
EMB
EM
B
Budg
et av
ailab
ility a
nd
supp
ort fr
om LG
Us
No. o
f LGU
s with
up
dated
co
mpre
hens
ive la
nd
use p
lan
2016
14
14
18
18
15
11
10
11
4 Mo
nitor
ing
Repo
rt HL
URB
HLUR
B
Sub-
sect
or O
utco
me 3
Ad
aptiv
e cap
acity
an
d res
ilienc
y of th
e ec
osys
tem im
prov
ed
No.of
casu
alties
by
disas
ter
2016
Zero
ca
sualt
ies
Year
ly mo
nitor
ing
repo
rts
OCD
OCD
Death
9
0 0
0 0
0 0

Bic
ol R
egio
nal S
tatis
tical
Dev
elop
men
t Pro
gram
201
8-20
23
113
Injur
ed
337
0 0
0 0
0 0
Miss
ing
0 0
0 0
0 0
0
No. o
f LGU
s with
appr
oved
and u
pdate
d:
Monit
oring
Re
ports
DRR-
CCA
enha
nced
loc
al de
velop
ment
plan
114
DILG
/LGU
DILG
W
ith LG
U su
ppor
t
LDRR
MP
114
DILG
/LGU
DILG
W
ith LG
U su
ppor
t
LCCA
P
11
4 DI
LG/LG
U DI
LG
With
LGU
supp
ort
Fore
st La
nd U
se
Plan
s
2016
16
/98
5 5
18
18
18
18
100%
(9
8/98)
DE
NR
DENR
Bu
dget
avail
abilit
y and
LG
Us su
ppor
t
Pr
ovinc
ial F
ores
hore
Ma
nage
ment
and
Deve
lopme
nt Pl
an
2016
2/
6 2
2 -
- -
- 10
0%
(6/6)
DENR
DE
NR
Budg
et av
ailab
ility a
nd
LGUs
supp
ort
No
. of e
arly
warn
ing
devic
es
oper
ation
alize
d/main
taine
d in t
he re
gion
2016
80
/80
80
80
80
85
85
85
85
Monit
oring
Re
ports
DO
ST
DOST
Coop
erati
on of
the L
GUs
and c
ommu
nities