bicycle or other pedalcycle involved crash summary - mva home
TRANSCRIPT
MARYLAND DEPARTMENT OF TRANSPORTATION August 10, 2020 Maryland Motor Vehicle AdministrationMaryland Highway Safety Office
Bicycle or Other Pedalcycle InvolvedCrash Summary
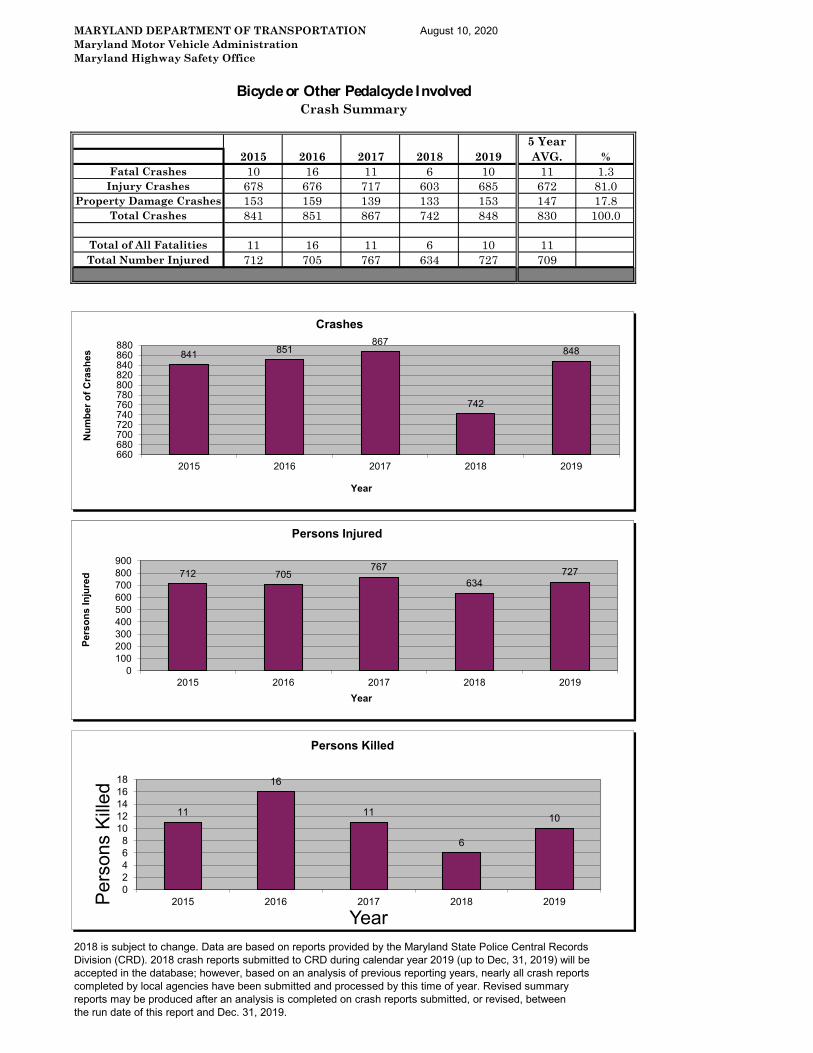
5 Year 2015 2016 2017 2018 2019 AVG. %
Fatal Crashes 10 16 11 6 10 11 1.3Injury Crashes 678 676 717 603 685 672 81.0
Property Damage Crashes 153 159 139 133 153 147 17.8Total Crashes 841 851 867 742 848 830 100.0
Total of All Fatalities 11 16 11 6 10 11Total Number Injured 712 705 767 634 727 709
2018 is subject to change. Data are based on reports provided by the Maryland State Police Central RecordsDivision (CRD). 2018 crash reports submitted to CRD during calendar year 2019 (up to Dec, 31, 2019) will beaccepted in the database; however, based on an analysis of previous reporting years, nearly all crash reportscompleted by local agencies have been submitted and processed by this time of year. Revised summary reports may be produced after an analysis is completed on crash reports submitted, or revised, between the run date of this report and Dec. 31, 2019.
15
43
75
02468
10121416
2014 2015 2016 2017 2018
Num
ber o
f Cra
shes
Year
Crashes
3
2
1
3 3
00.5
11.5
22.5
33.5
2014 2015 2016 2017 2018
Pers
ons
Inju
red
Year
Persons Injured
11
16
11
6
10
02468
1012141618
2015 2016 2017 2018 2019Pers
ons
Kille
d
Year
Persons Killed
841 851867
742
848
660680700720740760780800820840860880
2015 2016 2017 2018 2019
Num
ber o
f Cra
shes
Year
Crashes
712 705767
634727
0100200300400500600700800900
2015 2016 2017 2018 2019
Pers
ons
Inju
red
Year
Persons Injured
MARYLAND DEPARTMENT OF TRANSPORTATION August 10, 2020 Maryland Motor Vehicle AdministrationMaryland Highway Safety Office
Bicycle or Other Pedalcycle InvolvedRoute Type
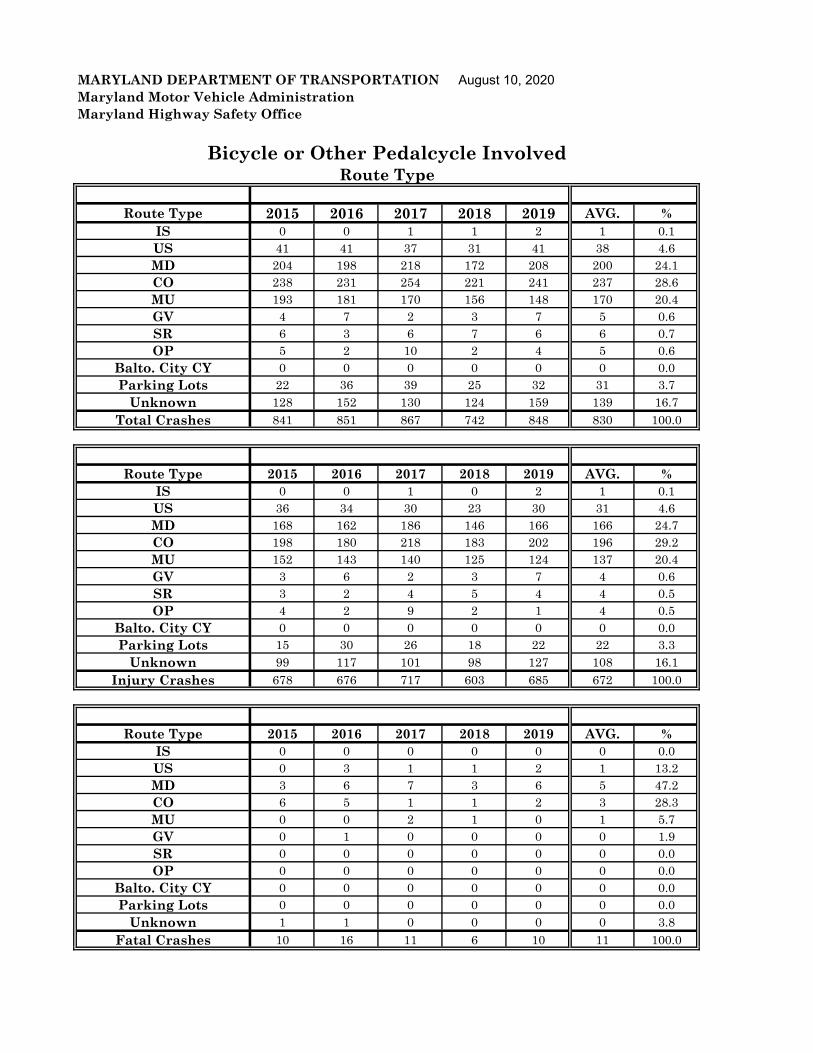
Route Type 2015 2016 2017 2018 2019 AVG. %
IS 0 0 1 1 2 1 0.1US 41 41 37 31 41 38 4.6MD 204 198 218 172 208 200 24.1CO 238 231 254 221 241 237 28.6MU 193 181 170 156 148 170 20.4GV 4 7 2 3 7 5 0.6SR 6 3 6 7 6 6 0.7OP 5 2 10 2 4 5 0.6
Balto. City CY 0 0 0 0 0 0 0.0Parking Lots 22 36 39 25 32 31 3.7
Unknown 128 152 130 124 159 139 16.7Total Crashes 841 851 867 742 848 830 100.0
Route Type 2015 2016 2017 2018 2019 AVG. %
IS 0 0 1 0 2 1 0.1US 36 34 30 23 30 31 4.6MD 168 162 186 146 166 166 24.7CO 198 180 218 183 202 196 29.2MU 152 143 140 125 124 137 20.4GV 3 6 2 3 7 4 0.6SR 3 2 4 5 4 4 0.5OP 4 2 9 2 1 4 0.5
Balto. City CY 0 0 0 0 0 0 0.0Parking Lots 15 30 26 18 22 22 3.3
Unknown 99 117 101 98 127 108 16.1Injury Crashes 678 676 717 603 685 672 100.0
Route Type 2015 2016 2017 2018 2019 AVG. %
IS 0 0 0 0 0 0 0.0US 0 3 1 1 2 1 13.2MD 3 6 7 3 6 5 47.2CO 6 5 1 1 2 3 28.3MU 0 0 2 1 0 1 5.7GV 0 1 0 0 0 0 1.9SR 0 0 0 0 0 0 0.0OP 0 0 0 0 0 0 0.0
Balto. City CY 0 0 0 0 0 0 0.0Parking Lots 0 0 0 0 0 0 0.0
Unknown 1 1 0 0 0 0 3.8Fatal Crashes 10 16 11 6 10 11 100.0
MARYLAND DEPARTMENT OF TRANSPORTATION August 10, 2020 Maryland Motor Vehicle AdministrationMaryland Highway Safety Office
Bicycle or Other Pedalcycle InvolvedCounty
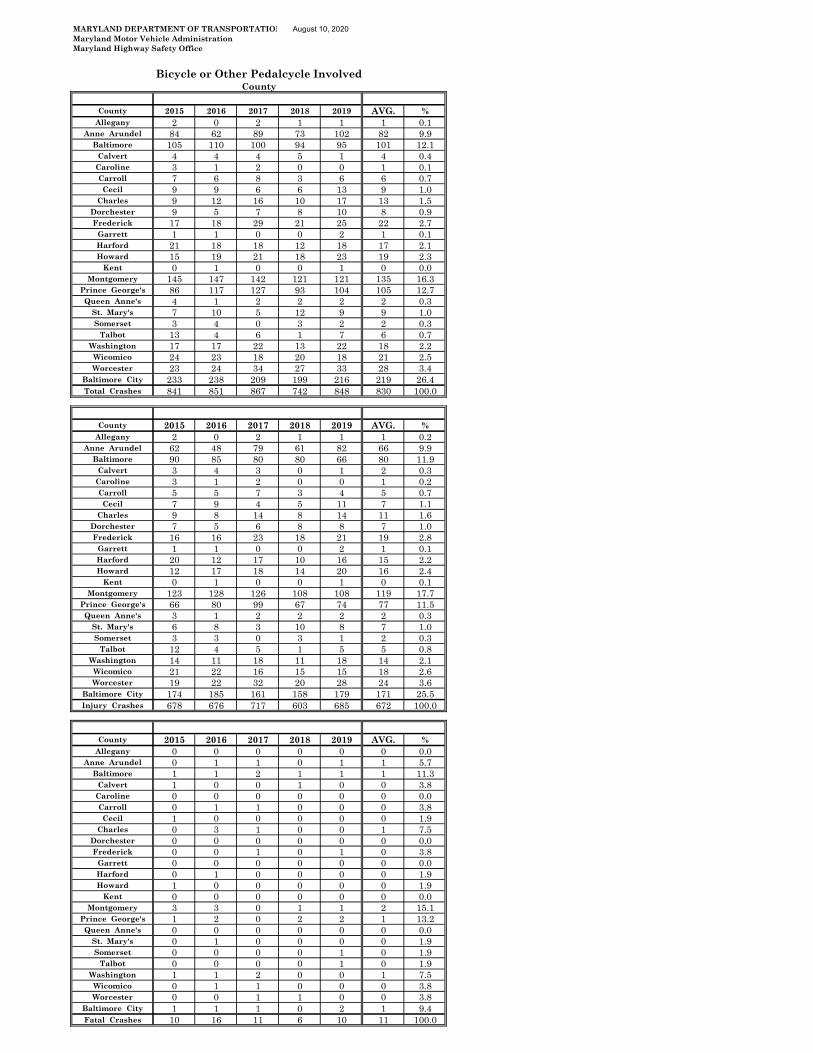
County 2015 2016 2017 2018 2019 AVG. %Allegany 2 0 2 1 1 1 0.1
Anne Arundel 84 62 89 73 102 82 9.9Baltimore 105 110 100 94 95 101 12.1
Calvert 4 4 4 5 1 4 0.4Caroline 3 1 2 0 0 1 0.1Carroll 7 6 8 3 6 6 0.7Cecil 9 9 6 6 13 9 1.0
Charles 9 12 16 10 17 13 1.5Dorchester 9 5 7 8 10 8 0.9Frederick 17 18 29 21 25 22 2.7
Garrett 1 1 0 0 2 1 0.1Harford 21 18 18 12 18 17 2.1Howard 15 19 21 18 23 19 2.3
Kent 0 1 0 0 1 0 0.0Montgomery 145 147 142 121 121 135 16.3
Prince George's 86 117 127 93 104 105 12.7Queen Anne's 4 1 2 2 2 2 0.3
St. Mary's 7 10 5 12 9 9 1.0Somerset 3 4 0 3 2 2 0.3
Talbot 13 4 6 1 7 6 0.7Washington 17 17 22 13 22 18 2.2Wicomico 24 23 18 20 18 21 2.5Worcester 23 24 34 27 33 28 3.4
Baltimore City 233 238 209 199 216 219 26.4Total Crashes 841 851 867 742 848 830 100.0
County 2015 2016 2017 2018 2019 AVG. %Allegany 2 0 2 1 1 1 0.2
Anne Arundel 62 48 79 61 82 66 9.9Baltimore 90 85 80 80 66 80 11.9
Calvert 3 4 3 0 1 2 0.3Caroline 3 1 2 0 0 1 0.2Carroll 5 5 7 3 4 5 0.7Cecil 7 9 4 5 11 7 1.1
Charles 9 8 14 8 14 11 1.6Dorchester 7 5 6 8 8 7 1.0Frederick 16 16 23 18 21 19 2.8
Garrett 1 1 0 0 2 1 0.1Harford 20 12 17 10 16 15 2.2Howard 12 17 18 14 20 16 2.4
Kent 0 1 0 0 1 0 0.1Montgomery 123 128 126 108 108 119 17.7
Prince George's 66 80 99 67 74 77 11.5Queen Anne's 3 1 2 2 2 2 0.3
St. Mary's 6 8 3 10 8 7 1.0Somerset 3 3 0 3 1 2 0.3
Talbot 12 4 5 1 5 5 0.8Washington 14 11 18 11 18 14 2.1Wicomico 21 22 16 15 15 18 2.6Worcester 19 22 32 20 28 24 3.6
Baltimore City 174 185 161 158 179 171 25.5Injury Crashes 678 676 717 603 685 672 100.0
County 2015 2016 2017 2018 2019 AVG. %Allegany 0 0 0 0 0 0 0.0
Anne Arundel 0 1 1 0 1 1 5.7Baltimore 1 1 2 1 1 1 11.3
Calvert 1 0 0 1 0 0 3.8Caroline 0 0 0 0 0 0 0.0Carroll 0 1 1 0 0 0 3.8Cecil 1 0 0 0 0 0 1.9
Charles 0 3 1 0 0 1 7.5Dorchester 0 0 0 0 0 0 0.0Frederick 0 0 1 0 1 0 3.8
Garrett 0 0 0 0 0 0 0.0Harford 0 1 0 0 0 0 1.9Howard 1 0 0 0 0 0 1.9
Kent 0 0 0 0 0 0 0.0Montgomery 3 3 0 1 1 2 15.1
Prince George's 1 2 0 2 2 1 13.2Queen Anne's 0 0 0 0 0 0 0.0
St. Mary's 0 1 0 0 0 0 1.9Somerset 0 0 0 0 1 0 1.9
Talbot 0 0 0 0 1 0 1.9Washington 1 1 2 0 0 1 7.5Wicomico 0 1 1 0 0 0 3.8Worcester 0 0 1 1 0 0 3.8
Baltimore City 1 1 1 0 2 1 9.4Fatal Crashes 10 16 11 6 10 11 100.0
MARYLAND DEPARTMENT OF TRANSPORTATION August 10, 2020 Maryland Motor Vehicle AdministrationMaryland Highway Safety Office
Bicycle or Other Pedalcycle InvolvedMonth
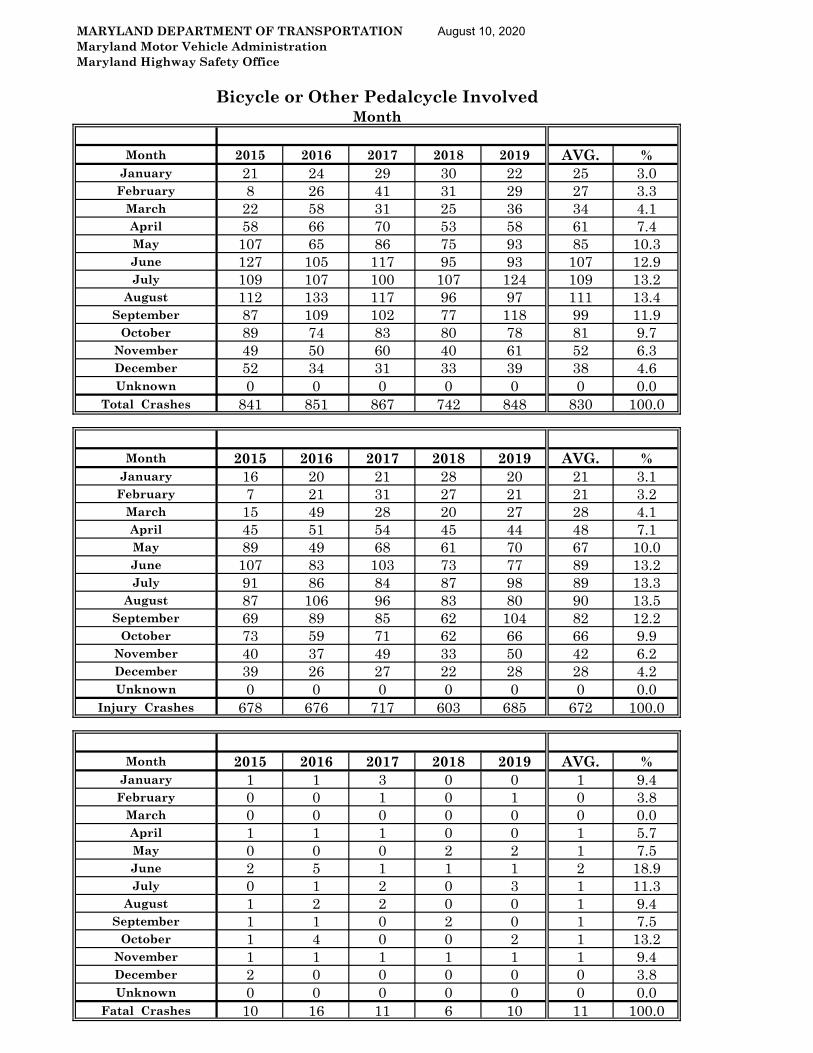
Month 2015 2016 2017 2018 2019 AVG. %January 21 24 29 30 22 25 3.0February 8 26 41 31 29 27 3.3
March 22 58 31 25 36 34 4.1April 58 66 70 53 58 61 7.4May 107 65 86 75 93 85 10.3June 127 105 117 95 93 107 12.9July 109 107 100 107 124 109 13.2
August 112 133 117 96 97 111 13.4September 87 109 102 77 118 99 11.9
October 89 74 83 80 78 81 9.7November 49 50 60 40 61 52 6.3December 52 34 31 33 39 38 4.6Unknown 0 0 0 0 0 0 0.0
Total Crashes 841 851 867 742 848 830 100.0
Month 2015 2016 2017 2018 2019 AVG. %January 16 20 21 28 20 21 3.1February 7 21 31 27 21 21 3.2
March 15 49 28 20 27 28 4.1April 45 51 54 45 44 48 7.1May 89 49 68 61 70 67 10.0June 107 83 103 73 77 89 13.2July 91 86 84 87 98 89 13.3
August 87 106 96 83 80 90 13.5September 69 89 85 62 104 82 12.2
October 73 59 71 62 66 66 9.9November 40 37 49 33 50 42 6.2December 39 26 27 22 28 28 4.2Unknown 0 0 0 0 0 0 0.0
Injury Crashes 678 676 717 603 685 672 100.0
Month 2015 2016 2017 2018 2019 AVG. %January 1 1 3 0 0 1 9.4February 0 0 1 0 1 0 3.8
March 0 0 0 0 0 0 0.0April 1 1 1 0 0 1 5.7May 0 0 0 2 2 1 7.5June 2 5 1 1 1 2 18.9July 0 1 2 0 3 1 11.3
August 1 2 2 0 0 1 9.4September 1 1 0 2 0 1 7.5
October 1 4 0 0 2 1 13.2November 1 1 1 1 1 1 9.4December 2 0 0 0 0 0 3.8Unknown 0 0 0 0 0 0 0.0
Fatal Crashes 10 16 11 6 10 11 100.0
MARYLAND DEPARTMENT OF TRANSPORTATION Maryland Motor Vehicle AdministrationMaryland Highway Safety Office August 10, 2020
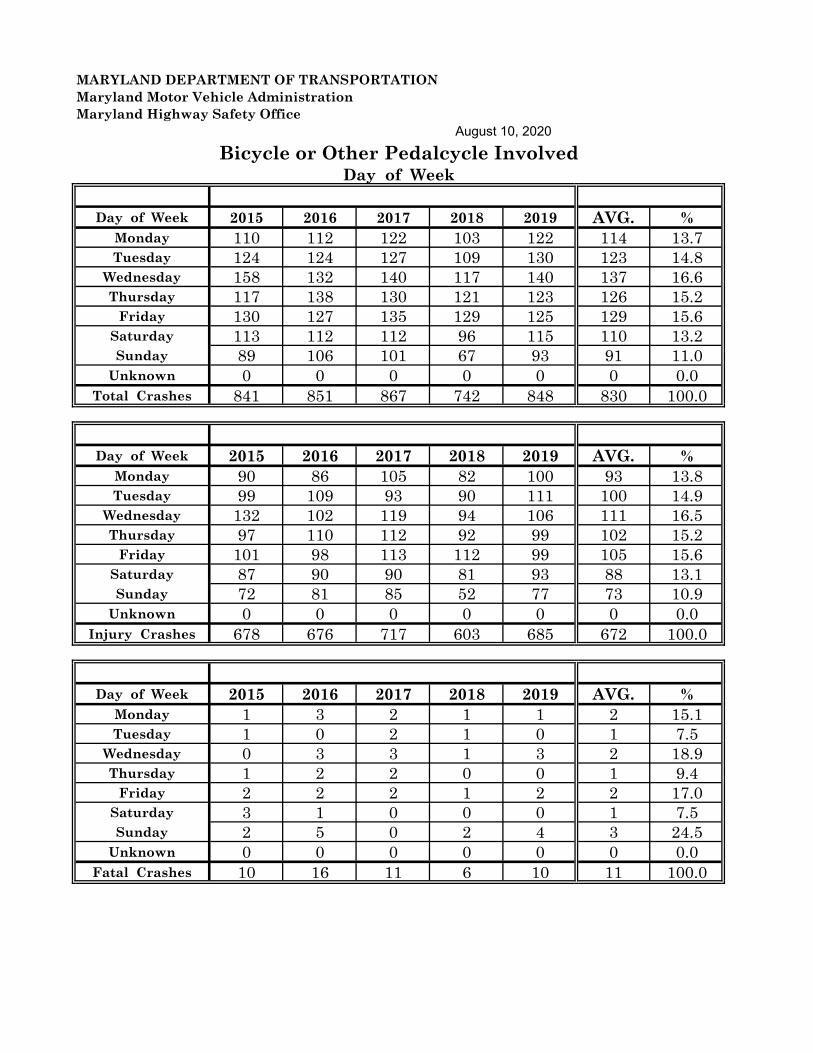
Bicycle or Other Pedalcycle InvolvedDay of Week
Day of Week 2015 2016 2017 2018 2019 AVG. %Monday 110 112 122 103 122 114 13.7Tuesday 124 124 127 109 130 123 14.8
Wednesday 158 132 140 117 140 137 16.6Thursday 117 138 130 121 123 126 15.2
Friday 130 127 135 129 125 129 15.6Saturday 113 112 112 96 115 110 13.2Sunday 89 106 101 67 93 91 11.0
Unknown 0 0 0 0 0 0 0.0Total Crashes 841 851 867 742 848 830 100.0
Day of Week 2015 2016 2017 2018 2019 AVG. %Monday 90 86 105 82 100 93 13.8Tuesday 99 109 93 90 111 100 14.9
Wednesday 132 102 119 94 106 111 16.5Thursday 97 110 112 92 99 102 15.2
Friday 101 98 113 112 99 105 15.6Saturday 87 90 90 81 93 88 13.1Sunday 72 81 85 52 77 73 10.9
Unknown 0 0 0 0 0 0 0.0Injury Crashes 678 676 717 603 685 672 100.0
Day of Week 2015 2016 2017 2018 2019 AVG. %Monday 1 3 2 1 1 2 15.1Tuesday 1 0 2 1 0 1 7.5
Wednesday 0 3 3 1 3 2 18.9Thursday 1 2 2 0 0 1 9.4
Friday 2 2 2 1 2 2 17.0Saturday 3 1 0 0 0 1 7.5Sunday 2 5 0 2 4 3 24.5
Unknown 0 0 0 0 0 0 0.0Fatal Crashes 10 16 11 6 10 11 100.0
MARYLAND DEPARTMENT OF TRANSPORTATI August 10, 2020 Maryland Motor Vehicle AdministrationMaryland Highway Safety Office
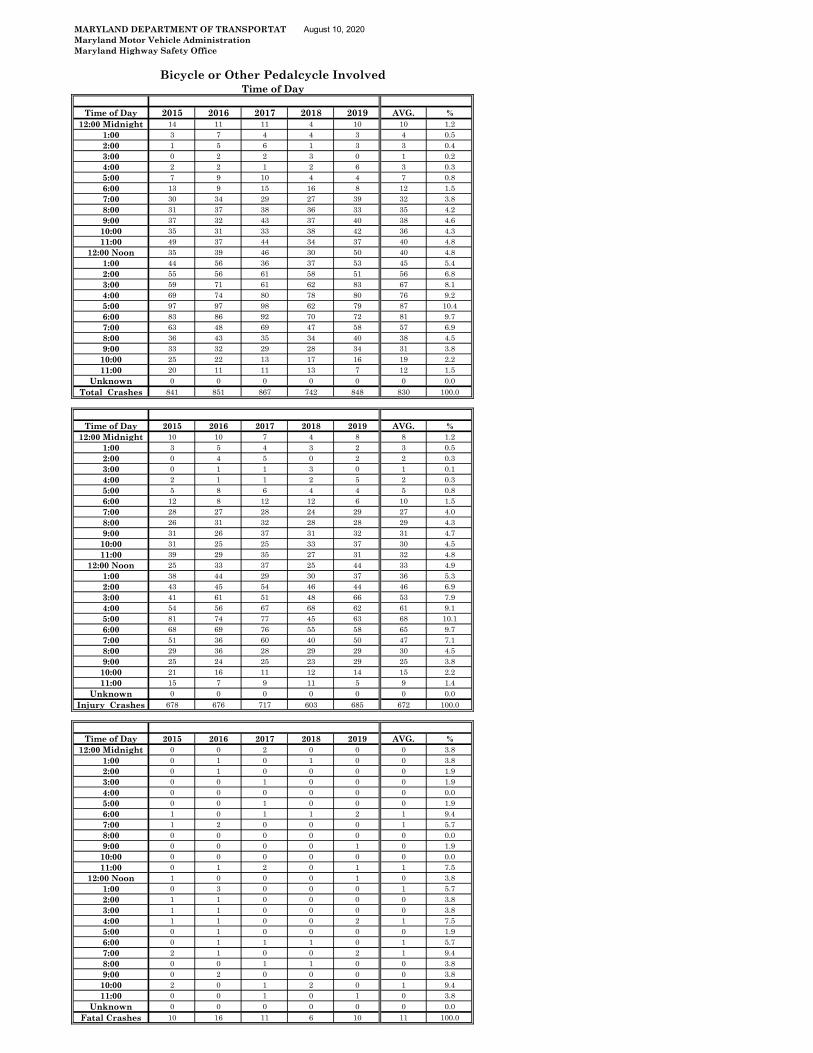
Bicycle or Other Pedalcycle InvolvedTime of Day
Time of Day 2015 2016 2017 2018 2019 AVG. %12:00 Midnight 14 11 11 4 10 10 1.2
1:00 3 7 4 4 3 4 0.52:00 1 5 6 1 3 3 0.43:00 0 2 2 3 0 1 0.24:00 2 2 1 2 6 3 0.35:00 7 9 10 4 4 7 0.86:00 13 9 15 16 8 12 1.57:00 30 34 29 27 39 32 3.88:00 31 37 38 36 33 35 4.29:00 37 32 43 37 40 38 4.610:00 35 31 33 38 42 36 4.311:00 49 37 44 34 37 40 4.8
12:00 Noon 35 39 46 30 50 40 4.81:00 44 56 36 37 53 45 5.42:00 55 56 61 58 51 56 6.83:00 59 71 61 62 83 67 8.14:00 69 74 80 78 80 76 9.25:00 97 97 98 62 79 87 10.46:00 83 86 92 70 72 81 9.77:00 63 48 69 47 58 57 6.98:00 36 43 35 34 40 38 4.59:00 33 32 29 28 34 31 3.810:00 25 22 13 17 16 19 2.211:00 20 11 11 13 7 12 1.5
Unknown 0 0 0 0 0 0 0.0Total Crashes 841 851 867 742 848 830 100.0
Time of Day 2015 2016 2017 2018 2019 AVG. %12:00 Midnight 10 10 7 4 8 8 1.2
1:00 3 5 4 3 2 3 0.52:00 0 4 5 0 2 2 0.33:00 0 1 1 3 0 1 0.14:00 2 1 1 2 5 2 0.35:00 5 8 6 4 4 5 0.86:00 12 8 12 12 6 10 1.57:00 28 27 28 24 29 27 4.08:00 26 31 32 28 28 29 4.39:00 31 26 37 31 32 31 4.710:00 31 25 25 33 37 30 4.511:00 39 29 35 27 31 32 4.8
12:00 Noon 25 33 37 25 44 33 4.91:00 38 44 29 30 37 36 5.32:00 43 45 54 46 44 46 6.93:00 41 61 51 48 66 53 7.94:00 54 56 67 68 62 61 9.15:00 81 74 77 45 63 68 10.16:00 68 69 76 55 58 65 9.77:00 51 36 60 40 50 47 7.18:00 29 36 28 29 29 30 4.59:00 25 24 25 23 29 25 3.810:00 21 16 11 12 14 15 2.211:00 15 7 9 11 5 9 1.4
Unknown 0 0 0 0 0 0 0.0Injury Crashes 678 676 717 603 685 672 100.0
Time of Day 2015 2016 2017 2018 2019 AVG. %12:00 Midnight 0 0 2 0 0 0 3.8
1:00 0 1 0 1 0 0 3.82:00 0 1 0 0 0 0 1.93:00 0 0 1 0 0 0 1.94:00 0 0 0 0 0 0 0.05:00 0 0 1 0 0 0 1.96:00 1 0 1 1 2 1 9.47:00 1 2 0 0 0 1 5.78:00 0 0 0 0 0 0 0.09:00 0 0 0 0 1 0 1.910:00 0 0 0 0 0 0 0.011:00 0 1 2 0 1 1 7.5
12:00 Noon 1 0 0 0 1 0 3.81:00 0 3 0 0 0 1 5.72:00 1 1 0 0 0 0 3.83:00 1 1 0 0 0 0 3.84:00 1 1 0 0 2 1 7.55:00 0 1 0 0 0 0 1.96:00 0 1 1 1 0 1 5.77:00 2 1 0 0 2 1 9.48:00 0 0 1 1 0 0 3.89:00 0 2 0 0 0 0 3.810:00 2 0 1 2 0 1 9.411:00 0 0 1 0 1 0 3.8
Unknown 0 0 0 0 0 0 0.0Fatal Crashes 10 16 11 6 10 11 100.0
MARYLAND DEPARTMENT OF TRANSPORTATIO August 10, 2020 Maryland Motor Vehicle AdministrationMaryland Highway Safety Office
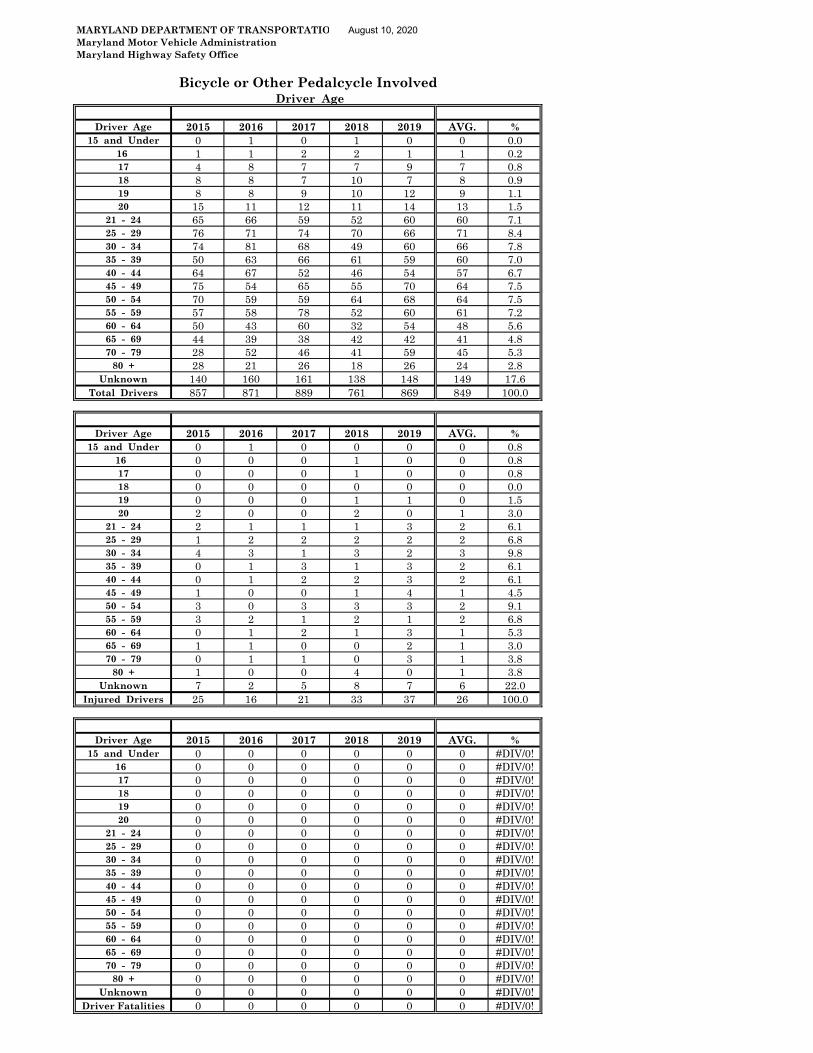
Bicycle or Other Pedalcycle Involved Driver Age
Driver Age 2015 2016 2017 2018 2019 AVG. %15 and Under 0 1 0 1 0 0 0.0
16 1 1 2 2 1 1 0.217 4 8 7 7 9 7 0.818 8 8 7 10 7 8 0.919 8 8 9 10 12 9 1.120 15 11 12 11 14 13 1.5
21 - 24 65 66 59 52 60 60 7.125 - 29 76 71 74 70 66 71 8.430 - 34 74 81 68 49 60 66 7.835 - 39 50 63 66 61 59 60 7.040 - 44 64 67 52 46 54 57 6.745 - 49 75 54 65 55 70 64 7.550 - 54 70 59 59 64 68 64 7.555 - 59 57 58 78 52 60 61 7.260 - 64 50 43 60 32 54 48 5.665 - 69 44 39 38 42 42 41 4.870 - 79 28 52 46 41 59 45 5.3
80 + 28 21 26 18 26 24 2.8Unknown 140 160 161 138 148 149 17.6
Total Drivers 857 871 889 761 869 849 100.0
Driver Age 2015 2016 2017 2018 2019 AVG. %15 and Under 0 1 0 0 0 0 0.8
16 0 0 0 1 0 0 0.817 0 0 0 1 0 0 0.818 0 0 0 0 0 0 0.019 0 0 0 1 1 0 1.520 2 0 0 2 0 1 3.0
21 - 24 2 1 1 1 3 2 6.125 - 29 1 2 2 2 2 2 6.830 - 34 4 3 1 3 2 3 9.835 - 39 0 1 3 1 3 2 6.140 - 44 0 1 2 2 3 2 6.145 - 49 1 0 0 1 4 1 4.550 - 54 3 0 3 3 3 2 9.155 - 59 3 2 1 2 1 2 6.860 - 64 0 1 2 1 3 1 5.365 - 69 1 1 0 0 2 1 3.070 - 79 0 1 1 0 3 1 3.8
80 + 1 0 0 4 0 1 3.8Unknown 7 2 5 8 7 6 22.0
Injured Drivers 25 16 21 33 37 26 100.0
Driver Age 2015 2016 2017 2018 2019 AVG. %15 and Under 0 0 0 0 0 0 #DIV/0!
16 0 0 0 0 0 0 #DIV/0!17 0 0 0 0 0 0 #DIV/0!18 0 0 0 0 0 0 #DIV/0!19 0 0 0 0 0 0 #DIV/0!20 0 0 0 0 0 0 #DIV/0!
21 - 24 0 0 0 0 0 0 #DIV/0!25 - 29 0 0 0 0 0 0 #DIV/0!30 - 34 0 0 0 0 0 0 #DIV/0!35 - 39 0 0 0 0 0 0 #DIV/0!40 - 44 0 0 0 0 0 0 #DIV/0!45 - 49 0 0 0 0 0 0 #DIV/0!50 - 54 0 0 0 0 0 0 #DIV/0!55 - 59 0 0 0 0 0 0 #DIV/0!60 - 64 0 0 0 0 0 0 #DIV/0!65 - 69 0 0 0 0 0 0 #DIV/0!70 - 79 0 0 0 0 0 0 #DIV/0!
80 + 0 0 0 0 0 0 #DIV/0!Unknown 0 0 0 0 0 0 #DIV/0!
Driver Fatalities 0 0 0 0 0 0 #DIV/0!
MARYLAND DEPARTMENT OF TRANSPORTATION August 10, 2020 Maryland Motor Vehicle AdministrationMaryland Highway Safety Office
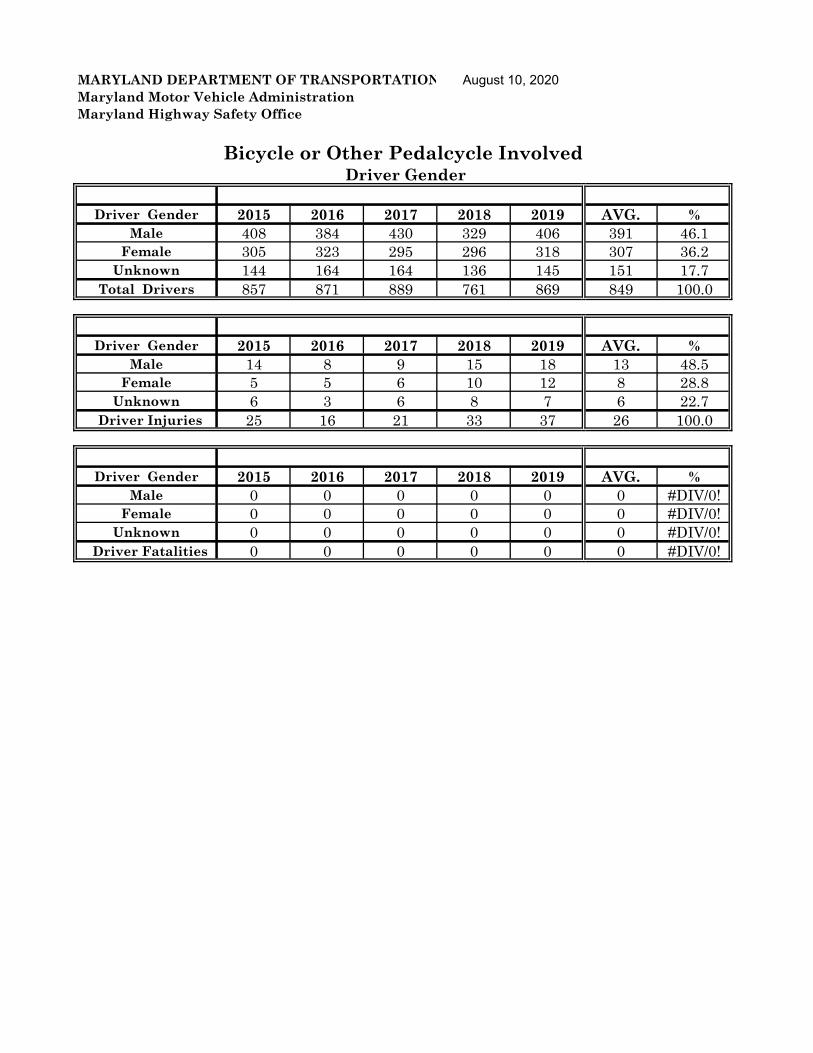
Bicycle or Other Pedalcycle Involved Driver Gender
Driver Gender 2015 2016 2017 2018 2019 AVG. %Male 408 384 430 329 406 391 46.1
Female 305 323 295 296 318 307 36.2Unknown 144 164 164 136 145 151 17.7
Total Drivers 857 871 889 761 869 849 100.0
Driver Gender 2015 2016 2017 2018 2019 AVG. %Male 14 8 9 15 18 13 48.5
Female 5 5 6 10 12 8 28.8Unknown 6 3 6 8 7 6 22.7
Driver Injuries 25 16 21 33 37 26 100.0
Driver Gender 2015 2016 2017 2018 2019 AVG. %Male 0 0 0 0 0 0 #DIV/0!
Female 0 0 0 0 0 0 #DIV/0!Unknown 0 0 0 0 0 0 #DIV/0!
Driver Fatalities 0 0 0 0 0 0 #DIV/0!
MARYLAND DEPARTMENT OF TRANSPORTATION August 10, 2020 Maryland Motor Vehicle AdministrationMaryland Highway Safety Office
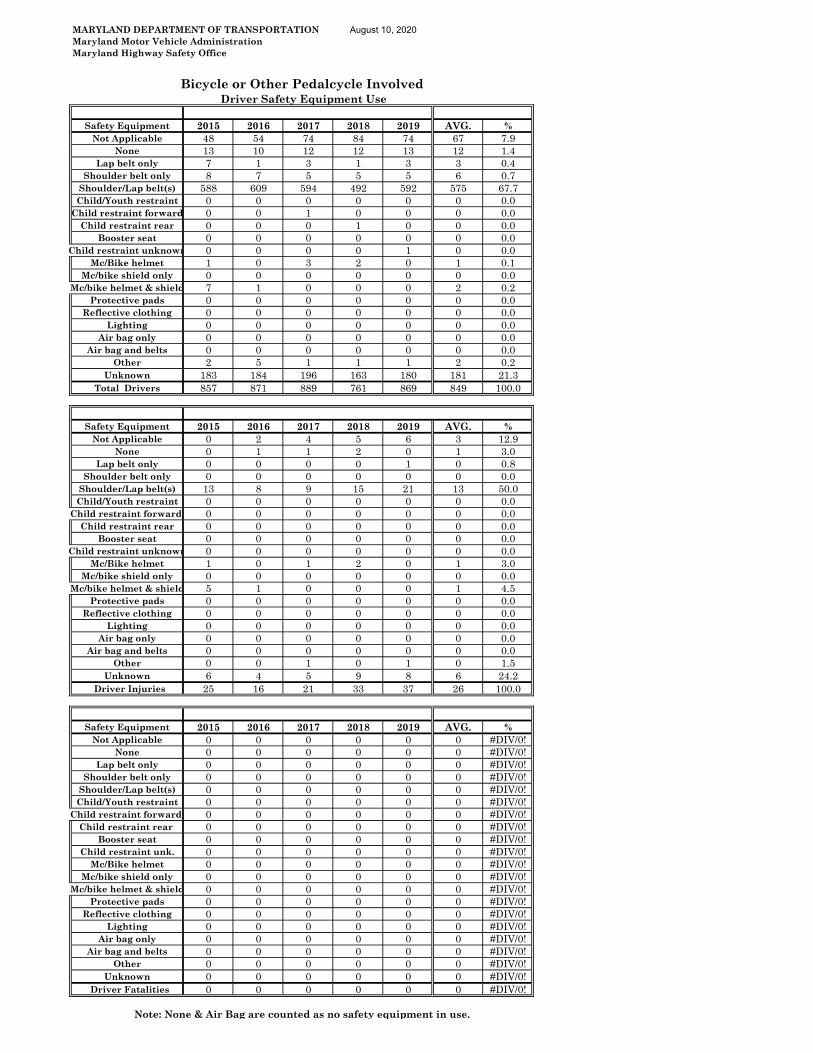
Bicycle or Other Pedalcycle Involved Driver Safety Equipment Use
Safety Equipment 2015 2016 2017 2018 2019 AVG. %Not Applicable 48 54 74 84 74 67 7.9
None 13 10 12 12 13 12 1.4Lap belt only 7 1 3 1 3 3 0.4
Shoulder belt only 8 7 5 5 5 6 0.7Shoulder/Lap belt(s) 588 609 594 492 592 575 67.7Child/Youth restraint 0 0 0 0 0 0 0.0
Child restraint forward 0 0 1 0 0 0 0.0Child restraint rear 0 0 0 1 0 0 0.0
Booster seat 0 0 0 0 0 0 0.0Child restraint unknown 0 0 0 0 1 0 0.0
Mc/Bike helmet 1 0 3 2 0 1 0.1Mc/bike shield only 0 0 0 0 0 0 0.0
Mc/bike helmet & shield 7 1 0 0 0 2 0.2Protective pads 0 0 0 0 0 0 0.0
Reflective clothing 0 0 0 0 0 0 0.0Lighting 0 0 0 0 0 0 0.0
Air bag only 0 0 0 0 0 0 0.0Air bag and belts 0 0 0 0 0 0 0.0
Other 2 5 1 1 1 2 0.2Unknown 183 184 196 163 180 181 21.3
Total Drivers 857 871 889 761 869 849 100.0
Safety Equipment 2015 2016 2017 2018 2019 AVG. %Not Applicable 0 2 4 5 6 3 12.9
None 0 1 1 2 0 1 3.0Lap belt only 0 0 0 0 1 0 0.8
Shoulder belt only 0 0 0 0 0 0 0.0Shoulder/Lap belt(s) 13 8 9 15 21 13 50.0Child/Youth restraint 0 0 0 0 0 0 0.0
Child restraint forward 0 0 0 0 0 0 0.0Child restraint rear 0 0 0 0 0 0 0.0
Booster seat 0 0 0 0 0 0 0.0Child restraint unknown 0 0 0 0 0 0 0.0
Mc/Bike helmet 1 0 1 2 0 1 3.0Mc/bike shield only 0 0 0 0 0 0 0.0
Mc/bike helmet & shield 5 1 0 0 0 1 4.5Protective pads 0 0 0 0 0 0 0.0
Reflective clothing 0 0 0 0 0 0 0.0Lighting 0 0 0 0 0 0 0.0
Air bag only 0 0 0 0 0 0 0.0Air bag and belts 0 0 0 0 0 0 0.0
Other 0 0 1 0 1 0 1.5Unknown 6 4 5 9 8 6 24.2
Driver Injuries 25 16 21 33 37 26 100.0
Safety Equipment 2015 2016 2017 2018 2019 AVG. %Not Applicable 0 0 0 0 0 0 #DIV/0!
None 0 0 0 0 0 0 #DIV/0!Lap belt only 0 0 0 0 0 0 #DIV/0!
Shoulder belt only 0 0 0 0 0 0 #DIV/0!Shoulder/Lap belt(s) 0 0 0 0 0 0 #DIV/0!Child/Youth restraint 0 0 0 0 0 0 #DIV/0!
Child restraint forward 0 0 0 0 0 0 #DIV/0!Child restraint rear 0 0 0 0 0 0 #DIV/0!
Booster seat 0 0 0 0 0 0 #DIV/0!Child restraint unk. 0 0 0 0 0 0 #DIV/0!
Mc/Bike helmet 0 0 0 0 0 0 #DIV/0!Mc/bike shield only 0 0 0 0 0 0 #DIV/0!
Mc/bike helmet & shield 0 0 0 0 0 0 #DIV/0!Protective pads 0 0 0 0 0 0 #DIV/0!
Reflective clothing 0 0 0 0 0 0 #DIV/0!Lighting 0 0 0 0 0 0 #DIV/0!
Air bag only 0 0 0 0 0 0 #DIV/0!Air bag and belts 0 0 0 0 0 0 #DIV/0!
Other 0 0 0 0 0 0 #DIV/0!Unknown 0 0 0 0 0 0 #DIV/0!
Driver Fatalities 0 0 0 0 0 0 #DIV/0!
Note: None & Air Bag are counted as no safety equipment in use.
MARYLAND DEPARTMENT OF TRANSPORTATION August 10, 2020 Maryland Motor Vehicle AdministrationMaryland Highway Safety Office
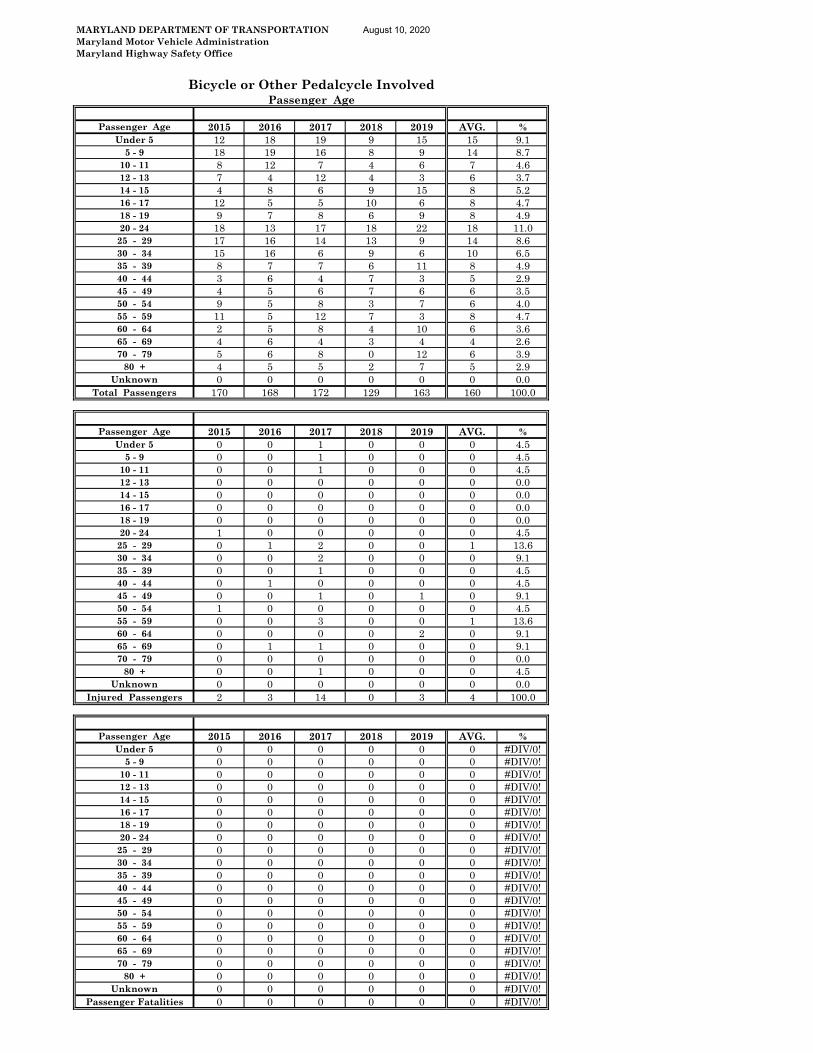
Bicycle or Other Pedalcycle InvolvedPassenger Age
Passenger Age 2015 2016 2017 2018 2019 AVG. %Under 5 12 18 19 9 15 15 9.1
5 - 9 18 19 16 8 9 14 8.710 - 11 8 12 7 4 6 7 4.612 - 13 7 4 12 4 3 6 3.714 - 15 4 8 6 9 15 8 5.216 - 17 12 5 5 10 6 8 4.718 - 19 9 7 8 6 9 8 4.920 - 24 18 13 17 18 22 18 11.0
25 - 29 17 16 14 13 9 14 8.630 - 34 15 16 6 9 6 10 6.535 - 39 8 7 7 6 11 8 4.940 - 44 3 6 4 7 3 5 2.945 - 49 4 5 6 7 6 6 3.550 - 54 9 5 8 3 7 6 4.055 - 59 11 5 12 7 3 8 4.760 - 64 2 5 8 4 10 6 3.665 - 69 4 6 4 3 4 4 2.670 - 79 5 6 8 0 12 6 3.9
80 + 4 5 5 2 7 5 2.9Unknown 0 0 0 0 0 0 0.0
Total Passengers 170 168 172 129 163 160 100.0
Passenger Age 2015 2016 2017 2018 2019 AVG. %Under 5 0 0 1 0 0 0 4.5
5 - 9 0 0 1 0 0 0 4.510 - 11 0 0 1 0 0 0 4.512 - 13 0 0 0 0 0 0 0.014 - 15 0 0 0 0 0 0 0.016 - 17 0 0 0 0 0 0 0.018 - 19 0 0 0 0 0 0 0.020 - 24 1 0 0 0 0 0 4.5
25 - 29 0 1 2 0 0 1 13.630 - 34 0 0 2 0 0 0 9.135 - 39 0 0 1 0 0 0 4.540 - 44 0 1 0 0 0 0 4.545 - 49 0 0 1 0 1 0 9.150 - 54 1 0 0 0 0 0 4.555 - 59 0 0 3 0 0 1 13.660 - 64 0 0 0 0 2 0 9.165 - 69 0 1 1 0 0 0 9.170 - 79 0 0 0 0 0 0 0.0
80 + 0 0 1 0 0 0 4.5Unknown 0 0 0 0 0 0 0.0
Injured Passengers 2 3 14 0 3 4 100.0
Passenger Age 2015 2016 2017 2018 2019 AVG. %Under 5 0 0 0 0 0 0 #DIV/0!
5 - 9 0 0 0 0 0 0 #DIV/0!10 - 11 0 0 0 0 0 0 #DIV/0!12 - 13 0 0 0 0 0 0 #DIV/0!14 - 15 0 0 0 0 0 0 #DIV/0!16 - 17 0 0 0 0 0 0 #DIV/0!18 - 19 0 0 0 0 0 0 #DIV/0!20 - 24 0 0 0 0 0 0 #DIV/0!
25 - 29 0 0 0 0 0 0 #DIV/0!30 - 34 0 0 0 0 0 0 #DIV/0!35 - 39 0 0 0 0 0 0 #DIV/0!40 - 44 0 0 0 0 0 0 #DIV/0!45 - 49 0 0 0 0 0 0 #DIV/0!50 - 54 0 0 0 0 0 0 #DIV/0!55 - 59 0 0 0 0 0 0 #DIV/0!60 - 64 0 0 0 0 0 0 #DIV/0!65 - 69 0 0 0 0 0 0 #DIV/0!70 - 79 0 0 0 0 0 0 #DIV/0!
80 + 0 0 0 0 0 0 #DIV/0!Unknown 0 0 0 0 0 0 #DIV/0!
Passenger Fatalities 0 0 0 0 0 0 #DIV/0!
MARYLAND DEPARTMENT OF TRANSPORTATION August 10, 2020 Maryland Motor Vehicle AdministrationMaryland Highway Safety Office
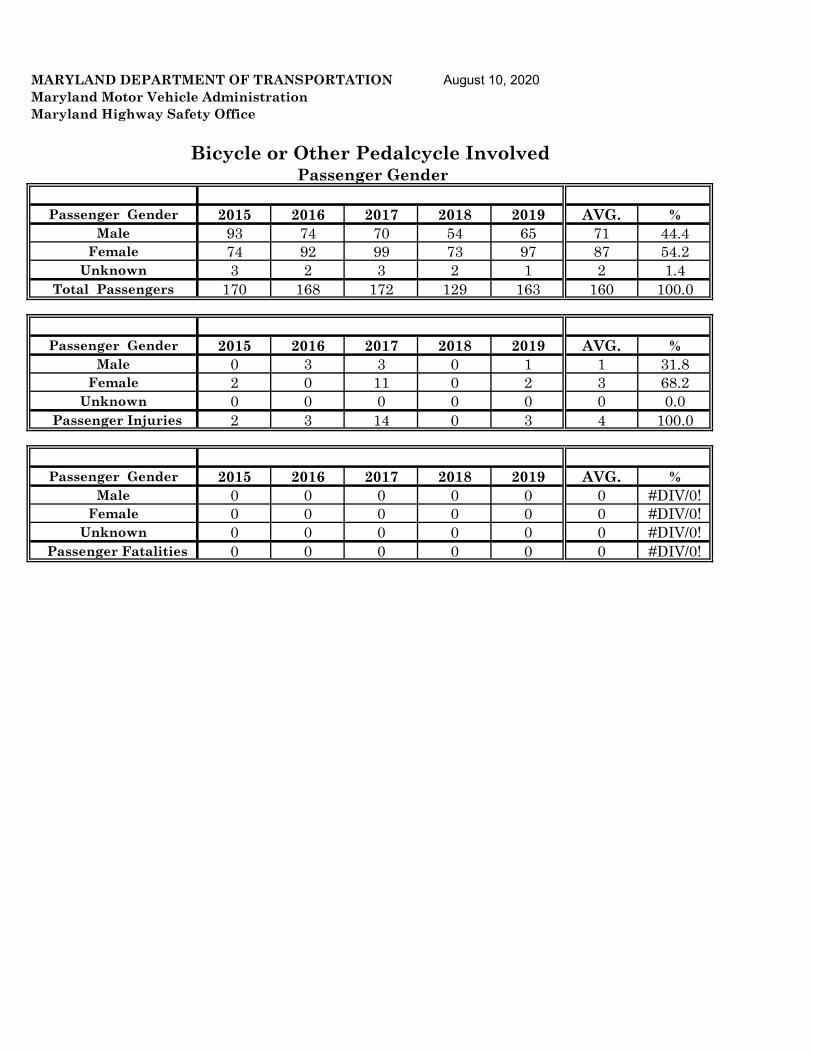
Bicycle or Other Pedalcycle Involved Passenger Gender
Passenger Gender 2015 2016 2017 2018 2019 AVG. %Male 93 74 70 54 65 71 44.4
Female 74 92 99 73 97 87 54.2Unknown 3 2 3 2 1 2 1.4
Total Passengers 170 168 172 129 163 160 100.0
Passenger Gender 2015 2016 2017 2018 2019 AVG. %Male 0 3 3 0 1 1 31.8
Female 2 0 11 0 2 3 68.2Unknown 0 0 0 0 0 0 0.0
Passenger Injuries 2 3 14 0 3 4 100.0
Passenger Gender 2015 2016 2017 2018 2019 AVG. %Male 0 0 0 0 0 0 #DIV/0!
Female 0 0 0 0 0 0 #DIV/0!Unknown 0 0 0 0 0 0 #DIV/0!
Passenger Fatalities 0 0 0 0 0 0 #DIV/0!
MARYLAND DEPARTMENT OF TRANSPORTATION August 10, 2020 Maryland Motor Vehicle AdministrationMaryland Highway Safety Office
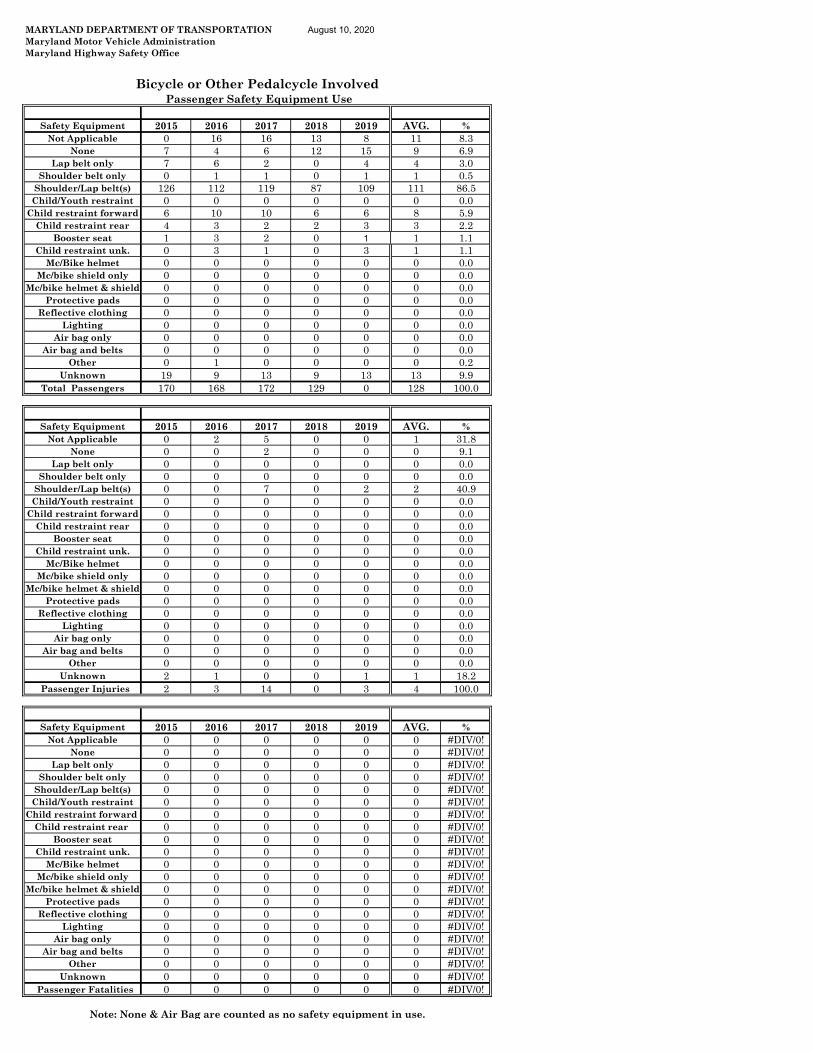
Bicycle or Other Pedalcycle Involved Passenger Safety Equipment Use
Safety Equipment 2015 2016 2017 2018 2019 AVG. %Not Applicable 0 16 16 13 8 11 8.3
None 7 4 6 12 15 9 6.9Lap belt only 7 6 2 0 4 4 3.0
Shoulder belt only 0 1 1 0 1 1 0.5Shoulder/Lap belt(s) 126 112 119 87 109 111 86.5Child/Youth restraint 0 0 0 0 0 0 0.0
Child restraint forward 6 10 10 6 6 8 5.9Child restraint rear 4 3 2 2 3 3 2.2
Booster seat 1 3 2 0 1 1 1.1Child restraint unk. 0 3 1 0 3 1 1.1
Mc/Bike helmet 0 0 0 0 0 0 0.0Mc/bike shield only 0 0 0 0 0 0 0.0
Mc/bike helmet & shield 0 0 0 0 0 0 0.0Protective pads 0 0 0 0 0 0 0.0
Reflective clothing 0 0 0 0 0 0 0.0Lighting 0 0 0 0 0 0 0.0
Air bag only 0 0 0 0 0 0 0.0Air bag and belts 0 0 0 0 0 0 0.0
Other 0 1 0 0 0 0 0.2Unknown 19 9 13 9 13 13 9.9
Total Passengers 170 168 172 129 0 128 100.0
Safety Equipment 2015 2016 2017 2018 2019 AVG. %Not Applicable 0 2 5 0 0 1 31.8
None 0 0 2 0 0 0 9.1Lap belt only 0 0 0 0 0 0 0.0
Shoulder belt only 0 0 0 0 0 0 0.0Shoulder/Lap belt(s) 0 0 7 0 2 2 40.9Child/Youth restraint 0 0 0 0 0 0 0.0
Child restraint forward 0 0 0 0 0 0 0.0Child restraint rear 0 0 0 0 0 0 0.0
Booster seat 0 0 0 0 0 0 0.0Child restraint unk. 0 0 0 0 0 0 0.0
Mc/Bike helmet 0 0 0 0 0 0 0.0Mc/bike shield only 0 0 0 0 0 0 0.0
Mc/bike helmet & shield 0 0 0 0 0 0 0.0Protective pads 0 0 0 0 0 0 0.0
Reflective clothing 0 0 0 0 0 0 0.0Lighting 0 0 0 0 0 0 0.0
Air bag only 0 0 0 0 0 0 0.0Air bag and belts 0 0 0 0 0 0 0.0
Other 0 0 0 0 0 0 0.0Unknown 2 1 0 0 1 1 18.2
Passenger Injuries 2 3 14 0 3 4 100.0
Safety Equipment 2015 2016 2017 2018 2019 AVG. %Not Applicable 0 0 0 0 0 0 #DIV/0!
None 0 0 0 0 0 0 #DIV/0!Lap belt only 0 0 0 0 0 0 #DIV/0!
Shoulder belt only 0 0 0 0 0 0 #DIV/0!Shoulder/Lap belt(s) 0 0 0 0 0 0 #DIV/0!Child/Youth restraint 0 0 0 0 0 0 #DIV/0!
Child restraint forward 0 0 0 0 0 0 #DIV/0!Child restraint rear 0 0 0 0 0 0 #DIV/0!
Booster seat 0 0 0 0 0 0 #DIV/0!Child restraint unk. 0 0 0 0 0 0 #DIV/0!
Mc/Bike helmet 0 0 0 0 0 0 #DIV/0!Mc/bike shield only 0 0 0 0 0 0 #DIV/0!
Mc/bike helmet & shield 0 0 0 0 0 0 #DIV/0!Protective pads 0 0 0 0 0 0 #DIV/0!
Reflective clothing 0 0 0 0 0 0 #DIV/0!Lighting 0 0 0 0 0 0 #DIV/0!
Air bag only 0 0 0 0 0 0 #DIV/0!Air bag and belts 0 0 0 0 0 0 #DIV/0!
Other 0 0 0 0 0 0 #DIV/0!Unknown 0 0 0 0 0 0 #DIV/0!
Passenger Fatalities 0 0 0 0 0 0 #DIV/0!
Note: None & Air Bag are counted as no safety equipment in use.
MARYLAND DEPARTMENT OF TRANSPORTATIO August 10, 2020 Maryland Motor Vehicle AdministrationMaryland Highway Safety Office
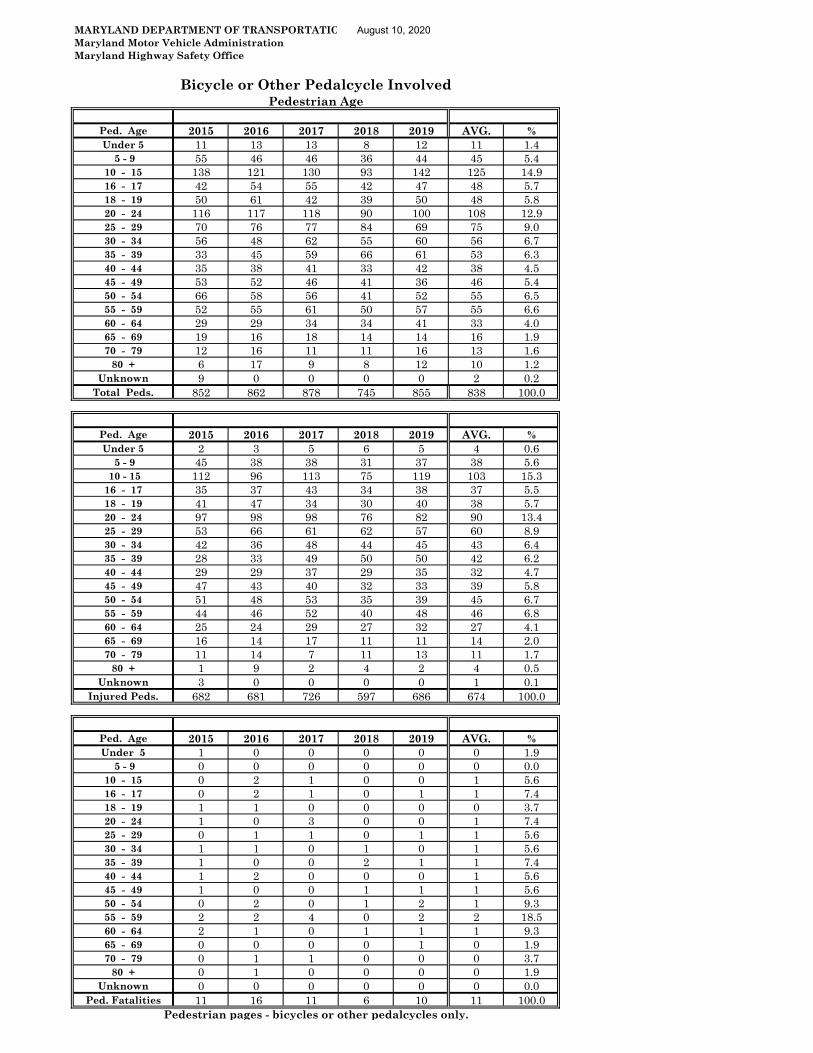
Bicycle or Other Pedalcycle InvolvedPedestrian Age
Ped. Age 2015 2016 2017 2018 2019 AVG. %Under 5 11 13 13 8 12 11 1.4
5 - 9 55 46 46 36 44 45 5.410 - 15 138 121 130 93 142 125 14.916 - 17 42 54 55 42 47 48 5.718 - 19 50 61 42 39 50 48 5.820 - 24 116 117 118 90 100 108 12.925 - 29 70 76 77 84 69 75 9.030 - 34 56 48 62 55 60 56 6.735 - 39 33 45 59 66 61 53 6.340 - 44 35 38 41 33 42 38 4.545 - 49 53 52 46 41 36 46 5.450 - 54 66 58 56 41 52 55 6.555 - 59 52 55 61 50 57 55 6.660 - 64 29 29 34 34 41 33 4.065 - 69 19 16 18 14 14 16 1.970 - 79 12 16 11 11 16 13 1.6
80 + 6 17 9 8 12 10 1.2Unknown 9 0 0 0 0 2 0.2
Total Peds. 852 862 878 745 855 838 100.0
Ped. Age 2015 2016 2017 2018 2019 AVG. %Under 5 2 3 5 6 5 4 0.6
5 - 9 45 38 38 31 37 38 5.6 10 - 15 112 96 113 75 119 103 15.316 - 17 35 37 43 34 38 37 5.518 - 19 41 47 34 30 40 38 5.720 - 24 97 98 98 76 82 90 13.425 - 29 53 66 61 62 57 60 8.930 - 34 42 36 48 44 45 43 6.435 - 39 28 33 49 50 50 42 6.240 - 44 29 29 37 29 35 32 4.745 - 49 47 43 40 32 33 39 5.850 - 54 51 48 53 35 39 45 6.755 - 59 44 46 52 40 48 46 6.860 - 64 25 24 29 27 32 27 4.165 - 69 16 14 17 11 11 14 2.070 - 79 11 14 7 11 13 11 1.7
80 + 1 9 2 4 2 4 0.5Unknown 3 0 0 0 0 1 0.1
Injured Peds. 682 681 726 597 686 674 100.0
Ped. Age 2015 2016 2017 2018 2019 AVG. %Under 5 1 0 0 0 0 0 1.9
5 - 9 0 0 0 0 0 0 0.010 - 15 0 2 1 0 0 1 5.616 - 17 0 2 1 0 1 1 7.418 - 19 1 1 0 0 0 0 3.720 - 24 1 0 3 0 0 1 7.425 - 29 0 1 1 0 1 1 5.630 - 34 1 1 0 1 0 1 5.635 - 39 1 0 0 2 1 1 7.440 - 44 1 2 0 0 0 1 5.645 - 49 1 0 0 1 1 1 5.650 - 54 0 2 0 1 2 1 9.355 - 59 2 2 4 0 2 2 18.560 - 64 2 1 0 1 1 1 9.365 - 69 0 0 0 0 1 0 1.970 - 79 0 1 1 0 0 0 3.7
80 + 0 1 0 0 0 0 1.9Unknown 0 0 0 0 0 0 0.0
Ped. Fatalities 11 16 11 6 10 11 100.0Pedestrian pages - bicycles or other pedalcycles only.
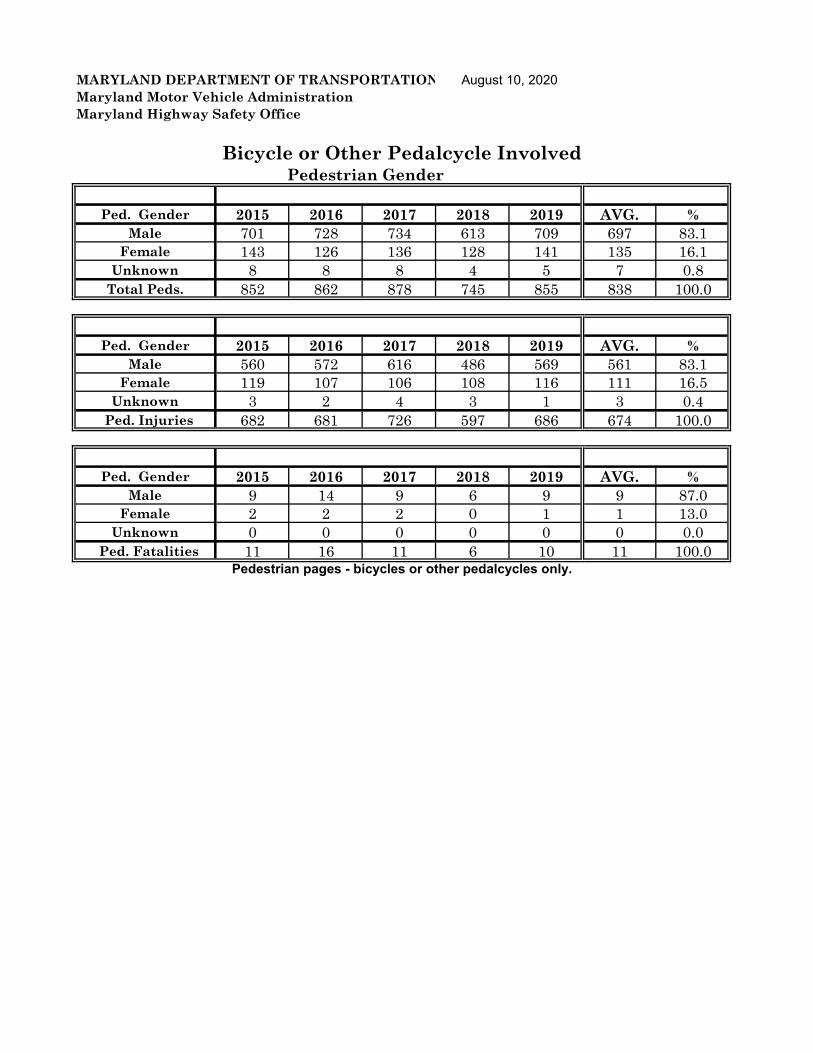
MARYLAND DEPARTMENT OF TRANSPORTATION August 10, 2020 Maryland Motor Vehicle AdministrationMaryland Highway Safety Office
Bicycle or Other Pedalcycle InvolvedPedestrian Gender
Ped. Gender 2015 2016 2017 2018 2019 AVG. %Male 701 728 734 613 709 697 83.1
Female 143 126 136 128 141 135 16.1Unknown 8 8 8 4 5 7 0.8
Total Peds. 852 862 878 745 855 838 100.0
Ped. Gender 2015 2016 2017 2018 2019 AVG. %Male 560 572 616 486 569 561 83.1
Female 119 107 106 108 116 111 16.5Unknown 3 2 4 3 1 3 0.4
Ped. Injuries 682 681 726 597 686 674 100.0
Ped. Gender 2015 2016 2017 2018 2019 AVG. %Male 9 14 9 6 9 9 87.0
Female 2 2 2 0 1 1 13.0Unknown 0 0 0 0 0 0 0.0
Ped. Fatalities 11 16 11 6 10 11 100.0Pedestrian pages - bicycles or other pedalcycles only.
MARYLAND DEPARTMENT OF TRANSPORTATION August 10, 2020 Maryland Motor Vehicle AdministrationMaryland Highway Safety Office
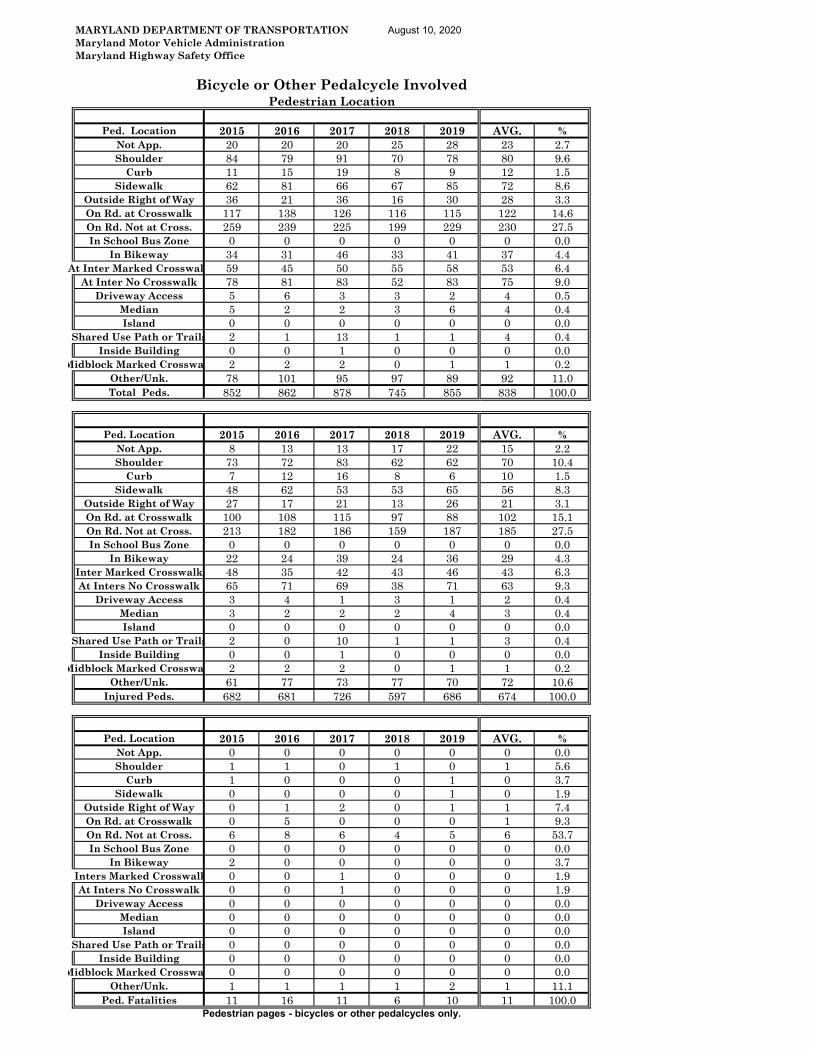
Bicycle or Other Pedalcycle InvolvedPedestrian Location
Ped. Location 2015 2016 2017 2018 2019 AVG. %Not App. 20 20 20 25 28 23 2.7Shoulder 84 79 91 70 78 80 9.6
Curb 11 15 19 8 9 12 1.5Sidewalk 62 81 66 67 85 72 8.6
Outside Right of Way 36 21 36 16 30 28 3.3On Rd. at Crosswalk 117 138 126 116 115 122 14.6On Rd. Not at Cross. 259 239 225 199 229 230 27.5In School Bus Zone 0 0 0 0 0 0 0.0
In Bikeway 34 31 46 33 41 37 4.4At Inter Marked Crosswal 59 45 50 55 58 53 6.4
At Inter No Crosswalk 78 81 83 52 83 75 9.0Driveway Access 5 6 3 3 2 4 0.5
Median 5 2 2 3 6 4 0.4Island 0 0 0 0 0 0 0.0
Shared Use Path or Trails 2 1 13 1 1 4 0.4Inside Building 0 0 1 0 0 0 0.0
Midblock Marked Crosswa 2 2 2 0 1 1 0.2Other/Unk. 78 101 95 97 89 92 11.0Total Peds. 852 862 878 745 855 838 100.0
Ped. Location 2015 2016 2017 2018 2019 AVG. %Not App. 8 13 13 17 22 15 2.2Shoulder 73 72 83 62 62 70 10.4
Curb 7 12 16 8 6 10 1.5Sidewalk 48 62 53 53 65 56 8.3
Outside Right of Way 27 17 21 13 26 21 3.1On Rd. at Crosswalk 100 108 115 97 88 102 15.1On Rd. Not at Cross. 213 182 186 159 187 185 27.5In School Bus Zone 0 0 0 0 0 0 0.0
In Bikeway 22 24 39 24 36 29 4.3Inter Marked Crosswalk 48 35 42 43 46 43 6.3At Inters No Crosswalk 65 71 69 38 71 63 9.3
Driveway Access 3 4 1 3 1 2 0.4Median 3 2 2 2 4 3 0.4Island 0 0 0 0 0 0 0.0
Shared Use Path or Trails 2 0 10 1 1 3 0.4Inside Building 0 0 1 0 0 0 0.0
Midblock Marked Crosswa 2 2 2 0 1 1 0.2Other/Unk. 61 77 73 77 70 72 10.6
Injured Peds. 682 681 726 597 686 674 100.0
Ped. Location 2015 2016 2017 2018 2019 AVG. %Not App. 0 0 0 0 0 0 0.0Shoulder 1 1 0 1 0 1 5.6
Curb 1 0 0 0 1 0 3.7Sidewalk 0 0 0 0 1 0 1.9
Outside Right of Way 0 1 2 0 1 1 7.4On Rd. at Crosswalk 0 5 0 0 0 1 9.3On Rd. Not at Cross. 6 8 6 4 5 6 53.7In School Bus Zone 0 0 0 0 0 0 0.0
In Bikeway 2 0 0 0 0 0 3.7 Inters Marked Crosswalk 0 0 1 0 0 0 1.9
At Inters No Crosswalk 0 0 1 0 0 0 1.9Driveway Access 0 0 0 0 0 0 0.0
Median 0 0 0 0 0 0 0.0Island 0 0 0 0 0 0 0.0
Shared Use Path or Trails 0 0 0 0 0 0 0.0Inside Building 0 0 0 0 0 0 0.0
Midblock Marked Crosswa 0 0 0 0 0 0 0.0Other/Unk. 1 1 1 1 2 1 11.1
Ped. Fatalities 11 16 11 6 10 11 100.0Pedestrian pages - bicycles or other pedalcycles only.
MARYLAND DEPARTMENT OF TRANSPORTATION August 10, 2020 Maryland Motor Vehicle AdministrationMaryland Highway Safety Office
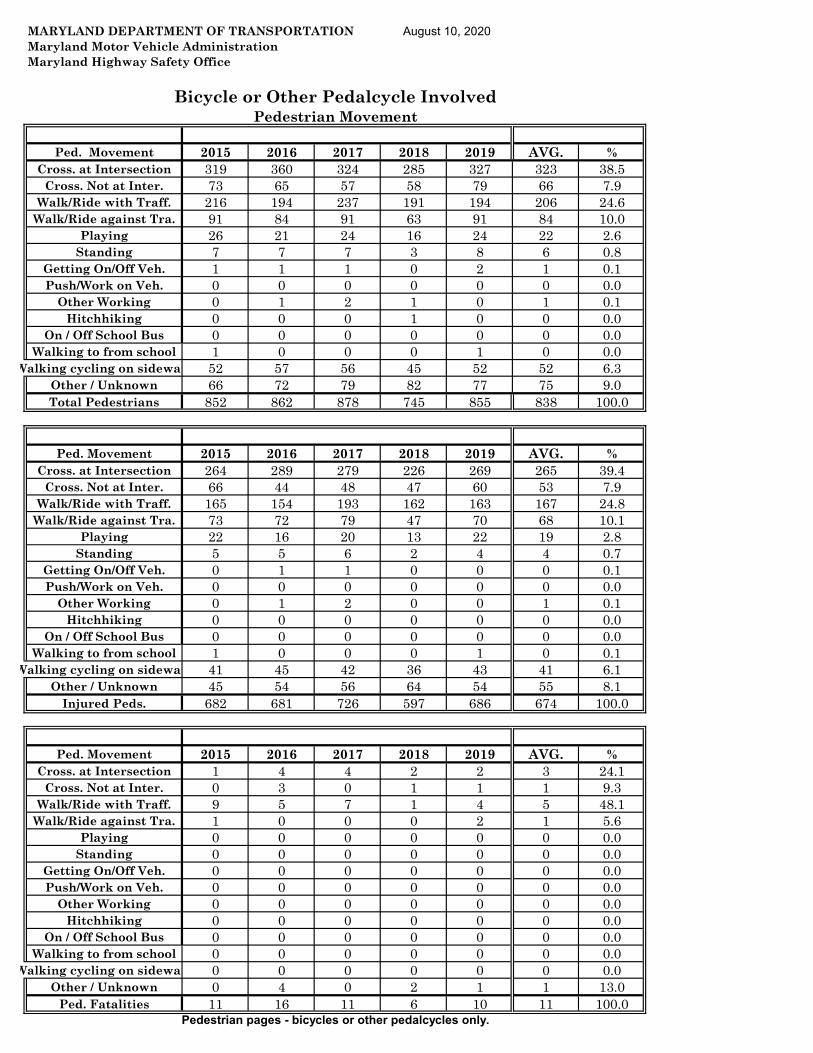
Bicycle or Other Pedalcycle InvolvedPedestrian Movement
Ped. Movement 2015 2016 2017 2018 2019 AVG. %Cross. at Intersection 319 360 324 285 327 323 38.5
Cross. Not at Inter. 73 65 57 58 79 66 7.9Walk/Ride with Traff. 216 194 237 191 194 206 24.6
Walk/Ride against Tra. 91 84 91 63 91 84 10.0Playing 26 21 24 16 24 22 2.6
Standing 7 7 7 3 8 6 0.8Getting On/Off Veh. 1 1 1 0 2 1 0.1Push/Work on Veh. 0 0 0 0 0 0 0.0
Other Working 0 1 2 1 0 1 0.1Hitchhiking 0 0 0 1 0 0 0.0
On / Off School Bus 0 0 0 0 0 0 0.0Walking to from school 1 0 0 0 1 0 0.0
Walking cycling on sidewal 52 57 56 45 52 52 6.3Other / Unknown 66 72 79 82 77 75 9.0Total Pedestrians 852 862 878 745 855 838 100.0
Ped. Movement 2015 2016 2017 2018 2019 AVG. %Cross. at Intersection 264 289 279 226 269 265 39.4
Cross. Not at Inter. 66 44 48 47 60 53 7.9Walk/Ride with Traff. 165 154 193 162 163 167 24.8
Walk/Ride against Tra. 73 72 79 47 70 68 10.1Playing 22 16 20 13 22 19 2.8
Standing 5 5 6 2 4 4 0.7Getting On/Off Veh. 0 1 1 0 0 0 0.1Push/Work on Veh. 0 0 0 0 0 0 0.0
Other Working 0 1 2 0 0 1 0.1Hitchhiking 0 0 0 0 0 0 0.0
On / Off School Bus 0 0 0 0 0 0 0.0Walking to from school 1 0 0 0 1 0 0.1
Walking cycling on sidewal 41 45 42 36 43 41 6.1Other / Unknown 45 54 56 64 54 55 8.1
Injured Peds. 682 681 726 597 686 674 100.0
Ped. Movement 2015 2016 2017 2018 2019 AVG. %Cross. at Intersection 1 4 4 2 2 3 24.1
Cross. Not at Inter. 0 3 0 1 1 1 9.3Walk/Ride with Traff. 9 5 7 1 4 5 48.1
Walk/Ride against Tra. 1 0 0 0 2 1 5.6Playing 0 0 0 0 0 0 0.0
Standing 0 0 0 0 0 0 0.0Getting On/Off Veh. 0 0 0 0 0 0 0.0Push/Work on Veh. 0 0 0 0 0 0 0.0
Other Working 0 0 0 0 0 0 0.0Hitchhiking 0 0 0 0 0 0 0.0
On / Off School Bus 0 0 0 0 0 0 0.0Walking to from school 0 0 0 0 0 0 0.0
Walking cycling on sidewal 0 0 0 0 0 0 0.0Other / Unknown 0 4 0 2 1 1 13.0
Ped. Fatalities 11 16 11 6 10 11 100.0Pedestrian pages - bicycles or other pedalcycles only.