bicycle plan - california · st. helena bicycle plan january 2012 acknowledgments project team napa...
TRANSCRIPT

January 2012
Submitted by
Whitlock & Weinberger Transportation, Inc.
490 Mendocino AvenueSuite 201Santa Rosa, CA 95401
voice 707.542.9500
475 14th StreetSuite 290Oakland, CA 94612
voice 510.444.2600
web www.w-trans.com
Questa Engineering Corporation
1220 Brickyard Cove RoadSuite 206Point Richmond, CA 94801
voice 510.236.6114
web www.questaec.com
St. HelenaBicycle Plan
Prepared for
Napa County Transportation & Planning Agency
City of St. Helena

St. Helena Bicycle Plan January 2012
Acknowledgments
Project Team
Napa County Transportation & Planning Agency Eliot Hurwitz, Program Manager Paul Price, Executive Director Renée Kulick, Administrative Assistant
Consultant Team
Whitlock & Weinberger Transportation, Inc. Steve Weinberger, PE, PTOE, Principal Mary Jo Yung, PE, PTOE, Traffic Engineer Allan Tilton, PE, Traffic Engineer Josh Abrams, Transportation Planner Angela McCoy, Editing/Formatting Dalene J. Whitlock, PE, PTOE, Report Review Questa Engineering Corporation Jeffery Peters, Principal Margaret Henderson, ASLA, Principal Aaron Fulton, GIS Specialist Shaun O’Bryan, GIS Specialist
Project Steering Committee
Michael Costanzo, Executive Director Napa County Bicycle Coalition/ Napa County Bicycle Advisory Committee
Randy Davis, Director, Parks and Recreation City of American Canyon
Jean Hasser, Principal Planner (Retired) City of Napa
Greg Desmond, Acting Planning Director City of St. Helena
Rick Marshall, Deputy Director, Public Works County of Napa
City Staff
Greg Desmond, Acting Planning Director
John Ferons, Public Works Director Carol Poole, Planning Director
City Council
Del Britton, Mayor Sharon Crull, Vice Mayor Catarina Sanchez Ann Nevero Peter White
Planning Commission
Alan Galbraith, Chairperson Grace Kistner, Vice Chairperson Greg Pitts Sarah Parker Matthew Heil

St. Helena Bicycle Plan Page i January 2012
Table of Contents
Page
Introduction ........................................................................................................................................................................ 1
Setting and Context .......................................................................................................................................................... 9
Bicyclists and Bicycle Facilities ...................................................................................................................................... 24
The Local Bicycle Transportation Network ............................................................................................................. 28
Implementation ................................................................................................................................................................ 51
Definitions, Terms, and List of Acronyms ................................................................................................................. 63
Bibliography ....................................................................................................................................................................... 68
Figures
1 St. Helena Bikeways Map...........................................................................................................................................................3 2 Planning Area – North Valley ...................................................................................................................................................4 3 Napa County Bicycle Facilities .................................................................................................................................................5 4 St. Helena Circulation Network ........................................................................................................................................... 12 5 City of St. Helena Bicycle Collisions .................................................................................................................................... 31 6 City of St. Helena Bicycle Count Locations ....................................................................................................................... 35 7 Grant Application Development Calendar ......................................................................................................................... 62
Tables
1 Required Bicycle Master Plan Elements .................................................................................................................................7 2 General Info – City of St. Helena ............................................................................................................................................9 3 2000 US Census – Travel Time to Work for St. Helena ................................................................................................ 10 4 2000 US Census – Mode Split Data for St. Helena .......................................................................................................... 11 5 Bicyclist Types, Preferences and Needs .............................................................................................................................. 25 6 City of St. Helena Bicycle Collisions High Incidence Intersections (January 1, 1999 – December 31, 2008) ..... 30 7 City of St. Helena Bicycle Collisions High Incidence Mid-Block Locations (January 1, 1999 – December 31,
2008)........................................................................................................................................................................................... 30 8 City of St. Helena – Proposed Bicycle Count Locations ................................................................................................. 34 9 St. Helena Schools ................................................................................................................................................................... 37 10 Existing City of St. Helena Parks .......................................................................................................................................... 37 11 Existing Bikeways ..................................................................................................................................................................... 38 12 Proposed Bikeways and Project Priorities ......................................................................................................................... 44 13 Bicycle System Maintenance .................................................................................................................................................. 52 14 Maintenance Cost Assumptions ........................................................................................................................................... 53 15 Construction Cost Assumptions for Bikeway Improvements ....................................................................................... 55 16 Cost Assumptions for Programmatic Improvements ...................................................................................................... 57 17 Historical Expenditures on Bicycle Facilities ...................................................................................................................... 59
Appendices
A Summaries of Relevant Planning Documents and Policies B Bikeway Type Design Details C OTS Collision Rankings, Charts and Graphs D MTC and National Bicycle and Pedestrian Documentation Project Information E Project Ranking Matrix F Funding Program Summaries


St. Helena Bicycle Plan Page 1 January 2012
Introduction
Purpose of the Plan
The St. Helena Bicycle Plan was developed as a component of the Napa County Transportation Authority’s Countywide Bicycle Plan Update. The Plan is intended to guide and influence the development of bikeways, bicycle policies, bicycle programs and bicycle facility design standards to make bicycling throughout St. Helena and Napa County more safe, comfortable, convenient and enjoyable for all bicyclists. The overarching goal of the Bicycle Plan is to increase the number of persons who bicycle throughout St. Helena and Napa County for transportation to work, school, utilitarian purposes, and recreation.
This plan has been developed to address the needs of all types of bicyclists, including novice riders and children, the average bicyclist, and advanced riders and commuters, as well as shoppers, recreational riders, and tourists. Important reasons for increasing bicycle travel include reducing congestion and greenhouse gas emissions due to automobile traffic as well as general public health benefits of active transportation. This plan is designed to address the most common reasons why people do NOT use bicycles, including lack of convenience and perceived safety concerns. Important reasons for increasing bicycle travel include reducing congestion and greenhouse gas emissions due to automobile traffic as well as general public health benefits of active transportation.
Bicycle Plan Maps including the St. Helena Bikeways Map, Planning Area – North Valley, and Napa County Bicycle Facilities are shown in Figures 1, 2, and 3 respectively.
Background
This Bicycle Master Plan is St. Helena’s first comprehensive bicycle plan. Previous bicycle planning and implementation efforts have included the development of a bikeways map in the 1993 St. Helena General Plan, bike route planning in the 2003 Napa Countywide Bicycle Plan, formation of the 2009 Vine Trail sub-committee assembled to analyze and develop the most feasible Vine Trail alignment through the City, development of a bicycle parking program for Main Street, and delivery of bicycle rodeos to elementary students on an as-needed basis by the St. Helena Police Department. Finally, this effort builds upon and is being coordinated with the City’s concurrent evaluation of bicycle needs for the Draft St. Helena General Plan Update.
Caltrans Compliance
The St. Helena Bicycle Plan was prepared in accordance with the California Bicycle Transportation Act. To be eligible for Bicycle Transportation Account Funds, the California Bicycle Transportation Act requires that cities and counties prepare and adopt a Bicycle Transportation Plan that addresses items a – k in Section 891.2 of the Streets and Highways Code. These items are outlined in Table 1. To maintain eligibility with the Caltrans BTA, Bicycle Transportation Plans must be updated every five years. Information on the Bicycle Transportation Act, Bicycle Transportation Plan (BTP) preparation and processing, and eligible Bicycle Transportation Account projects is available on Caltrans’ BTA webpage: http://www.dot.ca.gov/hq/LocalPrograms/bta/btawebPage.htm

St. Helena Bicycle Plan Page 2 January 2012
This page intentionally left blank

1

2

3

St. Helena Bicycle Plan Page 6 January 2012
This page intentionally left blank

St. Helena Bicycle Plan Page 7 January 2012
Table 1 Required Bicycle Master Plan Elements
California Bicycle Transportation Act (1994) Bicycle Plan Reference Page
a. Estimated number of existing and future bicycle commuters
Existing – Table 4 ..................................................................... 11 Proposed – Local Mode Split Goal .................................. 14
b. Map and description of land use settlement patterns
Jurisdiction Overview Setting and Land Use .............. 9 Figure 1 .......................................................................................... 3
c. Map and description of existing and proposed bikeways
Figures 1-3 ................................................................................ 3-5 Existing – Bikeways Inventory ........................................... 38 Existing – Table 11 .................................................................. 38 Proposed – Proposed Bikeway System ......................... 40 Proposed – Table 12 ........................................................ 44-47
d. Map and description of bicycle parking facilities Figure 1 .......................................................................................... 3 Bicycle Parking Section ........................................................ 39
e. Map and description of multi-modal connections Figure 1 .......................................................................................... 3 Multi-Modal Connections Section ................................. 38
f. Map and description of facilities for changing and storing clothes and equipment
Figure 1 ................................................................................ 3 Shower and Locker Facilities ............................................ 43
g. Description of bicycle safety and education programs
Safety, Education, and Support Programs .................. 48
h. Description of citizen and community participation
Public Participation ................................................................... 7
i. Description of consistency with transportation, air quality, and energy conservation plans
Coordination and Consistency with Existing Plans and Policies ......................................................................... 13
j. Description of proposed projects and implementation priorities
Proposed Bikeway System ................................................. 39 Table 12 ....................................................................................... 44
k. Description of past expenditures and future financial needs for bicycle facilities
Past – Table 17 ......................................................................... 59 Future –Table 12 ............................................................... 44-47
Public Participation
The Bicycle Plan Update was developed over an 18-month period in 2010/11. The Plan was prepared by a consulting team working closely with NCTPA staff, a Project Steering Committee, local agency staff, Bicycle Advisory Committees or other responsible groups from the County and Napa’s cities, stakeholders, the bicycle community, and interested citizens. The 2011 Napa Countywide Bicycle Plan Update builds upon the efforts of the 2003 Plan and integrates new projects, partnerships, concepts, and programs. Public participation was an important component of the Countywide Bicycle Plan Update. The NCTPA and plan participants solicited public input on existing conditions for bicyclists, potential improvement projects and programs, and site-specific issues such as safety concerns, access, connectivity, bicycle parking, and other items needed to improve conditions for bicyclists in the Plan Area. The public participation process utilized an “advocacy” approach, where the general public and citizen representatives serving on advisory committees were instrumental in the development of a vision for bicycling in the community. The public participation process is summarized below.
• Project Steering Committee – A project steering committee comprised of local agency staff, citizen representatives, representatives from the Napa County Bicycle Coalition, Vine Trail Coalition, Napa

St. Helena Bicycle Plan Page 8 January 2012
County Safe Routes to Schools Program, Bay Trail Project, and Napa County Parks and Open Space, bicycle advocates, and others was established to oversee the development and progress of the Plan.
• Advisory Committee Meetings – The project consultant and NCTPA staff attended bicycle or other responsible advisory committee meetings in each participating jurisdiction to kick off the project, collect input on issues and opportunities, and develop a vision and goals for the project. A second round of advisory committee meetings was conducted to review draft plans and project and program proposals.
• Public Workshop #1 – The initial public workshop for the Bicycle Plan Update was held on Saturday, October 23, 2010, from 10:30 a.m. to 12:30 p.m. at the Yountville Community Center. Approximately 65 people attended the workshop, including local agency staff, elected officials, NCTPA board members, local bicycle advocates, and members of public. The purpose of the workshop was to collect input on issues, opportunities, and constraints throughout the Plan Area. Attendees were led through a series of small and large group exercises designed to solicit their input using a slide presentation, mapping exercise, issues discussion, and a visioning exercise.
• Staff Interviews – Members of local agency staff responsible for bikeway implementation and maintenance were interviewed to solicit their input on existing conditions, issues, opportunities, and constraints regarding Napa’s bikeway system and programs.
• Public Workshop #2 – Public Workshop #2 was held on Saturday, September 24, 2011, from 1:00 to 4:00 p.m. at New Technology High School in the City of Napa. Approximately 50 people attended the workshop, including local agency staff, elected officials, NCTPA board members, local bicycle advocates, and members of public. The purpose of the meeting was to give the public an opportunity to comment on the draft Bicycle Plan Update. The draft Plan was presented and attendees participated in group discussions and mapping exercises. Public comments were recorded and incorporated into the Bicycle Plan Update.
• City Council Hearings – In early 2012, the Plan will be presented to the City Council for review and adoption.

St. Helena Bicycle Plan Page 9 January 2012
Mode Split is a term that describes the number of trips or the percentage of travelers using a particular type of transportation, e.g., walking, bicycling, taking a bus, driving, etc.
Circulation and Mobility Framework for St. Helena
Draft St. Helena General Plan Update
Transportation planning in California is undergoing a broad transformation. A changing demographic, the growing movement to combat climate change, and an increasing focus on the public health benefits of biking and walking all highlight the need to provide greater choice in local and regional travel mode. Multimodal transportation and the integration of land use and transportation planning, while always important, are central components of this paradigm shift. These concepts are widely accepted as essential to creating lasting circulation and mobility improvements. As municipalities and agencies plan for change, individuals too seek to minimize travel costs, and learn more every day about how decreasing their reliance on the automobile can reduce their carbon footprint and improve their physical health and well-being. Mobility is no longer only about the private automobile and public transit. Increasingly, it is defined by how community members can use alternate modes of transportation efficiently. The size, topography and climate of St. Helena make it an ideal city for both walking and biking.
Setting and Context
Jurisdiction Overview Setting and Land Use
The City of St. Helena is located centrally in Napa County, in the heart of the upper Napa Valley, approximately 65 miles north of San Francisco. St. Helena is located on the western side of the valley floor along State Route (SR) 29 between Calistoga to the north and Yountville to the south. From its inception, St. Helena has served as a rural agricultural center. Over the years, with the growth and development of the wine industry, the City has become an important business center for the wine industry. St. Helena also serves as a commercial and business center for surrounding towns and unincorporated areas, including Calistoga, Angwin, Deer Park, Rutherford and the unincorporated area south of the City. St. Helena is a popular tourist destination, hosting visitors from all over the world who visit the area’s wineries, dine at acclaimed culinary destinations, shop on Main Street, and enjoy the area's scenic qualities.
St. Helena’s compact land use pattern, relatively low-volume network of grid streets, and developed sidewalk network, coupled with its relatively small land area and mostly flat geography, create many opportunities for residents and visitors to bicycle throughout the community. Residential housing and agriculture are the predominant land uses in St. Helena. General demographic and land use information are presented in Table 2. More information on issues, opportunities, constraints, and the benefits of bicycling, are presented in the NCTPA’s Countywide Overview.
Table 2 General Info – City of St. Helena
Total Population 1 6,010
Males 1, 2 45.90% 2,759
Females 1, 2 54.10% 3,251
Median Age 2 39.9
2035 ABAG Population Projections 3 6,300
Land Area 4 4.71 sq. mi
Average Population Density 1, 4 1,276.01 persons/sq. mi.
Elevation 4 257 feet
Source: 1 CADOF 2010 2 United States Census 2000 3 2035 ABAG Projections 4 City-data.com July 2008
Demographics and Commute Patterns
Demographics and travel information for St. Helena were analyzed to identify mode split and to evaluate travel time to work. The analysis

St. Helena Bicycle Plan Page 10 January 2012
establishes base data on the existing number of bicycle commuters, and also provides an indication of the number of potential bicycle commuters in the Plan area. This information can then be used by staff and local officials to develop improvement plans and set priorities, with the objective of increasing the percentage of people who choose to bicycle rather than drive a car or be driven.
A review of available demographic and commute statistics was performed in order to better understand the level of bicycling in St. Helena and Napa County as a whole. Several data sources were reviewed, including California Department of Finance Population Estimates, the Bay Area Travel Survey, and Journey-to-Work (JTW) Data from the US Census Bureau.
Every ten years the US Census Bureau attempts to count every person throughout the nation. As part of this survey process, the agency collects information on the primary mode of transportation used by employed people over the age of 16 to get to work. The collective responses to the Census Bureau’s question “How did you usually get to work last week?” form a set of data known as Journey-to-Work (JTW). JTW data is considered the most reliable source of transportation mode choice information available. However, while the JTW provides a glimpse of how St. Helena residents travel to and from work, the data source only provides a partial understanding of the travel characteristics of bicyclists in St. Helena. This is particularly true since it does not reflect multi-modal or non-work trips. For example, survey respondents who typically use more than one method of transportation are instructed to mark the mode used for “most of the distance,” thus overlooking bicycling and walking trips to transit. For commuters who do not use the same mode every day, the survey wording leaves the response up to the respondent; and the survey takes place in the month of March, which can be rainy in Napa County and a deterrent to bicycling. Further, the JTW data does not include school, shopping, and recreational trips, which constitute much of the bicycle and pedestrian travel by St. Helena’s student and senior populations, and others including tourists.
The 2010 California Department of Finance Population Estimates indicates that St. Helena has a population of 6,010 persons. Population Projections from the Association of Bay Area Governments anticipate that St. Helena will add approximately 300 residents by the year 2035. According to the 2000 US Census, (the most current Census for which data is available) there were 2,797 workers in St. Helena 16 years old or older. Of these, 2,527 work outside the home. Fifty percent, or 1,393 workers, have a travel time to work of 15 minutes or less. This is higher than the average rates for the state and nation, which are at 25 percent and 30 percent respectively. This data indicates that a substantial portion of the City’s workers are employed in the community. Travel time to work in St. Helena is shown in Table 3.
As shown in Table 4, JTW data indicates that 69 percent of workers in St. Helena, or 1,901 persons, drive to work alone. Approximately 0.25 percent (7 persons) commute by bicycle, a rate that is significantly lower than the Countywide and statewide average bicycle mode shares, which average around 0.8 percent, and lower than the national average of 0.4 percent. About 7.2 percent (198 persons) of work trips are taken on foot, the third highest rate in the County behind Calistoga and the unincorporated County, and more than twice the statewide average. While approximately 13 percent of workers in St. Helena (359 persons) carpool, the majority of workers drive to work alone. Given St. Helena’s climate, topography, and percentage of commuters with a travel time to work of 15 minutes or less compared to the number
Table 3 2000 US Census – Travel Time to Work for St. Helena
Total Employed Persons 100.00% 2,748
Worked at home 8.04% 221
Less than 15 minutes 50.69% 1,393
15 to 29 minutes 19.72% 542
30 to 44 minutes 13.21% 363
45 or more minutes 8.33% 229
Did not work at home: 91.96% 2,527
Source: United States Census 2000

St. Helena Bicycle Plan Page 11 January 2012
of existing bicycle and pedestrian commuters, a significant opportunity exists to achieve a greater bicycle mode split. Every motor vehicle trip or vehicle mile traveled that is eliminated results in less air pollution, reduced green house gas emissions, and lessened traffic congestion.
Table 4 2000 US Census – Mode Split Data for St. Helena
St. Helena Napa County California
Population (2000 US Census) 5,950 124,279 33,871,648
Employed persons 16 years of age + 2,797 58,501 14,525,322
Mode Split Percent Number Percent Number Percent Number
Mode Split 100.00% 2,748 100.00% 57,393 100.00% 14,525,322
Drove Alone 69.18% 1,901 72.65% 41,698 71.82% 10,432,462
Bike 0.25% 7 0.83% 479 0.83% 120,567
Walk 7.21% 198 4.14% 2,378 2.85% 414,581
Public Transit 1.31% 36 1.40% 803 5.07% 736,037
Carpool 13.06% 359 14.84% 8,519 14.55% 2,113,313
Motorcycle 0.00% 0 0.22% 127 0.25% 36,262
Other 0.95% 26 0.83% 474 0.79% 115,064
Worked at Home 8.04% 221 5.08% 2,915 3.83% 557,036
Source: United States Census 2000
Visitors and Tourism
Visitors are another important existing and future user group. The Napa Valley is renowned as a grape growing region making it an international tourist destination. Aside from its scenic qualities, wineries, spas, and restaurants, the Napa Valley is known for its temperate climate, making it ideal for walking and bicycling. The area was one of the first to attract bicycle touring groups, and continues to draw residents and visitors committed to an active lifestyle. Bicycle adventure tourists are a match for the Napa Destination Council’s Targeted Visitor Profile. Other studies have shown that with safe bicycle/pedestrian trails such as the Vine Trail, cycle tourists stay longer, spend more and participate in more activities than non-cycle tourists, including in the shoulder seasons. Ongoing surveys among visitors continue to indicate that bicycling is one of the top 10 reasons tourists choose Napa Valley as their destination.
For several years, the Napa Valley Vine Trail Coalition has been working on developing a 44-mile continuous, Class 1 trail from Vallejo to Calistoga, including an alignment through the City of St. Helena and its Downtown. Parts of the trail will soon be under design. The organization identified the importance of such a trail in providing transportation options, tourism opportunities and to enhance the quality of life for residents throughout the Napa Valley. The trail will offer transportation, recreation, education and healthy lifestyle benefits to residents and the 4.7 million visitors who come to the Valley each year while potentially replacing the need for 150,000 automobile trips in the process. As it provides these benefits, the Vine Trail is expected to generate $75 million per year in ongoing economic impact as well as providing jobs for 60 people per mile built during construction. The Greenway Feasibility Study projected over 3 million uses per year of a completed regional Vine Trail with about half being residents; half visitors.
St. Helena Bicycle Plan Page 12 January 2012
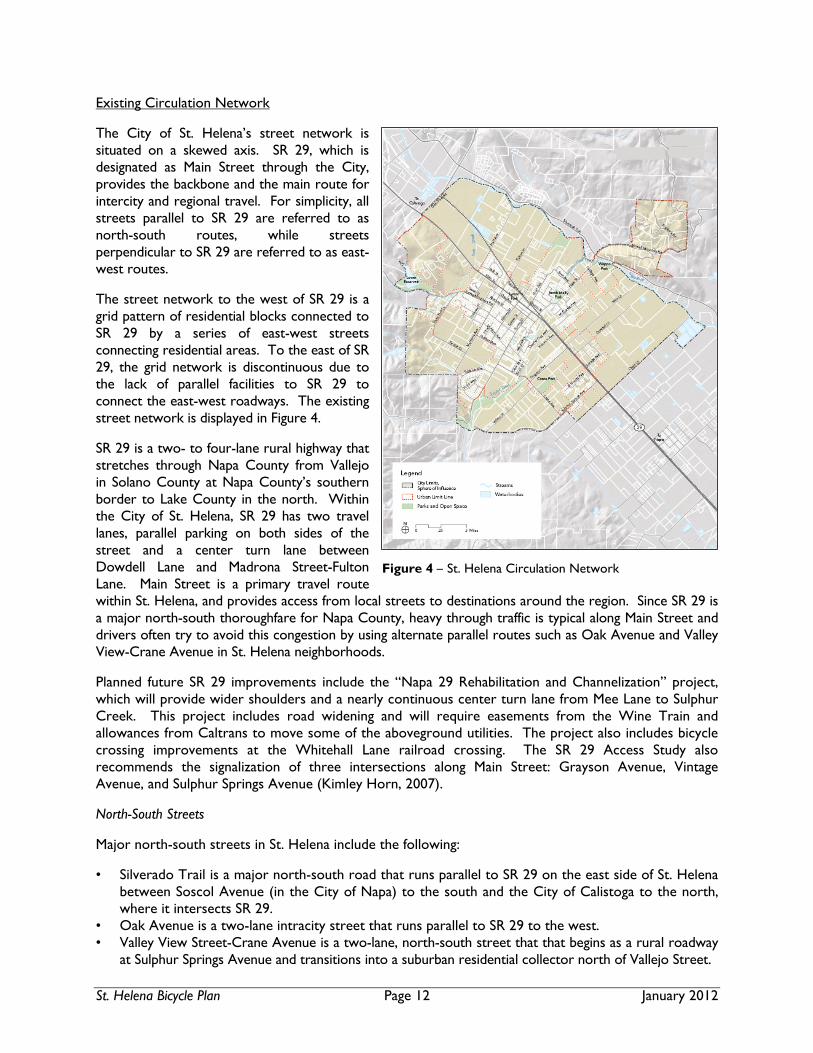
Existing Circulation Network
The City of St. Helena’s street network is situated on a skewed axis. SR 29, which is designated as Main Street through the City, provides the backbone and the main route for intercity and regional travel. For simplicity, all streets parallel to SR 29 are referred to as north-south routes, while streets perpendicular to SR 29 are referred to as east-west routes.
The street network to the west of SR 29 is a grid pattern of residential blocks connected to SR 29 by a series of east-west streets connecting residential areas. To the east of SR 29, the grid network is discontinuous due to the lack of parallel facilities to SR 29 to connect the east-west roadways. The existing street network is displayed in Figure 4.
SR 29 is a two- to four-lane rural highway that stretches through Napa County from Vallejo in Solano County at Napa County’s southern border to Lake County in the north. Within the City of St. Helena, SR 29 has two travel lanes, parallel parking on both sides of the street and a center turn lane between Dowdell Lane and Madrona Street-Fulton Lane. Main Street is a primary travel route within St. Helena, and provides access from local streets to destinations around the region. Since SR 29 is a major north-south thoroughfare for Napa County, heavy through traffic is typical along Main Street and drivers often try to avoid this congestion by using alternate parallel routes such as Oak Avenue and Valley View-Crane Avenue in St. Helena neighborhoods.
Planned future SR 29 improvements include the “Napa 29 Rehabilitation and Channelization” project, which will provide wider shoulders and a nearly continuous center turn lane from Mee Lane to Sulphur Creek. This project includes road widening and will require easements from the Wine Train and allowances from Caltrans to move some of the aboveground utilities. The project also includes bicycle crossing improvements at the Whitehall Lane railroad crossing. The SR 29 Access Study also recommends the signalization of three intersections along Main Street: Grayson Avenue, Vintage Avenue, and Sulphur Springs Avenue (Kimley Horn, 2007).
North-South Streets
Major north-south streets in St. Helena include the following:
• Silverado Trail is a major north-south road that runs parallel to SR 29 on the east side of St. Helena between Soscol Avenue (in the City of Napa) to the south and the City of Calistoga to the north, where it intersects SR 29.
• Oak Avenue is a two-lane intracity street that runs parallel to SR 29 to the west. • Valley View Street-Crane Avenue is a two-lane, north-south street that that begins as a rural roadway
at Sulphur Springs Avenue and transitions into a suburban residential collector north of Vallejo Street.
Figure 4 – St. Helena Circulation Network

St. Helena Bicycle Plan Page 13 January 2012
East-West Streets
Major east-west streets in St. Helena include the following:
• Pratt Avenue is a two-lane street that connects Main Street to Silverado Trail on the north side of the City. Pratt Avenue provides access to both residential and winery uses, but lacks any north-south connections other than Main Street and Silverado Trail.
• Pope Street is a two-lane street that runs parallel to Pratt Avenue (to the south) and connects Main Street and downtown St. Helena to Silverado Trail. Pope Street also provides access to suburban residential neighborhoods on the east side of Main Street.
• Madrona Street-Fulton Lane is a two-lane, east-west street. To the west of Main Street, Madrona Street provides access to residential neighborhoods and to Spring Mountain Road, a regional connection to the City of Santa Rosa in Sonoma County. To the east of Main Street, Madrona becomes Fulton Lane which provides access to commercial and residential areas.
• Adams Street and Spring Street are both downtown streets that primarily provide access to the residential neighborhoods on the west side of the city.
• Dowdell Lane is a two-lane street to the east of Main Street that provides access to a variety of agricultural and industrial uses located in the southeastern quadrant of the city.
• Sulphur Springs Avenue is two-lane street on the southern edge of the city that provides access to a variety of commercial and rural residential uses.
Other Streets
In addition to streets listed above, there are a number of local streets with low traffic speeds and volumes that provide direct access to abutting land uses.
Coordination and Consistency with Existing Plans and Policies
There are a number of federal, state, regional, and local plans, policies and standards that govern bikeway development. Preparation of the Bicycle Plan included an extensive review of the pertinent planning documents and policies. Brief summaries of these relevant efforts are provided in Appendix A. The Bicycle Plan update was undertaken in context with the policies and standards of the following documents resulting from local efforts.
• Revised Draft General Plan Update 2030 – Circulation Element, City of St. Helena, 2010 • Revised Draft General Plan Update 2030 – Parks & Recreation Element, City of St. Helena, 2010 • Revised Draft General Plan Update 2030 – Open Space and Conservation Element, City of St. Helena, 2010
Vision, Goals, Objectives and Policies
The following vision, goal, objectives, and common policies are meant to function as a mutually agreed upon framework applicable to both the primary countywide bicycle system and St. Helena’s local bicycle Plan. The policies are designed to guide the development and maintenance of a bicycle system throughout Napa County and express the intent of St. Helena, the NCTPA, and its member agencies to enhance bicycle mobility and to improve safety, access, traffic congestion, air quality, and the quality of life throughout Napa County for residents, workers and visitors. In addition to common policies that are mutually agreed to, local policies and implementing programs are included that address issues in St. Helena and complement the common policies.
It is important to note that as projects advance or are developed, local and countywide bicycle policies should be referenced to ensure that both private development and public works projects are consistent with the mutually agreed upon countywide policies, and that plans and development projects in St. Helena implement the full measures of the bicycle plan elements. The common countywide policies were a focal point of the Bicycle Plan effort and appear in the Overview Section of the plan as well.

St. Helena Bicycle Plan Page 14 January 2012
Definitions
For context, definitions of terms used in this report are provided below.
• Bicycle “System” – the whole of all of the components, including both physical and programmatic.
• Bicycle “Network” – the physical improvements that establish bikeways (Class I, II, or III routes).
• Goal – the destination or where we want to be at the end of the planning journey. Goals are usually broad, optimistic and expressive of a long-term vision.
• Objective – mileposts along the way to achieving the goals. They are specific, measurable steps to be achieved if the overall goals are to be met.
• Policy – a principle or rule to guide decisions by the local agency with regard to a particular issue or set of issues.
• Program – a specific action to accomplish the policy or objective.
Bicycling Vision for the Region
A comprehensive, connected bicycle system is established through supportive development patterns and programmatic practices, providing people with safe, convenient and enjoyable access throughout all Napa County jurisdictions and to destinations beyond. Bicycling is common for everyday trips and recreation, contributing to the quality of life in Napa and the health, safety and welfare of its residents, workers and visitors. Napa is known as a bicycle friendly community with a “world class” bicycling system.
Principal Goal: To develop and maintain a safe and comprehensive countywide bicycle transportation and recreation system that provides access, opportunities for healthy physical activity, and reduced traffic congestion and energy use. Policies, programs and projects work together to provide safe, efficient and enjoyable opportunities for bicyclists of all types, ages, and abilities to access public transportation, school, work, recreation areas, shopping and other activity centers, and residential neighborhoods, and to connect Napa jurisdictions to each other and the region.
Countywide Objectives
Objective 1.0: The Countywide Bicycle Network
Establish a comprehensive, safe, connected countywide bicycle transportation and recreation system to support increases in bicycle trips made throughout the County to 10 percent of all trips by 2035.
Policies
1.1 Develop and maintain a local and countywide bicycle transportation and recreation network that connects Napa’s neighborhoods and communities, and provides access to public transportation, school, work, recreation areas, shopping and other activity centers, and to regional routes according to the maps and recommendations in this plan. [NCTPA, cities, towns, County]
Local Mode Split Goal
The Draft St. Helena General Plan Update Circulation Element Policy CR3.3 states: “Shift travel from single-occupancy vehicles to other modes so that by 2030, 45 percent of work trips by St. Helena residents and workers are by carpool, transit, walking or bicycling.”
Commute Mode Split Targets for 2030
Mode Commute Trips by Workers To and From
St. Helena
2000 2030 Goal
Drove alone 69.2% N/A
Carpooled 13.1% At least 20%
Transit 1.3% At least 5%
Bicycle 0.3% At least 10%
Walked 7.2% At least 10%
Other means (inc. work at home)
8.9% N/A
Source: US Census Bureau, 2000

St. Helena Bicycle Plan Page 15 January 2012
Summaries of Federal, State, and Regional policies regarding the importance and consideration of non-motorized modes are provided in Appendix A.
1.2 Develop and maintain continuous north-south and east-west Class I pathways to provide inter-city connections and serve as primary bikeways in the Countywide Bikeway System. [NCTPA, cities, towns, County]
1.3 Consistent with federal, state and regional directives for “routine accommodation and complete streets”1, ensure that all transportation projects on designated bicycle routes include, enhance or maintain bicycle transportation facilities. [NCTPA, cities, towns, County]
1.4 Seek opportunities to work cooperatively with all responsible departments and agencies (for example, transportation agencies, flood districts, utility agencies, parks and open space districts) to close existing gaps in facilities and ensure the network is funded, designed, constructed, and maintained. [NCTPA, cities, towns, County]
1.5. Consider the needs of all types of bicyclists (commuters, recreational riders, children, and families) in planning, developing, and maintaining a bikeway network that is safe and convenient. [NCTPA, cities, towns, County]
1.6 Establish and/or maintain local and countywide bicycle advisory committees to advise staff on bicycle network issues. [NCTPA, cities, towns, County]
St. Helena Policies/Programs
SH-1.a Develop and adopt a citywide bicycle and pedestrian master plan to improve bicycle and pedestrian safety, and to encourage community members to walk and bike more often. Build on St. Helena’s existing partnership with the Napa County Transportation and Planning Agency (NCTPA) to ensure that the City’s master plan is consistent with countywide transportation planning efforts. (CR2.A)
SH-1.b Create a comprehensive bicycle and pedestrian network that enhances neighborhood connectivity. Develop the system consistent with the network identified in the City’s General Plan Circulation Element to expand and improve the pedestrian and bikeway system. (CR2.1)
SH-1.c Increase the City’s share of walking, bicycling, transit and carpooling trips, in accordance with NCTPA 2035 goals. As a major part of this effort, the City will continue to develop and maintain a safe and integrated bicycle and pedestrian system throughout St. Helena for people of all ages and abilities.
SH-1.d Provide a complete bicycle and pedestrian network between residential areas, downtown and other major activity centers identified by the City.
SH-1.e Reduce transportation-based GHG emissions from City-controlled sources by employing the following strategies: Complete the City’s bicycle and pedestrian network, which will increase transportation choices in the City and reduce the demand for vehicle travel. (CR1.8)
SH-1.f Work with Caltrans to ensure regional coordination and manage congestion on SR 29. (CR1.L)
1 US DOT Policy Statement: Integrating Bicycling and Walking into Transportation Infrastructure, 2000; Assembly Concurrent Resolution 211, 2002; Caltrans Deputy Directive 64, 2001; Caltrans Director’s Policy 22 (Director’s Policy on Context Sensitive Solutions), 2001; Metropolitan Transportation Commission Resolution No. 3765, (Routine Accommodations), 2006

St. Helena Bicycle Plan Page 16 January 2012
European Design
European cities employ a variety of bikeway designs generally known as “Cycle Tracks” that protect or separate bikeways from vehicle traffic where possible. These engineering efforts combined with a comprehensive approach to safety, encouragement, and awareness have helped to establish mode split rates with up to 40 percent of all trips made by bicycle. Where appropriate, similar practices should be tested or employed to determine if significant mode split shifts can be achieved within the Napa Valley.
SH-1.g Ensure convenient public access between developed areas and stream corridors by providing access at frequent intervals. (OS2.4)
Objective 2.0: Design
Utilize accepted design standards and “best practices” to facilitate completion of a connected bicycle system that is safe, convenient and enjoyable to use.
Policies
2.1 Utilize Chapter 1000, "Bikeways Planning and Design," of the California Highway Design Manual, the California Manual of Uniform Traffic Control Devices, and the American Association of State Highway Transportation Officials (AASHTO) Guide for the Development of Bicycle Facilities, as well as evolving “best practices” for the development of bicycle facilities. [NCTPA, cities, towns, County]
2.2 Consistent with Assembly Bill 1581 (Fuller) and Caltrans Policy Directive 09-06, assure that all approaches to signalized intersections include bicycle detection devices that are operational and properly marked. [NCTPA, cities, towns, County]
2.3 Provide consistent enhanced crossing features at uncontrolled intersections with Class I multi-use paths. [NCTPA, cities, towns, County]
2.4 Where standard Class II bike lanes are infeasible under current conditions, local jurisdictions shall consider innovative approaches to safely accommodate bicycles. (Approaches may include but are not limited to: striped edge lines, signs, shared lane markings, reduced lane widths, “road diets,” eliminating parking, etc.) [NCTPA, Caltrans, cities, towns, County]
2.5 Install way-finding signage, markers, and stencils on off-street paths, on-street bikeways, local Class III routes, and State Routes to improve way finding for bicyclists, assist emergency personnel, and heighten motorists’ awareness. [NCTPA, Caltrans, cities, towns, County]
2.6 Improve safety and access for bicyclists at all at-grade railroad crossings by providing appropriate enhancements such as proper track structure, safe crossing angles, track fillers, lighting, and adequate warning and guidance information among other features. [NCTPA, Caltrans, cities, towns, County]
St. Helena Policies/Programs
SH-2.a Provide complete streets that balance the diverse needs of users of the public right-of-way, in accordance with the California Complete Streets Act of 2008. (CR1.2)
SH-2.b Develop guidelines for the design, construction and maintenance of bicycle and pedestrian paths in St. Helena. Coordinate the guidelines with Napa County or regional trail connections. (CR2.B)
St. Helena Bicycle Plan Page 17 January 2012
Objective 3.0: Multimodal Integration
Develop and enhance opportunities for bicyclists to easily access public transit and other transportation resources.
Policies
3.1 Require transit providers to provide and maintain convenient and secure bike parking facilities and related amenities at major transit stops and transportation centers. [NCTPA, cities, towns, County]
3.2 Require local and regional transit agencies to accommodate bicycles on all transit vehicles that serve the general public. [NCTPA]
3.3 Plan for additional bicycle storage capacity on transit vehicles to ensure capacity keeps up with demand. [NCTPA]
3.4 Consider a “Safe Routes to Transit” program that prioritizes bicycle and pedestrian access to transit stops and centers. [NCTPA, cities, towns, County]
3.5 Encourage the development of “staging areas” as a component of trail development and other bikeway projects where appropriate to accommodate recreational bicycling needs. [NCTPA, cities, towns, County]
3.6 Develop strategies and work with private landowners/businesses to provide bicycle parking at strategic locations. [NCTPA, cities, towns, County, NCBC]
St. Helena Policies/Programs
SH-3.a Continue to support NCTPA in the provision of convenient transit, including regional and local service. Support more frequent and reliable transit service between communities to reduce the number of people traveling to or from St. Helena to work by private vehicle. Promote and encourage use of the St. Helena Vine Shuttle. (CR1.6)
Objective 4.0: Comprehensive Support Facilities
Ensure development of comprehensive support facilities for bicycling such as short- and long-term bicycle parking, end of trip amenities, bicycle staging areas, repair stations, and other resources such as bicycle maps, guide information, and on-line tools.
Policies
4.1 Require adequate short-term (i.e. bike racks) and long-term (i.e. bike lockers) bicycle parking for non-residential uses as required in local standards. Nonresidential uses include private commercial and industrial uses, as well as hospitals, clinics, gyms, parks and other civic facilities. [Cities, towns, County]
4.2 Provide adequate short-term bicycle parking and long-term bicycle storage for transportation centers including transit transfer centers, park-and-ride lots, train stations, transit stops, etc. [NCTPA, Caltrans, cities, towns, County]
4.3 Work with businesses and private property owners to provide bicycle parking at existing employment, retail, and commercial sites. [NCTPA, cities, towns, County]
4.4 Encourage employers to provide secure indoor and/or covered bicycle parking for their employees. [Cities, towns, County]

St. Helena Bicycle Plan Page 18 January 2012
4.5 Encourage major employers to provide shower and locker facilities for workers. [Cities, towns, County]
4.6 Encourage local school district to provide well located, secure bicycle parking at schools. [NCTPA, cities, towns, County]
4.7 Design Class 1 paths to incorporate pedestrian scale lighting, street furniture, drinking fountains, wayfinding signage, interpretive elements, high-visibility crossing treatments, and other amenities where appropriate. [NCTPA, cities, towns, County]
St. Helena Policies/Programs
SH-4.a Ensure secure, accessible and convenient bicycle parking facilities throughout St. Helena, including downtown, commercial areas, schools and parks. (CR2.3)
SH-4.b Consider the feasibility of a citywide bike sharing program for municipal and/or public use. (CR2.K)
Objective 5.0: Safety and Security
Create a countywide bicycle system that is perceived to be safe for bicyclists of all types and age groups, and work to reduce collisions involving bicyclists by 50 percent by the year 2035. (Use 2008 collision data as the baseline for analysis and perform periodic progress evaluations at 5-year intervals to benchmark progress.)
Policies
5.1 Coordinate the delivery of bicycle Safety Education Programs to schools utilizing assistance from law enforcement agencies, bicycle advocacy groups, local bicycle shops, Napa County Office of Education, Napa County Health and Human Services, and other appropriate organizations. [NCTPA, cities, towns, County, NCBC]
5.2 Focus on improving safety at intersections by using or installing routine pedestrian signal cycles; pedestrian push buttons; high-visibility crosswalk markings; appropriate warning and directional signs; and reassurance or directional markings for bicyclists such as shared lane markings, skip lines, etc.; and through the use of focused education.
5.3 Focus on improving safety at railroad crossings by providing safe track crossing angles for bicyclists, using concrete panels and flangeway fillers to avoid surface irregularities, and through the use of quad crossing gates and warning signs. [Caltrans, cities, towns, County, Napa Wine Train]
5.4 Safety improvements in the vicinity of schools, major public transit hubs, civic buildings, shopping centers, and other community destinations shall be given a high priority for implementation. [NCTPA, Caltrans, cities, towns, County]
5.5 Improve ongoing collection and analysis of collision data to assist in the identification of problem areas which may require immediate attention. [Cities, towns, County]
5.6 Promote targeted enforcement of violations that focus on primary collision factors such as riding on the wrong side of the road, riding without proper safety equipment including lights at night, and right-of-way violations, etc.
St. Helena Policies/Programs
SH-5.a Ensure adequate maintenance of transportation facilities such as streets and multi-use paths.

St. Helena Bicycle Plan Page 19 January 2012
Emphasize safety considerations, impacts on non-automobile modes of travel and overall impact on long-term resource needs as maintenance priorities. (CR4.1)
SH-5.b Ensure safety on residential neighborhood streets to promote walking and bicycling and preserve neighborhood livability. (CR4.2)
SH-5.c Continue efforts to calm traffic, and minimize traffic volumes and speeds in residential areas. (CR4.3)
SH-5.d Improve traffic safety and encourage walking and bicycling trips to St. Helena schools through a Safe Routes to School program. (CR4.5)
Objective 6.0: Land Use
Support and strengthen local land use policies for compact, mixed use development in appropriate areas, and for designing and constructing bicycle facilities in new development projects.
Policies
6.1 Consistent with federal, state, and regional directives for “routine accommodation and complete streets,” condition discretionary projects to provide needed bicycle improvements on Class I, II or III routes designated in this plan, assuming a nexus is established. Improvements include easements or land dedication and route construction, maintenance or enhancement, including support facilities. Construction may be deferred until a connection to an existing route can be made at the discretion of the jurisdiction. [Cities, towns, County]
6.2 In accordance with CEQA Guidelines, projects that could result in the loss of existing bicycle facilities or jeopardize future facilities included in this Plan must be mitigated.
6.3 Encourage school districts to participate in providing safe and continuous bicycle and pedestrian connections from surrounding neighborhoods when constructing new or improving existing school facilities. [NCTPA, cities, towns, County]
St. Helena Policies/Programs
SH-6.a Develop and adopt an ordinance that requires any new development and re-use projects to provide bicycle and pedestrian improvements and amenities. (CR2.C)
SH-6.b Obtain easements or title to land along Sulphur Creek, York Creek and the Napa River. (PR6.D)
SH-6.c Preserve open space for recreational uses, including a bicycle and pedestrian trail system along creek corridors when compatible with riparian vegetation and wildlife habitat. Where possible, integrate stream corridors with trails and other recreational open space, provided that the vegetation, habitat value and water quality is not significantly impacted. (OS2.3)
Objective 7.0: Education and Promotion
Develop programs and public outreach materials to promote safety and the positive benefits of bicycling.
Policies
7.1 Develop and implement a multimedia countywide bicycle and pedestrian safety and education campaign to increase knowledge of riding rules, improve etiquette between motorized and non-motorized modes, to promote bicycle tourism, and increase the awareness of the benefits of

St. Helena Bicycle Plan Page 20 January 2012
bicycling and walking as transportation modes. [NCTPA, cities, towns, County – potentially jointly]
7.2 Expand the delivery of Safe Routes to Schools curriculum to all elementary and middle schools annually. [NCTPA, cities, towns, County, School Districts, NCBC]
7.3 Educate law enforcement personnel, agency staff, elected officials, and school officials about the benefits of non-motorized transportation, and the safety needs of bicyclists and pedestrians. [NCTPA, cities, towns, County, School Districts, NCBC]
7.4 Develop and maintain a public bikeway map and user guide that provides bike route, education, safety, and promotional information. [NCTPA, cities, towns, County- potentially jointly]
7.5 Distribute bicycle and pedestrian safety, educational, and promotional materials at drivers training and citation diversion programs, school orientations and community and civic events. [NCTPA, cities, towns, County, law enforcement agencies, schools, advocacy organizations]
7.6 Encourage events that introduce the public to bicycling and walking such as bike-to-work, commuter challenges, bike/walk-to-school days, elected official bike rides, etc. [NCTPA, cities, towns, County, schools, advocacy organizations]
7.7 Encourage major employment centers and employers to facilitate commuting by bicycle, including the use of flex-time work schedules to support non-rush hour bicycle commuting. [NCTPA, cities, towns, County, advocacy organizations]
St. Helena Policies/Programs
SH-7.a Promote walking and bicycling as safe and convenient modes of transportation. (CR2.2)
SH-7.b Encourage walking and bicycling trips to St. Helena schools. (CR2.6)
SH-7.c Provide incentives and encourage existing major employers to develop and implement transportation demand management (TDM) programs to increase the number of people who bike and walk to work and reduce peak-period trip generation. (CR3.1)
SH-7.d Work with the wine and hospitality industries to manage congestion and create and promote car-free tourism services. (CR3.4)
Objective 8.0: Planning
Continue to update and integrate bicycle-related transportation, land use, and recreation plans and improvement projects.
Policies
8.1 The countywide and/or local Bicycle Advisory Committee (BAC) shall be responsible for advising staff and decision makers on planning and policy development for, coordination and implementation of the countywide bicycle transportation system. [County, city and town BACs]
8.2 Update and adopt the Bicycle Plan in accordance with the California Bicycle Transportation Act, and to coordinate with Regional Transportation Plan updates. [NCTPA, County, participating cities and towns]
8.3 Participating jurisdictions shall update their general plans to incorporate the key contents of this Bicycle Plan. [County, participating cities and towns]

St. Helena Bicycle Plan Page 21 January 2012
8.4 Use local commissions and/or the Countywide BAC as a resource to review roadway improvement projects on designated bicycle routes, for bicycle safety and compatibility and consistency with this plan. “Roadway improvements” include widening, resurfacing, rehabilitation, capacity improvements, traffic calming improvements, rumble strips, etc. Note that MTC’s Regional Bicycle Plan for the San Francisco Bay Area recommends that local agencies form and maintain Advisory Committees to advise staff on bicycle and pedestrian issues. [NCTPA, cities, towns, County]
8.5 Proactively seek new opportunities for acquisition of abandoned rights-of-way, natural waterways, flood control rights-of-way, utility rights-of-way, and other lands for the development of new Class I multi-use pathways that integrate with the planned system. [NCTPA, cities, towns, County]
8.6 Recognize the varied needs of bicyclists by striving to maintain on-street bikeways where off street pathways or alternative routes are proposed. Existing bikeways should not be altered or eliminated without consulting local bicycle advisory committees. [NCTPA, cities, towns, County]
8.7 NCTPA and local jurisdictions are encouraged to assign staff to assume bicycle coordination duties to oversee implementation of the Countywide Bicycle Plan and coordinate activities between affected departments and jurisdictions. [NCTPA, cities, towns, County]
St. Helena Policies/Programs
SH-8.a Use performance measures that consider all road users to determine transportation impacts of new development. (CR1.4)
SH-8.b Avoid mitigation measures that negatively impact the walking and bicycling environment and encourage driving, such as roadway and intersection widenings. (CR1.5)
SH-8.c Establish a multimodal transportation impact fee program to finance and implement project mitigations that help achieve GHG reduction goals. As part of the impact fee program, require new development to manage citywide travel demand and finance and construct all off-site circulation improvements necessary to reduce the severity of cumulative transportation impacts to all modes of travel. (CR1.11)
SH-8.d Identify streets that should become “more complete,” through consideration of transit priorities, sidewalk gap closures, new bikeways and vehicle traffic calming measures. (CR1.C)
SH-8.e Ensure that any new land use development provides a continuous path of travel for walking and bicycling from the development site to the center of downtown and other key destinations, as determined by the City. Determine appropriate bicycle and pedestrian routes based on street typologies and the proposed bicycle and pedestrian network. If a path of travel is not continuous, require development to construct improvements and/or contribute to the transportation mitigation fee program. (CR1.J)
SH-8.f Regularly monitor progress toward increasing the number of residents and workers walking, biking and using public transit, in order to achieve the mode split targets outlined in the General Plan. (CR3.C)
SH-8.g Prioritize and implement improvements to the circulation system, including street extensions, bicycle and pedestrian improvements, and expanded transit service. (CR6.1)

St. Helena Bicycle Plan Page 22 January 2012
SH-8.i Require concurrent infrastructure development for any new development projects that have impacts on the circulation system, including streets, paths, trails, sidewalks and public transit. (CR6.2)
Objective 9.0: Maintenance
Maintain and/or improve the quality, operation, and integrity of bicycle infrastructure.
Policies
9.1 Maintain Class I paths, and maintain geometry, pavement surface condition, debris removal, markings, and signage on Class II and Class III bikeways to the same standards and condition as the adjacent motor vehicle lanes. [Cities, towns, County]
9.2 Develop or retain a maintenance reporting system with a central point of contact to report, track, and respond to routine bicycle maintenance issues in a timely manner. [NCTPA, NCBC, cities, towns, County]
9.3 Require that road construction projects minimize their impacts on bicyclists by avoiding placement of construction signs and equipment in bicycle lanes, and by providing adequate detours. [Caltrans, cities, towns, County]
9.4 Consider bicycle safety in the routine maintenance of local roads and seek to, at a minimum, include the following activities [Caltrans, cities, towns, County]: • Trim vegetation to provide a minimum horizontal clearance of two feet from the edge of
pavement and a minimum vertical clearance of eight feet. • Clear debris from road shoulder areas to provide a clean surface for bicycling.
St. Helena Policies/Programs
SH-9.a Develop a maintenance and operations plan for the City's trail network. Provide a high level of service to users by preventing deterioration, encroachment of vegetation, vandalism and crime. Consider including an Adopt-a-Trail program, and invite local businesses to participate in trail maintenance. Include a funding program to support the plan. (PR6.F)
Objective 10.0: Funding
Work to maximize the amount of funding to implement bicycle projects and programs throughout the county.
Policies
10.1 Seek varied sources of funding, including but not limited to federal, state, and regional programs, partnerships with local non-profits and other local agencies, and local sources such as assessments to improve the bicycle system. [NCTPA, cities, towns, County]
10.2 Encourage multi-jurisdictional funding applications to implement the primary network and countywide bicycle system. [NCTPA, cities, towns, County]
10.3 Promote the availability of adequate regional, state and federal funding sources for bicycle transportation projects. [NCTPA, NCBC, cities, towns, County]
St. Helena Policies/Programs
SH-10.a Pursue appropriate funding for the development of a balanced transportation system. (CR1.3)

St. Helena Bicycle Plan Page 23 January 2012
SH-10.b Fund transportation improvements through a citywide, multimodal transportation mitigation fee program. The mitigation fee program will emphasize transportation improvements that reduce citywide automobile trips, including completing the bicycle and pedestrian network, implementing transportation demand and systems management strategies, and improving traffic signal coordination on SR 29. Ensure that fees are proportional to a development’s contribution to changes in net new automobile trips and change in travel time along SR 29. (CR1.K)
SH-10.c Identify and pursue funding opportunities for bicycle projects on the local, state and federal levels. (CR2.D)
SH-10.d Pursue state and federal grant opportunities to fund a Safe Routes to School program. (CR2.J)

St. Helena Bicycle Plan Page 24 January 2012
Bicyclists and Bicycle Facilities
Operation of Bicycles/Rules of the Road
In California, the California Vehicle Code (VC) is the set of traffic laws that govern the behaviors of vehicle drivers. VC 231 defines a bicycle as “a device upon which any person may ride, propelled exclusively by human power through a belt, chain, or gears and having one or more wheels.” The VC does not define bicycles as vehicles, but states that persons riding bicycles have all the rights and responsibilities of the drivers of vehicles (Division 11, “Rules of the Road”). Additionally, the VC includes several sections specific to bicyclists. In general, bicyclists are required to ride according to the basic traffic laws that all drivers follow including but not limited to the following:
• Drive on the right-hand side of the roadway • Obey traffic control devices (signs, signals) • Yield to cross traffic • Yield when changing lanes
Duty of Bicycle Operator: Operation On Roadway (VC 21202)
a) Any person operating a bicycle upon a roadway at a speed less than the normal speed of traffic moving in the same direction at such time shall ride as close as practicable to the right-hand curb or edge of the roadway except under any of the following situations:
• When overtaking and passing another bicycle or motor vehicle proceeding in the same direction.
• When preparing for a left turn at an intersection or into a private road or driveway. • When reasonably necessary to avoid conditions (including, but not limited to, fixed or moving
objects, vehicles, bicycles, pedestrians, animals, surface hazards, or substandard width lanes) that make it unsafe to continue along the right-hand curb or edge. For purposes of this section, a "substandard width lane" is a lane that is too narrow for a bicycle and a vehicle to travel safely side by side within the lane.
b) Any person operating a bicycle on a one-way street or highway with two or more marked traffic lanes, may ride as near the left-hand curb or edge of such roadway as practicable.
Permitted Movements from Bicycle Lanes (VC 21208)
a) Whenever a bicycle lane has been established on a roadway, any person operating a bicycle upon the roadway at a speed less than the normal speed of traffic moving in the same direction shall ride in the bicycle lane, except under the following situations.
• When overtaking or passing another bicycle, vehicle, or pedestrian within the lane or about to enter the lane if such overtaking and passing cannot be done safely within the lane.
• When preparing for a left turn at an intersection or into a private road or driveway. • When necessary to leave the lane to avoid debris or other hazardous conditions.
b) No operator of a bicycle shall leave a bicycle lane until it can be done safely and then only after giving an appropriate hand signal in the event that any vehicle might be affected by the movement.
Intersection Positioning
At intersections, bicycles should travel in the right-most lane that leads to their destination. This means that if a bicycle is preparing for a left-hand turn, they may leave the right side of the road even if a bike lane is provided.

St. Helena Bicycle Plan Page 25 January 2012
Types of Bicyclists
Understanding the needs and preferences of the various types of bicyclists in the Plan Area is an important part of the process of evaluating existing usage, projecting future demand, and planning for improvement projects. While bicyclists’ skills, confidence, and preferences can vary significantly amongst the various bicyclist types, concerns about the safety of bicycling remain paramount for all bicyclists. According to the Portland Office of Transportation, “riding a bicycle should not require bravery, yet all too often, that is the perception among bicyclists and non-bicyclists alike.” The common denominator for cities around the world that have achieved a high share of bicyclists in their mode splits is that they have essentially removed the element of fear associated with bicycling in an urban environment. In regard to travel choices, it is unfortunate that fear currently exists in our society. In many cities, bicycling is often the most logical, enjoyable and cost effective choice for short trips for a substantial portion of the community, if not the majority of their populace.
Bicyclists can be categorized in a variety of ways, including age, skill, trip purpose, i.e. transportation or recreation, and even by type of bicycle ridden such as road, mountain, or recumbent bicycle. For the purpose of this Plan, bicyclists have been classified in the following categories: “Advanced Bicyclists,” “Average Bicyclists,” and “Novice Youth/Adult Bicyclists.”
Advanced Bicyclists are typically comfortable riding anywhere they are legally allowed to operate a bicycle, including space shared with cars and trucks along arterials or rural highways. Less advanced or Average Bicyclists are typically more comfortable on roadways that provide space separated from motorists and/ or along separated pathways. Novice Bicyclists, including children and new adult riders, may be confident and have some level of bicycle handling skills; however, they often do not have the experience of seasoned riders, nor the training or background in traffic laws necessary to operate safely on the road. Bicyclist types and their preferences and needs are defined further in Table 5.
Table 5 Bicyclist Types, Preferences and Needs
Bicyclist Type Rider Preferences Rider Needs
Advanced Bicyclist Experienced riders who can operate under most traffic conditions
• Direct access to destinations • Operate at maximum speed with
minimum delays • Sufficient roadway space or shoulder so
that bicyclists and motorists can pass without altering their line of travel
• Establish and enforce speed limits • Provide wide outside lanes (urban) • Provide usable shoulders (rural)
Average Bicyclist Casual or new adult and teenage riders who are less confident of their ability to operate in traffic without special provisions for bicycles
• Comfortable access to destinations • Direct route, but on low-speed, low
traffic-volume streets or on designated bicycle facilities
• Well-defined separation of bicycle and motor vehicles or separate multi-use paths
• Ensure low speeds on neighborhood streets • Traffic calming • Provide network of designated bicycle
facilities (multi-use paths, bike lanes, bike routes)
• Usable roadway shoulders
Novice Bicyclist Young children, students, and pre-teen riders whose roadway use is initially monitored by parents, and/or adult bicyclists just beginning to ride
• Access to schools, recreation facilities, shopping, or other residential areas
• Residential streets with low motor vehicle speed limits and volumes
• Well-defined separation of bicycles and motor vehicles or separate multi-use paths
• Ensure low speeds on neighborhood streets • Traffic calming • Provide network of designated bicycle
facilities (lanes, multi-use paths, well-marked Class III routes)
• Usable roadway shoulders • Interconnected Class I pathway network
Source: Hawaii DOT, Minnesota DOT

St. Helena Bicycle Plan Page 26 January 2012
Bikeway Types
Class 1 Multi Use Path
Class II Bike Lane
Bicycle Boulevard
Shared Lane Marking
Cycle Track
Bikeway Types
The California Vehicle Code permits bicycling on all roads in California with the exception of access controlled freeways and expressways. Chapter 1000 of the Caltrans Highway Design Manual recognizes this when it states that “the needs of non-motorized transportation are an essential part of all roadway projects.” Although not all streets are designated as bikeways, they are all important facilities that ensure access and connectivity for bicyclists.
Effective bikeways encourage the use of bicycles as an alternative to the automobile. The bikeways identified in this Plan include standards and designations established by Caltrans. The Highway Design Manual identifies three distinct types of bikeways: Class I Off-Street Bike Paths (Multi-Use Path), Class II On-Street Bike Lanes, and Class III On-Street Bike Routes. These facilities are described below and design details for each facility type are provided in Appendix B. In addition to these three basic facility types, hybrid bikeways and facility enhancements are also described below and recommended for use in appropriate locations. Each class of bikeway has its appropriate application.
Standard Bikeways
Class I Multi Use Path
Class I facilities, typically known as bike paths, are multi-use facilities that provide a completely separated right-of-way for the exclusive use of bicycles and pedestrians with cross flows of motorized traffic minimized.
Class II Bike Lane
Class II facilities, known as bike lanes; provide a striped and signed lane for one-way bicycle travel on a street or highway. The minimum width for bike lanes ranges between four and five feet depending upon the edge of roadway conditions (curbs). Bike lanes are demarcated by a six-inch white stripe, signage and pavement legends.
Class III Bike Route
Class III facilities, known as bike routes, provide signs for shared use with motor vehicles within the same travel lane on a street or highway. Bike routes may be enhanced with warning or guide signs and shared lane marking pavement stencils. While Class III routes do not provide measures of separation, they have an important function in providing continuity to the bikeway network.
Class III Bike Route Enhancements
Bicycle Boulevard
A bicycle boulevard is a roadway that gives priority to bicycle traffic at intersections along the route. The boulevard may also include traffic calming features that reduce the total number of vehicles that use the roadway to make the roadway more bicycle-friendly. By definition, bicycle boulevards are Class III facilities, but are not typically signed with just the basic “Bike Route” sign.

St. Helena Bicycle Plan Page 27 January 2012
Shared Lane Marking
Shared Lane Markings (SLM), known “Sharrows,” are pavement legends which may be placed in the travel lane adjacent to on-street parking. The purpose of the marking is to provide positional guidance to bicyclists on roadways that are too narrow to be striped with bike lanes. SLM do not designate a particular part of the street for the exclusive use of bicyclists. They simply guide bicyclists to the best place to ride on the road to avoid the “door swing” of parked cars, and to warn motorists that they should expect to see and share the lane with bicyclists.
Non-Standard Bikeways
Cycle Track
A cycle track is a bikeway that is separated from adjacent traffic flows through the use of a visible grade change or other physical buffer between the bikeway and the roadway. Cycle tracks may provide for one- or two-way travel. Additionally, cycle tracks may be placed outside the parking lane, but in front of the sidewalk. There are no federal or State standards for cycle tracks, and they are not currently approved for use in California.

St. Helena Bicycle Plan Page 28 January 2012
The Local Bicycle Transportation Network
Existing Conditions
This section describes existing conditions for bicyclists in St. Helena, including opportunities and constraints, safety analysis, existing programs, bicycle counts, origins and destinations, schools and safe routes, bicycle parking, and a map and inventory of existing bikeways.
Opportunities and Constraints
A variety of issues and opportunities related to bicycling have been identified through the review of existing documents, maps, aerial images, staff input, public input, and field reconnaissance. A discussion of broad opportunities and constraints, such as funding, regional access, and public support and perception, to name a few, are detailed in the NCTPA Overview Plan. Following are some physical and operational constraints specific to St. Helena.
• St. Helena residents have raised traffic safety concerns, such as speeding on residential streets. • There is a need for convenient bicycle parking along Main Street and at commercial and employment
destinations throughout the community. • Improved pedestrian crossings are needed on Main Street. • Caltrans ownership of Main Street limits local control over the ability to provide bicycle facilities. • Crosswalks are needed on Main Street at Mills Lane and Dowdell Lane to improve access to St.
Helena High School, Crane Park, and other community destinations. • There is a desire for trail connections to establish bicycle and pedestrian access between developed
areas including locations on Adams Street, Pine Street, Scott Street, and Library Lane, among others. • Many families live within biking/walking distance of St. Helena’s schools. • A significant portion of Napa County’s traffic congestion results from tourists traveling throughout
the region. • Support for car-free tourism options, including development of the Vine Trail, will help manage
congestion in the area. • The community has expressed an interest in developing trails and interpretive exhibits along the
City’s creeks and waterways. • Development of a comprehensive traffic calming program will help to preserve and enhance the
livability of St. Helena’s neighborhoods.
Safety Analysis
The following section addresses safety conditions for bicyclists in St. Helena and includes a review of the California Office of Traffic Safety’s (OTS) collision rankings, the Statewide Integrated Traffic Records System (SWITRS), Seasonal Trends in Napa County, an understanding of the limitations of bicycle collision reporting, an analysis of bicycle collisions in St. Helena for the more recent 10-year period for which collision data was available, a summary of collision findings, a location map of bicycle collisions in St. Helena, and a review of urban and rural bicycle crash types.
Collision Rankings
The California Office of Traffic Safety (OTS) conducts ongoing research of traffic safety statewide. OTS prepares an annual traffic safety ranking of all California cities and counties. Cities are broken into groups based on population, while all 58 counties are grouped together; however, the grouping does not take into account other local demographics or characteristics. With the exception of the City of Napa, all cities within Napa County experience a lower number of annual bicycle collisions than the average for their population group. Because these cities have populations of less than 25,000, any small increase or decrease in annual collisions can result in a dramatic shift in their ranking. Therefore, these rankings were used for a generalized look at collision performance, not as an exact metric.

St. Helena Bicycle Plan Page 29 January 2012
Seasonal Trends
Seasonally, Napa County experiences the most bicycle collisions during the summer and early fall months, which corresponds to periods with more tourism. Additionally, most crashes occur on Friday through Monday with generally fewer collisions midweek. This also corresponds to increased tourism activity on weekends. The vast majority of collisions reported occurred during daylight and with clear weather conditions.
Collision Reporting
Collision records provided in SWITRS only include collisions reported by an involved party. In cases where there is no significant damage or injury, especially if the collision only involved a single bicyclist, the collision often is not reported. When a collision is reported, the level of detail provided can vary depending on the reporting styles and/or policies of the responding law enforcement agency or even the individual officer.
Bicycle Collision Analysis
The bicycle collision history for St. Helena was reviewed to determine any trends or patterns that could indicate safety issues for bicyclists. Collision data for a ten-year period from January 1, 1999, through December 31, 2008, was obtained from the California Highway Patrol (CHP) as published in their SWITRS reports. The collected SWITRS data was verified for location references, duplicate reporting, and inconsistencies. It is important to note that SWITRS data only includes collisions that were reported, so does not necessarily reflect all incidents that occurred.
A comprehensive review of the data was performed to help understand the nature and factors involved in reported bicycle collisions. A better understanding of these factors may help planners and engineers address some of the physical environments that contribute to these incidents. For example, if it is determined that a high incidence of collisions is occurring in the evening, lighting improvements may help to correct the situation. Conversely, a high incidence of collisions attributed to riders traveling in the wrong direction or those involving children may be addressed through education and/or enforcement activities.
The following types of data were reviewed with an emphasis on the conditions indicated to better understand the factors that may have contributed to the reported collisions:
Collisions: This information includes an analysis of the major causes of each collision, the locations of collisions, and the seasonal variation of collisions.
Conditions: Environmental conditions at or near the collision site at the time of each crash were examined. This included an analysis of weather conditions, lighting conditions, and types of traffic control devices present.
Demographics: This included a determination, by gender and age, of collision rates for bicyclists.
Locations: This portion of the analysis includes a map of reported bicycle collisions and spatial analyses of different collision types.
During the ten-year review period, more than 26,000 collisions were recorded throughout Napa County. Analysis of the data for all jurisdictions combined revealed a rise in the number of collisions per year from 1999 to 2002 to a high of 3,082 collisions annually, and then a steady decline to 1,789
Statewide Integrated Traffic Records System
The California Highway Patrol (CHP) Accident Investigation Unit maintains SWITRS, which was developed as a means to collect and process data elements from a collision scene. The program ensures that local police departments and the CHP utilize and maintain uniform tools and methods to collect and compile meaningful data and statistics which can be used to improve roadway conditions and monitor the effectiveness of enforcement efforts.
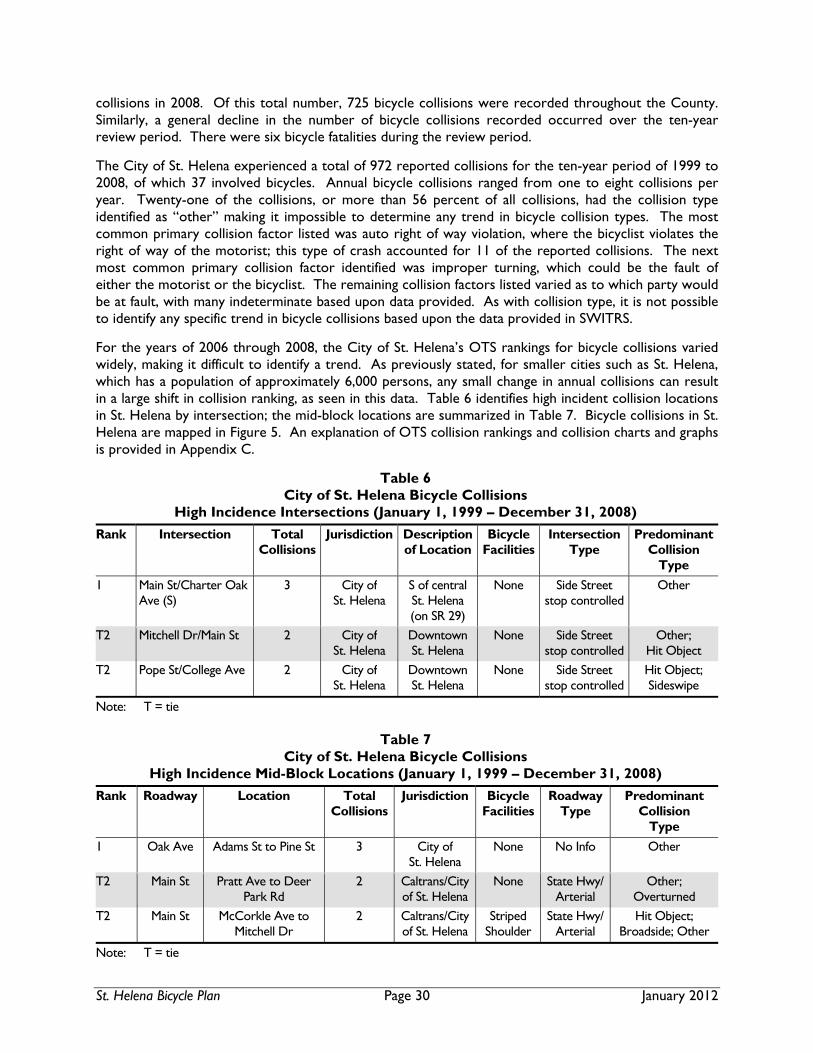
St. Helena Bicycle Plan Page 30 January 2012
collisions in 2008. Of this total number, 725 bicycle collisions were recorded throughout the County. Similarly, a general decline in the number of bicycle collisions recorded occurred over the ten-year review period. There were six bicycle fatalities during the review period.
The City of St. Helena experienced a total of 972 reported collisions for the ten-year period of 1999 to 2008, of which 37 involved bicycles. Annual bicycle collisions ranged from one to eight collisions per year. Twenty-one of the collisions, or more than 56 percent of all collisions, had the collision type identified as “other” making it impossible to determine any trend in bicycle collision types. The most common primary collision factor listed was auto right of way violation, where the bicyclist violates the right of way of the motorist; this type of crash accounted for 11 of the reported collisions. The next most common primary collision factor identified was improper turning, which could be the fault of either the motorist or the bicyclist. The remaining collision factors listed varied as to which party would be at fault, with many indeterminate based upon data provided. As with collision type, it is not possible to identify any specific trend in bicycle collisions based upon the data provided in SWITRS.
For the years of 2006 through 2008, the City of St. Helena’s OTS rankings for bicycle collisions varied widely, making it difficult to identify a trend. As previously stated, for smaller cities such as St. Helena, which has a population of approximately 6,000 persons, any small change in annual collisions can result in a large shift in collision ranking, as seen in this data. Table 6 identifies high incident collision locations in St. Helena by intersection; the mid-block locations are summarized in Table 7. Bicycle collisions in St. Helena are mapped in Figure 5. An explanation of OTS collision rankings and collision charts and graphs is provided in Appendix C.
Table 7
City of St. Helena Bicycle Collisions High Incidence Mid-Block Locations (January 1, 1999 – December 31, 2008)
Rank Roadway Location Total Collisions
Jurisdiction Bicycle Facilities
Roadway Type
Predominant Collision
Type
1 Oak Ave Adams St to Pine St 3 City of St. Helena
None No Info Other
T2 Main St Pratt Ave to Deer Park Rd
2 Caltrans/City of St. Helena
None State Hwy/ Arterial
Other; Overturned
T2 Main St McCorkle Ave to Mitchell Dr
2 Caltrans/City of St. Helena
Striped Shoulder
State Hwy/ Arterial
Hit Object; Broadside; Other
Note: T = tie
Table 6 City of St. Helena Bicycle Collisions
High Incidence Intersections (January 1, 1999 – December 31, 2008)
Rank Intersection Total Collisions
Jurisdiction Description of Location
Bicycle Facilities
Intersection Type
Predominant Collision
Type
1 Main St/Charter Oak Ave (S)
3 City of St. Helena
S of central St. Helena (on SR 29)
None Side Street stop controlled
Other
T2 Mitchell Dr/Main St 2 City of St. Helena
Downtown St. Helena
None Side Street stop controlled
Other; Hit Object
T2 Pope St/College Ave 2 City of St. Helena
Downtown St. Helena
None Side Street stop controlled
Hit Object; Sideswipe
Note: T = tie

5

St. Helena Bicycle Plan Page 32 January 2012
This page intentionally left blank

St. Helena Bicycle Plan Page 33 January 2012
Comparison of Rural and Urban Bicycle Crashes
Existing Bicycle Safety, Education, and Encouragement Programs
Currently, there are no formal safety or education programs for bicyclists in St. Helena that are delivered by the City. However, in the past on an as-needed basis, bicycle rodeos have been delivered by the St. Helena Police Department to elementary students, and the Department has offered free helmets to those in need.
Safe Routes to School is a national movement with a variety of programs that are designed to improve safety and encourage students to walk and bicycle to school. Such programs work to reduce traffic congestion and improve the health of both children and the environment. The City of St. Helena may pursue funding for these efforts through the state and federal Safe Routes to School programs and can work with the Napa County Office of Education to implement safety and education programs which are currently offered to elementary and middle schools throughout Napa County when requested.
Data Collection Recommendations (Bicycle Counts)
One of the challenges agency staff and local decision makers currently face in the area of bicycle and pedestrian planning is the lack of documentation on usage and demand for bicycle and pedestrian facilities. Without accurate and consistent data, it is difficult to measure the positive benefits of bicycle and pedestrian investments, especially when compared to other types of transportation. Regular bicycle counts are recommended to address the need for data. The first set of bicycle counts conducted in the Plan Area will be used to establish a baseline for bicycling in and around St. Helena. This baseline can then be compared to bicycle counts conducted on a periodic basis so that usage trends can be identified and measured. Note that counts are not meant to establish the number of bicyclists throughout the Plan area, which may be better achieved through a survey of a representative sample of residents, or through Census results. Instead, they are intended to help identify trends in bicycle use over time. In addition to tracking trends and identifying usage, counts can be used to substantiate the need for
FHWA Summary Report of Factors Contributing to Pedestrian and Bicycle Crashes on Rural Highways
A 2010 report by the FHWA’s Highway Safety Information System, Factors Contributing to Pedestrian and Bicycle Crashes on Rural Highways, was prepared to examine the difference between pedestrian and bicycle crashes in urban and rural settings in order to identify crash types and crash locations specific to rural highways that could be addressed through the use of existing safety treatments and/or through the development of new treatments.
According to the study, “approximately 25 percent of nationwide pedestrian and bicycle fatal and injury accidents occur on rural highways. In contrast to urban highways, rural highways have certain characteristics that can be more hazardous to pedestrians and bicyclists, such as higher average vehicle speeds and a lack of sidewalk and/or shoulder provisions.” Further, limited research has been conducted on rural highways in regards to the potential to link crash data with roadway characteristics and traffic counts.
The first objective of the study was to compare general descriptive statistics of rural versus urban crashes. This general comparison is useful for indicating which factors are common to both localities as well as which factors are over-represented in a rural environment.
The most common crash types for bicyclists differed in rural and urban areas. The most common rural crashes included bicyclists turning/merging into the path of the driver and drivers overtaking the bicyclist. The most common urban crashes included drivers failing to yield, bicyclists failing to yield midblock, and bicyclists failing to yield at the intersection. One noticeable difference is that common rural crash types generally occurred on midblock segments, while urban crash types generally occurred at intersections.

St. Helena Bicycle Plan Page 34 January 2012
additional facilities and support requests for funding, enforcement, maintenance, facility enhancements, and other safety improvements.
Proposed count locations in St. Helena and the surrounding unincorporated County were identified through this planning process. The basic criteria used to select count locations included points along and intersections of primary streets in the bikeway network, area coverage, population centers, attractors and generators, and community gateways. Proposed count locations in St. Helena are identified in Table 8 and mapped in Figure 6. Information on standard counting methodologies, recommended count periods, a discussion of ongoing counting efforts at the regional and national levels, and sample standardized count forms from the Metropolitan Transportation Commission and the National Bicycle and Pedestrian Documentation Project are provided in Appendix D.
Table 8 City of St. Helena – Proposed Bicycle Count Locations
# Primary Street
Facility Classification
Cross Street
Facility Classification
Use/ Activity
Notes
1 Main St/ SR 29
Class II Deer Park Rd Class II Primary Routes/ Northern City Limit
Intersection of primary north-south and east-west routes, northern gateway to St. Helena
2 Main St/ SR 29
Class III Adams St Class II Primary Route/ Local/Crosstown
Route/MTC Count Station
Downtown location adjacent to City Hall
3 Silverado Trail
Class II Pope St Class II Primary Routes Intersection of primary north-south and east-west routes, eastern gateway to St. Helena
4 Main St/ SR 29
Class II Chaix Ln Class III Primary Route/ Southern City Limit
Intersection of north-south and east-west
routes, southern gateway to St. Helena
5 Napa River Trail (Future)
Class I Pope St Class II Primary Route Future Class I pathway along the Napa River
Notes: Italics = Proposed Facility
Origins and Destinations
The following sections identify St. Helena’s major origins and destinations for bicycle trips. It is important to identify these facilities in order to understand access needs and existing and potential travel patterns when considering alignments for both the local and primary bikeway networks. Brief descriptions and/or lists of origins and destinations are provided below. Major facilities are mapped on Figure 1, the St. Helena Bikeways Map, to show their relationship to existing and proposed bikeways.
Schools and Safe Routes
Primary and Secondary Schools
The St. Helena Unified School District oversees the City’s public school system. The District includes one primary school, one elementary school, one junior high school, one high school, and a continuation

6

St. Helena Bicycle Plan Page 36 January 2012
This page intentionally left blank

St. Helena Bicycle Plan Page 37 January 2012
high school. The District serves a population of around 1,300 students. A number of private schools are also located in St. Helena. Table 9 lists the schools located in St. Helena.
Community Facilities and Parks
There are a variety of civic destinations and community facilities located in St. Helena that can be reached by bicycle or on foot. Major community facilities in St. Helena include:
• St. Helena Post Office • St. Helena Public Library • City Hall • St. Helena Fire Station • Carnegie Library Building
The City of St. Helena maintains eight public parks with a total of approximately 25.6 acres of parkland, including Wappo Park which is currently undeveloped, but under design with construction of improvements including a segment of Class I multi-use pathway along the Napa River expected in FY 2011/12. A list of existing parks in St. Helena is provided in Table 10.
Table 10 Existing City of St. Helena Parks
Category Park Number of Acres
Characteristics
Mini Baldwin Park 1.00 Mowed grass; picnic tables; handicapped-accessible from Voorhees Circle
Lewis Station 0.13 “Pocket park” with picnic tables, benches, and restroom
Lyman Park 1.00 Picnic tables; grassy areas; children’s play area; gazebo for events; one restroom
Mary Fryer Park 1.00 Picnic tables; play equipment designed for pre-school-aged children
Stonebridge Park 0.25 Located on the Napa River; grassy areas with limited parking
Neighborhood Jacob Meily Park 4.00 Play field; heritage orchard; picnic area; children’s playground; restroom
Wappo Park 6.20 Undeveloped
Community Crane Park 12.00 Six lighted tennis courts; six lighted bocce courts; two Little League baseball fields; horseshoe pits; children’s playground; two restrooms; picnic areas; Farmer’s Market; skate park
Total 25.58
Source: City of St. Helena, 2010
Other parks in the vicinity of St. Helena include two state parks located on the west side of SR 29 north of the city: the 1,900-acre Bothe-Napa Valley State Park, which offers camping, picnicking, swimming, and hiking trails; and the adjoining 0.75-acre Bale Grist Mill State Historic Park, the site of a water powered grist mill that was built in 1846 (California State Parks, 2010).
Table 9 St. Helena Schools
School Grade Levels
Location
St. Helena Primary School K – 2 1701 Grayson Ave
St. Helena Elementary School 3 – 5 1325 Adams St
Robert Louis Stevenson Middle School
6 – 8 1316 Hillview Place
St. Helena High School 9 – 12 1401 Grayson Ave
Madrone High (Continuation) School
9 – 12 465 Main St
St. Helena Catholic School K – 8 1255 Oak Ave
The Young School (Montessori Elementary)
1 – 6 957 Brown St
Sun and Star Montessori School Pre K 1310 Adams St
St. Helena Montessori Pre K - 9 1343 Spring St
Culinary Institute of America at Greystone
2555 Main St
Napa Valley College 1088 College Ave

St. Helena Bicycle Plan Page 38 January 2012
Multi-Modal Connections
Bicycles are often used in combination with other modes of transit (such as bus, carpool, ferry, or train) as part of a multimodal trip. Convenient multi-modal connections that are well-integrated into the transportation system are a vital component of a balanced transportation network. Transit has the potential to extend trip ranges for bicyclists to both nearby communities, and destinations outside of Napa County. Multi-modal connections are especially important in Napa County, considering existing barriers to bicycle travel such as distances between communities, existing gaps in the bicycle network between urban areas, heat during summer months, and rain during winter months. While these obstacles likely serve as deterrents to existing and potential trips by bike, convenient multi-modal access can help to address these issues and extend trip ranges. Front loading bicycle racks, which typically accommodate two bicycles, are provided on all fixed route transit buses that operate in Napa County. Bicycle rack spaces are available on a first come, first served basis. When the front loading racks are full, drivers can accommodate bicycles inside the bus at their discretion, however, in the event that it is the last scheduled bus of the day, bicycles are permitted inside the vehicle.
Park and Ride Lots
Currently, there are no formal Park and Ride lots in the City of St. Helena; however, public parking is available at the corner of Pine Street and Oak Avenue. Bicycle and winery tour companies often use this parking as a staging area, and NCTPA identifies the site as commuter parking for the Vine 29 Express bus.
Bikeways Inventory
Existing bicycle facilities in St. Helena were inventoried through a GIS survey, field reconnaissance, staff questionnaires and interviews, and through outreach to the public as well as an ad-hoc Bicycle Advisory Committee assembled to oversee development of this Plan. Currently, the only existing bikeways in St. Helena are a short segment of Class II bike lanes on Silverado Trail that falls within the city limits, and a short connector path between the Wine Train tracks and Crinella Drive. Existing bikeways in St. Helena are listed in Table 11 and shown on Figure 1: the St. Helena Bikeways Map. Primary and regional bikeways in the vicinity of St. Helena are shown on Figure 2; the Up-Valley Planning Area Bikeway Map. Figure 3, the Countywide Bikeways Map, shows existing and planned bikeways throughout Napa County along with connections to adjacent Counties.
Table 11 Existing Bikeways
Project Corridor/Street Begin Point End Point Class Length (Miles)
Primary Route
SF Bay Area
Class I
Crinella Dr Path (connector path to Vine Trail)
Vine Trail (along railroad) Crinella Dr 1 0.03 Yes Yes
Napa River Trail SE edge of Wappo Park Pope St 1 0.16 Yes Yes
Class II
Silverado Trail Howell Mtn Rd St Helena City Limit 11 0.22 Yes Y
Starr Ave Hunt Ave Pope St 11 0.25 Yes Yes
Class I 0.19
Class II 0.47
Class III -

St. Helena Bicycle Plan Page 39 January 2012
Bicycle Parking
Currently, limited bicycle parking is provided in St. Helena. Bicycle racks are generally located at schools and civic destinations. In 2009, the City initiated a bike rack installation program for Main Street. The project included the installation of approximately ten racks between City Hall and just south of Hunt Avenue. The racks are an inverted U design and accommodate two bikes at each location. The rack locations were carefully selected by the City’s Climate Protection Task Force in close coordination with downtown merchants to allow barrier free travel along the sidewalks as well as easy access from parked vehicles along Main Street.
The City’s Municipal Code includes the following bicycle parking requirements:
17.124.060 – Parking Lot Design and Improvement – subsection ‘H’ reads: Bicycle Parking. The Planning Commission may require the provision of bicycle parking facilities for any use which is required to provide ten (10) or more vehicular parking spaces dependent upon the use, size and location of the property. The required bicycle parking facilities must generally hold a bicycle in a vertical position and permit a typical bicycle lock to be used for security. (Ord. 05-4 § 1 (part): prior code § 27.251)
Proposed Improvements
Proposed bikeway improvements in the St. Helena Bicycle Plan consist of a network of Class I multi-use paths, Class II bike lanes, and Class III bike route projects to complete both the local and primary countywide bikeway networks, along with various safety enhancements, bicycle support facilities, and programs designed to improve safety and encourage bicycling.
The local and primary bikeway networks have been planned to link residents, visitors, and bicyclists of all ages and types between residential areas and community destinations including schools, parks, shopping, civic buildings, employment centers, and regional trails and bikeways. Recommended bicycle support facilities and programs include increasing short- and long-term bicycle parking supplies, improving multi-modal integration, maintenance and monitoring programs, strategies to develop a bicycle counting program, safe routes to school programs, public education, signing and marking enhancements, and a communitywide traffic safety education campaign.
Criteria for Route Selection and Evaluation
The methodology for developing a bikeway network for any community begins with input from the local bicycling community, local planning and engineering staff familiar with the community and the public. Based on input received, existing conditions, project goals, and opportunities and constraints, a network of proposed facilities and programs was prepared. Next, a ranking methodology based on general planning criteria was developed with the Project Steering Committee to prioritize the recommended bikeway projects and programs. A Decision Matrix was used to attach weights to each criterion and determine which recommendations meet the highest number of criteria listed. It is important to note however, that over time changes will occur that may impact project implementation opportunities, and thus projects that may not be heavily weighted could be implemented in the short term due to opportunity, funding availability, political will, or other reasons.
Project ranking criteria include:
Land Use: A project that provides or promotes connections or access to multiple land uses (e.g. primary generators such as dense residential neighborhoods with high numbers of bicycle commuters with areas of dense employment) will rank favorably according to the land use criteria. Facilities that provide intra- or inter-neighborhood access to schools, for shopping trips, access to transit, access to public open space/parks would also rank favorably according to the land use criterion. Longer corridor projects that

St. Helena Bicycle Plan Page 40 January 2012
“connect” more land uses will tend to rank higher as they are assigned greater points over shorter projects that do not connect generators with destinations, or vice versa.
Current and Latent Bicyclist Demand: Higher points are awarded to those projects that currently have significant usage or latent demand, that is they are likely to generate significant usage based on land uses, population, corridor aesthetics, etc. Justification for this criterion is that corridors or spot locations currently receiving high demand may or may not be optimally designed for safety and functionality and additional improvement would benefit a large number of existing bicyclists. Under latent demand, existing corridors or spot locations may be viewed by a high percentage of potential users as undesirable from a safety or operational perspective, and if safety or functionality is improved, even high use facilities may experience an increase in use levels.
Technical Ease of Implementation: Technical ease of implementation focuses on the actual engineering challenges of a project, emphasizing the point that typical physical requirements of bicycle projects such as parking removal, traffic lane removal, or lane re-striping are not technically challenging from an engineering perspective. Physical solutions are often readily apparent but may require development of political support, addressed under "Non-Technical Ease of Implementation," or that specific operational issues be addressed to demonstrate that no negative impacts will occur to other modes. These criteria specifically address the technical and physical aspects of an engineering solution.
Non-Technical Ease of Implementation: Maximum points are assigned for an easy, popular project. If significant neighborhood opposition is a known factor, if support of elected officials is not anticipated, or if other political opposition to a particular aspect of the assumed engineering solution (such as parking removal or agricultural issues) is anticipated, then the project would receive fewer points under this criterion.
Note: Projects that are supported by current or adopted planning efforts by regional or local agencies receive points under these criteria, for example, projects that are identified in Bay, Ridge, or Vine Trail Studies that have the potential to serve both pedestrians and bicyclists. In addition, projects that are supported by existing or anticipated funding would receive points under this criterion.
Overcomes Barrier/Connectivity (Safety): Maximum points should be assigned to projects that address a major safety concern for bicyclists using bridges, interchanges, and/or negotiating other environments difficult for bicyclists to navigate. Higher points should be assigned to roadways with high speed, high traffic volume, wide road width, difficult intersections or other obstacles to bicycle travel. Maximum points should be assigned for filling a gap in the existing network.
Public Input: This criterion is based directly on public input received during workshops, results from the surveys, indirect public input through agency staff, and an informal survey of local elected officials. Points are assigned in correlation to the number of comments and perceived interest of workshop attendees.
The ranking matrix is located in Appendix E.
Proposed Bikeway System
This section describes proposed bicycle improvements in St. Helena including both physical and programmatic improvements. A range of users must be considered in building a bicycle system. Whereas an experienced rider or bicycle commuter might prefer the shortest and fastest on-road route, a young or inexperienced rider will likely prefer a Class 1, separated bicycle facility. Bicycle riders of all ages and abilities, and those who are riding for both recreation and transportation to destinations like work and school, must be considered in system improvement and implementation. The proposed bikeway network consists of an interconnected network of Class I pathways, Class II bike lanes, and Class III bike routes that will close gaps, connect existing facilities, and provide access to areas that are not currently served by bicycle facilities.

St. Helena Bicycle Plan Page 41 January 2012
Primary Bikeway Network
A new element of this planning effort has been the designation of a countywide Primary Bikeway Network – a continuous countywide network of on- and off-street bikeways that extend between and through communities. The Primary Bikeway Network consists of a combination of existing and proposed Class I, Class II, and Class III bikeways that provide inter-city and inter-county routes along with connections to other transportation modes, major destinations, jobs, neighborhoods, recreation, and local bikeways. The network typically includes one or more north-south and east-west routes through each community. The intention of the Primary Bikeway Network is to focus and collaborate on a set of basic routes that will provide access to major destinations and activity areas. Primary Bikeway Network routes are identified on the bikeway map using a colored highlight around their route designation, Primary Bikeway Maps have been prepared to show how the network connects between communities, and proposed project lists identify bikeway segments on the Primary Bikeway Network. The Primary Bikeway Network has been further coordinated with “routes of regional significance” that comprise the Bay Area’s Regional Bicycle Network identified in the Metropolitan Transportation Commission’s Regional Bicycle Plan for the San Francisco Bay Area.
Proposed Bikeways
St. Helena’s proposed bicycle network includes Class I paths, Class II bike lanes, and Class III bike routes in order to maximize connectivity throughout the community and to destinations beyond St. Helena. The proposed network has been planned to provide safe and convenient bicycle access to parks, open spaces, commercial areas, residential neighborhoods and community facilities. Approximately 36 miles of bikeways are proposed in St. Helena. Once completed, the network will play a key role in bolstering the City’s efforts to increase the use of bicycles as non-auto modes of transit, and to reduce overall vehicle miles traveled in the City.
Approximately 15 miles of Class I pathways are proposed throughout the community, connecting parks and open spaces via multi-use trails that are completely separate from auto traffic. These proposed facilities provide important crosstown connections, and include the Napa Vine Trail (north-south), a path along Sulphur Creek (east-west), a path along York Creek (east-west), a path along the northern city limit from the Lower Reservoir to the Napa River Trail (east-west), and the Napa River Trail (north-south). On-street paths or “Cycle Tracks” are proposed along Allison Avenue, Charter Oak Avenue, Grayson Avenue, Hunt Avenue, Pope Street, and Starr Avenue. Additionally, proposed Class I pathways will connect the Lower Reservoir Park to Spring Mountain Road and Crane Park to Grayson Avenue.
Approximately 9 miles of Class II bike lanes are proposed. Class II bike lanes provide a designated lane for bicycle travel along a street or highway, and are proposed along various streets. Key east-west routes include: Madrona Avenue between Main Street and Riesling Way; Spring Street between Oak Avenue and the city limits adjacent to Sulphur Creek; Pope Street between Main Street and Silverado Trail; and Sulphur Springs Avenue, between Main Street and Crane Avenue. Key north-south routes are proposed on Spring Mountain Road, Valley View Street, Crane Avenue, and SR 29 (Main Street) between Deer Park Road and Pratt Avenue.
Bikeway System
The whole of all of the components including both physical and programmatic.
Bikeway Network
The physical improvements that establish bikeways (Classes I, II, III).
Primary Bikeway Network
A continuous countywide network of on- and off-street bikeways that extend between and through communities along with connections to other transportation modes, major destinations, jobs, neighborhoods, recreation, and local bikeway networks.

St. Helena Bicycle Plan Page 42 January 2012
Approximately 11 miles of Class III bike routes are proposed. Class III bike routes provide for shared use of travel lanes with vehicle traffic. Some of these routes have been identified as potential Bicycle Boulevards. Key Class III routes include Chaix Lane, Pratt Avenue, and SR 29 (Main Street) between Pratt and Charter Oak Avenues. Bicycle Boulevards are primarily located in the residential neighborhoods directly east and west of Main Street. Key Bicycle Boulevards include Mitchell Drive, Adams Street and Oak Avenue.
Additionally, a signing campaign of warning signs and destination based ‘way-finding’ signs is proposed. Approximately 15-20 signs placed strategically at community gateways, route junctions, and regular intervals along the primary network would provide coverage for the entire community.
A segment by segment breakdown of the proposed bikeway facilities including facility type, length, and estimated cost of improvements, project priority, and other criteria are listed in Table 12. The proposed bikeway network is shown in Figure 1. The proposed bikeways network has been developed to provide bicycle access to destinations throughout St. Helena, with an equal emphasis on primary routes that connect through the City and provide access to neighboring jurisdictions. Primary bikeways that extend beyond the City of St. Helena are shown in Figures 2 and 3. A recommended list of short-term actions follows. While the projects in this Plan have received a preliminary feasibility evaluation, engineering and environmental studies will be required prior to project implementation to determine project specific issues such as right-of-way impacts, traffic operations, parking impacts, and/or environmental issues.
Short-Term Actions
There are a variety of recommended projects, improvements, and actions distributed throughout this plan. The following list consolidates a series of low-cost actions, programmatic, and infrastructure improvements that can be achieved in the short-term, a period of one to five years, to improve conditions for bicyclists in St. Helena. Recommendations are not listed in priority order.
• Update Journey to Work Commute Statistics – Analyze and update Journey to work commute statistics with 2010 US Census Data upon its release, which is anticipated in 2012-13.
• Conduct Bicycle Counts – Work with NCTPA to implement bicycle counts at locations identified in this Plan to create baseline data.
• Bicycle Advisory Committee (BAC) – Establish a Bicycle Advisory Committee to review bicycle issues and help oversee implementation of this plan. Invite law enforcement personnel, school district representatives, and elected officials to participate. Continue to participate in the Countywide BAC.
• Implement a Maintenance Monitoring and Reporting System – Work with the NCTPA and the Countywide BAC to implement a maintenance reporting system with a central point of contact to report, track, and respond to routine bicycle maintenance issues in a timely manner.
• Bicycle Guide Map – Work with/support the NCTPA’s effort to update a public bikeway map and user guide that provides bike route, education, safety, and promotional information for locals and visitors.
• Install Bicycle Signs and Shared Lane Marking Stencils – Install wayfinding, warning, guide, and regulatory signs, and Shared Lane Marking stencils on existing bicycle facilities to improve way finding for bicyclists, assist emergency personnel, and heighten motorists’ awareness of bicycle activity.
• Napa Bike Program – Support the development and implementation of a countywide multimedia bicycle and pedestrian safety and education campaign to increase knowledge of riding rules, improve

St. Helena Bicycle Plan Page 43 January 2012
etiquette between motorized and non-motorized modes, to promote bicycle tourism, and increase the awareness of the benefits of bicycling and walking as transportation modes.
• Traffic Engineering Feasibility Studies – This Plan proposes several new Class I multi-use pathways including several projects that are proposed within existing roadway rights-of-way. These proposals may require changes to existing travel lanes, parking, and/or travel patterns, along with special design considerations for user separation, intersection treatments, and the pathway treatments. It is recommended that an engineering analysis be prepared to assess these impacts and too determine a preferred facility type. Similar analysis should be conducted for proposed Bicycle Boulevards if traffic diversions are proposed.
Bicycle Parking and Support Facilities
Every bicycle trip has two main components: the route selected by the bicyclist and the “end-of-trip” facilities at the destinations. The availability of safe bicycle routes and secure and convenient facilities is critical to promoting greater bike usage in St. Helena. Bicycle facilities can include short- and long-term bicycle parking, showers, lockers and lighting of bicycle parking areas.
Providing short- and long-term bicycle parking at key destinations, such as downtown St. Helena, parks, schools, community facilities, transit stops and shopping areas, will be essential to the development of a complete bicycle system. Parking should be highly visible, accessible and easy to use. In addition, facilities should be located in well-lit areas and covered where possible.
Support facilities for bicyclists should also be provided. Showers are an important amenity for those bicycle commuters with a rigorous commute and/or formal office attire. Lockers provide a secure place for bicyclists to store their helmets and other gear.
Shower and Locker Facilities
Currently, the City does not require employers to install shower and locker facilities for employees. Large employers and/or business parks often provide these facilities. Public input indicated that additional shower and locker facilities are desired by commuter bicyclists; however, none are proposed at this time.

St. Helena Bicycle Plan Page 44 January 2012
Tab
le 1
2 P
rop
ose
d B
ikew
ays
and
Pro
ject
Pri
ori
ties
#
Pro
ject
Co
rrid
or/
Str
eet
Beg
in P
oin
t E
nd
Po
int
Cla
ss
Len
gth
(M
iles)
P
rim
ary
Ro
ute
S
F B
ay
Are
a R
ou
te
Use
C
ost
P
rio
rity
Cla
ss I
Mu
lti-
Use
Pat
h
1 A
dam
s St
Pat
h Ex
tens
ion
to
Nap
a R
iver
Tra
il St
arr
Ave
Si
lver
ado
Tra
il I
0.45
Y
es
Yes
C
/R
$247
,924
M
ediu
m
2 A
lliso
n A
ve P
ath
(Cyc
le
Tra
ck)
Cha
rter
Oak
Ave
M
cCor
kle
Ave
I
0.05
Y
es
Yes
C
/R
$25,
930
Low
3 A
lliso
n A
ve P
ath
(Cyc
le
Tra
ck)
McC
orkl
e A
ve
Pope
St
I 0.
12
No
No
C/R
$6
6,17
4 Lo
w
4 C
hart
er O
ak A
ve P
ath
(Cyc
le
Tra
ck)
Mai
n St
A
lliso
n A
ve
I 0.
21
Yes
N
o C
$1
15,3
22
Med
ium
5 C
rane
Par
k Pa
th (
to L
a Q
uint
a W
y)
Gra
yson
Ave
K
enne
dy C
t I
0.32
N
o N
o C
/R
$175
,218
H
igh
6 G
rays
on A
ve P
ath
(Cyc
le
Tra
ck)
Cra
ne A
ve
Cla
ss I
faci
lity
455'
wes
t of
SR
29
I
0.42
N
o N
o C
/R
$230
,229
H
igh
7 H
unt
Ave
Pat
h (C
ycle
Tra
ck)
Chu
rch
St
Star
r A
ve
I 0.
42
No
No
C
$231
,354
M
ediu
m
8 Li
brar
y La
ne P
ath
Ada
ms
St
Vin
e T
rail
(alo
ng R
R c
orri
dor)
I
0.13
N
o N
o C
/R
$70,
330
Hig
h
9 Lo
wer
Res
ervo
ir T
rail
(Loo
p ar
ound
Low
er R
eser
voir
) N
W c
ity li
mit
Prop
osed
Low
er R
eser
voir
T
rail
alon
g Sp
ring
Mou
ntai
n R
d
I 0.
27
No
No
R
$146
,899
Lo
w
10
Low
er R
eser
voir
Tra
il (a
long
th
e no
rthe
rn c
ity li
mit
adja
cent
to
Dee
r Pa
rk R
d)
Nap
a R
iver
Tra
il Ju
st e
ast
of S
prin
g M
ount
ain
Rd
I 1.
48
No
No
C/R
$8
16,4
45
Low
11
McC
orkl
e A
ve P
ath
Prop
osed
cla
ss I
faci
lity
675'
w
est
of C
olle
ge A
ve
Col
lege
Ave
I
0.14
N
o N
o C
$7
5,21
4 Lo
w
12
Nap
a R
iver
Tra
il St
Hel
ena
city
lim
it ne
ar
was
tew
ater
tre
atm
ent
plan
t SE
edg
e W
appo
Par
k I
1.14
Y
es
No
C
$627
,446
H
igh
13
Nap
a R
iver
Tra
il Po
pe S
t (N
apa
Riv
er T
rail-
Wap
po P
ark)
St
Hel
ena
city
lim
it (D
eer
Park
Rd/
Low
er R
eser
voir
T
rail)
I 1.
85
Yes
N
o C
/R
$1,0
18,7
00
Hig
h
14
Oak
Ave
Pat
h M
itche
ll D
r C
hart
er O
ak A
ve
I 0.
16
No
No
C/R
$8
9,35
4

St. Helena Bicycle Plan Page 45 January 2012
Tab
le 1
2 P
rop
ose
d B
ikew
ays
and
Pro
ject
Pri
ori
ties
#
Pro
ject
Co
rrid
or/
Str
eet
Beg
in P
oin
t E
nd
Po
int
Cla
ss
Len
gth
(M
iles)
P
rim
ary
Ro
ute
S
F B
ay
Are
a R
ou
te
Use
C
ost
P
rio
rity
15
Pope
St
Path
(C
ycle
Tra
ck)
Alli
son
Ave
St
arr
Ave
I
0.23
Y
es
No
C
$128
,266
M
ediu
m
16
Spri
ng M
tn R
d Lo
wer
Res
ervo
ir
Dea
n Y
ork
Ln
I 0.
65
No
No
R
$356
,710
Lo
w
17
Star
r A
ve P
ath
(Cyc
le T
rack
) H
unt
Ave
Po
pe S
t I
0.25
Y
es
Yes
C
/R
$138
,214
Lo
w
18
Star
r A
ve P
ath
(ext
ends
SE
from
Sta
rr A
ve)
Mill
s Ln
Po
pe S
t I
0.43
N
o N
o C
/R
$235
,412
Lo
w
19
Sulp
hur
Cre
ek P
ath
Sulp
hur
Spri
ngs
Ave
N
apa
Riv
er T
rail
I 2.
23
No
No
C/R
$
1,22
9,20
9 H
igh
20
Sulp
hur
Cre
ek P
ath
Spri
ng S
t Su
lphu
r Sp
ring
s A
ve
I 0.
10
No
No
C/R
$
53,
167
Med
ium
21
Vin
e T
rail
(alo
ng P
ratt
Ave
) V
ine
Tra
il (in
ters
ectio
n of
V
ine
Tra
il al
ong
RR
w/P
ratt
A
ve)
Vin
e T
rail
(alo
ng S
R 2
9-M
ain
St)
I 0.
35
Yes
Y
es
C/R
$1
94,4
76
Med
ium
22
Vin
e T
rail
(alo
ng S
R 2
9-M
ain
St)
Cha
rter
Oak
Ave
G
rays
on A
ve
I 0.
25
No
No
C
$ 13
5,77
9 H
igh
23
Vin
e T
rail
(alo
ng S
R 2
9-M
ain
St)
Yor
k C
reek
Pat
h/V
ine
Tra
il in
ters
ectio
n (n
ear
Prat
t A
ve)
Dee
r Pa
rk R
d I
0.74
Y
es
Yes
C
/R
$404
,461
H
igh
24
Vin
e T
rail
(alo
ng S
R 2
9-M
ain
St)
Cha
ix L
n C
hart
er O
ak A
ve
I 0.
82
Yes
Y
es
C/R
$4
51,1
68
Hig
h
25
Vin
e T
rail
on R
R g
rade
C
hart
er O
ak A
ve
Prat
t A
ve
I 1.
02
Yes
Y
es
C/R
$5
59,5
14
Hig
h
26
Yor
k C
reek
Pat
h V
ine
Tra
il (S
R 2
9-M
ain
St)
Nap
a R
iver
Tra
il I
0.79
N
o N
o R
$4
33,2
40
Low
27
Yor
k C
reek
Pat
h Sp
ring
Mou
ntai
n R
d V
ine
Tra
il (S
R 2
9-M
ain
St)
I 0.
33
No
No
R/C
$1
81,2
42
Low
Cla
ss I
I B
ike
Lan
e
28
Ally
n A
ve
Spri
ng S
t M
adro
na A
ve
II 0.
34
No
No
C
$30,
377
Med
ium
29
Col
lege
Ave
Pr
opos
ed c
lass
I fa
cilit
y at
SE
end
of C
olle
ge A
ve
Pope
St
II 0.
18
No
No
C
$16,
155
Med
ium
30
Cra
ne A
ve
Sulp
hur
Spri
ngs
Ave
Bi
rch
St
II 0.
62
No
No
R
$55,
502
Med
ium
31
Val
ley
Vie
w S
t-C
rane
Ave
Sp
ring
St
Birc
h St
II
0.20
N
o N
o R
$1
8,44
5 M
ediu
m
32
Gra
yson
Ave
C
lass
I fa
cilit
y 45
5' W
of S
R
29
SR 2
9, M
ain
St
II 0.
09
No
No
C
$7,6
87
Med
ium

St. Helena Bicycle Plan Page 46 January 2012
Tab
le 1
2 P
rop
ose
d B
ikew
ays
and
Pro
ject
Pri
ori
ties
#
Pro
ject
Co
rrid
or/
Str
eet
Beg
in P
oin
t E
nd
Po
int
Cla
ss
Len
gth
(M
iles)
P
rim
ary
Ro
ute
S
F B
ay
Are
a R
ou
te
Use
C
ost
P
rio
rity
33
McK
orkl
e A
ve
Mar
ipos
a Ln
Pr
opos
ed c
lass
I fa
cilit
y 67
5'
wes
t of
Col
lege
Ave
II
0.23
N
o N
o C
$2
0,82
4 Lo
w
34
Mill
s Ln
SR
29-
Mai
n St
Pr
opos
ed c
lass
I fa
cilit
y an
nex
from
Sta
rr A
ve
II 0.
50
No
No
C
$45,
318
Low
35
Pope
St
Star
r A
ve
Silv
erad
o T
rail
II 0.
41
Yes
N
o C
$3
6,77
1 H
igh
36
Pope
St
SR 2
9-M
ain
St
Alli
son
Ave
(Pr
opos
ed c
lass
I fa
cilit
y al
ong
Pope
St)
II
0.23
Y
es
No
C
$20,
604
Med
ium
37
Prat
t A
ve
Vin
e T
rail
SR 2
9-M
ain
St
II 0.
26
Yes
Y
es
C
$23,
063
Med
ium
38
Spri
ng M
tn R
d D
ean
Yor
k Ln
M
adro
na A
ve
II 0.
39
No
No
C
$34,
990
Med
ium
39
Spri
ng S
t W
hite
Sul
phur
Spr
ings
Rd
at
city
lim
it O
ak A
ve
II 1.
16
No
No
C
$104
,774
H
igh
40
SR 2
9-M
ain
St
Prat
t A
ve
St H
elen
a ci
ty li
mit,
Dee
r Pa
rk
Rd
II 0.
80
Yes
Y
es
C
$72,
161
Hig
h
41
SR 2
9-M
ain
St
Cha
rter
Oak
Rd
Cha
ix L
n II
0.83
Y
es
Yes
C
$7
4,54
5 H
igh
42
Star
r A
ve-A
dam
s St
-Rai
lroa
d A
ve-F
ulto
n Ln
V
ine
Tra
il/Fu
lton
Ln a
t R
R
trac
k H
unt
Ave
II
0.79
Y
es
Yes
C
$7
0,86
4 M
ediu
m
43
Sulp
hur
Spri
ngs
Ave
C
rane
Ave
SR
29-
Mai
n St
II
0.50
N
o N
o C
$4
5,05
1 M
ediu
m
44
Sulp
hur
Spri
ngs
Ave
St
Hel
ena
city
lim
it Sp
ring
St
II 0.
16
No
No
C
$14,
623
Med
ium
45
Sylv
aner
Ave
-Rei
slin
g W
ay-
Mad
rona
Ave
Sp
ring
St
Mai
n St
II
1.33
N
o N
o C
$1
19,6
43
Hig
h
Cla
ss I
II B
ike
Bo
ule
vard
46
Ada
ms
St
Ally
n W
y R
ailr
oad
Ave
III
0.
47
No
No
C
$2,1
37
Med
ium
47
Elm
hurs
t A
ve
Spri
ng M
t R
d SR
29-
Mai
n St
III
0.
23
No
No
C
$1,0
34
Med
ium
48
Fulto
n Ln
M
ain
St
Rai
lroa
d A
ve
III
0.08
N
o N
o C
$3
60
Med
ium
49
Mitc
hell
Dr
SR 2
9, M
ain
St
Cra
ne A
ve
III
0.43
N
o N
o C
$1
,964
M
ediu
m
50
N C
rane
Ave
/Bir
ch S
t V
alle
y V
iew
St
Spri
ng S
t III
0.
38
No
No
C
$1,7
00
Med
ium
51
Oak
Ave
, Hill
view
Pl
Spri
ng M
tn R
d M
itche
ll D
r III
0.
69
No
No
C
$3,1
00
Hig
h

St. Helena Bicycle Plan Page 47 January 2012
Tab
le 1
2 P
rop
ose
d B
ikew
ays
and
Pro
ject
Pri
ori
ties
#
Pro
ject
Co
rrid
or/
Str
eet
Beg
in P
oin
t E
nd
Po
int
Cla
ss
Len
gth
(M
iles)
P
rim
ary
Ro
ute
S
F B
ay
Are
a R
ou
te
Use
C
ost
P
rio
rity
Cla
ss I
II B
ike
Ro
ute
52
Cha
ix L
n SR
29-
Mai
n St
N
apa
Riv
er T
rail
(pro
pose
d)
III
1.07
N
o N
o C
$2
,683
M
ediu
m
53
Edw
ards
St
Hun
t A
ve
Pope
St
III
0.15
N
o N
o C
$3
68
Med
ium
54
How
ell M
tn B
lvd
Silv
erad
o T
rail
Dee
r Pa
rk R
d III
4.
36
No
No
C
$10,
895
Med
ium
55
Mar
ipos
a Ln
Po
pe S
t M
cCor
kle
Ave
III
0.
14
Yes
Y
es
C
$344
M
ediu
m
56
McC
orkl
e A
ve
Alis
on A
ve
Mar
ipos
a Ln
III
0.
06
Yes
Y
es
C
$155
M
ediu
m
57
Prat
t A
ve
RR
tra
ck/V
ine
Tra
il at
Pra
tt
Ave
N
apa
Riv
er T
rail
(pro
pose
d)
III
0.48
N
o N
o C
$1
,189
M
ediu
m
58
Rai
lroa
d A
ve, C
hurc
h St
Po
pe S
t A
dam
St
III
0.26
N
o N
o C
$6
48
Med
ium
59
Spri
ng M
ount
ain
Rd
W S
t H
elen
a ci
ty li
mit
Prop
osed
cla
ss II
faci
lity
on
Spri
ng M
ount
ain
Rd
III
0.69
N
o N
o C
$1
,715
M
ediu
m
60
SR 2
9-M
ain
St
Cha
rter
Oak
Rd
Prat
t A
ve
III
0.95
Y
es
No
C
$2,3
72
Hig
h
61
Sulp
her
Spri
ngs
Ave
Su
lphu
r C
reek
C
rane
Ave
III
0.
93
No
No
R
$2,3
31
Med
ium
C
lass
I
15.3
4
To
tal
$9,2
81,7
91
C
lass
II
9.02
C
lass
III
11
.37
Not
es:
R =
Rec
reat
ion;
C =
Com
mut
e

St. Helena Bicycle Plan Page 48 January 2012
Safety, Education, and Support Programs
The bikeway network has been planned to provide safe, convenient access for all types of bicyclists to destinations throughout Plan Area. Like all other modes of transportation, the system and its network of facilities must be used appropriately to maximize the safety of all users, bicyclists, pedestrians, and motorists alike. To help minimize safety risks, it is imperative that bicyclists and motorists follow basic traffic laws. For bicyclists, this includes activities such as riding in the correct direction, stopping at stop signs and traffic signals when the light is red, riding predictably, and taking proper measures to be visible day and night; and for motorists yielding to turning bicyclists, passing with care, and not driving or parking in designated bicycle lanes, to name a few behaviors for both.
Efforts must be made to encourage a culture of respect and shared usage, among motorists and bicyclists alike. The safety, education, encouragement, and enforcement programs recommended in this section are intended to help grow the number of bicyclists in the Plan Area, while also increasing safe and appropriate behavior by bicyclists and all other roadway users.
Bicycle Safety Education for Students
Action: Provide bicycling/walking safety education to all students in St. Helena from second grade through high school on an annual basis.
The Napa County Office of Education Safe Routes to School Program currently provides bicycling/ walking safety education to approximately eight (8) schools throughout the County annually. The City and St. Helena Unified School District should work together to ensure Safe Routes to Schools programs are delivered to St. Helena’s schools.
• Expected Result: Decrease the number of bicycle crashes among school age children and increase the number of students bicycling/walking to school through increased Safe Routes to School safety education delivery efforts.
• Measure: Collision analysis and bicycle and walking counts performed regularly by agency staff.
Action: Develop a sustainable Walking School Bus/Bicycle Train Program for interested schools.
Safety is a primary concern when parents decide whether to allow their children to bicycle/walk to school. Walking school busses and bicycle trains are organized groups of students who walk or bicycle to school under the supervision of one or more adults. The Program’s formal organization and adult supervision can provide peace of mind for parents wanting to let their child walk or bicycle to school. The City, St. Helena Unified School Distrcit, and individual schools should work with the Napa County Office of Education to develop a formal program identifying school commute routes and establishing a roster of volunteer parent or staff “bus drivers” from each participating school.
• Expected Result: More students will bicycle and walk to school on a regular basis.
• Measure: The Napa County Office of Education Safe Routes to School Coordinator will track the number of children walking and biking to school and survey participating schools to track the success of walking and bicycling school busses.
Bicycle Safety Education for Adults
Action: Develop and deliver bicycle safety education to adult bicyclists throughout the community using a variety of media (print, radio, web, and hands-on instruction) targeted toward specific user groups: migrant workers, college students, commuter bicyclists, recreational bicyclists, families, senior citizens, and large employers.

St. Helena Bicycle Plan Page 49 January 2012
Adult bicyclists account for the majority of bicyclists in the Plan Area. A variety of rider types comprise the “adult bicyclist” category, as such appropriate safety education information should be developed to target focused issues for each user group. Safety information is widely available from FHWA, AAA, the League of American Bicyclists, and a variety of local and regional transportation agencies. Existing resources should be used and adapted to meet the needs of the local community. Safety education should stress the importance of following the rules of the road and how doing so plays a role in the prevention of collisions. Educational messages should be targeted at addressing common violations, issues, and/or collision types such as: wrong-way riding, no lights or other required night-riding equipment, running stop signs or red lights, bicyclists that are careless or disobey traffic laws, proper helmet use, riding with children, sharing trails and roads, riding two abreast or in groups, yielding to pedestrians, etc.
• Expected Result: Bicyclists will employ safe bicycling techniques and etiquette on streets and pathways, parents will serve as role models for safe bicycling techniques for their children, bicycle conflicts along streets and pathways will decrease, and annual bicycle collisions will be reduced.
• Measure: Traffic citations, bicycle crash data, and bicycle/traffic complaints will be analyzed on an annual basis to determine trends. Surveys may be conducted on trails and/or as a component of regular bicycle counts to determine the effectiveness of the outreach and if bicycle/vehicle/ pedestrian interactions have improved.
Bicycle Safety Education and Encouragement Campaign for Tourists
Action: Develop and deliver bicycle safety education information to tourists throughout the Plan Area to make bicycling more attractive and available to short-term tourists.
Findings from the 2005 Napa Valley Visitor Profile Study document the profound significance that tourism has on the Napa Valley’s economy and transportation system. In order to help alleviate traffic congestion, improve traffic safety, reduce vehicle miles traveled, and make bicycling more attractive and available to tourists, a focused tourist information, safety, and education campaign should be developed. The campaign would require collaboration from multiple entities including NCTPA and local agencies, and tourism, winery hospitality, agricultural, and visitor serving interests. Marketing will be critical to inspire tourists of all levels, abilities, and desires to tour the Valley’s many attractions by bicycle. Materials should be developed in multiple languages, and focus on issues such as bicycling safety and etiquette, tips to improve comfort and convenience, route planning and wayfinding, bike rental services, and information on both guided tours and unguided routes.
• Expected Result: The number bicycle trips by made by short-term tourists visiting the Napa Valley will increase substantially. Both bicycle and traffic safety will improve as a greater understanding of the bicycle system is developed and vehicle miles traveled are reduced. Targeted reductions in Greenhouse Gas Emissions will be achieved as fewer “short” tourism trips are made. Touring the Napa Valley’s vineyards, wineries, and attractions by bicycle, and experiencing Napa’s “healthy lifestyle” will be central to the Valley’s tourism industry and an active destination choice for tourists worldwide.
• Measure: Traffic citations, bicycle crash data, and bicycle/traffic complaints will be analyzed on an annual basis to determine trends. Visitor serving businesses including bicycle tours and rental establishments, wineries, and lodging will be surveyed to determine trends and the effectiveness of the campaign.
Law Enforcement Activities
Police officers are responsible for enforcing traffic laws and improving safety for bicyclists and motorists on St. Helena’s highways, streets and pathways. Traffic officers interact with bicyclists and motorists on

St. Helena Bicycle Plan Page 50 January 2012
a daily basis, which puts them in a unique position to add credibility to efforts to encourage bicycling and to improve bicycle safety. Coordination with law enforcement agencies and an improved understanding of bicycling issues by officers can lead to better enforcement, heightened awareness of safety issues, and recognition of “teachable moments” for both bicyclists and motorists.
Action: Provide bicycle specific training for law enforcement personnel and establish a community policing agreement.
Training of law enforcement personnel, including on-bike enforcement techniques, is critical to keeping officers up to date on current bicycle laws and issues, and will help officers to understand the behaviors, rights, and traffic safety concerns associated with bicycling. A community policing agreement engages members of the community, including agency engineering and planning staff, local elected officials, non-profit community advocates, schools, and others, to ensure the coordination of enforcement goals and strategies, and to develop a balanced approach to address traffic safety issues that includes education, engineering, and enforcement. A community policing agreement amongst local law enforcement agencies in the Plan Area will help to ensure specific and consistent consideration of enforcement efforts as well as consistent investigation techniques of collisions for on-going monitoring purposes.
• Expected Result: Bicycle specific training for police officers will familiarize enforcement personnel with bicycle issues and the bicyclist’s perspective. A community policing agreement will ensure a collaborative approach to traffic safety that includes enforcement, engineering, and education efforts to improve traffic safety.
• Measure: Trained enforcement officers may be required to complete post training evaluation forms. Community policing agreements would result in regular committee meetings and a reduction in bicycle-related citations and collisions.
Action: Establish a bicycle diversion program for bicycle traffic offenders.
Bicycle diversion programs are provided in a variety of jurisdictions throughout the nation. Diversion programs allow persons cited for eligible bicycle-related traffic violations to attend a bicycle safety course sponsored by law enforcement and the Court in lieu of paying a fine. Courses are typically free of charge, and successful completion results in the dismissal of the fine and all charges. Eligibility is determined by the Court. Diversion courses range from one to four hours in duration and include the delivery of instructional videos, bicycle safety materials, a review of state and local laws, and hands on safety skill training.
• Expected Result: Court administered bicycle diversion program for bicycle traffic offenders which would provide bicycle safety training in lieu of a fine.
• Measure: Bicycle safety training delivered to (number) of residents through the program.
Action: Provide focused law enforcement operations at high collision locations.
The Bicycle Plan Update has identified the top collision locations for bicyclists throughout the community. Increased law enforcement efforts at these specific locations may help to decrease collisions between motorists and bicyclists. The City’s planning and engineering staff should work with law enforcement (community policing) to develop a strategy to address safety concerns at these locations. Strategies may include increased patrols during peak periods, crosswalk(s), signal compliance, etc.
• Expected Result: Increased law enforcement patrols at top collision locations throughout the County.
• Measure: Reduction in bicycle collisions at high collision locations.

St. Helena Bicycle Plan Page 51 January 2012
Implementation
Introduction
This section identifies the activities and actions that are necessary to implement the physical improvements, facilities, and programs contained in this Plan, along with the estimated costs for the proposed improvements, maintenance requirements, and funding and financing strategies.
Implementation
Successful implementation of the projects and programs contained in the Bicycle Plan will require ongoing cooperation within and among City departments, other public agencies, and bicycle stakeholders. The planning horizon for the projects identified in this plan is the year 2035. Implementation of the projects in this plan will occur incrementally in a variety of ways. Many projects will be incorporated into the City’s Capital Improvement Program (CIP) process and will be implemented as the CIP projects get funded. Others can happen as part of regular maintenance and operations practices and road resurfacing projects. Development and/or redevelopment in some areas of the City will present a significant opportunity to implement some of the recommendations of this Plan. While improvements associated with development and/or redevelopment often occur “piecemeal’, this is the way development happens and it is important to include bicycle improvements as a component of project improvements. Finally, outside funding can be obtained to finance the design and construction of other projects, improvements and programs. The most likely funding sources are addressed in the last section of this chapter.
Project Implementation Process
The actions necessary to complete infrastructure projects identified in this Plan will vary from project to project, but generally include:
1. Adoption of the Plan by resolution. a. Approval of the Plan by the Metropolitan Transportation Commission. b. Certification of the Plan by the Caltrans Bicycle Facilities Unit. a. Programmatic level review and environmental clearance of the Plan.
2. Feasibility analysis, environmental analysis, and cost estimates for individual projects as needed.
3. Public review as necessary.
4. Project approvals; Advisory Committee, Planning Commission, City Council.
5. Secure local and outside funding commitments.
6. Completion of final plans, specifications and estimates, advertising for bids, receipt of bids and award of contract(s).
7. Project construction.
Maintenance and Monitoring
Bicycle system maintenance needs include cleaning/sweeping, asphalt resurfacing, striping maintenance, sign replacement, pavement repairs, signal maintenance, drainage work, refuse removal, graffiti removal, and landscape maintenance. Maintenance of on-street facilities such as Class II bike lanes, Class III bike routes, and bicycle boulevards, is generally treated as a component of typical roadway maintenance activities which are funded through gas taxes and programmed annually. While some maintenance needs such as re-striping or re-surfacing can be placed on a periodic schedule, other needs such as fixing potholes,

St. Helena Bicycle Plan Page 52 January 2012
addressing signal detection sensitivity, and trimming overgrown vegetation require immediate attention. Table 13 provides a recommended timetable for regular maintenance activities associated with the St. Helena bicycle network.
Table 13 Bicycle System Maintenance
Maintenance Item Schedule/Frequency
Pavement/pathway sweeping Monthly – annually as needed
Signal detection sensitivity Bi-annually – or as needed on a request basis
Trash disposal Weekly – as needed
Graffiti removal Weekly – monthly as needed
Potholes As needed – on a request basis
Sign replacement/repair 1 to 3 years – as needed
Pavement marking replacement 1 to 3 years – as needed
Pavement sealing Every 5 years – as needed
Lighting (replacement/repair) Annually – or as needed on a request basis
Clean drainage system Annually – or as needed on a request basis
Maintain furniture, bus stops, railings Annually – or as needed on a request basis
Fountain/restroom cleaning/repair Weekly - monthly as needed
Bridge/Underpass inspection Annually
Maintain emergency telephones, Closed circuit TV 1 year
Replenish shoulder material Annually
Landscape Maintenance Schedule/Frequency
Tree, Shrub, & grass trimming/fertilization 5 months – 1 year
Maintain irrigation lines/replace sprinklers 1 year
Irrigate/water plants Weekly – monthly as needed
Shoulder and grass mowing Seasonally as needed
Vegetation maintenance Annually – or as needed on a request basis
Weed control Monthly – as needed
Maintenance Recommendations
Recommendation: Ensure that all bikeways and roadway shoulders are included in the City’s street sweeping program and swept as part of routine street sweeping operations. Street sweeper operators should be properly trained to understand the needs of bicyclists and the importance of clearing debris from bikeways.
Recommendation: Ensure that all construction projects (roadway and/or road adjacent projects) maintain both a clean swept shoulder and a through right-of-way for bicycles.
Recommendation
Implement a Maintenance Reporting System
Policy 9.2: Develop or retain a maintenance reporting system with a central point of contact to report, track, and respond to routine bicycle maintenance issues in a timely manner. [NCTPA, NCBC, cities, towns, County]

St. Helena Bicycle Plan Page 53 January 2012
Recommendation: Establish a maintenance reporting system as a means to report, track, and respond to routine bicycle maintenance issues in a timely manner. Ensure that the City’s maintenance reporting system is integrated with any countywide efforts to develop a similar program.
Maintenance Costs
Maintenance costs for the bikeway system are generally lumped into two categories. As previously noted, maintenance activities associated with on-street bikeways are typically accommodated as a component of routine street maintenance activities that are programmed annually, while maintenance of off-street bikeways (Class I multi-use paths) and support facilities such as bike lockers and racks is generally funded through local revenues. While currently, there is a limited number of existing Class I multi-use pathways in St. Helena, approximately 15 miles of pathways are proposed. Maintenance costs for these proposed facilities should not be overlooked. Cost assumptions for typical bikeway maintenance activities are presented in Table 14.
Table 14 Maintenance Cost Assumptions
Facility Classification
Estimated Annual Cost Per Mile
Notes
Class I $8,500 Assumes maintenance associated with Class I trails, trail amenities, and landscaping
Class II $2,000 Assumes regular/periodic lane sweeping, sign and stripe/stencil maintenance, signal detection, and minor surface repairs
Class III $1,000 Assumes sweeping and minor surface repairs
Sidewalks $2,500 Assumes landscape/ vegetation maintenance and surface repairs
Monitoring
The projects and programs recommended in this Plan are dynamic and subject to change as bicycling conditions and demands throughout the plan area evolve. Periodically monitoring certain indicators and conditions along the bikeway network will allow the City to assess needs and issues that require attention and/or to adjust plans and project recommendations accordingly. The primary components to monitor include: bicycle collisions, bicycle usage, and safety/security and enforcement. The following monitoring actions are recommended to evaluate the success the City’s efforts and to ensure implementation of the Bicycle Plan goals over time.
• Collect and analyze collision data on an ongoing basis to assist in the identification of problem locations.
• Conduct and log bicycle counts on an annual or semi-annual basis so that usage trends can be identified and measured.
• Conduct regular meetings with bicycle stakeholders (annually or bi-annually) to solicit feedback on bicycle facilities, network maintenance, promotional and educational activities, and safety/security, and enforcement issues.
• Consider the use of periodic public surveys to receive input on bicycle issues from the larger community.

St. Helena Bicycle Plan Page 54 January 2012
Project Costs
Construction costs for bicycle infrastructure are presented in Table 15. Costs estimates were developed by researching the latest unit costs experienced by the local jurisdictions in Napa County and the North Bay, and were cross-referenced by reviewing the National Cooperative Highway Research Program’s Guidelines for Analysis of Investments in Bicycle Facilities2. In recent years, actual costs have fluctuated significantly, with sharp rises in the costs of construction materials in the late 1990’s and early 2000’s, followed by steep declines in labor costs and a leveling of construction material costs in last few years. Overall, these changes have been dramatic and have resulted in instabilities that are difficult to predict, especially over a long-term. The costs below are for planning level estimates. They are unit costs for construction and do not include contingencies, design, environmental analysis, administrative costs, right-of-way acquisition, or inflation factors. Furthermore, unit costs may vary considerably depending on the size of the job and the location. For example, the unit cost of striping only 1,000 linear feet can easily be two to three times that of a 15,000-foot project. The same ‘economy of scale’ can be applied to sign installation and signal modification projects. Pavement widening costs also vary considerably depending on the terrain and other variables, such as presence of utility poles, monuments, and drainage issues.
2 Transportation Research Board, National Cooperative Highway Research Program’s Guidelines for Analysis of Investments in Bicycle Facilities, 2006

St. Helena Bicycle Plan Page 55 January 2012
Table 15 Construction Cost Assumptions for Bikeway Improvements
Capital Project Unit Cost
Class I: Multi Use Trail
Construct Multi-Use Pathway Mile $550,000
Rehabilitation Mile $125,000
Trail Entry Improvements (may include bollards, signs, minor paving, & concrete driveway apron)
Each $2,000-$6,000
At Grade Roadway Crossing (varies by improvement type) Each $10,000-$90,000
Grade Separated Crossing (under/over crossing) Each **
Trail Bridge (Prefabricated steel bridge 10-12 ft wide by 100 ft long) Each $200,000
Class II: Bike Lanes
Road widening to accommodate bike lanes Mile $300,000
Install Signs, Striping, & Stencils Mile $30,000
Reconfigure Roadway Striping, add Bike Lanes Mile $75,000-$90,000
Install Loop Detectors Each Intersection $2,500-$5,000
Intersection Striping (bike lane pockets, combined turn lanes, advanced stop bar/pocket)
Each Intersection $2,000-$6,000
Class III: Bike Route
Install Signing (Up to 10 signs per mile) Mile $2,500
Bicycle Boulevard
(Signing and Stencils Only) Mile $4,500
(Traffic Calming Treatments) Each $2,000-$60,000
Shoulder/Roadway Widening (One side, 6 foot) Mile $325,000
Shared Lane Markings / Pavement Legends Each $175-$300
Bicycle Parking
Inverted “U” Rack (I rack parks 2 bikes) Each $250
Post and Ring Rack (1 rack parks 2 bikes) Each $200
Bicycle Locker (1 to 2 bikes per unit depending upon locker type) Each $1,500
Bus Bicycle Racks – Front Loading Each $600-$800
Notes: The above unit costs are for construction. These planning level estimates do not include contingencies, design, administrative, right-of-way acquisition costs, or inflation factors. ** Costs are highly variable depending upon conditions
A variety of bicycle rack and bicycle locker products and styles are available through local and national manufactures and retailers. The sample “styles” identified in Table 15 are intended for reference. Local agencies and developers are encouraged to utilize racks and lockers that are effective and appropriate for the context of the respective installation site.

St. Helena Bicycle Plan Page 56 January 2012
Program Costs
This plan includes a variety of collaborative programmatic improvements and actions that will help achieve the vision of increased bicycling throughout Napa County and bicycle safety improvements for each community. The programs and actions are important to help realize Plan vision and safety enhancements and should be implemented as soon as time and funding resources are available. Costs for individual programs and actions are highly variable and dependent upon the scope and scale of actions. For example, bicycle counts are often collected using volunteer labor which results in a significant savings. Other programs and actions can be carried out using existing staff resources and/or by utilizing existing media available free of charge from other transportation agencies such as safety education materials and/or public service announcements. Table 16 identifies the primary programmatic improvements, which are defined in greater detail in earlier sections, includes a range of estimated costs, a potential lead agency, likely partner agencies, and potential funding sources.
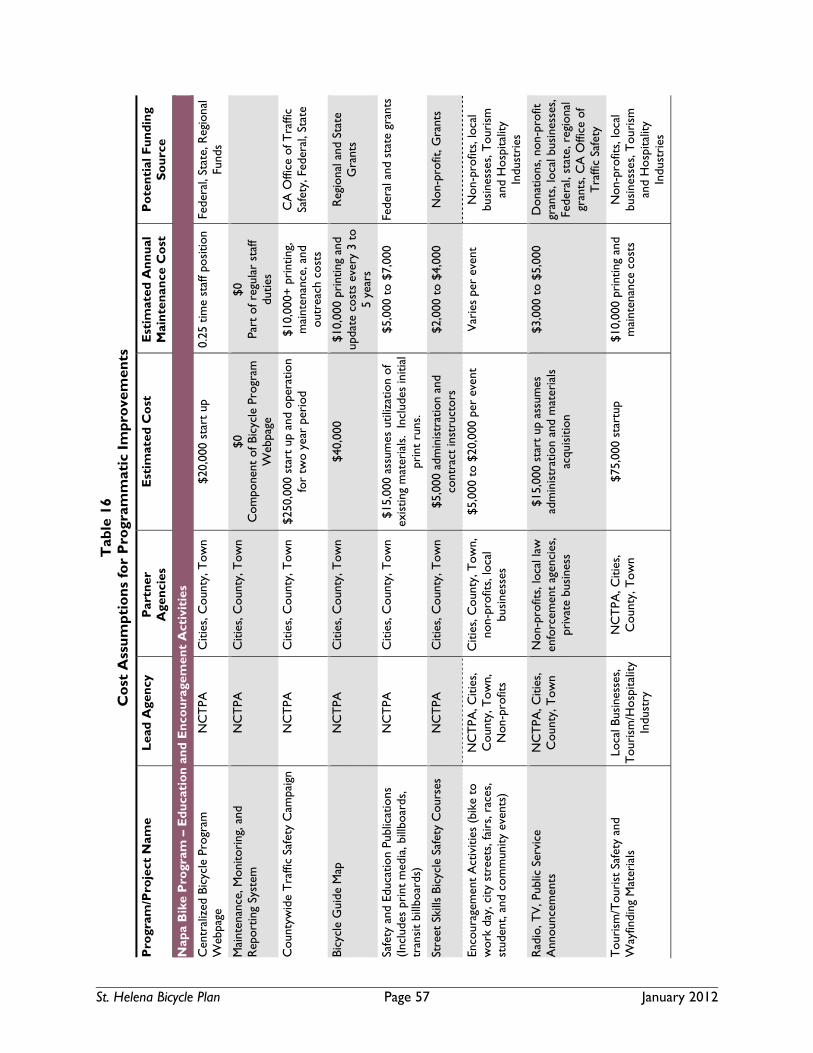
St. Helena Bicycle Plan Page 57 January 2012
Tab
le 1
6 C
ost
Ass
um
pti
on
s fo
r P
rogr
amm
atic
Im
pro
vem
ents
Pro
gram
/Pro
ject
Nam
e L
ead
Age
ncy
P
artn
er
Age
nci
es
Est
imat
ed C
ost
E
stim
ated
An
nu
al
Mai
nte
nan
ce C
ost
P
ote
nti
al F
un
din
g S
ou
rce
Nap
a B
ike
Pro
gram
– E
du
cati
on
an
d E
nco
ura
gem
ent
Act
ivit
ies
Cen
tral
ized
Bic
ycle
Pro
gram
W
ebpa
ge
NC
TPA
C
ities
, Cou
nty,
Tow
n $2
0,00
0 st
art
up
0.25
tim
e st
aff p
ositi
on
Fede
ral,
Stat
e, R
egio
nal
Fund
s
Mai
nten
ance
, Mon
itori
ng, a
nd
Rep
ortin
g Sy
stem
N
CT
PA
Citi
es, C
ount
y, T
own
$0
Com
pone
nt o
f Bic
ycle
Pro
gram
W
ebpa
ge
$0
Part
of r
egul
ar s
taff
dutie
s
Cou
ntyw
ide
Tra
ffic
Safe
ty C
ampa
ign
NC
TPA
C
ities
, Cou
nty,
Tow
n $2
50,0
00 s
tart
up
and
oper
atio
n fo
r tw
o ye
ar p
erio
d $1
0,00
0+ p
rint
ing,
m
aint
enan
ce, a
nd
outr
each
cos
ts
CA
Offi
ce o
f Tra
ffic
Safe
ty, F
eder
al, S
tate
Bicy
cle
Gui
de M
ap
NC
TPA
C
ities
, Cou
nty,
Tow
n $4
0,00
0 $1
0,00
0 pr
intin
g an
d up
date
cos
ts e
very
3 t
o 5
year
s
Reg
iona
l and
Sta
te
Gra
nts
Safe
ty a
nd E
duca
tion
Publ
icat
ions
(In
clud
es p
rint
med
ia, b
illbo
ards
, tr
ansi
t bi
llboa
rds)
NC
TPA
C
ities
, Cou
nty,
Tow
n $1
5,00
0 as
sum
es u
tiliz
atio
n of
ex
istin
g m
ater
ials
. In
clud
es in
itial
pr
int
runs
.
$5,0
00 t
o $7
,000
Fe
dera
l and
sta
te g
rant
s
Stre
et S
kills
Bic
ycle
Saf
ety
Cou
rses
N
CT
PA
Citi
es, C
ount
y, T
own
$5,0
00 a
dmin
istr
atio
n an
d co
ntra
ct in
stru
ctor
s $2
,000
to
$4,0
00
Non
-pro
fit, G
rant
s
Enco
urag
emen
t A
ctiv
ities
(bi
ke t
o w
ork
day,
city
str
eets
, fai
rs, r
aces
, st
uden
t, an
d co
mm
unity
eve
nts)
NC
TPA
, Citi
es,
Cou
nty,
Tow
n,
Non
-pro
fits
Citi
es, C
ount
y, T
own,
no
n-pr
ofits
, loc
al
busi
ness
es
$5,0
00 t
o $2
0,00
0 pe
r ev
ent
Var
ies
per
even
t N
on-p
rofit
s, lo
cal
busi
ness
es, T
ouri
sm
and
Hos
pita
lity
Indu
stri
es
Rad
io, T
V, P
ublic
Ser
vice
A
nnou
ncem
ents
N
CT
PA, C
ities
, C
ount
y, T
own
Non
-pro
fits,
loca
l law
en
forc
emen
t ag
enci
es,
priv
ate
busi
ness
$15,
000
star
t up
ass
umes
ad
min
istr
atio
n an
d m
ater
ials
ac
quis
ition
$3,0
00 t
o $5
,000
D
onat
ions
, non
-pro
fit
gran
ts, l
ocal
bus
ines
ses,
Fe
dera
l, st
ate,
reg
iona
l gr
ants
, CA
Offi
ce o
f T
raffi
c Sa
fety
Tou
rism
/Tou
rist
Saf
ety
and
Way
findi
ng M
ater
ials
Lo
cal B
usin
esse
s,
Tou
rism
/Hos
pita
lity
Indu
stry
NC
TPA
, Citi
es,
Cou
nty,
Tow
n $7
5,00
0 st
artu
p $1
0,00
0 pr
intin
g an
d m
aint
enan
ce c
osts
N
on-p
rofit
s, lo
cal
busi
ness
es, T
ouri
sm
and
Hos
pita
lity
Indu
stri
es

St. Helena Bicycle Plan Page 58 January 2012
Tab
le 1
6 C
ost
Ass
um
pti
on
s fo
r P
rogr
amm
atic
Im
pro
vem
ents
Pro
gram
/Pro
ject
Nam
e L
ead
Age
ncy
P
artn
er
Age
nci
es
Est
imat
ed C
ost
E
stim
ated
An
nu
al
Mai
nte
nan
ce C
ost
P
ote
nti
al F
un
din
g S
ou
rce
Bicy
cle
Park
ing
Prog
ram
N
CT
PA, C
ities
, C
ount
y, T
own,
loca
l bu
sine
sses
Non
-pro
fits
$20,
000
star
t-up
A
ssum
es d
esig
n, a
dmin
istr
atio
n,
site
sel
ectio
n
$5,0
00
Ann
ual i
nsta
llatio
n ex
pens
es
Bicy
cle
Tra
nspo
rtat
ion
Acc
ount
, sta
te a
nd
regi
onal
gra
nts
Way
findi
ng S
igni
ng C
ampa
ign
NC
TPA
C
ities
, Cou
nty,
Tow
n $7
5,00
0 A
ccou
nts
for
desi
gn a
nd
adm
inis
trat
ion
alon
g w
ith
inst
alla
tion
of a
ppro
xim
atel
y 25
0 si
gns
Cou
ntyw
ide
$5,0
00
Bicy
cle
Tra
nspo
rtat
ion
Acc
ount
, sta
te a
nd
regi
onal
gra
nts
Shar
e th
e R
oad
Cam
paig
n N
CT
PA
Citi
es, C
ount
y, T
own
$35,
000
Acc
ount
s fo
r de
sign
and
ad
min
istr
atio
n al
ong
with
in
stal
latio
n of
app
roxi
mat
ely
75
sign
s C
ount
ywid
e
$2,5
00
Bicy
cle
Tra
nspo
rtat
ion
Acc
ount
, sta
te a
nd
regi
onal
gra
nts,
gen
eral
fu
nd
Bicy
cle
Am
bass
ador
Pro
gram
(2
to 4
pa
rt-t
ime
pers
ons
Pote
ntia
l in
tern
ship
or
volu
ntee
r op
port
uniti
es)
NC
TPA
C
ities
, Cou
nty,
Tow
n $5
,000
Adm
inis
trat
ion
cost
s $2
,000
to
$5,0
00
Priv
ate
fund
ing,
non
-pr
ofits
, loc
al b
usin
esse
s
Bicy
cle
Shar
e Pr
ogra
m
NC
TPA
C
ities
, Cou
nty,
Tow
n,
loca
l bus
ines
ses
$5,0
00 p
er in
stal
latio
n si
te.
Doe
s no
t in
clud
e la
nd c
osts
. A
nnua
l ope
ratin
g co
sts
can
rang
e fr
om $
1,00
0 to
$2,
000
per
bike
Priv
ate
Fund
ing,
loca
l bu
sine
sses
, Tou
rism
an
d H
ospi
talit
y In
dust
ries
Loca
l Age
ncy
Bicy
cle
Flee
ts
Loca
l Age
ncie
s an
d N
CT
PA
Citi
es, C
ount
y, T
own
$3,0
00 t
o $6
,000
per
age
ncy
$250
to
$500
Bicy
cle
Div
ersi
on P
rogr
am
Nap
a C
ount
y C
ourt
s Lo
cal P
olic
e A
genc
ies
$5,0
00
Prog
ram
sta
rt-u
p $0
Pa
rt o
f ann
ual
oper
atin
g co
sts
Focu
sed/
Tar
gete
d En
forc
emen
t Lo
cal L
aw
Enfo
rcem
ent
Age
ncie
s
Citi
es, C
ount
y, T
own
$0
G
ener
al F
und,
CA
O
ffice
of T
raffi
c Sa
fety
G
rant
s
Bicy
cle
Cou
nts
Citi
es, C
ount
y,
Tow
n N
CT
PA, N
on-p
rofit
s,
volu
ntee
rs
$6,0
00
Prog
ram
sta
rt-u
p an
d ad
min
istr
atio
n
$3,5
00
Reg
iona
l Gra
nts

St. Helena Bicycle Plan Page 59 January 2012
Project Prioritization and Phasing
Project implementation priorities are identified in Table 12, the proposed project list. Projects are categorized as High, Medium, or Low to both indicate priority and provide flexibility in phasing and implementation. Project prioritization was developed using the qualitative analysis detailed previously. Project ranking and prioritization scores are presented in Appendix E. Prioritization of projects and phasing of improvements are presented as guidelines, as planned bikeway projects and programs are flexible.
Past Expenditures
Since completion of the 2003 Napa Countywide Bicycle Plan, St. Helena has spent approximately $100,000 on the construction of bicycle facilities. Additional funds have been spent on design, administration, environmental, and maintenance activities. Project improvements are listed in Table 17.
Table 17 Historical Expenditures on Bicycle Facilities
Project/Road Description Cost Estimate
Fiscal Year (FY)
Main Street Bicycle Parking Project Installation of bicycle racks at various locations along Main Street
$5,000 2010/11
Napa River Trail (Wappo Park) Development of Class I path along the Napa River though Wappo Park
$95,000 2011
Funding Resources
This section provides an overview of funding mechanisms available to implement the bicycle projects and programs contained in this plan. Due to its dynamic nature, transportation financing is complex. Implementation of bicycle facilities, improvements, and programs is made possible by a wide variety of funding sources including:
• Federal, State, Regional, and Local Governmental Sources • Private Sector Development and Investment • Community, Special Interest and Philanthropic Organizations
Federal, State, Regional, and Local Governmental Sources
The dollars used to fund transportation projects originate from a wide variety of government sources including federal and state fuel taxes, sales taxes, property taxes, transit fares, truck weight fees, vehicle registration fees, tolls, development fees, bonds, traffic fines, local general funds, and assessment districts, among others. Many transportation fund sources are closely tied to larger local, state, and national economic trends, and as a result, the availability of these funds can fluctuate with economic upturns and downturns.
In the San Francisco Bay Area, the flow of revenues for bicycle and pedestrian projects from source to implementing entity most often involves the California Department of Transportation (Caltrans), the regional Metropolitan Transportation Commission (MTC), to a limited extent, the Bay Area Air Quality Management District (BAAQMD), and at the local level, the Napa County Transportation Planning Agency (NCTPA). Funding for bicycle projects is possible from various sources that NCTPA facilitates. While the NCTPA does not own or operate bicycle facilities or services, the agency supports the implementation of projects and programs identified by its member agencies.

St. Helena Bicycle Plan Page 60 January 2012
At the federal, state, regional and local levels, transportation funds are divided into myriad funding programs. Each program is handled differently, depending on its size, eligible uses, and the agency responsible for making spending decisions. While some programs remain relatively consistent, the majority are dynamic, changing regularly with passage of legislation or as a result of administrative or programmatic adjustments. Moreover, many programs, especially at the regional level, are not funded from a single source; rather they are derived from a combination of federal and/or state funds. Government funds can be used for both non-infrastructure and infrastructure projects. Examples of the non-infrastructure or “programmatic” improvements include safe routes to school education and community traffic safety campaigns; examples of infrastructure projects include roadway rehabilitation, roadway construction, construction of Class I multi-use pathways and Class II bike lanes, and traffic signal infrastructure.
In general, federal funds are used for capital projects, such as new roadway, highway, and rail construction, as well as for specific projects earmarked by Congress. State funds are used for new capital projects too, but also cover maintenance costs, like street and highway resurfacing. Certain State funds may also be used as matching funds for larger federal projects, and/or to cover operational costs. Regional and local funds are often the most flexible, and may be used for capital project, maintenance, and operational costs, and programmatic improvements.
The primary implementers of infrastructure projects are city and county public works departments. Project selection is typically based on planning processes involving public participation. Additionally, schools and school districts can be the implementers of on-site bicycle and pedestrian infrastructure and amenities, such as sidewalks and bicycle racks; and/or for bicycle and pedestrian education programs and incentives. Other governmental partners are law enforcement agencies and parks and recreation departments. Such entities can sponsor enforcement and/or safety programs that are aimed at improving motorist, bicyclist and pedestrian behaviors to bring about greater community safety and security.
Redevelopment agencies are another source of governmental funding. Many redeveloped districts have incorporated bicycle and pedestrian facilities in their planning. Likewise, fees exacted from developers for project mitigation can potentially be used to accommodate pedestrians and bicyclists.
Private Sector Development and Investment
Private sector development and investment play an important role in funding non-motorized infrastructure. Many newer housing and retail developments throughout Napa County have been planned, or required, to include sidewalks, pathways, and bicycle facilities. Private development is expanding its focus on “smart growth” and balanced transportation options. This inherently builds in orientation to the bicycle and pedestrian modes. Sometimes developers also fund such amenities as bicycle racks, bicycle storage, benches, lockers and shower facilities. Additionally, in many locations improvements such as closure of gaps in sidewalks or road widenings are made only after a private land use change is approved. Improvements or right-of-way dedication can be made conditions of approval, allowing upgrades for bicyclists and pedestrians. Finally, both the government and the private sector can play important roles in providing employee programs that encourage walking and bicycling, as well as use of transit.
Community, Special Interest and Philanthropic Organizations
Other non-governmental sources of funding include the contributions of community-based organizations, such as the Napa County Bicycle Coalition, in carrying out programs that support bicycle usage. Examples include Bike to Work Day efforts, bicycle valet parking at events, education programs, and community bike rides. Special-interest groups have made contributions toward non-motorized improvements and programs if such are in alignment with group objectives. Sometimes the contribution is monetary; at other times in the form of volunteer efforts, such as path or trail upkeep programs.

St. Helena Bicycle Plan Page 61 January 2012
Philanthropic entities including non-profit, foundation, and corporate organizations and individuals can fund programs, and at times facilities. Donations and grants have paid for community amenities such as pathways and trails; landscaping, fountains and other aesthetic improvements; and street furniture such as bicycle racks, lighting and seating benches. The latter “beautification” efforts create bicycle and pedestrian friendly environments.
Construction Projects
Because this Plan’s planning process has generated a ranked list of construction projects for each entity, additional information about the sources of infrastructure financing will be useful. Bicycle projects are eligible for funding through a variety of program sources. However, while a portion of the funds available for such improvements are programmed or ‘guaranteed’ to the local agencies based on various formulas, the majority of the funds are available through a competitive process at the state, regional, or local level. Thus while improvements to major roadways are likely to be financed through programmed transportation funds, the majority of the projects contained in this Plan are likely to be funded through competitive grant programs or some combination of the two sources.
To ensure timely implementation of the projects contained in this plan, it will be incumbent upon the local agencies to pursue competitive source funds, which are expected to account for the majority of funds available to implement the projects in this Plan. Competition for these limited funds can be intense, especially at the state and regional levels where often hundreds of applicants compete for monies from impacted programs. Therefore, competitive programs typically require the development of extensive applications with clear documentation of the project need, costs, and benefits, along with maps, schedules, letters of support, and proposed work scopes. A local match of between 10 and 15 percent is typically required; however, some programs require a dollar for dollar match. While the development of applications combined with securing local matching funds can be challenging, competitive source funding programs represent an outstanding opportunity to secure funds for local improvements.
Costs and Implementation
This section provides an overview of the costs, implementation strategies, and actions that are necessary to implement the projects and programs that have been identified in this Plan.
Project Costs
Planning level cost estimates were developed for this effort. Bicycle project cost estimates were developed by utilizing available information on each proposed project including segment length, corridor condition, and other available information. Each segment was evaluated according to an estimated cost-per-mile based on the recommended facility type. Unit costs were developed by researching the latest unit costs experienced by local agencies in Napa County and the North Bay; and were reviewed by agency staff for verification.
Proposed projects and programs in this Plan have been analyzed to determine financing requirements, and to allow the entities to budget their resources and target available funding sources. It is important to note that the majority of funding for the projects contained in this Plan is expected to be derived from competitive funding sources that require a combination of sound applications, local support, and lobbying on the regional and state level. To help with project implementation, potential funding sources for improvement projects have been identified in Table 12. Figure 7 contains a calendar overview of primary competitive source programs to provide an understanding of funding program timelines. Since the programs are dynamic, often changing annually, the calendar is formatted on a quarterly basis. It provides a 12-week time to provide guidance on when calls for projects are typically released and application deadlines occur. Summaries of funding programs including weblinks are provided in Appendix F.

St. Helena Bicycle Plan Page 62 January 2012
Gra
nt A
pplic
atio
n D
evel
opm
ent C
alen
dar
Ag
ency
Pro
gra
mE
stim
ated
Du
e D
ate
Cal
tran
sH
ighw
ay S
afet
y Im
prov
emen
t Pro
gram
4th
Qua
rter
Cal
tran
sT
rans
port
atio
n E
nhan
cem
ents
(S
tate
wid
e)4t
h Q
uart
erS
tate
Par
ksR
ecre
atio
nal T
rails
Pro
gram
4th
Qua
rter
Cal
tran
sB
icyc
le T
rans
port
atio
n A
ccou
nt1s
t Qua
rter
Cal
tran
sS
afe
Rou
te to
Sch
ool
3rd
Qua
rter
OT
SO
TS
Gra
nts
1st Q
uart
erC
altr
ans
Env
ironm
enta
l Enh
ance
men
t & M
itiga
tion
Pro
gram
4th
Qua
rter
CA
Coa
stal
CoO
n-go
ing
Coa
stal
Con
serv
ancy
Gra
nts
On-
goin
gS
tate
Par
ksH
abita
t Con
serv
atio
n F
und
Pro
gram
4th
Qua
rter
Sta
te P
arks
Land
and
Wat
er C
onse
rvat
ion
Fun
d P
rogr
am4t
h Q
uart
erC
altr
ans
Cal
tran
s T
rans
port
atio
n P
lann
ing
Gra
nts
1st Q
uart
erM
TC
Tra
nspo
rtat
ion
for
Liva
ble
Com
mun
ities
*B
AA
QM
DB
AA
QM
D -
Bic
ycle
Fac
ility
Pro
gram
3rd
Qua
rter
BA
AQ
MD
Tra
nspo
rtat
ion
for
Cle
an A
ir P
rogr
am2n
d Q
uart
erM
TC
Reg
iona
l Bic
ycle
and
Ped
estr
ian
Pro
gram
*A
BA
GB
ay T
rail
Fun
dsO
n-go
ing
CM
AT
DA
-Art
icle
31s
t Qua
rter
* V
arie
s ba
sed
on fe
dera
l fun
ding
Pro
ject
Sel
ectio
n an
d D
evel
opm
ent
Pro
ject
App
licat
ion
Pre
para
tion
Nov
Dec
Sep
Oct
Aug
Jan
Feb
Mar
Apr
Jul
May
Jun
Fig
ure
7 –
Gra
nt A
pplic
atio
n D
evel
opm
ent
Cal
enda
r
St. Helena Bicycle Plan Page 63 January 2012
Definitions, Terms, and List of Acronyms
AASHTO – American Association of State Highway and Transportation Officials
Accessible – Characteristic of a location allowing approach and use; absence of barriers
Accessible Pathway – Unobstructed path connecting all accessible elements and spaces of a building or a facility that meets the requirements of ADAAG
Accessible Pedestrian Signal (APS) – A device that communicates information about pedestrian signal timing in non-visual format, through the use of audible tones (or verbal messages) and vibrating surfaces
ADAAG – ADA Accessibility Guidelines for Buildings and Facilities
Americans with Disabilities Act (ADA) – A Federal law prohibiting discrimination against people with disabilities. Requires public entities and public accommodations to provide accessible accommodations for people with disabilities
AQMD – Air Quality Management District
Arterial – Through route/street carrying traffic to and from major points of interest, often inter-city
BAC – Bicycle Advisory Committee
Bicycle Boulevard – A low volume or residential street that has been modified for bicyclist safety and access.
Bicycle Connection – Paths or roadways created to link bicycle users with major streets/corridors
Bicycle Facilities – A general term denoting improvements and provisions to accommodate or encourage bicycling, including parking facilities, all bikeways and shared roadways, bicycle activated signal infrastructure, bicycle storage and changing facilities, etc.
Bicycle Lane (Class II Bike Lane or Class II Bikeway) – A portion of a roadway that has been designated by striping, signing, and pavement markings for the preferential or exclusive use of bicyclists. Bike lanes are ideal for minor thoroughfares or collectors. Under certain conditions, bike lanes may be beneficial on streets with significant traffic volumes and/or speeds. The Highway Design Manual (HDM) specifies the minimum width for bike lanes under various curb and on-street parking conditions. The HDM also states that “for greater safety,” widths wider than the minimums should be provided “wherever possible.”
Bicycle Path (Class I Multi-Use Path or Class I Bike Path) – A bikeway physically separated from motorized vehicular traffic and either within the highway right-of-way or within an independent right-of-way. Bike paths have a minimum paved width of 8 feet, with an additional graded area maintained on each side of the path. Typically, these facilities are usually shared with other non-motorized modes of travel.
Bicycle “Network” – the physical improvements that establish bikeways (Class I, II, or III routes)
Bicycle Route (Class III Bike Route or Class III Bikeway) – a designated route that provides for shared use of paved surfaces with pedestrian or motor vehicle traffic, also termed “shared roadway” designated by appropriate directional and/or informational signs. In this plan, a Class 3 signed bike route may be a local or residential street, bicycle boulevard, an arterial with wide outside lanes, or a roadway with a paved shoulder.
Bicycle “System” – the whole of all of the components, including both physical bikeways and programmatic improvements

St. Helena Bicycle Plan Page 64 January 2012
Bicyclist Demand – Number determined by count of recreational and non-recreational bike trips during a specific duration of time (i.e. peak commute, weekly, monthly, etc.) on a given street/corridor
Bikeway – Any path or roadway with a provision for transportation or recreational use by bicyclists
Bikeway Network – The combined system of all bikeway types and amenities; connects destinations and attractions via bicycle accessible routes
Bollards – A rigid post placed in a through fare so as to limit access or traffic of certain widths or types
BPAC – Bicycle & Pedestrian Advisory Committee
BTA – Bicycle Transportation Account
Caltrans – California Department of Transportation
CARB – California Air Resources Board
CEQA – California Environmental Quality Act
Circulation Enhancements – Elements placed to modify and improve circulation for one or more modes of transportation
CMAQ – Congestion Mitigation and Air Quality Program
Connectivity – The relative relationship of transportation routes and access corridors to necessary resources and points of interest
Controlled Intersection – Area with a traffic light or other traffic control device where traffic flow from two or more paths or roadways meet
Corridor – An area that follows the shape and path of a major environmental feature; also a term used for transportation routes with designated district activities such as a mixed use-retail corridor
Crosswalk – Portion of a roadway where pedestrians are permitted to cross the street; can be marked or unmarked
CTC – California Transportation Commission
Curb Ramp – A combined ramp and landing that accomplishes a change in level at a curb. This element provides street and sidewalk access to pedestrians using wheelchairs
Design Guidelines – Specifications set to govern the physical or visual elements of development
Detectable Warning – A standardized surface feature built in or applied to walking surfaces or other elements to warn people who are blind or visually impaired of specified hazards
Existing Conditions – Current context of a site, including physical, demographic and political data
FAS – Federal Aid System
FHWA – Federal Highway Administration
FTA – Federal Transit Administration
FTIP – Federal Transportation Improvement Program

St. Helena Bicycle Plan Page 65 January 2012
Gateway – A designated or marked entrance to a pathway or area
Goal – a "goal" describes the destination, or where we want to be at the end of the planning journey. Goals are usually broad, optimistic and expressive of a long-term vision.
Greenway – A pathway for various modes of transportation, including bicycles, that contains elements of a linear park
Infill Development – Development of new building adjacent to or on the same lots as existing buildings, utilizes pockets of un- or underdeveloped real estate contiguous with existing development
Infrastructure – Physical structures that support basic uses and services
Intersection – Where traffic flow from two or more paths or roadways meet
ISTEA – Intermodal Surface Transportation Efficiency Act of 1991 (reauth’d 1998 as TEA-21, and 2006 at SAFTEA-LU)
JARC – Job Access and Reverse Commute Program
Landscaping – Alteration of the ground through grading, planting and contouring
LTF – Local Transportation Fund
Median – A barrier (paved, landscaped, or planted) separating two traffic through fares
Median Refuge – An area within an island or median that is intended for pedestrians to wait safely away from travel lanes for an opportunity to continue crossing the roadway
Midblock Crosswalk – A legally established crosswalk that is not at an intersection
Mode Split – the number of people using a particular mode of transportation (bicycle, public transit, vehicle, walking, etc.)
MPO – Metropolitan Planning Organization
MTC – Metropolitan Transportation Commission – The Metropolitan Transportation Commission is the transportation planning, coordinating and financing agency for the nine-county San Francisco Bay Area
MUTCD – Manual on Uniform Traffic Control Devices
NCTPA – Napa County Transportation Planning Agency
NEPA – National Environmental Quality Act
Objective – objectives describe mileposts along the way to achieving the goals. They are specific, measurable steps to be achieved if the overall goals are to be met.
Paved Shoulder – The part of the highway/street that is adjacent to the regularly traveled portion of the highway, is on the same level as the highway, and when paved can serve as a bikeway. Paved shoulders should be at least four feet wide and additional width is desirable in areas where speeds are high and/or a large percentage of trucks use the roadway.
Paving Treatments – a variety of materials, utilitarian and /or decorative used to level and condition pathway and roadway surfaces
St. Helena Bicycle Plan Page 66 January 2012
Pedestrian Accessibility – the relative ease with which a location can be approached and utilized by pedestrian traffic
Policy – a principle or rule to guide decisions by the local agency with regard to a particular issue or set of issues.
Primary Bikeway Network – a continuous countywide network of on- and off-street bikeways that extend between and through communities developed specifically through this planning effort. The Primary Bikeway Network consists of a selection of existing and proposed Class I, Class II, and Class III bikeways that provide inter-city and inter-county routes along with connections to other transportation modes, major destinations, jobs, neighborhoods, recreation, and local bicycle networks.
Program – a specific action to accomplish the policy or objective
PSR – Project Study Report
Public Improvements – additions to public space intended to increase value and functionality
Public Transit – a system of multi-user transportation incorporating light rail, busses, ferries, streetcars, aerial trams, commuter trains
PUC – Public Utilities Commission / Public Utilities Code
Regional Trail System – a trail system that cross jurisdictional lines
Right of Way – the right of a vehicle or pedestrian to proceed in a lawful manner in preference to another vehicle or pedestrian. (2) A general term denoting land, property, or interest therein, usually in a strip. (3) Land designated for transportation purposes, usually in the public sphere
RPA – Rural Planning Assistance
RSTP – Regional Surface Transportation Program
RTIP – Regional Transportation Improvement Program
RTP – Regional Transportation Plan
RTPA – Regional Transportation Planning Agency
Safe Routes to Schools – a nationwide program focusing efforts on improving the paths and routes used by children to commute to and from school
SHA – State Highway Account
SHOPP – State Highway Operation and Protection Program
Shared Lane Markings (Sharrows) – pavement legends which may be placed in the travel lane to provide positional guidance to bicyclists on roadways that are too narrow to be striped with bike lanes
Shoulder – Any portion of a roadway to the right of the right-most travel lane, but not including curbs, planting buffers and sidewalks. Shoulders can have a variety of surface treatments including pavement, gravel or grass. Depending on their width and surface, they serve a variety of purposes, including providing space for vehicles to slow and turn right, accommodation of stopped or broken-down vehicles, to allow emergency vehicles to pass, for structural support of the roadbed, or for bicycle and pedestrian travel.

St. Helena Bicycle Plan Page 67 January 2012
Sidepath – An informal term referring to a portion of a street or highway right-of-way, separated from motor vehicle traffic, and designed for non-motorized modes of travel, including bicycles
STA – State Transit Assistance
STIP – State Transportation Improvement Program
STP – Surface Transportation Program
Streetscape – the overall appearance and functionality of the roadway, incorporating the rights-of-way, landscaping, built features and adjacent land uses
Subdivision – an area that has been divided into smaller lots for individual development
TAC – Technical Advisory Committee, a committee made up of citizens and technical professionals, convened to create recommendations for the development of a plan
TDA – Transportation Development Act of 1971
TE – Transportation Enhancement Program (formerly TEA)
TEA-21 – Transportation Equity Act for the 21st Century (1998 – formerly ISTEA)
Title 24 Standards – administrative, building, mechanical, and safety codes set forth in the California Code of Regulations
Traffic Congestion – roadway condition characterized by reduced travel speeds or even complete stoppage of flow of vehicles
Transportation Routes – all widely used paths and roadways
USDOT – United States Department of Transportation
Utilitarian Trips – all trips made to secure basic needs and services; e.g. grocery, pharmacy, local commerce
VMT – vehicle miles traveled
Wide Outside Lane – an outside (curb) lane on a roadway that does not have a striped bike lane, but may be of sufficient width for a bicyclist and motorist to share the lane with a degree of separation
Wrong-Way Riding – riding against the flow of traffic
Zoning – regulation by a governing agency to specify permitted land uses for a given area

St. Helena Bicycle Plan Page 68 January 2012
Bibliography
California Manual on Uniform Traffic Control Devices for Streets and Highways, California Department of Transportation, 2010
California Vehicle Code, California Department of Motor Vehicles, 2011 Caltrans Bicycle Transportation Account, http://www.dot.ca.gov/hq/LocalPrograms/bta/btawebPage.htm Factors Contributing to Pedestrian and Bicycle Crashes on Rural Highways, Federal Highway Administration,
2010 Guide for the Development of Bicycle Facilities, American Association of State Highway and Transportation
Officials, 1999 Guidelines for Analysis of Investments in Bicycle Facilities, Transportation Research Board, 2006 Napa Valley Visitor Profile Study, Purdue University Tourism and Hospitality Research Center, 2005 Revised Draft St. Helena General Plan Update 2030, City of St. Helena, 2010 SCTA Countywide Bicycle & Pedestrian Master Plan, Sonoma County Transportation Authority, 2008 St. Helena Municipal Code, Code Publishing Company, 2011 Statewide-Integrated Traffic Records System (SWITRS), California Highway Patrol, 1999-2008 United States Census 2000, United States Census Bureau, 2000 VINE, http://www.nctpa.net/vine.cfm

St. Helena Bicycle Plan January 2012
Appendix A
Summaries of Relevant Planning Documents and Policies


Existing Plan and Policy Review A-1 January 2012
Appendix A – Existing Plan and Policy Review
Federal
Safe, Accountable, Flexible, Efficient, Transportation Equity Act: A Legacy for Users (SAFETEA-LU)
Federal Transportation Legislation sets policy, addresses challenges, and provides funding for federal and a variety of state and regional transportation programs throughout the nation. In August 2005, the Safe, Accountable, Flexible, Efficient Transportation Equity Act: A Legacy for Users (SAFETEA-LU) was signed into law. SAFETEA-LU, which will run through December 31, 2010, replaces TEA-21, the Transportation Equity Act for the 21st Century.
The new bill provides $286.5 billion nationwide for surface transportation projects, including highways, mass transit, road safety programs, and bicycle and pedestrian improvements. SAFETEA-LU builds on the initiatives established in TEA-21 and its predecessor, ISTEA. It combines the continuation and improvement of current programs with new initiatives to meet the challenges of improving safety, increasing multi-modal transportation options, reducing traffic congestion, and protecting and enhancing communities and the natural environment through efficient and flexible transportation improvements.
SAFETEA-LU promotes more efficient and effective Federal surface transportation programs by focusing on transportation issues of national significance, while giving State and local transportation decision makers more flexibility for solving transportation problems in their communities.
Policy:
Federal transportation policy is to increase non-motorized transportation to at least 15 percent of all trips and to simultaneously reduce the number of non-motorized travelers killed or injured in traffic collisions by at least 10 percent (TEA-21, 1998). This policy, which was adopted in 1994 as part of the National Bicycling and Walking Study, remains a high priority for the U.S. Department of Transportation (USDOT). Federal Transportation Legislation provides the funding opportunities, planning processes, and policy language by which states and metropolitan areas can achieve these ambitious national goals.
http://www.fhwa.dot.gov/safetealu/index.htm
US DOT Accommodating Bicycle and Pedestrian Travel
“Accommodating Bicycle and Pedestrian Travel: A Recommended Approach” is a policy statement that was adopted by the U.S. Department of Transportation (USDOT) in response to TEA-21. USDOT encourages public agencies, professional organizations, advocacy groups, and any other groups involved in transportation issues to adopt this policy to further promote bicycling and walking as viable components of the transportation system. The policy statement address measures to improve bicycle and pedestrian access, convenience, and safety in transportation projects. It incorporates three key principles:
a. policy statement that bicycling and walking facilities will be incorporated into all transportation projects unless exceptional circumstances exist;
b. an approach to achieving this policy that has already worked in State and local agencies; and c. a series of action items that a public agency, professional association, or advocacy group can
take to achieve the overriding goal of improving conditions for bicycling and walking.
Finally, the policy statement notes that:
The challenge for transportation planners, highway engineers and bicycle and pedestrian user groups, therefore, is to balance their competing interest in a limited amount of right-of-way, and to develop a

Existing Plan and Policy Review A-2 January 2012
transportation infrastructure that provides access for all, a real choice of modes, and safety in equal measure for each mode of travel.
http://www.fhwa.dot.gov/environment/bikeped/design.htm
Federal Americans with Disabilities Act (ADA)
In 1990, Congress passed the Americans with Disabilities Act (ADA), which provides comprehensive rights and protections to people with disabilities in the areas of employment, public accommodations, state and local government services, and telecommunications. Title II of the ADA requires that new and altered facilities constructed by, on behalf of, or for the use of state and local government entities be designed to be readily accessible to and usable by people with disabilities (28 CFR 35.151).
Title II also requires that public entities prepare and submit “transition plans,” which identify alterations that are needed to make their facilities (including transportation networks) and programs accessible; and specify how those alterations will be accomplished. ADA transition plans must include a schedule for providing curb ramps where pedestrian walkways cross curbs, giving priority to walkways serving government offices, public transportation and other public places.
http://www.usdoj.gov/crt/ada/adahom1.htm
Revised Draft Guidelines for Accessible Public Rights-of-Way, US Access Board
The goal of the ADA is to assure equality of opportunity, full participation, independent living, and economic self-sufficiency. Under the ADA, the US Access Board has developed and continues to maintain design guidelines for accessible buildings and facilities known as the ADA Accessibility Guidelines (ADAAG). ADAAG covers a wide variety of facilities including roadway design practices, slope and terrain issues, and pedestrian access to streets, sidewalks, curb ramps, street furnishings, pedestrian signals, parking, and other components of public rights-of-way. The ADAAG establishes minimum requirements for new construction and alterations.
The Board’s aim is to ensure that access for persons with disabilities is provided wherever a pedestrian way is newly built or altered, and that the same degree of convenience, connection, and safety afforded the public generally is available to pedestrians with disabilities. The guidelines do not require alterations to existing public rights-of-way, but apply where a pedestrian route or facility is altered as part of a planned project to improve existing public rights-of-way.
http://www.access-board.gov/prowac/draft.htm
Federal Statutes – State
Title 23, CFR Sec §450.214 (b) (3) The State shall develop a statewide transportation plan for all areas of the State and contain, as an element, a plan for bicycle transportation, pedestrian walkways and trails which is appropriately interconnected with other modes.
Title 23, CFR Sec §450.214 (b) (4) The State shall develop a statewide transportation plan that is coordinated with the metropolitan transportation plans required under 23 U.S.C. 134.
Title 23, U.S.C. Sec. 135 (a) (3). The plans and programs for each State shall provide for the development and integrated management and operation of transportation systems and facilities (including pedestrian walkways and bicycle transportation facilities) that will function as an intermodal transportation system for the State and an integral part of an intermodal transportation system for the United States.
Title 23 U.S.C. 217(g) Planning and Design. Bicyclists and pedestrians shall be given due consideration in the comprehensive transportation plans developed by each metropolitan planning organization and state in accordance with sections 134 and 135, respectively. Bicycle transportation facilities and pedestrian

Existing Plan and Policy Review A-3 January 2012
walkways shall be considered, where appropriate, in conjunction with all new construction and reconstruction of transportation facilities, except where bicycle and pedestrian use are not permitted.
Federal Statues – Metropolitan Planning Organizations
Title 23, CFR §450.322 The Metropolitan Transportation Plan shall contain adopted congestion management strategies including, as appropriate, traffic operations, ridesharing, pedestrian and bicycle facilities, alternative work schedules, freight movement options, high occupancy vehicle treatments, telecommuting, and public transportation improvements (including regulatory, pricing, management, and operational options), that demonstrate a systematic approach in addressing current and future transportation demand and identify pedestrian walkway and bicycle transportation facilities in accordance with 23 U.S.C. 217(g).
Title 23, U.S.C. Sec. 134 (a) (3) The plans and programs for each metropolitan area shall provide for the development and integrated management and operation of transportation systems and facilities (including pedestrian walkways and bicycle transportation facilities) that will function as an intermodal transportation system for the metropolitan area and as an integral part of an intermodal transportation system for the State and the United States.
State
State bicycle and pedestrian related policies and laws are found in a variety of documents, legislative actions, and codes. State policies are generally more focused than Federal policies and statutes, and are applicable to Federal and state transportation facilities, as well as local bicycle and pedestrian projects.
California Streets and Highways Code, Division 1: State Highways, Chapter 8 Non-Motorized Transportation – California Bicycle Transportation Act, 890-894 (1994)
The California Bicycle Transportation Act, Streets and Highways Code 890-894 is legislation that seeks "to establish a bicycle transportation system designed and developed to achieve the functional commuting needs of the employee, student, business person, and shopper as the foremost consideration in route selection, to have the physical safety of the bicyclist and bicyclist's property as a major planning component, and to have the capacity to accommodate bicyclists of all ages and skills."
A city or county may complete a bicycle transportation plan pursuant to Section 891.2 in order for their project to be considered by the Department for funding. Section 890.6 states the Department, in cooperation with county and city governments, shall establish minimum safety design criteria for the planning and construction of bikeways and roadways where bicycle travel is permitted. Section 890.8 states the Department shall establish uniform specifications and symbols for signs, markers, and traffic control devices to designate bikeways, regulate traffic, improve safety and convenience for bicyclists, and alert pedestrians and motorists of the presence of bicyclists on bikeways and on roadways where bicycle travel is permitted. As Section 891 states, “All city, county, regional, and other local agencies responsible for the development or operation of bikeways or roadways where bicycle travel is permitted shall utilize all minimum safety design criteria and uniform specifications and symbols for signs, markers, and traffic control devices established pursuant to Sections 890.6 and 890.8.”
http://www.leginfo.ca.gov/.html/shc_table_of_contents.html
California Vehicle Code
The California Vehicle Code is an extensive body of laws which regulate all facets of driving in California. The Vehicle Code is nearly 700 pages long and covers everything to do with roads and driving, including pedestrians and bicyclists.

Existing Plan and Policy Review A-4 January 2012
Sections 2149-21971 describe the responsibilities of pedestrians when crossing the street or walking along a street on a sidewalk, and the roles and responsibilities of motorists in relationship to pedestrians and wheelchair users. According to the Vehicle Code, "it is the policy of the State of California that safe and convenient pedestrian travel and access, whether by foot, wheelchair, walker, or stroller, be provided to the residents of the state." The code also states that it is the intent of the Legislature that all government levels, especially Caltrans and other DOTs, will work to provide safe, convenient passage for pedestrians on or across all streets and highways, increase levels of walking, and reduce pedestrian fatalities and injuries.
Sections 21200-21212 pertain to the operation of bicycles including laws applicable to bicycle use, operating bicycles on a roadway, bicycle parking, and bicycle regulations. Sections 39000-39011 pertain to the licensing and registration of bicycles. Section 21200 states that “every person riding a bicycle upon a street or highway has all the rights and is subject to all the duties applicable to the driver of a vehicle,” and the CVC permits the use of bicycles on all streets and highways, except where restricted on Freeways by discretion of the State DOT or local authorities as identified in Section 21960.
http://www.dmv.ca.gov/pubs/vctop/vc/vc.htm
Chapter 1000, California Highway Design Manual
Highway Design Manual, Chapter 1000, “Bikeway Planning and Design. The Highway Design Manual, Chapter 1000, “Bikeway Planning and Design,” provides design standards and guidelines for on- and off-street bikeways. State and local transportation agencies are required to comply with Chapter 1000 mandatory standards as a minimum when implementing new bikeways. Chapter 1000 differs from the rest of the Highway Design Manual in that it also applies to facilities off the State Highway System (California Streets and Highways Code, Sections 890.8 and 891).
www.dot.ca.gov/hq/oppd/hdm/hdmtoc.htm
California Manual on Uniform Traffic Control Devices (CA MUTCD), 2006
The MUTCD provides general standards and guidance for traffic control devices, nationally. The California MUTCD clarifies which policies, practices or standards are different in California, by identifying and including them. It also enhances the federal standards by providing additional details.
The California Manual on Uniform Traffic Control Devices (California MUTCD) is published by the State of California, Department of Transportation and is issued to adopt uniform standards and specifications for all official traffic control devices, in accordance with Section 21400 of the California Vehicle Code.
http://www.dot.ca.gov/hq/traffops/signtech/mutcdsupp/ca_mutcd.htm
California Blueprint for Bicycling and Walking
The Supplemental Report of the 2001 Budget Act required the California Department of Transportation (Caltrans) to submit a report addressing “measurable goals for increasing bicycling and walking within the state, funding of facilities, and a reduction in pedestrian and bicycling injuries and fatalities.” The California Blueprint for Bicycling and Walking responds to the Budget Act requirements with three main statewide goals:
• A 50 percent increase in bicycling and walking trips by 2010. • A 50 percent decrease in bicycle and pedestrian fatality rates by 2010. • Increased funding for bicycle and pedestrian programs.
Achieving the first two goals lies largely on local agencies. Policies and programs in this Plan will allow Napa County and its cities to actively work towards fulfilling these goals.
http://www.dot.ca.gov/hq/tpp/offices/bike/CABlueprintRpt.pdf

Existing Plan and Policy Review A-5 January 2012
Caltrans Project Development Procedures Manual, CHAPTER 31 – Non-motorized Transportation Facilities
The Office of State Project Development Procedures and Quality Improvement in the Division of Design is responsible for the development and consistent application of Caltrans' policies for the project development process. The office maintains the Project Development Procedures Manual (PDPM), to provide guidance for project development on State Highway System projects. While the emphasis of the PDPM is directed toward State highway projects, projects on local transportation systems and other modes are also discussed. Chapter 31: Non-motorized Transportation Facilities outlines pertinent statutory requirements, planning policies, and implementing procedures regarding non-motorized transportation facilities.
http://www.dot.ca.gov/hq/oppd/pdpm/chap_htm/chapt31/chapt31.htm
Caltrans Deputy Directive-64-R1 (DD-64-R1), Deputy Directive on “Complete Streets-Integrating the Transportation System”
Deputy Directive 64-R1, a policy directive related to “Complete Streets” non-motorized travel throughout the state, was adopted by Caltrans in October of 2008. DD 64-R1 supersedes DD 64, which was developed to consider the needs of non-motorized travelers. DD 64-R1 reads:
The California Department of Transportation (Department) provides for the needs of travelers of all ages and abilities in all planning, programming, design, construction,' operations, and maintenance activities and products on the State highway system. The Department views all transportation improvements as opportunities to improve safety, access, and mobility for all travelers in California and recognizes bicycle, pedestrian, and transit modes as integral elements of the transportation system.
The Department develops integrated multimodal projects in balance with community goals, plans, and values. Addressing the safety and mobility needs of bicyclists, pedestrians, and transit users in all projects, regardless of funding, is implicit in these objectives. Bicycle, pedestrian, and transit travel is facilitated by creating "complete streets" beginning early in system planning and continuing through project delivery and maintenance and operations. Developing a network of "complete streets" requires collaboration among all Department functional units and stakeholders to establish effective partnerships.
http://www.dot.ca.gov/hq/tpp/offices/bike/guidelines_files/DD64.pdf
Director’s Policy 22 (DP-22), “Director’s Policy on Context Sensitive Solutions”
Directors Policy 22, a policy regarding the use of “Context Sensitive Solutions” on all state highways, was adopted by Caltrans in November of 2001. The policy reads:
The Department uses “Context Sensitive Solutions” as an approach to plan, design, construct, maintain, and operate its transportation system. These solutions use innovative and inclusive approaches that integrate and balance community, aesthetic, historic, and environmental values with transportation safety, maintenance, and performance goals. Context sensitive solutions are reached through a collaborative, interdisciplinary approach involving all stakeholders.
The context of all projects and activities is a key factor in reaching decisions. It is considered for all State transportation and support facilities when defining, developing, and evaluating options. When considering the context, issues such as funding feasibility, maintenance feasibility, traffic demand, impact on alternate routes, impact on safety, and relevant laws, rules, and regulations must be addressed.
The policy recognizes that “in towns and cities across California, the State highway may be the only through street or may function as a local street,” that “these communities desire that their main street be an economic, social, and cultural asset as well as provide for the safe and efficient movement of people and goods”, and that “communities want transportation projects to provide opportunities for
Existing Plan and Policy Review A-6 January 2012
enhanced non-motorized travel and visual quality.” The policy acknowledges that addressing these needs will assure that transportation solutions meet more than just traffic and operational objectives.
http://www.dot.ca.gov/hq/transprog/stip/2004%20ITIP/references/DP-22.pdf
Assembly Concurrent Resolution No. 211 (ACR 211)
California’s cities and counties have even more reason to pay attention to the aforementioned policies. ACR 211 (Nation) “Integrating walking and biking into transportation infrastructure” became effective in August 2002. ACR 211 encourages all cities and counties to implement the policies of DD-64 and the USDOT design guidance document when building local transportation infrastructure. Specifically, ACR 211 asks local governments to "fully consider the needs of non-motorized travelers (including pedestrians, bicyclists and person with disabilities) in all programming, planning, maintenance, construction, operations, and project development activities and projects.” The resolution also states that bicycling and walking contribute to cleaner air, encourage physical activity, provide for alternative transportation, help to safeguard California's coast from offshore oil drilling, and enhance California's energy independence and national security by reducing our reliance upon imported oil.
http://www.leginfo.ca.gov/pub/01-02/bill/asm/ab_0201-0250/acr_211_bill_20020820_chaptered.html
California Department of Motor Vehicles
The California Department of Motor Vehicles maintains a webpage dedicated to bicycle rules and safety. The page contains information for drivers and bicyclists and includes links to the Bicycle Section of the DMV Driver’s Handbook, bicycle safety information on the California Department of Transportation’s website, information on the National Highway Transportation Safety Agency and the California Vehicle Code as well as other links.
http://www.dmv.ca.gov/about/bicycle.htm
Caltrans Bicycle Transportation Account
The California Bicycle Transportation Account (BTA) provides state funds for city and county projects that improve safety and convenience for bicycle commuters, which are included in an adopted local Bicycle Transportation Plan that complies with Section 891.2 of the Streets and Highways Code, and are designed and constructed in accordance with the Chapter 1000 of the Highway Design Manual. The program is consistent with the Legislature’s intent when it adopted the California Bicycle Transportation Act:
“...to establish a bicycle transportation system...designed and developed to achieve the functional commuting needs of the employee, student, business person, and shopper as the foremost consideration in route selection, to have the physical safety of the bicyclist and bicyclist’s property as a major planning component, and to have the capacity to accommodate bicyclists of all ages and skills”.
http://www.dot.ca.gov/hq/LocalPrograms/bta/btaweb%20page.htm
Assembly Bill 32: Global Warming Solutions Act
In 2006, the California Legislature passed the Global Warming Solutions Act, which set the 2020 greenhouse gas emissions reduction goal into law. It directed the California Air Resources Board to begin developing actions to reduce greenhouse gases while also preparing a scoping plan to identify how best to reach the 2020 limit. The reduction measures to meet the 2020 target are to be adopted by the start of 2011.
Assembly Bill 32 Includes a Number of Specific Requirements:
• ARB shall prepare and approve a scoping plan for achieving the maximum technologically feasible and cost-effective reductions in greenhouse gas emissions from sources or categories of sources

Existing Plan and Policy Review A-7 January 2012
of greenhouse gases by 2020 (Health and Safety Code (HSC) §38561). • Identify the statewide level of greenhouse gas emissions in 1990 to serve as the emissions limit
to be achieved by 2020 (HSC §38550). • Adopt a regulation requiring the mandatory reporting of greenhouse gas emissions (HSC
§38530). • Identify and adopt regulations for discrete early actions that could be enforceable on or before
January 1, 2010 (HSC §38560.5). • Ensure early voluntary reductions receive appropriate credit in the implementation of AB 32
(HSC §38562(b) (3)). • Convene an Environmental Justice Advisory Committee (EJAC) to advise the Board in
developing the Scoping Plan and any other pertinent matter in implementing AB 32 (HSC §38591).
• Appoint an Economic and Technology Advancement Advisory Committee (ETAAC) to provide recommendations for technologies, research and greenhouse gas emission reduction measures (HSC §38591).
http://www.arb.ca.gov/cc/ab32/ab32.htm
Senate Bill 375: Linking Regional Transportation Plans to State Greenhouse Gas Reduction Goals
Senate Bill 375 enhances California's ability to reach its AB 32 goals by promoting good planning with the goal of more sustainable communities. SB 375 establishes a process for the California Air Resources Board (ARB) to implement the state’s global warming legislation (AB 32) for the transportation sector. It requires ARB to adopt regional greenhouse gas (GHG) targets for emissions associated with the automobile and light truck sector. ARB will also work with California's 18 metropolitan planning organizations to align their regional transportation, housing and land-use plans and prepare a "sustainable communities strategy" to reduce the amount of vehicle miles traveled in their respective regions and demonstrate the region's ability to attain its greenhouse gas reduction targets. The Bill acknowledges that spending less time on the road is the single-most powerful way for California to reduce its carbon footprint. Additionally, SB 375 provides incentives for creating attractive, walkable and sustainable communities and revitalizing existing communities.
http://www.arb.ca.gov/cc/sb375/sb375.htm
Regional
Federal and state policy are often used to inform regional policy, which is then crafted to be more focused with specific requirements, actions and design implications.
Metropolitan Transportation Commission
The Metropolitan Transportation Commission (MTC) is the transportation planning authority for the nine county San Francisco Bay Area. The MTC serves as the state designated Regional Transportation Planning Agency (RTPA) and the federally designated Metropolitan Planning Organization (MPO). MTC provides oversight on all transportation projects in the region and is responsible for preparing the Regional Transportation Plan (RTP). MTC is largely responsible for transportation financing in the Bay Area, and helps to set priorities for the hundreds of millions of dollars flowing each year to the Bay Area from flexible federal funding programs. Using flexible federal dollars, MTC has established several funding programs that were developed to enhance Bay Area communities including the Transportation for Livable Communities (TLC) Program, Housing Incentive Program (HIP), Low Income Flexible Transportation (LIFT) Program, and the Regional Bicycle and Pedestrian Program (RBPP).
http://www.mtc.ca.gov/

Existing Plan and Policy Review A-8 January 2012
Regional Transportation Plan (RTP)
The current RTP, Transportation 2035, was finalized in February 2009 and updates the previous 2005 RTP. The 2035 Plan sets forth regional transportation policy and provides capital program planning for all regional, state and federally funded projects. In addition, the 2035 Plan provides strategic investment recommendations to improve regional transportation system performance over the next 25 years. Investments in regional highway, transit, local roadway, bicycle, and pedestrian projects are set forth in the 2035 Plan. These projects have been identified through regional and local transportation planning processes. Project recommendations are premised upon factors related to existing infrastructure maintenance, increased transportation system efficiencies, improved traffic and transit operations, and strategic expansions of the regional transportation system.
The 2035 Plan includes programs and projects which provide or contribute to a safe and well maintained transportation system, a reliable commute, access to mobility, livable communities, clean air, and efficient freight travel. A key element of the Transportation 2035 Plan is the coordination of land use and transportation planning, both at a regional and local level. Further, this plan element calls for an emphasis on “the Three E’s of sustainability-Economy, environment, and equity.” The Plan also recommends that existing transportation infrastructure be utilized efficiently while new investment is coordinated regionally. This includes new public transit service supporting existing transit centers and densification of development around existing transit infrastructure.
http://www.mtc.ca.gov/planning/2035_plan/FINAL/T2035_Plan-Final.pdf
Regional Bicycle Plan for the San Francisco Bay Area
The 2001 Regional Bicycle Plan for the San Francisco Bay Area was developed by the MTC and has been incorporated into the Regional Transportation Plan (RTP), which establishes a 25-year investment plan for regional transportation projects in the nine-county Bay Area. The overall goal of the plan is to ensure that bicycling is a convenient, safe, and practical means of transportation throughout the Bay Area. To achieve this goal, the plan established a regional bicycle network, programs to enhance bicycling, and a financial strategy to implement the improvements. To ensure implementation of the Plan, MTC developed the Regional Bicycle and Pedestrian Program Fund, which uses regional discretionary funds allocated through the federal Surface Transportation Program/Congestion Mitigation and Air Quality improvement program (STP-CMAQ) for bicycle and pedestrian projects that support the Regional Network.
Programs identified to enhance bicycling include safe routes to transit, a comprehensive network leading to major transit hubs; annual bicycle counts; more detailed collision data collection; and increased outreach and marketing efforts such as training programs, emphasis on Bike to Work Week, and a web-based trip planner, www.511.org.
http://www.mtc.ca.gov/planning/bicyclespedestrians/
Metropolitan Transportation Commission Complete Streets (Routine Accommodations)
The San Francisco Bay Area’s Regional Transportation Plan – Transportation 2030 – calls for “full consideration of the needs of pedestrians and bicyclists during transportation project development design, construction, and rehabilitation.” To help accomplish this “Call for Action,” in 2006 the MTC adopted Resolution No. 3765, which sets forth “MTC’s regional policies for accommodating bicycle and pedestrian facilities during transportation project planning, design, funding and construction.” The policy was written in recognition that developing such facilities in conjunction with the development of parallel facilities for motor vehicles offers cost savings and can create safer and more convenient bicycle and pedestrian travel.
To implement the Resolution’s requirements, MTC maintains a “Complete Streets” checklist, which sponsors of projects seeking regional transportation funds are now required to submit with their

Existing Plan and Policy Review A-9 January 2012
funding applications. The checklist requires project sponsors to document how the needs of bicyclists and pedestrians were considered in the process of planning and designing the project for which funds are being requested. It is meant to prompt consideration of bicyclists and pedestrians during project planning and design and alert bicycle and pedestrian advisory committees of upcoming projects that may deserve their attention.
MTC Resolution 3765, “Routine Accommodations” Policy requires that:
Projects funded all or in part with regional funds (e.g. federal, STIP, bridge tolls) shall consider the accommodation of bicycle and pedestrian facilities, as described in Caltrans Deputy Directive 64. These recommendations shall not replace locally adopted policies regarding transportation planning, design, and construction. These recommendations are intended to facilitate the accommodation of pedestrians, which include wheelchair users, and bicyclist needs into all projects where bicycle and pedestrian travel is consistent with current, adopted regional and local plans. In the absence of such plans, federal, state, and local standards and guidelines should be used to determine appropriate accommodations.
http://www.mtc.ca.gov/planning/bicyclespedestrians/routine_accommodations.htm
The Bay Trail
The Bay Trail Project is a nonprofit organization administered by the Association of Bay Area Governments (ABAG) that plans, promotes and advocates for the implementation of a continuous 500-mile bicycling and hiking path around San Francisco and San Pablo Bays. The Bay Trail Plan was prepared by ABAG pursuant to Senate Bill 100, which was passed into law in 1987. In 1990, the San Francisco Bay Trail Project was created as a nonprofit organization dedicated to planning, promoting and advocating implementation of the Bay Trail. To carry out its mission, the Bay Trail Project makes available grant funds for trail construction and maintenance; participates in planning efforts and encourages consistency with the adopted Bay Trail Plan; educates the public and decision-makers about the merits and benefits of the Bay Trail; produces maps and other materials to publicize the existence of the Bay Trail; and disseminates information about progress on its development. The Bay Trail Project does not own land, construct trail segments, or maintain them; segments are built, owned, managed and maintained by cities, counties, park districts and other agencies with land-management responsibilities.
In Napa, the original alignment in the 1989 Bay Trail Plan was along Highway 29 – not a particularly pleasant experience, and also not along the shoreline. For many years, the North Bay counties of Sonoma, Napa and Solano saw little or no progress on their sections of Bay Trail. However, in the last 6-8 years, significant strides have been made. The City of American Canyon has constructed and opened 3 miles of Bay Trail with another 3 miles in the planning phase. Local jurisdictions in coordination with the Bay Trail Steering Committee have reassessed and realigned 6 miles of trail from busy roadways to the edges of the Napa River and bay wetlands. The Bay Trail is collaborating with the Napa Vine Trail to capture synergies, and continues its long partnership with the Ridge Trail to connect the two systems.
Pending environmental review and Bay Trail Steering Committee approval, segments of trail through the Napa Pipe property, across Napa Sanitation District levees, and along the edge of the Napa airport will connect existing trail at Kennedy Park to existing trail at the California Department of Fish and Game’s Napa Plant Site restoration project off of Green Island Road, and south into American Canyon.
Ultimately, the Bay Trail will be a 500-mile bicycle and hiking trail encircling the San Francisco and San Pablo Bays. Currently over 300 miles of the trail are in operation, including several segments located within Napa County. The segments in Napa County are comprised of various on- and off-street routes including:
Built Trail Sections
• Las Amigas from Milton to Cuttings Wharf (Class II) • Cuttings Wharf from Las Amigas to Cuttings Wharf Boat Ramp (Class II)

Existing Plan and Policy Review A-10 January 2012
• Stanly Lane from Stanly Crossroad to Hwy 12/121 (Class I) • Maxwell Bridge on Imola (Class II) • Napa River Trail from Hartle Ct to Southern end of Kennedy Park (Class I) • CA Department of Fish and Game Napa Plant Site Trail – end of Green Island Rd to existing
Bay/River trail near Eucalyptus/treatment ponds (levee-top gravel trail) • American Canyon--Eucalyptus to River Trail (gravel/levee top) • American Canyon Wetlands Edge Trail--Eucalyptus to American Canyon Road (Class I) • Golden Gate Drive (Class II)
Un-Built Trail Sections
The following sections of the un-built trail have been identified by the Bay Trail Project. As of November 2010, additional route planning is underway by the Bay Trail in conjunction with local agency staff. Route updates will be documented when official plans are in place.
• Duhig from Ramal onto Las Amigas to Milton (proposed Class II) • Stanly Crossroad (proposed Class I) • Imola from Golden Gate to Maxwell Bridge (proposed Class II) • Napa Pipe (proposed Class I) • Napa Sanitation District Levees (Proposed levee top trail) • CDFG Lands: Fagan Marsh (proposed boardwalk) • Kimberly Park to Vallejo/Solano border (Class I and natural surface trails)
http://baytrail.abag.ca.gov/
The Bay Area Ridge Trail
The Bay Area Ridge Trail Council formed in 1987 with the vision of a trail that would ring the San Francisco Bay Area high on the ridges of the hills and mountains that encircle San Francisco and San Pablo Bays. Current plans call for over 550 miles of trail along these ridge tops, open to hikers, equestrians, mountain bicyclists, and outdoor enthusiasts of all types. To date, the Council has worked with state, regional, local, and non-profit agencies to dedicate over 325 miles of trail.
Many of the existing Ridge Trails in Napa County run through regional and state parks along existing trails. Most of these trail sections are isolated, with either on-street connections or large gaps between them. The built and un-built sections of the Bay Area Ridge Trail within Napa County include the following:
Built Trail Sections
• Sugarloaf Ridge State Park: From Visitor Center to Bald Mountain Summit (2.7 mi) • Yountville Cross Road: From Locust Ave. and Highway 29 to Yountville Cross Road and
Silverado Trail (7.5 mi) • Skyline Wilderness Park and Napa Solano Ridge Trail: From Skyline Wilderness Park Entrance
to south boundary (5.7 mi)
Un-Built Trail Sections
• Bald Mountain Summit to Locust Ave and Highway 29 • Yountville Cross Road and Silverado Trail to Skyline Wilderness Park Entrance
The Ridge Trail Council is working to close existing facility gaps in order to connect the routes for hikers, equestrians, and bicyclists. More details about the ridge trail are located at the Bay Area Ridge Trail website.
www.ridgetrail.org

Existing Plan and Policy Review A-11 January 2012
Bay Area Air Quality Management District
Bay Area Air Quality Management District (BAAQMD) is the regional agency with the authority to develop and enforce regulations for the control of air pollution throughout the Bay Area including Napa County. The clean Air Plan is the BAAQMD’s plan for reducing the emission of air pollutants that lead to ozone. BAAQMD has also published CEQA Guidelines for the purpose of evaluating the air quality impact of projects and plans. One of the criteria that the Guidelines describe is that plans must demonstrate reasonable efforts to implement transportation control measures included in the Clean Air Plan, and identify local governments as the implementing agencies. The BAAQMD cites on-road motor vehicles as the largest source of air pollution in the Bay Area. To address the impact of vehicles, the California Clean Air Act requires air districts to adopt, implement, and enforce transportation control measures.
The BAAQMD has implemented the Bicycle Facility Program, an annual grant program developed from the Transportation Fund for Clean Air that provides funding to reduce motor vehicle emissions through the implementation of new bikeways and bicycle parking facilities in the San Francisco Bay Area.
http://www.baaqmd.gov/
Bay Area Ozone Strategy
The 2005 Bay Area Ozone Strategy was prepared by the BAAQMD in cooperation with the Metropolitan Transportation Committee and the Association of Bay Area Governments (ABAG). The Plan was developed to show how the Bay Area will achieve compliance with State air quality standards. According to the report, “the Bay Area has made considerable progress towards improving ozone conditions over the years; however, the region fails to meet the State one-hour ozone standard.”
The 2005 Ozone Strategy is a comprehensive document that describes the Bay Area’s strategy for compliance with State one-hour ozone standard planning requirements, and represents the region’s commitment to achieving clean air to protect the public's health and the environment. The control strategy includes: stationary source control measures to be implemented through Air District regulations; mobile source control measures to be implemented through incentive programs and other activities; and transportation control measures to be implemented through transportation programs in cooperation with the MTC, local governments, transit agencies and others. Transportation control measures (TCM) were developed to mitigate the impact of mobile pollution sources. The TCMs proposed in the 2005 Strategy that relate to bicycling and walking include:
TCM #1: Support Voluntary Employer-Based Trip Reduction Programs – provide incentives and assistance to help employers develop programs to reduce single-occupancy vehicle use to work.
TCM #5: Improve Access to Rail & Ferries – Safe Routes to Transit program sponsored by the MTC; develop a master plan for innovative secure bicycle storage strategies at key transit hubs.
TCM #9: Improve Bicycle Access and Facilities – fund the Regional Bicycle Plan and Safe Routes to Transit improvements; continue Transportation Development Act (TDA) Article 3, Tobacco Litigation Settlement (TLS), and Transportation fund for Clean Air (TFCA) funding for bike improvements; develop an on-line bicycle mapping tool as part of the regional 511 traveler information number; promote Bike-to-Work Week/Day; encourage local jurisdictions to develop safe and convenient bicycle lane and route networks, provide secure bike racks and storage, and require bicycle access and amenities as conditions of approval of development projects; explore innovative bicycle programs, such as “station bike” or bike sharing programs at transit stations, downtowns, and activity centers; encourage public education about bicycle safety for both bicyclists and motorists.
TCM #10: Youth Transportation – encourage Safe Routes to School program.

Existing Plan and Policy Review A-12 January 2012
TCM #15: Local Land Use Planning and Development Strategies – MTC to continue Transportation for Livable Communities (TLC) planning, capital grant, and HIP programs; MTC will examine opportunities for transit oriented development along major transit corridors; BAAQMD will continue the TFCA program; ABAG will provide incentives for smart growth.
TCM #19: Improve Pedestrian Access and Facilities – review and comment on general/specific plan policies to promote development patterns that encourage walking; encourage amending zoning ordinances to include pedestrian-friendly design standards; MTC will continue to fund TLC, support SR2S, and support the Regional Pedestrian Committee and associated pedestrian safety programs; identify and fund projects that enhance pedestrian movement in neighborhoods, downtowns, and near transit stops.
TCM #20: Promote Traffic Calming Measures – implement projects such as pedestrian-only streets, residential and neighborhood traffic calming measures, and arterial and major route traffic calming measures.
http://www.baaqmd.gov/pln/plans/ozone/2005_strategy/index.htm
Lake County Regional Bikeway Plan
The 2006 Lake County Regional Bikeway Plan was prepared by the Lake County/City Area Planning Council through the transportation planning agency's planning work program. This document is an update to the 2002 Regional Bikeway Plan. The Plan is consistent with projects, goals, policies and objects identified in the 2005 Regional Transportation Plan. This Regional Bikeway Plan is a capital improvement program of commuter bikeways. It incorporates proposals for bikeway improvements for all jurisdictions within Lake County into one document. It is directed toward meeting the provisions of the California Bicycle Transportation Act. Napa County shares a common border with Lake County along the northern Napa County border. The two counties are connected by SR 29 and Butts Canyon Road. The Lake County Regional Bikeway Plan does not include planned bikeways to Napa County.
http://lakeapc.org/acc.asp?Webpage=Documents
Solano Countywide Bicycle Plan
The 2004 Solano Countywide Bicycle Plan was prepared by the Solano Transportation Authority. The Plan aims to encourage the development of a bicycle network that will provide connections within Solano County as well as connections to surrounding counties. The Plan covers the entire County and contains policies designed to encourage and support biking, implementation standards, and promotional strategies. The Plan includes proposed bikeway connections to Napa County along the SR 12, SR 29, Suisun Valley Road, and McGary Road corridors.
http://www.sta.dst.ca.us/plans2.html#bikeplan
County of Yolo Bicycle Implementation Plan
The County of Yolo Bicycle Implementation Plan was prepared by the Yolo County Transportation Advisory Committee and published in 2006. This plan is an update of the 2002 County of Yolo Bicycle Implementation Plan and formulates a long-range, comprehensive, and consistent policy guide for achieving a countywide bikeway network. The plan includes goals and policies for bicycle facilities in the unincorporated County to encourage bicycle ridership. The Plan includes a proposed bikeway connection to Napa County along the SR 128 corridor between northeastern Napa County and southwestern Yolo County.
http://www.yolocounty.org/Index.aspx?page=834
Existing Plan and Policy Review A-13 January 2012
Sonoma County – SCTA Countywide Bicycle and Pedestrian Master Plan
The 2008 SCTA Countywide Bicycle and Pedestrian Master Plan was developed under the guidance of the Sonoma County Transportation Authority. The Plan is designed to prioritize bicycle and pedestrian improvements, develop implementation strategies, and foster countywide collaboration and coordination. Consisting of eight stand alone documents specific to local agencies and a countywide overview section, the SCTA Countywide Bicycle and Pedestrian Master Plan is designed to facilitate transportation improvements for bicyclists and pedestrians. The recommendations of the plan include physical improvements, expanding existing facilities, and connecting gaps in the network, addressing constraints, and providing greater local and regional connectivity. Several bicycle facilities are planned that would connect Sonoma County to Napa County including Class II bike lanes on SR 128, Petrified Forest Road, and SR 12/121. A Class I pathway connection is proposed via the Bay Trail, and Class III bike route connections are proposed on St. Helena Road, Trinity Road, and Duhig/Ramal Road.
http://www.sctainfo.org/Bike_Main_files/index.htm
Local
Napa Wine Train
The Napa Valley Wine Train (NVWT) runs between the Cities of Napa and St. Helena. The Napa Valley Railroad (NVRR) owns the right-of-way used by the NVWT. The NVRR has indicated its willingness to consider hosting passenger rail along the existing NVWT route as detailed in the Napa/Solano Passenger/Freight Rail Study provided that sufficient infrastructure improvements are made to prevent any conflict with existing NVWT and freight rail service.
Napa/Solano Passenger/Freight Rail Study
The Napa/Solano Passenger/Freight Rail Study is a comprehensive new-start public rail transportation plan completed in 2003. The main objectives of the study were to determine economic feasibility of possible passenger rail service and enhanced rail freight activity, compare of potential rail versus existing and potential bus service, and examine the long run potential of connecting passenger rail services. The plan addresses both new passenger rail and increased freight service between Vallejo, Fairfield/Suisun, Napa, Calistoga and intervening areas. The Fairfield/Suisun Amtrak station, Vallejo Ferry Terminal and Downtown Napa were identified as locations for major intermodal stations.
http://www.nctpa.net/docs/Napa%20Solano%20Freight%20Rail%20Study.pdf
Napa’s Transportation Future
The 2009 Napa’s Transportation Future document was developed by the Napa County Transportation and Planning Agency (NCTPA). The NCTPA is a “Joint Powers Agency” (JPA) made up of the City of Calistoga, the City of St. Helena, the Town of Yountville, the City of Napa, the City of American Canyon and Napa County and acts as the transportation program and funding administrator for all member jurisdictions. The vision of Napa’s Transportation Future is to create an attractive, flexible, fully integrated transportation system with a diverse set of transportation mode options which will enable people and good to flow throughout the County in a more efficient manner. This plan coordinates the transportation planning efforts throughout the County in order to prioritize transportation needs for the horizon of the year 2035. The Plan establishes a series of visionary goals to address traffic congestion and air quality issues including:
• Goal: Reduce/restrain growth of automobile vehicle miles traveled (VMT) Objective: 0 percent net growth in aggregate VMT
• Goal: Shift travel from Single-Occupancy Vehicles to other modes Objective: Increase the percent of county trips made by transit to 5 percent

Existing Plan and Policy Review A-14 January 2012
Objective: Increase the percent of county trips made by bicycle to 10 percent Objective: increase the percent of county trips made by walking to 10 percent
http://sites.google.com/site/napastransportationfuture/
Napa County General Plan
In 2008 the Napa County Department of Conservation, Development & Planning updated the 1983 Napa County General Plan. The General Plan acts as the blueprint for growth and development on County unincorporated land through the year 2025. The General Plan will determine how much growth will occur and where it will occur. Development of the document included extensive public outreach, input and oversight from a General Plan Update Steering Committee, and community meetings. Currently adopted key General Plan policies regarding transportation and circulation that are applicable to bicycle and pedestrian planning include:
• Circulation CIR-2 – CIR-4; CIR-31 – CIR-37 • Conservation CON-65 d, CON-69 • Recreation and Open Space ROS-10 – ROS-12.5, ROS-15
http://www.countyofnapa.org/GeneralPlan/
Napa County Regional Parks and Open Space District Master Plan
The Napa County Regional Park and Open Space District Master Plan was completed in 2009 and covers the time period of 2008-2013. This plan provides a comprehensive framework for guiding the future work of the District through the identification of long-term goals and guiding principles, as well as identifying a 2008 through 2013 work program. The Master Plan is consistent with the Napa County General Plan and strives to meet the goal of providing opportunities for outdoor recreation through the development of a system of parks, trails, water resource activities, open space and related facilities. The Master Plan identifies 61 separate projects in its work program of which 17 are trail projects. These trail projects consist of the following:
A.1 Oat Hill Mine Trail Improvements A.2 Milliken Creek Trails and Picnic Area Development A.4 Rector Ridge/Stag’s Leap Trail Development A.5/A.6 Napa River and Bay Trail Development from American Canyon to Napa A.7 Lake Hennessey North Shore Trail Expansion A.9 Newell Preserve Access Improvement A.10 Lake Berryessa Trail Development A.11 Berryessa Peak and Blue Ridge Public Access Development A.12. Berryessa Vista Wilderness Park Development A.13 Pope and Putah Creeks Trail Development A.15 Camp Berryessa to Knoxville Wildlife Area Trail Development A.19 Bay Area Ridge Trail Completion A.22 Moore Creek Trail, Picnic Area and Camping Facilities Development A.24 Napa Valley Greenway / Vine Trail Development A.25 Henry Road/Milliken Peak Area Trail Development A.26 Countywide Trail Network Development
http://napaoutdoors.org/documents
Napa County Flood Control and Water Conservation District
The Napa County Flood Control and Water Conservation District administers water supply contracts, watershed management and stormwater management programs throughout Napa County. The District's

Existing Plan and Policy Review A-15 January 2012
mission is the conservation and management of flood and storm waters to protect life and property; the maintenance of the County watershed using the highest level of environmentally sound practices; and to provide coordinated planning for water supply needs for the community. The Napa County Flood Control and Water Conservation District maintains the 13 miles of channels within its jurisdiction.
http://www.countyofnapa.org/FloodDistrict/
Napa Countywide Community Climate Action Plan
The 2009 a preliminary draft of the Napa Countywide Community Climate Action Plan was completed by the private consultant MIG. The Action Plan includes viable measures to help the County reduce Green House Gas emissions resulting from County operations. The report establishes a baseline during the year of 2005, and emissions contributors are categorized by three distinct categories: jurisdiction, sector, and source. The report notes that 55% of the County’s green house gas emissions result from transportation and mobility related activities. The Plan contains reduction targets of 30 percent below the baseline year, and provides a series of actions that can be utilized to reduce Napa County’s green house gas emissions including shifting the current commute habits of County employees to alternative modes such as public transit, ridesharing, bicycling, and walking as much as possible.
Napa County Bicycle Coalition
The Napa County Bicycle Coalition is a non-profit member based organization that was created to encourage bicycling in Napa County. The NCBC works with local government from an advocacy stand point to ensure that bicycles are an integral part of the part of the County’s transportation system. The Coalition serves the four main functions of bicycle education, bicycle advocacy, promotion of events and programs, and fundraising to support the coalition.
http://www.napabike.org/
Napa Greenway Feasibility Study
The Napa Greenway Feasibility Study was completed in 2009 by Alta Planning for the Napa County Transportation and Planning Agency. The proposed 48 mile Greenway is planned to provide a continuous pedestrian and bicycle path from the BayLink Ferry terminal in Vallejo north through the Napa Valley and ending in the City of Calistoga. The Greenway study consisted of background data gathering, development of route options and alternatives, alternative alignment analysis, and design and implementation strategies. The Greenway is designed in a manner which allows for each individual segment can function as a stand-along facility until connections are built. Key implementation steps for the future include funding, identifying an agency responsible for the Greenway as a whole, and finding implementation sponsorship for the project.
http://sites.google.com/site/napastransportationfuture/napagreenwayfeasibilitystudy
Napa Valley Vine Trail
The nonprofit Napa Valley Vine Trail Coalition was created in 2008 after the completion of the Greenway Feasibility Study to design, fund and implement its conclusions. The trail is planned to follow Highway 29 and the existing Wine Train tracks north of Napa. South of Napa it will follow the Wine Train Tracks and the Napa River. The design will ultimately link the existing unconnected segments including the Napa Valley Vine Trail, the San Francisco Bay Trail, the Bay Area Ridge Trail and the wider Bay Area and when completed make-up a combined 149 miles of trails. When completed, the Napa Valley Vine Trail is anticipated to be one of the premier active transportation systems in the country.
http://www.railstotrails.org/resources/documents/ourWork/Napa%20Valley%20Vine%20Trail%20Case%20Statement.pdf

Existing Plan and Policy Review A-16 January 2012
2007 Calistoga Bicycle Transportation Plan
The 2007 Calistoga Bicycle Transportation Plan was prepared by Calistoga staff and the Calistoga Bicycle Advisory Committee. The Plan was developed to meet the requirements of the California Bicycle Transportation Act, and the needs of the community. The Plan was developed over the course of approximately two years and included a number of opportunities for public involvement. The Plan includes goals, objectives, policies, and actions to improve conditions for bicyclists within the community of Calistoga, and to provide bikeway connections to the outlying County and neighboring communities. It identifies an extensive network of Class I pathways, Class II bike lanes, and Class III bike routes within Calistoga, and recommends Class II bike lanes on SR 128, Tubbs Lane, Bennett Lane, and Dunaweal Lane.
http://www.ci.calistoga.ca.us/Index.aspx?page=101
Existing Plan and Policy Review – City of St. Helena
Saint Helena General Plan
LU3.2 – Enhance the pedestrian-oriented character of commercial areas and provide for convenient pedestrian and bicycle connections to encourage walking and reduce vehicle trips within the commercial area. (Page 2-34)
LU3.7 – Provide sufficient auto and bicycle parking in order to serve local businesses in the commercial districts. Ensure that all parking areas are well-designed, and that auto parking spaces are hidden from pedestrian view, whenever possible. (Page 2-35)
Relevant Circulation Element Goals: (Page 5-12)
• Provide a complete bicycle and pedestrian network between residential areas, downtown and other major activity centers identified by the City.
• Increase the current mode split for transit, bicycling and walking (as measured by the American Community Survey).
CR1.1 – Promote a connected street network within the City to provide better internal automobile, bicycle and pedestrian connections for residents. Where new streets are constructed, ensure they connect to dead-end roads and other streets to create a flexible network for residents. (Page 5-29)
CR1.5 – Avoid mitigation measures that negatively impact the walking and bicycling environment and encourage driving, such as roadway and intersection widenings. (Page 5-29)
CR1.9 – Promote a walking and bicycling environment that is comfortable and convenient. Ensure that all St. Helena streets have no more than a single through-automobile lane in each direction, plus a single left-hand turning lane where appropriate, even if this requirement increases vehicle travel times. Allow exceptions if an extra lane would reduce the possibility of collisions. (Page 5-30)
CR1.A – Use the street typologies as defined in the Circulation Element as a basis for improving and managing streets. Improve vehicle, pedestrian and bicycle facilities on streets based on this system. (Page 5-31)
CR1.C – Identify streets that should become “more complete,” through consideration of transit priorities, sidewalk gap closures, new bikeways and vehicle traffic calming measures. (Page 5-31)
CR1.J – Ensure that any new land use development provides a continuous path of travel for walking and bicycling from the development site to the center of downtown and other key destinations, as determined by the City. Determine appropriate bicycle and pedestrian routes based on street typologies and the proposed bicycle and pedestrian network. If a path of travel is not continuous,

Existing Plan and Policy Review A-17 January 2012
require development to construct improvements and/or contribute to the transportation mitigation fee program. (Page 5-32)
CR2.1 – Create a comprehensive bicycle and pedestrian network that enhances neighborhood connectivity. Develop the system as shown in Figure 5.3 to expand and improve the pedestrian and bikeway system. (Page 5-34)
CR2.2 – Promote walking and bicycling as safe and convenient modes of transportation. (Page 5-34)
CR2.3 – Ensure secure, accessible and convenient bicycle parking facilities throughout St. Helena, includ-ing downtown, commercial areas, schools and parks. (Page 5-34)
CR2.6 – Encourage walking and bicycling trips to St. Helena schools. (Page 5-34)
CR2.A – Develop and adopt a citywide bicycle and pedestrian master plan to improve bicycle and pedestrian safety, and to encourage community members to walk and bike more often. Build on St. Helena’s existing partnership with the Napa County Transportation and Planning Agency (NCTPA) to ensure that the City’s master plan is consistent with countywide transportation planning efforts. (Also see the following elements: Open Space and Conservation, Topic Area 2; and Parks and Recreation, Topic Area 6) (Page 5-35)
CR2.B – Develop guidelines for the design, construction and maintenance of bicycle and pedestrian paths in St. Helena. Coordinate the guidelines with Napa County or regional trail connections. (Page 5-35)
CR2.C – Develop and adopt an ordinance that requires any new development and re-use projects to provide bicycle and pedestrian improvements and amenities. (Page 5-35)
CR2.D – Identify and pursue funding opportunities for bicycle projects on the local, state and federal levels. Update the existing and proposed bicycle system every five years, as required by Caltrans to qualify for Bicycle Transportation Account funds. (Page 5-35)
CR2.K – Consider the feasibility of a citywide bike sharing program for municipal and/or public use. (Page 5-36)
CR3.6 – Support development of the bikeway and pedestrian networks to provide a convenient opportunity for at least 20 percent of commuters to get to work by walking or bicycling. (Page 5-38)
CR3.C – Regularly monitor progress toward increasing the number of residents and workers walking, biking and using public transit, in order to achieve the mode split targets outlined in Table 5.5. (Page 5-39)
CR4.5 – Improve traffic safety and encourage walking and bicycling trips to St. Helena schools through a Safe Routes to School program. (Page 5-40)
CR6.1 – Prioritize and implement improvements to the circulation system, including street extensions, bicycle and pedestrian improvements, and expanded transit service. (Page 5-44)
CR6.2 – Require concurrent infrastructure development for any new development projects that have impacts on the circulation system, including streets, paths, trails, sidewalks and public transit. (Page 5-44)
CR6.A – Prioritize and construct all new streets, paths and trails (identified in Section E: St. Helena’s Circulation and Mobility Future) when adequate funding is secured and concurrent with any new, adjacent developments. (Page 5-45)
CR6.B – Update the existing St. Helena Traffic Mitigation Fee program to provide funding for all new streets and trails included in the Circulation Element, in order to ensure new streets and trails are constructed in a timely manner. (Page 5-45)

Existing Plan and Policy Review A-18 January 2012
Relevant Community Design Element Goals: (Page 7-12)
Encourage Community Design throughout the City that Helps to Build Community, Encourage Human Interaction and Support Non-Automobile Transportation. St. Helena is committed to promoting community design that is human-scaled, comfortable, safe and convenient for pedestrian, bicyclist and transit use.
CD2.C – Install attractive and well-designed community amenities such as public restrooms, drinking fountains, benches, bicycle racks and trash and recycling containers in commercial districts. Ensure that community amenities are designed and installed to complement surrounding businesses and support the pedestrian-orientation of the street. (Page 7-19)
CD3.4 – Ensure safe bicycle and pedestrian-friendly character on all residential streets. Consider retrofitting existing wide residential streets, such as Starr Avenue, with landscaped medians, wide sidewalks and adjacent Class I pedestrian and bicycle trails. (Page 7-22)
CD3.F – Establish residential street guidelines that ensure a safe environment for families and children. Encourage traffic calming, street trees, wide sidewalks, and Class I or II bike lanes. (Page 7-24)
CD4.4 – Integrate bicycle and pedestrian trails adjacent to open spaces to enhance connectivity throughout the City and the region. (Also see the Parks and Recreation Element, Topic Area 6) (Page 7-26)
CD6.1 – Ensure a connected street system that maximizes pedestrian and bicycle connectivity. (Page 7-29)
CD6.2 – Promote the inclusion of bicycle and pedestrian trails and bicycle lanes throughout the City, as well as connections to regional trail systems, such as the Napa Valley Vine Trail. (Also see the Parks and Recreation and Circulation elements for additional policies and implementing actions relating to bicycle and pedestrian trails and amenities.) (Page 7-29)
CD6.3 – Require streetscape design that maximizes bicycle and pedestrian usage by providing safe and well-lit streets. (Page 7-29)
CD6.A – Use the City’s grid street pattern as the template for any future developing areas. Ensure that new streets logically extend existing street and infrastructure; facilitate the safe and efficient flow of pedestrian, bicycle and vehicular traffic; enhance and frame views of the hills and surrounding agricultural lands; and incorporate appropriate traffic calming features to support and complement the neighborhood environment. (Page 7-30)
Parks and Recreation Element Relevant Goals: (Page 12-11)
Develop a System of Interconnected Bicycle and Pedestrian Trails. The City is committed to providing residents and visitors with opportunities to walk or bicycle throughout the City and the Napa Valley region, while promoting citywide efforts to encourage participation in active, healthy alternate modes of transportation.
PR1.E – Develop a comprehensive network of bicycle and pedestrian trails that links the City’s parks and enhances bicycle and pedestrian connectivity throughout the City and the region. (Page 12-15)
PR4.C – Identify locations to accommodate active recreational uses to meet citywide needs. Potential locations include: (Page 12-21)
• Bicycle and pedestrian trails, interpretive areas, trail heads, and comfort stations along York and Sulphur creeks and the Napa River; and
• A community park at the City-owned Lower Reservoir area.

Existing Plan and Policy Review A-19 January 2012
PR6.1 – Promote walking and bicycling as safe and convenient modes of transportation. (Page 12-26)
PR6.2 – Develop a comprehensive network of bicycle and pedestrian trails to enhance bicycle and pedestrian connectivity throughout the City and the region. (Also see the Community Design Element, Topic Area 4) (Page 12-26)
PR6.3 – Promote the inclusion of bicycle and pedestrian trails, and bicycle lanes throughout the City, as well as connections to regional trail systems, such as the Napa Valley Vine Trail. (Page 12-26)
PR6.A – Develop and adopt a citywide bicycle and pedestrian master plan to improve bicycle and pedestrian safety, and to encourage community members to walk and bike more often. Build on St. Helena’s existing partnership with the Napa County Transportation and Planning Agency (NCTPA) to ensure that the City’s master plan is consistent with countywide transportation planning efforts. (Also see the following elements: Circulation, Topic Area 2; Open Space and Conservation, Topic Area 2) (Page 12-27)
PR6.B – Develop guidelines for the design, construction and maintenance of bicycle and pedestrian trails in St. Helena. Include guidelines for installing context-sensitive and solar lighting, and mitigating noise impacts from the trails. Include guidelines for wayfinding and interpretive exhibits that use signs, art and other visual clues to enhance users’ experiences. Highlight the rich history of the City and provide education and information for users. Coordinate the guidelines with Napa County or regional trail connections. (Page 12-27)
PR6.C – Develop and adopt an ordinance that requires new development and redevelopment projects to provide bicycle and pedestrian improvements and amenities. (Page 12-27)
PR6.E – Coordinate with countywide efforts to establish regional trail systems through the City limits. (Page 12-28)


St. Helena Bicycle Plan January 2012
Appendix B
Bikeway Type Design Details


Bicycle Design Standards B-1 January 2012
Appendix B – Design Standards for Class I, II, and III Bikeways
Introduction
The bicycle design guidelines presented in this section are intended to provide guidance to staff, policy makers, developers, and the public for the development, retrofit, and maintenance of bicycle facilities in Napa County. The guidelines are a combination of the minimum bicycle facility standards defined in Chapter 1000 of the Caltrans Highway Design Manual (HDM) and the California Manual on Uniform Traffic Control Devices (CA MUTCD), along with recommended standards contained in the American Association of State Highway and Transportation Officials’ (AASHTO) Guide for the Development of Bicycle Facilities. Standards and guidelines from these resources have been assembled to improve the quality of consistency of Napa’s countywide bikeway system. In addition to the standardized treatments, there are several creative solutions drawn from ‘best practices’ used in other locations throughout the state and nation that provide promising results, but remain experimental at this time. While ‘best practice’ or non-standard features have been identified at the request of the BAC, it should be noted that implementation of non-standard treatments should be done under the guidance and permission of State and Federal authorities.
The following resources, which provide detailed design guidance for the development of bikeways and bicycle parking facilities, are recommended to supplement the design information presented below.
• NACTO Urban Bikeway Design Guide, National Association of City Transportation Officials, 2011 http://nacto.org/cities-for-cycling/design-guide/
• APBP Bicycle Parking Guidelines, 2nd Edition, Association of Pedestrian and Bicycle Professionals, 2010 http://www.apbp.org/?page=Publications
Bicycle Characteristics
To understand the needs of bicyclists, and help encourage and accommodate safe bicycling within the plan area, it is important to have an understanding of the dimensions of typical bicycles as well as the operational characteristics of bicyclists. These design factors are critical in planning and designing both on-road and off-road bicycle facilities.
Horizontal Clearance
The images below show the dimensions and operating space of a typical bicyclist. The width of a stationary bicyclist is approximately 2.0 feet, and a moving bicyclist generally requires a 3.0-foot operating envelope in order to maintain their balance. To ride comfortably and avoid fixed objects (curbs, potholes, debris, automobiles, etc.) as well as other facility users including bicyclists, pedestrians, strollers, or in-line skaters, a bicyclist requires an operating envelope of five feet. If space is restricted, such as in a tunnel or on a bridge,

Bicycle Design Standards B-2 January 2012
ten feet of horizontal clearance is recommended to allow two opposing bicyclists enough space to pass each other comfortably. On pathways, more width may be needed to allow bicyclists to react to unexpected maneuvers of another bicyclist or other user types such as in-line skaters, persons with pets, etc. Given the popularity of multi-use pathways, other users and their dimensions and operational characteristics should be considered in addition to typical bicyclists when designing these facilities.
Vertical Clearance
A bicyclist’s vertical design height is eight feet. While even the tallest bicyclists would not be expected to reach this height when riding a bicycle; however, vertical clearance is essential to allow sufficient space for bicyclists pedaling upright or passing under an overpass. To accommodate maintenance and/or emergency vehicles in underpasses and tunnels, and to allow for overhead signing vertical clearance should be a minimum of ten feet.
Travel Speeds
An average bicyclist travels at a rate of speed between 12 and 19 mph. Advanced bicyclists and can maintain speeds of 20 mph or better on flat terrain in windless conditions. On descents, bicyclists can reach speeds 30 mph or greater.
Bicycle Facility Design Standards
According to Caltrans, the term “bikeway” encompasses all facilities that provide primarily for bicycle travel. The three standard classes include:
• Class I Bike Path • Class II Bike Lanes • Class III Bike Routes
Class I Bikeway
The following section includes recommended design standards and best practice information for Class I bikeways:
• Rails with Trails • Rails-to-trails • Under-crossings

Bicycle Design Standards B-3 January 2012
• Rivers with Trails • Mid-block Crossing
Typically called a “bike path” or “multi-use path,” a Class I bikeway provides for bicycle travel on a paved right-of-way completely separated from any street or highway. The recommended design width of a Class I path is dependent upon anticipated usage:
• 8 feet (2.4 m) is the minimum width for Class I facilities; • 10 feet (3.0 m) is the recommended minimum width for a typical two-way Class I path; and • 12 feet (3.6 m) is the preferred minimum width, if heavy mixed bicycle and pedestrian use is
anticipated
Typically, 25 feet of right-of-way is preferred to accommodate a Class I bikeway, including the pathway surface, required shoulders, signage, amenities, landscaping, and offsets. However, pathway implementation can be achieved in constrained corridors of 15 feet or less where necessary.
Guidelines:
1. Paths should be constructed with adequate sub grade compaction to minimize cracking and sinking (stabilization fabric is recommended), and should be designed to accommodate appropriate loadings, including maintenance trucks and emergency vehicles.
2. A minimum 2-foot wide graded area must be provided adjacent to the path to provide clearance from trees, poles, walls, guardrails, etc. Wider shoulders on one or both sides of the path are recommended where feasible to accommodate pedestrians and help reduce pathway conflicts.
3. A 2% cross slope shall be provided to ensure proper drainage.
4. A yellow centerline stripe is recommended to separate travel in opposite directions.
5. Pathway lighting should be provided where commuters will be expected during dark or nighttime hours.
6. Pathway/roadway intersections require engineering review to ensure appropriate safety features are incorporated. Pathways that cross roadways with average traffic volumes of 20,000 vehicles per day or greater generally require signalization or grade separation.
7. Landscaping should generally be low water consuming native vegetation. Vegetation that produces minimal debris is recommended to reduce maintenance needs.
8. Barriers at pathway entrances (bollards, gates, etc.) should be clearly marked with reflectors and be ADA accessible (minimum five feet clearance).
9. Bridges and/or other structures should be designed to accommodate appropriate vehicle loadings. The width of structures should be the same as the approaching trail width, plus minimum two-foot wide clear areas.
10. To minimize potential conflicts, pedestrian traffic should be directed to the right side of pathway with signing and/or stenciling.
11. Staging areas and/or trailhead parking including restrooms, drinking fountains, and secure bicycle parking should be provided at appropriate locations.

Bicycle Design Standards B-4 January 2012
Class 1 Bike Path: Rail-with-Trail
Rail with trail (RWT) describes any shared use path or trail located on or directly adjacent to an active railroad corridor. No national standards or guidelines dictate RWT facility design. Therefore design guidance is pieced together from existing standards for Class I bikeways, railroad requirements, and pedestrian, road and highway design resources. In order to achieve safe and attractive designs, it is important for trail designers to work closely with railroad planning, operations, and maintenance staff.
General Design Guidelines:
1. RWT designers should maximize the setback between any RWT and active railroad track. The setback distance between a track centerline and the closest edge of the RWT should correlate to the type, speed, and frequency of train operations, as well as the topographic conditions and separation techniques.
2. Subject to railroad and State and Federal guidelines and the advice of engineering and safety experts, exceptions to the recommended setbacks may include:
a. Constrained areas (bridges, cut and fill areas) b. Low speed and low frequency train operations
In these cases and in areas with a history of extensive trespassing, fencing or other separation technique is recommended.
3. When on railroad property, RWT planners should adhere to the request or requirements for fencing by the railroad company. Fencing and/or other separation techniques should be a part of all RWT projects.
4. Trail planners should minimize the number of at-grade crossings, examine all reasonable alternatives to new at-grade track crossings, and seek to close existing at grade crossings as part of the project.
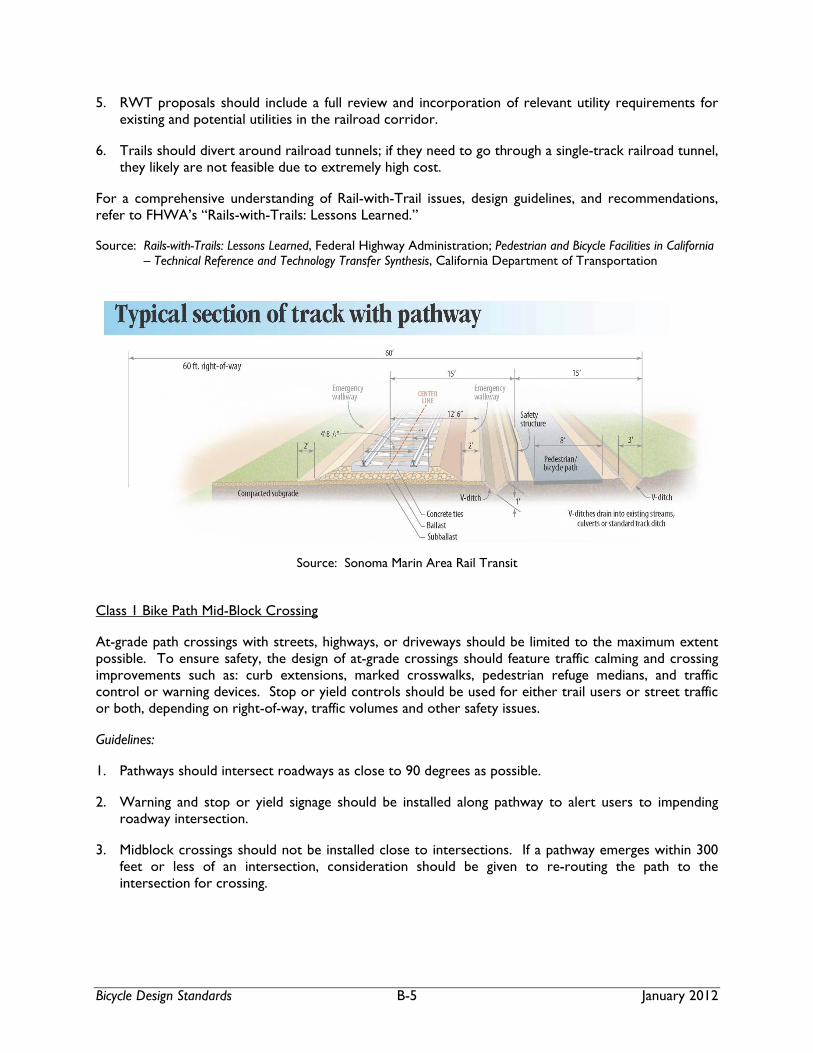
Bicycle Design Standards B-5 January 2012
5. RWT proposals should include a full review and incorporation of relevant utility requirements for existing and potential utilities in the railroad corridor.
6. Trails should divert around railroad tunnels; if they need to go through a single-track railroad tunnel, they likely are not feasible due to extremely high cost.
For a comprehensive understanding of Rail-with-Trail issues, design guidelines, and recommendations, refer to FHWA’s “Rails-with-Trails: Lessons Learned.”
Source: Rails-with-Trails: Lessons Learned, Federal Highway Administration; Pedestrian and Bicycle Facilities in California – Technical Reference and Technology Transfer Synthesis, California Department of Transportation
Source: Sonoma Marin Area Rail Transit
Class 1 Bike Path Mid-Block Crossing
At-grade path crossings with streets, highways, or driveways should be limited to the maximum extent possible. To ensure safety, the design of at-grade crossings should feature traffic calming and crossing improvements such as: curb extensions, marked crosswalks, pedestrian refuge medians, and traffic control or warning devices. Stop or yield controls should be used for either trail users or street traffic or both, depending on right-of-way, traffic volumes and other safety issues.
Guidelines:
1. Pathways should intersect roadways as close to 90 degrees as possible.
2. Warning and stop or yield signage should be installed along pathway to alert users to impending roadway intersection.
3. Midblock crossings should not be installed close to intersections. If a pathway emerges within 300 feet or less of an intersection, consideration should be given to re-routing the path to the intersection for crossing.

Bicycle Design Standards B-6 January 2012
Sample crossing treatment on a two-lane collector street
Class II Bikeway – Bike Lanes
The following section includes recommended design standards and best practice information for Class II bikeways:
• On-Street Parking • Right turn lanes • Left turn lanes • Railroad tracks
A Bike Lane is defined as a portion of the roadway or highway that has been designated by striping, signage, and pavement markings for the preferential or exclusive use of bicyclists. Bike lanes enable bicyclists to ride along a roadway or highway without interference from prevailing traffic conditions. Bike lanes increase safety by facilitating predictable behavior and movements between bicyclists and motorists. Bike lanes typically run in the same direction of traffic, although they may be configured in a contra-flow direction along one-way streets for system connectivity where necessary.
Guidelines:
Class II bike lanes shall be one-way facilities, running with the direction of traffic. (Contra-flow bike lanes may be installed on one-way streets where necessary.)
Where on-street parking is allowed, Class II bike lanes must be striped between the parking area and the travel lanes.
The width of the bike lanes vary according to parking and street conditions:
• 4’ minimum if no gutter exists, measured from edge of pavement; • 5’minimum with normal gutter, measured from curb face; or 3' measured from the gutter pan seam; • 5’ minimum when parking stalls are marked; and

Bicycle Design Standards B-7 January 2012
• 11’ minimum for a shared bike/parking lane where parking is permitted but not marked on streets without curbs or 12’ for a shared lane adjacent to a curb face.
Bike Lane striping standards:
• Bicycle lanes shall be comprised of a 6 inch solid white stripe on the outside of the lane, and a 4 inch solid white stripe on the inside of the lane.
• The inside 4 inch stripe of the bicycle lane should be dropped 90-180 feet prior to any intersection where right turns are permitted, and the outside 6 inch stripe should be dashed in this location.
• Bicycle lanes shall never be striped to the right of a right-hand turn lane
Bicycle lane signage standards:
• The R81 bicycle lane sign shall be placed at the beginning of all bicycle lanes, on the far side of arterial street intersections, at all changes in direction and at a maximum of 0.6 mile intervals, however, reassurance signs may be placed at 200 to 500 foot intervals.
• Standard signage is shown in Chapter 9 of the 2010 edition of the CA MUTCD.
Class II Bike Lanes with On-Street Parking
Parked vehicles can pose a serious hazard to bicyclists. Conflicts can occur during parking maneuvers and bicyclists are especially vulnerable to being hit by an opening door. On streets with parked vehicles, experienced bicyclists will generally ride three or four feet away from parked vehicles even if it means riding in a travel lane. To help maximize separation between bicyclists and parked vehicles, the following techniques may be employed:
• Minimize the parking lane width. This technique may be used in conjunction with widening the bike lane. Research suggests that the narrower the parking lane, the closer vehicles park to the curb. The traditional eight-feet wide parking lane can be reduced to seven feet or narrower where acceptable to help achieve this result.
• Parking stall markings. Marked parking spaces with cross hatches indicating the parking lane limits may help guide drivers closer to the curb.
• Angled parking should be avoided in areas of high bike traffic. If angled parking is used a four-foot buffer is recommended to provide maneuvering space for bicyclists, and/or reverse angle parking should be considered so that drivers back into spaces, which provides drivers greater visibility of bicyclists when entering and leaving the space.
Class II Bike Lanes Approaching Intersections
Right Turn Lanes
Bike lanes approaching intersections should dash the solid bike lane line for the last 100 to 200 feet in advance of the intersection. Dashing is preferable to dropping the bike lane stripe because it alerts bicyclists and right-turning motorist of the weave. Further, the treatment encourages bicyclists to wait in the proper location to be detected when signal detection is provided.

Bicycle Design Standards B-8 January 2012
Left Turn Lanes
Left turns at intersections present difficulty to bicyclists in two ways: conicts with left-turning motorists and the difficulty experienced by a bicyclist in executing a left turn. Improper left turns by motorist are often one of the chief causes of collisions at intersections. Often motorists are concentrating on finding a gap in vehicular traffic that they fail to notice oncoming bicycle traffic. Potential counter measures include:
• Provide left-turn pockets • Provide protected left-turn signal phasing
Bike Lanes approaching Right-Turn Only Lanes Source: Guide for the Development of Bicycle Facilities, AASHTO

Bicycle Design Standards B-9 January 2012
Class II Bike Lanes: Railroad Tracks
All railroad crossings should be made as bicycle-safe as possible. Optimizing bicycle safety at railroad crossings involves three issues:
1. The Angle of the Crossing
Where the angle of the tracks is not 90 degrees, additional pavement shall be provided so that bicyclists can approach the crossing at 90 degrees as depicted in Figure 1003.6A of the Highway Design Manual. Warning signs should be installed at skewed railroad crossings.
2. The Smoothness of the Crossing
The surface of the crossing should be designed such that the rails are as flush as possible with the surrounding pavement with minimal gaps between the roadway and the flangeway. Rubber or concrete crossing materials last longer than wood or asphalt and accordingly require less maintenance.
Bikeway Crossing Skewed Railroad Tracks
Bike Lane Striping at a Left-Turn Only Lane Source: VTA Bicycle Technical Guidelines

Bicycle Design Standards B-10 January 2012
3. The Gap Between the Flangeway and Roadway
On low-speed lightly traveled railroad tracks, commercially available flangeway fillers can eliminate the gap next to the rail.
Bike Lane Treatments at Bus Stops and Pullouts
Currently, no formal standard exists for the bike lane treatments at bus stops and pullouts. Therefore, the design is up to the local agency. The most common practice allows buses to cross through the bike lane to reach the curb. Treatments for this type of practice include bike lanes where both the inside and outside lanes are broken, or lanes where only the inside lane exists and it too is broken. Another alternative eliminates the bike lane completely, and then starts it again downstream of the bus stop.
The purpose of each of these alternatives is to let bikes know to expect vehicles crossing their lane, let cars know to expect buses, and let buses know to look out for bikes. Using a dashed or dotted line may be an attempt to tell motorists that cyclists may be leaving the bike lane to pass a bus, or to make it legal for the bus to encroach on the dedicated lane. The dashed lines in the bike lanes also inform the bicyclist that motor vehicles may be crossing the bike lane and to use extra caution.
Class III Bikeway – Bike Route
The following section includes recommended design standards and best practice information for Class III bikeways:
• Wide Curb Lane • Bicycle pavement markings “Sharrow” Lanes • Bicycle Boulevard
Referred to as a “bike route,” a Class III bikeway provides a route for bicyclists, which is identified by signing. On-street Class III bikeways are shared with motorists, may provide a designated route through areas not served by Class I or II facilities, or connect discontinuous segments of a bikeway. Class III facilities can be shared with pedestrians on a sidewalk; however, this practice is not recommended.
Bike Lane Treatments at Bus Stops (Far Side Stop)

Bicycle Design Standards B-11 January 2012
The Highway Design Manual does not provide recommended minimum widths for Class III bikeways, however, when encouraging bicyclists to travel along selected routes, traffic speed and volume, parking, traffic control devices, and surface quality should be acceptable for bicycle travel. A wide outside traffic lane (14-15’) is preferable to enable cars to safely pass bicyclists without crossing the centerline.
Class III Bike Route: Wide Curb Lane
On all streets, but especially where shoulder bikeways or bike lanes are warranted but cannot be provided due to severe physical constraints, a wide outside lane may be provided to accommodate bicycle travel. A wide lane usually allows an average size motor vehicle to pass a bicyclist without crossing over into the adjacent lane. Wide curb lanes are generally appropriate to accommodate bicyclists, whether or not the street is considered a bikeway.
Bike lanes should resume where the restriction ends. It is important that every effort be made to ensure bike lane continuity. Practices such as directing bicyclists onto sidewalks or other streets for short distances should be avoided, as they may introduce unsafe conditions. For curb lanes 16 ft or wider, the edge line should be striped.
12’ is the minimum width on State Highways without obtaining a Design Exception.
Class III Bike Route: Bicycle Boulevards
A variation of the Class III bike route known as a ‘Bicycle Boulevard’ has gained significant interest in California in recent years. Bicycle boulevards are generally comprised of low-volume residential streets that parallel major streets. Bicycle Boulevards are designed to give priority to bicyclists through various design techniques that reduce through traffic volumes and provide crossing enhancements for bicyclists at major intersections. Generally, bicycle boulevards include one or more of the following criteria:
• Low traffic volumes; • Traffic calming devices to discourage non-local motor vehicle traffic; • Priority for bicycles by assigning right-of-way to the bicycle boulevard at intersections wherever
possible;

Bicycle Design Standards B-12 January 2012
Shared Lane Marking
The SLM consists of a standard bicycle symbol combined with chevron
arrows.
• Traffic control to help bicycles cross major streets (i.e. bicycle sensitive detectors at signals); • Distinct “look” to alert bicyclists and motorists that the route is a priority for bicyclists (special
signs, pavement markings, etc.); and • By emphasizing bicycle use over automobiles, the walking environment for pedestrians along bicycle
boulevards is also improved.
Class III Bike Route: Shared Lane Markings “Sharrows”
The shared lane marking (SLM), known as “shared roadway bicycle marking” in the MUTCD, and as “sharrows” by the bicycling public, is a pavement legend which may be placed in the travel lane adjacent to on-street parking. The purpose of the marking is to provide positional guidance to bicyclists on roadways that are too narrow to be striped with bike lanes. Unlike bike lanes, a SLM does not designate a particular part of the street for the exclusive use of bicyclists. It is simply an informational marking to guide bicyclists to the best place to ride on the road to avoid the “door swing” of parked cars, and to help motorists expect to see and share the lane with bicyclists. The marking gives bicyclists freedom to move further to the left within a travel lane rather than brave the door zone, squeezed between moving and parked cars. The marking is usually repeated every several hundred feet. Without such markings, bicyclists might seek refuge on the sidewalk, ride in a serpentine pattern between parked vehicles, or travel in the wrong direction. Perhaps the most important benefit of SLM is that they send a message to cyclists and drivers alike that bikes belong on the road.
Sample Bicycle Boulevard treatments from Berkeley, CA

Bicycle Design Standards B-13 January 2012
Positional Layout of Shared Lane Markings
Source: San Francisco Bicycle Design Guidelines
Shared Lane Markings were approved for use in California in 2007 after device testing was performed by the City of San Francisco. While the version of the 2010 MUTCD adopted by California specifies that the device is to be used only where there is existing on-street parallel parking (Section 9C.103), the national MUTCD provides for use of the device on streets without on-street parking. Further, jurisdictions around the nation are recognizing the benefit of utilizing the device in locations where it may not be obvious where cyclists should be riding, such as at intersections with multiple turn lanes, as a guide marking through intersections (similar to skip lines), and as a guide-marking between bikeways.
Marking Placement
Laterally – According to the California MUTCD guidelines, SLM shall be placed so that the centers of the markings are a minimum of 11 feet from the curb face or edge of paved shoulders, and the distance may be increased beyond 11 feet. According to the National MUTCD, if SLM are used on a street without parking, the markings should be placed far enough from the curb to direct cyclists away from gutters, seams, and other obstacles, or near the center of the lane if the lane is less than 14 feet wide.
Longitudinally – SLM should be placed immediately after intersections and spaced at intervals of 250 feet. The longitudinal spacing of the markings may be increased or decreased as needed for roadway and traffic conditions (Source: 2010 CA MUTCD).
Signalized Intersections
Signal Detection
Actuated traffic signals pose a significant barrier to bicyclists when the detectors do not sense the presence of a bicycle. Bicyclists are then forced to wait for a vehicle to actuate the signal, dismount and use the intersection as a pedestrian, or proceed against the red light. A variety of signal detection technologies are currently available including inductive loop detectors which utilize an electromagnetic field to sense the presence of vehicles, video detection which senses the presence of vehicles optically, and a new technology – magnetometers – which uses magnetic anomaly detection.
Each of these technologies is suitable for the detection of bicycles, and bicycle detection should be provided at all traffic signal installations. Efforts need to be made to ensure that signal detection devices are capable of detecting a bicycle and detectors need to be located in the bicyclist’s expected path, including left-turn lanes and shoulders. Marking the road surface to indicate the optimum location for bicycle detection is helpful to the bicyclist so that they may position themselves properly to trigger the traffic signal.

Bicycle Design Standards B-14 January 2012
Inductive loops are still the most common technology employed. Two types of inductive loop detectors are typically used; the Diagonal Quadrupole Loop – Type “D” is typically used in vehicle lanes, and the Quadrupole Loop – Type “C” is typically used in bike lanes. The bicycle detection symbol may be used to show a bicyclist where to stop in a bike lane or traffic lane to be detected.
Bike Boxes
Bike boxes provide a reservoir for bicyclists in front of vehicle traffic at intersections. Cars wait behind the box, allowing bikes to come to the front of vehicular traffic and position themselves for turning and through movements. Bike boxes give bicyclists greater visibility, a head start through intersections, and help to reduce conflicts between turning bicycles and vehicles by clearly delineating the location for movements to occur. Bike boxes or “advanced stop lines” also provide a buffer between vehicles and pedestrians or bicycles crossing the street. Using colored surfacing for bike boxes should make them more prominent and thus making encroachment by motor vehicles less likely.
Quadrupole Loop Type “C”
Used in bike lane. Detects strongly in center. Sharp cut-off sensitivity
Quadrupole Loop Type “D”
Used in vehicle & “shared lanes” Sensitive over whole area Sharp cut-off sensitivity
Photo: New York City, NY
Source: Portland Office of Transportation

Bicycle Design Standards B-15 January 2012
Design Elements
Drainage Grates
The function of drainage grates is to drain storm water quickly from the roadway and to provide access to the storm water system. Gutters are sloped to direct water flow into the inlet. This keeps water from ponding at the longitudinal joint and undermining the pavement. Improperly designed drainage grates can catch bicycle tires and cause bicyclists to lose control of their bicycle. Because of this, cyclists may veer into traffic lanes to avoid grates and utility covers. Properly designed grates and utility covers allow cyclists to maintain their direction of travel without catching tires or being forced into travel lanes.
Optimally the roadway should be designed so that the bicyclist does not have to traverse the grate per HDM Section 837.2. On roadways with curb and gutter, the grate should not be wider than the gutter pan. If the gutter pan needs to be widened to accommodate a large drainage grate, the taper should be on the outside edge.
On roads with bike lanes, the roadway shall be designed such that the minimum asphalt concrete pavement width of 48 inches is maintained between the bike lane stripe and the edge of the gutter lip. If 48 inches of asphalt cannot be maintained, then a curb face inlet design for the drainage grate should be considered (see Section 3.2.1).
On roadways with shoulders, the grate should be placed outside the travel path of the bicyclist, i.e. 48 inches of clear pavement should be maintained between the shoulder stripe and the left edge of the drainage grate. If 48 inches cannot be provided within the existing shoulder width, the shoulder can be widened to accommodate the grate, with the taper on the outside edge, or a narrower grate should be selected. See also Section 7.4.2 and Figure 7-13.
Only drainage grates depicted in Caltrans Standard Plans D77B-Bicycle- Proof Grate Details or otherwise known to be bicycle-safe may be used on all roadways per HDM 837.2. Regardless of type of roadway or placement on the roadway, all grates on the roadway should be bicycle-proof.
Pavement Marking Materials
Paint is the least recommended marking material due to its low reflectivity and low skid resistance, plus it needs to be reapplied every 12 to 24 months, increasing maintenance costs. Durable pavement markings are preferred. They should be reflectorized and be capable of maintaining an appropriate skid resistance under rainy or wet conditions to maximize safety for bicyclists. The minimum coefficient of friction should be 0.30 as measured with California Test 342 to test surface skid resistance. Pavement marking tape or thermoplastic is recommended.

Bicycle Design Standards B-16 January 2012
Pavement Marking Tape
Type I Tape such as 3M Stamark TM tape Series 380I and Series 420 is the least slippery (and most long-lasting) pavement marking. Type I tape is cost-effective when placed after resurfacing, since it lasts as long as (or longer than) the pavement itself. The skid resistance of 3M Stamark TM Series 420 tape is 55 BPN with a retained value of 45 BPN; the equivalent coefficient of friction is not available.
Thermoplastic
Thermoplastic is optimized when the composition has been modified with crushed glass to increase the coefficient of friction and the maximum thickness is 100 mils (2.5 mm).
Pavement Markers
Pavement markers, whether raised reflective markers (Type C, D, G or H) or non-reflective ceramic pavement markers (Type A or AY, otherwise known as Bott’s dots) present a vertical obstruction to bicyclists, and shall not be used as bike lane stripes. When necessary as a fog line or adjacent to the edge line, the Type C or G reflective markers should be placed to the left of the line outside the shoulder area, and ideally the shoulder should be at least 4 feet wide. Where raised markers cross a bike lane or extensions thereof through intersections a gap of 4 feet should be provided as a clear zone for bicyclists. At gore areas (e.g. Standard Plan A20C) and other locations with channelizing lines, (e.g. Standard Plan A20D) if raised reflective markers are used to supplement the striping, extra lane width shall be provided in the areas where bicycles travel to provide bicyclists with more latitude to avoid the markers. (See also Section 7.2).
Roadway Surface Obstacles
Manhole covers and utility plates present obstacles to bicyclists due to their slipperiness and change in surface elevation with the surrounding pavement. While covers and plates can be replaced with less slippery designs, as discussed below, to minimize their adverse impacts on bicyclists, it is best to design the roadway so that they are not located within the typical path of bicyclists riding on the roadway. Therefore, new construction should not place manhole and other utility plates and covers where bicyclists typically ride i.e. within the six feet adjacent to the curb (or between 8 and 13 feet from curb if parking is permitted).
Wet utility covers and construction plate materials can be very slippery. Plain steel plates have a coefficient of friction of 0.012, which is unacceptably slippery and should never be used on the roadway. The coefficient of friction on all utility covers and steel plates placed on a roadway or highway or shoulder should be a minimum of 0.35. An example of an effective method for covers and plates (both steel or concrete) to have acceptable skid resistance is for the manufacturer to imprint waffle shaped patterns or right-angle undulations on the surface. The maximum vertical deviation within the pattern should be 0.25 inch (6 mm).
Bike Parking
As bicycle use becomes more prevalent in throughout the Plan Area, there will be more demand for adequate bicycle parking. Bicycle parking can be typified as either short- or long-term. Short-term parking generally consists of bicycle racks located conveniently to destinations such as at shopping centers, civic destinations, and schools. Long-term parking is designed to accommodate those who are expected to park for more that two hours. Long-term parking provides security and weather protection. It typically includes covered parking areas, bike lockers and/or bike lids, storage rooms, or secure areas such as “cages” or “corrals” that can only be accessed by bicyclists.

Bicycle Design Standards B-17 January 2012
Bicycle parking should be provided at all public destinations, including transit centers and bus stops, community centers, parks, schools, downtown areas, and civic buildings. All bicycle parking should be in a safe, secure, covered area (if possible), conveniently located to the main building entrance.
Bicycle Parking Placement – Type and Location
• Visibility – bicycle racks and lockers should be located in a highly visible location near building entrances so cyclists can spot them immediately. Bicyclists and motorists alike appreciate the convenience of a parking space located right in front of a destination. A visible location also discourages the theft and vandalism of bicycles. Preferably, racks will be located as close as or closer than the nearest automobile parking spaces to the building entrance.
• Security – properly designed bicycle racks and lockers that are well anchored to the ground are the first measure to help avoid vandalism and theft. In some cases, added measures, which may include lighting and/or surveillance, are essential for the security of bicycles and their users. The rack element (part of the rack that supports the bike) must keep the bike upright by supporting the frame in two places allowing one or both wheels to be secured. Inverted “U,” “A,” and post and loop racks are recommended designs. Wave type racks that are found in many locations throughout the County are not recommended because they require excessive space and are so often used improperly.
• Weather Protection – is especially important. A portion of all bicycle parking should be protected from the rain and the sun. Various methods can be employed including the use of building awnings and overhangs, newly constructed covers, weatherproof bicycle lockers or lids, or indoor storage areas. Long-term parking should always be protected.
• Clearance – adequate clearance is an essential component of rack placement. Clearance is required between racks to allow for the parking of multiple bicycles and around racks to give bicyclists room to maneuver and too prevent conflicts with others. If it becomes too difficult for a bicyclist to easily lock their bicycle, they may park it elsewhere and the bicycle capacity is lowered. Racks should be placed in a position where they do not block access to and from building entrances, stairways, or fire hydrants. Empty racks must not pose a tripping hazard for visually impaired pedestrians. Position racks out of the walkway’s clear zone (space reserved for walking). Likewise, bicycle racks placed along a sidewalk should be oriented parallel with the street, so parked bicycles do not intrude into the walkway’s clear zone. A row of inverted “U” racks should be situated on 30” minimum centers. Ideally, racks should be located immediately adjacent to the entrance to the building it serves, but not in a spot that may impede upon pedestrian flow in and out of the building.
Source: APBP Bike Parking Guidelines


St. Helena Bicycle Plan January 2012
Appendix C
OTS Collision Rankings, Charts and Graphs


READING AND UNDERSTANDING THE OTS RANKINGS
What are the OTS Rankings?
How are the OTS Rankings determined?
How to Read and Understand the OTS RankingsTop Horizontal Bar
Center Table
Bottom Table
The OTS Rankings were developed so that individual cities could compare their city’s traffic safety statistics to those of other cities withsimilar-sized populations. Cities could use these comparisons to see what areas they may have problems in and which they were doingwell in. The results helped both cities and OTS identify emerging or on-going traffic safety problem areas in order to help plan how tocombat the problems and help with the possibility of facilitating grants. In recent years, media, researchers and the public have taken aninterest in the OTS Rankings. It should be noted that OTS rankings are only indicators of potential problems; there are many factors thatmay either understate or overstate a city/county ranking that must be evaluated based on local circumstances.
NOTE: City rankings are for incorporated cities only. County Rankings include all roads – state, county and local – and all jurisdictions –CHP, Sheriff, Police and special.
Return to top
Victim and collision data for the rankings is taken from the latest available California Highway Patrol (CHP) Statewide Integrated TrafficRecords System (SWITRS) data.
Victim and collision rankings are based on rates of victims killed and injured or fatal and injury collisions per “1,000 daily-vehicle-miles-of-travel" (Caltrans data) and per “1,000 average population" (Department of Finance data) figures. This more accurately ensures properweighting and comparisons when populations and daily vehicle miles traveled vary.
DUI arrest totals and rankings are calculated for cities only and are based on rates of non-CHP DUI arrests (Department of Justicedata). This is so that local jurisdictions can see how their own efforts are working.
Counties are assigned statewide rankings, while cities are assigned population group rankings.
Return to top
Top Horizontal Bar:
Agency – local jurisdiction that the data applies to.
Year – the year the data represents. The rankings are updated once per year when all component statistics and data have beenreported.
County – county in which the city is located.
Group – Cities are grouped by population:
Group A – 13 cities, populations over 250,000
Group B – 55 cities, population 100,001-250,000
Group C – 103 cities, population 50,001-100,000
Group D – 97 cities, population 25,001-50,000
Rankings for smaller cities are not included on-line, but are available through the OTS Public Affairs Office.
Population – estimates matched to “Year”
DVMT – Daily Vehicle Miles Traveled. Caltrans estimate of the total number of miles all vehicles traveled on that city’s streets on anaverage day during that year.
What are the OTS Rankings?
How are the OTS Rankings determined?
How to Read and Understand the OTS Rankings
11/17/2010 California Office of Traffic Safety (OTS) - Grants
ots.ca.gov/Media_and_Research/…/default.asp 2/4

Return to top
Center Table:
IMPORTANT NOTE #1: The figures in the two ranking columns show as two numbers divided by a slash. The first number is that city’sranking in that category. The second number is the total number of cities/counties within that “Group”. For instance, if you see “22/55”, thatmeans that city ranks 22nd out of 55 cities of similar size.
IMPORTANT NOTE #2: OTS Rankings are calculated so that the higher the number of victims or collisions per 1000 residents in apopulation group, the higher the ranking. Number 1 in the rankings is the highest, or “worst.” So, for Group B, a ranking of 1/55 is thehighest or worst, 27/55 is average, and 55/55 is the lowest or best.
Type of Collision – This column delineates the different types of collisions OTS has chosen to show in the rankings. These representthe types with larger percentages of total killed and injured and areas of focus for the OTS grant program. Motorcycles were added in2008.
Victims Killed and Injured – This column shows the number of fatalities and injuries aggregated. Damage-only or fender-bendercollisions are not included.
Ranking by daily vehicle miles traveled – This column weighs this city against all others in the Group when looking at DVMT. Cities oflike size may have widely varying rates of traffic, a factor which can be meaningful on a local basis. Significant differences betweenthis and the population column must be evaluated based on local circumstances.
Ranking by population – This column weighs this city against all others in the Group based on population. Population can be ameaningful basis for comparison. Significant differences between this and the Daily Vehicle Miles Traveled column must be evaluatedbased on local circumstances.
Total Fatal and Injury – The total number of victims involved in all collisions where there were fatalities and/or injuries in thatcity/county.
Alcohol Involved – Collisions in which there were victims killed or injured where a party (driver, pedestrian, bicyclist) was classified as“Had Been Drinking.”
HBD Driver <21 – Collisions in which there were victims killed or injured where a driver who was under the age of 21 had been drinking.
HBD Driver 21-34 – Collisions in which there were victims killed or injured where a driver who was between the ages of 21 and 34 hadbeen drinking.
Motorcycles - Collisions in which there were victims killed or injured and a motorcycle was involved.
Pedestrians - Collisions in which there were victims killed or injured and a pedestrian was involved.
Pedestrians <15 - Collisions in which there were victims killed or injured and a pedestrian under the age of 15 was involved.
Pedestrians 65+ - Collisions in which there were victims killed or injured and a pedestrian age 65 and older was involved.
Bicycles - Collisions in which there were victims killed or injured and a bicyclist was involved.
Bicycles <15 - Collisions in which there were victims killed or injured and a bicyclist under age 15 was involved.
Composite – Figures which show rankings only, an aggregate of several of the other rankings (HBD 21-34, HBD Under21, AlcoholInvolved victims plus Hit & Run, Nighttime and Speed collisions). These figures are a means to give an indication of over-all trafficsafety.
Return to top
Bottom Table:
Speed Related – Collisions in which there were victims killed or injured where speed was the primary factor.
Nighttime (9:00pm - 2:59am) – Collisions in which there were victims killed or injured that occurred between those hours, which areprime hours for DUI, speeding and drowsy driving crashes.
Hit and Run – Collisions in which there were victims killed or injured and a driver left the scene.
DUI Arrests – DUI arrest figures are shown for cities only, not counties.
The first figure gives the total number of DUI arrests for the year on city streets. The second number shows the percentage of thecity’s estimated licensed drivers that was arrested for DUI during that year. The current statewide average is .90%. Localpercentages shown give an indication of how cities compare against the average. Lower than .90% means lower than the stateaverage and higher than .90% means higher that the state average. However, differences can be from many factors and must beevaluated based on local circumstances.
Cities often use this measure to determine how to adjust their DUI enforcement activity. When increased DUI enforcement is combinedwith education and public information campaigns, it can lead to a reduction of the incidence of DUI.
11/17/2010 California Office of Traffic Safety (OTS) - Grants
ots.ca.gov/Media_and_Research/…/default.asp 3/4

“0” Note: Cities reporting 0 victims and/or collisions for a category or 0 DUI arrests are ranked using the variable upon which the ranking isbased. For example, if 10 of 97 cities in population group D reported 0 hit-and-run fatal and injury collisions when ranking by per “1,000average population,” the city with the highest population of these 10 cities would be ranked 97/97, and the city with the lowest population ofthese 10 cities would be ranked 88/97. The same methodology has been applied when ranking per “1,000 daily-vehicle-miles-of-travel” andper “estimated average number of licensed drivers.”
Return to top
Conditions of Use | Privacy PolicyCopyright © 2007 State of California
11/17/2010 California Office of Traffic Safety (OTS) - Grants
ots.ca.gov/Media_and_Research/…/default.asp 4/4

OFFICE OF TRAFFIC SAFETY - 2006 RANKINGS
AGENCY
2803 NAPA COUNTY 5,988F
31
5
NCIC COUNTY POPULATION (AVG) DVMTGROUP
1
4
1
0
8
3
1
0
3
0
11/74
16/74
8/74
6/74
32/74
60/74
15/74
21,256
18/74
10/74
43/74
17/74
46/74
11/74
5/74
3/74
22/74
56/74
6/74
7/74
13/74
9/74
35/74
7/74
41/74
TYPE OF COLLISION
Total Fatal and Injury.......................
Speed Related..................................
Alcohol Involved..............................
Nighttime...........................................
Hit and Run........................................
HBD Driver <21..................................
HBD Driver 21-34...............................
Pedestrians........................................
Pedestrians 65+.................................
Pedestrians <15.................................
Bicyclists...........................................
Bicyclists <15.....................................
DUI ARRESTS 92
5/74 14/74Composite ...........................................................................
2.56 64/69%
VICTIMS
KILLED AND
INJURED
SAINT HELENA
RANKING BY
DAILY VEHICLE
MILES TRAVELED
RANKING BY
AVERAGE
POPULATION
COLLISIONS
10/20/2010Printed: Page 1 of 1

OFFICE OF TRAFFIC SAFETY - 2007 RANKINGS
AGENCY
2803 NAPA COUNTY 5,933F
19
4
NCIC COUNTY POPULATION (AVG) DVMTGROUP
1
1
2
2
7
2
0
0
0
0
14/73
37/73
6/73
20/73
19/73
13/73
15/73
30,101
17/73
44/73
35/73
61/73
45/73
27/73
6/73
14/73
18/73
12/73
13/73
16/73
21/73
45/73
39/73
62/73
44/73
TYPE OF COLLISION
Total Fatal and Injury.......................
Speed Related..................................
Alcohol Involved..............................
Nighttime...........................................
Hit and Run........................................
HBD Driver <21..................................
HBD Driver 21-34...............................
Pedestrians........................................
Pedestrians 65+.................................
Pedestrians <15.................................
Bicyclists...........................................
Bicyclists <15.....................................
DUI ARRESTS 153
12/73 10/73Composite ...........................................................................
4.3 69/70%
VICTIMS
KILLED AND
INJURED
SAINT HELENA
RANKING BY
DAILY VEHICLE
MILES TRAVELED
RANKING BY
AVERAGE
POPULATION
COLLISIONS
10/20/2010Printed: Page 1 of 1

OFFICE OF TRAFFIC SAFETY - 2008 RANKINGS
AGENCY
2803 NAPA COUNTY 5,927F
16
5
NCIC COUNTY POPULATION (AVG) DVMTGROUP
3
1
2
2
1
1
1
0
2
0
13/73
38/73
1/73
12/73
20/73
9/73
52/73
30,101
34/73
6/73
43/73
18/73
50/73
26/73
1/73
12/73
15/73
11/73
47/73
7/73
31/73
9/73
44/73
21/73
44/73
TYPE OF COLLISION
Total Fatal and Injury.......................
Speed Related..................................
Alcohol Involved..............................
Nighttime...........................................
Hit and Run........................................
HBD Driver <21..................................
HBD Driver 21-34...............................
Pedestrians........................................
Pedestrians 65+.................................
Pedestrians <15.................................
Bicyclists...........................................
Bicyclists <15.....................................
DUI ARRESTS 66
16/73 31/73Composite ...........................................................................
1.86 52/70%
VICTIMS
KILLED AND
INJURED
Saint Helena
RANKING BY
DAILY VEHICLE
MILES TRAVELED
RANKING BY
AVERAGE
POPULATION
COLLISIONS
2 7/738/73Motorcyclists ....................................
10/20/2010Printed: Page 1 of 1

1
2
3
4
5
6
7
8
9
10
1999
8
2000
4
2001
4
2002
7
2003
1
2004
1
2005
2
2006
3
2007
1
2008
6
NAPA COUNTY BICYCLE STUDYST HELENA
Collisions by Year 1/1/1999 to 12/31/2008 Total Collisions: 37

1
2
3
4
5
6
7
8
9
10
January
1
February
2
March
1
April
2
May
1
June
7
July
5
August
3
September
6
October
3
November
4
December
2
NAPA COUNTY BICYCLE STUDYST HELENA
Collisions by Month 1/1/1999 to 12/31/2008 Total Collisions: 37

5
10
15
20
25
Sunday
3
Monday
6
Tuesday
7
Wednesday
1
Thursday
2
Friday
11
Saturday
7
NAPA COUNTY BICYCLE STUDYST HELENA
Collisions by Day of Week 1/1/1999 to 12/31/2008 Total Collisions: 37

1
2
3
4
5
6
7
8
9
10
0700
1
0800
3
0900
2
1000
2
1100
5
1200
1
1300
3
1400
3
1500
6
1600
2
1700
3
1800
2
1900
4
NAPA COUNTY BICYCLE STUDYST HELENA
Collisions by Hour 1/1/1999 to 12/31/2008 Total Collisions: 37 (Unkown Time: 0)

5
10
15
20
25
Other
21
Broadside
5
Overturned
3
Sideswipe
3
HitObject
2
Rear-End
2
Vehicle-
Pedestrian
1
NAPA COUNTY BICYCLE STUDYST HELENA
Collision Type 1/1/1999 to 12/31/2008 Total Collisions: 37

5
10
15
20
25
AutoR/W
Violation
11
ImproperTurning
9
WrongSide
ofRoad
4
Unknown
3
OtherHazardousMovement
2
UnsafeStarting
orBacking
2
Lights
1
OtherEquipment
1
OtherThan
DriverorPed
1
PedestrianViolation
1
TrafficSignals
andSigns
1
UnsafeSpeed
1
NAPA COUNTY BICYCLE STUDYST HELENA
Primary Collision Factors 1/1/1999 to 12/31/2008 Total Collisions: 37

5
10
15
20
25
PropertyDamage
Only
7
Complaintof
Pain
8
OtherVisibleInjury
18
SevereInjury
3
Fatal
1
NAPA COUNTY BICYCLE STUDYST HELENA
Extent of Injury 1/1/1999 to 12/31/2008 Total Collisions: 37

Clear 31 (83.78%)
Cloudy 6 (16.22%)
Weather
Daylight 31 (83.78%)
Dark - No Street Lights 2 (5.41%)
Dark - Street Lights 2 (5.41%)
Dusk - Dawn 2 (5.41%)
Lighting Conditions
NAPA COUNTY BICYCLE STUDYST HELENA
1/1/1999 to 12/31/2008 Total Collisions: 37

St. Helena Bicycle Plan January 2012
Appendix D
MTC and National Bicycle and Pedestrian Documentation Project Information


Bicycle Count Guidelines D-1 January 2012
Appendix D – Bicycle Count Guidelines
Count Methodologies
Metropolitan Transportation Commission
In 2003, the Metropolitan Transportation Commission (MTC) funded the Bicyclist and Pedestrian Data Collection and Analysis Project. The project resulted in the Handbook for Bicyclists and Pedestrian Counts, for use by local agencies throughout the Bay Area. The Handbook presents guidelines and standard methodologies for conducting counts of bicyclist and pedestrian activity. MTC’s bicycle count methodology was developed to attain a consistent regional bicycle count and analysis procedures so that trends in usage can be documented throughout the Bay Area. The counting strategy outlined in the Handbook provides an easy and inexpensive method of conducting bicycle and pedestrian counts on a regular basis. The level of detail to be extracted during routine counts is kept to a minimum to reduce ambiguity while still providing useful data. The methodology is not unlike a typical traffic count which reveals little more than the time of day, and direction of travel. Collection of data regarding the motorist’s age, trip purpose, length of trip, etc. is relatively rare. Using the procedures outlined in MTC’s Handbook and any subsequent updates will ensure consistent results among local agencies for the development of a count database, as well as with larger efforts conducted by MTC throughout the region. Count procedures and instructions provided by MTC can be found on MTC’s website via the following web link: http://www.mtc.ca.gov/planning/bicyclespedestrians/counts.htm
National Bicycle and Pedestrian Documentation Project
The National Bicycle and Pedestrian Documentation Project (NBPDP) is an annual bicycle and pedestrian count and survey effort sponsored by the Institute of Transportation Engineers Pedestrian and Bicycle Council. The goals of the NBPD are to: (1) Establish a consistent national bicycle and pedestrian count and survey methodology; (2) Establish a national database of bicycle and pedestrian count information generated by these consistent methods and practices; and (3) Use the count and survey information to begin analysis on the correlations between local demographic, climate and land-use factors and bicycle and pedestrian activity. More information about the project can be found at: http://bikepeddocumentation.org/
Recommendations
In order to supplement US Census Journey to Work (JTW) data, to attain a better understanding of existing usage and travel patterns, and to be able to project demand, regular bicycle counts (on an annual or bi-annual basis as needed), are recommended as a programmatic improvement. Periodic counts should be coordinated through a central clearing house such as the NCTPA or the Napa County Bicycle Coalition and conducted in each jurisdiction within the plan area. Counts may be conducted by volunteers, interns, and others as appropriate.
Recommended Count Locations
Count locations were selected using the following criteria:
1. To ensure a balanced geographical representation of the count locations.
2. To capture inter-jurisdiction activity at community gateways.
3. The intersection of primary bicycle routes.

Bicycle Count Guidelines D-2 January 2012
4. Proximity to major destinations such as downtowns, civic destinations, employment centers, transit facilities, schools, etc.
5. Location on the regional or local bicycle network (existing or proposed)
Recommended count locations are catalogued in a database by jurisdiction in Attachment A, and shown graphically on maps in Attachment B. Count locations generally consist of street intersections and/or pathway/street intersections. Each count location is identified by its primary street and cross street, and includes notations about the existing and/or proposed bikeway facilities at the site. Additional details are provided about the general type of bicycle use or activity expected in the area along with notes specific to the site or future uses in the vicinity of the count location where appropriate. Over time, additional data fields may be built into the database such as Average Daily Traffic Volumes, traffic speeds, street widths, pavement conditions, etc.
Count Periods
Bicyclist and pedestrian counts can be conducted during each season of the year: fall, spring, summer and winter. However, counts during the winter months are often avoided due to poor weather conditions and extended holiday-related vacations. The second week in September is the official annual National Bicycle and Pedestrian Count and survey week. Counts are also conducted optionally for the National Bicycle and Pedestrian Count program during the second week of January, the second week of May, and the first week of July.
Prior to conducting counts, school districts and/or institutions within each jurisdiction should be contacted to verify when schools will be in session to avoid spring and winter breaks and special school events. Counts at locations that are not near schools can be accurately conducted during the summer months. In Napa, summertime conditions typically represent peak travel volumes. It should be noted that counting periods should be as condensed as much as possible to ensure the most consistent conditions.
Counts should be conducted during non-holiday weeks on Tuesdays, Wednesdays or Thursdays and the Saturdays preceding or following the count week. If counts must be conducted during holiday weeks, the actual holiday day should be avoided, and the Tuesday after Monday holidays and the Thursday before Friday holidays should also be avoided.
Counts should be conducted during standard peak commute hours. Typically, the weekday morning peak occurs between 7:00 and 9:00 AM, the weekday evening peak occurs between 4:00 and 6:00 PM, and the weekend midday peak occurs on Saturdays between 12:00 noon and 2:00 PM. Time periods may be adjusted to account for local considerations, and supplementary counts may be conducted to capture specific activities, such as school commutes.
Recommendation: It is recommended that bicycle counts conducted throughout the Plan area be consistent with MTC’s guidelines and conducted in accordance with the National Bicycle and Pedestrian Documentation Project so that they may be coordinated with regional and national databases.

Bicycle Count Guidelines D-3 January 2012

Bicycle Count Guidelines D-4 January 2012

Bicycle Count Guidelines D-5 January 2012

Bicycle Count Guidelines D-6 January 2012

Bicycle Count Guidelines D-7 January 2012

Bicycle Count Guidelines D-8 January 2012

Bicycle Count Guidelines D-9 January 2012


St. Helena Bicycle Plan January 2012
Appendix E
Project Ranking Matrix


Route_No
EW NS
Corridor/Street
Beginn
ing Po
int
Ending
Point
Class
Length
(Miles)
Local
Route
Prim
ary
Route
SF Bay
Area
Route
Recreatio
nal/
Commute
Cost Estim
ate
Land
Use
Dem
and
Technical
Difficulty
Non
‐Technical
Difficulty
Overcom
es
Barriers/Con
nectivity
Issues
Public
Inpu
tPriority
Score
Priority Rank
37‐SH‐ALT‐17‐NV‐
CONN
NS
Adams St Path Extension to Napa River Trail
(City
Flood
Con
trol Prope
rty)
Starr Ave
Silverado Trail
Class I M
ulti Use Path
0.45
No
Yes
Yes
C / R
$247
,924
12
22
24
13Med
ium
1‐SH
‐37‐SH
‐CONN
NS
Allison Ave Path (Cycle Track)
Charter Oak Ave
McCorkle Ave
Class I M
ulti Use Path
0.05
No
Yes
Yes
C / R
$25,93
01
21
22
311
Low
1‐SH
‐37‐SH
‐CONN
NS
Allison Ave Path (Cycle Track)
McCorkle Ave
Pope
St
Class I M
ulti Use Path
0.12
Yes
No
No
C / R
$66,17
41
21
22
311
Low
1‐SH
‐37‐SH
‐CONN
EWCh
arter Oak Ave Path (Cycle Track)
Main St
Allison Ave
Class I M
ulti Use Path
0.21
No
Yes
No
C$1
15,322
12
12
23
11Med
ium
36‐SH‐SPU
REW
Crane Park Path (to La Quinta Wy)
Grayson
Ave
Kenn
edy Ct
Class I M
ulti Use Path
0.32
Yes
No
No
C / R
$175
,218
33
23
34
18High
36‐SH
EWGrayson
Ave Path (Cycle Track)
Crane Ave
Class I facility 455
' west o
f SR 29
Class I M
ulti Use Path
0.42
Yes
No
No
C / R
$230
,229
33
23
34
18High
1‐SH
‐37‐SH
‐ALT‐
CONN
NS
Hun
t Ave Path (Cycle Track)
Church St
Starr Ave
Class I M
ulti Use Path
0.42
Yes
No
No
C$2
31,354
22
11
22
10Med
ium
1‐SH
‐37‐SH
‐CONN
EWLibrary Lane
Path
Adams St
Vine
Trail (along
RR cooridor)
Class I M
ulti Use Path
0.13
Yes
No
No
C / R
$70,33
03
22
22
516
High
30‐SH‐LOOP
NS
Lower Reservior Trail (Loo
p arou
nd Low
er
Reservoir)
NW city
limit
Prop
osed
Low
er Reservoir Trail alon
g Spring
Mou
ntain Rd
Class I M
ulti Use Path
0.27
Yes
No
No
R$1
46,899
01
22
23
10Low
30‐SH‐LOOP
NS
Lower Reservoir Trail (along
the no
rthe
rn city
lim
it adjacent to
Deer Park Rd)
Napa River Trail
Just east o
f Spring Mou
ntain Rd
Class I M
ulti Use Path
1.48
Yes
No
No
C / R
$816
,445
12
12
24
12Low
1‐SH
‐37‐SH
‐CONN
EWMcCorkle Ave Path
Prop
osed
class I facility 67
5' west o
f College
Ave
College Ave
Class I M
ulti Use Path
0.14
Yes
No
No
C$7
5,21
42
11
22
311
Low
17‐SH‐ALT
EWNapa River Trail
St Helen
a city limit ne
ar wastewater
treatm
ent p
lant
SE edge Wappo
Park
Class I M
ulti Use Path
1.14
Yes
Yes
No
C$6
27,446
12
33
25
16High
17‐SH‐ALT
EWNapa River Trail
Pope
St (Napa River Trail‐W
appo
Park)
St Helen
a city limit (Deer Park Rd / Lower
Reservoir Trail)
Class I M
ulti Use Path
1.85
Yes
Yes
No
C / R
$1,018
,700
12
33
25
16High
34‐SH
NS
Oak Ave Path
Mitche
ll Dr
Charter Oak Ave
Class I M
ulti Use Path
0.16
Yes
No
No
C / R
$89,35
43
31
23
517
High
37‐SH
NS
Pope
St P
ath (Cycle Track)
Allison Ave
Starr Ave
Class I M
ulti Use Path
0.23
Yes
Yes
No
C$1
28,266
22
12
24
13Med
ium
30‐SH‐LOOP
EWSpring
Mtn Rd
Lower Reservoir
Dean Yo
rk Ln
Class I M
ulti Use Path
0.65
Yes
No
No
R$3
56,710
12
22
13
11Low
37‐SH‐ALT
EWStarr Ave Path (Cycle Track)
Hun
t Ave
Pope
St
Class I M
ulti Use Path
0.25
No
Yes
Yes
C / R
$138
,214
12
12
23
11Low
36‐SH‐37‐SH
‐CO
NN
EWStarr Ave Path (exten
ds sou
theast from
Starr
Ave)
Mills Ln
Pope
St
Class I M
ulti Use Path
0.43
Yes
No
No
C / R
$235
,412
12
11
23
10Low
37‐SH‐ALT‐2
NS
Sulphu
r Creek Path
Sulphu
r Springs Ave
Napa River Trail
Class I M
ulti Use Path
2.23
Yes
No
No
C / R
$1,229
,209
32
22
34
16High
28‐SH
NS
Sulphu
r Creek Path
Spring
St
Sulphu
r Springs Ave
Class I M
ulti Use Path
0.10
Yes
No
No
C / R
$53,16
71
21
23
413
Med
ium
1‐SH
NS
Vine
Trail (along
Pratt Ave)
Vine
Trail (in
tersectio
n of Vine Trail along
RR
with
Pratt Ave)
Vine
Trail (along
SR 29
‐Main St)
Class I M
ulti Use Path
0.35
No
Yes
Yes
C / R
$194
,476
12
13
25
14Med
ium
34‐SH
NS
Vine
Trail(alon
gSR
29‐M
ainSt)
CharterOak
Ave
Grayson
Ave
ClassIM
ultiUse
Path
025
Yes
No
No
C$1
3577
93
22
33
417
High
34‐SH
NS
Vine
Trail (along
SR 29
‐Main St)
Charter Oak Ave
Grayson
Ave
Class I M
ulti Use Path
0.25
Yes
No
No
C$1
35,779
32
23
34
17High
1‐SH
NS
Vine
Trail (along
SR 29
‐Main St)
York Creek Path/Vine
Trail intersectio
n (near
Pratt A
ve)
Deer Park Rd
Class I M
ulti Use Path
0.74
No
Yes
Yes
C / R
$404
,461
23
23
35
18High
1‐SH
NS
Vine
Trail (along
SR 29
‐Main St)
Chaix Ln
Charter Oak Ave
Class I M
ulti Use Path
0.82
No
Yes
Yes
C / R
$451
,168
33
13
35
18High
1‐SH
NS
Vine
Trail on
RR grade
Charter Oak Ave
Pratt A
veClass I M
ulti Use Path
1.02
No
Yes
Yes
C / R
$559
,514
32
23
35
18High
30‐SH‐LOOP
NS
York Creek Path
Vine
Trail (SR 29
‐Main St)
Napa River Trail
Class I M
ulti Use Path
0.79
Yes
No
No
R$4
33,240
12
12
24
12Low
30‐SH‐LOOP
NS
York Creek Path
Spring
Mou
ntain Rd
Vine
Trail (SR 29
‐Main St)
Class I M
ulti Use Path
0.33
Yes
No
No
R / C
$181
,242
12
12
24
12Low
39‐SH
NS
Allyn Ave
Spring
St
Madrona
Ave
Class II Bike Lane
0.34
Yes
No
No
C$3
0,37
71
12
22
311
Med
ium
1‐SH
‐37‐SH
‐CONN
NS
College Ave
Prop
osed
class I facility at SE en
d of College
Ave
Pope
St
Class II Bike Lane
0.18
Yes
No
No
C$1
6,15
52
22
22
313
Med
ium
39‐SH
EWCrane Ave
Sulphu
r Springs Ave
Birch St
Class II Bike Lane
0.62
Yes
No
No
R$5
5,50
22
22
22
313
Med
ium
37‐SH‐39‐SH
‐CO
NN
EWCrane Ave
Spring
St
Birch St
Class II Bike Lane
0.20
Yes
No
No
R$1
8,44
51
22
22
312
Med
ium
36‐SH
EWGrayson
Ave
Class I facility 455
' west o
f SR 29
SR 29, M
ain St
Class II Bike Lane
0.09
Yes
No
No
C$7
,687
22
22
23
13Med
ium
1‐SH
‐37‐SH
‐CONN
EWMcKorkle Ave
Mariposa Ln
Prop
osed
class I facility 67
5' west o
f College
Ave
Class II Bike Lane
0.23
Yes
No
No
C$2
0,82
41
12
22
311
Low
36‐SH
EWMills Ln
SR 29‐Main St
Prop
osed
class I facility anne
x from
Starr Ave
Class II Bike Lane
0.50
Yes
No
No
C$4
5,31
81
12
11
28Low
37‐SH
NS
Pope
St
Starr Ave
Silverado Trail
Class II Bike Lane
0.41
Yes
Yes
No
C$3
6,77
12
32
33
518
High
37‐SH
EWPo
pe St
SR 29‐Main St
Allison Ave (P
ropo
sed class I facility along
Po
pe St)
Class II Bike Lane
0.23
Yes
Yes
No
C$2
0,60
42
22
22
414
Med
ium
1‐SH
NS
Pratt A
veVine
Trail
SR 29‐Main St
Class II Bike Lane
0.26
No
Yes
Yes
C$2
3,06
31
22
22
312
Med
ium
34‐SH
EWSpring
Mtn Rd
Dean Yo
rk Ln
Hillview
Pl
Class II Bike Lane
0.29
Yes
No
No
C$2
5,71
22
22
22
313
Med
ium
34‐SH‐37‐SH
‐ALT‐
CONN
EWSpring
Mtn Rd
Hillview
Pl
Madrona
Ave
Class II Bike Lane
0.10
Yes
No
No
C$9
,278
22
22
23
13Med
ium
37‐SH
NS
Spring
St
White Sulph
ur Springs Rd at city
limit
Oak Ave
Class II Bike Lane
1.16
Yes
No
No
C$1
04,774
22
33
34
17High
25‐SH
NS
SR 29‐Main St
Pratt A
veSt Helen
a city limit, Deer Park Rd
Class II Bike Lane
0.80
No
Yes
Yes
C$7
2,16
13
32
33
519
High
25‐SH
NS
SR 29‐Main St
Mills Ln
Charter Oak Rd
Class II Bike Lane
0.21
No
Yes
Yes
C$1
8,72
03
32
33
519
High
25‐SH
NS
SR 29‐Main St
Chaix Ln
Mills Ln
Class II Bike Lane
0.62
No
Yes
Yes
C$5
5,82
53
32
33
519
High
37‐SH‐ALT
EWStarr Ave‐Adams St‐Railroad Ave‐Fulton Ln
Vine
Trail/Fulto
n Ln at R
R track
Hun
t Ave
Class II Bike Lane
0.79
No
Yes
Yes
C$7
0,86
42
22
22
313
Med
ium
28‐SH
EWSulphu
r Springs Ave
Crane Ave
SR 29‐Main St
Class II Bike Lane
0.50
Yes
No
No
C$4
5,05
11
22
22
312
Med
ium

28‐SH
EWSulphu
r Springs Ave
St Helen
a city limit
Spring
St
Class II Bike Lane
0.16
Yes
No
No
C$1
4,62
31
22
22
312
Med
ium
37‐SH‐ALT
NS
Sylvaner Ave‐Reisling Way‐M
adrona
Ave
Spring
St
Main St
Class II Bike Lane
1.33
Yes
No
No
C$1
19,643
22
23
34
16High
1‐SH
‐39‐SH
NS
Adams St
Allyn Wy
Railroad Ave
Class III Bike Bo
ulevard
0.47
Yes
No
No
C$2
,137
32
22
23
14Med
ium
1‐SH
‐ALT‐34‐SH
‐CO
NN
NS
Elmhu
rst A
veSpring
Mt R
dSR
29‐Main St
Class III Bike Bo
ulevard
0.23
Yes
No
No
C$1
,034
22
22
23
13Med
ium
37‐SH‐ALT
NS
Fulto
n Ln
Main St
Railroad Ave
Class III Bike Bo
ulevard
0.08
Yes
No
No
C$3
602
22
22
313
Med
ium
1‐SH
‐39‐SH
‐CONN
NS
Mitche
ll Dr
Crane Ave
Oak Ave
Class III Bike Bo
ulevard
0.36
Yes
No
No
C$1
,637
12
22
23
12Med
ium
1‐SH
‐ALT‐34‐SH
‐CO
NN
NS
Mitche
ll Dr
Oak Ave
SR 29, M
ain St
Class III Bike Bo
ulevard
0.07
Yes
No
No
C$3
272
22
22
313
Med
ium
39‐SH
NS
N Crane
Ave/Birch St
Valley View
St
Spring
St
Class III Bike Bo
ulevard
0.38
Yes
No
No
C$1
,700
11
32
23
12Med
ium
34‐SH
EWOak Ave, H
illview
Pl
Spring
Mtn Rd
Mitche
ll Dr
Class III Bike Bo
ulevard
0.69
Yes
No
No
C$3
,100
33
22
24
16High
28‐SH
EWCh
aix Ln
SR 29‐Main St
Napa River Trail (prop
opsed)
Class III Bike Ro
ute
1.07
Yes
No
No
C$2
,683
11
33
13
12Med
ium
37‐SH‐SPU
REW
Edwards St
Hun
t Ave
Pope
St
Class III Bike Ro
ute
0.15
Yes
No
No
C$3
681
13
31
312
Med
ium
37‐NV
NS
How
ell M
tn Blvd
Silverado Trail
Deer Park Rd
Class III Bike Ro
ute
4.36
Yes
No
No
C$1
0,89
51
13
31
312
Med
ium
37‐SH‐SPU
RNS
Mariposa Ln
Pope
St
McCorkle Ave
Class III Bike Ro
ute
0.14
No
Yes
Yes
C$3
441
13
31
312
Med
ium
1‐SH
‐37‐SH
‐CONN
EWMcCorkle Ave
Alison
Ave
Mariposa Ln
Class III Bike Ro
ute
0.06
No
Yes
Yes
C$1
551
13
31
312
Med
ium
1‐SH
‐17‐SH
‐ALT‐
CONN
NS
Pratt A
veRR
track/Vine
Trail at Pratt Ave
Napa River Trail (prop
opsed)
Class III Bike Ro
ute
0.48
Yes
No
No
C$1
,189
11
33
13
12Med
ium
1‐SH
‐ALT
EWRa
ilroad Ave, Chu
rch St
Pope
St
Adam St
Class III Bike Ro
ute
0.26
Yes
No
No
C$6
482
13
31
414
Med
ium
34‐SH
EWSpring
Mou
ntain Rd
W St H
elen
a city limit
Prop
osed
class II facility on
Spring Mou
ntain
RdClass III Bike Ro
ute
0.69
Yes
No
No
C$1
,715
11
33
13
12Med
ium
25‐SH
EWSR
29‐Main St
Charter Oak Rd
Pratt A
veClass III Bike Ro
ute
0.95
Yes
Yes
No
C$2
,372
33
33
24
18High
28‐SH
EWSulphe
r Springs Ave
Sulphu
r Creek
Crane Ave
Class III Bike Ro
ute
0.93
Yes
No
No
R$2
,331
11
33
13
12Med
ium

St. Helena Bicycle Plan January 2012
Appendix F
Funding Program Summaries


Summary of Funding Programs F-1 January 2012
Appendix F – Summary of Funding Programs
The following section presents a general description of funding programs that can be used to implement the projects contained in this plan.
Federal Funding Programs
Approximately every six years, the U.S. Congress adopts a surface transportation act — Congress’s authorization to spend tax dollars on highways, streets, roads, transit and other transportation related projects. The most recent surface transportation act is titled the Safe, Accountable, Flexible, Efficient Transportation Equity Act: A Legacy for Users (SAFETEA-LU). SAFETEA-LU ended on September 30, 2009. To date the U.S. Congress has yet to enact a new authorization act. Instead it has passed several extensions to SAFETEA which run through September 30, 2011 to continue the flow of funding to transportation programs. It is now anticipated that the passage of the new act will be completed by this date.
Federal funding through SAFETEA-LU and its future successors will provide much of the funding available for transportation projects in this Plan. SAFETEA-LU contains several major programs, which are highlighted below, that may be used to fund transportation and/or recreation improvements in this Plan. SAFETEA-LU funding is administered through the state (Caltrans or Resources Agency) and regional governments such as the Metropolitan Transportation Commission (MTC). Most, but not all, of the funding programs are transportation versus recreation oriented, with an emphasis on (a) reducing auto trips and (b) providing an intermodal connection. Funding criteria often includes project listing in a Regional Transportation Improvement Plan, completion and adoption of a bicycle master plan, quantification of the costs and benefits of the system (such as saved vehicle trips and reduced air pollution), proof of public involvement and support, National Environmental Policy Act (NEPA) compliance, and commitment of some local resources. In most cases, SAFETEA-LU provides matching grants of 80 to 90 percent, but prefers to leverage other moneys at a lower rate.
Web Link: http://www.fhwa.dot.gov/safetealu/index.htm
Congestion Mitigation and Air Quality Improvement Program / Surface Transportation Program
The majority of federal transportation funds flow to the states in the form of Congestion Mitigation & Air Quality Improvement Program (CMAQ) Funds and Surface Transportation Program (STP) Funds. In California these funds are administered by Caltrans, however, Caltrans assigns a significant portion of two of the programs to MTC and other regional planning agencies to be used at their own discretion subject to federal regulations. Using these sources, MTC develops and administers its own funding programs, including the Transportation for Livable Communities Program and the Regional Bicycle and Pedestrian Program to target Bay Area transportation needs.
Web Link: http://www.mtc.ca.gov/funding/STPCMAQ/
Highway Safety Improvement Program
Section 1401 of the Safe, Accountable, Flexible Efficient Transportation Equity Act - Legacy for Users (SAFETEA-LU) amended Section 148 of Title 23 to create a new, core Highway Safety Improvement Program. This new Highway Safety Improvement Program (HSIP) replaces the Hazard Elimination Safety Program, (23 U.S.C §152). This new stand-alone program reflects increased importance and emphasis on highway safety initiatives in SAFETEA-LU. It replaces the current statutory requirement that States set aside 10 percent of their Surface Transportation Program (STP) funds for carrying out the rail-highway crossings and hazard elimination programs. Funds can be used for safety improvement projects

Summary of Funding Programs F-2 January 2012
on any public road or publicly owned bicycle or pedestrian pathway or trail. A safety improvement project corrects or improves a hazardous roadway condition, or proactively addresses highway safety problems that may include: intersection improvements; installation of rumble strips and other warning devices; elimination of roadside obstacles; railway-highway grade crossing safety; pedestrian or bicycle safety; traffic calming; improving highway signage and pavement marking; installing traffic control devices at high crash locations or priority control systems for emergency vehicles at signalized intersections, safety conscious planning and improving crash data collection and analysis, etc. The States that adopt and implement a strategic highway safety plan are provided additional flexibility to use Highway Safety Improvement Program (HSIP) funds for public awareness, education, and enforcement activities otherwise not eligible if they are consistent with a strategic State highway safety plan and comprehensive safety planning process.
Web Link: http://www.dot.ca.gov/hq/LocalPrograms/hsip.htm
Transportation Enhancements
Transportation Enhancements (TE) are transportation-related activities that strengthen the cultural, aesthetic, and environmental aspects of the Nation's transportation system. Similar to CMAQ and STP funds, MTC develops and administers its own funding programs using TE funds to target Bay Area transportation needs. TE funds help to make up regional funding programs such as the Transportation for Livable Communities Program and the Regional Bicycle and Pedestrian Program.
Web Link: http://www2.dot.ca.gov/hq/TransEnhAct/TransEnact.htm
National Recreational Trails Program
The Recreational Trails Program (RTP) provides funds to states to develop and maintain recreational trails and trail-related facilities for both non-motorized and motorized recreational trail uses. Examples of trail uses include hiking, bicycling, in-line skating, equestrian use, and other non-motorized as well as motorized uses.
Recreational Trails Program funds may be used for:
Maintenance and restoration of existing trails;
Development and rehabilitation of trailside and trailhead facilities and trail linkages;
Purchase and lease of trail construction and maintenance equipment;
Construction of new trails (with restrictions for new trails on federal lands);
Acquisition of easements or property for trails;
State administrative costs related to this program (limited to seven percent of a State's funds); and
Operation of educational programs to promote safety and environmental protection related to trails (limited to five percent of a State's funds).
Web Links: http://www.parks.ca.gov/?Page_id=24324
http://www.fhwa.dot.gov/environment/rectrails/index.htm

Summary of Funding Programs F-3 January 2012
State Funding Programs
State Highway Operations Protection Program
The State Highway Operations Protection Program (SHOPP) is a multi-year program of capital projects whose purpose is to preserve and protect the State Highway System. Funding is comprised of state and federal gas taxes. SHOPP funds capital improvements relative to maintenance, safety, and rehabilitation of state highways and bridges that do not add a new traffic lane to the system. Just over $1 billion is allocated to SHOPP annually. Funding is based on need, so there are no set distributions by county or Caltrans district. There are no matching requirements for this program. Projects include rehabilitation, landscaping, traffic management systems, rest areas, auxiliary lanes, and safety. Caltrans Projects are “applied” for by each Caltrans District. Each project must have a completed Project Study Report (PSR) to be considered for funding. Projects are developed in fall every odd numbered year.
Web Link: http://www.dot.ca.gov/hq/transprog/shopp.htm
State Transportation Improvement Program
The State Transportation Improvement Program (STIP) is a multi-year capital improvement program of transportation projects on and off the State Highway System. The STIP is funded with revenues from the state Transportation Investment Fund and other federal funding sources. STIP programming generally occurs every two years. The programming cycle begins with the release of a proposed fund estimate in July of odd-numbered years, followed by California Transportation
Commission (CTC) adoption of the fund estimate in August (odd years). The STIP program represents the lion’s share of California’s state and federal transportation dollars. The amount of funds available for the STIP is dependent on the state budget, and therefore, funding levels fluctuate from year to year. The majority of the program’s funds are earmarked for improvements determined by locally adopted priorities contained in Regional Transportation Improvement Programs (RTIP). RTIPS are submitted by regional transportation planning agencies from around the state. STIP funds can be used for a wide variety of projects, including road rehabilitation, road capacity, intersections, bicycle and pedestrian facilities, public transit, passenger rail and other projects that enhance the region’s transportation infrastructure.
Regional Transportation Planning Agencies (RTPAs), such as MTC, are allocated 75 percent of STIP funding for regional transportation projects in their Regional Improvement Program (RIP). Caltrans is allocated 25 percent of STIP funding for interregional transportation projects in the Interregional Improvement Program (IIP).
Web Link: http://www.mtc.ca.gov/funding/STIP/
Bicycle Transportation Account
The state Bicycle Transportation Account (BTA) is an annual statewide discretionary program that is available through the Caltrans Bicycle Facilities Unit for funding bicycle projects. The BTA provides state funds for city and county projects that improve safety and convenience for bicycle commuters including: New bikeways serving major transportation corridors; New bikeways removing travel barriers to potential bicycle commuters; Secure bicycle parking at employment centers, park-and-ride lots, rail and transit terminals, and ferry docks and landings; Bicycle-carrying facilities on public transit vehicles;
Installation of traffic control devices to improve the safety and efficiency of bicycle travel; Elimination of

Summary of Funding Programs F-4 January 2012
hazardous conditions on existing bikeways; Planning; Improvement and maintenance of bikeways; Project planning; Preliminary engineering; Final design; Right of way acquisition; Construction engineering; and Construction and/or rehabilitation among other items. To be eligible for Bicycle Transportation Account (BTA) funds, a city or county must prepare and adopt a Bicycle Transportation Plan (BTP) that addresses items a – k in Streets and Highways Code Section 891.2. BTP adoption establishes eligibility for five consecutive BTA funding cycles. Funding is available on a statewide basis. $7.2 million was available for FY 2010/11.
Web Link: http://www.dot.ca.gov/hq/LocalPrograms/bta/btawebPage.htm
Safe Routes to School
There are currently two Safe Routes to School funding programs in California. In 1999 the State legislature enacted a State Safe Routes to School (SR2S) program through a set-aside of federal transportation funds. The program has since been re-authorized three times and will run through 2013. In the meantime, the federal government created a Safe Routes to School (SRTS) with the passage of SAFETEA-LU. Both programs are meant to improve school commute routes through construction of bicycle and pedestrian safety and traffic calming projects. The State program provides funding for projects that address school commutes for students in grades K-12, the
federal program provides funding for projects that address school commutes for students in grades K-8. Both programs require a local match. While both programs fund construction improvements, the federal program also includes a programmatic element that will fund activities related to education, enforcement, or encouragement.
Web Link: http://www.dot.ca.gov/hq/LocalPrograms/saferoutes/saferoutes.htm
Office of Traffic Safety
The California Office of Traffic Safety (OTS) has the mission to obtain and effectively administer traffic safety grant funds to reduce deaths, injuries and economic losses resulting from traffic related collisions in California. OTS distributes federal funding apportioned to California under the National Highway Safety Act and SAFETEA-LU.
Grants are used to mitigate traffic safety program deficiencies, expand ongoing activity, or develop a new program. Grant funding cannot replace existing program expenditures, nor can traffic safety funds be used for program maintenance, research, rehabilitation, or construction.
OTS grants address several traffic safety priority areas including Pedestrian and Bicycle Safety. Eligible activities include programs to increase safety awareness and skills among pedestrians and bicyclists. Concepts may encompass activities such as safety programs, education, enforcement, traffic safety and bicycle rodeos, safety helmet distribution, and court diversion programs for safety helmet violators.
Web Link: http://www.ots.ca.gov/
Environmental Enhancement and Mitigation Program
Environmental Enhancement and Mitigation Program (EEMP) funds are allocated to projects that offset environmental impacts of modified or new public transportation facilities including streets, mass transit guideways,
park-n-ride facilities, transit stations, tree planting to equalize the effects of vehicular emissions, and the acquisition or development of roadside recreational facilities, such as trails. State gasoline tax monies

Summary of Funding Programs F-5 January 2012
fund the EEMP. The EEMP program represents an opportunity to fund improvements as mitigation to highway work in the SR 12, 29, and 128 corridors, as well as other highway facilities in Napa County.
Web Link: http://resources.ca.gov/grant_programs.html
http://www2.dot.ca.gov/hq/LocalPrograms/EEM/homepage.htm
California State Coastal Conservancy
The California State Coastal Conservancy manages several programs that provide grant funds for coastal trails, access, and habitat restoration projects. The funding cycle for these programs is open and on-going throughout the year. Funds are available to local government as well as non-profits. The Conservancy may be a funding source for bicycle facilities that improve access to Napa’s rivers and creeks.
Web Link: http://www.scc.ca.gov/Programs/guide.htm
Habitat Conservation Fund
The Habitat Conservation Fund (HCF) provides $2 million dollars annually in grants for the conservation of habitat including wildlife corridors and urban trails statewide. Eligible activities include property acquisition, design, and construction. The HCF is 50% dollar for dollar matching program. California Environmental Quality Act (CEQA) compliance is required. Urban projects should demonstrate how the project would increase the public’s awareness and use of park, recreation, or wildlife areas.
Web Link: http://www.parks.ca.gov/?page_id=21361
Land and Water Conservation Fund
Administered by CA State Parks, the Land and Water Conservation Fund is offered annually to cities, counties and districts. Funds can be used to acquire or develop outdoor recreation areas and facilities. Communities can use these funds to build trails, picnic areas, and preserve natural and cultural areas.
Web Link: http://www.parks.ca.gov/?page_id=21360
Caltrans Transportation Planning Grants
Caltrans Transportation Planning Grants are intended to promote strong and healthy communities, economic growth, and protection of our environment. These planning grants (Environmental Justice: Context-Sensitive Planning, Community-Based Transportation Planning, Partnership Planning, and Transit Planning) support closer
placement of jobs and housing, efficient movement of goods, community involvement in planning, safe and convenient pedestrian and bicycle mobility and access, smart or strategic land use, and commute alternatives.
Web Link: http://www.dot.ca.gov/hq/tpp/grants.html

Summary of Funding Programs F-6 January 2012
Regional Funding Programs
Regional Transportation Improvement Program
The Regional Transportation Improvement Program (RTIP) funds are a portion of the State Transportation Improvement Program. The Metropolitan Transportation Commission, acting as the Regional Transportation Planning Agency in the nine-county Bay Area, is responsible for allocating Napa County’s share of the funding.
Web Link: http://www.mtc.ca.gov/funding/STIP/
Transportation for Livable Communities
MTC’s Transportation for Livable Communities (TLC) Program was created to support community-based transportation projects that revitalize downtown areas, commercial cores, neighborhoods and transit corridors by enhancing their amenities and ambiance and making them places where people want to live, work and visit. The TLC Program supports the region’s FOCUS Program by investing in Priority Development Areas, designated areas in which there is local commitment to developing housing, along with amenities and services, to meet the day-to-day needs of residents in a pedestrian-friendly environment served by transit. TLC provides funding for planning and capital improvement projects that provide for a range of transportation choices, support connectivity between transportation investments and land uses, and are developed through an inclusive community planning effort.
Web Link: http://www.mtc.ca.gov/planning/smart_growth/tlc_grants.htm
Regional Bicycle and Pedestrian Program
The Regional Bicycle and Pedestrian Program (RBPP) was created by the MTC in 2003 through a set-aside of federal funds to fund construction of the Regional Bicycle Network, regionally-significant pedestrian projects, and bicycle and pedestrian projects that serve schools and transit. MTC has committed $200 million in the Transportation 2030 Plan to support the regional program over a 25-year period ($8 million each year). The program is administered through County Congestion Management Agencies (CMAs; NCTPA in Napa County).
Web Link: http://www.mtc.ca.gov/planning/bicyclespedestrians/regional.htm#bikepedprog
TDA Article 3
Transportation Development Act (TDA) Article 3 funds are generated from State gasoline sales taxes and are returned to the source counties from which they originate to fund transportation projects. Article 3 funds provide a 2 percent set aside of the County TDA funds for bicycle and pedestrian projects. Eligible projects include right-of-way acquisition; planning, design and engineering; support programs; and construction of bicycle and pedestrian infrastructure, including retrofitting to meet ADA requirements, and related facilities. Each year NCTPA approves a Program of Projects for Napa County, which is submitted to MTC for approval.
Web Link: http://www.mtc.ca.gov/funding/STA-TDA/
Lifeline Transportation Program
The Lifeline Transportation Program (LTP) was established to fund projects that result in improved mobility for low-income residents of the nine San Francisco Bay Area counties. Lifeline funds may be used for either capital or operating purposes. Eligible capital projects include (but are not necessarily

Summary of Funding Programs F-7 January 2012
limited to) purchase of vehicles, provision of bus shelters, benches, lighting, sidewalk improvements or other enhancements to improve transportation access for residents of low-income communities. A local match of a minimum of 20% of the total program cost is required.
Web Link: http://www.mtc.ca.gov/planning/lifeline/
Safe Routes to Transit
Funded through Regional Measure 2, this competitive program is designed to promote bicycling and walking to transit stations by funding projects and plans that make important feeder trips easier, faster, and safer. The program is administered by the Transportation and Land Use Coalition (TALC). TALC is a Bay Area partnership of over 90 groups that develops and forwards a range of projects, programs, and campaigns supporting sustainability and equity in the land use, housing, and transportation arenas.
Web Link: http://www.transcoalition.org/c/bikeped/bikeped_saferoutes.html#application
Bay Trail
The Association of Bay Area Governments (ABAG) sponsors the San Francisco Bay Trail project. As funds become available, the Bay Trail Project administers grant programs to fund planning and construction of the Bay Trail. Grant monies are available for planning studies, trail design work, feasibility studies, and construction of new Bay Trail segments and associated amenities including bike lane striping, sidewalk construction and improvements to roadway bicycle routes. The deadline for the program is on-going until program funds are programmed. While a local match is not required, it is encouraged. Grant awards generally range from $150,000-$500,000.
Web Link: http://baytrail.abag.ca.gov/grants.html
Transportation Fund for Clean Air
The Transportation Fund for Clean Air (TFCA) is a grant program funded by a $4 surcharge on motor vehicles registered in the Bay Area. The program generates
approximately $22 million per year in revenue and consists of two parts: Program Manager Funds (60 percent of revenues), which guarantees a calculated percentage to each county, and Regional Funds (40 percent of revenues), which are allocated on the basis of regional competition. The program's goal is to implement cost-effective projects that will decrease motor vehicle emissions. The fund covers a wide range of project types, including purchase or lease of clean fuel buses, purchase of clean air vehicles, ridesharing programs to encourage carpool and transit use, bicycle facility improvements such as bike lanes, bicycle racks, and projects to enhance the availability of transit information. Applications for the Regional Funds are made directly to BAAQMD. The Program Manager Funds are administered by NCTPA.
Web Link: http://www.baaqmd.gov/Work.aspx
BAAQMD Bicycle Facility Program
The Bay Area Air Quality Management District's (Air District’s) Bicycle Facility Program (BFP) provides grant funding to reduce motor vehicle emissions through the implementation of new bikeways and bicycle parking facilities in the Bay Area. The BFP is funded through the Transportation Fund for Clean Air (TFCA) program. Proposed projects must comply with Board-adopted policies and be located within the Air District’s boundaries. Eligible project types include: Class I – Bicycle Paths; Class II –

Summary of Funding Programs F-8 January 2012
Bicycle Lanes; Class III – Bicycle Routes; Bicycle Lockers and Racks; Secure Bicycle Parking; and Bicycle Racks on Public Transportation Vehicles.
Web Link: http://www.baaqmd.gov/Divisions/Strategic-Incentives/Bicycle-Facility-Program.aspx
Local Funding Programs
Direct Local Jurisdiction Funding
Local jurisdictions can fund bicycle and pedestrian projects using a variety of sources. A city’s general funds are often earmarked for non-motorized transportation projects, especially sidewalk and ADA improvements.
Future road widening and construction projects are one means of providing bike lanes and sidewalks. To ensure that roadway construction projects provide these facilities where needed, appropriate, and feasible, it is important that an effective review process is in place so that new roads meet the standards and guidelines presented in this Plan.
Impact fees
Another potential local source of funding is developer impact fees, typically tied to trip generation rates and traffic impacts produced by a proposed project. A developer may reduce the number of trips (and hence impacts and cost) by paying for on- and off-site pedestrian and bikeway improvements, which will encourage residents to walk and bicycle rather than drive. In-lieu parking fees may be used to help construct new or improved bicycle parking. A clear connection between the impact fee and the mitigation project must be established.
Special Taxing Districts
Special taxing districts, such as redevelopment districts, can be good instruments to finance new infrastructure – including shared use trails and sidewalks – within specified areas. New facilities are funded by assessments placed on those that are directly benefited by the improvements rather than the general public. In a “tax increment financing (TIF) district, taxes are collected on property value increases above the base year assessed property value. This money can then be utilized for capital improvements within the district. TIFS are especially beneficial in downtown redevelopment districts. These districts are established by a petition from landowners to a local government. The districts can operate independently from the local government and some are established for single purposes, such as roadway construction.
Other
Local sales taxes, fees, and permits may be implemented, requiring a local election. Parking meter revenues may be used according to local ordinance. Volunteer programs may substantially reduce the cost of implementing some of the proposed pathways. Use of groups such as the California Conservation Corp which offer low-cost assistance will be effective at reducing project costs. Local schools or community groups may use the bikeway or pedestrian project as a project for the year, possibly working with a local designer or engineer. Work parties may be formed to help clear the right of way where needed. A local construction company may donate or discount services. A challenge grant program with local businesses may be a good source of local funding, where corporations “adopt” a bikeway and help construct and maintain the facility.