big bird: an autonomous ornithopter - machine … · 5 abstract the purpose of this project was to...
TRANSCRIPT

Big Bird: An AutonomousOrnithopter
Micah O’HalloranAnd
Stephen Horowitz
12/9/98

2
Table of Contents
ABSTRACT................................................................................................................... 5
EXECUTIVE SUMMARY ........................................................................................... 6
INTRODUCTION - FLAPPING FLIGHT THEORY ................................................ 7
FORCES THROUGHOUT THE FLAPPING CYCLE................................................................ 8Fig. 1 - Downstroke Forces ......................................................................................................... 8Fig.2 - Upstroke Forces............................................................................................................... 9Fig. 3 - Net Forces .....................................................................................................................10
REDIRECTING THRUST................................................................................................ 10Fig. 4 - Redirected Thrust...........................................................................................................10Fig. 5 - Wing Frame...................................................................................................................11
STABILITY IN GLIDING AND SOARING FLIGHT ............................................................. 12
INTEGRATED SYSTEM........................................................................................... 13
MOBILE PLATFORM............................................................................................... 14
THE BASE .................................................................................................................. 14Fig. 6 - The Base........................................................................................................................15
THE GEAR ASSEMBLY ................................................................................................ 15The Large Pulleys.................................................................................................. 16
Fig. 7 – Large Pulleys ................................................................................................................16
The Small Pulleys .................................................................................................. 17Fig. 8 - Small Pulleys.................................................................................................................18
The Belts ............................................................................................................... 18Fig. 9 – Early gearbox................................................................................................................19
The Axles............................................................................................................... 19The Support Structure............................................................................................ 20
Fig. 10 – Gearbox supports on base ............................................................................................20
The Motor ............................................................................................................. 21Putting it all together............................................................................................. 21
Fig. 11 - Output shaft. ................................................................................................................23
THE WING SUPPORT CAGE ......................................................................................... 24Fig. 12 – Body and wing skeleton...............................................................................................25
THE TAIL ASSEMBLY ................................................................................................. 25Fig. 13 – Old tail........................................................................................................................26Fig. 14 – New tail ......................................................................................................................26
THE NOSE .................................................................................................................. 27THE WINGS................................................................................................................ 27
Fig. 15 – Wing frame .................................................................................................................27Fig. 16 – First wings ..................................................................................................................28Fig. 17 – New wing frame ........................................................................................................29
ACTUATION.............................................................................................................. 29

3
ELECTRIC MOTOR ...................................................................................................... 29SERVOS ..................................................................................................................... 30BATTERIES................................................................................................................. 30FLAPPING LINKAGES – T-BAR .................................................................................... 31
Fig. 18 – T - bar and surgical tubing ...........................................................................................31
SURGICAL TUBING ..................................................................................................... 32
SENSORS.................................................................................................................... 32
ELECTROLYTIC TILT SENSOR...................................................................................... 33Tilt Sensor Circuitry .............................................................................................. 34
Fig. 19 – The electrolytic tilt sensor............................................................................................34Fig. 20 – Sensor Circuit..............................................................................................................35
Tilt Sensor Software driver .................................................................................... 36Tilt Sensor Experimental Layout and Results ......................................................... 37
Pitch and Roll Series 1 Data ......................................................................................................................37Fig. 21 - Roll Series1 Chart ........................................................................................................38Table 1 – Roll Series 1 Data.......................................................................................................39Fig. 22 - Roll 1 Sensitivity..........................................................................................................40Fig. 23 - Pitch Sensitivity ...........................................................................................................41
Pitch and Roll Series 2 Data ......................................................................................................................41Table 2 – Roll Series 2 Data.......................................................................................................42
Roll Series 3 Data .....................................................................................................................................42Table 3 – Roll Series 3 Data.......................................................................................................43
Roll Series 4 Data .....................................................................................................................................44Table 4 – Roll Series 4 Data.......................................................................................................44
Roll Series 5 Data .....................................................................................................................................44Table 5 – Roll Series 5 Data.......................................................................................................45
Pitch and Roll Series 6 Data ......................................................................................................................46Table 6 – Roll Series 6 Data.......................................................................................................47Table 7 – Pitch Series 6 Data......................................................................................................47
Comparison of Series 1-6 ..........................................................................................................................48Figure 24 - Roll Axis Characterization........................................................................................48Figure 25 – Roll Axis Contour....................................................................................................49Fig. 26 – Roll Axis Sensitivity....................................................................................................50Fig. 27 – Roll Axis Sensitivity Contour ......................................................................................50
Tilt Sensor Conclusions ......................................................................................... 51BATTERY MONITOR ................................................................................................... 52
Table 8 - Battery Voltage Data ...................................................................................................52Fig. 28 - Battery Characterization Curve.....................................................................................53
TAKEOVER SENSOR.................................................................................................... 54
BEHAVIORS .............................................................................................................. 54
BALANCING ............................................................................................................... 54TAKEOVER................................................................................................................. 55LANDING ................................................................................................................... 56
EXPERIMENTAL LAYOUT AND RESULTS......................................................... 56
WING SIZE ................................................................................................................. 57AMPLITUDE ............................................................................................................... 57ADDITIONAL WINGS................................................................................................... 57
CONCLUSION ........................................................................................................... 58
DOCUMENTATION .................................................................................................. 59

4
VENDORS/ SUPPLIERS............................................................................................ 60
APPENDIX.................................................................................................................. 61
A1 – PICTURES .......................................................................................................... 61A2 – COMPLETE PITCH AND ROLL DATA ................................................................... 62A3 – SOURCE CODE ................................................................................................... 63

5
Abstract
The purpose of this project was to design, build, and test an autonomousornithopter. An ornithopter is essentially a mechanical bird. The mobile platformconsists of several components: the base, flapping assembly, wings, tail, and nose. Weelected to build our ornithopter using an electric motor and membrane wings rather than agas engine and aeroelastic wings. We designed and built an electrolytic tilt sensor circuit,a voltage monitor, and an emergency takeover circuit. We implemented balancing,takeover, and landing behaviors using these sensors and assembly language programsrunning on a 68HC11 microcontroller. All software was coded in assembly language tominimize code size and avoid unnecessary complications. Experiments were conductedto optimize the tilt sensor sensitivity, the thrust produced by the wings, and to determinethe main battery discharge curve. We determined the drag of our design was too large forthe bird to fly; however, modifications and upgraded components could allow for asuccessful design in the future.

6
Executive Summary
The goal of this project was to design an autonomous ornithopter. To accomplish
this we first needed to build a radio controlled ornithopter, which we then could make
autonomous. The body was constructed of balsa wood, cyanoacrylate glue, epoxy,
Monokote covering material, and aircraft plywood. The flapping assembly was
homemade and consisted of the above materials in addition to PVC piping, steel rods,
ball bearings, and rubber bands. An electric model airplane motor was the source of
actuation, powered by a NiMH battery. The wings were made of carbon rod and rip-stop
nylon. The tail was constructed of balsa and covered with rip-stop nylon. Two servos
provided elevator and roll motions for the tail.
We implemented balancing, emergency takeover, and landing behaviors. To
provide sensory input to the behaviors, we made a pitch and roll sensing circuit, a battery
voltage monitor, and routed a takeover signal from the receiver to the microcontroller.
All behaviors were written in assembly language and run on a MC68HC11
microcontroller. We used the output compare, input capture, and A/D converter
subsystems of the controller to implement these behaviors. We tested the bird’s flying
capabilities using different flapping amplitudes and wing designs. This included a set of
tests with a secondary fixed wing to provide additional lift. We were unable to achieve
flight with our design, other than a powered descent. The drag proved to overpower the
thrust produced. Future work should focus on aeroelastic wings and a more streamlined
design.

7
Introduction - Flapping Flight Theory
Aerodynamics involving flapping wings differs in many ways from conventional
aerodynamics, however some conventional rules apply. First, the lift produced by the
vehicle must exceed the vehicle’s weight if it is to climb in altitude. Second the thrust
produced by the vehicle must exceed the drag if is to accelerate in the forward direction.
The lift produced by the wings of an ornithopter differs from that of a conventional
airplane. There are two major types of wings used for ornithopters, membrane wings and
aeroelastic wings. Membrane wings consist of flat material that is stretched between the
leading edge spar and the root chord. They are generally capable of producing decent
downstroke lift, but do not usually generate positive upstroke lift, because the camber of
the wings reverses on the upstroke. Aeroelastic wings on the other hand have a fixed
camber and therefore can generate positive lift throughout the flapping cycle. These
wings pitch and twist as a function of the force applied. This allows them to operate
much more efficiently then the membrane wings. Unfortunately, with this efficiency of
operation, comes along an increase in complexity of design. It is for this reason that we
chose to design and build membrane wings instead of aeroelastic wings, despite their
reduced efficiency. Because of our design choice, the remainder of this theory section
will focus on membrane wing aerodynamics. This theory is extracted from, The
Ornithopter Design Manual1, by Nathan Chronister, where a more detailed explanation
can be found.
8
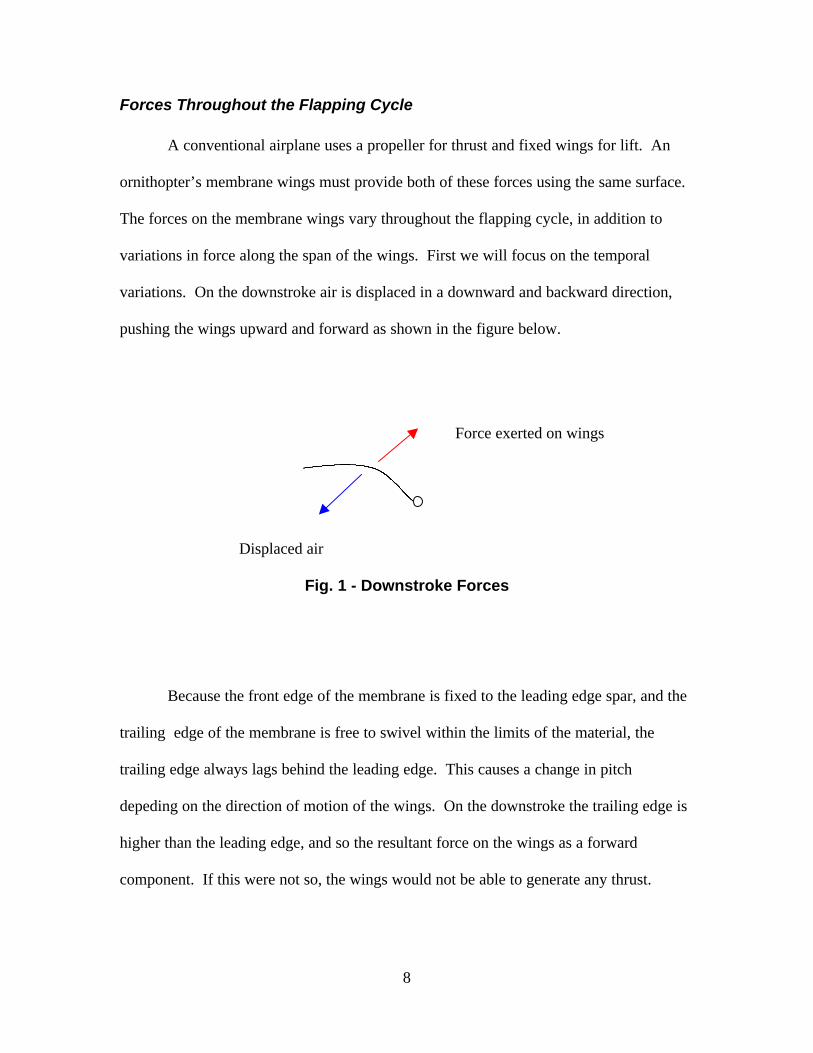
Forces Throughout the Flapping Cycle
A conventional airplane uses a propeller for thrust and fixed wings for lift. An
ornithopter’s membrane wings must provide both of these forces using the same surface.
The forces on the membrane wings vary throughout the flapping cycle, in addition to
variations in force along the span of the wings. First we will focus on the temporal
variations. On the downstroke air is displaced in a downward and backward direction,
pushing the wings upward and forward as shown in the figure below.
Fig. 1 - Downstroke Forces
Because the front edge of the membrane is fixed to the leading edge spar, and the
trailing edge of the membrane is free to swivel within the limits of the material, the
trailing edge always lags behind the leading edge. This causes a change in pitch
depeding on the direction of motion of the wings. On the downstroke the trailing edge is
higher than the leading edge, and so the resultant force on the wings as a forward
component. If this were not so, the wings would not be able to generate any thrust.
Displaced air
Force exerted on wings

9
On the upstroke, this situation is reversed. The trailing edge is lower than the
leading edge and so the resultant force on the wings is angled down and forward as is
displayed in the figure below. Additionally the camber of the wings reverses to negative.
Fig.2 - Upstroke Forces
Averaging out the upstroke and downstroke forces results in the net force shown
below. As can be seen this force contributes solely to thrust. No net lift if generated from
this configuration.
Displaced air
Force exerted on wings

10
Fig. 3 - Net Forces
Redirecting Thrust
In order to obtain net lift, the line about which the wing hinges must be angled up
relative to the direction of motion. This rotates each of the above vectors counter-
clockwise by the number of degrees between this hinge line and the angle of motion as is
show below.
Fig. 4 - Redirected Thrust
Now as can be clearly seen in the diagram above, the net force is no longer solely
in the thrust direction. There is also a lift component to it. Most ornithopters, ours
included, cannot maintain a hinge angle steep enough relative to the direction of motion
to generate enough lift to stay in the air. In fact, since a greater force is needed to lift the
Downstroke
Upstroke
Net
Downstroke
Upstroke
Net

11
ornithopter than to push it, the hinge angle would have to be greater than 45 degrees in
order to support the bird. This is obviously not the case. Instead, the additional lift
necessary is created in way similar to conventional aerodynamics, by moving air over a
cambered surface. It differs, however, in that the camber of a membrane wing changes
significantly with respect to distance from the root chord as well as changing from
upstroke to downstroke.
During the downstroke, the wing maintains a positive camber as air fills the
membrane from the bottom. This results in lift being generated over the entire length of
the wing. On the upstroke, the camber of most of the wing reverses since the air is
filling the membrane from the top. In the figure below, the main spars of the wing are
shown. They form the skeleton of the wing to which the membrane is attached.
Fig. 5 - Wing Frame
On the upstroke, the air presses against the large portion of the membrane to the
right of the triangular piece. Due to the large surface area of this section, the force is
sufficient enough to reverse the camber of this portion of the wing. It also pulls the
material in the triangular section taught enough that so that the camber is not reversed in
this inner section. This is why lift varies so much over the span of the wing. The inner
portion of the wing is still capable of generating positive lift on the upstroke, due to it

12
maintaining positive camber. Meanwhile the tip of the wing generates negative lift on
the upstroke. At some point between the root chord and the wingtip, an area exists where
no lift is generated. It is the inner portion of the wing that generates the extra lift that is
needed to support the weight of the ornithopter.
To optimize the amount of lift generated in this manner, the inner portion of the
wing, inside the triangle, would need to be expanded. Unfortunately, this cannot continue
indefinitely, as an area of negative lift is needed that can keep the material taught over the
triangular section. Additionally, the vertical speed of the material increases with distance
from the body. Therefore the force needed to keep this inner section taught increases as
well.
Stability in Gliding and Soaring Flight
Most birds alive today have wings that are set high on their bodies. Since the
weight of the bird is below the wings, and the wings are holding the bird in the air, the
bird acts like a pendulum. The stable point for a pendulum is at its bottommost
extension. When a bird rolls to one side or another, the weight of the body acts to return
the bird to its upright position, and hence provide stability. Additionally, when viewed
from the front or back, many birds’ wings form a v-shape. This v-shape, or positive
dihedral angle, increases the stability of the bird. This occurs for two reasons. According
to Georg Ruppell, in his book Bird Flight2, when a bird has a positive dihedral angle, and
rolls to one side, the lift on the lower wing has a larger vertical component, than does the
upper wing. Although both wings produce the same amount of lift, this lift is

13
perpendicular to the wings. As one wing is tilted more than the other is, this wings lift is
mostly in the horizontal direction, while the other wing’s lift is mostly vertical. This
additional force acts to return the bird to its stable position. By increasing the dihedral
angle, the lift on the upper wing is reduced in the vertical direction, thereby increasing
the stabilizing force.
The second reason for the increase in stability of a dihedral angle, is the raising of
the average wing height. When a bird has a positive dihedral angle, the average wing
chord is located higher up than before. This increases the length of the pendulum, and
therefore increases the stabilizing force. The above reasons are why most birds maintain
a high wing with a positive dihedral angle.
Integrated System
Big Bird’s mechanical systems are composed of two separate assemblies: the
flapping assembly and the tail assembly. The flapping assembly consists of an electric
motor, gearbox, “T” mechanism (described in Actuation section), and the wings
themselves. There are also support structures for these components that are discussed in
the Mobile Platform section of this paper. The purpose of the flapping assembly is to
provide the lift and thrust that the bird needs in order to fly. The tail assembly consists of
two Futaba S148 servos, and the tail itself. The tail is used to steer the bird.
Big Bird is controlled using a Motorola 68HC11 chip on an MSCC11 board from
Mekatronix. An electrolytic tilt sensor from the Fredericks Company was used to allow

14
our bird to determine its pitch and roll with respect to the “level” position. Some external
circuitry was custom made around this sensor. Circuits were also built to allow for
remote control overriding of the onboard computer, and for a sensor that monitors the
voltage of the batteries that are used to power the wings. When released, Big Bird tries to
balance itself using readings from its tilt sensor, allows a remote user to override all
microprocessor commands using a radio transmitter, and signals when its batteries are
drained to the point that it will soon no longer be able to flap.
Mobile Platform
The mobile platform was the main focus of our attention in this project. It
consists of several important subsections: the base, the gear assembly, the wing support
cage, the tail, the nose, and the wings. We will discuss each of these sections in detail.
The Base
The base of the robot consists of a 3” wide by 16” long by 3/8” thick piece of
balsa wood glued lengthwise with a 2” wide by 14” long by 3/8” thick piece of balsa (see
Fig. 6). We also provided extra support at the joint by gluing two triangular sections of
balsa (one on each side) at the joint. The base of each triangle is ½” wide and they are
about 3” tall. They were the same thickness (3/8”) as the rest of the base. These
provided a more tapered transition from the 3” wide balsa to the 2” wide balsa. All of
these joints were glued with model airplane CA glue. This is a special type of superglue

15
that can be purchased at a model hobby shop (we purchased all of our wood and glue at
“The Hobby Shop” on the corner of University Ave. and 34th Street).
In order to strengthen the joint, we cut a piece of 1/32” thick model airplane
plywood to fit over it. We allowed the piece of plywood to extend 3” along the length of
each of the two pieces of balsa. We then glued down the plywood with CA glue. This
provided a lot of extra strength, and should be done at any joint where balsa needs high
strength.
Fig. 6 - The Base
The Gear Assembly
This section of the ornithopter was the one we spent the bulk of our time building.
Originally, we wanted to purchase a professional gearbox from a machining company.
However, the only ones that we could find cost over $200 dollars, and we could not
convince any of the companies to donate one to us. The main lesson we learned in
building this assembly was to purchase a professional gearbox if possible! This
assembly took a long time to design and build, and we continuously had to improve it as
the semester progressed. However, our final design is very sturdy. We will discuss each
of its components separately.
Edges of aircraft plywood

16
The Large Pulleys
After many different attempts at creating pulley wheels, we decided to try to make
some from PVC tubing (we bought this at Lowe’s). We used 2 3/8” outside diameter
PVC to make our pulleys because we wanted to have a relatively large gear reduction
(1:5) for each stage in our gearbox. For each pulley, we cut a 9/16” wide ring off of the
PVC pipe and squared off the ends of the ring with sandpaper. Next, we cut two 3”
diameter circles out of plywood using the T-tech machine. Finally we cut a 9/16” long
piece of ½” diameter wooden dowel to use as a strengthener along the central axis of the
pulley. The pulleys were made by first gluing a PVC ring onto one of the plywood
circles using CA glue. This step requires some care because the ring must be glued on as
centered as possible. Next, we glued a piece of dowel to the plywood circle. The axis of
the dowel extends along the axis of the PVC ring, and needs to line up as close as
possible to create a well-balanced pulley. Finally, glue the other plywood circle to the
other side of the ring, and to the dowel. After this has dried, drill the appropriate size
axle hole through the center using a drill press. See figure 7 below for a graphical view
of the parts.
Fig. 7 – Large Pulleys
Plywood circle
PVC
Dowel

17
The Small Pulleys
We could not use the same idea for our small pulleys as we did for the large ones
because we needed them to be too small. We needed their diameter to be no larger than
about ½” an inch in order to create our 1:5 gear reduction ratio. At first, we tried to use
pieces of dowel and drill holes through the center of them to make the pulley, but this
proved to be much harder than it sounds. It was impossible for us to drill through the
center of the dowel and so the dowel wobbled at least ¼” up and down.
Our next idea was to look at a craft store (Joanne’s Fabrics) and see if we could
find any thread spools that we could use as pulleys. We found none, but did find a bag of
½” diameter wooden cylinders with holes pre-drilled through their central axes. They
were the perfect size, but eventually we abandoned them because they tended to break
under the high stresses in our assembly. They would work wonderfully for a lower
torque assembly that may be needed in many other projects.
Our final design came by a bit of luck. We found a small aluminum rod, 3/8” in
diameter with a hole already drilled through the central axis. We needed to only widen
the hole slightly, slip surgical tubing onto the rod to widen the diameter of the rod and
provide better grip, and cap the two ends of the rod with two 1 ½” diameter washers to
make our pulleys. The length of rod used was 9/16”. See figure 8 for a graphical view of
the parts.

18
Fig. 8 - Small Pulleys
The Belts
When we decided to use pulleys for our project, we needed to obtain pulley belts
from somewhere. Steve remembered seeing replacement vacuum cleaner belts at Wal-
Mart. We went there and found that they had several different sized belts for different
types of vacuum cleaners. We bought two belts made for a Hoover vacuum cleaner
because they seemed to be the closest to the length we needed. They are ½” thick (which
is why we made the pulleys 9/16” wide) and about 12” in circumference. They worked
well for a long time, and were strong enough to handle the loads of our bird. However,
as our project progressed, we ran into a few problems with them. First, as our load
reached its final point (with the wing material on), the belts began to slip on the small
pulleys. In order to stop this, we would have to install the belts tighter, but this meant
increasing the diameter of the pulleys (our axle placement is fixed). A second problem
we were having is that the belts would sometimes catch on the edges of the larger pulley
wheels and begin to “ride” onto the edges of the pulleys. This problem was enough to
usually freeze-up the motor, and had to be solved.
We tried to solve these problems by gluing strips of sandpaper around the inside
lip of the larger pulleys to increase their diameter, and thus tighten the belts. After
Washers
Hole (for axle)Aluminum Tube
Surgical Tubing

19
spending a lot of time on this, we realized it would not work. No matter how tight we got
the belts, they still slipped, and still caught the edges of the larger pulleys. After many
weeks of trying other solutions, we decided to try replacing the belts with No. 64 rubber
bands. They worked great! They still caught the edges as the larger belts did, but we
found that if we used several, even if one hit the edge, the others would keep the gears
going at the same speed until the rubber band worked itself away from the edge of the
pulley. You can see the vacuum cleaner belts are used early on in figure 9.
Fig. 9 – Early gearbox
The Axles
Originally, all of our axles were 3/16” diameter wooden dowels. The first time
we loaded the gear assembly with covered wings, these axles snapped apart. We ended
up using two different axle materials after this. On the first set of gears, we used a piece
of 3/16” diameter by 6” long carbon rod that was leftover from building the wings (from
Gone With the Wind Kites). However, in order to provide extra strength to the final
output shaft, we used a 3/16” diameter by 3 ½” long solid steel rod for this axle.

20
The Support Structure
In order to hold all of the gears and axles in the correct spots, we needed to build
a support structure. This structure consists of three identical balsa/aircraft plywood
assemblies. Each piece of balsa measures 3” wide by 6½” tall by 3/8” thick. Then we
covered both faces of each balsa piece with a piece of 1/32” thick aircraft plywood using
CA glue. These faces need strength because they will hold the ball bearings that will
hold the axles. Each of these support pieces was attached to the base (discussed earlier)
2 ¾” apart from each other using two wood screws. The center support is about 10” from
the front edge of the base, but this placement is not critical. To strengthen this
attachment, we glued ½” wide strips of aircraft plywood across the 3” wide section of the
base on the top and bottom at each point where a support was going to be placed. Then,
we drilled holes through the base, and screwed into the support structures. Next, we
backed the screws out and filled the screw holes with thin CA glue and let the glue dry.
This strengthens the wood around the holes after it is dry so that the screws will give a
stronger hold. After the glue dried, we screwed the supports back on, and then CA glued
around the base of the middle and motor supports. We did not glue around the base of
the third support (nearest the nose) so that we could remove it to replace belts, and make
other changes. See figure 10 for a picture of the supports on the base.
Fig. 10 – Gearbox supports on base

21
The Motor
Originally, we planned on using a .049 cubic inch model airplane gas motor
(bought from Norvel via the Internet). After breaking in our motor, we thought that it
would be best to use an electric motor instead. The gas motor was very loud and would
have to be run outside. This would have made it time consuming to test parts of the gear
system as we put it together. Also, the gas motor was hard to start, and therefore was not
as dependable as an electric motor would be.
Our first electric motor was a Speed 400 model from the Great Planes Company.
We also bought a 1:2.7 gearbox as an initial gear reduction for the motor. The motor
turned out to not be strong enough to run the wings at more than 1 flap per second when
they were covered.
Our second motor was a Speed 500 electric motor from the same company. It is
capable of outputting over 300W if we need it to. We bought a 1:2.6 gearbox for this
motor. This motor is much more powerful, and can flap our wings at over two flaps per
second.
Putting it all together
The most important step in making the gearbox is to carefully put the parts
together. The first step we had to accomplish was to mount the motor on the back
support structure. The first electric (Speed 400) was easy to mount because it had a
mounting flange on the front face of the gearbox. We had to only drill a hole large
enough for the gearbox axle to fit through, and then drill holes for mounting the motor.
The second electric (Speed 500) was more difficult to mount because there was no
mounting flange on the gearbox. In short, we had to widen the hole in the support to

22
accommodate the axle of the new gearbox, and we had to glue pieces of dowel to the
back of the support as standoffs. Then, we drilled through these standoffs and screwed
from the front of the support, through the standoffs, through the gearbox, and into the
front face of the motor to attach the motor (the motor can be seen attached in figure 9).
Next, we placed one of the small pulleys on the axle of the gearbox and bolted it
on with the supplied nut. We used Loctite (a gritty liquid which we bought from Lowe’s)
to keep the nut from vibrating loose.
The next step was to determine where to drill the holes in the supports for the ball
bearings. We determined this by placing one of the vacuum cleaner belts on the motor
pulley, and stretching it around one of the big pulleys. Then, while stretching the belt
taut, we eyeballed the location for the ball bearings on the wooden supports, and drilled
the ½” diameter holes to accommodate them.
Then we glued the ball bearings into their holes, and placed the remaining pulleys
onto the axles. The placement of large and small pulleys can be seen in figure 9. After
all of the pulleys were in place and the belts were lined up, we used epoxy to attach the
pulleys permanently to the axles.
The final step in building the gear assembly was to glue two leftover plywood
circles from the pulleys to each other, and attach these to the output shaft of the gear
assembly. This particular connection needs extra strength in order to handle the strong
loads at the output shaft. We tried for over a month to glue the wheel on. It would work,
but eventually fail after a few minutes of flapping. Finally, we decided to make a
stronger attachment by drilling a perpendicular hole into the output shaft and then
screwing a screw into the side of the output shaft.

23
The method we used to drill the hole into the shaft is worth mentioning. It is very
hard to drill into cylindrical shafts. We devised a very effective method for doing this.
First, drill a hole the same diameter as the shaft into the side of a piece of scrap
hardwood. Then, drill a smaller hole perpendicular to the first from the top face of the
scrap wood. This hole should intersect the first hole drilled from the side. Then insert
the cylindrical rod into the first hole to the depth you wish the perpendicular hole to be
drilled through the rod at. Finally, use the small perpendicular hole as a guide to drill
into the shaft. This method produced very nice, centered holes without much trouble.
After the hole was drilled, we gouged a recess into the face of the pulley for the
screw to sink into. Then we slipped the pulley onto the shaft, screwed the screw into the
shaft, and slid the pulley back so the screw fit into the recess in the face of the pulley.
Then we CA glued the pulley to the axle and the screw into the slot. See figure 11 for a
picture of this.
Side View Front View
Fig. 11 - Output shaft.
Axle
Hole in axle withscrew screwed in
Pulley
Axle
Screw(recessed)

24
This method was also eventually used on the final large pulley in the gear
reduction stage because of the large stress put on this pulley.
The Wing Support Cage
This structure holds the wings at the proper height in relation to the output shaft
of the gear assembly. No specific instructions can be given on where to place the
flapping axis of the wings. The placement must consider a balance of how much force
the engine must produce to flap the wings, where the mid-level of the wings’ flap should
be located, and how wide the ornithopter will be. A detailed discussion can be found in
the references1.
After balancing our options, we designed the cage so that the wings’ flapping axes
were about 5” above the central axis of the output shaft, and about 6” to the side. The
cage is made of ½” by ¼” strips of balsa. Ball bearings are all placed at each of the four
places where the wings’ flapping axes will be supported. These spots are also reinforced
with aircraft plywood strips. All gluing was done with epoxy to give extra strength to
this cage. A picture of the cage mounted on the base around the gear assembly can be
seen in figure 12. The top edges each measure 11 ¼” across, the bottom edges measure
2” across each , and the angled supports are 9 ¼” long each. The front-to-back supports
are 13 ½” long to accommodate the front-to-back length of the wings.

25
Fig. 12 – Body and wing skeleton
The Tail Assembly
The balsa tail went through two different designs. The first idea was to make the
tail an isosceles right triangle with a 1’ wide back edge. Hinges attached the two back
corners to the rest of the tail (see fig. 13). These back flaps could be alternately pulled up
perpendicular to the tail by a Cirrus sub-micro servo using fishing line. There were also
rubber bands on the underside of the tail to return the flaps to their original positions after
the servo ceased to pull them up. The final component of this tail was a second Cirrus
sub-micro servo that was used to lift the tail as a unit up and down. This allowed the tail
to steer the bird up and down. The tail was covered with rip-stop nylon (from JoAnn’s
fabrics).
26
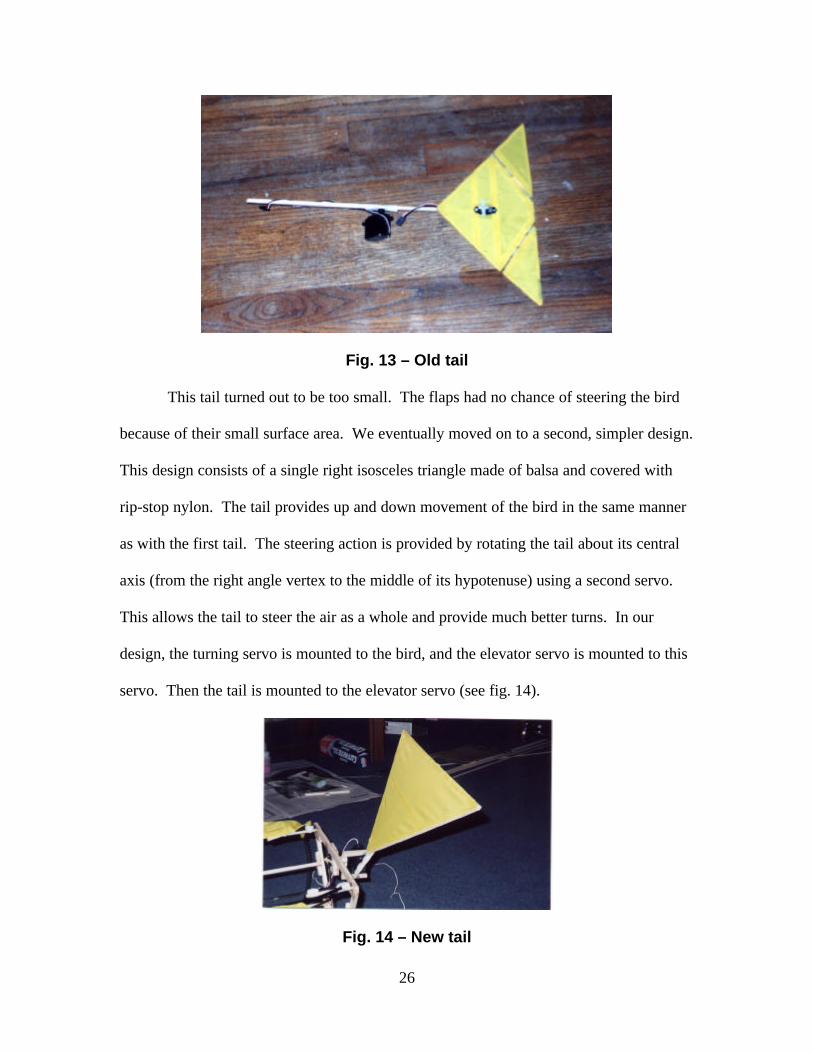
Fig. 13 – Old tail
This tail turned out to be too small. The flaps had no chance of steering the bird
because of their small surface area. We eventually moved on to a second, simpler design.
This design consists of a single right isosceles triangle made of balsa and covered with
rip-stop nylon. The tail provides up and down movement of the bird in the same manner
as with the first tail. The steering action is provided by rotating the tail about its central
axis (from the right angle vertex to the middle of its hypotenuse) using a second servo.
This allows the tail to steer the air as a whole and provide much better turns. In our
design, the turning servo is mounted to the bird, and the elevator servo is mounted to this
servo. Then the tail is mounted to the elevator servo (see fig. 14).
Fig. 14 – New tail

27
The Nose
The nose was the easiest part of the bird to build. We made it using CA glue and
Monokote sheeting (we purchase Monokote from the hobby store). The nose was made
in a freeform manner, with no special attention given to its shape and angles. After the
balsa frame was completed, we covered it with Monokote using a model aircraft iron.
The nose can be seen in pictures in the appendix.
The Wings
The wings went through several different phases through the course of this
project. The basic underlying structure remained the same throughout, though. The wing
frames were constructed using .198” diameter hollow carbon rods. The front spars of the
wings are 30” long, the inside spars are 13” long, and the triangular spars are 15” long.
The inside spar was glued perpendicular to the front spar 6” from one end of the front
spar. The 15” long triangular piece was glued from the tip of this inside spar to the front
spar (see fig. 15).
Fig. 15 – Wing frame
Front spar
TriangularInside

28
The technique by which these pieces were glued together is important. It is not
sufficient to just sand the tips of the carbon rods so that they fit together at the proper
angles and then glue. This connection is too weak and cannot handle the high stresses of
flapping. We decided to lash (surround with windings of string) the joints with 100%
cotton string, and then soak the string in superglue. This structure dried rock solid and
created strong joints.
All of the wing coverings were sewn out of rip-stop nylon. The first set of wings
was in the shape of a right triangle (see fig. 16). Eyelets were sewn at each vertex of the
triangle so that bungee cord could be attached at each corner. The bungee was used to
stretch the wing covering over the wing frames. The edges of the wings were attached to
the frames using Velcro. After testing them, we realized these wings were too small.
Fig. 16 – First wings
In order to increase the surface area of our wings, we needed a way to make them
wider at the wingtips. We accomplished this by CA gluing 1/16” thick pieces of solid
carbon rod inside the tips of the first wing frame. They extended 15” from the tip of the
first frame. These rods are very flexible, and we were able to bend them down and
perpendicular to the front spar (see fig. 17).

29
Additional carbon rod
Flexible
Fig. 17 – New wing frame
The addition of this rod allowed us to create a rip-stop nylon covering that has
over twice the area of the first set of wings. As with the first set of wings, we sewed
eyelets at the corners of the wings, and stretched the wings over the frame with bungee.
We also sewed a small pocket along the front edge of the wing stretching from tip to the
point where the triangular spar attaches to the front spar. We slipped this pocket over the
carbon rods to attach the wings to the frame. Finally, we sewed a few buttons to the
material in other spots to wrap around the spars of the wing frame and attach the material
there.
Actuation
Electric Motor
In order to provide enough force to flap the wings at a speed over 2 flaps per
second, we bought and installed a Graupner Speed 500 Race electric motor. It has an
operating voltage range from 3.6 V to 8.4 V without a gearbox, and 6 V to 12 V with a
gearbox. The no-load speed is 21,200 RPM. The idle current drain is 2 A, while the stall
current drain is 96 A. The current at which the motor is operating at max efficiency is 14

30
A. The max efficiency without a gearbox is 76 %. The total weight of the motor is 164
g.
Servos
The tail assembly needs to be able to lift up and down and roll left and right. In
order to accommodate these two directions of motion, we used two Futaba Standard
Servos. These servos provide approximately 42 oz-in of torque, which we found was
strong enough for our application. Initially, we bought 3 Cirrus sub-micro servos. These
servos are very small and light, and provide 21 oz-in of torque. When we started out this
project, we initially had in mind a smaller bird, and thought these servos would be strong
enough for our needs. Unfortunately, as the dimensions of the bird grew, these little
servos were no longer strong enough to lift the tail effectively.
We mounted one of the large servos on the trailing edge of the flapping cage.
This servo provided roll movements for the tail. To this servos was attached the tail spar.
On the tail spar, closer to the tail, the second servo was mounted. This servo provides
elevator motion. By using a combination of elevator and roll motions on the tail, we can
achieve the same effect as ailerons.
Batteries
To provide the high current needed for the electric motor, we used a 6 cell, 7.2V, 1200
mAh, NiMH battery. We obtained the 6-oz. battery pack from Hobby Lobby
International, Inc. We chose NiMH over NiCd because it provides almost twice the
running time for the same weight. It also capable of putting the high currents needed.

31
The servo battery we used was Futaba 4.8 V NiCd standard servo pack. They were
capable of outlasting the motor batteries because the current drain on them was much
lower.
The microcontroller battery is a rechargeable NiMH 9V battery from Radio
Shack. It conforms to the standard 9V-battery size.
Flapping Linkages – T-Bar
To the surface of the output wheel we mounted a small wooden axle. The other
end of this axle goes into a ball bearing on a rectangular piece of wood. This rectangular
piece forms the base of the T-Bar. The top of the T-Bar and a vertical extension piece is
made of carbon graphite rod, the same material as the wing spars. We lashed the
horizontal top to the extension piece, which was then glued firmly into the rectangular
base. As the output wheel goes around, the T-Bar is forced up and down. Once the top
of the bar is attached to the wings, it is limited to an almost vertical motion, imparting
this motion to the leading edge wing spars.
Fig. 18 – T - bar and surgical tubing

32
Surgical Tubing
Connecting the T-bar to the leading edge wing spars are two pieces of surgical
tubing. The surgical tubing was obtained from a slingshot replacement kit (Model 3330)
made by Marksman. The surgical tubing serves as a universal joint, allowing for rotating
in several directions. This joint proves more useful than an elbow joint because it allows
for slight misalignments between the T-bar and the leading edge spars. Additionally, the
elastic properties of the surgical tubing prove useful. On ornithopter files better when the
downstroke is faster and more powerful than the upstroke. When the T-bar is going
down and the wings are going up, the surgical tubing is stretched because the leading
edge spars cannot go down as far as the T-bar. The stretching of the tubing slows down
the upstroke and stores some energy in the elasticity of the surgical tubing. When the T-
bar comes back up, the wings are going down, and the tubing releases the energy it has
stored. This speeds up the downstroke, contributing to a more powerful downstroke than
upstroke.
Sensors
There are three main types of sensors on Big Bird, an electrolytic tilt sensor, a
battery monitor, and a takeover sensor. The tilt sensor monitors the pitch and roll of the
ornithopter so that we can implement a behavior to stay balanced. The takeover sensor
monitors the pulse width of channel four of the radio control receiver unit. It watches to
see when we push the channel four transmitter stick all the way to the right. This is our
signal to the bird that we wish to take over control from the microprocessor. When the
stick is moved all the way to the left, control is given back to the microprocessor. The

33
takeover sensor is responsible for distributing this control. The final sensor on Big Bird is
the battery monitor. The battery monitor watches the voltage of the battery. When the
battery voltage drops to 6 V, the battery monitor sets a flag in the software that we use to
implement a landing behavior.
Electrolytic Tilt Sensor
In order for Big Bird to be able to balance while in flight, he needs to have a
sensor to measure his pitch and roll relative to the plane of the earth. The Fredericks
Company (2400 Philmont Ave, Huntington Valley, PA. 19006-0067) donated a dual-axis
electrolytic tilt sensor to us (Model # 0717-4405-99 Rev. C). The factory publishes a test
circuit that can be used in conjunction with the dual-axis sensor, but we elected to design
our own circuit in order to keep the parts needed to a minimum. The suggested test
circuit can be found in the Fredericks’ catalog entitled “Electrolytic Tilt Sensors”, but we
will not discuss it further here since we did not use it.
The electrolytic bulb measures tilt by acting as a series of variable capacitors.
The sensor consists of a glass bulb that is partially filled with a capacitive fluid, and has
five internal vertical metal rods mounted in a ‘+’ configuration (see fig. 19). As the
sensor tilts along one axis, the amount of fluid between one outside pole and the center
pole becomes greater, and the amount of fluid between the other outside pole and the
center pole becomes less. Thus the capacitance increases between the first set of poles,
and decreases between the second set of poles. If we apply an AC signal on the two
outside poles of and axis, then the AC voltage measured at the center pole varies
depending on the tilt of the sensor. This technique can be used to determine the tilt on
both axes.

34
Tilt Sensor Circuitry
We designed a custom circuit to power and interpret the results of the tilt sensor.
The circuit diagram can be seen in figure 20. There are five major blocks that make up
Fig. 19 – The electrolytic tilt sensor
the circuit. The first is a square-wave oscillator. It creates the 1250Hz AC signal used to
power the electrolytic bulb. The frequency of 1250Hz was chosen because it gives an
impedance of around 130Ω (this will affect our sensitivity), and allows for easy filtering
of the output signal into a DC voltage (requires a small filtering capacitor).
The second block is the axis selection block. It is a multiplexer that allows the
microprocessor to select from which axis it is going to take its measurements. One of the
major simplifications that we made in our circuit is that both axes of the tilt sensor share
the amplifier and AC/DC conversion circuits. This allows us to have less hardware on
the bird, but requires us to switch between axes as we take measurements.
The third block is the electrolytic sensor. It has “leg” resistances on both sides of
both axes to limit the current that flows through the bulb. According to the part
specifications, this current should not exceed 15mA. These “leg” resistances were one of

35
the variables we tested in our experiments to see how they affected the operation of the
circuit.
Fig. 20 – Sensor Circuit
The fourth block is a differential op-amp amplifier with a gain of 10. It takes the
AC output wave from the center pin of the electrolytic bulb and amplifies the difference
between this wave and a reference DC voltage by a factor of 10. The reference voltage
can be altered using the 10kΩ potentiometer in this functional block. Using this
potentiometer, we can adjust the center of our amplified range.

36
The final block is an integrating filter. The filter takes the AC square wave output of the
differential amplifier and integrates it into a DC signal. This DC signal is what is read by
the microprocessor to determine what its pitch and roll are.
Tilt Sensor Software driver
The driver for this sensor was fairly easy to implement. Using one output
compare module (OC5), we created periodic 21ms readings of the A/D port. We used
21ms updates because the processor is also running servo pulse width modulation (PWM)
routines on three other output compares. By giving the sensor update routine the same
period as the servo routines, we can begin the sensor routine during a common dead
portion of all three of the servo routines (during the long “low” time of the PWM pulse),
and guarantee that this will always be where it runs.
One A/D pin is connected to the DC output from the sensor board and reads the
tilt level of the currently selected axis. Two queues, one for each axis, are stored in
memory. They keep track of the past sensor readings for each axis. The depth of each
queue is specified at the top of the program listing in the macro QUEUE_LENGTH.
After a queue is filled, it is averaged, and then overwritten with new data as it arrives.
The most recently computed average value is kept in a global variable (ROLL_AVG or
PITCH_AVG). These values can be used by a behavior that needs the current pitch and
roll.
The only other function of the driver is to multiplex the axis. This is done by
toggling PORTB, pin 1 between one and zero. The algorithm is simple:
1) Toggle PORTB, pin 1 (done at the end of the interrupt service routine (ISR)).
2) Exit the ISR.

37
3) At the start of the next interrupt, perform an A/D on the sensor pin.
4) Do the bookkeeping routines to update queues.
5) Go to step 1).
All of the code that has been written so far for this project can be found in the appendix.
Tilt Sensor Experimental Layout and Results
To characterize our tilt sensor, we mounted the sensor board, on a small sheet of
plywood, aligning the axes with the sides of the wood. Placing the wood near the edge of
a level desk, we used a protractor to measure the angles at which each voltage
measurement was recorded. This setup is far from perfect, but our accuracy in measuring
with the protractor is believed to be within a degree. The voltage measurements were
taken using a Radio Shack Pocket Digital Multimeter (Model #22-179A), set to DC
measurement. We recorded all values within a series, either pitch or roll, at one sitting.
Pitch and Roll Series 1 Data
This experiment was the first using the actual circuitry that will be used on Big
Bird. As such, we did not have a clear idea what resistance values would be optimal for
our particular sensor. The Fredericks Company provided us with expected values of
resistors to obtain the desired characteristics; however, we were not using the exact
sensor that they specified. In addition, we designed our sensor circuitry quite different
from their design. We therefore had to make an educated guess as what values would be

38
best for our circuit. This experiment is conducted using the resistance values determined
by our educated guessing. We estimated that our sensor had an impedance around 100
ohms and we wanted to use as small a resistance as possible while still keeping the
current under the specified maximum of 15 mA. We therefore chose 470 ohms as a good
starting value for the sensor leg resistors.
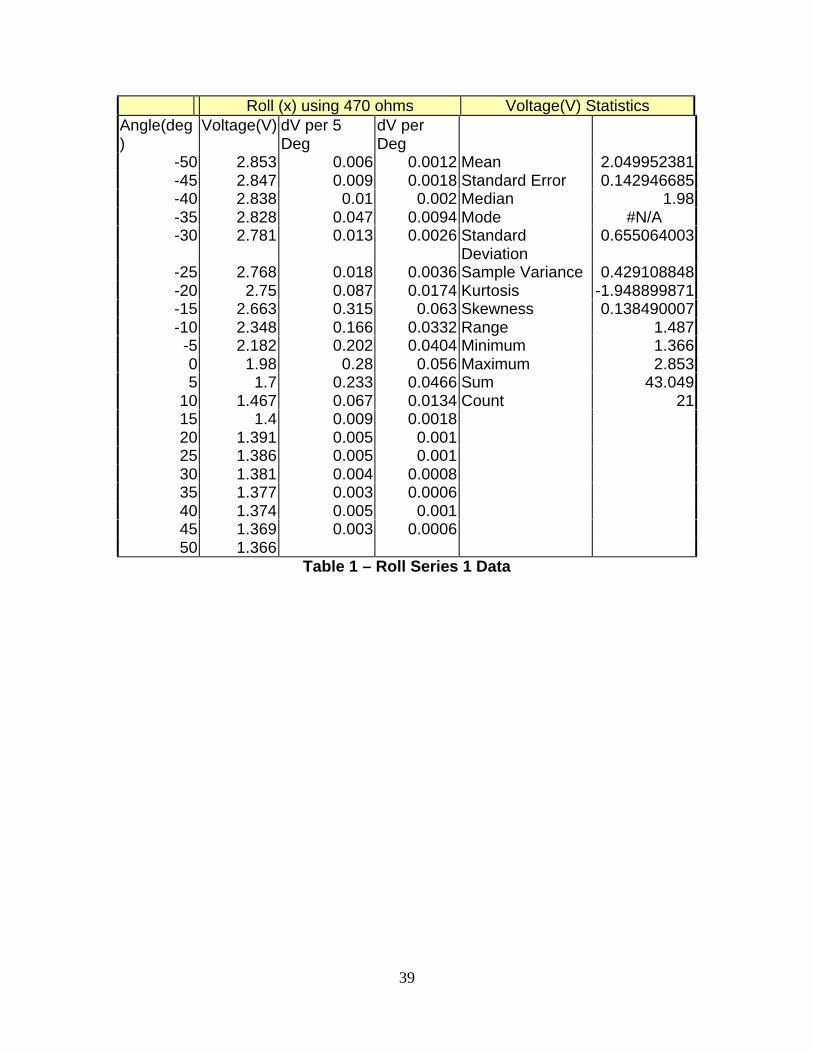
The data taken in Series 1 of our experiments is shown below. As can be seen
from the Voltage/Degree chart, the slope has nonzero value only between –20 and 20
Degrees. This defines the useful range for the sensor. Outside this range, the curves are
approximately horizontal, and we therefore would not be able to detect any significant
difference in voltage between angles.
Fig. 21 - Roll Series1 Chart
Roll using 470 ohms in legs
0
0.5
1
1.5
2
2.5
3
-60 -40 -20 0 20 40 60
Angle
Vo
ltag
e
39
Roll (x) using 470 ohms Voltage(V) StatisticsAngle(deg)
Voltage(V) dV per 5Deg
dV perDeg
-50 2.853 0.006 0.0012 Mean 2.049952381-45 2.847 0.009 0.0018 Standard Error 0.142946685-40 2.838 0.01 0.002 Median 1.98-35 2.828 0.047 0.0094 Mode #N/A-30 2.781 0.013 0.0026 Standard
Deviation0.655064003
-25 2.768 0.018 0.0036 Sample Variance 0.429108848-20 2.75 0.087 0.0174 Kurtosis -1.948899871-15 2.663 0.315 0.063 Skewness 0.138490007-10 2.348 0.166 0.0332 Range 1.487
-5 2.182 0.202 0.0404 Minimum 1.3660 1.98 0.28 0.056 Maximum 2.8535 1.7 0.233 0.0466 Sum 43.049
10 1.467 0.067 0.0134 Count 2115 1.4 0.009 0.001820 1.391 0.005 0.00125 1.386 0.005 0.00130 1.381 0.004 0.000835 1.377 0.003 0.000640 1.374 0.005 0.00145 1.369 0.003 0.000650 1.366
Table 1 – Roll Series 1 Data

40
This can also be expressed in terms of sensitivity. The following chart displays
the sensitivity of the sensor throughout the tested range. This was computed by taking
the instantaneous slope between each of our data points. The chart is in terms of the delta
voltage per degree. From this chart, it is easy to see that the useful range of the circuit is
only between –20 and 20 degrees, where the sensitivity is greater than resolution of the
A/D on the 68HC11.
Fig. 22 - Roll 1 Sensitivity
0
0.01
0.02
0.03
0.04
0.05
0.06
0.07
-60 -40 -20 0 20 40 60
Angle (Deg)
dv
(V)
Roll1

41
Fig. 23 - Pitch Sensitivity
Pitch and Roll Series 2 Data
This series of data was taken using 220 ohms resistors in the sensor legs in place
of the 470hms resistors. This was done in hopes of increasing the sensitivity of the
sensor. As can be seen from the charts below there is no noticeable increase in sensitivity
or in useful range.
-0.01
0
0.01
0.02
0.03
0.04
0.05
0.06
0.07
0.08
-60 -40 -20 0 20 40 60
Angle(Deg)
dv(
V)
Pitch1

42
Roll(x) using 220 ohms in legs
Angle(deg)
Voltage(V)
dV per 5 Deg dV perDeg
Voltage(V)
-50 2.879 0.004 0.0008-45 2.875 0.007 0.0014 Mean 2.153666667-40 2.868 0.008 0.0016 Standard Error 0.1467824-35 2.86 0.008 0.0016 Median 2.19-30 2.852 0.012 0.0024 Mode #N/A-25 2.84 0.015 0.003 Standard
Deviation0.67264146
-20 2.825 0.017 0.0034 SampleVariance
0.452446533
-15 2.808 0.085 0.017 Kurtosis -1.959616425-10 2.723 0.265 0.053 Skewness -0.111257585
-5 2.458 0.268 0.0536 Range 1.5060 2.19 0.099 0.0198 Minimum 1.3735 2.091 0.296 0.0592 Maximum 2.879
10 1.795 0.339 0.0678 Sum 45.22715 1.456 0.049 0.0098 Count 2120 1.407 0.011 0.002225 1.396 0.006 0.001230 1.39 0.005 0.00135 1.385 0.005 0.00140 1.38 0.004 0.000845 1.376 0.003 0.000650 1.373
Table 2 – Roll Series 2 Data
Roll Series 3 Data
After having unsuccessful results with the 220-ohm resistors, we decided to head
in the other direction and increase the resistance. We therefore chose a value of 1K for
this series of measurements. We did not repeat the pitch measurements with this new
configuration because we felt the roll sensitivity had not increased enough and this would
also be indicative of the pitch. From the charts below, it can be seen that the sensitivity
may have increased slightly. More noticeable is the shift in peak sensitivities that has

43
been occurring among many of our charts. This is caused by our adjustment of the offset
voltage of the op-amp. We have been adjusting the op-amp offset between series, to
compensate for differences in the two leg resistors. The leg resistors are intended to be
matched, however, there were minor differences in resistance and this caused the center
(0 degree) voltage to drift away from our desired center. We adjusted the offset to try
and re-center this, however as can be seen from all of our charts, we did not always get
the center voltage to remain consistent.
Roll(x) using 1K in legsAngle(deg) Roll3 V dV per 5 Deg dV per Deg Voltage
-50 2.863 0.006 0.0012-45 2.857 0.012 0.0024 Mean 2.078666667-40 2.845 0.007 0.0014 Standard Error 0.144550557-35 2.838 0.013 0.0026 Median 2.015-30 2.825 0.013 0.0026 Mode #N/A-25 2.812 0.032 0.0064 Standard
Deviation0.662413869
-20 2.78 0.156 0.0312 SampleVariance
0.438792133
-15 2.624 0.112 0.0224 Kurtosis -1.93715899-10 2.512 0.27 0.054 Skewness 0.051057125
-5 2.242 0.227 0.0454 Range 1.5160 2.015 0.153 0.0306 Minimum 1.3475 1.862 0.233 0.0466 Maximum 2.863
10 1.629 0.202 0.0404 Sum 43.65215 1.427 0.049 0.0098 Count 2120 1.378 0.009 0.001825 1.369 0.006 0.001230 1.363 0.004 0.000835 1.359 0.005 0.00140 1.354 0.003 0.000645 1.351 0.004 0.000850 1.347
Table 3 – Roll Series 3 Data

44
Roll Series 4 Data
This series of data was taken using 10K resistors in the legs. We increased the
resistance from the former 1K values because we saw in increasing trend in sensitivity as
we increased the resistance.
Roll Using 10K in legs
Angle(deg)
Roll4 V dV per 5Deg
dV perDeg
Voltage
-50 2.786 0.009 0.0018-45 2.777 0.014 0.0028 Mean 2.279142857-40 2.763 0.026 0.0052 Standard Error 0.097839915-35 2.737 0.04 0.008 Median 2.372-30 2.697 0.036 0.0072 Mode #N/A-25 2.661 0.03 0.006 Standard
Deviation0.448358817
-20 2.631 0.067 0.0134 SampleVariance
0.201025629
-15 2.564 0.055 0.011 Kurtosis -0.625460723
-10 2.509 0.079 0.0158 Skewness -0.694311746
-5 2.43 0.058 0.0116 Range 1.4070 2.372 0.068 0.0136 Minimum 1.3795 2.304 0.059 0.0118 Maximum 2.786
10 2.245 0.074 0.0148 Sum 47.86215 2.171 0.075 0.015 Count 2120 2.096 0.095 0.01925 2.001 0.105 0.02130 1.896 0.123 0.024635 1.773 0.145 0.02940 1.628 0.186 0.037245 1.442 0.063 0.012650 1.379
Table 4 – Roll Series 4 Data
Roll Series 5 Data
After deciding that we had reached an appropriate resistance value for the circuit.
We decided to try increasing the gain of the op-amp to 20 instead of 10. This was done in

45
hopes of better mapping our range from 0V to 5V. With the gain set at ten our range
varied from about 1.3V to 2.85 V. If we could increase the range from 0V to 5V, then
the sensitivity would increase throughout all measurable angles. The charts below show
the measurements we obtained using an op-amp gain of 20. As can be seen from the
charts, an increase in sensitivity was not obtained. In fact, a decrease in sensitivity is
evident.
Roll using 10K, gain=20
Angle(deg)
Roll5 V dV per 5Deg
dV perDeg
Voltage
-50 2.839 0.01 0.002-45 2.829 0.009 0.0018 Mean 2.143047619-40 2.82 0.011 0.0022 Standard Error 0.135000767-35 2.809 0.012 0.0024 Median 2.16-30 2.797 0.014 0.0028 Mode #N/A-25 2.783 0.024 0.0048 Standard
Deviation0.618651233
-20 2.759 0.06 0.012 SampleVariance
0.382729348
-15 2.699 0.122 0.0244 Kurtosis -1.846404679-10 2.577 0.149 0.0298 Skewness -0.128019864
-5 2.428 0.268 0.0536 Range 1.4820 2.16 0.184 0.0368 Minimum 1.3575 1.976 0.105 0.021 Maximum 2.839
10 1.871 0.133 0.0266 Sum 45.00415 1.738 0.139 0.0278 Count 2120 1.599 0.135 0.02725 1.464 0.074 0.014830 1.39 0.013 0.002635 1.377 0.008 0.001640 1.369 0.006 0.001245 1.363 0.006 0.001250 1.357
Table 5 – Roll Series 5 Data

46
Pitch and Roll Series 6 Data
Having decided to return to a gain of 10 with leg resistors of 10K. We matched
the leg resistor values as close to each other as possible, on both the pitch and roll axes.
This was done in hopes of centering the sensitivity and range around 0 Degrees, which
corresponded to approximately 2 V. The four matched leg resistors had actual values of
9.79 K each. We also balanced the resistors used in setting our op-amp gain, as it
simplifies the equations that describe the op-amp. The op-amp uses two 100K and two
1M resistors. The actual values for the resistors were 97.9 K matched and 1.010M
matched, respectively. As can be seen from the charts below, the sensitivity was spread
more uniformly throughout the usable range. Notice how the voltage changes almost
linearly throughout the entire tested range.
Roll using 9.79K, gain=10
Angle(deg)
Voltage dV per 5Deg
dV perDeg
Voltage
-50 2.742 0.059 0.0118-45 2.683 0.088 0.0176 Mean 2.008809524-40 2.595 0.095 0.019 Standard Error 0.09744435
8-35 2.5 0.077 0.0154 Median 2.018-30 2.423 0.077 0.0154 Mode #N/A-25 2.346 0.07 0.014 Standard
Deviation0.44654614
8-20 2.276 0.065 0.013 Sample
Variance0.19940346
2-15 2.211 0.052 0.0104 Kurtosis -
1.202562478
-10 2.159 0.065 0.013 Skewness 0.039093377
-5 2.094 0.076 0.0152 Range 1.3690 2.018 0.076 0.0152 Minimum 1.3735 1.942 0.067 0.0134 Maximum 2.742

47
10 1.875 0.065 0.013 Sum 42.18515 1.81 0.079 0.0158 Count 2120 1.731 0.09 0.01825 1.641 0.091 0.018230 1.55 0.109 0.021835 1.441 0.047 0.009440 1.394 0.013 0.002645 1.381 0.008 0.001650 1.373
Table 6 – Roll Series 6 Data
Pitch Using 9.79K, gain=10Angle(deg)
Pitch6 V dV per 5Deg
dV perDeg
Column1
-50 2.782 0.059 0.0118-45 2.723 0.093 0.0186 Mean 2.042809524-40 2.63 0.106 0.0212 Standard Error 0.097075048-35 2.524 0.077 0.0154 Median 2.05-30 2.447 0.083 0.0166 Mode #N/A-25 2.364 0.063 0.0126 Standard
Deviation0.444853753
-20 2.301 0.064 0.0128 SampleVariance
0.197894862
-15 2.237 0.059 0.0118 Kurtosis -1.083724754
-10 2.178 0.06 0.012 Skewness 0.019831172-5 2.118 0.068 0.0136 Range 1.4050 2.05 0.075 0.015 Minimum 1.3775 1.975 0.052 0.0104 Maximum 2.782
10 1.923 0.059 0.0118 Sum 42.89915 1.864 0.075 0.015 Count 2120 1.789 0.098 0.019625 1.691 0.069 0.013830 1.622 0.113 0.022635 1.509 0.099 0.019840 1.41 0.025 0.00545 1.385 0.008 0.001650 1.377
Table 7 – Pitch Series 6 Data

48
Comparison of Series 1-6
The chart below, in Figure 24, shows all six roll series plotted on the same chart
for easy comparison. Notice how the linear region of the early sets of data is much
steeper and covers smaller range than the final series. Also notice that all six sets start
and end at about the same point. That is because the op-amp is saturating at these points,
which does not change regardless of our sensor leg resistances. As can be seen from the
chart, the final set of measurements, with the balanced 10K resistors gives a fairly
linearly curve over almost the entire range.
Figure 24 - Roll Axis Characterization
Roll Axis Characterization
1.2
1.4
1.6
1.8
2
2.2
2.4
2.6
2.8
3
-60 -40 -20 0 20 40 60
Degrees(Deg)
Vo
ltag
e(V
)
470 ohm legs
220 ohm legs
1K legs
10K legs
10K/gain=20
Balanced 10K
49
-50 -45 -40 -35 -30 -25 -20 -15 -10 -5 0 5 10 15 20 25 30 35 40 45 50S1
S2
S3
S4
S5
S6
1-1.1 1.1-1.2 1.2-1.3 1.3-1.4 1.4-1.5 1.5-1.6 1.6-1.7 1.7-1.8 1.8-1.9 1.9-2 2-2.1 2.1-2.2 2.2-2.3
2.3-2.4 2.4-2.5 2.5-2.6 2.6-2.7 2.7-2.8 2.8-2.9
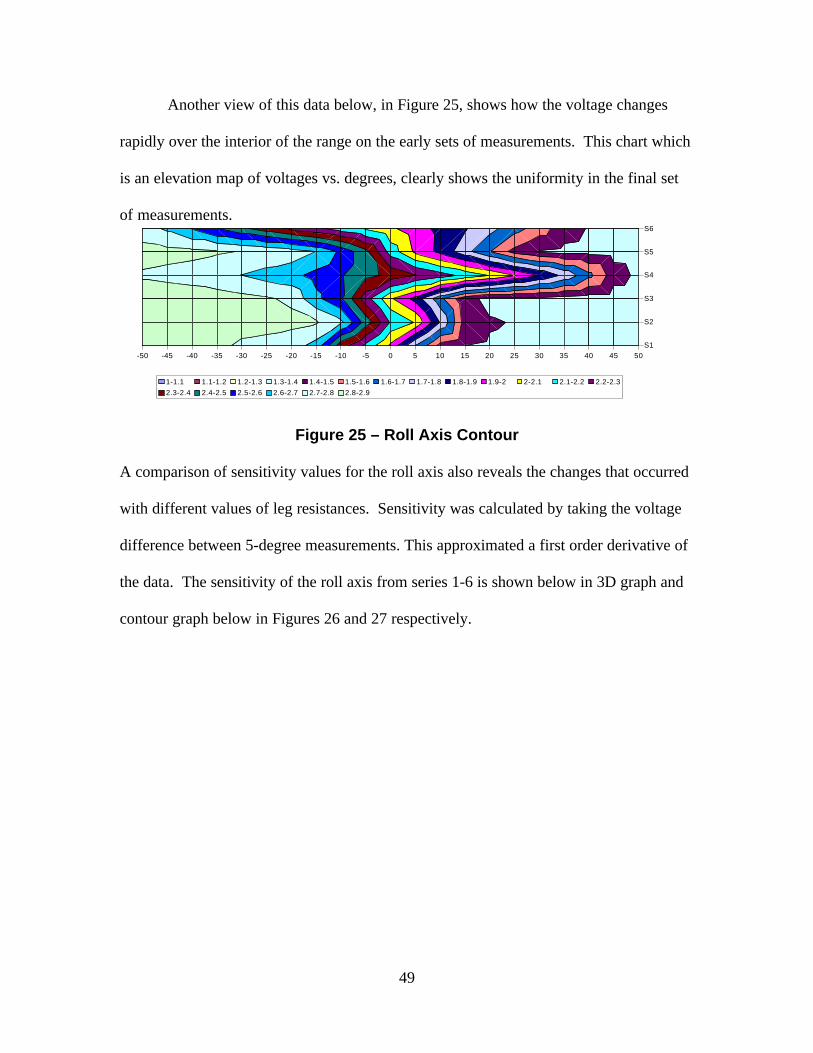
Another view of this data below, in Figure 25, shows how the voltage changes
rapidly over the interior of the range on the early sets of measurements. This chart which
is an elevation map of voltages vs. degrees, clearly shows the uniformity in the final set
of measurements.
Figure 25 – Roll Axis Contour
A comparison of sensitivity values for the roll axis also reveals the changes that occurred
with different values of leg resistances. Sensitivity was calculated by taking the voltage
difference between 5-degree measurements. This approximated a first order derivative of
the data. The sensitivity of the roll axis from series 1-6 is shown below in 3D graph and
contour graph below in Figures 26 and 27 respectively.

50
=S1
S2
S3
S4
S5
S6
S7
-50 -45 -40 -35 -30 -25 -20 -15 -10 -5 0 5 10 15 20 25 30 35 40 45S1
S2
S3
S4
S5
S6
0-0.01 0.01-0.02 0.02-0.03 0.03-0.04 0.04-0.05 0.05-0.06 0.06-0.07 0.07-0.08
Fig. 26 – Roll Axis Sensitivity
Fig. 27 – Roll Axis Sensitivity Contour

51
In the chart above, S7 is added for padding so that Series 6 is made visible. S7 is
not a series of measurements. As you can see, Series 6 has a wide range of values that are
readable by the A/D port. The contour graph above is provided just for clarity, as the 3D
graph can get a little confusing. Again you can see the extended range of the last data
series.
Tilt Sensor Conclusions
By adjusting the resistance values in the sensor legs, and changing the op-amp gain, we
were able to optimize our sensor circuitry for our needs. The next logical step for us will
be to characterize the effects of vibration on the sensor, as it will be in almost constant
vibration when mounted on the ornithopter. Luckily for us, we don’t need highly
accurate measurements (down to the degree). In order to control the ornithopter, we only
need to generalize our orientation into five distinct categories for each axis: far left, left,
center, right, and far right.
The only problem we encountered during our characterization was a time constant
problem with the sensor. This is due to the capacitance of the sensor and resistance of the
legs, as it takes time to charge and discharge. In our circuit, we switch between both axes
every 21 ms. We were worried that this time constant would pose a problem, however we
have found that the sensor does still work with the rapid switching, but it centers itself
about a different voltage. We may need to re-characterize the sensor after we finish
debugging the software that activates the axes.

52
Battery Monitor
The battery monitor’s primary responsibility is to monitor the voltage of the
battery. As the battery voltage drops, its ability to flap the wings is reduced. At some
critical point, it can no longer provide the force necessary to move the wings and the
motor stalls. As mentioned earlier in the section describing the motor, the stall current is
96 A. At this high of a current it does not take long for the batteries to overheat. In order
to protect the battery from this dangerous situation, we decided to initiate a landing
sequence before we reach this point. Below is the voltage characterization for the NiMH
batteries along with the cutoff point we chose. The raw data is displayed first followed by
the characterization curve in Fig. 28.
Time(s) Voltage(V)0 8.275 6.83
10 6.7215 6.7220 6.6625 6.630 6.5535 6.4840 6.3745 6.4550 6.4355 6.3260 6.5665 6.4970 6.4475 6.3780 6.3585 6.2590 6.3595 6.3
100 6.29
105 6.27110 6.22115 6.28120 6.21125 6.37130 6.14135 6.15140 6.13145 6.12150 5.98155 5.96160 6.04165 5.93170 5.85175 5.86180 5.66185 5.62190 5.38195 4.55200 5.09205 5.32
Table 8 - Battery Voltage Data

53
Fig. 28 - Battery Characterization Curve
As can be seen in the chart above, the open circuit voltage of a freshly charged
NiMH battery is 8.4 V. This is slightly higher than the listed voltage of 7.2 V. When the
battery is connected to the circuit, the voltage drops almost immediately to a voltage
much closer to the listed voltage of the battery. Notice that around 180 seconds, the
voltage drops significantly, this is the point where the battery can no longer power the
wings. We wish to avoid this undesirable situation and set the cutoff point for 6 V, which
occurs at 150 seconds (as can be seen above).
Battery Monitor Characterization
0
1
2
3
4
5
6
7
8
9
0 50 100 150 200
Time (s)
Vo
ltag
e (V
)
Cutoff Point
Open Circuit Battery Voltage
54
The battery monitor, which consists of a simple voltage divider network, cuts the
battery voltage in half so that it can be read by the A/D subsystem of the 68HC11. When
the A/D reads a voltage below 3 V, it sets a flag in the software. The flag is used to
initiate a landing signal behavior.
Takeover Sensor
Our first takeover circuit was implemented in hardware. It worked well, but we
abandoned it in order to save weight. The circuit diagram is in the appendix, for any
people who may want to use this circuit in the future. It monitors a channel of the
receiver and integrates the pulse of the pulse width modulation. It then compares this
value with a preset value using two comparators. If the stick is pulled left, the flip-flops
will flip the logic circuitry and cause the relays to switch to microprocessor control. If
the stick is pulled right, the comparators will cause the flip-flops to flip and the logic
circuitry causes the relays to switch to transmitter control.
Eventually, we moved to a software-based implementation to save weight. It is
briefly discussed in the Behavior section of this report.
Behaviors
Balancing
Big Bird’s balancing behavior is probably his most important behavior.
Without it, he would have no way to tell whether or not he is flying level. The software
for this behavior monitors the average current voltage reading from the tilt sensor for
both the pitch and roll axes. It then compares each of these values to the voltage values
55
corresponding to “no tilt” (one for each axis), and then linearly maps the difference
between each pair onto the range of controlling values for the servos. Servo position
changes are made by overwriting a single memory location (of the form SERVx_UP,
where x is the servo number). This location is what is read by a particular servo to
determine where it should be turned to.
Output compare 5 is used to periodically read all external sensors. The tilt sensor
is multiplexed between axes by this routine, and each axis’ voltage values are stored in a
separate queue of values. The length of both queues is defined by a macro at the
beginning of the program. The subroutine AVGLEVEL is used to average the current
values in each queue and store the average values to variables used by the routine
BALANCE.
Takeover
A second important behavior is the takeover behavior. In order to be able to
correct for errors while Big Bird is “learning” to balance itself, we need a way to override
the microcontroller’s control of him while he is flying. The takeover behavior is
controlled using a leftover channel on our transmitter, and is implemented in software in
the input capture number one interrupt service routine. It monitors channel four from the
receiver, and looks for a change in the channel’s output. If the transmitter stick is pulled
fully in one direction, the routine switches control to the microcontroller by flipping a bit
that controls the external takeover circuit. If the stick is pulled fully in the other
direction, the routine switches control to the transmitter by flipping the bit in the other
direction. The switching is done using a quad two-input-one-output multiplexer.

56
Landing
The landing behavior monitors the voltage level of the battery pack that is
powering the wings. When it falls below a predefined level, the tail is wagged up and
down to signal that the bird must land soon. This behavior is the first one that has the
capability of overriding other behaviors. It also has several software “locks” associated
with it.
The first lock is locked upon reset. The landing behavior waits until the battery
has been applied, and then looks for the voltage to drop below the threshold value.
Otherwise, the bird would signal that it needs to land upon every reset, unless the wings
were flapping beforehand.
Once this lock has been opened, the behavior looks for the voltage to drop below
the threshold value. At this point, the bird subsumes both the balancing behavior and the
takeover behavior. Then it wags the tail up and down. Finally, it ceases to subsume the
balance and takeover behaviors, and subsumes itself. In this manner, the tail can wag
without being overridden by the balancing behavior or the remote control through the
takeover behavior. And, once the behavior has completed, it may never run again until
after reset.
Experimental Layout and Results
We conducted experiments to optimize the tilt sensor used in Big Bird’s balancing
behavior. These experiments have been previously described in the Sensors section of
this report. We also conducted experiments in an attempt to optimize the flapping and
wings of Big Bird. These will be described here.
57
Wing Size
Big Bird’s wings went through several design stages. These have been previously
described in the Mobile Platform section. It was clear that the first set of triangular wings
were too small after we tried flapping them for the first time. They produced almost no
thrust. As a result we redesigned the wing frame and were able to double the wing area.
This set of wings produced much more thrust, and thus we decided to perform other
experiments using this set of wings.
Amplitude
By altering how far away from the center of the gearbox’s output wheel we placed
the flapping tee, we could alter the amplitude of the flaps. We experimented with many
different values of amplitude to determine the advantages of each. We discovered what
we expected to discover – the small amplitude provided fast flaps, but not as much thrust,
and the large amplitude provided slower, higher thrust flaps. Also associated with the
larger amplitude was a more jerky flapping motion. We compromised by settling on an
amplitude approximately in the middle of the range we experimented with. It provided
thrust, but was not so jerky that it caused the bird to gyrate wildly.
Additional Wings
After we had given up on trying to optimize our membrane wings and flapping
amplitude, we decided to add a set of fixed, cambered wings. These wings provided the
lift that we felt was missing and not allowing our bird to fly. In theory, these wings
should have allowed Big Bird to fly. They were used on a glider of comparable weight
and provided enough lift for it to fly. However, Big Bird would still not stay airborne.

58
When we ran with him he would lift out of our hands, but as soon as we released him, he
would slow down and drop. This experiment provided us with enough evidence to
conclude that Big Bird doesn’t have enough thrust to fly.
Conclusion
We made several attempts at a radio controlled/autonomous ornithopter.
Although we weren’t successful at achieving powered flight, we did achieve a powered
descent. We did not exhaust the available as we ran out of time, giving us hope for the
future. We developed several important construction techniques that will be valuable on
other projects. These include the universal joints from surgical tubing, the casting of the
wing joints using cotton string lashing and CA glue, a technique for drilling through
metal rods, an inexpensive lightweight pulley system, and a technique allowing us to
sturdily screw into balsa wood. We also used a technique, introduced to us by the owner
of The Hobby Shop, that allowed us to strengthen balsa joints by gluing aircraft plywood
to them.
In the future, we would like to develop a more streamlined body. In order to
achieve this, it will be necessary to obtain a manufactured gearbox. Our pulley system,
although lightweight, is large in size and difficult to work with. It would be ideal for a
less demanding application, however under the heavy loads we submitted it to, it
continually needed repairs. We would also like to experiment with aeroelastic wings3 to
achieve a more efficient flap. Additionally, we would like to try using a gas motor instead
of the electric motor, as the energy density of the gas is much higher than any batteries
existing to date.

59
Documentation
1 Chronister, Nathan, The Ornithopter Design Manual, The Ornithopter Modeler’s
Society, 1996
2 Rupell, Georg, Bird Flight, Van Nostrand Reinhold Company, New York, NY, 1997
3 DeLaurier, James D., “Ornithopter Wing Design”, Canadian Aeronautics and Space
Journal, V40 No 1, Mar 1994, p 10-18

60
Vendors/ Suppliers
The Fredericks CompanyP.O. Box 672400 Philmont AveHuntingdon Valley, PA 19006-0067(215) 947-2500http://www.frederickscom.com/
Gone with the Wind Kites200 Industrial Road - #100San Carlos, CA 94070(650) 594-1055http://www.gwtw-kites.com/
Hobby Lobby5614 Franklin Pike CircleBrentwood, TN 37027(615) 373-1444http://www.hobby-lobby.com/
The Hobby ShopCorner of University Ave and W 34th St.Gainesville, Fl
Radio Shack3315 SW Archer RdGainesville, Fl 32608(352) 375-2426
Wal-Mart
Mekatronix316 NW 17th Street, Suite AGainesville, FL 32603(407) 672-6780http://www.mekatronix.com
Jo-Ann’sCorner of NW 43rd St and NW 16th AveGainesville, Fl

61
Appendix
A1 – Pictures
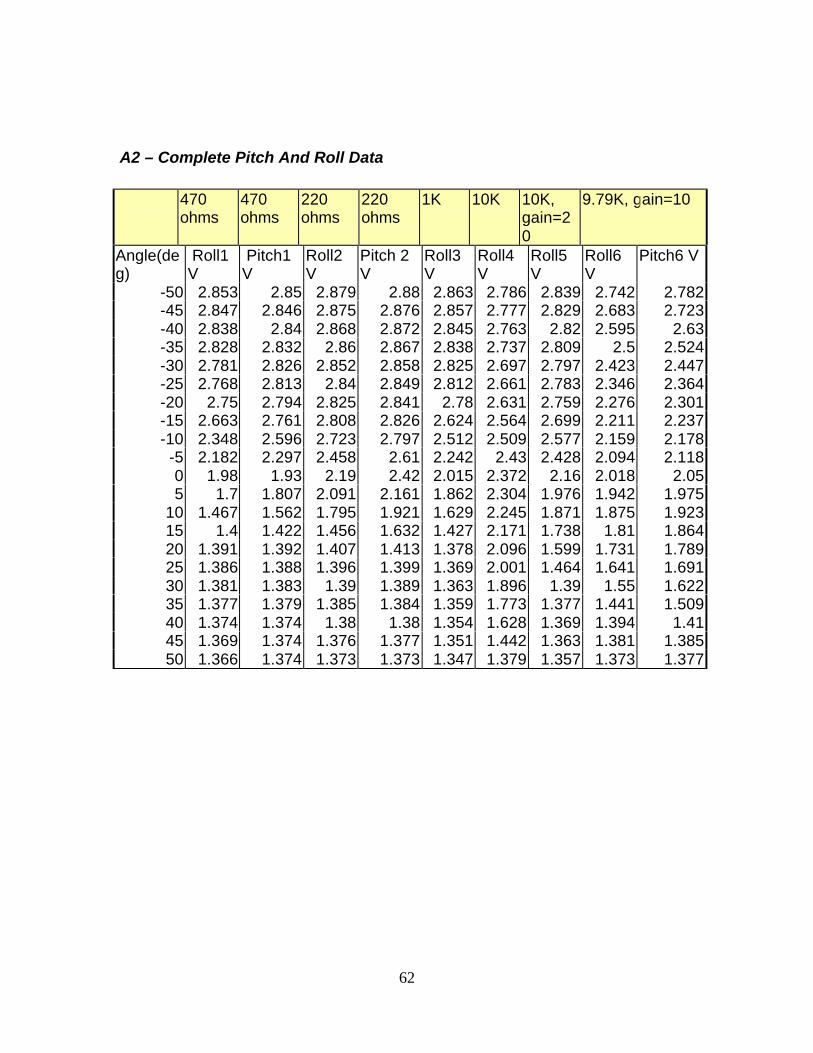
62
A2 – Complete Pitch And Roll Data
470ohms
470ohms
220ohms
220ohms
1K 10K 10K,gain=20
9.79K, gain=10
Angle(deg)
Roll1V
Pitch1V
Roll2V
Pitch 2V
Roll3V
Roll4V
Roll5V
Roll6V
Pitch6 V
-50 2.853 2.85 2.879 2.88 2.863 2.786 2.839 2.742 2.782-45 2.847 2.846 2.875 2.876 2.857 2.777 2.829 2.683 2.723-40 2.838 2.84 2.868 2.872 2.845 2.763 2.82 2.595 2.63-35 2.828 2.832 2.86 2.867 2.838 2.737 2.809 2.5 2.524-30 2.781 2.826 2.852 2.858 2.825 2.697 2.797 2.423 2.447-25 2.768 2.813 2.84 2.849 2.812 2.661 2.783 2.346 2.364-20 2.75 2.794 2.825 2.841 2.78 2.631 2.759 2.276 2.301-15 2.663 2.761 2.808 2.826 2.624 2.564 2.699 2.211 2.237-10 2.348 2.596 2.723 2.797 2.512 2.509 2.577 2.159 2.178
-5 2.182 2.297 2.458 2.61 2.242 2.43 2.428 2.094 2.1180 1.98 1.93 2.19 2.42 2.015 2.372 2.16 2.018 2.055 1.7 1.807 2.091 2.161 1.862 2.304 1.976 1.942 1.975
10 1.467 1.562 1.795 1.921 1.629 2.245 1.871 1.875 1.92315 1.4 1.422 1.456 1.632 1.427 2.171 1.738 1.81 1.86420 1.391 1.392 1.407 1.413 1.378 2.096 1.599 1.731 1.78925 1.386 1.388 1.396 1.399 1.369 2.001 1.464 1.641 1.69130 1.381 1.383 1.39 1.389 1.363 1.896 1.39 1.55 1.62235 1.377 1.379 1.385 1.384 1.359 1.773 1.377 1.441 1.50940 1.374 1.374 1.38 1.38 1.354 1.628 1.369 1.394 1.4145 1.369 1.374 1.376 1.377 1.351 1.442 1.363 1.381 1.38550 1.366 1.374 1.373 1.373 1.347 1.379 1.357 1.373 1.377
63
A3 – Source Code
*************************************************************************** PROGRAM: FINAL.ASM* PROGRAMMER: MICAH O'HALLORAN AND STEVE HOROWITZ* DATE: DEC. 2, 1998* VERSION: 1.5* DESCRIPTION: THIS PROGRAM OUTPUTS A PWM SIGNAL APPROPRIATE FOR DRIVING* STANDARD SERVOS. THE PERIOD FOR THE TOTAL WAVE IS* ABOUT 21ms, AND THE PWM VARIES BETWEEN ABOUT 1.05ms (LOW)* TO ABOUT 1.9ms (HIGH). NOTE THAT THE TIMING OF THIS PROGRAM* DEPENDS ON THE SETTINGS OF PR0 AND PR1 IN THE TMSK2 REGISTER.* IT ALSO CONTAINS THE ROUTINE FOR THE TAKEOVER INPUT CAPTURE.* IT IMPLEMENTS THE LANDING BEHAVIOR, TAKEOVER BEHAVIOR, AND* BALANCING BEHAVIOR.* USES: OC2, OC3, OC4, 0C5, IC1**************************************************************************** DATA SECTION**************************************************************************** INTERRUPT VECTORS
ORG $FFFE FDB MAIN
ORG $FFE0 FDB OC5_ISR FDB OC4_ISR FDB OC3_ISR FDB OC2_ISR
ORG $FFEE FDB IC1_ISR
**************************************************************************** CONSTANTS****************************************************************************
TCTL1 EQU $1020TCNT EQU $100ETFLG1 EQU $1023TMSK1 EQU $1022TMSK2 EQU $1024CFORC EQU $100BTOC1 EQU $1016TOC2 EQU $1018TOC3 EQU $101ATOC4 EQU $101CTOC5 EQU $101ETCTL2 EQU $1021TIC1 EQU $1010TIC2 EQU $1012TIC3 EQU $1014PORTB EQU $1004OPTION EQU $1039ADCTL EQU $1030ADR1 EQU $1031ADR2 EQU $1032ADR3 EQU $1033ADR4 EQU $1034DDRC EQU $1007PORTC EQU $1003PORTE EQU $100APACTL EQU $1026

64
****FOR SERVOS*****PULS_LEN EQU 42000 ;THE LENGTH OF ONE PERIOD OF SIGNALMID_POSITION EQU 3000 ;MIDDLE POSITION (IN E-CLOCKS) OF SERVOSOC2_START_DELAY EQU 1000 ;THE E-CLOCK DELAY BEFORE OC2 SHOULD START
****FOR TAKEOVER SYSTEM****MICRO_ON EQU %11111110 ;BITMAPS FOR SETTING PORT BRCVR_ON EQU %00000001 ;PULLED_LEFT EQU 2500 ;THE THRESHOLD VALUE FOR STICK TO COUNT AS "LEFT"PULLED_RIGHT EQU 3400 ;" " " " " " " " "RIGHT"
****FOR SAMPLING ROUTINE****ROLL_ON EQU %11111101 ;THE MASK FOR TURNING ROLL MEASUREMENT ONPITCH_ON EQU %00000010 ;THE MASK FOR TURNING PITCH MEASUREMENT ONOC5_DELAY EQU 4000 ;DELAY FROM START OF OC4 BEFORE OC5 RUNSQUEUE_LENGTH EQU 4 ;LENGTH OF PITCH AND ROLL QUEUES
****FOR BALANCING BEHAVIOR****MID_LEV_ROLL EQU %01100111 ;MID LEVELS FOR TILT AND PITCHMID_LEV_PITCH EQU %01101111 ;
****FOR LANDING BEHAVIOR*****BAT_THRESH EQU %10011001 ;LANDING TAKEOVER THRESHOLD VALUE (3V)BAT_THRESH EQU %00011001
**************************************************************************** END OF CONSTANTS***************************************************************************
**************************************************************************** VARIABLES****************************************************************************
ORG $0042 ;STORE ALL VARIABLES IN THIS SECTION
****GLOBAL VARIABLES****TEMP_VAR RMB 2 ;MAKE A TEMPORARY VARIABLE FOR ALL'S USE
****FOR SERVOS******SERV1_UP RMB 2 ;THE 'UPTIMES' OF THE PWM FOR SERVOSOC2_TIM_LO RMB 2 ;THE LENGTH OF LOW TIME TO COMPLETE A CYCLESERV2_UP RMB 2 ;OC3_TIM_LO RMB 2 ;SERV3_UP RMB 2 ;OC4_TIM_LO RMB 2 ;
****FOR TAKEOVER SYSTEM*****IC1_START RMB 2 ;KEEPS THE FIRST EDGE OF IC1SUBSUM_TAK RMB 1 ;KEEPS TRACK OF SUBSUMPTION OF TAKEOVER SYSTEM
****FOR SAMPLING ROUTINE****CUR_ROLL RMB 2CUR_PITCH RMB 2PITCHQ RMB QUEUE_LENGTHPITCH_AVG RMB 1ROLLQ RMB QUEUE_LENGTHROLL_AVG RMB 1
****FOR LANDING ROUTINE****ARM_LAND RMB 1 ;0 =NOT YET ARMED, 1 = ARMEDSUBSUM_LAND RMB 1 ;ALLOWS LANDING TO SUBSUME ITSELF (WHEN DONE)BAT_MEAS RMB 1 ;HOLDS LATEST BATTERY MEASUREMENT
****FOR BALANCING ROUTINE********SUBSUM_BAL RMB 1 ;ALLOWS PROCESSES TO SUBSUME BALANCING
***************************************************************************
65
* END OF VARIABLES***************************************************************************
ORG $F800
*************************************************************************** MAIN PROGRAM***************************************************************************MAIN LDS #$0041
LDD #MID_POSITION ;INITIALIZE ALL 3 SERVOS TO MID_POSITION STD SERV1_UP STD SERV2_UP STD SERV3_UP
LDAA TMSK2 ;SET TIMER PRESCALAR TO FASTEST SETTING ANDA #%11111100 ; STAA TMSK2 ;
LDAA #%00000000 ;INITIALIZE PORT C'S VALUE STAA PORTC ; LDAA #%11111111 ;SET PORTC TO ALL OUTPUTS STAA DDRC ;
LDAA PORTB ;SET THE CONTROL TO INITIALLY BELONG TO THE ANDA #MICRO_ON ;MICROPROCESSOR STAA PORTB ;(DON'T ALTER OTHER BITS)
LDAA PORTB ;SET TO READ THE ROLL AXIS FIRST ANDA #ROLL_ON ;ON DATA MEASUREMENTS STAA PORTB ;
LDAA OPTION ;TURN ON A/D CONVERTER ORAA #%10000000 ; STAA OPTION ;
LDAA $FF ;DELAY FOR THE START OFMAIN_AD_DELAY DECA ;THE A/D ROUTINES BNE MAIN_AD_DELAY
LDD #PITCHQ ;GET THE FIRST SLOT IN QUEUE1 STD CUR_PITCH ;AND MAKE A POINTER TO IT
LDD #ROLLQ ;GET THE FIRST SLOT IN QUEUE2 STD CUR_ROLL ;AND MAKE A POINTER TO IT
LDAA #0 STAA SUBSUM_BAL ;TURN BALANCING ON STAA SUBSUM_TAK ;" TAKEOVER " STAA SUBSUM_LAND ;" LANDING "
STAA ARM_LAND ;DISARM STAA BAT_MEAS ;SET BATTERY MEASUREMENT TO 0
JSR INIT_IC1 ;INITIALIZE THE IC1 PROCESS JSR INIT_OCS ;INITIALIZE ALL OUTPUT COMPARES
CLI ;TURN ON INTERRUPTS
HERE LDAA PORTE ;LOAD PORTE DATA ANDA #%10000000 ;MASK BIT 7 BNE DIS_ROL ;IF !=0, DISPLAY ROLL DATADIS_PIT LDAA PITCH_AVG ;SHOW BINARY RUNNING TOTAL STAA PORTC ;ON LEDS BRA MAIN_1 ;WAIT ON INTERRUPTSDIS_ROL LDAA ROLL_AVG STAA PORTC

66
MAIN_1 LDAA SUBSUM_BAL ;CHECK FOR SUBSUMPTION OF BALANCE BNE SKIP_1 ;SUBSUME BALANCE IF '1'
JSR CHK_BAL ;BALANCE THE BIRD
SKIP_1 LDAA SUBSUM_LAND ;CHECK FOR SUBSUMPTION OF LANDING BNE SKIP_2 ;SUBSUME IF '1'
MAIN_2 JSR LAND_CHK ;CHECK FOR LANDING NEED
SKIP_2 BRA HERE
*************************************************************************** END OF MAIN**************************************************************************
*************************************************************************** SUBROUTINE-LAND_CHK** INPUTS: NONE* OUTPUTS: CHANGES SERV1_UP,SERV2_UP* DESTROYS: REGISTERS A AND B AND X* DESCRIPTION: THIS SUBROUTINE TRIGGERS LANDING SIGNAL**************************************************************************
* THIS FIRST SEGMENT LOOKS FOR INITIAL BATTERY APPLICATION, THEN ARMS* THE LANDING MECHANISM
LAND_CHK LDAA ARM_LAND ;CHECK IF ARMEDBNE SKIP_ARM ;IF NOT 0, WE ARE ALREADY ARMED
LDAA BAT_MEAS ;LOAD THE LATEST BATTERY MEASUREMENT STAA PORTC
CMPA #BAT_THRESH ;LOOK FOR THE FIRST TIME BATTERY IS APPLIEDBHI ARM_NOW ;IF LARGER THAN THRESHOLD, ARM LANDING MECHANISMBRA RET_LAND_CHK ;ELSE RETURN
ARM_NOW LDAA #1 ;ARM THE LANDING MECHANISMSTAA ARM_LAND ;BRA RET_LAND_CHK ;RETURN
* THIS SEGMENT CHECKS TO SEE IF WE HAVE FALLEN BELOW OUR THRESHOLD
SKIP_ARM LDAA BAT_MEAS ;GET LATEST MEASUREMENTCMPA #BAT_THRESH ;COMPARE TO THRESHOLDBLS LAND_EDG ;WE FOUND THE DIP TO INITIATE LANDINGBRA RET_LAND_CHK ;ELSE, RETURN
* INITIATE LANDING PATTERN
LAND_EDG LDAA #1STAA SUBSUM_TAK ;SUBSUME TAKEOVER AND BALANCINGSTAA SUBSUM_BAL ;ROUTINES
LDAA PORTB ;TAKE CONTROL OF TAIL (OVERRIDINGANDA #MICRO_ON ;REMOTE CONTROL, IF NECESSARY)STAA PORTB ;
LDD #MID_POSITIONSTD SERV1_UP
LDD #4000 ;PULL TAIL TO ONE EXTREMESTD SERV2_UP ;
LDAA #$FFLP_1_OUT LDX #$621 ;WAIT FOR ABOUT .2 secLP_1_IN DEX
BNE LP_1_INDECA

67
BNE LP_1_OUT
LDD #2000 ;PULL TO OTHER EXTREMESTD SERV2_UP ;
LDAA #$FFLP_2_OUT LDX #$621 ;WAIT FOR ABOUT .2 secLP_2_IN DEX
BNE LP_2_INDECABNE LP_2_OUT
LDD #4000STD SERV2_UP
LDAA #$FFLP_3_OUT LDX #$621 ;WAIT FOR ABOUT .2 secLP_3_IN DEX
BNE LP_3_INDECABNE LP_3_OUT
LDD #2000STD SERV2_UP
LDAA #$FFLP_4_OUT LDX #$621 ;WAIT FOR ABOUT .2 secLP_4_IN DEX
BNE LP_4_INDECABNE LP_4_OUT
LDAA #0STAA SUBSUM_TAK ;END SUBSUMPTIONSTAA SUBSUM_BAL ;
LDAA #1STAA SUBSUM_LAND ;SUBSUME SELF PERMANANTLY
RET_LAND_CHK RTS ;DONE, SO RETURN
*************************************************************************** SUBROUTINE-CHK_BAL** INPUTS: NONE* OUTPUTS: CHANGES SERV1_UP,SERV2_UP* DESTROYS: REGISTERS A AND B* DESCRIPTION: THIS SUBROUTINE SETS UP CALLS TO BALANCE SUBROUTINE***************************************************************************CHK_BAL LDAA ROLL_AVG ;SET UP REGS FOR SUB CALL
LDAB #MID_LEV_ROLL ; JSR BALANCE ;CALL BALANCE
SUBD #MID_POSITION ;SUBTRACT OFF MID POSITION STD TEMP_VAR ;MAKE A TEMP STORE LDD #0 ;NEGATE THE RESULT SUBD TEMP_VAR ; ADDD #MID_POSITION ;
STD SERV1_UP ;SET SERVO
LDAA PITCH_AVG ;SET UP REGS FOR SUB CALL LDAB #MID_LEV_PITCH ; JSR BALANCE ;CALL BALANCE STD SERV2_UP ;SET SERVO
RTS

68
*************************************************************************** SUBROUTINE-BALANCE** INPUTS: TILT READING IN REGISTER A* MID-TILT VALUE IN REGISTER B* OUTPUTS: THE VALUE TO SET THE SERVO AT IN REGISTER D* DESTROYS: REGISTERS A AND B* DESCRIPTION: THIS SUBROUTINE TAKES IN A READING, COMPARES IT TO* THE CENTER READING, AND LINEARLY MAPS THIS ERROR ONTO* THE SERVO RANGE (2000 TO 4000). IT RETURNS THIS VALUE* IN THE D REGISTER.***************************************************************************BALANCE SBA ;SUBTRACT THE CENTER VALUE FROM MEASURED
BLO BAL_LOW ;IF TILT VALUE < MID LEVEL VALUE TAB CLRA ; BRA BAL_1 ;
BAL_LOW TAB LDAA #$FF ;IF RESULT IS NEG, DO OPPOSITE
BAL_1 LSLD ;MULTIPLY BY 32 LSLD ; LSLD ; LSLD ; LSLD ;
LSLD ADDD #MID_POSITION ;ADD TO SERVO MID_POSITION
RTS ;RETURN
*************************************************************************** SUBROUTINE-INIT_OCS* INPUTS: NONE* OUTPUTS: NONE* DESTROYS: NONE* DESCRIPTION: THIS SUROUTINE SETS UP ALL SERVO OC PINS TO BEGIN AT 0V, RISE* ON THE FIRST COMPARE, AND ENABLES ALL OC INTERRUPTS. IT SETS* OC5, WHICH IS USED TO TIME SAMPLING, TO BE DISCONNECTED FROM* THE OUTPUT PIN.***************************************************************************
INIT_OCS PSHA ;PRESERVE CONTENTS OF REG. A
LDAA PACTL ;SET I4/O5 FUNCTION TO O5 ANDA #%11111011 ; STAA PACTL ;
LDAA #%10101000 ;CLEAR OC2-4 PINS TO 0V ON FORCE STAA TCTL1 ;DISCONNECT OC5 FROM ITS PIN
LDAA #%01110000 ;FORCE COMPARES ON OC2-4 PINS STAA CFORC ;
LDD TCNT ;GET CURRENT TIMER VALUE ADDD #OC2_START_DELAY ;ADD A CERTAIN DELAY BEFORE
OC2 STD TOC2 ;STARTS
ADDD #150 ;ADD DELAY TO START OF OC3 STD TOC3
ADDD #150 ;ADD ANOTHER DELAY TO START OF OC4 STD TOC4
ADDD #OC5_DELAY ;ADD DELAY FOR SAMPLING ROUTINE STD TOC5 ;TO BE IN DEAD PART OF 21ms PERIOD
LDAA #%01111000 ;CLEAR ANY PENDING FLAGS STAA TFLG1 ;

69
LDAA #%11111100 ;SET OC2-4 PINS TO 5V ON FIRST STAA TCTL1 ;SUCCESSFUL COMPARE.
LDAA TMSK1 ;TURN ON OC2-5 INTERRUPTS, BUT DON'T ORAA #%01111000 ;ALTER OTHER BITS IN TMSK1 STAA TMSK1 ;
PULA ;RESTORE CONTENTS OF REG. A
RTS ;RETURN
*************************************************************************** ISR - OC2_ISR* DESCRIPTION: HANDLES THE OC2 INTERRUPT REQUESTS***************************************************************************OC2_ISR LDAA TFLG1 ;CHECK FOR VALID INTERRUPT
ANDA #%01000000 ; BEQ RET_OC2 ;IF NOT VALID, RETURN
STAA TFLG1 ;IF VALID, CLEAR OC2F
LDAA TCTL1 ;CHECK TO SEE IF OC2 PIN WAS SET ANDA #%01000000 ;OR CLEARED ON THE COMPARE BEQ OC2_CLRD ;IF 0, IT WAS JUST CLEARED TO 0V
LDD TOC2 ;ELSE, IT WAS JUST SET STD OC2_TIM_LO ;TEMP SAVE OF TIME ADDD SERV1_UP ;ADD THE UP TIME OF THE PULSE STD TOC2 ;STORE TIME FOR NEXT COMPARE
LDAA TCTL1 ;CLEAR ON NEXT COMPARE ANDA #%10111111 ; STAA TCTL1 ;
LDD OC2_TIM_LO ;FIND THE END OF THE PERIOD ADDD #PULS_LEN ;AND STORE INTO TIM_LO STD OC2_TIM_LO ;
BRA RET_OC2 ;RETURN
OC2_CLRD LDD OC2_TIM_LO ;GET PREV. CALC. END OF PERIOD STD TOC2 ;AND PUT INTO COMPARE REGISTER
LDAA TCTL1 ;SET ON NEXT COMPARE ORAA #%11000000 ; STAA TCTL1 ;
RET_OC2 RTI
*************************************************************************** ISR - OC3_ISR* DESCRIPTION: HANDLES THE OC3 INTERRUPT REQUESTS***************************************************************************OC3_ISR LDAA TFLG1 ;CHECK FOR VALID INTERRUPT
ANDA #%00100000 ; BEQ RET_OC3 ;IF NOT VALID, RETURN
STAA TFLG1 ;IF VALID, CLEAR OC3F
LDAA TCTL1 ;CHECK TO SEE IF OC3 PIN WAS SET ANDA #%00010000 ;OR CLEARED ON THE COMPARE BEQ OC3_CLRD ;IF 0, IT WAS JUST CLEARED TO 0V

70
LDD TOC3 ;ELSE, IT WAS JUST SET STD OC3_TIM_LO ;TEMP SAVE OF TIME ADDD SERV2_UP ;ADD THE UP TIME OF THE PULSE STD TOC3 ;STORE TIME FOR NEXT COMPARE
LDAA TCTL1 ;CLEAR ON NEXT COMPARE ANDA #%11101111 ; STAA TCTL1 ;
LDD OC3_TIM_LO ;FIND THE END OF THE PERIOD ADDD #PULS_LEN ;AND STORE INTO TIM_LO STD OC3_TIM_LO ;
BRA RET_OC3 ;RETURN
OC3_CLRD LDD OC3_TIM_LO ;GET PREV. CALC. END OF PERIOD STD TOC3 ;AND PUT INTO COMPARE REGISTER
LDAA TCTL1 ;SET ON NEXT COMPARE ORAA #%00110000 ; STAA TCTL1 ;
RET_OC3 RTI
*************************************************************************** ISR - OC4_ISR* DESCRIPTION: HANDLES THE OC4 INTERRUPT REQUESTS***************************************************************************OC4_ISR LDAA TFLG1 ;CHECK FOR VALID INTERRUPT
ANDA #%00010000 ; BEQ RET_OC4 ;IF NOT VALID, RETURN
STAA TFLG1 ;IF VALID, CLEAR OC4F
LDAA TCTL1 ;CHECK TO SEE IF OC4 PIN WAS SET ANDA #%00000100 ;OR CLEARED ON THE COMPARE BEQ OC4_CLRD ;IF 0, IT WAS JUST CLEARED TO 0V
LDD TOC4 ;ELSE, IT WAS JUST SET STD OC4_TIM_LO ;TEMP SAVE OF TIME ADDD SERV3_UP ;ADD THE UP TIME OF THE PULSE STD TOC4 ;STORE TIME FOR NEXT COMPARE
LDAA TCTL1 ;CLEAR ON NEXT COMPARE ANDA #%11111011 ; STAA TCTL1 ;
LDD OC4_TIM_LO ;FIND THE END OF THE PERIOD ADDD #PULS_LEN ;AND STORE INTO TIM_LO STD OC4_TIM_LO ;
BRA RET_OC4 ;RETURN
OC4_CLRD LDD OC4_TIM_LO ;GET PREV. CALC. END OF PERIOD STD TOC4 ;AND PUT INTO COMPARE REGISTER
LDAA TCTL1 ;SET ON NEXT COMPARE ORAA #%00001100 ; STAA TCTL1 ;
RET_OC4 RTI
*************************************************************************** ISR - OC5_ISR* DESCRIPTION: HANDLES THE OC5 INTERRUPT REQUESTS**************************************************************************

71
*OC5_ISR LDAA TFLG1 ;CHECK FOR VALID INTERRUPT
ANDA #%00001000 ; BNE OC5_BEG ;IF NOT VALID, RETURN FROM ISR JMP RET_OC5
OC5_BEG STAA TFLG1 ;IF VALID, CLEAR OC5F
LDD TOC5 ;SET TOC5 TO NEXT INTERRUPT ADDD #PULS_LEN ;TIME STD TOC5 ;
LDAA #$10 ;BEGIN THE A/D CONVERSION STAA ADCTL ;PROCESS
LDAA #15 ;DELAY FOR OVER 32msAD_DELAY DECA ;
BNE AD_DELAY ;
LDAB ADR2 STAB BAT_MEAS ;READ BATTERY, STORE TO VAR
LDAB ADR1 ;GET DATA JUST MEASURED
LDAA PORTB ;CHECK TO SEE IF WE JUST ANDA #%00000010 ;MEASURED PITCH OR ROLL BEQ IS_ROLL ;
IS_PITCH LDX CUR_PITCH ;GET POINTER TO PITCH QUEUE STAB 0,X ;SAVE LATEST PITCH
LDAB PORTB ANDB #ROLL_ON ;SET TO MEASURE ROLL NEXT
STAB PORTB
UPDATE_DATA LDD CUR_PITCH ;GET CURRENT Q POINTER SUBD #PITCHQ ;SUBTRACT Q STARTING POINT CPD #QUEUE_LENGTH-1 ;SEE IF WE ARE AT THE END OF THE Q BEQ RESET_PITCH ;SET CUR_PITCH BACK TO PITCHQ AND
UPDATE LEVEL2 LDY CUR_PITCH ;INCREMENT CUR_PITCH POINTER INY STY CUR_PITCH ; BRA RET_OC5 ;DONE WITH PITCH UPDATE
RESET_PITCH LDX #PITCHQ ;GET POINTER TO START OF Q STX CUR_PITCH ;RESET CURRENT PITCH POINTER LDY #PITCH_AVG LDAB #QUEUE_LENGTH JSR AVGLEVEL BRA RET_OC5 ;DONE WITH PITCH UPDATE
IS_ROLL LDX CUR_ROLL ;GET POINTER TO Q STAB 0,X ;SAVE LATEST ROLL LDAB PORTB ORAB #PITCH_ON ;SET TO MEASURE PITCH NEXT
STAB PORTB
UPDATE_ROLL LDD CUR_ROLL ;GET CURRENT Q POINTER SUBD #ROLLQ ;SUBTRACT Q STARTING POINT CPD #QUEUE_LENGTH-1 ;SEE IF WE ARE AT END OF Q BEQ RESET_ROLL ;SET CUR_ROLL BACK TO PITCHQ AND
UPDATE LEVEL2 LDY CUR_ROLL ;INCREMENT CUR_ROLL POINTER INY ; STY CUR_ROLL ;
BRA RET_OC5 ;EXIT ISR
RESET_ROLL LDX #ROLLQ ;RESET Q POINTER TO START OF Q
72
STX CUR_ROLL ; LDY #ROLL_AVG ;GET AVERAGE VALUE LDAB #QUEUE_LENGTH JSR AVGLEVEL
RET_OC5 RTI ;RETURN FROM OC5_ISR
******************************************************* Subroutine: AVGLEVEL ***************************** INPUT: X => BASE ADDRESS OF VALUES TO AVG (LEVEL ADDRESS)* Y => ADDRESS TO STORE AVG (LEVEL+1 ADDRESS)* B => NUMBER OF VALUES ON LEVEL ( MUST BE POWER OF 2)* OUTPUT: LEVEL+1 ADDRESS* DESTROYS: X,Y,A,B*******************************************************
AVGLEVEL PSHY
CLRA
PSHB ;SAVE TEMP FOR LATERPSHA ;CLEAR MSBYTE FOR YPSHB ;TEMP FOR YPSHA ;CLEAR MSBYTE FOR YPULY ;HAS NUMBER OF VALUES ON LEVEL
DECBABX ;POINT TO LAST VALUELDAB 0,X ;GET VALUE
LEVEL_LOOP DEX ;POINT TO PREV VALUEDEYBEQ ADD_DONE ;EXIT WHEN ALL VALUES ADDEDADDB 0,X ;ADD PREV VALUE
BCC LEVEL_LOOP
INCA ;COUNT OVERFLOWSBRA LEVEL_LOOP
ADD_DONE PULX ;GET # OF VALUES XGDX ;SWAP TEMPORARILY LSRD ;INITIAL DIVIDE BY 2 XGDX ;SWAP BACK
BEQ COMP_AVG_DONE
COMPUTE_AVG LSRD ;DIVIDE THE TOTAL BY 2 XGDX ;TRADE VALUES LSRD ;DIVIDE THE COUNTER BY TWO XGDX ;TRADE VALUES AGAIN
BNE COMPUTE_AVG
COMP_AVG_DONE PULY STAB 0,Y
RTS
*************************************************************************** SUBROUTINE-INIT_IC1* INPUTS: NONE* OUTPUTS: NONE* DESTROYS: NONE

73
* DESCRIPTION: THIS SUROUTINE SETS UP THE IC1 FUNCTION TO BEGIN CAPTURING* ON A RISING EDGE, AND ENABLES INTERRUPTS***************************************************************************INIT_IC1 PSHA ;SAVE CONTENTS OF REGISTER A
LDAA #%00010000 ;SET IC1 TO CAPTURE ON RISING EDGESSTAA TCTL2 ;
LDAA #%00000100 ;TURN OFF IC1'S FLAGSTAA TFLG1 ;
LDAA TMSK1 ;TURN ON IC1 INTERRUPTS, BUT DON'T INTERFEREORAA #%00000100 ;WITH OTHER INTERRUPT BITSSTAA TMSK1 ;
PULA ;RESTORE THE CONTENTS OF REGISTER A
RTS ;RETURN FROM THE SUBROUTINE
*************************************************************************** ISR - IC1_ISR* DESCRIPTION: HANDLES THE IC1 INTERRUPT REQUESTS***************************************************************************IC1_ISR LDAA TFLG1 ;CHECK FOR VALID INTERRUPT
ANDA #%00000100 ;IF INVALIDBEQ RET_IC1 ;RETURN FROM ISR
STAA TFLG1 ;ELSE, CLEAR THE FLAG
LDAA SUBSUM_TAK ;IF 1, THEN CONTROL IS SUBSUMEDBNE RET_IC1 ;TO ANOTHER HIGH PRIORITY PROCESS
LDAA TCTL2 ;CHECK TO SEE IF RISING OR FALLING EDGE WASANDA #%00100000 ;CAPTUREDBEQ IC1_ROSE ;IF ZERO, RISING EDGE WAS CAPTURED
IC1_FELL LDAA TCTL2 ;SET IC1 TO CAPTURE ON RISING EDGE NEXTANDA #%11011111 ;ORAA #%00010000 ;STAA TCTL2 ;
LDD TIC1 ;GET THE CAPTURED TIMESUBD IC1_START ;SUBTRACT THE PREVIOUSLY CAPTURED TIME
CPD #PULLED_LEFT ;CHECK TO SEE IF STICK IS PULLED LEFTBLO IC1_MICR_ON ;IF SO, GIVE CONTROL TO MICROPROCESSOR
CPD #PULLED_RIGHT ;CHECK TO SEE IF STICK IS PULLED RIGHTBHI IC1_RCVR_ON ;IF SO, GIVE CONTROL TO RECEIVER
BRA RET_IC1 ;ELSE RETURN FROM ISR
IC1_MICR_ON LDAA PORTB ;SET PORTB[0] TO ZERO WITHOUT DESTROYINGANDA #MICRO_ON ;OTHER PORTB VALUESSTAA PORTB ;
BRA RET_IC1 ;RETURN FROM ISR
IC1_RCVR_ON LDAA PORTB ;SET PORTB[0] TO ONE WITHOUT DESTROYINGORAA #RCVR_ON ;OTHER PORTB VALUESSTAA PORTB ;
BRA RET_IC1 ;RETURN FROM ISR
IC1_ROSE LDAA TCTL2 ;SET TO CAPTURE ON FALLING EDGE NEXTANDA #%11101111 ;ORAA #%00100000 ;STAA TCTL2 ;

74
LDD TIC1 ;GET THE TIME OF CAPTURESTD IC1_START ;AND STORE IT TO A TEMP VARIABLE
RET_IC1 RTI ;RETURN FROM INTERRUPT