big data and organizational impacts: a study of big data
TRANSCRIPT

University of Arkansas, FayettevilleScholarWorks@UARK
Theses and Dissertations
12-2016
Big Data and Organizational Impacts: A Study ofBig Data VenturesTaha HavakhorUniversity of Arkansas, Fayetteville
Follow this and additional works at: http://scholarworks.uark.edu/etd
Part of the Entrepreneurial and Small Business Operations Commons, Management InformationSystems Commons, and the Technology and Innovation Commons
This Dissertation is brought to you for free and open access by ScholarWorks@UARK. It has been accepted for inclusion in Theses and Dissertations byan authorized administrator of ScholarWorks@UARK. For more information, please contact [email protected], [email protected].
Recommended CitationHavakhor, Taha, "Big Data and Organizational Impacts: A Study of Big Data Ventures" (2016). Theses and Dissertations. 1763.http://scholarworks.uark.edu/etd/1763

1
Big Data and Organizational Impacts: A Study of Big Data Ventures
A dissertation submitted in partial fulfillment
of the requirements for the degree of
Doctor of Philosophy in Information Systems
by
Taha Havakhor
Amirkabir University
Bachelor of Science in Industrial Engineering, 2008
Shahid Beheshti University
Masters of Business Administration in Information Technology Management, 2011
December 2016
University of Arkansas
Dr. Rajiv Sabherwal
Dissertation Director
Dr. Paul Cronan
Committee Member
Dr. Varun Grover
Ex-officio Committee Member
Dr. Jon Johnson
Committee Member

2
Abstract
New information technology (IT) ventures are at the forefront of developing IT innovations.
In spite of their importance in the advancement of IT and the unique risks of survival that
distinguishes them from established firms, the organizational literature on IT has mostly
overlooked new IT ventures. Specifically, Big Data industry is a context where new IT ventures
actively change the landscape of IT innovations. However, less is known about the factors
influencing the economic success of Big Data ventures (BDVs), as well as the established firms
that invest in them. To shed light on these factors, three essays are designed and executed.
The first essay investigates the value proposition of a BDV‘s product/service as an important
constituent of its business model and seeks to understand how it affects the capital raised by
BDVs in their early stages of development. Then, the second essay is concerned with the role
that the network embeddedness of a BDV plays in its success. Building on the notion of socially-
constructed innovations, this essay examines the suitable network structures that help BDVs
succeed. Finally, the third essay focuses on a BDV‘s strategy in management of its
communication with the potential investors on social media platforms. In this essay, we extend
the previous literature that had highlighted the importance of the verbal content of
communication on social media platforms for a new venture‘s success and in turn focus on the
non-verbal aspects of communication in social media. Building on the notion of symbolic actions
to theorize about non-verbal communication, we focus on the sequence of message narrators in
social media and investigate the different tactics BDVs follow to raise capital.

3
Table of Contents
Chapter 1: Introduction ................................................................................................................... 1
A Three-Essay Research Approach .................................................................................... 2
References ........................................................................................................................... 6
Table 1. Overview of the Dissertation Essays .................................................................... 7
Chapter2: Big Data and Organizational Impacts: A Study of Investment in Big Data Ventures ... 8
Abstract ............................................................................................................................... 8
Introduction ......................................................................................................................... 9
Theoretical Development .................................................................................................. 13
Business Models ............................................................................................................ 13
Business Models and Performance ................................................................................... 14
A BDV‘s Business Model and Investing Firm‘s Market Performance ......................... 15
A BDV‘s Value Emphasis............................................................................................. 16
A BDV‘s Scope ............................................................................................................. 18
Environmental Uncertainty of the Investing Firm ........................................................ 20
Methods............................................................................................................................. 23
Measures ........................................................................................................................... 24
Value Emphasis ............................................................................................................. 24
Technological Scope ..................................................................................................... 26
Environmental Uncertainty ........................................................................................... 27
Market Return ............................................................................................................... 28
Controls ......................................................................................................................... 29
Model and Estimation ................................................................................................... 31
Results ............................................................................................................................... 32
Robustness Tests ............................................................................................................... 35
The Effect of Environmental Uncertainty ..................................................................... 36
Payoffs for the BDV ...................................................................................................... 37
Discussion ......................................................................................................................... 39
References ......................................................................................................................... 45
Tables of Chapter 2 ........................................................................................................... 50
Appendix A. Examples of Announcements about Investments in BDVs ........................ 56
Reported by Techcrunch, June 10, 2013: ...................................................................... 56
Reported by marketwatch.com, June 27, 2013: ............................................................ 57
Appendix B. Additional Analysis with Different Sets of Bi-grams ................................. 58

4
Chapter 3: Socially-Constructed Innovations in New IT Ventures ............................................. 59
Abstract ............................................................................................................................. 59
Introduction ....................................................................................................................... 61
Innovation and New Ventures .......................................................................................... 65
Theoretical Development .................................................................................................. 65
Theories of Social Embeddedness and Access to Financial Capital ............................. 66
Big Data Innovations and Intellectual Capital Networks .............................................. 69
Methods............................................................................................................................. 77
Obtaining Network Information .................................................................................... 78
Financial Capital Network ............................................................................................ 78
Networks Based on Personal Ties ............................................................................. 78
Networks Based on Investment ................................................................................. 79
Intellectual Capital Network ......................................................................................... 79
Educational Network ................................................................................................. 79
Professional Network ................................................................................................ 79
Measures ........................................................................................................................... 80
Controls ......................................................................................................................... 83
Analysis............................................................................................................................. 85
Sub-Sample Analysis: Technological Scope................................................................. 89
Comparison with non-IT Context ................................................................................. 91
Network Effects on Inception of Innovation ................................................................. 93
Discussion ......................................................................................................................... 95
Contributions ................................................................................................................. 96
Practical Implications .................................................................................................... 98
Limitations .................................................................................................................... 99
References ....................................................................................................................... 101
Tables of Chapter 3 ......................................................................................................... 107
Appendix A. Summary of the Research on New Ventures and Social Networks .......... 114
Appendix B. Correlation Matrix ..................................................................................... 115
Chapter 4: It is a Matter of Who Narrates the Lines ................................................................... 116
Abstract ........................................................................................................................... 116
Introduction ..................................................................................................................... 118
Theoretical Background .................................................................................................. 120
Impression Management ............................................................................................. 120

5
Legitimacy Strategies .................................................................................................. 121
Pursuing Normative Legitimacy in Social Media: Symbolic Communication ........... 123
Narrators in Symbolic Communication....................................................................... 125
Signaling Theory ......................................................................................................... 128
Theoretical Development ................................................................................................ 129
Radical vs. Incremental Innovations and Investor Uncertainties ................................ 129
Symbolic Actions: Radical vs. Incremental Innovations ............................................ 131
WoM as a Mediating Mechanism ............................................................................... 133
Methods........................................................................................................................... 134
Data ................................................................................................................................. 135
Measures ......................................................................................................................... 136
Quality of non-verbal symbolic communications ....................................................... 136
WoM............................................................................................................................ 138
Innovation strategy ...................................................................................................... 138
Raised capital .............................................................................................................. 139
Controls ....................................................................................................................... 140
Analysis........................................................................................................................... 141
Robustness Tests ............................................................................................................. 147
Alternative Ideal Sequences ........................................................................................ 147
Endogneity .................................................................................................................. 148
Volume of WoM ......................................................................................................... 149
Discussion ....................................................................................................................... 151
Contributions ............................................................................................................... 154
Managerial Implications .............................................................................................. 156
Limitations .................................................................................................................. 157
References ....................................................................................................................... 158
Tables of Chapter 4 ......................................................................................................... 164
Appendix A. Correlation Matrix ..................................................................................... 174
Appendix B. Illustrative Example of Social Media Promotion ...................................... 175
Appendix C. The Effect of Narrator Frequencies on Capital Raised ............................. 176
Chapter 5: Conclusions ............................................................................................................... 177
Chapter 2 (Essay 1) ......................................................................................................... 178
Chapter 3 (Essay 2) ......................................................................................................... 179
Chapter 4 (Essay 3) ......................................................................................................... 181

6
References ....................................................................................................................... 184

1
Chapter 1: Introduction
New IT ventures are at the forefront of developing information technology (IT) innovations,
some of which have transformed the way the modern society, as well as the modern economy,
function. For example, in the growing economy of Big Data, our preliminary examination of the
Big Data initiatives0F
1, pursued by established firms, shows a significant presence of investments
in new Big Data ventures (BDVs). uBiomeis one of these BDVs that has developed a platform
that utilizes the Big Data science to investigate human microbiomes and present the outcome of
its discoveries to healthcare and pharmaceutical companies. uBiome is among the first industry-
scale initiatives to understand human microbiomes through analyzing masses of data coming
from thousands of patients around the globe. It revolutionizes the way that the interrelations
among diseases, as well as the effectiveness of drugs, are understood.
New ventures face higher risks of survival compared to the bigger and more established
firms (MacMillan and Day 1987). Most notably, they face threats of newness and smallness
(e.g., Leung et al. 2006). Because of their unknown nature, or lack of a clear business history,
their access to financial capital is challenging (threat of newness). Also, because of their organic
organization (Covin and Slevin 1990) and extremely small size (Lu and Beamish 2006), they
often face a fierce competition from the competitors that usually benefit from economies of scale
(MacMillan and Day 1987).
In spite of their importance in advancement of ITand the unique risks of survival that
distinguishes them from established firms, the organizational literature on IT has overlooked new
IT ventures for the most part.We searched the Web of Science database to see if the keywords
―new venture‖ or ―startup‖ have been mentioned in AIS‘ basket-of-eight journals; the search in
1Out of 842 Big Data investments by businesses from 2009 to 2014 found in press news
(collected from Lexis/Nexis), 615 (73%) were investments in BDVs.

2
Web of Science returns only seven results (Janson et al. 1997; Leidner 1999; Siau 1999; Poon
2000; Winter and Gill 2001; Custodio et al. 2006; Laffey 2007), none of which appearin the top-
three journals of the field (MIS Quarterly, Information Systems Research, and Journal of
Management Information Systems). While one of the seven studies discusses the usefulness of e-
commerce togeneral startups (Poon 2000), the other six studies are examinations of new IT
venture single cases, which have mostly focused on the new technology introduced by the
venture, rather than investigating the venture‘s roadmap to success. Therefore, this dissertation
intends to investigate factors that affect the economic success of new IT ventures, and BDVs
specifically, as less understood organizational forms.
At an abstract level, we treat the question about the economic success of new IT ventures as
the overarching theoretical phenomenon of interest. We study this phenomenon in the Big Data
context as an important emerging area in which new IT ventures have a salient presence.
Specifically, we design and execute three essays that shed light on factors influencing the
economic success ofBDVs, as well as the established firms that invest in them. In the design of
the three essays, we expand our attention to the strategic aspects of success of new IT ventures
and the context-specific insights pertaining to BDVs. Below we briefly introduce each essay.
A Three-Essay Research Approach
The first essay (Chapter 2) investigates the value proposition of a BDV‘s product/service as
an important constituent of its business model and seeks to understand how it affects the capital
raised by BDVs in their early stages of development. In this study, we identify different
technological scopes prevalent in the Big Data context and discuss the value propositions that
best fit each scope. Moreover, we examine the value that BDVs generate for their well-

3
established investors. In doing so, we consider the environmental characteristics of the investing
firm as a factor that moderates the effect of a BDV‘s value proposition.
We assess a BDV‘s value proposition by investigating its verbal communication with the
potential investors, reflected in its product/service description statements. Moreover, we
complement our examination of a BDV‘s verbal communication by surveying the value
propositions communicated to the potential investors indirectly, mostly through third-party blog
posts, or news pieces about the BDV. This study uses a mixture of qualitative and quantitative
approaches and utilizes data crawled from a focal BDV‘s web pagesand archival
data.Specifically, a text-analytics approach is followed to make sense of value propositions
offered by a BDV, and an event study approach is used in examining the economic payoff of
investing in BDVs by established firms.
The second essay (Chapter 3) is concerned with the role that the network embeddedness of a
BDV plays in its success. The existing research on entrepreneurial success has emphasized the
effect of network embeddedness, especially in providing access to the investors. Nonetheless, the
role of embeddedness in development and refinement of innovation and its effect on a new
venture‘s success is understudied. Networks play a pertinent role in the development of a new
venture‘s innovation, especially if the product/service is developed in an industry where
innovation is socially-constructed. While regulation, patenting trends, and other social norms
may make developing an innovation possible within the boundaries of individual firms, we argue
that IT innovations, specifically in the area of Big Data, can be constructed socially. Building on
the notion of socially-constructed innovations, this essay examines the suitable network
structures that help BDVs succeed. Specifically, those networks supplying intellectual capital to
a BDV are studied along with those supplying access to financial capital.

4
Further, this essay conducts a comparison between the IT context, i.e., Big Data, and a non-
IT context, i.e., Medical Devices. The purpose of this comparison is to understand the potential
unique outcomes of network embeddedness for new IT ventures compared to their peers in other
industries.
A secondary focus in this essay is to simultaneously investigate the different types of
networks that new ventures are embedded inand investigate whether separating or aggregating
the ties from the different networks can better explain the economic benefits that the ventures
receive.
This quantitative study combines data gathered from the first study with the founders‘ and
investors‘ networks of affiliation to investigate the proposed research models. In conducting this
essay, networks of co-founders, employees, and investors are mapped and then transformed to
examine the inter-venture networks that supply a BDV with intellectual or financial capital. In
studying the network effects, the network structures are measured longitudinally, across each
round of fundraising for each BDV, and a panel of BDVs across rounds of fundraising are
examined. Further, a matched-sample methodology is used to conduct the comparison between
the models run in the Big Data and Medical Devices Industry, to ensure a fair comparison.
The third essay (Chapter 4) focuses on a BDV‘s strategy in management of its
communication with the potential investors on social media platforms. In this essay, we intend to
extend the previous literature that had highlighted the importance of the verbal content of
communication on social media platforms for a new venture‘s successand in turn focus on non-
verbal aspects of communication in social media. Building on the notion of symbolic actions to
theorize about non-verbal communication, we focus on the sequence of message narrators in
social media and investigate the different tactics BDVs follow to raise capital.

5
A second focus of this essay is on examining the extent to which non-verbal communication
tactics in one platform instigate reaction (in form of Word-of-mouth, WoM) in another platform.
Specifically, we discuss that the BDVs face an environment in which fundraising activities are
not limited to the macro-investors(e.g., angels and venture capitalists) and extend to micro-
investors in form of crowdfunding. Accordingly, social media activities extend beyond attracting
audiences in platforms which are designed for macro-investors and include communication with
micro-investors in more publicly accessible platforms. Since a new venture‘s activities in one
platform are visible to the audience in another, investigating cross-platform effects can inform
entrepreneurs about ways in which they can coordinate their social media efforts.
The third essay follows an inductive approach, where we utilize event-sequence analysis to
identify beneficial non-verbal communication tactics followed by BDVs in macro- and micro-
investor platforms. We then assess the effect that these tactics have on the raised capital and
examine the possible cross-platform effects in a longitudinal study. Similar to Essay 2, this
essay‘s quantitative analysis is conducted on a panel of BDVs followed in multiple rounds of
fundraising. Table 1 summarizes these three essays, in terms of their research question(s),
theoretical focus, and methodology.

6
References
Covin, J. G., and D. P. Slevin. 1990, "New Venture Strategic Posture, Structure, and
Performance: An Industry Life Cycle Analysis," Journal of Business Venturing (5:2), pp.
123-135.
Custodio, M., A. Thorogood, and P. Yetton. 2006, "24 X 7 @ Full Speed: Accelerated Time to
Market," Journal of Information Technology (21:2), JUN, pp. 116-126.
Janson, M., A. Brown, and T. Taillieu. 1997, "Colruyt: An Organization Committed to
Communication," Information Systems Journal (7:3), JUL, pp. 175-199.
Laffey, D. 2007, "The Ultimate Bluff: A Case Study of Partygaming.Com," Journal of
Information Technology (22:4), DEC, pp. 479-488.
Leidner, D. 1999, "Virtual Partnerships in Support of Electronic Commerce: The Case of TCIS,"
Journal of Strategic Information Systems (8:1), MAR, pp. 105-117.
Leung, A., J. Zhang, P. K. Wong, and M. Der Foo. 2006, "The use of Networks in Human
Resource Acquisition for Entrepreneurial Firms: Multiple ―fit‖ Considerations," Journal of
Business Venturing (21:5), pp. 664-686.
Lu, J. W., and P. W. Beamish. 2006, "Partnering Strategies and Performance of SMEs'
International Joint Ventures," Journal of Business Venturing (21:4), pp. 461-486.
MacMillan, I. C., and D. L. Day. 1987, "Corporate Ventures into Industrial Markets: Dynamics
of Aggressive Entry," Journal of Business Venturing (2:1), pp. 29-39.
Poon, S. 2000, "Business Environment and Internet Commerce Benefit - a Small Business
Perspective," European Journal of Information Systems (9:2), JUN, pp. 72-81.
Siau, K. 1999, "Xcert Software, Inc." Journal of Information Technology (14:3), SEP, pp. 235-
242.
Winter, S., and T. Gill. 2001, "OFFICETECH (R): A New Paradigm in Office Services?"
Journal of Information Technology (16:1), MAR, pp. 23-32.

7
Table 1. Overview of the Dissertation Essays
Essay 1 Essay 2 Essay 3
Research
Question(s)
1. How do a BDV‘s value
propositions affect its success?
2. How do the environmental
characteristics of an investing
firm interact with the BDV‘s
value propositions to affect the
success for investing firms?
1. How does the embeddedness of a
BDV in intellectual and financial
capital networks affect its success?
2. Are there any differences between
the social construction of IT
innovations and innovations
developed in other industries?
1. What are the prevalent
non-verbal
communication
strategies that BDVs
pursue?
2. Are there any cross-
platform effects for non-
verbal communication
strategies followed in
macro- and micro-
investor social media
platforms?
Theoretical Focus Business Models Social Networks Non-Verbal Symbolic
Communication
Methodology Qualitative (content analysis)/
Quantitative (event study)
Qualitative (content analysis)/
Quantitative (longitudinal panel, social
networks analysis)
Qualitative (content
analysis)/ Quantitative
(longitudinal panel, event
sequence analysis)
Data Crawled data from webpages
Archival
Crawled data from webpages
Crawled data from
webpages

8
Chapter2:
Big Data and Organizational Impacts: A Study of Investment in Big Data Ventures
Abstract
Due to their versatility, Big Data ventures (BDVs) have become a prevalent choice of
investment for conventional firms that perceive the risk of investment in Big Data technologies
to be high. However, less is known about how BDVs produce rent for their investing partners.
Utilizing a business model lens, this study proposes that the value emphasis and technological
scope of a BDV‘s business model interact to influence the market performance of the investing
firms. Further, we hypothesize that the environmental uncertainty of the investing firm is another
interacting factor, influencing the effect that the value emphasis has on the performance of
investing firms. Adopting an event-study approach, we test our hypotheses by forming a sample
of 651 public announcements about firms that have invested in BDVs from 2010 to 2013 and
found that a BDV‘s emphasizing tackling Big Data challenges (i.e., volume, velocity, variety,
and veracity) increases abnormal returns for the investing firm, although such benefits are
contingent on the technological scope of the BDV‘s innovation (i.e., Big Data security, analytics,
or Big Data infrastructure) and the investing firm‘s environmental dynamism, complexity, and
munificence.
Key words: Big Data venture, Big Data investment, business model, value emphasis,
technological scope, environmental uncertainty, event-study.

9
Introduction
In the ―Big Data‖ era, where the volume, velocity, and veracity of data available to
organizations exceeds the capacity of traditional data processing applications (Chen et al. 2012),
organizations strive to use new generations of technology to process fast-flowing information
and produce competitive intelligence. According to one report, 64 percent of US firms had
already invested or planned to invest in ―Big Data technologies‖ in 2013 (Gartner 2014). Big
Data technologies are directed at finding ways to effectively assimilate voluminous and fast-
flowing data into the day-to-day conduct of firms (Gartner 2014) and range from infrastructural
investments in new data processing platforms to advanced business intelligence and analytics
applications. In the Big Data era, groundbreaking technological advancements have changed the
nature of information technology (IT) investments, making their costs higher than what most
medium-sized firms can afford (Jacobs 2009). Moreover, risks associated with Big Data
investments are considered to be higher than with conventional IT investments (Chen et al.
2012). The high cost of Big Data investments (BDIs), coupled with their high risk, has resulted
in a growing mode of IT investment that is no longer internally driven.
In turn, start-ups pursuing Big Data ventures (BDVs) represent a prevalent organizational
form due to their versatility and risk-taking nature in design and development of Big Data
technologies. BDVs are considered to be an important way of involving larger firms in Big Data
Initiatives (BDIs). In fact, larger firms try to pursue BDIs through the proxy of BDVs, by
investing in their venture capital, or acquiring them. Gobble (2013, p. 65) describes the
emergence of BDVs:
―…A number of promising start-ups are offering new ways to collect, store and
analyze data; in 2011 and 2012 Wall Street Journal profiled several of these
companies in a series of blog posts.‖

10
Similarly, results of our preliminary study of publicly-announced BDIs in 2013 show that 73
percent of organizations‘ BDIs can be categorized as external investment in Big Data ventures
(BDVs).
Unlike conventional IT investments, investment in BDVs adds value through external
partnership with another firm, i.e., the start-up company owning the venture. Literature on the
value of IT in organizations has mainly focused on how IT as an internal production factor (e.g.,
Brynjolfsson and Hitt 2000), resource (e.g., Wade and Hulland 2004), or capability (e.g., Pavlou
and El Sawy 2006) enables organizations to compete with rivals and produce economic gain.
However, this literature informs us less about value addition through investments in IT ventures,
generally, and BDVs, specifically. Because of their external focus, value-adding mechanisms in
ventures are different from those mechanisms in conventional organizations (Zott and Amit
2007) and thusrequire more research to unfold.
Moreover, Big Data technologies change the data focus of organizations from within-
enterprise data (i.e., own suppliers, own firm, own customers) to outside-of-the-enterprise data
(i.e., potential suppliers, potential customers) (Chen et al. 2012). Due to their role in triggering
major changes in the architecture of data in firms, Big Data investments have become an
important area of interest within information systems (IS), with academia responding through
redefined research agendas (Kumar et al. 2013; Goes 2014). Recent IS literature has focused on
BDIs as the means to gain competitive advantage (Agarwal and Dhar 2014) and called for
research that transcends the professional speculations around BDIs (Chen et al. 2012) by
investigating their value-creation mechanisms (Agarwal and Dhar 2014) and impacts on
organizational practices (Goes 2014) and organizational strategies (Bharadwaj et al. 2013).

11
In spite of the prevalence and importance of Big Data for contemporary firms, and although
there have been calls for research on the economic payoffs of investment in Big Data (e.g., Goes
2014), this research is in infancy stages, and other than few exceptions (e.g., Tambe 2014), there
has not been much research on the topic. Specifically, and to the best of our knowledge, there has
been no empirical study that investigates investment in BDVsas a prevalent mode of investment
in Big Data. In summary, investment in BDVs presents two fresh challenges to the field of
information systems (IS): (a) it presents an external mode of investment in IT that differs from
the traditional in-house investments studied in the previous literature; and (b) it involves
investment in a type of technology that is distinctively different from the conventional IT and
can change the way that value is created by IT. To overcome these challenges, we intend to
address the following research question: “What strategic and environmental factors influence the
value of investments in BDVs?”
We adopt the lens of business models (BMs) to understand value-adding mechanisms of
BDVs for firms that invest in them. A BM ―elucidates how an organization is linked to external
stakeholders, and how it engages in economic exchanges with them to create value for all
exchange partners‖ (Amit and Zott 2001, p. 511). Recent IS studies have called for better
understanding of the value creation of IT through the lens of BM (e.g., Rai and Tang 2013,
Bharadwaj et al. 2013). Specifically, we view a BDV‘s BM as the way by which it presents its
innovation to the marketand draws a path to success for its investors. Since many BDVs are in
the initial phases of innovation inception, their BM can be the most tangible interface that can
predict their profitability for investing firms.1F
2
2Because of the novel nature of Big Data technologies most active BDVs are at the product
development stages and are still away from the organizational maturity at the initial public

12
Further and building on the resource-based view (RBV) in the IT context, we suggest that
the BDV‘s and the investing firm‘s industry influence the effect that a BDV‘s BM has on
performance of the investing firm. In hypothesizing about the role of the BDV‘s BM, as well as
the BDV‘s and the investing firm‘s environment, we suggest that a BDV‘s BM involves value
emphases on the ways in which the BDV‘s innovation helps an investing firm overcome any of
the Big Data challenges of volume, velocity, variety, or veracity of data. Then, we conceptualize
a BDV‘s environment as the technological scope (i.e., Big Data infrastructure, Big Data security,
Big Data analytics) at which the BDV‘s innovation operates. Finally, and following the previous
research (Miller and Friesen 1980; Newkirk and Lederer, 2006; Yayla and Hu 2012), we
conceptualize the investing firm‘s environment through three dimensions of dynamism,
complexity, and munificence. We hypothesize and test that the Big Data emphasis, the scope of a
BDV, and the investing firm‘s environmental uncertainty interact to generate value for the
investing firm. Despite being guided by the literature on business models in entrepreneurial firms
and RBV to identify potential factors explaining the value of BDVs for established firms, the
study takes an explorative approach in unfolding the way in which the identified factors affect
the value of BDVs. Specifically, this approach is plausible given the rather understudied nature
of the Big Data industry, as well as the economic ways in which IT start-ups create value for
their investors.
Given the pronounced importance of Big Data investments for firms (e.g., Agarwal and
Dhar 2014), we expect that an event study approach enables us to assess the profitability of
investments in BDVs by measuring the impact that public announcements about investments in
BDVs have on the investing firms‘ market value. Using a longitudinal study of 651 public
offering (IPO) stage. As a result, in absence of mature organizational structures, their business
model is one of the few signals they can send to the market about their success potentials.

13
announcements of investment in BDVs from 2010-2013, we find that the value of different
emphases on Big Data challenges is contingent onthe technological scope of the BDV‘s
innovation and the investing firm‘s environment. Further, our results shed light on the emerging
trends in Big Data markets and offeractionable implications for the managers of investing firms,
as well as for Big Data entrepreneurs.
Theoretical Development
Business Models
Business models of IS firms are viewed as mediums that explain how a technological
innovation results in business success (e.g., Al-Debei and Avison 2010). They provide a
narrative that explains how a technological product/service can gain traction in a marketand
achieve and maintain its competitive position (Pateli and Giaglis 2004). In spite of their appeal to
the organizational studies focusing on the success of IS-centric firms (Eriksson and Penker 2000,
Pouloudi et al. 2003, Vassilopoulou et al. 2003, Hedman and Kalling 2003, Klueber 2000),
limited consensus exists on the definition of business models. For example, Al-Debei and Avison
(2010) note that:
―To date, the BM concept is still considered an ill-defined buzzword. It is
suggested that the BM concept is ‗murky‘ at best. Some other researchers argue
that the concept is underdeveloped. In addition, the BM concept has sometimes
been misperceived as a substitute of corporate strategy, business process, or
business case.‖
The existing literature on business models has attempted to clarify the definition of business
models by identifying its components (e.g., Dubosson-Torbay et al. 2002, Pateli and Giaglis
2004, Al-Debei and Avison 2010). Among the most agreed-upon components, especially in the
early stages of development in entrepreneurial firms (Dubosson-Torbay et al. 2002), is value
emphasis (Amit and Zott 2001, Petrovic et al. 2001, Magretta 2002, Osterwalder et al. 2005).
Value emphasis explains the source of a product‘s/service‘s value creation for its

14
customers/users (Amit and Zott 2001). The extant empirical research on business models has
often surveyed business models by describing value emphasis (e.g., Bonaccorsi et al. 2006;
Susarla et al. 2009; Brynjolfsson et al. 2010; Demirkan et al. 2010; Casadesus-Masanell and
Llanes 2011; Casadesus-Masanell and Llanes 2011; Deodahr et al. 2012; VandeMeer et al. 2012;
Lin et al. 2012; Liu et al. 2014; Niculescu and Wu 2014).
Business Models and Performance
Performance of new ventures critically depends on their boundary-spanning arrangements
(Hite and Hesterly 2001). Among these boundary-spanning arrangements are their business
models where they promote themselves as attractive investments for potential investors. In fact, a
business model is considered an important pillar of new ventures because they need a convincing
logic and narrative in order to attract investorsand expand. Especially in early stages of their
existence, when the venture‘s service/product is not presented to customers at a large scale
(Hand 2007), a business model operates as one of the main measures for the market to evaluate
overall benefits of investment in the venture (Zott and Amit 2007). Since business models
explain how value is created for an external partner (e.g., an investing firm), assessing them can
explain payoffs for investing firms.
The existing literature on the effect of business models on firm performance suggests that
business models can be a source of competitive advantage (Markides and Charitou 2004;
Casadesus-Masanell and Ricart, 2010). Particularly, Zott et al. (2011, p.1029) note that more
novel and effective models can result in superior value-creation for stakeholders:
―The novelty presented by new, effective models can result in superior value
creation‖
As a result, by investing in BDVs with superior business models (that are new and effective), a
firm can gain competitive advantage over its rivals.

15
A BDV’s Business Model and Investing Firm’s Market Performance
Building on the general literature on business models and firm performance, we develop a
logic that explains how the value of investments in BDVs can be inferred by assessing the
BDV‘s business model. Business models present a narrative through broadcasting the value
emphasis of a venture. Value emphasis signals the way in which value is to be created for
stakeholders. However, the same value emphasis in one technological scope might not be as
novel in another. The technological scope of business models defines the context in which value
is created. In fact, the technological scope operates as an environment where the value emphasis
of a BM should be interpreted. Thus, in order to assess the value of BDV for an investing firm,
its value emphasis should be examined in the technological scope in which it is presented. If in a
given technological scope, the value emphasis of a BDV is novel and effective, then competitive
advantage, and thereby increased market returns, can be expected for the investing firm.
In addition to the technological scope, the environmental uncertainty of the investing firm
can also influence the effect of the focal BDV‘s value emphasis. Specifically, the resource-based
view in IT suggests that organizational uncertainty is a contingency factor that influences the
plausibility and attractiveness of resources and investments for organizations (Wade and Hulland
2004). Wade and Hulland (2004) contend (p. 126) that:
―The relationship between IS resources and firm performance is affected not only by
internal elements …, but also by environmental factors. These factors reflect the
uncertainty in an organization's operating environment. Drawing on the work of
Aldrich (1979), Child (1972), and Pfeffer and Salancik (1978), Dess and Beard (1984)
concluded that three dimensions of the environment contribute most to environmental
uncertainty and are thus most likely to consistently influence firm performance over
time: environmental dynamism, munificence, and complexity.‖
Thus, the performance payoffs of investment in BDVs, as an emerging mode of investment
in IS resources, can be affected by the three dimensions of environmental uncertainty, namely,
dynamism, complexity, and munificence. Overall, we suggest that the effect of a BDV‘s value

16
emphasis on the payoffs for the investing firm depends on the environment of the BDV, i.e., its
technological scope, and the environment of the investing firm. In the below section, we discuss
the value emphasis in BDVs, explain the prevalent technological scope in BD, and discuss the
relevance of environmental uncertainty to BD investments.
A BDV’s Value Emphasis
The existing literature offers a variety of lenses to think of the value emphasis dimension of
a business model in a BDV. For example, Amit and Zott (2001) suggest a typology that is
consisted of four value emphases, i.e., innovativeness, efficiency, complementarity, and lock-in.
Similarly, Zott and Amit (2007) focus on a combined pursuit of both efficiency and
innovativeness as another value emphasis. Nonetheless, the existing frameworks to model value
emphases of business models are too broad to fit the distinct nature of Big Data technologies and
innovations. In this study, we build on the existing literature on Big Data technologies and frame
value emphases of Big Data innovations around the specific purpose they are designed for.
There is almost a unanimous agreement that Big Data technologies create value, through
harnessing the volume, velocity, variety, veracity of data (Lee et al. 2014). The challenge of data
volume refers to the vast amount of data that is generated and is accessible for making sense of
(Chen et al. 2012). Not only is the massive size of data available to firms in Big Data era
challenging, the speed at which it flows also represents a threat. This is what the challenge of
velocity refers to (Jagadish et al. 2014). While these two challenges are the most discussed in the
Big Data literature (Lee et al. 2014), other challenges are also present. Specifically, data
available to contemporary firms can come in various formats (e.g., text, video, hypertext) and
from different sources (e.g., social media, competitors‘ webpages, etc.). This refers to the
challenge of data variety (Jagadish et al. 2014). Finally, data veracity, i.e., susceptibility of data

17
to correctness and accuracy (Normandeau 2013) is another challenge that Big Data technologies
must respond to. Building on these agreed-upon challenges and expectations from Big Data
technologies to overcome them, we suggest that a Big Data innovation by a BDV can propose to
create value for its investors by emphasizing any of the four areas of Big Data challenge.
Therefore, emphasizing the ability to tackle each of the 4Vs challenges signals a BDV‘s
proposed way of creating value for its stakeholders, and hence, its investors2F
3.
We define the volume emphasis of a BDV‘s innovation as the focus of the product on
collecting, updating, screening, maintaining, or analyzing large data sets. Further, we define the
velocity emphasis of a BDV‘s innovation as the focus of the product on timely collecting,
updating, screening, maintaining, or analyzing fast-flowing data. Moreover, the variety emphasis
of a BDV‘s innovation refers to the BDV‘s product focus on collecting, updating, screening,
maintaining, or analyzing data from various sources and in different formats. Finally, we define
the veracity emphasis of a BDV‘s innovation as the focus of the product on maintaining
accuracy, correctness, and integrity of data available to a firm. We note that we do not define
these areas of emphasis as mutually exclusive or collectively exhaustive. While a BDV can
choose to emphasize neither or only one of the areas, another can emphasize more than one area.
Since the purpose of Big Data technologies is widely believed to be addressing the 4Vs
challenges of Big Data (e.g., Lee et al. 2014), the effectiveness of a BDV‘s business model for an
investing firm can be determined by the way the BDV‘s innovation emphasizes resolving these
challenges. The more a BDV signals that its innovation is capable of resolving the challenges of
Big Data, the morethe likelihood of its ability to create competitive advantage for investing firms
3Even if the investing firm is not the end customer of the BDV‘s product/service, the investors
can gather economic benefits, i.e., through selling the product/service to end customers, and
such economic gains depend on the value emphasis of the BDV‘s product/service.

18
is. Thus, variability in market returns of investment in BDVs can be explained by the extent of a
BDV‘s business model emphasis on tackling the challenges of volume, velocity, variety, or
veracity. Hence, we hypothesize that:
H1a: The extent of a BDV‘s volume emphasis is positively associated with the
market returns for the investing firm following the announcement of investing
in the BDV.
H1b: The extent of a BDV‘s velocity emphasis is positively associated with the
market returns for the investing firm following the announcement of investing
in the BDV.
H1c: The extent of a BDV‘s variety emphasis is positively associated with the
market returns for the investing firm following the announcement of investing
in the BDV.
H1d: The extent of a BDV‘s veracity emphasis is positively associated with the
market returns for the investing firm following the announcement of investing
in the BDV.
A BDV’s Scope
Although the four value emphases mentioned above can all be regarded as important areas
of focus for Big Data innovations, the existing literature on Big Data suggests that there is no
agreement on the superiority of either of the emphases. Some experts suggest that some
emphases are superior to others (e.g., Normandeau (2013) believes that emphasis on veracity is
superior to other emphases), but mostly they regard the four areas of emphasis as equally
important for handling the Big Data challenges (e.g., Jagadish et al. 2014). We suggest that the
effectiveness of a BDV‘s value emphases is determined by the technological scope that its
innovation operates at.
In the context of BDVs, we define the technological scope as the main Big Data area that the
BDV‘s product/service is focused on. Big Data technologies cover diverse technological areas,
most distinctively, Big Data security (McAfee and Brynjolfsson 2012), analytics applications
(LaValle et al. 2013), and Big Data infrastructure (e.g., computing) (Jacobs 2009, McAfee and
Brynjolfsson 2012). The review of the existing literature on Big Data suggests that Big Data

19
technologies are also diverse in their architectural scope. While some Big Data technologies
(e.g., cloud-based computing structures (Grossman and Siegel 2014)) are at the infrastructural
level of IT architecture (see Weill and Vitale 2002 for a discussion of IT enterprise architecture),
some technologies target the analytics application layer (e.g., data modeling applications
(Grossman and Siegel 2014)). In addition to these more pronounced technological scopes, there
is a third technological scope for Big Data innovations that is concerned with the security
applications that protect large operations of the Big Data innovations belonging to the two other
technological scopes. The following schema3F
4 presents the architectural schema that ties these
three scopes together:
Figure 1- Architectural Relationship of Big Data Scopes
Jagadish et al. (2014) suggest a similar hierarchy for the Big Data operations that starts with data
acquisition, storage, and integration at the infrastructural layer and ends with modeling and
interpretation at the analytics application layer. They also mention the overarching role of Big
Data security technologies that protect the infrastructural and application layers from potential
data losses or breaches.
4This schema is adapted from Federal Deposit Insurance Corporation‘s (FDIC) enterprise
architecture framework (OIG, 2005).
20
Since different scopes of Big Data technologies differ in their architectural position, their
effectiveness can depend on different value emphases. For example, at the analytics scope,
handling (i.e., sense-making of) data in different formats might be more crucial than it is at the
infrastructural level where the data in different formats merely needs to be stored and integrated.
As a result, a high variety emphasis in an analytics innovation might be more valuable than a
high variety emphasis in an infrastructural one. Thus, we expect that the market returns on
different Big Data value emphases varies across different technological scopes. Thereby, we
hypothesize that:
H2a: The positive association between the extent of a BDV‘s volume emphasis
and market returns for the investing firm following the announcement of
investing in the BDV is moderated by the scope of BDV‘s innovation.
H2b: The positive association between the extent of a BDV‘s velocity emphasis
and market returns for the investing firm following the announcement of
investing in the BDV is moderated by the scope of BDV‘s innovation.
H2c: The positive association between the extent of a BDV‘s variety emphasis
and market returns for the investing firm following the announcement of
investing in the BDV is moderated by the scope of BDV‘s innovation.
H2d: The positive association between the extent of a BDV‘s veracity emphasis
and market returns for the investing firm following the announcement of
investing in the BDV is moderated by the scope of BDV‘s innovation.
Environmental Uncertainty of the Investing Firm
In addition to the characteristics of a BDV, i.e., its value emphasis and technological scope,
the characteristics of the investing firm can also influence the payoffs for the investing firm.
What is a lucrative investment for one firm might not be as beneficial for the other (Venkatraman
and Prescott 1990). While internal characteristics can be important, the effect of the external
environment of a firm is more salient with relation to BD investments. This is because Big
Datatechnologies change the data focus of organizations from within-enterprise data (i.e., own
suppliers, own firm, own customers) to outside-of-the-enterprise data (i.e., potential suppliers,
potential customers) (Chen et al. 2012). The out-side-of-the enterprise data depends on the

21
external environment of an organization. For example, the volume of data incoming for
analytical purposes can directly depend on the number of competitors, the type of customers,
number of products produced, etc. Further, velocity of incoming data can depend on the extent of
dynamism in the environment. As an industry becomes more turbulent, the half-life of
information decreases, requiring a firm increase the frequency of data-gathering. The resource-
based view in IT suggests that environmental uncertainty, i.e., the extent of challenge and
unpredictability in environment (Aldrich 1979; Child 1972; Pfeffer and Salancik 1978; Dess and
Beard 1984), influences the payoffs IT investment create. Specifically, three dimensions of
environmental uncertainty, dynamism, complexity, and munificence are highlighted.
Environmental dynamism is viewed as ―the rate and unpredictability of environmental
change‖ (Newkirk and Lederer 2006, p, 394). It represents the instability of the environment,
which challenges managers to quickly and frequently adopt new strategies and tactics (Yayla and
Hu 2012). Among the four BD value emphases, velocity is the most relevant to the dynamism
aspect. As the extent of environmental dynamism increases, the half-life of external data for an
organization decreases. In a vibrant environment, incoming data can lose its relevance faster,
requiring an organization to increase the frequency at which it surveys, collects, and analyzes
relevant data. As the frequency of collecting, storing, and analyzing incoming data increases,
technologies with a value emphasis on velocity might be deemed more appropriable for firms in
dynamic environments. Although we test for the interaction of all four value emphasis with the
investing firm‘s environmental dynamism, we hypothesize, a priori, that:
H3: The positive association between the extent of a BDV‘s velocity emphasis
and market returns for the investing firm following the announcement of
investing in the BDV is moderated by the environmental dynamism of the
investing firm.

22
Environmental complexity refers to ―the heterogeneity and range of an industry and/or an
organization‘s activities‖ (Wade and Hulland 2004, p. 127). Environmental complexity makes it
difficult for managers to comprehend the drivers of performance (Newkirk and Lederer 2006).
As the drivers of performance become more and more ambiguous for managers, the
organizational need for accessing data starts to change. Ambiguity regarding success might be
resolved through two paths. First, as the industry becomes more heterogeneous, the incoming
data should match such heterogeneity. Therefore, BD investments that help access to a broader
variety of data become more relevant and important. Aside from the emphasis on variety,
emphasis on veracity can also help organizations facing a high degree of complexity. Due to the
ambiguous nature of success and the need to access data from various sources, some of which
might be of unknown nature, technologies with emphasis on data veracity can also be beneficial.
As a firm increases its span of search for incoming data, authenticating information becomes
more important. Although we test for the interaction of all four value emphases with the
investing firm‘s environmental complexity, we hypothesize, a priori, that:
H4a: The positive association between the extent of a BDV‘s variety emphasis
and market returns for the investing firm following the announcement of
investing in the BDV is moderated by the environmental complexity of the
investing firm.
H4b: The positive association between the extent of a BDV‘s veracity emphasis
and market returns for the investing firm following the announcement of
investing in the BDV is moderated by the environmental complexity of the
investing firm.
Environmental munificence refers to the extent to which the firm‘s environment supports
sustained growth (Dess and Beard 1984; Wade and Hulland 2004). Mature or shrinking
environments generally have a low level of munificence, whereas rapidly growing markets are
usually associated with a high level of munificence. In environments marked by low
munificence, or hostile environments, stiff competition is usually present and adversely affects

23
the accomplishment of organizational goals (Toole 1994). By contrast, munificent environments
are more forgiving in natureand support organizational performance and growth despite
inappropriate firm strategies (Wade and Hulland 2004). All four Big Data value emphases can
become more beneficial as the environment of a firm becomes more hostile (i.e., less
munificent). More hostile environments require more scanning of the environment and therefore
access to more incoming data (volume), in greater frequency (velocity) and variety, with a
greater need for data authenticity (veracity) as use of unauthenticated data can be more
punishing. Therefore, we hypothesize:
H5a: The positive association between the extent of a BDV‘s volume emphasis
and market returns for the investing firm following the announcement of
investing in the BDV is moderated by the environmental munificence of the
investing firm.
H5b: The positive association between the extent of a BDV‘s velocity emphasis
and market returns for the investing firm following the announcement of
investing in the BDV is moderated by the environmental munificence of the
investing firm.
H5c: The positive association between the extent of a BDV‘s variety emphasis
and market returns for the investing firm following the announcement of
investing in the BDV is moderated by the environmental munificence of the
investing firm.
H5d: The positive association between the extent of a BDV‘s veracity emphasis
and market returns for the investing firm following the announcement of
investing in the BDV is moderated by the environmental munificence of the
investing firm.
Methods
This research utilizes an event study approach. We define an event as the public
announcement of a firm to invest in a BDV. The sample was formed by searching for related
events from January 1st, 2010 to December 31
st, 2013. An online search was conducted through
the services of Lexis-Nexis by searching for public announcements made at all news sources
available at Lexis-Nexis, containing the terms: (1) Big Data, and (2) investment, invest,
acquiring, or acquire, and (3) venture, new venture, or start-up. The search resulted in 3,239

24
related news pieces. Upon further refinement of this set, 1393 news pieces were identified as the
ones that a firm has invested in a BDV. These related news articles were then further refined by
excluding announcements where: (1) there was a confounding announcement related to the firm
(e.g., major earnings, change in top executives, mergers, etc.) in a window of five days before
and after the BDV announcement, (2) there was more than one investment in a BDV in a 300-
day period prior to the announcement, (3) the firm was non-US, not-for-profit, or sub-division of
a bigger firm, or (4) the firm was not publicly traded, or the study‘s organizational controls were
not available. This process resulted in a set of 651 public announcements in our final set5.
Figure 2- Research Model
Measures
Value Emphasis
In order to determine the volume, velocity, variety, and veracity emphases of a BDV‘s
business model, we conducted a text analysis of the product description section of the BDV‘s
webpage. We believe a BDV‘s value emphases can be unfolded in the product description
section of the BDV‘s webpage because that section is the medium through which the product is
5Appendix A includes an illustrative example of an announcement.

25
introduced and its potential superiorities to competing products is explained. The webpage
associated with the BDV was crawled using the hyperlinks embedded in each announcement‘s
news pieces6. In cases where the hyperlink to the BDV‘s webpage was not embedded in the
announcement‘s news piece, a manual search was conducted to find the webpage. The text-
mining module of R (tm) was used to analyze the product description section of each BDV‘s
website. In order to do so, first, a set of words associated with each of the four areas of emphasis
was compiled using the existing literature on Big Data technologies. We searched Google
Scholar for 2010-2103 articles that contained terms: (1) Big Data, and (2) volume, velocity,
variety, or veracity. Over 1300 articles were identified, and the HTML version of these articles
were combined to form a corpus.
This corpus was text-mined to extract sentences that did not include any of the words
volume, velocity, variety, or veracity, with the exception of sentences that were adjacent to the
sentences containing these words. Then, the sentences containing the 4Vs and their adjacent
sentences were analyzed to form a network of bigrams4F
7 (i.e., combination of two words) that are
closely associated with handling the 4Vs. For example, the bigrams ―accelerated computing‖,
―fast response‖, and ―real time‖ had the highest frequency of occurring when the word ―velocity‖
was discussed in the corpus of articles. Also, the bigrams ―large size‖, ―massive data‖, and ―large
calculations‖ were among the most used adjacent words to ―volume‖. Further, the bigrams
―multimedia data‖, ―different formats‖, ―non-textual data‖, and ―unstructured data‖ were used
adjacent to the word ―variety.‖ Finally, ―data authentication‖, ―data cleansing‖, and ―data
verification‖ were adjacent to the word ―veracity‖. The adjacent bigrams were then processed to
6Only descriptions with a time stamp prior to the announcement were used in the analysis. 7We use bigrams instead of single words, because combination of two words more accurately
point to a concept, as opposed monograms (i.e., single words) (e.g., Faraj et al. 2015).

26
eliminate the ones that are irrelevant to the concepts of 4Vs8. Then, a library of refined bigrams
for each of the 4Vs were used to analyze the product description section of each BDV in the
sample. For each of the four emphases, we calculated the frequency of its associated bigrams in
the product description corpus of text. Then, we obtained the ratio of associated bigrams to the
total number of bigrams in the text as the measure of each of the 4 emphases. For example, if the
product description of a BDV contains 2 bigrams associated with ―volume‖ and the text contains
200 meaningful bigrams in total, then the value of the volume emphasis is 0.01 (=2/200).
Technological Scope
We used the product description section part of a BDV‘s webpage to determine the
technological scope at which it operates. We searched the description for the words ―analytics‖
and ―intelligence‖ to categorize the BDV‘s innovation in the scope of analytics. If the words
―security‖ or ―cyber-security‖ were used in the description, the innovation was categorized in the
security scope, and descriptions with the words ―infrastructure‖, ―cloud‖, ―computing‖, and
―grid‖ were categorized in the infrastructure scope. Out of 651 BDVs in the sample, our analysis
resulted in identification of 427 BDVs with a clear categorization (the searched words were used
in the description and the BDV could not be categorized in two or more scopes). The rest of the
224 BDV descriptions were manually read and categorized into the three scopes of Big Data
technologies. To ensure the validity of manually categorized ventures, a sub-set of BDVs which
8We retained only bi-grams that appeared in at least 10% of the relevant articles. Appendix B
presents the results of the main model where the bi-grams appearing in 5% and 20% of the
relevant articles are considered. Although these bi-grams were used in academic articles
adjacent to the 4Vs concepts, we asked a panel of four tenured Management Information
Systems professors from a public school in mid-west US to evaluate (very good, good, fair,
poor) the correspondence of each bi-gram to the concept it describes (i.e., volume, velocity,
variety, or veracity). Rater agreed in their rating of 63 (85%) of the big-grams. Out of the 74
bi-grams, eight did not pass Obermiller and Spangeberg‘s (1998) threshold of having at least
three raters evaluating the bi-gram very good and no poor evaluation. Model B3 in Appendix
B presents the results of the model with these words dropped from the calculations of the 4Vs.

27
had a presence in AngelList.com a crowd-funding service were selected (149 out of 224).
AngelList reports the technological scope tag of the registered BDVs (i.e., if the BDV is active in
the area of analytics, Big Data infrastructure, or Big Data security). We compared the reported
tags of those 149 BDVs with our manual categorizations. It resulted in 138 matched cases,
showing a reliability of 92.6%.
Inclusion of technological scopes as a co-variate along with the value emphases poses a
potential threat. That is, BDVs in certain scopes may emphasize certain aspects of Big Data
challenges more than the others. If that is correct, a BDV‘s value emphases may be correlated
with its technological scope, hence making the estimates of value emphases endogenous. To test
for such potential threat, we compared the means of each value emphasis across the three scopes
of Big Data in our sample. The analysis of variance (ANOVA)9 for difference of the value
emphases across the three scopes fails to reject the null hypothesis about that assumes the scope
of a BDV does not influence its emphasis on tackling the 4Vs of Big Data (Velocity: F-statistic=
0.617, p-value = 0.540; Variety: F-statistic= 0.861, p-value = 0.423; Volume: F-statistic= 1.294,
p-value = 0.275; Veracity: F-statistic= 2.599, p-value = 0.075).
Environmental Uncertainty
The three dimensions of environmental uncertainty are measured using prior measures and
COMPUSTAT data. Following the prior literature (Keats and Hitt 1988; Xue et al. 2011), we
measure environmental dynamism by quantifying the volatility of industry sales. For each firm,
the natural log of total sales of four-digit SIC industry to which a firm belongs is regressed
against an index variable of years, for a period of five years [t, t-4], and the antilog of the
standard error of the regression coefficient is used to measure sales volatility as a proxy of a
9For each of the value emphases (e.g., emphasis on volume) we compared the mean score across
the three scopes of analytics, security and infrastructure.

28
firm‘s environmental dynamism. We measure environmental complexity using the reciprocal of
industry concentration. This is consistent with the logic that firms situated in industries with
fewer competitors (i.e., more concentration) is embedded in less complex environment where the
competitors and their likely actions are well known. Specifically, following Xue et al. (2011), the
log value of the reciprocal of the Herfindahl index of the market shares of the top four firms in
that industry (i.e., the sum of the squares of the market shares of the four firms with the highest
sales in that industry) is used to measure environmental complexity. Following prior literature
(Keats and Hitt 1988; Xue et al. 2011), environmental munificence is measured based on
growth in industry‘s sales. To do so, the natural log of total sales of four-digit SIC industry to
which a firm belongs is regressed against an index variable of years, for a period of five years [t,
t-4]. The antilog of the regression coefficient is then used to measure munificence.
Market Return
Following the existing literature on event studies (e.g., Chatterjee et al. 2001; Xu and Zhang
2013), we use cumulative abnormal return (CAR) as a measure of market returns to investments
in BDVs. CAR measures unexpected market returns in a window of time around an
announcement when the news release of the investment is supposed to be followed by a market
reaction. When CAR is positive, it reflects that the announcement has been met with a positive
reaction in the market and thereby the market returns exceed the expectation. A zero CAR shows
indifference in the market with regards to the announcement, and a negative CAR shows a
negative reaction from the market. To calculate the normal returns, we first calculate the market
model which is:
Ri, t = αi + βi * Rm, t + ϵi, t
Where Ri, t is return on stock i in day t, and Rm, t is the return on market portfolio on day t.
αi and βi are regression estimates for firm i and ϵi, tis the error term for the regression. The market

29
portfolio is calculated using equally-weighted CRSP index for the main analysis, and value-
weighted index is used in a robustness check. Following the previous literature (e.g., Sabherwal
and Sabherwal 2007; Chatterjee et al. 2001), the market model was estimated using a 255-day
window starting from 300 days before the announcement to 46 days before it. The normal return
was calculated by αi + βi* Rm, tusing the coefficient estimates of the market model. Then
abnormal return (AR) was calculated as:
ARi, t= Ri, t - (αi + βi* Rm, t)
This abnormal return was then cumulated over a 3-day window (i.e. one day before the day of
announcement, and one day after announcement [-1, +1]). Since it is possible that market reacts
in a wider span of time to the announcement, we also calculate CAR in a 5-day (i.e., [-2, +2])
window for further robustness checks.
Controls
We controlled for the fixed effect of industry of the investing firm by including an industry
dummy generated from 2-digit SIC code associated with the firm. Moreover, to account for the
effect of possible time trends, we created a variable called time that accounts for the number of
days between January 1st, 2010 and the date of the announcement. Further, we control for the
firm size by using the natural log of total assets ($) of the investing firm, collected form
COMPUSTAT. Finally, we account for the intensity of the investment made by creating a
variable called investment value that uses the natural log of the value ($) of the investment
made in each announcement.
Further, during the data collection, we noticed that while some investments in BDVs are
made in the form of a partnership where the investing firm contributes to the seed funding of a
BDV, some investments are made to acquire the BDV. Since acquiring a BDV has distinct
difference in governance and transfer of risks and benefits of the BDV to the investing firm, it is

30
plausible to assume that CAR for acquiring firms can be different from the rest of the sample.
Therefore, we created an ―Acquired‖ dummy (1 if the investing firm acquired the BDV; 0
otherwise) to control for potential effects.
Moreover, while some investing firms become the end-users of the BDV for their core
activities, whereas some may utilize the BDV‘s product/services for operational purposes. For
example, a banking corporation might invest in a BDV active in detecting credit-card breaches.
In such an example, the product/service of the BDV aligns with the main activity of the investing
firm. On the contrary, a retailing company might invest in a BDV that offers an analytical
visualization service. In this example, the BDV‘s product/service is used for enhancing internal
operations of the investing firm. Therefore, the relevance of a BDV‘s product/service to an
investing firm may affect the way that the market evaluates such investments. Hence, we created
a ―main‖ dummy (1 if the investing firm uses the BDV‘s product/service for its main activity; 0
otherwise) to control this effect. Each BDV reports the industry of end-users through a secondary
tag in its AngelList page. We compared the industry of a BDV‘s end-user to the industry of the
investing firm. In case of a match, we assume that the BDV‘s product/service is used to perform
a main activity in the investing firm.
Finally, although we control for the time trends in our model, it can be argued that
occurrence of a specific economic or technological event in a certain year, if not accounted for,
can bias the coefficient estimates. To overcome this threat, we followed the suggestions of
Greene (2011) and controlled for each year‘s fixed effect by including year dummies (2010 was
the reference year) in the estimation model.

31
Model and Estimation
In order to test for our first set of hypotheses (H1) we first formed a direct effect model with
CAR of announcement i as the dependent variable and the four value emphases, i.e., volume,
velocity, variety, and veracity, along with the BDV‘s scope dummies, analytics and security (we
use the Infrastructure scope as the reference group) as the independent variables, while
controlling for the controls mentioned above:
CARi = α0 + Controls + β1 * (Velocity) + β2 * (Variety) + β3 * (Volume) + β4 *
(Veracity) + β5 * (Analytics) + β6 * (Security) + ϵi
We estimate this model using an ordinary-least-squares (OLS) estimation. However, since there
are instances of a firm investing in more than one announcement, we estimate robust variance of
coefficients by allowing the error terms of investments made by the same firm be correlated.
Then, to test the second set of hypotheses (H2) we first follow an interaction approach and run
the following estimation, while mean-centering the emphases variable (continuous variables)
following the suggestions of (Cohen et al. 2013).
CARi = α0 + Controls+ β1 * (Velocity) + β2 * (Variety) + β3 * (Volume) + β4 *
(Veracity) + β5 * (Analytics) + β6 * (Security) + β7 * (Velocity) * (Analytics) + β8
* (Variety) * (Analytics) + β9 * (Volume) * (Analytics) + β10 * (Veracity) *
(Analytics) + β11 * (Velocity) * (Security) + β12 * (Variety) * (Security) + β13 *
(Volume) * (Security) + β14 * (Veracity) * (Security) + ϵi
As an alternative approach, we also run a split-sample analysis where we compare the below
model across the three scopes of analytics, security and infrastructure:
CARi = α0 + Controls + β1 * (Velocity) + β2 * (Variety) + β3 * (Volume) + β4 *
(Veracity) + ϵi
In order to test for hypotheses 3-5, the following model will be tested10
:
10The environmental variables, dynamism, complexity, and munificence are measured in the
same year as the announcement. The measures of emphasizing 4Vs are collected from the
product descriptions posted prior to the announcement and in the same year.

32
CARi = α0+ Controls + β1 * (Velocity) + β2 * (Variety) + β3 * (Volume) + β4 *
(Veracity) + β5 * (Analytics) + β6 * (Security) + β7 * (Velocity) * (Analytics) + β8
* (Variety) * (Analytics) + β9 * (Volume) * (Analytics) + β10 * (Veracity) *
(Analytics) + β11 * (Velocity) * (Security) + β12 * (Variety) * (Security) + β13 *
(Volume) * (Security) + β14 * (Veracity) * (Security) + β15 * (Velocity) *
(Dynamism) + β16 * (Variety) * (Dynamism) + β17 * (Volume) * (Dynamism) +
β18 * (Veracity) * (Dynamism) + β19 * (Velocity) * (Complexity) + β20 * (Variety)
* (Complexity) + β21 * (Volume) * (Complexity) + β22 * (Veracity) *
(Complexity) + β23 * (Velocity) * (Munificence) + β24 * (Variety) *
(Munificence) + β25 * (Volume) * (Munificence) + β26 * (Veracity) *
(Munificence) + ϵi
Results
Table 1 provides a summary of descriptive statistics. Our sample shows that the average
value of investment in BDVs is around 0.02% of the firm‘s annual sales. Also, on average,
investing in a BDV results in a 0.31% cumulative abnormal return, while this number can be as
low as -17.4% and as large as over 16.5%. The average size of an investing firm‘s total assets in
our sample is slightly over $18 billion, with largest investing firm in the sample showing an asset
endowment as large as $62.9 billion. Table 2 reports the results of our full-sample and sub-
sample analysis. Model 1 in Table 2 reports our direct effect model where we find that the
investment value has a positive and significant effect on CAR (P<0.001). This means that the
size of abnormal returns increase as firms increase the intensity of their investment in a BDV.
This results suggest that in spite of described cautions about Big Data investments and their
associated risks (e.g., Jacobs 2009; Lazer et al. 2014), the market reacts positively to a firm‘s
decision for sizable investments in BDVs.
Moreover, Model 1 suggests a positive and significant effect of firm size on CAR (P<0.01).
This means that a larger firm‘s investment in BDVs is met with more positive reaction in the
market. Also, the positive and significant sign of the Analytics scope (P<0.05) and Security
scope (P<0.01) dummies suggest that investment in these two scopes is perceived more
beneficial than investment in Big Data infrastructures. Further, the non-significance of the Time

33
dummy suggests that the market reactions to investments in BDVs do not change over time, at
least when the full sample is considered. Finally, the results point to positive and significant
effects of a Volume (p<0.01), Velocity (p<0.01), Veracity (p<0.05), and Variety (p<0.05)
emphasis in a BDV‘s business model. This suggests that the market positively reacts to focus of
a BDV on either of the Big Data 4Vs and that, explication of such focus in product description of
a BDV positively affects their perceived value in the market, supporting H1a-d.
---Insert Tables 1 and 2 here---
Model 2 in Table 2 tests for the moderating effect of a BDV‘s technological scope on the
impact of its value emphases. The positive and significant coefficient estimate for the interaction
between the Analytics dummy and Variety (p<0.001) (supporting H2c) or Veracity (P<0.01)
(supporting H2d) emphasis suggests that a focus on overcoming variety or veracity issues of Big
Data is more beneficial for analytics innovations than it is for Big Data infrastructure. Moreover,
the positive and significant estimate of the coefficient for the interaction between the Security
and Veracity emphasis (p<0.001) (supporting H2d) suggests that a focus on tackling the veracity
of Big Data is perceived more beneficial for Big Data innovations in the scope of security
compared to infrastructure. Also, the non-significance of interaction coefficients between
Analytics or Security, and the emphasis on Volume or Velocity suggests that an emphasis on the
volume and velocity of Big Data is regarded as equally beneficial across the three scopes of Big
Data innovations.
In order to gain a better understanding about the market returns of emphasizing the 4Vs, and
given the apparent heterogeneity across the three Big Data scopes, we continue our analysis by
dividing the samples into three sub-samples. Model 3 reports the analysis of our data for
announcements that are made on a BDV active in the scope of security. Similar to the full-

34
sample analysis, both investment value and firm size positively and significantly affect CAR,
while no apparent change in the market return over time is traceable. Also, an emphasis on
volume, velocity, or veracity shows a positive and significant effect, however, an emphasis on
variety does not increase CAR in the security scope. On the other hand, Model 4 that reports the
results for the sub-sample of announcements in the infrastructure scope shows a negative and
significant effect of the Time dummy (p<0.05) suggesting that from 2010 onwards the perceived
value of Big Data infrastructure in the market has been decreasing. Also, Model 4 indicates that
only an emphasis on volume or velocity positively and significantly affects CAR, whereas there
is no support for the effect of emphasis on variety or veracity in the infrastructural scope of BDV
innovations. Finally, Model 5 shows the estimation of the model for the subsample of
announcements that are made on BDVs active in the analytics scope. Contrary to the
infrastructural scope, the positive and significant effect of the Time dummy (p<0.05) suggests
that over time, market returns to investment in analytics innovations have improved. Moreover,
the results of analysis in this subsample suggests that an emphasis on any of the 4Vs in the
analytics scope is associated with higher CAR.
To shed more light on the observed market-return trends, we plotted the number of
investments made in each scope (Figure 3a), as well as the average CAR (Figure 3a) from 2010
to 2013. These plots further corroborate the trends revealed in Models 3-5. The plots show that
the popularity and market returns on BDVs active in the security scope have remained steady
across the four years of the study, whereas the popularity and market returns of BDVs active in
infrastructure and analytics have followed contrasting patterns. While BDVs in analytics scope
have seen a raise in popularity and value, those in the infrastructure scope have endured a slight

35
drop. These results further indicate the heterogeneity of patterns across the different
technological scopes of Big Data innovations.
Figure 3a- Number of Announcements per
Scope
Figure 3b- Average CAR per Scope
Robustness Tests
In order to make sure the results are robust to variations in measurement of constructs and
selected control variables, we conducted a series of robustness checks. Table 3 reports the results
of these first sets of analysis. First, we cumulated abnormal returns over a 5-day period (i.e., [-2,
+2]) instead of a three day (i.e., [-1, +1]) period (Models 6-8). Then, instead of using an equally-
weighted index of CRSP in calculating the market returns, we used a value-weighted index.
Models 9-11 report the results with CARs calculated based on the value-weighted index for
estimating market returns. Further, Models 12-14 report the sub-sample analysis models for an
alternative measure of emphasis on the 4Vs. In these models, instead of measuring the BDV‘s
emphasis on the 4Vs through assessing the product descriptions posted on the BDV‘s website,
we analyzed third-party‘s blog reports on the BDV‘s product. For doing so, a blog covering the
30
35
40
45
50
55
60
65
70
75
80
2010 2011 2012 2013
Num
ber
of A
nnou
ncem
ents
Security Infrastructure Analytics
0.10%
0.15%
0.20%
0.25%
0.30%
0.35%
0.40%
2010 2011 2012 2013
Ave
rage
CA
R
Security Infrastructure Analytics

36
BDV‘s innovation was identified through a Lexis-Nexis search5F
11 and then, the blog‘s description
of the product was analyzed in the same manner to obtain the extent of the BDV‘s emphasis on
any of the 4Vs. We did so, because there might be doubts regarding the accuracy of claims made
by a BDV on its website. Evaluating the product‘s emphases through a third-party report can
reduce the concern that self-presentation of the product might involve exaggerations that affect
the accuracy of our measures. The results of models presented in Table 3 qualitatively converge
with the results of Models 3-5, providing evidence for robustness of our findings to variations in
measurement of key constructs.
---Insert Table 3 here---
The Effect of Environmental Uncertainty
We also tested for the moderating effect of environmental uncertainty, while keeping the
interactions of technological scope and value emphasis in the model. Table 4 summarizes the
results when the interaction of value emphasis and environmental uncertainty variables are
included. Model 15 presents the results of a direct effect model, whereas Model 16 reports the
results with the interaction terms included. Consistent with H3, a positive and significant
interaction between Dynamism and emphasis on Velocity is observed (p < 0.001). Also, the
findings suggest that interaction of other value emphases with Dynamism is insignificant.
Moreover, consistent with H4a and H4b, both Variety (p < 0.001) and Veracity (p < 0.01) show
significant and positive interaction with Complexity, while the interactions of Velocity and
Volume with Complexity are insignificant. Finally, Velocity (p < 0.05), Variety (p < 0.01),
Volume (p < 0.001), and Veracity (p < 0.05) emphases show a negative and significant
11In cases where more than one blog covered a report describing the BDV‘s product, we selected
the blog post with more words, because of its higher potential for reflecting on the value
emphases of the product.

37
interaction with Munificence, consistent with H5a-H5d. Models 17-19 report the results when: a
5-day window, value-weighted measure of CAR, and alternative measures of 4Vs based on blog
posts (instead of the product/service description written by the BDV) are considered in
estimations. These models present results that qualitatively converge with findings in Model 16.
---Insert Table 4 Here---
Payoffs for the BDV
While the role of value of emphasis and technology scope in creating value for the investing
firm is investigated, we complement our analysis by finding out if the two factors can benefit the
BDV itself. Raised capital is viewed as an early financial success indicator for new ventures in
early stages. We investigate if the value emphases of a BDV contribute to its success in raising
capital. Also, we test if such an effect is moderated by the technological scope of the innovation.
To do so, we focus on BDVs active in AngelList.com, and track their raised capital in each round
of fundraising. This analysis focuses on 2,026 BDV-round observations, belonging to 529 unique
BDVs. On average, each BDV had raised a total of $4.62 million, had 12.42 employees, and
24.58% of them were ultimately acquired by a larger firm. For each round, the value emphasis
on each of the Big Data 4Vs is calculated similar to the previous section, however, the corpus of
text analyzed to determine each emphasis is limited to the content generated within each round.
Raised capital and dates indicating the beginning and ending of each fundraising round is
crawled from AngelList.com. For each BDV, the technological scope is evaluated similar to the
previous section.
Additionally, we control for the stage of development where the funding is raised. We do so
because early and late stages of fundraising are different in terms of funding providers, as well
funds needed. To best capture the effect of fundraising stage, for each stage of development (e.g.,

38
seeding, stage A) we specify a variable, where the value of variable indicates number of
fundraising rounds a new venture has completed in that stage prior to the current round.
Therefore, for BDVs in their first round of fundraising, the value of seeding, stage A, stage B,
and stage B variables is all set at 0. If a venture has had two rounds of fundraising at the seeding
stage, and the current round is its second round at stage A, the value of seeding variable is set at
2, the value of stage A variable is set at 1, and the value of stage B and stage C variables are set
at 0.
Also, we control for the number years since a BDV has been established because the time
elapsed since establishment of a venture can have an effect on resources it can access, both
financially and intellectually. We control for the location dummy, measured at the city level, and
whether or not the venture identifies itself as a business-to-business or business-to-customer
(identified by tags reported in AngelList.com). Moreover, number of employees 6F
12 (including co-
founders) in the fundraising period of interest, and average of employees (including co-founders)
value of education7F
13 are controlled for. Table 5 presents the results for the effect of emphasis on
BD 4Vs in the full sample (Model 20), as well as in the sub-samples representing each
technological scope (Models 21-23).
---Insert Table 5 here---
The results mainly converge with those pertaining to payoffs for the investing firm,
suggesting that BDVs which are focused on infrastructural technologies see an increase in their
raised capital when they emphasize the aspects of Volume and Velocity, whereas for BDVs
12
AngelList reports the date of employment and departure of employees. This data was used to
calculate number of employees employed in each fundraising period. 13
The LinkedIn account of each employee was accessed to obtain educational background of
employees. The highest degree obtained by each individual was then coded (high school
diploma=1, associate degree= 2, undergraduate degree= 3, master‘s degree= 4, doctorate= 5)
and averaged for each BDV.

39
active in the scope of security, emphasizing Veracity is also beneficial. Finally, BDVs active in
the scope of analytics benefit from emphasizing all 4V aspects of Big Data. Together, the results
suggest that BDVs benefit from the value emphasis of Big Data 4Vs in the same fashion that the
investing firms do.
Discussion
Motivated by the rather unknown factors that influence the economic success of investment
in Big Data innovations, this study has focused on a prevalent mode of investment, i.e.,
investment in BDVs. While there has been a void in studying general investments in new IT
ventures, the issue is more amplified in the context of Big Data given the understudied nature of
Big Data technologies. Investment in BDVs as a way of organizational investment in Big Data
has emerged as a phenomenon of interest for the IS field. Following an event-study approach,
this paper has focused on the role of the BDV‘s business model as the driver of market returns
for investing firms. Specifically, we focus on the value emphasis component of a BDV‘s
business model. Given the purpose of Big Data innovations in solving the challenges of 4Vs (i.e.,
velocity, volume, variety, and veracity), we proposed a framework to make sense of a BDV‘s
value emphasis by considering its focus on overcoming the 4Vs challenges. In other words, we
contend that BDVs propose creating value for their investors through addressing the 4V
challenges of Big Data. Moreover, building on the existing literature on Big Data (e.g., Jagadish
et al. 2014), we suggested that Big Data innovations can be heterogeneous in terms of the
effectiveness or novelty of emphasis on 4Vs. As a result, we hypothesized that some areas of
emphasis may not be met with increased market returns in certain scopes.
We took a longitudinal approach to study investments in BDVs from 2010 to 2013.
Focusing on investments made by publicly-traded firms, we found that, in general, as a BDV

40
increases its emphasis on overcoming any of the 4V challenges, the market returns for its
investors increase. Nonetheless, our results point to a heterogeneity in the value of these 4 areas
of emphasis. Across the three technological scopes of Big Data, an emphasis on overcoming the
issues of volume or velocity of data proves beneficial consistently. However, an emphasis on
overcoming the issue of data veracity only becomes important for Big Data security or analytics
innovations. Also, an emphasis on overcoming the issue of data variety meets abnormal market
returns only in the scope of analytics. Although the existing literature on Big Data points to the
4Vs in a flat manner, where the four issues are almost regarded equivalently, our findings point
to a heterogeneity in the value of the four areas of emphasis. This heterogeneity matches our
proposed hierarchy of Big Data technological scopes. That is, parallel to the architectural
hierarchy of Big Data technologies, there exists a hierarchy of challenges.
Figure 4 depicts the hierarchy of challenges along with the architectural hierarchy of Big
Data technologies presented earlier. As it can be seen, at the infrastructural layer, emphasis on
harnessing the volume and velocity of data is vital. Moving up the pyramid, veracity becomes
important when fast-responding security algorithms also require detection of anomaly in data and
verifying sources of the data (e.g., LaValle et al. 2013) to function well. Finally, at the analytics
application layer, handling massive loads of data on the fly, along with the capability to leaving
out unreliable data, is important, but also, utilizing and sense-making of data that comes in
various formats becomes of paramount value. We note that our proposed hierarchy of emphasis
does not suggest that overcoming the issues of veracity or variety of data are not needed at all at
the infrastructural layer of architecture. For example, if Big Data structures are not capable of
collecting and storing data in various formats and form different sources, they cannot deliver on

41
their promise. Rather, the hierarchy means that not all of the areas of emphasis are of the same
importance or ability to create competitive advantage for investing firms.
Figure 4- Architectural Hierarchy of Big Data Emphases and Scopes
In addition to the moderating role of the technological scope, we recognized that the
environmental uncertainty of the investing firm also influences the effect of value emphases.
Specifically, we find that for firms active in the dynamic environment, investing in BDVs that
emphasize the velocity aspect of Big Data becomes more beneficial, whereas for firms active in a
complex environment, investing in BDVs that focus on variety and veracity is met with more
payoffs. Finally, we found that firms that are active in more hostile environments obtain benefits
from an emphasis on either of the 4V aspects of Big Data.
The findings of this study should be seen in the light of its limitations. First and foremost,
our study has focused on publicly-traded firms and thereby our insights are limited to only a
subset of firms that engage in making investments in BDVs. Because of their relatively larger
size, competition dynamics and performance implications can be different for publicly-traded
firms compared to the smaller or privately-owned organizations. Moreover, market-based
measures of performance, such as CAR, are limited in considering insiders‘ insight and foresight
(e.g., Sabherwal and Sabherwal 2007) about the investment. However, given the recentness of

42
the investments in our sample (2010-2013) and the fact that the investments are made in
innovations that are at the early stages of development, productivity measures of firm
performance cannot be much informing either. We suggest that future research can examine the
productivity of these investments once enough time has elapsed to observe and measure
performance effects of these investments more directly. Also, due to the secondary nature of our
data, our measures of value emphases are limited to insights that can be gathered from product
descriptions announced by the BDV. Product descriptions written by BDVs may be biased.
Although we have made efforts to triangulate our findings by assessing these emphases from
third-party reports, a BDV‘s emphases on addressing 4Vs of Big Data could be measured with
more objective alternatives. Finally, our data is limited to identify the mechanisms through
which product/services of a BDV are utilized by investing firm. While some firms may utilize a
BDV‘s product/service to enhance their core competencies, others might utilize it for more
peripheral purposes such as maintenance and security. Our findings should be interpreted while
considering the heterogeneous uses of BDV products which this study could not account for.
In spite of its limitations, this study has theoretical contributions to the field of IS. First,
this study extends the current literature on the business value of IT investments by offering a lens
to assess the value of investments made on new ventures. Specifically, this study extends the use
of a business model lens to studying the value of investment in IT ventures. Moreover, unlike the
prevalent unilateral focus on the value emphasis portion of a business model (e.g., Brynjolfsson
et al. 2010; Lin et al. 2012), this study highlights the importance of considering the technological
scope of an innovation in explaining the value-adding mechanisms of business models. Second,
this study provides a more nuanced view of the 4V challenges of Big Data and incorporates them
in a framework to make sense of the relationship between overcoming these challenges and

43
making competitive advantage for a firm. This study shows that emphasizing these four areas of
challenge can make firms competitive, although the effects of these emphases is contingent upon
the nature (i.e., scope) of the innovation. Thereby, the findings of this study suggest that the
competitive value of overcoming each of the 4Vs depends on the technological scope in which
an organization needs to invest. Third, by showing a general positive CAR as a result of
investment in BDVs, this study sheds light on the discussions regarding the risky nature of Big
Data investments (e.g., Jacobs 2009; Lazer et al. 2014). This study provides evidence that in
spite of the existing risks, firms benefit by engaging in Big Data innovations, especially when
these investments are made in the form of funding new ventures.
In addition to its theoretical contributions, this study provides some practical implications.
The findings of this study inform the organizational decision-makers by providing them with a
framework to assess the likely value of investing in BDVs. Table 6 presents our contingency
framework for investors where depending on the scope of their investment, they can evaluate the
promise of a BDV by assessing its emphasis on overcoming the relevant issues of volume,
velocity, variety, or veracity. Specifically, our results suggest that investing mangers can assess
the value emphases of BDVs either by reviewing the product description offered by the BDV
itself, or by reviewing reports about the BDV in blogsphere. Moreover, our findings suggest that
larger firms, as well as those that make bigger investments in BDVs, can expect more market
payoffs from their investments.
Finally, our results suggest that investing firms must evaluate the value emphases of a BDV
with regards to the industrial uncertainty they face. Our findings indicate that firms in hostile
environments can gain more benefits from an increased emphasis on either of the 4V aspects of
Big Data. Moreover, our results suggest that firms in dynamic environments can increase their
44
gains by investing in BDVs that emphasize overcoming the issues of handling high velocity of
data, whereas, those in complex environments must direct their investments into BDVs that
emphasize the aspects of variety and veracity. Also, our findings suggest that investors can
increase their returns by acquiring BDVs instead of providing a limited investment without
further integration of the BDV into their organization. Finally, our findings can inform Big Data
entrepreneurs and founders of new BDVs, by suggesting that their market attractiveness can
increase if they explicate their emphases in overcoming the 4V challenges of Big Data. Our
results show that product descriptions of a Big Data innovation, operates as a medium to
communicate the product‘s value-generating emphasis. Therefore, we encourage BDV founders
to better explicate the value of their innovation by highlighting the role it plays in controlling the
volume, velocity, variety, or veracity of Big Data.

45
References
Afuah, A., and C. L. Tucci. 2000. Internet Business Models and Strategies: Text and Cases,
McGraw-Hill Higher Education.
Agarwal, R., and V. Dhar. 2014, "Editorial—Big Data, Data Science, and Analytics: The
Opportunity and Challenge for IS Research," Information Systems Research (25:3), pp. 443-
448.
Aldrich, H. E. 1979. Organizations and Environments, Prentice Hall, Englewood Cliffs, NJ.
Al-Debei, M. M., and D. Avison. 2010, "Developing a Unified Framework of the Business
Model Concept," European Journal of Information Systems (19:3), pp. 359-376.
Amit, R., and C. Zott. 2001, "Value Creation in e‐business," Strategic Management Journal
(22:6‐7), pp. 493-520.
Bharadwaj, A., O. A. El Sawy, P. A. Pavlou, and N. Venkatraman. 2013, "Digital Business
Strategy: Toward a Next Generation of Insights," MIS Quarterly (37:2), pp. 471-482.
Bonaccorsi, A., S. Giannangeli, and C. Rossi. 2006, "Entry Strategies Under Competing
Standards: Hybrid Business Models in the Open Source Software Industry," Management
Science (52:7), pp. 1085-1098.
Brynjolfsson, E., and L. M. Hitt. 2000, "Beyond Computation: Information Technology,
Organizational Transformation and Business Performance," The Journal of Economic
Perspectives (14:4), pp. 23-48.
Brynjolfsson, E., P. Hofmann, and J. Jordan. 2010, "Cloud Computing and Electricity: Beyond
the Utility Model," Communications of the ACM (53:5), pp. 32-34.
Casadesus-Masanell, R., and G. Llanes. 2011, "Mixed Source," Management Science (57:7), pp.
1212-1230.
Casadesus-Masanell, R., and J. E. Ricart. 2010, "From Strategy to Business Models and Onto
Tactics," Long Range Planning (43:2), pp. 195-215.
Chatterjee, D., V. J. Richardson, and R. W. Zmud. 2001, "Examining the Shareholder Wealth
Effects of Announcements of Newly Created CIO Positions," MIS Quarterly (25:1), pp. 43-
70.
Chen, H., R. H. L. Chiang, and V. C. Storey. 2012, "Business Intelligence and Analytics: From
Big Data to Big Impact," MIS Quarterly (36:4), pp. 1165-1188.
Child, J. 1972, "Organizational Structure, Environment and Performance: The Role of Strategic
Choice," Sociology (1), pp. 2-22.

46
Cohen, J., P. Cohen, S. G. West, and L. S. Aiken. 2013. Applied Multiple regression/correlation
Analysis for the Behavioral Sciences, Routledge.
Demirkan, H., and D. Delen. 2013, "Leveraging the Capabilities of Service-Oriented Decision
Support Systems: Putting Analytics and Big Data in Cloud," Decision Support Systems
(55:1), pp. 412-421.
Deodhar, S. J., K. Saxena, R. K. Gupta, and M. Ruohonen. 2012, "Strategies for Software-Based
Hybrid Business Models," The Journal of Strategic Information Systems (21:4), pp. 274-
294.
Dess, G., and Beard, D. 1984, "Dimensions of Organizational Task Environments,"
Administrative Science Quarterly (29), pp. 52-73.
Dubosson‐Torbay, M., A. Osterwalder, and Y. Pigneur. 2002, "E‐business Model Design,
Classification, and Measurements," Thunderbird International Business Review (44:1), pp.
5-23.
Eriksson, H., and M. Penker. 2000, "Business Modeling with UML," Business Patterns at Work,
John Wiley & Sons, New York, USA.
Gartner. 2014, http://www.gartner.com/newsroom/id/2848718.
Gobble, M. M. 2013, "Big Data: The Next Big Thing in Innovation," Research-Technology
Management (56:1), pp. 64.
Goes, P. B. 2014, "Editor's Comments: Big Data and IS Research," MIS Quarterly (38:3), pp. iii-
viii.
Greene, William H. 2011. Econometric Analysis, 7th edition. Upper Saddle River, NJ: Prentice-
Hall.
Grossman, R. L., and K. P. Siegel. 2014, "Organizational Models for Big Data and Analytics,"
Journal of Organization Design (3:1), pp. 20-25.
Hamel, G. 2002. Leading the Revolution: How to Thrive in Turbulent Times by Making
Innovation a Way of Life, Harvard Business School Press Boston.
Hand, J. R. 2007, "Determinants of the Round-to-Round Returns to Pre-IPO Venture Capital
Investments in US Biotechnology Companies," Journal of Business Venturing (22:1), pp. 1-
28.
Hedman, J., and T. Kalling. 2003, "The business model concept: theoretical underpinnings and
empirical illustrations," European Journal of Information Systems (12:1), pp. 49-59.
Hite, J. M., and W. S. Hesterly. 2001, "The Evolution of Firm Networks: From Emergence to
Early Growth of the Firm," Strategic Management Journal (22:3), pp. 275-286.

47
Jacobs, A. 2009, "The Pathologies of Big Data," Communications of the ACM (52:8), pp. 36-44.
Jagadish, H., J. Gehrke, A. Labrinidis, Y. Papakonstantinou, J. M. Patel, R. Ramakrishnan, and
C. Shahabi. 2014, "Big Data and its Technical Challenges," Communications of the ACM
(57:7), pp. 86-94.
Keats, B. W., and Hitt, M. A. 1988, ―A Causal Model of Linkages among Environmental
Dimensions, Macro Organizational Characteristics, and Performance,‖ Academy of
Management Journal (31:3), pp. 570-598.
Klueber, R. 2000, "Business Model Design and Implementation for services," In Proceedings of
Americas Conference on Information Systems, Long Beach, CA, 2000.
Kumar, A., F. Niu, and C. Ré. 2013, "Hazy: Making it Easier to Build and Maintain Big-Data
Analytics," Communications of the ACM (56:3), pp. 40-49.
LaValle, S., E. Lesser, R. Shockley, M. S. Hopkins, and N. Kruschwitz. 2013, "Big Data,
Analytics and the Path from Insights to Value," MIT Sloan Management Review (52), pp.
20-32.
Lazer, D., R. Kennedy, G. King, and A. Vespignani. 2014, "The Parable of Google Flu: Traps in
Big Data Analysis," Science (343:14 March).
Lee, Y., S. Madnick, R. Wang, F. Wang, and H. Zhang. 2014, "A Cubic Framework for the
Chief Data Officer: Succeeding in a World of Big Data," MIS Quarterly Executive (13:1),
pp. 1-13.
Lin, M., X. Ke, and A. B. Whinston. 2012, "Vertical Differentiation and a Comparison of Online
Advertising Models," Journal of Management Information Systems (29:1), pp. 195-236.
Liu, C. Z., Y. A. Au, and H. S. Choi. 2014, "Effects of Freemium Strategy in the Mobile App
Market: An Empirical Study of Google Play," Journal of Management Information Systems
(31:3), pp. 326-354.
McAfee, A., and E. Brynjolfsson. 2012, "Big Data: The Management Revolution," Harvard
Business Review (90:10), Oct, pp. 60-6, 68, 128.
Magretta, J. 2002, "Why Business Models Matter," Harvard Business School Publishing
Corporation.
Markides, C., and C. D. Charitou. 2004, "Competing with Dual Business Models: A
Contingency Approach," The Academy of Management Executive (18:3), pp. 22-36.
Miller, D., and Friesen, P. 1980, ―Archetypes of Organizational Transition,‖ Administrative
Science Quarterly (25:2), pp. 268-299.

48
Newkirk, H. E., and A. L. Lederer. 2006, "The Effectiveness of Strategic Information Systems
Planning Under Environmental Uncertainty," Information & Management (43:4), pp. 481-
501.
Niculescu, M. F., and D. Wu. 2014, "Economics of Free Under Perpetual Licensing:
Implications for the Software Industry," Information Systems Research (25:1), pp. 173-199.
Normandeau, K. 2013, "Beyond Volume, Variety and Velocity is the Issue of Big Data
Veracity," Inside Big Data.
Obermiller, C., and E. R. Spangenberg. 1998, "Development of a Scale to Measure Consumer
Skepticism toward Advertising," Journal of Consumer Psychology (7:2), pp. 159-186.
OIG. 2005, "Implementation of E-Government Principles," https://www.fdicig.gov/reports05/05-
018-508.shtml.
Osterwalder, A., Y. Pigneur, and C. L. Tucci. 2005, "Clarifying Business Models: Origins,
Present, and Future of the Concept," Communications of the Association for Information
Systems (16:1), pp. 1.
Pateli, A. G., and G. M. Giaglis. 2004, "A Research Framework for Analysing eBusiness
Models," European Journal of Information Systems (13:4), pp. 302-314.
Pavlou, P. A., and O. A. El Sawy. 2006, "From IT Leveraging Competence to Competitive
Advantage in Turbulent Environments: The Case of New Product Development,"
Information Systems Research (17:3), pp. 198-227.
Petrovic, O., C. Kittl, and R. D. Teksten. 2001, "Developing Business Models for Ebusiness,"
Available at SSRN 1658505.
Pfeffer, J., and Salancik, G. 1978. The External Control of Organizations: A Resource
Dependence Perspective, Harper and Row, New York.
Pouloudi, A., K. Vassilopoulou, and X. Ziouvelou. 2003, "A societal perspective on E-Business
adoption," Journal of Information, Communication and Ethics in Society (1:3), pp. 149-165.
Rai, A., and X. Tang. 2013, "Research Commentary-Information Technology-Enabled Business
Models: A Conceptual Framework and a Coevolution Perspective for Future Research,"
Information Systems Research (25:1), pp. 1-14.
Sabherwal, R., and S. Sabherwal. 2007, "How do Knowledge Management Announcements
Affect Firm Value? A Study of Firms Pursuing Different Business Strategies," Engineering
Management, IEEE Transactions on (54:3), pp. 409-422.
Susarla, A., A. Barua, and A. B. Whinston. 2009, "A Transaction Cost Perspective of the"
Software as a Service" Business Model," Journal of Management Information Systems
(26:2), pp. 205-240.

49
Tambe, P. 2014, "Big Data Investment, Skills, and Firm Value," Management Science (60:6), pp.
1452-1469.
VanderMeer, D., K. Dutta, and A. Datta. 2012, "A Cost-Based Database Request Distribution
Technique for Online E-Commerce Applications," MIS Quarterly (36:2), pp. 479-507.
Vassilopoulou K., X. Ziouvelou, A. Pateli, and N. Pouloudi. 2003 "Examining e-Business
models: Applying a Holistic Approach in the Mobile Environment," In Proceedings of 11th
European Conference on Information Systems (ECIS) - Naples, June 16-21, 2003.
Venkatraman, N., and J. E. Prescott. 1990, "Environment‐strategy Coalignment: An Empirical
Test of its Performance Implications," Strategic Management Journal (11:1), pp. 1-23.
Wade, M., and J. Hulland. 2004, "Review: The Resource-Based View and Information Systems
Research: Review, Extension, and Suggestions for Future Research," MIS Quarterly (28:1),
pp. 107-142.
Weill, P., and M. Vitale. 2002, "What IT Infrastructure Capabilities are Needed to Implement e-
Business Models," MIS Quarterly Executive (1:1), pp. 17-34.
Xu, S. X., and X. M. Zhang. 2013, "Impact of Wikipedia on Market Information Environment:
Evidence on Management Disclosure and Investor Reaction," MIS Quarterly (37:4), pp.
1043-1068.
Xue, L., G. Ray, and B. Gu. 2011, "Environmental Uncertainty and IT Infrastructure
Governance: A Curvilinear Relationship," Information Systems Research (22:2), pp. 389-
399.
Yayla, A. A., and Hu, Q. 2012, ―The Impact of IT-Business Strategic Alignment on Firm
Performance in a Developing Country Setting: Exploring Moderating Roles of
Environmental Uncertainty and Strategic Orientation,‖ European Journal of Information
Systems (21:4), pp. 373-387.
Zott, C., and R. Amit. 2007, "Business Model Design and the Performance of Entrepreneurial
Firms," Organization Science (18:2), pp. 181-199.
Zott, C., R. Amit, and L. Massa. 2011, "The Business Model: Recent Developments and Future
Research," Journal of Management (37:4), pp. 1019-1042.

50
Tables of Chapter 2
Table 1- Descriptive Statistics
Avg. Min Max S.D. 1 2 3 4 5 6 7
1 CAR 0.31% -17.42% 16.53% 5.82%
2 Velocity (% in text) 0.21% 0.04% 0.38% 0.04% 0.21**
3 Variety (% in text) 0.19% 0.03% 0.31% 0.05% 0.18* 0.09
4 Volume (% in text) 0.26% 0.05% 0.42% 0.08% 0.23** 0.09* 0.08#
5 Veracity (% in text) 0.15% 0.02% 0.29% 0.06% 0.27** 0.09#
0.06 0.08#
6 Dynamism 1.26 0.32 0.05 2.08 -0.08 0.07#
0.02 0.05 0.06
7 Complexity 0.31 0.22 0.03 0.74 -0.04 0.03 0.10* 0.04 0.02 0.10*
8 Munificence 0.86 0.37 0.12 0.92 0.04 -0.07#
-0.09*
-0.11*
-
0.08#
-0.08
-
0.06 # p < 0.10, * p < 0.05, ** p < 0.01, *** p< 0.001; N= 651.

51
Table 2- CAR [-1, +1] - Equally Weighted
Full Sample Analysis Sub-Sample Analysis
Model 1 Model 2 Model 3 Model 4 Model 5
Security Infrastructure Analytics
Investment Value
(normalized by org
sales) 0.326*** 0.318*** 0.306*** 0.322*** 0.332***
Firm Size (total
assets) 0.082** 0.076*** 0.079*** 0.063** 0.059**
Time 0.012 0.011 0.009 -0.011* 0.014*
Velocity 0.036** 0.039** 0.036** 0.028** 0.018*
Variety 0.014* 0.018* 0.004 -0.003 0.054***
Volume 0.042** 0.051** 0.026** 0.049*** 0.024**
Veracity 0.027* 0.022* 0.054*** 0.008 0.042**
Analytics 0.018* 0.016*
Security 0.031** 0.028**
Analytics*Velocity 0.009
Analytics*Variety 0.078***
Analytics*Volume -0.008
Analytics*Veracity 0.064**
Security*Velocity 0.011
Security*Variety 0.002
Security*Volume -0.007
Security*Veracity 0.081***
N 651 651 231 184 236
Adjusted R2 (%) 12.4 13.6 11.3 11.7 12.8
∆ R2 (%) 1.2***
Industry, year, acquired, and main dummies are included but the dummy coefficients are not
reported for brevity; * p < 0.05, ** p < 0.01, *** p< 0.001; Robust standard errors are
estimated by clustering errors around firm dummies. There is at least a 300-day distance
between announcements of the same firm.

52
Table 3- Robustness Analyses: Alternative Measures for Core Constructs
CAR [-2, +2]- Equally Weighted CAR [-1, +1]- Value Weighted Alt. Measures of 4Vs Emphasis
Model 6 Model 7 Model 8 Model 9 Model 10 Model 11 Model 12 Model 13 Model 14
Security Infra. Analytics Security Infra. Analytics Security Infra. Analytics
Investment Value
(normalized by org
sales) 0.321*** 0.313*** 0.304*** 0.284*** 0.292*** 0.318*** 0.305*** 0.344*** 0.279***
Firm Size (total
assets) 0.062*** 0.051** 0.073** 0.077*** 0.082*** 0.062* 0.064*** 0.076** 0.075**
Time 0.004 -0.013* 0.010* -0.003 -0.011* 0.015* -0.0043 -0.019* 0.013*
Velocity 0.029** 0.023** 0.023* 0.030* 0.032* 0.017* 0.022* 0.021* 0.025*
Variety -0.007 0.005 0.062*** 0.012 0.009 0.039* -0.006 -0.008 0.016*
Volume 0.033** 0.066** 0.017* 0.042** 0.072*** 0.041** 0.051** 0.064** 0.029*
Veracity 0.062*** 0.013 0.031* 0.068*** -0.004 0.052*** 0.074** 0.008 0.043**
N 231 184 236 231 184 236 214 168 199
Adjusted R2 (%) 12.1 11.4 11.2 10.1 10.6 11.7 11.2 13.7 9.6
Industry, year, acquired, and main dummies are included but the dummy coefficients are not reported for brevity; * p < 0.05, ** p <
0.01, *** p< 0.001; Robust standard errors are estimated by clustering errors around firm dummies. There is at least a 300-day
distance between announcements of the same firm.

53
Table 4- Full Models
Direct Interaction [-2, +2] Value-
Weighted
Alt. Measures of
4Vs
DV= CAR Model 15 Model 16 Model 17 Model 18 Model 19
Velocity 0.093** 0.082** 0.068** 0.073** 0.059*
Variety 0.082** 0.064** 0.086* 0.092*** 0.041*
Volume 0.078** 0.053** 0.088** 0.067* 0.091**
Veracity 0.096** 0.032** 0.077* 0.082** 0.093*
Analytics 0.031* 0.026* 0.028* 0.031** 0.056*
Security 0.044* 0.037** 0.071 0.080* 0.029
Dynamism 0.133*** 0.112*** 0.159*** 0.121** 0.134***
Complexity 0.102* 0.093** 0.084** 0.058* 0.091***
Munificence -0.070* -0.067* -0.021 -0.029#
0.042**
Analytics*Velocity 0.005 0.002 0.003 -0.001 0.008
Analytics*Variety 0.048** 0.053* 0.039* 0.044** 0.052*
Analytics*Volume 0.011 0.009 0.003 0.000 0.002
Analytics*Veracity 0.073* 0.089*** 0.071* 0.066** 0.069*
Security*Velocity 0.003 0.012 0.009 0.011 0.010
Security*Variety 0.008 0.010 0.005 0.002 0.002
Security*Volume 0.001 0.002 -0.006 0.003 0.006
Security*Veracity 0.088** 0.094* 0.102*** 0.038# 0.057*
Dynamism * Velocity 0.173*** 0.184*** 0.122*** 0.083**
Dynamism * Variety 0.018 0.010 0.009 0.004
Dynamism * Volume 0.009 0.011 0.012 0.005
Dynamism * Veracity 0.011 0.004 0.004 -0.006
Complexity * Velocity 0.013 0.012 0.007 0.003
Complexity * Variety 0.125*** 0.092*** 0.111*** 0.098***
Complexity * Volume 0.018 0.012 0.014 0.009
Complexity * Veracity 0.093** 0.172*** 0.048* 0.069**
Munificence * Velocity -0.065* -0.070* -0.057** -0.061*
Munificence * Variety -0.082** -0.088** -0.091* -0.073**
Munificence * Volume -0.116*** -0.131*** -0.109** -0.094**
Munificence * Veracity -0.049* -0.081* -0.042* -0.033*
N 651 651 651 651 651
Adjusted R2 (%) 13.6 16.3 18.2 16.8 15.8
∆ R2 (%)
2.7***
Industry, year, acquired, and main dummies are included but the dummy coefficients are not
reported for brevity; * p < 0.05, ** p < 0.01, *** p< 0.001; Robust standard errors are
estimated by clustering errors around firm dummies. There is at least a 300-day distance
between announcements of the same firm.

54
Table 5- Payoffs for the BDV
Full Sample Security Analytics Computing
Model 20 Model 21 Model 22 Model 23
DV= Raised Capital
Velocity 0.115*** 0.152*** 0.119*** 0.128***
Variety 0.183** 0.032 0.203*** 0.027
Volume 0.064** 0.078** 0.033* 0.068*
Veracity 0.218*** 0.321*** 0.256*** 0.012
Analytics 0.022*
Security 0.038*
Number of employees 0.052* 0.063** 0.049* 0.081*
Education of co-
founders
0.093** 0.231** 0.117** 0.198***
Years established -0.011 -0.009 -0.012 -0.01
Funding round count 0.116*** 0.125*** 0.142*** 0.133***
Acquired 0.204*** 0.354*** 0.242*** 0.198***
B2B 0.005 0.007 -0.004 0.003
N 2026 714 868 444
Adjusted R2 (%) 0.19 0.24 0.21 0.18
Coefficients of dummies representing the secondary scope of the BDV, location, funding series
(i.e., no stage, seed, A, B, C), and BDV’s year of establishment are not reported for brevity;
* p < 0.05, ** p < 0.01, *** p< 0.001;
Robust standard errors are estimated by clustering errors around start-up dummies.

55
Table 6- Importance of Big Data Emphasis in Different Scopes
Velocity Variety Volume Veracity
Security
Infrastructure
Analytics

56
Appendix A. Examples of Announcements about Investments in BDVs
Reported by Techcrunch, June 10, 2013:
Walmart, via its Silicon Valley innovation lab @WalmartLabs, has made another acquisition
today, continuing its shopping spree. The company is announcing that predictive intelligence
startup Inkiru will be joining Walmart Labs to accelerate the retail giant‘s analytics capabilities.
Financial terms of the deal were not disclosed.
Inkiru‘s platform is an active learning system that combines predictive intelligence, data
analytics and a decision engine to influence and determine customer interactions. Benefits to
using Inkiru include being able to reduce fraud, improve customer segmentation and targeting,
and more.
In a post announcing the acquisition, Walmart Labs writes that Inkiru‘s predictive analytics
platform will add data analysis capabilities, including site personalization, search, fraud
prevention and marketing. From the post: ―Walmart‘s data scientists will now be able to work
with big data directly and create impact faster than ever before.‖
Walmart Labs is known for being acquisitive when it comes to snapping up early-stage
startups to test new ideas in e-commerce. Some of these startups eventually get folded into the
company‘s e-commerce site and other online operations.
It looks like we can expect Walmart.com to improve personalization, which isn‘t too
surprising. Data analytics and personalization are certainly two areas where retailers are doubling
down as a way to both add to the customer experience and draw more conversions online.

57
Reported by marketwatch.com, June 27, 2013:
Raytheon Company has acquired a privately held company, Visual Analytics Incorporated,
further extending Raytheon's capabilities to meet the data analytics, data visualization and
information sharing needs of its customers. Terms of the transaction were not disclosed.
As one of the largest processors of data for the intelligence community, Raytheon has
extensive experience handling large data sets and providing actionable information to its
customers. The acquisition of Visual Analytics will add advanced analytic products and
knowledge management solutions with intuitive user interfaces to Raytheon's offerings to its
customers. It will also broaden the company's customer base in federal, state and local law
enforcement.
"The addition of Visual Analytics will further strengthen Raytheon's capabilities in the area
of data analytics," said Lynn Dugle, president of Raytheon's Intelligence, Information and
Services (IIS) business. "This will allow us to bring new, innovative visualization offerings to
our customers as they address the continuous challenge of increasing analyst efficiency and
effectiveness while transforming data into actionable intelligence."

58
Appendix B. Additional Analysis with Different Sets of Bi-grams pertaining to Emphasis on
4Vs
Frequency of 4V
Keywords -5%
Frequency of 4V
Keywords -20%
4Vs calculated with
problematic bi-grams dropped
DV= CAR Model B1 Model B2 Model B3
Velocity 0.068* 0.029* 0.088*
Variety 0.107** 0.072** 0.042**
Volume 0.072** 0.046#
0.033#
Veracity 0.049* 0.070** 0.021*
Analytics 0.013 0.021 0.004
Security 0.020 0.004 0.008
Dynamism 0.072* 0.099** 0.072*
Complexity 0.042* 0.028* 0.018#
Munificence -0.012
0.013#
0.010
Analytics*Velocity -0.002 0.002 0.001
Analytics*Variety 0.082*** 0.023* 0.091***
Analytics*Volume 0.060 0.002 0.005
Analytics*Veracity 0.092* 0.043#
0.053**
Security*Velocity 0.007 0.000 0.011
Security*Variety 0.000 -0.004 -0.016
Security*Volume 0.008 0.001 0.003
Security*Veracity 0.038# 0.022
# 0.041*
Dynamism * Velocity 0.201** 0.117*** 0.092*
Dynamism * Variety 0.003 0.001 0.003
Dynamism * Volume 0.005 0.017 -0.009
Dynamism * Veracity -0.001 -0.004 0.010
Complexity * Velocity -0.010 0.000 0.018
Complexity * Variety 0.052* 0.105* 0.088**
Complexity * Volume 0.002 0.003 0.005
Complexity * Veracity 0.051* 0.023* 0.112***
Munificence * Velocity -0.063* -0.028#
-0.033*
Munificence * Variety -0.111*** -0.061* -0.018#
Munificence * Volume -0.028#
-0.032* -0.029#
Munificence * Veracity -0.033#
-0.081** -0.073**
N 651 651 651
Adjusted R2 (%) 15.8 14.6 14.2
Industry, year, acquired, and main dummies are included but the dummy coefficients are not
reported for brevity; * p < 0.05, ** p < 0.01, *** p< 0.001; Robust standard errors are
estimated by clustering errors around firm dummies. There is at least a 300-day distance
between announcements of the same firm.

59
Chapter 3:
Socially-Constructed Innovations in New IT Ventures
Abstract
The network view is a prevalent theoretical lens to describe the success of new ventures.
Nonetheless, the relevant literature faces a number of shortcomings. First, while embeddedness
in networks providing access to financial capital resources has been studied, the structure of
networks facilitating access to intellectual capital is less understood. Therefore, this paper‘s first
goal is to understand the role that intellectual capital networks play, along with the financial
capital networks, to make new ventures successful. Second, most studies investigating the role of
network embeddedness in new ventures have mainly focused on either one type of network tie or
have aggregated different types of network ties to understand the role of network position.
However, different types of network ties may shape network structures that are distinct, and
therefore, their aggregation may mask important information about their value to a new venture.
Thus, the paper‘s second goal is to study different types of network ties, in both financial capital
and intellectual capital networks, and understand how these different networks interact to make
new ventures successful. Focusing on Big Data Ventures (BDVs), as ventures active in an
industry where innovation is socially-constructed, we investigate the structure of personal and
investment networks, as networks facilitating access to financial capital, and educational and
professional networks, as networks facilitating access to intellectual capital. We also differentiate
between ventures that pursue radical versus incremental innovations and hypothesize about the
difference in network positions ideal for each type of innovation.
Results of our study on 2,009 BDVs observed between 2011 and 2014 show that: a)
educational and professional networks have distinct structures, and thus, treating them as
separate networks is more informative; b) the structure of personal and investment networks calls

60
for super-imposing them; c) achieving a desirable mix of structural holes and density for venture
pursuing radical innovations is possible when those structural traits occur in different networks
(i.e., high network density in education network, and high level of structural holes in the
professional network or vice versa); and d) eigenvector centrality in the superimposed financial
capital network is positively associated with higher levels of raised capital for new ventures.
Moreover, our post-hoc matched sample analysis reveals that unlike in the Big Data industry,
ventures in the Medical Devices industry do not exhibit the same benefits from embeddedness in
the inter-venture intellectual capital networks. We discuss how this empirical evidence hints at
the distinct socially-constructed nature of IT innovations.
Keywords:embeddedness, big data venture, financial capital network, intellectual capital
network, socially-constructed innovation, structural holes, network density, eigenvector
centrality.

61
Introduction
The network view is a prevalent theoretical lens to describe the success of new ventures
(Brüderl and Preisendörfer 1996, Baum et al. 2000, Florin et al. 2003, Maurer and Eber 2006;
Evers and O‘Gorman 2011; Zanre and DeCarolis 2016). This lens assumes a positive relation
between the networking activities of a founder and its venture‘s success. The rationale behind
this expectation is the theory of socially embedded ties, according to which socially embedded
ties allow entrepreneurs to: a) obtain resources cheaper than they could be obtained through
markets; and b) secure resources that would not be available in markets at all (e.g. reputation,
customer contacts; Witt 2004). The extant research on the role of networks in the success of new
ventures has mostly focused on the strength and weakness of founders‘ personal ties (e.g.,
Brüderl and Preisendörfer 1996, Jenssen and Greve 2002, Florin et al. 2003) and their effect on
financial performance of new ventures (e.g., Baum et al. 2000, Lechner et al. 2006).
Nonetheless, the current literature8F
14 faces a number of shortcomings. First, focusing on the
late-stage performance of new ventures, prior studies overlook the effect of network structure on
the initial phases of forming new ventures. Focusing on the late stages of venture development,
the existing literature has emphasized financial capital networks, i.e., networks where ties among
the members are established through direct social interaction, as means to access resources,
mainly financial and reputational, required to enter a market and survive (e.g., Elfring and
Hulsink 2003). However, the early phases of venture development are also important because
they involve creation and refinement of the venture‘s innovation (Florin et al. 2003). This is in
contrast with late stages of venture‘s development, where appropriating market share,
competing, and survival are the main tasks. In the early stages, in addition to depending on their
14
See Appendix A for a brief summary of notable literature about the network view and success
of new ventures.

62
social networks to obtain financial and reputational resources to kick-start their business, BDVs
depend on their intellectualnetworks (i.e., networks where ties among the members are
established through knowledge-related associations) to develop their innovation. Specifically,
new ventures develop products/services on a spectrum of innovativeness (incremental to radical).
Previous literature suggests that network structures required for success of each type of
innovation are distinct (Elfring and Hulsink 2003). Therefore, the first objective of this study is
to extend the existing literature by considering the role that intellectual networks play, in
addition to the role of social networks, in the success of new ventures generally and BDVs
specifically. Also, we intend to study this role relevant to the type of a new venture‘s innovation
(radical vs. incremental). Figure 1 depicts how this study departs from the existing literature‘s
focus on the late stages of venture development and thereby includes access to intellectual
networks in the discussion about network factors affecting the success of new ventures.
Figure 1. Comparison of the Developmental Focus of this Essay and the Previous
Literature
Second, the current literature has mainly focused on either one type of founders‘ network
(e.g., Baum et al. 2000, Jenssen and Greve 2002, Jenssen and Koeing 2002, Maurer and Eber
2006) or has aggregated different types of founders‘ networks (e.g., Florin et al. 2003) to study
the role of network structure in the success of new ventures. However, venture founders are

63
embedded in different types of networks (Lechner et al. 2006). Friendship ties, educational ties,
and professional ties are among different types of network ties that a venture founder can have
with relevant individuals in his/her environment. Lechner and colleagues (2006) suggest and
empirically show that the same position in different types of networks results in different
outcomes and encourages researchers to consider separately studying networks of distinct nature.
Building on Lechner et al.‘s work, the second objective of this paper is to study different network
types in which a BDV is embedded and understand the effect of these networks‘ structure on the
success of the BDV.
To investigate the role of intellectual capital networks, we consider a BDV‘s educational
and professional ties with other BDVs. The general literature on entrepreneurial innovations
(e.g., Robinson and Sexton 1994; Van Praag et al. 2013), as well as the literature on development
of IT innovations (e.g., Couger 1973; Kautz et al. 2007), suggests that innovators access
technical knowledge through two main sources: formal education and professional experience.
While formal education provides innovators with basic technical knowledge, professional
experience provides access to tacit technical knowledge or organizational proprietary knowledge
that is not presented in formal curricula taught in colleges and universities. Individuals with
similar educational and professional background share a common language (e.g., Preston and
Karahanna 2009) that facilitates transfer of cutting-edge, and often complex, knowledge that is
usually required in the development of technological innovations (e.g., Kuemmerle 2003). While
some BDVs pursue the development of a radical innovation, others might pursue the
development of a more incremental one. First, we discuss how intellectual networks affect a
BDV‘s radical or incremental orientation in the early phases of venture development. Then, we

64
discuss the role that intellectual networks play in the development of a venture‘s initial idea,
radical or incremental, and raising the capital needed to expand the business.
To investigate the role of financial capital networks, we consider a BDV‘s personal and
investment ties with other BDVs, as well as with investors such as angels and venture capitalists.
We define personal networks as networks with ties constructed based on non-financial social
interactions that can include emotional and public encouragement for the BDV. Previous
literature has documented positive financial gains from similar ties, including kinship, friendship,
and family ties (e.g., Brüderl and Preisendörfer 1996); therefore, we consider personal ties a
major channel for accessing reputational and financial resources. Also, we consider investment
networks which are networks with ties to previous investors. Ties to previous investors,
including angels or venture capitalists, can allow a BDV to access unexploited financial
resources. Both personal and investment networks can provide a BDV with reputational and
financial resources it needs to raise capital.
Building on structural theories of innovation and the theory of social embeddedness, this
paper proposes to focus on structural holes and density in intellectual networks of a BDV, while
considering eigenvector centrality9F
15 in its social networks as the key determinant of success, i.e.,
raised capital. The developed hypotheses are tested using objective data from AngelList.com,
focusing on 2,009 BDVs active from 2011 to 2014. The results show that: a) educational and
professional networks have distinct structures, and thereby treating them as separate networks is
more informative; b) the structure of personal and investment networks call for super-imposing
them, considering personal and investment ties simultaneously; and c) achieving a desirable mix
15
Eigenvector centrality is a special measure of centrality that considers the importance ties, in
addition to the number of ties, when identifying the extent of an ego‘s centrality in a given
network.

65
of structural holes and density for radical innovations is possible when those structural traits
occur in different networks (i.e., high network density in education network, and high level of
structural holes in the professional network or vice versa).
Innovation and New Ventures
Innovation is at the heart of entrepreneurial firms at the early stages of development (Zott
and Amit 2007). Absent traditional firm resources, such as liquidity, reputation, and extensive
human capital, innovation is the main source of value-creation for these ventures (Zott and Amit
2007). To develop, grow, and stabilize, new ventures need to attract capital from venture
capitalists and angels, mainly through a persuasive innovation that shows the potential for
success (Timmons and Bygrave 1986). New ventures follow different strategies in developing
innovations. Some focus on radical novelty, where product/service is a clear often a risky
departure from the existing technology (Ettlie et al. 1984). Others pursue incremental
innovations where the focus is on improvements, modifications, or re-configuration of the
existing technology (Ettlie et al. 1984). While both types of innovation are shown to influence
performance of new ventures positively (Rosenbusch et al. 2011), different structures are
required to support and nourish them (Ettlie et al. 1984; Elfring and Hulsink 2003). Below,
utilizing a networks lens, we explain the structural features that support radical and incremental
innovations.
Theoretical Development
A new venture‘s ability to raise capital depends on two conditions. First, new ventures
should have access to channels that enable them present their work to capitalists and attract them
(e.g., Ferray 2003). Second, the innovation offered by the venture should be deemed lucrative
for the accessed investors. In doing so, the quality of innovation and its development play a key

66
role in convincing a capitalist to invest (e.g., McMillan et al. 1985; Kollman and Kuckertz 2010).
From a networks perspective, satisfying the two conditions requires access to different types of
networks and different structural positions. Specifically, we label networks allowing access to
capitalists‘financial capital networks, and label networks that enable creation, refinement, and
development of an innovation intellectual capital networks. Below, we discuss the network
theories relevant to each condition.
Theories of Social Embeddedness and Access to Financial Capital
Theories of embeddedness suggest that entrepreneurs become more successful as they
become more embedded in social ties with others because social ties facilitate accessing
resources and information in a fast and economically-efficient fashion (Uzzi 1997). Socially
embedded ties allow entrepreneurs know, approach, and persuade individuals and firms that seek
investment opportunities. Reach and access are not the only feature of socially-embedded ties.
Rather, social ties create a degree of network reputation (Uzzi 1997; Uzzi 1999) that is essential
for the flow of capital to new ventures. Ties to influential entities enhance a venture‘s worth in
the eyes of others, leading to an enhanced reputation. The existing research suggests that new
ventures are viewed as uncertain investments (Kollman and Kuckertz 2010). The reputation
stemming from a strong network position facilitates trust (Gluckler and Armbruster 2003), a key
element in financial decisions especially when an investment carries high levels of uncertainty
(Bhide and Stevenson 1992). Therefore, socially-embedded ties enable accessing investors under
a level of trust that is pertinent for suppressing the threat of newness investors face when
considering an investment in a new venture.
From a structural perspective, size and centrality are discussed as structural attributes that
pertain to the access and reach to entrepreneurial financial resources (Hoang and Antonic 2003).

67
Specifically, the size of a founder‘s ego network has been primarily discussed and empirically
investigated (e.g., Aldrich and Reese 1993; Hansen 1995). Centrality is conceptually similar to
network size. While network size determines the extent to which resources are available,
centrality ―explicitly includes the ability to access (or control) resources through indirect as well
as direct links‖ (Hoang and Antonic 2003, p. 171). The existing research has characterized a new
venture‘s access to financial resources through considering the network centrality of its
founder(s) (e.g., Brajkovich 1994; Johannisson et al. 1994; Powell et al. 1996).
In spite of research supporting the role that central positions play in accessing resources,
plain degree measures of centrality fail to reflect the reputation and therefore the trust that
network ties carry. As it was noted earlier, access to trusted ties is needed for the flow of capital
to new ventures. Therefore, new ventures with the same number of social ties may be different in
terms of their access to trusting resources, depending on the reputation of those they are
connected to. The current literature on social network structures suggests that to account for the
reputation carried by social ties, the centrality of edges needs to be considered. This is based on
the theory that ties to more influential actors bear more reputation (Hanneman and Riddle 2005).
Consistent with this theory, the concept of eigenvector centralityis introduced (Bonacich 1972)
and utilized in cases where reputation, in addition to the access to resources, is considered (e.g.,
Mehra et al. 2006). Similarly, we build on the notion of eigenvector centrality to argue about the
network structures that facilitate a BDV‘s access to trusting investors.
New ventures become embedded in financial ties by establishing two types of connections.
The first type is connections with other ventures and investors through personal ties. These
personal ties can exist due to social interactions such as friendship among founders and
employees and followership (in case of online communities) (e.g., Lechner et al. 2006). Second,

68
investment ties, i.e., ties with previous investors,can facilitate financial embeddedness. The two
types of ties are different in terms of content. In the former, social interactions are the basis for
connection, whereas in the latter, financial transactions play a key role. We suggest that
eigenvector centrality in financial capital networks (consisted of personal and investment ties)
increases access to trusting investors.
Personal ties with more central investors increase the reach and reputation for a new venture.
On the one hand, more ties with capitalists increase the level of access to them. On the other
hand, personal ties with popular and influential investors signal dependability of a venture and
thereby attract other investors. In addition to ties with potential investors, personal ties to other
(central) ventures can also increase access to more resources. Through ties to other ventures, a
venture can extend its access to those ventures‘ investors. Moreover, personal ties to highly
central ventures signal dependability and trustworthiness. Influential ventures are likely to be
successful in raising capital and showing potential. For newly emerged ventures or those at the
early stages of development, with the threat of newness glooming (Chen et al. 2009), ties to
successful and influential ventures can also boost reputation. This can be explained by social
homophily, a well-documented phenomenon that suggests personal ties often emerge between
social actors with similar traits and qualities (McPherson et al. 2001). For potential investors, an
influential venture‘s tie to a new venture can signal that the founders of the new venture,
although less known, share the same talent and experience as the in-tie influential venture.
In addition to personal ties, investment ties can also enhance a new venture‘s reach and
reputation. First, investors from the past rounds of investment are very likely to invest in the next
rounds due to the sunk costs of their initial investment (Hallen and Eisenhardt 2012). Moreover,
the threat of newness is less salient for previous investors as they have already spent some time

69
to research the venture in the previous round(s) of investment. The ongoing monitoring of a
business venture and observing its survival to another round of capital raising can reduce
perceived risks for an investor. Second, the empirical evidence suggests that new investors rely
on referrals by previous investors (Hallen and Eisenhardt 2012). Specifically, the more central
and influential investors have higher levels of network reach and hence are more likely to be able
to introduce a new venture to their ties. Moreover, a previous investment by an influential
investor signals the new venture‘s dependability to the potential investors. Highly central
investors, i.e., those with a large number of investments, have more financial capabilities.
Research suggests that well-endowed capitalists invest in better ventures (Hsu 2004; Sørensen
2007; Knill 2009). Therefore, new investors perceive a venture with ties to central investors as a
business with more potentials and/or less risks. Hence, we hypothesize that:
H1: Higher eigenvector centrality in the financial capital network, consisting of
personal and investment ties, is associated with higher capital raised by a BDV
in round t.
Big Data Innovations and Intellectual Capital Networks
The existing literature suggests that ―when the knowledge base of an industry is both
complex and expanding and the sources of expertise are widely dispersed, the locus of
innovation will be found in networks of learning, rather than in individual firm‖ (Powell et al.
1996, p. 116). Big Data fits the description of such an industry. First, the existing literature
describes Big Data innovations as complex and relying on multiple disciplines of science (e.g.,
Chen et al. 2012; Dhar 2013). Further, Big Data is described as a growing and expanding area
(Goes 2014). Therefore, development, refinement, and advancement of Big Data innovations are
socially-constructed in intellectual networks, rather than being confined to individual firms. In
addition to the general literature on management of innovations (e.g., Gilbert et al. 2008), the
existing literature on IT innovations provides empirical evidence suggesting learning about

70
innovations happens in a social discourse in the IT context (Wang and Ramiller 2009).
Therefore, a BDV‘s success in the development of a lucrative innovation highly depends on its
structural position in the intellectual network around it. In the section below, we introduce
structural theories of innovation and discuss structural positions that help a BDV with
incremental and radical innovations grow.
Two closely related but distinct streams of social networks research have theorized about the
intellectual capital embedded in networks and discussed the ways through which innovation
development is enabled. First, the literature on structural holes (Burt 2004) suggests that the
presence of structural holes facilitates access to a diverse set of resources, increasing the
possibility to innovate. When two separate clusters possess non-redundant information, there is
said to be a structural hole between them (Burt 2009). The theories of structural holes build on
the notion that in the context of networks, intellectual capital exists where people have an
advantage because of their location in a network. Contacts in a network provide information,
opportunities, and perspectives that can be beneficial to the central player in the network. These
theories emphasize that most social structures tend to be characterized by dense clusters of strong
connections (Burt 2004) and that information within these clusters tends to be rather
homogeneous and redundant. However, it is contended that non-redundant information is usually
obtained through contacts in different clusters, a case that happens when structural holes exist.
Thus, networks rich in structural holes have a form of intellectual capital by offering information
benefits. The player in a network that bridges structural holes is able to access information from
diverse sources and clusters (Burt 2009). For new ventures, the presence of structural holes
enables accessing to more diverse information and increases the likelihood of innovation
inception, and at the later stages, innovation refinement.

71
Second, the theory of weak ties (Granovetter 1973) has been utilized to shed more light on
the phenomenon by explaining the effects of network structure on development of innovations.
Tenets of this theory suggest that that different network positions, i.e., rich in cohesion or
structural holes, enable differing tie strengths such that individuals embedded in networks rich
with structural holes, due to their access to non-redundant resources and the broader reach of
their network, establish weaker ties that are more proper to acquire diverse knowledge (Hansen
1999). On the contrary, more cohesive networks, characterized by the existence of more ties
among the network actor, enable stronger ties that enable transfer of rich knowledge, often
enabling more drastic innovations (Hansen 1999).
Although the general role of strong and weak ties, as well as structural holes and network
cohesion, are realized in the existing literature, there is disagreement regarding the role that each
type of network characteristics plays the success of entrepreneurial firms (Johannisson 2000;
Hite and Hesterly 2001; Rowley et al. 2000). Specifically, the role of network characteristics in
the early stages of a venture‘s development has been less clear (Bloodgood et al. 1995; Steier
and Greenwood 2000). The existing literature suggests conflicting findings. For example, in
some instances ―both strong and weak ties are argued to be positively related to performance‖
(Rowley et al., 2000, p. 369) and in other cases, strong ties, enabled by highly dense networks,
are deemed detrimental to development of ideas (Gargiulo andBenassi, 1999). Burt (2000)
argues that the two types of ties, strong and weak, play different and distinct role in enabling
innovation. On one hand, dense networks and the resulting strong ties are regarded as means to
facilitate exchange of rich information, and complex and tacit knowledge (Krackhardt 1992;
Starr and MacMillan 1993; Rowley et al. 2000). On the other hand, structural holes and their
enablement of weak ties are beneficial as they facilitate access to diverse information

72
(Granovetter 1973, 1982; Burt 1992). Works by Uzzi (1996, 1997), Hite and Hesterly (2001),
and Rowley et al. (2000) indicate that a mix of structural holes and dense ties can explain the
network benefits for new ventures.
A contingency approach is often utilized to understand the mix in which structural holes and
network density operate create success for entrepreneurial firms. For instance, the stage of
development in which a venture is has been noted as a contingency factor such that in early
stages there is a greater need for higher cohesion, whereas in the later stages of development,
structural holes are more beneficial (Birley 1985; Bloodgood et al. 1995; Hite and Hesterly
2001). A second contingency factor in explaining the mix of structural holes and network
cohesion is the industrial context. Specifically, structural holes are shown to be more
instrumental in dynamic environments, whereas in stable environments, network density
becomes more beneficial (Rowley et al. 2000). A third contingency has been the type of
innovation, radical or incremental. While Elfring and Hulsink (2003) point to more agreed-upon
role by structural holes as the provider of information diversity for new ventures, they offer a
lens to understand the role that network density and strong ties play. Specifically, Elfring and
Hulsink (2003, p. 414) describe the role of network density and strong ties as following:
―Another strong tie advantage is related to the ability to exchange tacit knowledge. This
mechanism may be particularly important to start-ups realizing more radical innovations. They
are confronted with a new combination of resources from various backgrounds. The deployment
of these complementary assets requires the exchange of tacit knowledge.‖
Overall, the theoretical arguments point to importance of structural holes for advancement of
incremental innovations. Incremental innovations happen through the combination of existing
innovations or by re-configuring them (e.g., Obstfeld 2005). Structural holes provide access to a

73
diverse set of knowledge and thereby facilitate the development of incremental innovations. In
addition to the theoretical arguments supporting the role of structural holes in development of
incremental innovations, empirical findings suggest that for ventures pursuing incremental
innovations, those with weaker ties are more likely to discover opportunities than those with
strong ties (Elfring and Hulsink 2003).
On the other hand, it is contended that for ventures pursuing radical innovations, those
having a mix of strong and weak ties are more likely to discover opportunities than those that do
not have such a mix (Elfring and Hulsink 2003). That happens because for advancement of
radical innovations, a combination of diverse knowledge and exchange of complex tacit
knowledge is required.While access to more than enough diversity in a network traps innovators
in myopic states where breaking the status-quo is hard (Obstfeld 2005), presence of strong ties
along with weak ties is more important for ventures pursuing radical innovations as strong ties
enable exchange of complex tacit knowledge, which is key for radical innovations (Elfring and
Hulsink 2003). A novel and breakthrough idea is not a combination of different ideas or a re-
configuration of the existing ones. A diverse knowledge about existing innovations allows
entrepreneurs to understand the current status of an innovative field and define, or adopt, a niche
area. After this phase, a deep understanding of the often tacit and complex technological
knowledge is required to develop and refine an idea that is novel (Elfring and Hulsink 2003).
Creation of breakthrough innovations requires a great extent of tacit knowledge exchange as
evidenced by Smith et al. (2005), and the existing literature (Reagans and McEvily 2003) suggest
that strong ties enabled by higher levels of network cohesion enable the exchange of such tacit
and complex knowledge. Table 1 summarizes the potentials of network structures with high
levels of structural holes and network cohesion, and Table 2 summarizes the findings of the

74
extant literature regarding the type of network structures enabling incremental and radical
innovations.
---Insert Tables 1 and 2 here---
Building on the above-mentioned literature, hypothesizing about the direct effect of
structural holes and network density in the intellectual capital networks, i.e., educational and
professional networks, is rather straight-forward. For both radical and incremental innovations,
access to structural holes in either network is beneficial as it increases access to diverse
knowledge and ideas. On the other hand, the literature mentions the importance of network
density for radical innovations but not of incremental ones. Network density facilitates transfer
of complex knowledge that is key to advancement of radical innovations. Therefore, based on the
prior literature, we expect network density in both educational and professional networks has a
positive effect on the capital raised by BDVs pursuing radical innovations. Moreover, we expect
an insignificant effect in the case of BDVs pursuing incremental innovations. Because these
relationships have been theorized in the previous literature, we avoid hypothesizing about them
in this essay. Instead, our focus is on the interactions of structural positions in educational and
professional networks.
We believe the focus on the mentioned interactions advances the prior literature theorizing
about network structures enabling innovation development. For example, while achieving low
levels of network cohesion and high levels of structural holes is possible in a single network (in
case of incremental innovations), a simultaneous access to the structural holes and network
cohesion for BDVs with radical innovations is unlikely. As the network density increases,
redundant ties among individuals start to emerge. Therefore, reaching high levels of structural
holes and network density in the same network might not be feasible. However, the intellectual

75
networks of entrepreneurs can extend beyond a singular structure. Specifically, an entrepreneur‘s
intellectual network can be shaped around ties that are based on formal education and
professional experience. If the two networks are structurally distinct, one network can supply
entrepreneurs with high levels of structural holes, and the other can supply strong ties through
high level of network density. Below, we explain how different combinations of structural
positions in the two networks affect the capital raised by BDVs pursuing a radical or incremental
innovation.
For radical innovations, access to diverse knowledge and ability to communicate complex
information are required for success. A possible way to access both is when in one network (e.g.,
educational), structural holes are present, and the other (e.g., professional) is a network with high
density. Specifically, we suggest that high network density in the other network complements the
diverse access to the community knowledge. Therefore, as the network density increases in one
network, the BDV is able to make better use of its diverse access to knowledge through high
structural holes in the other. High network density in one network allows breakthrough ideas to
emerge through exchange of complex knowledge, building on the diverse knowledge obtained
through structural holes of another network. Therefore:
H2: For radical innovations, network density in one network (i.e., professional or
educational) increases the effect that structural holes in the other network have
on the BDV‘s raised capital in round t.
For incremental innovation, increasing density in one network does not help increase the
value of structural holes in another. Especially in the context of Big Data, where the speed of
generating incremental innovations by rival is high (Dhar 2013), high network density and its
associated redundancy do not help a timely response to market. Incremental innovations require
quick moves to the market (Tushman and Nadler 1986), and high network density is not
characterized with fast mobilization of ideas (Obstfeld 2005). Therefore, we expect:

76
H3: For incremental innovations, network density in one network (i.e.,
professional or educational) does not change the effect that structural holes in
the other network have on the BDV‘s raised capital in round t.
High network density in both educational and professional networks can be detrimental for
both radical and incremental innovations. As the network density increases in one network, it
erodes value from the high density in the other. This happens because increasing network density
in the second network happens at the expense of reduced structural holes; therefore, the BDV
becomes deprived of information diversity needed for quality innovations. Structural holes and
access to diverse knowledge are key to the development of innovation. Specifically, in the case
of Big Data innovations, with their dispersed nature of knowledge (e.g., Dhar 2013), lack of
structural holes reduces the quality of innovation, making them less attractive for investors.
Hence, we suggest that:
H4: For both radical and incremental innovations, network density in one network
(i.e., professional or educational) reduces the effect that network density in the
other network has on the BDV‘s raised capital in round t.
High structural holes in both educational and professional networks can be detrimental for
radical innovations, but not for incremental innovations. For radical innovations, as the structural
holes in one network increase, the value of the other network‘s structural holes decreases. This
happens because the structural holes in the second network emerge at the expense of reducing
network cohesion. In such cases, although the BDV has access to a wide set of ideas and
knowledge, it lacks the knowledge depth to come up with breakthrough ideas. Hence, we
suggest:
H5: For radical innovations, structural holes in one network (i.e., professional or
educational) reduces the effect that structural holes in the other network have
on the BDV‘s raised capital in round t.
Unlike the case of radical innovations, for BDVs pursuing incremental innovations, diverse
knowledge in both educational and professional networks is complementary. The quality of
combinative innovation increases as a wider set of ideas (Obstfeld 2005) and innovations are

77
inputs to the BDV‘s idea generation room. The content of professional knowledge about IT
innovations can be different from the knowledge obtained from formal education. Thereby,
BDVs with access to a broad knowledge in both educational and professional networks perform
better compared to those with access in only one. Moreover, the diverse ideas obtained from one
network can have higher value when combined with distinct ideas of another network. This
increases the quality of idea combination, as the components of the idea combination are likely
to be diverse, resulting in combinative innovations that are distinguished from those developed
by rivals. Hence, we suggest that:
H6: For incremental innovations, structural holes in one network increase the
effect that structural holes in the other network have on the BDV‘s raised
capital in round t.
Figure 2 presents an overview of our research model:
Figure 2. Research Model Overview
Methods
This research focuses on BDVs active on AngelList.com, a venture-funding website that
offers a platform to new ventures so they can connect to other ventures and gain access to a pool
of potential investors. A total of 2,009 BDVs were followed from January 1st, 2011 until
December 29th
, 2014. These ventures are self-identified as active in the Big Data context. An

78
average BDV in our sample has raised $4.73 million, has 3.56 co-founders, and has 12.84
employees. The website assigns a profile page to each BDV where information such as names
and links to personal pages of founders, employees, investors, and followers of the BDV are
identified. Additionally, information regarding different rounds of capital-raising, amount of the
capital raised, and contributing investors in each round is provided. Finally, the profile page
includes a section where the BDV‘s innovation is described and introduced. Using a Python-
based web-crawler, the mentioned information about each BDV is crawled and used as the main
source of information. This information is then supplied by accessing the LinkedIn profile of
founders, employees, and co-founders, where information about the professional and academic
background, as well as the friend list of each individual, is obtained.
Obtaining Network Information
In order to define the network of ventures in our study, four different types of ties where
identified to be examined. The nodes in the mapped networks are the BDVs, angels, and venture
capitalists. The ego networks of each BDV consisted of ties with other BDVs, angels, and
venture capitalists are analyzed to extract structural features mentioned in the hypothesis
development section.
Financial Capital Network
Networks Based on Personal Ties
A tie exists between a BDV and another BDV, angel, or venture capitalist if in the periods
leading to the current round of fundraising, a non-financial social transaction (e.g., friendship,
followership) has happened between the two actors. The strength of ties is defined by summing
the number of social interactions between each of two nodes. Specifically, following a BDV on
AngelList.com by a founder or employee of another BDV, an employee of a venture capital

79
company, or an angel is treated as a social interaction between the BDV and the other BDV,
venture capitalist, or angel. Similarly, appearing in the friend list of a BDV‘s founder or
employee by a founder or employee of another BDV, an employee of a venture capital company,
or an angel is treated as another type of a social interaction between the BDV and the other
BDV, the venture capitalist, or the angel. Then, the raw values of tie strength in the network are
range-standardized to vary between 0 and 1.
Networks Based on Investment
A tie exists between a BDV and an angel or venture capitalist if in the periods leading to the
current round of fundraising an investment, transaction has happened between the two actors.
The strength of tie is the cumulated value of transactions between the two parties. Then, the raw
values of tie strength in the network are range-standardized to vary between 0 and 1.
Intellectual Capital Network
Educational Network
To establish an educational tie between two BDVs, first, educational ties between all
founders and employees of the sample‘s BDVs are determined. An educational tie between two
individuals exists if they have graduated in the same major. The strength of the tie increases by
one for sharing alma mater, as well as having overlap in the educational period. The strength of
ties between two BDVs is determined by summing the weight of ties that exist between
individuals at the two ventures. Then, the raw values of tie strength in the network are range-
standardized to vary between 0 and 1.
Professional Network
To establish professional ties between two BDVs, first, professional ties between all
founders and employees of the sample‘s BDVs are determined. A professional tie between two

80
individuals exists if they have previously worked in the same place. The strength of the tie
increases by one if the two individuals have overlapping tenures. The strength of ties between
two BDVs is determined by summing the weight of ties that exist between individuals at the two
ventures. Then, the raw values of tie strength in the network are range-standardized to vary
between 0 and 1.
Measures
For the four networks mentioned above, structural characteristics were measured as follows.
Eigenvector centrality is measured utilizing Bonacich‘s measure 10F
16 (1972). We multiply the
value of eigenvector centrality by 100 for better interpretation. On average, personal networks
show an eigenvector centrality of 9.63, whereas the average eigenvector centrality in investment
networks is 13.2817
. For measuring structural holes and density measures, 1-step neighborhood
ego networks of each BDV are considered. The weighted-network measures of network density
and constraint suggested by Burt (2008) are utilized as measures of network density and
structural holes, respectively. For measuring structural holes, we use an inverse measure of
constraint. The constraint measure is calculated as follows:
Ci= 𝐶𝑖𝑗𝑗 , i ≠ j
Cij = (Pij + 𝑃𝑖𝑞 𝑞 𝑃𝑞𝑗 )2, i ≠ q ≠ j
Pij = Zij / 𝑍𝑖𝑞𝑞
Where Ci is the constraint index for ith BDV and Zij is the weight of the tie between the ith
and jth BDV. Then, Pij measures the direct access to the jth BDV by the ith one. We follow
16The elements of the adjacency matrix are the edge weights in the whole network. 17We ran our models with simple degree centrality measures, instead of the eigenvector centrality
measure. Although the same trends are observable with those alternative measures, Wald‘s
chi squared of those estimations are persistently lower than the ones estimated with the
eigenvector centrality measures. Therefore, we keep eigenvector centrality as the measure of
financial embeddedness.

81
Burt‘s suggestion for multiplying the index by 100 for better interpretation. Also, ego network
density is calculated by: Zij / N(N-1), where N is the size of the ego network. We also multiply
the density ratio by 100. On average, ego networks of education in our sample show a constraint
level of 27.83 and a density of 35.61. Ego networks of professional experience in our sample
show a constraint level of 19.22 and a density of 24.43.
In order to determine the innovation type (radical vs. incremental), we conducted a text
analysis of the product description section of the BDV‘s profile in the AngelList website,
supplemented with blog and news reports about the BDV‘s innovation, obtained from Lexis-
Nexis. We believe a BDV‘s innovation type can be unfolded in the product description section of
the BDV‘s webpage because that section is the medium through which the product is introduced
and its potential superiorities to competing products are explained. Further, news pieces and blog
posts provide outsiders‘ view of the BDV‘s innovation. The text-mining module of R (tm) was
used to analyze the product description section of each BDV‘s profile, as well as related news
pieces and blog posts. In order to do so, first, a set of words associated with radical and
incremental innovations was compiled using the existing literature on organizational innovations.
We searched Google Scholar for articles that contained terms incremental innovation and radical
innovation. Over 12,100 articles were identified, and the HTML versions of these articles where
combined to form a corpus. This corpus was text-mined to extract sentences that did not include
any of the radical innovation or incremental innovation with the exception of sentences that were
adjacent to the sentences containing these words. Then, the sentences containing the mentioned
terms and their adjacent sentences were analyzed to form a network of words that are closely
associated with them.

82
For example, the words ―original,‖ ―breakthrough,‖ ―pioneering,‖ and ―groundbreaking‖ had
the highest frequency of occurring when the word ―radical innovation‖ was discussed in the
corpus of articles. Also, the words ―revise,‖ ―extend,‖ ―amend,‖ ―combine,‖ ―re-configure,‖ and
―modify‖ were adjacent to the word ―incremental innovation.‖ The adjacent words were then
processed to eliminate the ones that are irrelevant to the concepts of incremental and radical
innovations. Then, a library of refined word for each type of innovation was used to analyze the
product description section of each BDV in the sample. The frequencies of words associated
with radical and incremental innovations in the product description corpus of each BDV are
calculated. The ratio of associated words to the total number of words in the text is calculated to
measure emphasis on a radical vs incremental approach. The two ratios are then compared with a
z-test to determine the category of innovation; the significantly larger ratio determines the
category of radical or incremental innovation. Observations with insignificant z-test are dropped
from further analysis. The following is a piece of a news coverage of Levyx, a Big Data startup
that was evaluated as radical in our sample:
―Start up Levyx believes that its Helium and LevyxSpark platform, which is integrated into
Apache Spark open source computing framework, is a groundbreaking change in big data
computing. Levyx CEO Reza Sadri told Legaltech News that company‘s proprietary technology
can process tens of millions of queries per second on a single computing node and with latency
in microseconds…
… Levyx differs from other big data processors in the market in its utilizations of solid state
drives (SSD) and flash memory, which stores and erases data through electrical circuits as
opposed to through mechanical parts like disk read-and-write heads in traditional hard drives,
and is therefore able to process data much quicker. The use of this technology, as well running it
on commodity servers, Sadri said, allows Levyx to achieve in-memory computing performance
at a fraction of the cost.‖
Alternatively, the following is a piece of news coverage of BloomReach which is evaluated
as a BDV that pursues development of an incremental innovation:
―Big data is hot, but infrastructure-level platforms such as Hadoop, which focus on storage
and processing, still need help to take them into the mainstream. They need an app or two that

83
extend Hadoop and will let companies analyze, visualize and act on all that data without hiring a
team of Stanford Ph.Ds, or that will let developers write big-data apps without having to reinvent
the wheel.; BloomReach is one of those applications.
BloomReach is taking a very targeted, very hands-free approach to big data for its
customers. It‘s offering a SaaS-based product that job listings say is for ―helping leading online
businesses uncover the highest quality, most relevant content sought by their consumers, when
and where they want it.‖ Founded by a team with roots at Google, Cisco, Facebook and Yahoo,
among other companies, BloomReach has, according to one estimate, about 160 customers — all
of them among the top 10,000 websites, and most of them in the retail space. Among its core
technologies and methods are Hadoop, Lucene, Monte Carlo simulations and large-scale image
processing.‖
The information about the raised capital in each round was collected from AngelList.com‘s
profile of the BDVs. From the conception to business planning, product development,
commercialization, operationalization, expansion, and eventually public offering, new ventures
raise funds from different resources (e.g., Cumming 2007). Depending on the stage of the
venture‘s development, the fundraising round is labeled as seeding (i.e., no stage, often at the
conception and research stage), Stage A, Stage B, Stage C, etc. It is possible that a BDV raises
external funding at multiple rounds in the same stage of development. Therefore, a new venture
might have two or three rounds of seeding. In our operationalization of a fundraising period, we
focus on each round of fundraising and use the raised capital in that round as the dependent
variable. Then, we control for the stage at which the capital is raised.
Controls
As mentioned above, we control for the stage of development where the funding is raised.
We do so because early and late stages of fundraising are different in terms of the funding
providers,11F
18 as well as the amount of the capital needed.12F
19 To best capture the effect of the
fundraising stage, for each stage of development (e.g., seeding, stage A, etc.), we specify a
18
For example, angels contribute more in the early stages of the development, whereas venture
capitalists do so in the later stages close to the initial public offering (IPO). 19
Usually, the financial capital needed in the early stages of development are smaller than the
capital needed in the later stages.

84
variable, the value of which indicates the number of fundraising rounds a new venture has
completed in that stage, prior to the current round. Therefore, for BDVs with their first round of
fundraising, the value of seeding, stage A, stage B, and stage B variables is all set at 0. If a
venture has had two rounds of fundraising at the seeding stage, and the current round is its
second round at stage A, the value of seeding variable is set at 2, the value of stage A variable is
set at 1, and the value of stage B and stage C variables are set at 0.
In addition to measuring the inter-venture networks, an intra-venture’s intellectual
networks (networks among employees and founders) were also analyzed. This is because the
existing research has primarily focused on intra-organizational networks as motors of innovation
(e.g., Hansen 1999); therefore, we measure the network density and network constraint for all
BDVs‘ internal networks.
Also, we control for the number of years since a BDV has been established because the
time elapsed since establishment can have an effect on accessible financial and intellectual
resources. We control for the location dummy, measured at the city level, whether or not the
venture identifies itself as a business-to-business (B2B) or business-to-customer (identified by
B2B tags reported in AngelList.com), and the technological scope dummies which represent the
area of focus in the Big Data context (identified by tags reported in AngelList.com; can be
analytics, security, or infrastructural). Moreover, the number of employees13F
20 (including co-
founders) in the fundraising period of interest, and average of employees‘ (including co-
founders) value of education14F
21 are controlled for.
20
AngelList reports the date of employment and departure of employees. This data was used to
calculate number of employees employed in each fundraising period. 21
The LinkedIn account of each employee was accessed to obtain educational background of
employees. The highest degree obtained by each individual was then coded (high school

85
Analysis
We constructed a panel where each BDV is observed in each round of fundraising (i.e., the
BDVs are paneled over rounds of fundraising). This resulted in 6,810 venture-round
observations.15F
22 We split the sample to BDVs pursuing radical and incremental innovations, and
models are run within each sub-sample. For all of the models, and due to the panel structure of
the data, the models are processed using a generalized least squares (GLS) estimation with panel-
specific corrections for first-order auto-correlation and heteroskedasticity.
In order to test the hypothesis, we followed a step-wise approach. First, we tested the
structural effects of the financial capital networks (without inclusion of the intellectual networks‘
variables; (1.1 and 1.2)). Next, we tested the structural effects of intellectual capital networks
(without inclusion of financial capital networks‘ variables; (2)). Finally, we tested a full model
(3) by simultaneously considering the structural variables pertaining to both financial and
intellectual capital networks.
RaisedCapitalit = α0 + β1 * (Investment eigen. cent.)it + β2 * (Personal eigen. cent.)it
+ β3 * (Investment eigen. cent. * Personal eigen. cent.)it + Controls + ϵit (1.1)
RaisedCapitalit = α0 + β1 * (Superimposed eigen. cent.)it + Controls + ϵit (1.2)
RaisedCapital16F23
it = α0 + β1 * (SH-Edu)it + β2 * (D-Edu)it + β3 * (SH-Prof)it + β4 * (D-Prof)it
+ β5 * (SH-Edu * D-Prof)it + β6 * (D-Edu * SH-Prof)it + β7 * (D-Prof * D-
Edu)it
+ β8 * (SH-Edu * SH-Prof)it + β9 * (D-Edu * SH-Edu)it
+ β10 * (D-Prof * SH-Prof)it + Controls + ϵit (2)
diploma=1, associate degree= 2, undergraduate degree= 3, master‘s degree= 4, doctorate= 5)
and averaged for each BDV. 22
Appendix B presents the correlations among key variables. 23
SH denotes structural holes; D denotes density; Edu denotes educational networks; Prof
denotes professional network. IVN denotes intra venture network.

86
RaisedCapitalit = α0 + β1 * (SH-Edu)it + β2 * (D-Edu)it + β3 * (SH-Prof)it + β4 * (D-Prof)it
+ β5 * (SH-Edu * D-Prof)it + β6 * (D-Edu * SH-Prof)it + β7 * (D-Prof * D-
Edu)it
+ β8 * (SH-Edu * SH-Prof)it + β9 * (D-Edu * SH-Edu)it
+ β10 * (D-Prof * SH-Prof)it + β10 * (Superimposed eigen. cent.)it
+ Controls + ϵit (3)
Table 3 represents the results of the first step, the model investigating the effect of
eigenvector centrality in personal and investment networks. We start with a model that treats the
two networks as structurally separate and only includes the direct effect of eigenvector centrality
in each network (Model 1). Results from this model show no significant effect from either of the
centrality measures in the two networks. However, when the cross-effect of eigenvector
centrality in personal and investment networks is considered, a positive and significant
coefficient is observed (Model 2), indicating that holding a central position among influential
investors helps only when a central position in the personal networks is held. In order to examine
the structural difference between the personal and investment networks, we calculate the Kendall
rank correlation between eigenvector centrality in investment and personal networks (following
Battiston et al. 2014). The results (Table 4) show a significantly high correlation between the two
measures (0.73) indicating that the two networks are structurally convergent, thereby justifying
superimposing the two networks. Hence, the two networks were superimposed, with the
redundant ties between the two networks being assigned with the sum of the weights of ties in
the two networks when considered separately. Also, if a tie existed in one network and not in the
other, the tie was included in the superimposed network with its weight set at the original weight
it had in the separated network. Then, we measured the eigenvector centrality in the newly
constructed superimposed network. The results (Model 3 in Table 3) show that in BDVs
pursuing both incremental and radical innovations, eigenvector centrality in the superimposed

87
networks is positively and significantly associated with the raised capital. Taken together, the
results provide support for H1.
---Insert Tables 3 and 4 here---
In the second step, we tested for the effect of structural holes and network density in both
educational and professional networks. Similar to our approach investigating the financial capital
networks, we started our analysis by treating the two networks structurally separate. The results
of direct effect models (4 and 6 in Table 5) suggest that while the presence of structural holes in
both networks positively and significantly affects the raised capital in BDVs pursing radical and
incremental innovations, density does not show a significant effect in either of the networks.
Also, the coefficient estimates of structural holes and density from intra-venture networks
suggest a similar pattern where structural holes in both educational and professional networks
show positive and significant association with the raised capital, whereas the coefficient estimate
of network density in both educational and professional networks shows insignificant
associations. However, our examination of the cross-effects between the networks suggests a
clear trend (Models 5 and 7). For radical innovations, the interactions between educational
network‘s density and professional network‘s structural holes, as well as the interaction between
educational network‘s structural holes and professional network‘s density, are positive and
significant, suggesting that the effect of high structural holes in one network increases with the
increase in the density of the other network, supporting H2. For BDVs pursuing incremental
innovations, the increase in one network‘s density does not increase the value of structural holes
in the other (supporting H3).
Also, for BDVs in the two sub-samples, the coefficient of interaction between network
density in educational and professional networks is negative and significant, indicating that

88
network density in one network erodes value from the network density in the other, supporting
H4. Moreover, for BDVs pursuing incremental innovations, the interaction of structural holes in
educational and professional networks show a negative and significant association with the
capital raised, indicating that increasing structural holes in one network erodes value from the
structural holes present in the other, supporting H5. Finally, for BDVs pursuing incremental
innovations, the coefficient of interaction between structural holes in educational and
professional networks is positive and significant, indicating that structural holes in one network
increase the value of structural holes in the other, supporting H6.
While we had hypothesized about the structural cross-effects of the two networks, we also
control for interaction of network density and structural holes in the same network. Although the
two structural measure are strongly and significantly correlated (-0.15), we controlled for these
interactions to remove any effect that the co-occurrence of structural holes and network density
in the same network might have. The results suggest that for incremental innovation, increasing
network density in a network erodes value from the effect of its structural holes, while for radical
innovation, the coefficients of interaction between density and structural holes in the same
network is insignificant.
Similar to the case of financial capital networks, we compared the structural similarity of
educational and professional networks. The results of the Kendall rank correlation tests (also
reported in Table 3) indicate that the structural features of the two networks are diverging. The
correlation between the structural holes of the two networks is 0.11 while the correlation
between the densities of the two networks is 0.18. This justifies structural separation of
educational and professional networks.
---Insert Table 5 here---

89
In the last step of our primary analysis, we include the eigenvector centrality in the
superimposed financial capital network, along with the structural holes and density measures of
professional and educational networks. Estimating these full models (Models 8 and 9 in Table 6)
shows patterns of results that are similar to when the effects of structural positions in financial
and intellectual capital networks are examined separately.
---Insert Table 6 here---
In conducting the main analysis, we established the inter-venture links by considering ties of
founders as well as employees of the BDVs in the sample. However, it might be contended that
founder ties are more influential in accessing both intellectual and financial capital. Founders are
deemed as the main drivers of development and refinement of innovation (Amitt and Zott 2001)
and also involve directly in fundraising activities (e.g., Birley 1986; Wetzel 1987; Harrison and
Mason 1992; Webb et al. 2013; Thai and Turkina 2014). In order to focus on the power of
founders‘ network, we conduct our main analysis by only considering the intellectual and
financial capital networks that are defined based on founders‘ ties only. Models 10 and 11 in
Table 7 represent these results. The findings from this table suggest that the main hypotheses
hold robust when networks based on founders‘ ties are considered.
---Insert Table 7 here---
Sub-Sample Analysis: Technological Scope
In the context of BDVs, we define the technological scope as the main Big Data area that the
BDV‘s product/service is focused on. Big data technologies cover diverse technological areas,
most distinctively, big data security (McAfee and Brynjolfsson 2012), analytics applications
(LaValle et al. 2013), and big data infrastructure (e.g., computing) (Jacobs 2009, McAfee and
Brynjolfsson 2012). The review of the existing literature on Big Data suggests that Big Data

90
technologies are also diverse in their architectural scope. While some big data technologies (e.g.,
cloud-based computing structures (Grossman and Siegel 2014)) are at the infrastructural level of
IT architecture (see Weill and Vitale 2002 for a discussion of IT enterprise architecture) some
technologies target analytics application layer (e.g., data modeling applications (Grossman and
Siegel 2014)). In addition to these more pronounced technological scopes, a third scope in Big
Data is concerned with the security applications that protect large operations of the Big Data
innovations belonging to the two other technological scopes.
We suspect that the three scopes of BD require different levels of knowledge diversity and
complexity in knowledge exchange and hence will be enabled by distinct network structures.
Therefore, our general arguments regarding the mix of structural holes and network density
might not be homogeneously applicable in all contexts. These scopes can be different in terms of
the way the required knowledge for their development is dispersed in the network. Absent
previous literature regarding these differences, we adopt an inductive approach and conduct our
analyses in sub-samples corresponding to the three technological scopes. Table 8 (Models 12-17)
represents the result of this sub-sample analysis.
---Insert Table 8 here---
Findings suggest that the results regarding the effect of financial capital networks‘
eigenvector centrality is consistent across the three scopes. However, the result shows
differences when the effects of structural holes and network densities of intellectual capital
networks are considered. For BDVs active in the security scope, the structure of intellectual
capital network shows a pattern similar to what was observed in the full model analysis.
However, while in the full sample analysis a trend was observed that structural holes in one
network and network density in the other positively interact to affect raised capital for BDVs

91
pursuing radical innovations, the subsample results show that for the BDVs in the analytics
scope, only structural holes in the educational network and network density in the professional
network positively and significantly interact. However, for BDVs in the infrastructural scope,
only structural holes in the professional networks and network density in educational networks
show the same complementary interaction. These results can be interpreted by considering that
analytics innovations are built on a broader span of knowledge, from statistics to distributed
computing, and thus diversity in the educational background is key to their development. In such
a case, professional networks can bring the network cohesion required to transfer complex ideas
needed for the development of radical innovations. On the contrary, Big Data infrastructural
innovations involve a complex exchange of knowledge, mostly developed in the computer
science, therefore, BDVs can benefit from high cohesion in the educational networks and obtain
diverse ideas from their professional ties. Due to infrastructural innovations‘ dependence on the
exchange of complex knowledge, increasing network density in one network does not erode
value from the network density in another. Moreover, structural holes in one network do not
show a significant complementarity with structural holes in another intellectual capital network.
Comparison with non-IT Context
Our hypothesizing about the effect of inter-venture networks heavily relies on the socially-
constructed nature of IT innovations that is evidenced by the previous research. We believe the
multi-disciplinary nature of IT innovations, combined with the dispersed access to the cutting-
edge IT knowledge, contributes to the patterns observed in terms of the effect of intellectual
capital networks. In order to further investigate this unique nature of IT innovation, we conduct
our model in a different industry, i.e., Medical Device, which shows a comparable level of
average valuation (i.e., $4.5 million). To allow a fair comparison between the two industries, we

92
constructed a matched sample following suggestions of Chae et al. 2014. In doing so, for each
venture-round observation in the Big Data sample, a venture-round observation in the Medical
Device context was selected that was in the 0.30% range of employee size and level of employee
education, and share the same year of establishment with the venture from the Big Data Sample.
Due to the restrictions for building the matched sample, the sample in the Medical Devices
context had fewer observations (5,182).17F
24
We start our matched sample analysis by assuming that similar to the Big Data context,
personal and investment networks have similar structure, whereas educational and professional
networks are structurally distinct. Therefore, we replicated our full models (Models 8 and 9) for
the Medical Devices sample (Models 18 and 19 in Table 9). While in both Big Data and Medical
Devices sample eigenvector centrality in the financial capital market is positively and
significantly associated with raised capital, the results for the effect of intellectual capital
networks‘ structure on capital raised are not converging.
---Insert Table 9 here---
A possible explanation for such a difference between the two industries is the difference in
the structural similarity of educational and professional networks. To investigate this possible
explanation, we first calculate the Kandall correlation coefficient for structural features of
networks in the Medical Devices industry. The results (Table 10) show that although personal
and investment networks are structurally similar (similar to the Big Data context), there is also a
high correlation between the structural features of educational and professional networks.
Specifically, the correlation coefficient between structural holes in educational and professional
networks is 0.46, and the correlation coefficient between network densities in the two networks
24
Only observations that had a match in the Big Data sample were included.

93
in 0.38. This indicates that the structural separation of educational and professional networks in
the Medical Devices context might be misleading. To address this issue, we superimpose the
educational and professional networks in the Medical Devices context and calculate the network
density, structural holes, and interaction between the two based on a single network of
intellectual capital.
---Insert Table 10 here---
The results of this modified model are also presented in Table 9 (Models 20 and 21). The
findings show insignificant coefficients for structural holes, density, and the interaction of the
two for inter-venture networks. However, the results indicate that while intra-venture structural
holes in ventures pursuing both radical and incremental innovations are positively and
significantly associated with the raised capital, the intra-venture network density has a positive
and significant association with the raised capital only for radical innovations. Taken together,
these results indicate two distinctions between the intellectual capital networks in Big Data and
Medical Devices industries. First, educational and professional networks in the Big Data industry
are structurally distinct, whereas the two networks show similar characteristics in the Medical
Devices context. Second, while in the Big Data context inter-venture intellectual networks
contribute to the capital raised, therefore providing evidence for their socially-constructed nature,
in the Medical Devices context, only intra-venture intellectual capital networks contribute to the
raised capital.
Network Effects on Inception of Innovation
Thus far, we have viewed intellectual networks as mediums through which BDVs access
knowledge resources required to refine and further develop their initial idea. It is also possible
that educational and professional ties of entrepreneurs affect the radicalness of innovation at its

94
inception. In order to test for such an effect, we investigate the effect of intellectual networks‘
structure on whether a BDV pursues a radical or incremental innovation. Specifically, we
consider the educational and professional ties of the founders of a BDV one year before
establishment. Since we need access to data about existing BDVs one year prior to establishment
of a focal one, this analysis is done on BDVs established after January 1st 2012. Table 11
presents two models (Models 22 and 23) with direct and interaction effects of inter-venture
educational and professional networks‘ structure.
---Insert Table 11 here---
The results suggest that network density or structural holes alone do not affect the type of
innovation a BDV pursues. However, the coefficients of the interaction between network density
in one network and structural holes in other are positive and significant. Therefore, as the
network density in one intellectual capital network increases, it increases the positive effect that
structural holes have on a BDV‘s pursuit of radical innovations. Moreover, the results show as
the structural holes in one network increase, it increases the likelihood that structural holes in
another leads to a BDV‘s pursuit of incremental innovations. Figure 3 presents the emerging
model from our study.

95
Figure 3. Emerging Research Model
Discussion
Focusing on BDVs, this study investigates the effect that intellectual and financial capital
networks have on a new venture‘s success, in terms of the raised capital in a fundraising period.
Specifically, educational and professional networks are identified as structurally distinct
networks that facilitate the flow of knowledge resources to BDVs for improvement and
development of their innovation. The results suggest that for radical innovations, one of the
educational or professional networks can supply the BDV with structural holes, enabling access
to diverse ideas, and the other can provide the network density needed to exchange complex
knowledge required for development of novel ideas. Moreover, our findings suggest that for
incremental innovations, diverse ideas obtained from educational networks can complement
those obtained from professional ties. Specifically, these effects are persistent for ties made by
founders only, or when extended ties among venture employees are also considered. Moreover,
the results suggest that intellectual networks of founders can affect the type of innovation, radical

96
or incremental, at the inception stage. Also, we found that depending on the technological scope,
the structural features of intellectual networks required for success change.
In addition to the effects of intellectual capital networks, our results suggest that personal
ties with other BDVs‘ founders and employees, personal ties made with angels and capitalists,
and ties based on previous investments are pertinent for raising capital. Specifically, we found
that eigenvector centrality in the financial capital network positively, significantly, and
consistently predicts the BDV‘s success.
Finally, our findings provide evidence that unlike the case of the Big Data context, inter-
venture intellectual networks do not contribute to fundraising success in a comparable non-IT
context, i.e., Medical Devices. The results suggest that while innovations are socially constructed
in the context of IT generally, and Big Data specifically, this is not always the case, as evidence
by lack of support for effects of inter-venture intellectual capital networks in the context of
Medical Devices. Further, the results indicate that unlike the case in the IT context, educational
and professional networks are not structurally distinct in a non-IT context such as Medical
Devices.
Contributions
Primarily, this study contributes to the literature on IT innovations (e.g., Nambisan et al.
1999; Fichman 2001, Han et al. 2012) which has mostly examined them in the context of
established firms (Han et al. 2012). However, with innovations generated by new ventures
becoming increasingly important in the IT field, this study extends the literature by focusing on
innovations generated in new ventures and providing a network framework that explains the
success of the innovation. Specifically, this study shows that IT innovations are socially-
constructed through intellectual networks of association that exist among venture in an industry.

97
Moreover, this study documents that such social embeddedness of innovation is not prevalent in
other non-IT contexts.
Second, while the general literature on new ventures‘ success has mainly focused on the
networks that help obtaining financial and reputational resources, this study extends this network
view by empirically providing evidence that external intellectual ties with other new ventures
also contribute to the success of a focal new venture, especially for those ventures that are still at
the early stages of development. Specifically, in the IT context, our results provide evidence for
how innovations can be socially developed and refined through intellectual ties among new
ventures in the same industry. Also, the study suggests that while intellectual networks operate as
a driving factor for pursuit of certain types innovations in the conception stages, they operate as a
factor that interacts with that type of innovation (radical or incremental) to predict financial
success.
Third, this study extends the network research in new ventures that has mainly focused on
aggregated networks (Lechner et al. 2006), by introducing separate networks and distinguishing
the structural interplay between them. More importantly, we show an empirical approach that
depends on the structural similarities to aggregate or disaggregate distinct network ties. An
implication of disaggregating inter-venture networks is resolving the equivocal suggestions made
by previous research. For example, while anecdotal evidence (e.g., Elfring and Hulsink 2003)
suggest that a mix of structural holes and network cohesion is required for success of radical
innovations, co-presence of the two structural features in a singular network is unlikely to
happen. However, considering ties with different contents as distinct, we showed that a new
venture can access structural holes in one network and simultaneously access cohesion in
another.

98
Practical Implications
From a practical perspective, this study has a number of implications. First, the results of the
study inform entrepreneurs and incubator managers about networking strategies contingent with
the type of innovation a new venture pursues. Specifically, our findings suggest that intellectual
ties should be appropriated by considering the radicalness of the innovation a new venture
pursues. Figures 4a and 4b present a blue print for networking structures appropriate for each
type of innovation. Another implication of this study is for incubator firms. Incubator firms
mainly focus on providing new ventures with networking opportunities that connect
entrepreneurs with angels and venture capitalists. However, findings of our study suggest that
personal ties with employees that founders of other BDVs can also contribute to fundraising
success.
Also, our findings suggest that networking efforts for obtaining financial and reputational
resources can be extended by developing proper intellectual links, by considering the educational
and professional background of new recruitments. Specifically, our findings suggest that
ventures pursuing incremental innovations need to diversify both of their educational and
professional backgrounds. Moreover, ventures pursuing radical innovations should consider
building a dense network of one type, e.g., educational, and supplement this dense network with
a diverse network of another type, e.g., professional. These findings also provide investors with
additional information to evaluate success of new ventures. Since access to financial capital is
key to new ventures‘ success, and since intellectual capital networks play a key role in a new
venture at development stages, investors can evaluate the promise of the venture by considering
its embeddedness in intellectual networks, while taking into account the radicalness of
innovation pursued by the venture.

99
Figure 4a. Networking Structure Appropriate for BDVs Pursuing Radical Innovations
Figure 4b. Networking Structure Appropriate for BDVs Pursuing Incremental Innovations
Limitations
In spite of its contributions, the findings of the study should be interpreted considering its
limitations. First, we use the BDVs listed on AngelList.com and ties evidenced in the website
and LinkedIn to construct financial capital and intellectual capital networks. While it is possible
that some ties are omitted due to the incomplete information in the website or due to lack of
access to BDVs that are not present in the AngelList.com, threat of tie or node omission is a

100
well-known limitation of network studies. However, we are encouraged by the number of BDVs
studied that is considerably higher than the sample size in similar studies. Also, in studying
intellectual capital networks, we focused on educational and professional networks of
association. We were limited in our access to other types of intellectual associations such as
journal memberships or attendance to field-related conferences. We suggest that future research
investigates other types of intellectual association and evaluate the role they have in raising
financial resources. Moreover, in identifying the radicalness of innovations, we rely on a
venture‘s description of a product as well as news report and blog posts about it. Self-
descriptions and news coverage might be biased towards claiming a product/service radical.
However, we strongly believe that our approach might contain less bias compared to the
alternative approaches used, such as self-reported measures. Moreover, while the interaction
between different network structures provides evidence of symmetrical complementarity
between structural holes and network density for BDVs pursuing radical innovations, the
theoretical arguments point to the possibility of a sequential complementarity. While studying
this sequential complementarity is out of this study‘ scope, we encourage future studies to further
investigate it.
Finally, in our matched sample comparison with non-IT contexts, we had only investigated one
other context, i.e., Medical Devices, mainly due to the limitations in accessing another industry
present in AngelList.com with similar valuation range and enough observations to make
meaningful comparisons. We believe that further research is required to further examine the
uniqueness of the effect of inter-venture intellectual networks to the IT context.

101
References
Amit, R., and C. Zott. 2001, "Value Creation in e‐business," Strategic Management Journal
(22:6‐7), pp. 493-520.
Battiston, F., V. Nicosia, and V. Latora. 2014, "Structural Measures for Multiplex Networks,"
Physical Review E (89:3), pp. 032804.
Baum, J. A., T. Calabrese, and B. S. Silverman. 2000, "Don't Go it Alone: Alliance Network
Composition and Startups' Performance in Canadian Biotechnology," Strategic Management
Journal (21:3), pp. 267-294.
Bhide, A., and H. Stevenson. 1992, "Trust, Uncertainty, and Profit," The Journal of Socio-
Economics (21:3), pp. 191-208.
Birley, S. 1986, "The Role of Networks in the Entrepreneurial Process," Journal of Business
Venturing (1:1), pp. 107-117.
Bloodgood, J. M., H. J. Sapienza, and A. L. Carsrud. 1995, "The Dynamics of New Business
Start-Ups: Person, Context, and Process," Advances in Entrepreneurship, Firm Emergence
and Growth (2), pp. 123-144.
Bonacich, P. 1972, "Factoring and Weighting Approaches to Status Scores and Clique
Identification," Journal of Mathematical Sociology (2:1), pp. 113-120.
Brajkovich, L. F. 1994, "Sources of Social Structure in a Start-Up Organization: Work
Networks, Work Activities, and Job Status," Social Networks (16:3), pp. 191-212.
Brüderl, J., and P. Preisendörfer. 1998, "Network Support and the Success of Newly Founded
Business," Small Business Economics (10:3), pp. 213-225.
Burt, R. 2008, "Measuring Access to Structural Holes," University of Chicago Graduate School
of Business, Chicago.
Burt, R. S. 2004, "Structural Holes and Good ideas1," American Journal of Sociology (110:2),
pp. 349-399.
———. 2009. Structural Holes: The Social Structure of Competition, Harvard university press.
Casper, S. 2007, "How do Technology Clusters Emerge and Become Sustainable?: Social
Network Formation and Inter-Firm Mobility within the San Diego Biotechnology Cluster,"
Research Policy (36:4), pp. 438-455.
Chae, H., C. E. Koh, and V. R. Prybutok. 2014, "Information Technology Capability and Firm
Performance: Contradictory Findings and their Possible Causes." MIS Quarterly (38:1), .

102
Chen, H., R. H. Chiang, and V. C. Storey. 2012, "Business Intelligence and Analytics: From Big
Data to Big Impact." MIS Quarterly (36:4), pp. 1165-1188.
Chen, X., X. Yao, and S. Kotha. 2009, "Entrepreneur Passion and Preparedness in Business Plan
Presentations: A Persuasion Analysis of Venture Capitalists' Funding Decisions," Academy
of Management Journal (52:1), pp. 199-214.
Clarysse, B., M. Knockaert, and A. Lockett. 2007, "Outside Board Members in High Tech Start-
Ups," Small Business Economics (29:3), pp. 243-259.
Couger, J. D. 1973, "Curriculum Recommendations for Undergraduate Programs in Information
Systems," Communications of the ACM (16:12), pp. 727-749.
Cumming, D. 2007, "Government Policy Towards Entrepreneurial Finance: Innovation
Investment Funds," Journal of Business Venturing (22:2), pp. 193-235.
Dhar, V. 2013, "Data Science and Prediction," Communications of the ACM (56:12), pp. 64-73.
Elfring, T., and W. Hulsink. 2003, "Networks in Entrepreneurship: The Case of High-
Technology Firms," Small Business Economics (21:4), pp. 409-422.
Ettlie, J. E., W. P. Bridges, and R. D. O'keefe. 1984, "Organization Strategy and Structural
Differences for Radical Versus Incremental Innovation," Management Science (30:6), pp.
682-695.
Ferrary, M. 2003, "The Gift Exchange in the Social Networks of Silicon Valley," California
Management Review (45:4), pp. 120-138.
Fichman, R. G. 2001, "The Role of Aggregation in the Measurement of IT-Related
Organizational Innovation," MIS Quarterlypp. 427-455.
Florin, J., M. Lubatkin, and W. Schulze. 2003, "A Social Capital Model of High-Growth
Ventures," Academy of Management Journal (46:3), pp. 374-384.
Gilbert, B. A., P. P. McDougall, and D. B. Audretsch. 2008, "Clusters, Knowledge Spillovers
and New Venture Performance: An Empirical Examination," Journal of Business Venturing
(23:4), pp. 405-422.
Glückler, J., and T. Armbrüster. 2003, "Bridging Uncertainty in Management Consulting: The
Mechanisms of Trust and Networked Reputation," Organization Studies (24:2), pp. 269-
297.
Goes, P. B. 2014, "Editor's Comments: Big Data and IS Research," Mis Quarterly (38:3), pp. iii-
viii.

103
Gargiulo, M., and M. Benassi. 1999. "The Dark Side of Social Capital," Corporate Social
Capital and Liability, Anonymous Springer, pp. 298-322.
Granovetter, M. 1973, "The Strength of Weak Ties," American Journal of Sociology (78:6), pp.
l.
Grossman, R. L., and K. P. Siegel. 2014, "Organizational Models for Big Data and Analytics,"
Journal of Organization Design (3:1), pp. 20-25.
Hallen, B. L., and K. M. Eisenhardt. 2012, "Catalyzing Strategies and Efficient Tie Formation:
How Entrepreneurial Firms Obtain Investment Ties," Academy of Management Journal
(55:1), pp. 35-70.
Han, K., W. Oh, K. S. Im, R. M. Chang, H. Oh, and A. Pinsonneault. 2012, "Value Cocreation
and Wealth Spillover in Open Innovation Alliances," MIS Quarterly (36:1), pp. 291-325.
Hanneman, R. A., and M. Riddle. 2005, Introduction to Social Network Methods.
Hansen, E. L. 1995, "Entrepreneurial Networks and New Organization Growth,"
Entrepreneurship: Theory and Practice (19:4), pp. 7-20.
Hansen, M. T. 1999, "The Search-Transfer Problem: The Role of Weak Ties in Sharing
Knowledge Across Organization Subunits," Administrative Science Quarterly (44:1), pp.
82-111.
Harrison, R. T., and C. M. Mason. 1992, "International Perspectives on the Supply of Informal
Venture Capital," Journal of Business Venturing (7:6), pp. 459-475.
Hite, J. M., and W. S. Hesterly. 2001, "The Evolution of Firm Networks: From Emergence to
Early Growth of the Firm," Strategic Management Journal (22:3), pp. 275-286.
Hoang, H., and B. Antoncic. 2003, "Network-Based Research in Entrepreneurship: A Critical
Review," Journal of Business Venturing (18:2), pp. 165-187.
Hsu, D. H. 2004, "What do Entrepreneurs Pay for Venture Capital Affiliation?" The Journal of
Finance (59:4), pp. 1805-1844.
Inge Jenssen, J., and A. Greve. 2002, "Does the Degree of Redundancy in Social Networks
Influence the Success of Business Start-Ups?" International Journal of Entrepreneurial
Behavior & Research (8:5), pp. 254-267.
Jacobs, A. 2009, "The Pathologies of Big Data," Communications of the ACM (52:8), pp. 36-44.
Jenssen, J. I., and H. F. Koenig. 2002, "The Effect of Social Networks on Resource Access and
Business Start-Ups," European Planning Studies (10:8), pp. 1039-1046.

104
Johannisson, B., 2000, ‗Networking and Entrepreneurial Growth‘, in D. L. Sexton and H.
Landström (eds.), The Blackwell Handbook of Entrepreneurship, Oxford: Blackwell.
Johannisson, B., O. Alexanderson, K. Nowicki, and K. Senneseth. 1994, "Beyond Anarchy and
Organization: Entrepreneurs in Contextual Networks," Entrepreneurship & Regional
Development (6:4), pp. 329-356.
Kautz, K., S. Madsen, and J. Nørbjerg. 2007, "Persistent Problems and Practices in Information
Systems Development," Information Systems Journal (17:3), pp. 217-239.
Knill, A. 2009, "Should Venture Capitalists Put all their Eggs in One Basket? Diversification
Versus Pure‐Play Strategies in Venture Capital," Financial Management (38:3), pp. 441-
486.
Kollmann, T., and A. Kuckertz. 2010, "Evaluation Uncertainty of Venture Capitalists'
Investment Criteria," Journal of Business Research (63:7), pp. 741-747.
Krackhardt, D., 1992, ―The Strength of Strong Ties: The Importance of Philos in Organizations,‖
in N. Nohria and R. G. Eccles (eds.), Networks and Organizations:Structure, Form and
Action, Cambridge, MA: HBS Press, pp. 216–239.
Kuemmerle, W. 2002, "Home Base and Knowledge Management in International Ventures,"
Journal of Business Venturing (17:2), pp. 99-122.
LaValle, S., E. Lesser, R. Shockley, M. S. Hopkins, and N. Kruschwitz. 2013, "Big Data,
Analytics and the Path from Insights to Value," MIT Sloan Management Review (21:.
Lechner, C., M. Dowling, and I. Welpe. 2006, "Firm Networks and Firm Development: The Role
of the Relational Mix," Journal of Business Venturing (21:4), pp. 514-540.
MacMillan, I. C., R. Siegel, and P. S. Narasimha. 1986, "Criteria used by Venture Capitalists to
Evaluate New Venture Proposals," Journal of Business Venturing (1:1), pp. 119-128.
Maurer, I., and M. Ebers. 2006, "Dynamics of Social Capital and their Performance Implications:
Lessons from Biotechnology Start-Ups," Administrative Science Quarterly (51:2), pp. 262-
292.
McAfee, A., and E. Brynjolfsson. 2012, "Big Data: The Management Revolution," Harvard
Business Review (90:10), Oct, pp. 60-6, 68, 128.
McPherson, M., L. Smith-Lovin, and J. M. Cook. 2001, "Birds of a Feather: Homophily in
Social Networks," Annual Review of Sociologypp. 415-444.
Mehra, A., A. L. Dixon, D. J. Brass, and B. Robertson. 2006, "The Social Network Ties of
Group Leaders: Implications for Group Performance and Leader Reputation," Organization
Science (17:1), pp. 64-79.

105
Nambisan, S., R. Agarwal, and M. Tanniru. 1999, "Organizational Mechanisms for Enhancing
User Innovation in Information Technology," MIS Quarterlypp. 365-395.
Obstfeld, D. 2005, "Social Networks, the Tertius Iungens Orientation, and Involvement in
Innovation," Administrative Science Quarterly (50:1), pp. 100-130.
Ostgaard, T. A., and S. Birley. 1996, "New Venture Growth and Personal Networks," Journal of
Business Research (36:1), pp. 37-50.
Pirolo, L., and M. Presutti. 2010, "The Impact of Social Capital on the Start‐ups' Performance
Growth," Journal of Small Business Management (48:2), pp. 197-227.
Powell, W. W., K. W. Koput, and L. Smith-Doerr. 1996, "Interorganizational Collaboration and
the Locus of Innovation: Networks of Learning in Biotechnology," Administrative Science
Quarterlypp. 116-145.
Preston, D. S., and E. Karahanna. 2009, "Antecedents of IS Strategic Alignment: A Nomological
Network," Information Systems Research (20:2), pp. 159-179.
Rosenbusch, N., J. Brinckmann, and A. Bausch. 2011, "Is Innovation always Beneficial? A
Meta-Analysis of the Relationship between Innovation and Performance in SMEs," Journal
of Business Venturing (26:4), pp. 441-457.
Rowley, T., D. Behrens, and D. Krackhardt. 2000, "Redundant Governance Structures: An
Analysis of Structural and Relational Embeddedness in the Steel and Semiconductor
Industries," Strategic Management Journal (21:3), pp. 369-386.
Saxenian, A. 1990, "Regional Networks and the Resurgence of Silicon Valley," California
Management Review (33:1), pp. 89-112.
Smith, K. G., C. J. Collins, and K. D. Clark. 2005, "Existing Knowledge, Knowledge Creation
Capability, and the Rate of New Product Introduction in High-Technology Firms," Academy
of Management Journal (48:2), pp. 346-357.
Sørensen, M. 2007, "How Smart is Smart Money? A two‐sided Matching Model of Venture
Capital," The Journal of Finance (62:6), pp. 2725-2762.
Starr, J. A., and I. C. MacMillan. 1990, "Resource Cooptation via Social Contracting: Resource
Acquisition Strategies for New Ventures," Strategic Management Journal (11:4), pp. 79-92.
Steier, L., and R. Greenwood. 2000, "Entrepreneurship and the Evolution of Angel Financial
Networks," Organization Studies (21:1), pp. 163-192.
Thai, M. T. T., and E. Turkina. 2014, "Macro-Level Determinants of Formal Entrepreneurship
Versus Informal Entrepreneurship," Journal of Business Venturing (29:4), pp. 490-510.

106
Timmons, J. A., and W. D. Bygrave. 1986, "Venture Capital's Role in Financing Innovation for
Economic Growth," Journal of Business Venturing (1:2), pp. 161-176.
Tushman, M., and D. Nadler. 1986, "Organizing for Innovation," California Management
Review (28:3), pp. 74-92.
Uzzi, B. 1999, "Embeddedness in the Making of Financial Capital: How Social Relations and
Networks Benefit Firms Seeking Financing," American Sociological Reviewpp. 481-505.
———. 1997, "Social Structure and Competition in Interfirm Networks: The Paradox of
Embeddedness," Administrative Science Quarterlypp. 35-67.
Van Praag, M., A. Van Witteloostuijn, and J. Van der Sluis. 2013, "The Higher Returns to
Formal Education for Entrepreneurs Versus Employees," Small Business Economics (40:2),
pp. 375-396.
Wang, P., and N. C. Ramiller. 2009, "Community Learning in Information Technology
Innovation," Mis Quarterly (33:4), pp. 709-734.
Webb, J. W., G. D. Bruton, L. Tihanyi, and R. D. Ireland. 2013, "Research on Entrepreneurship
in the Informal Economy: Framing a Research Agenda," Journal of Business Venturing
(28:5), pp. 598-614.
Weill, P., and M. Vitale. 2002, "What IT Infrastructure Capabilities are Needed to Implement e-
Business Models?" Mis Quarterly (1:1), pp. 17.
Wetzel, W. E. 1987, "The Informal Venture Capital Market: Aspects of Scale and Market
Efficiency," Journal of Business Venturing (2:4), pp. 299-313.
Witt, P. 2004, "Entrepreneurs‘ Networks and the Success of Start-Ups," Entrepreneurship &
Regional Development (16:5), pp. 391-412.
Zott, C., and R. Amit. 2007, "Business Model Design and the Performance of Entrepreneurial
Firms," Organization Science (18:2), pp. 181-199.

107
Tables of Chapter 3
Table 1- Summary of the potentials of networks structures with high levels of structural
holes and network cohesion.
Potential for reach to diverse
knowledge
Potential for enabling
exchange of complex
knowledge
Structural holes H L
Network cohesion L H
Table 2- Type of innovation and the fostering network structure
Incremental innovations Radical innovations
Structural holes H H
Network cohesion L H
Table 3- The Effect of Financial Capital Networks
Networks treated separately Superimposed networks
Incremental Radical Incremental Radical
DV =Raised Capital Model 1 Model 2 Model 3
Investment eigen. cent. 0.012 0.009 0.004 0.003
Personal eigen. cent. 0.022 0.018 0.019 0.018
Investment eigen. cent.* Personal
eigen. cent. 0.083* 0.072*
Superimposed eigen. cent. 0.182*** 0.178***
Wald's Chi 1073.86 1112.52 1008.92 1161.14 2252.22 2371.34
N 2712 2712 4098 4098 2712 4098 Coefficients of variables number of employees, education of employees, number of years the BDV is established, and
dummies representing the scope of the BDV, type of innovation (B2B or B2C), location, funding series (i.e., no stage, seed,
A, B, C), and BDV’s year of establishment are not reported for brevity;
#p < 0.10, * p < 0.05, ** p < 0.01, *** p< 0.001;
GLS estimation with corrections for panel specific AR1 and Heteroskedasticity is used.
Table 4- Kendall Correlation of Different Networks’ Structural Features
Correlation
SH-Edu - SH-Prof 0.11#
Justifies separation
D-Edu - D-Edu 0.18* Justifies separation
SH-Edu - SH-Prof (IVN) 0.21* Justifies separation
D-Edu - D-Edu (IVN) 0.14
Justifies separation
Investment eigen. cent. - Personal eigen. cent. 0.73** Justifies superimposing
SH denotes structural holes; D denotes density; Edu denotes educational networks; Prof denotes
professional network. IVN denotes intra venture network.
#p < 0.10, * p < 0.05, ** p < 0.01;

108
Table 5- The Effect of Intellectual Capital Networks
Incremental Radical
DV= capital raised Model 4 Model 5 Model 6 Model 7
SH-Edu 0.114*** 0.082** 0.0131*** 0.182***
D-Edu -0.021 0.005 0.012 0.019
SH-Prof 0.153*** 0.093** 0.096** 0.149***
D-Prof -0.019 0.008 0.009 0.012
SH-Edu * D-Prof 0.011 0.173***
D-Prof * D-Edu -0.076** -0.082**
SH-Edu * SH-Prof 0.132*** -0.078*
D-Edu * SH-Prof 0.016 0.125***
D-Edu * SH-Edu -0.038* 0.014
D-Prof * SH-Prof -0.026# 0.008
IVN D- Prof 0.008 0.005 0.022* 0.052*
IVN D- Edu 0.014 0.017 0.031* 0.063*
IVN SH- Prof 0.098** 0.073* 0.097* 0.096**
IVN SH- Edu 0.086* 0.082* 0.110** 0.084*
Wald's Chi 3026.34 5783.67 3244.38 6111.32
N 2712 2712 4098 4098
SH denotes structural holes; D denotes density; Edu denotes educational networks; Prof denotes
professional network. IVN denotes intra venture network.
Coefficients of variables number of employees, education of employees, number of years the
BDV is established, and dummies representing the scope of the BDV, type of innovation (B2B or
B2C), location, funding series (i.e., no stage, seed, A, B, C), and BDV’s year of establishment are
not reported for brevity;
#p < 0.10, * p < 0.05, ** p < 0.01, *** p< 0.001;
GLS estimation with corrections for panel specific AR1 and Heteroskedasticity is used.

109
Table 6- The Effect of Both Financial Capital and Intellectual Capital Networks
Incremental Radical
DV= capital raised Model 8 Model 9
SH-Edu 0.098** 0.080*
D-Edu 0.008 0.015
SH-Prof 0.120*** 0.089**
D-Prof 0.017 0.012
SH-Edu * D-Prof -0.010 0.168***
D-Prof * D-Edu -0.114** -0.053*
SH-Edu * SH-Prof 0.129*** -0.074*
D-Edu * SH-Prof 0.012 0.059**
D-Edu * SH-Edu -0.037** 0.008
D-Prof * SH-Prof -0.019* 0.011
IVN D- Prof 0.008 0.033*
IVN D- Edu 0.009 0.035*
IVN SH- Prof 0.056* 0.073*
IVN SH- Edu 0.068* 0.082**
Superimposed eigen. cent. 0.201*** 0.188***
Wald's Chi 7812.39 8623.91
N 2712 4098
SH denotes structural holes; D denotes density; Edu denotes educational networks; Prof denotes
professional network. IVN denotes intra venture network.
Coefficients of variables number of employees, education of employees, number of years the
BDV is established, and dummies representing the scope of the BDV, type of innovation (B2B or
B2C), location, funding series (i.e., no stage, seed, A, B, C), and BDV’s year of establishment are
not reported for brevity;
#p < 0.10, * p < 0.05, ** p < 0.01, *** p< 0.001;
GLS estimation with corrections for panel specific AR1 and Heteroskedasticity is used.

110
Table 7- Full Model When Only Founders’ Ties Are Considered
Incremental Radical
DV= capital raised Model 10 Model 11
SH-Edu 0.083* 0.053*
D-Edu 0.011 0.009
SH-Prof 0.117*** 0.144***
D-Prof 0.020 0.018
SH-Edu * D-Prof 0.013 0.128***
D-Prof * D-Edu -0.162*** -0.099**
SH-Edu * SH-Prof 0.133*** -0.051*
D-Edu * SH-Prof 0.008 0.071*
D-Edu * SH-Edu -0.020# 0.008
D-Prof * SH-Prof -0.018* 0.003
IVN D- Prof 0.010 -0.003
IVN D- Edu 0.002 0.009
IVN SH- Prof 0.005 0.012
IVN SH- Edu 0.007 0.005
Superimposed eigen. cent. 0.202*** 0.192***
Wald's Chi 6794.31 7032.46
N 2712 4098
SH denotes structural holes; D denotes density; Edu denotes educational networks; Prof denotes
professional network. IVN denotes intra venture network.
Coefficients of variables number of employees, education of employees, number of years the
BDV is established, and dummies representing the scope of the BDV, type of innovation (B2B or
B2C), location, funding series (i.e., no stage, seed, A, B, C), and BDV’s year of establishment are
not reported for brevity;
#p < 0.10, * p < 0.05, ** p < 0.01, *** p< 0.001;
GLS estimation with corrections for panel specific AR1 and Heteroskedasticity is used.

111
Table 8- Sub-sample Analysis: Technological Scope
Analytics Security Infrastructure
Incremental Radical Incremental Radical Incremental Radical
DV= capital
raised Model 12 Model 13 Model 14 Model 15 Model 16 Model 17
SH-Edu 0.081** 0.072* 0.082** 0.061* 0.071* 0.096**
D-Edu 0.005 0.006 0.012 0.007 0.005 0.014
SH-Prof 0.098** 0.067* 0.092** 0.042* 0.089** 0.092*
D-Prof 0.010 0.013 0.008 0.010 0.019 0.007
SH-Edu * D-
Prof -0.017 0.191*** -0.011 0.111** -0.011 0.019
D-Prof * D-
Edu -0.211*** -0.103** -0.080* -0.051* -0.017 -0.011
SH-Edu * SH-
Prof 0.173*** -0.078** 0.062** -0.074* 0.016 -0.059*
D-Edu * SH-
Prof 0.005 0.017 0.003 0.063* 0.016 0.084**
D-Edu * SH-
Edu -0.021* 0.001 -0.018* 0.010 -0.021 0.001
D-Prof * SH-
Prof -0.014# -0.002 -0.012# 0.010 -0.011 -0.012
IVN D- Prof 0.003 0.041* 0.005 0.027* 0.003 0.044**
IVN D- Edu -0.004 0.056** 0.009 0.019# 0.009 0.022*
IVN SH- Prof 0.028* 0.081* 0.071* 0.082** 0.042* 0.108**
IVN SH- Edu 0.072** 0.090* 0.052* 0.091* 0.033** 0.094**
Superimposed
eigen. cent. 0.194*** 0.170*** 0.173*** 0.231*** 0.221*** 0.211***
Wald's Chi 6232.12 7002.56 6714.81 6537.79 7444.31 7518.29
N 982 1349 699 1030 1031 1719
SH denotes structural holes; D denotes density; Edu denotes educational networks; Prof denotes
professional network. IVN denotes intra venture network.
Coefficients of variables number of employees, education of employees, number of years the
BDV is established, and dummies representing the scope of the BDV, type of innovation (B2B or
B2C), location, funding series (i.e., no stage, seed, A, B, C), and BDV’s year of establishment are
not reported for brevity;
#p < 0.10, * p < 0.05, ** p < 0.01, *** p< 0.001;
GLS estimation with corrections for panel specific AR1 and Heteroskedasticity is used.

112
Table 9- Matched Sample Comparison with Medical Devices Industry
Big Data Medical Devices
Incremental Radical Incremental Radical Incremental Radical
DV= capital
raised Model 8 Model 9 Model 18 Model 19 Model 20 Model 21
SH-Edu 0.098** 0.080* 0.012 0.010
D-Edu 0.008 0.015 0.009 0.007
SH-Prof 0.120*** 0.089** 0.002 0.007
D-Prof 0.017 0.012 0.005 0.014
SH-Edu * D-Prof -0.010 0.168*** 0.011 0.016
D-Prof * D-Edu -0.114** -0.053* 0.005 0.008
SH-Edu * SH-
Prof 0.129*** -0.074* 0.005 0.005
D-Edu * SH-Prof 0.012 0.059** 0.003 0.009
D-Edu * SH-Edu -0.037** 0.008 -0.007 0.011
D-Prof * SH-
Prof -0.019* 0.011 -0.004 0.010
IVN D- Prof 0.008 0.033* 0.003 0.004
IVN D- Edu 0.009 0.035* 0.005 0.000
IVN SH- Prof 0.056* 0.073* -0.006 0.003
IVN SH- Edu 0.068* 0.082** -0.008 0.011
Superimposed
SH 0.012 0.009
Superimposed D 0.007 -0.007
Superimposed
SH * D 0.000 0.003
Superimposed
IVN SH 0.086** 0.092*
Superimposed
IVN D 0.019 0.039**
Superimposed
eigen. cent. 0.201*** 0.188*** 0.294*** 0.376*** 0.271*** 0.301***
Wald's Chi 7812.39 8623.91 4324.81 4526.72 5679.34 6103.38
N 2712 4098 1954 3228 1954 3228
SH denotes structural holes; D denotes density; Edu denotes educational networks; Prof denotes
professional network. IVN denotes intra venture network.
Coefficients of variables number of employees, education of employees, number of years the
BDV is established, and dummies representing the scope of the BDV, type of innovation (B2B or
B2C), location, funding series (i.e., no stage, seed, A, B, C), and BDV’s year of establishment are
not reported for brevity;
#p < 0.10, * p < 0.05, ** p < 0.01, *** p< 0.001;
GLS estimation with corrections for panel specific AR1 and Heteroskedasticity is used.

113
Table 10- Comparison of Kendall Rank Correlation Results
Medical Devices Big Data Benchmark
SH-Edu - SH-Prof 0.46*** 0.11#
D-Edu - D-Edu 0.38** 0.18*
SH-Edu - SH-Prof (IVN) 0.54** 0.21*
D-Edu - D-Edu (IVN) 0.28* 0.14
Investment eigen. cent. - Personal eigen. cent. 0.75*** 0.73**
SH denotes structural holes; D denotes density; Edu denotes educational networks; Prof denotes
professional network. IVN denotes intra venture network.
#p < 0.10, * p < 0.05, ** p < 0.01, *** p< 0.001.
Table 11- The Network Effect at the Inception Phase
DV= Radical Innovation Model 22 Odds
Ratio
Model 23 Odds
Ratio
SH-Edu 0.016 1.016 0.018 1.018
D-Edu 0.008 1.008 0.010 1.010
SH-Prof 0.015 1.015 0.007 1.007
D-Prof 0.004 1.004 0.007 1.007
SH-Edu * D-Prof 0.139*** 1.149
D-Prof * D-Edu 0.002 1.002
SH-Edu * SH-Prof -0.120*** 0.887
D-Edu * SH-Prof 0.151*** 1.163
D-Edu * SH-Edu 0.013 1.013
D-Prof * SH-Prof 0.015 1.015
IVN D- Prof 0.028* 1.028 0.034* 1.035
IVN D- Edu 0.021* 1.021 0.029** 1.029
IVN SH- Prof 0.008 0.005 0.011 0.010
IVN SH- Edu 0.006 0.001 0.008 0.008
Wald's Chi 3456.13 5896.83
N 1233
1233
SH denotes structural holes; D denotes density; Edu denotes educational networks; Prof denotes
professional network. IVN denotes intra venture network.
Coefficients of variables number of employees, education of employees, and dummies
representing the scope of the BDV, type of innovation (B2B or B2C), location, and BDV’s year
of establishment are not reported for brevity;
#p < 0.10, * p < 0.05, ** p < 0.01, *** p< 0.001;
Logistics regression is used for estimation.

114
Appendix A. Summary of the Research on New Ventures and Social Networks
Study Type of founders’ network Dependent variable Method
Saxenian 1990 Regional proximity N/A Theoretical
Brüderl and
Preisendörfer 1996
Kinship Survival,
employment
growth, and sales
growth
Survey
Ostgaard and Birley
1996
Personal networks Sales Survey
Baum et al. 2000 Diversity and size of
alliance network
Revenue Survey
Jenssen and Greve
2002
Personal networks Revenue Survey
Jenssen and Koeing
2002
Personal networks Information, finance Survey
Ferrary 2003 VC's centrality, gift
exchange network
N/A Theoretical
Florin et al. 2003 Composite equally weighted
measure of business
network, personal network,
and underwriters.
Capital raised Archival
Elfring and Hulsink
2003
Strong and weak ties
aggregated
Early performance Case study
Witt 2004 N/a Performance Literature
review
Lechner et al. 2006 Relational mix: reputational
network, competition
network, cooperative
networks
Sales, time to break
even
Survey
Maurer and Eber
2006
Social capital Performance Case study
Clarysse et al. 2007 Outside board members
density
Complementary tie
formation
Survey
Casper 2007 Regional proximity Regional clusters,
connections of
managers
Survey
Pirolo and Presutti
2010
Customer ties Sales, number of
products developed
Survey

115
Appendix B. Correlation Matrix
Mean S.D. 1 2 3 4 5
1 SH-Edu -27.83 5.71
2 D-Edu 35.61 12.67 -0.16**
3 SH-Prof -19.22 6.33 0.17** -0.08*
4 D-Prof 24.43 13.08 -0.07* 0.10* -0.19**
5 Superimposed
eigen. cent.
10.28 3.39 0.02 0.04 0.04 0.02
6 Raised Capital 4.73 1.64 0.21*** 0.11# 0.15** 0.05 0.32***
#p < 0.10, * p < 0.05, ** p < 0.01, *** p< 0.001; N= 6,810.

116
Chapter 4:
It is a Matter of Who Narrates the Lines
Abstract
New ventures are at the forefront of developing IT innovations. Increasingly, new ventures
turn to micro- and macro-funding social media platforms to promote their products/services and
raise the necessary capital for their development. Some initial efforts have recently been made to
understand how new ventures promote their products/services in funding platforms, but further
insights are needed in terms of at least two important aspects.
First, while the attention has been on the content of verbal communication with potential
investors, signals sent through non-verbal communications have not been considered. To address
this gap, we investigate the sequence of narrators, i.e., personal (e.g., founders or employees),
organizational (e.g., the official account of the venture in a funding platform), or external (e.g.,
news links, blog posts), who deliver promotional messages in the funding platform, as a non-
verbal aspect of communication with investors. Second, social media provides a context for new
ventures to promote their products/services in both macro-funding (i.e., with angels and venture
capitalists as the potential audience) and micro-funding platforms (i.e., with the public micro-
investors as the potential audience). While the two types of platforms require distinct ways of
communication to promote the product/service, activities on one platform are observable to the
main audience of the other. Therefore, studying cross-platform effects of non-verbal signals of
communication can further inform new ventures about strategies to access financial capital. We
investigate how the sequence of narrators in one platform affects the success of a new venture in
another.

117
Focusing on the new ventures active in one specific industry -Big Data- i.e., Big Data
ventures (BDVs), we follow the sequence of narrators in a venture‘s communication in one
micro-investor platform, i.e., Twitter, and one macro-investor platform, i.e., AngelList.
Collecting longitudinal data from 2011 to 2014, our empirical study investigates 1,213 BDVs
over multiple stages of their fundraising. We examine: a) whether BDVs more successful in
raising financial capital follow a converging sequence of narrators (i.e., the ideal sequence) in
their social media communication; b) whether similarity to the ideal sequence (i.e., the quality of
sequence) helps BDVs increase positive Word-of-Mouth (WoM) and access to financial capital;
and c) whether following sequences that are appropriate for one platform leads to beneficial
cross-platform spillovers. Our findings suggest that the ideal sequence of narrators varies
depending on the type of innovation pursued by a BDV, i.e., incremental or radical, and that the
similarity to the ideal sequence contributes to a BDV‘s positive WoM and financial success.
Moreover, our findings provide empirical support for cross-platform effects.
Keywords: Micro-funding, Macro-funding, Social media, Non-verbal communication signal,
Sequence of narrators, Cross-platform effect, Twitter, AngelList.

118
Introduction
Social media plays an important role in the success of contemporary entrepreneurial firms
by providing a forum to access future stakeholders, customers, and potential investors (Fischer
and Reuber 2014). Empirical evidence suggests that specifically for information technology (IT)
ventures, the role of social media in promoting the business is more salient (Fischer and Reuber
2014). Since most IT ventures promote their business on social media platforms, management of
Word-of-Mouth (WoM), i.e., users‘, customers‘, or followers‘ opinions (Gu et al. 2012), in such
platforms is an important factor in explaining success (Aggarwal et al. 2012). WoM reflects
interaction with external partners for IT ventures, and hence, its proper management can play an
integral role in a new venture‘s success. Specifically, new ventures utilize communicative tactics
(Fischer and Reuber 2014) as a part of their impression management strategy (Zott and Huy
2007) to maintain certainty, and thereby legitimacy, in the eyes of their audience. In doing so,
modern ventures are not bound to a single communication channel, rather, they promote their
product/service on multiple platforms. Specifically, while some of these platforms are intended
to reach out to micro-investors in public, others are designed to attract macro-investors such as
angels, venture capitalists, and larger firms (Belleflamme et al. 2014).
In spite of social media‘s prevalence (Rueber and Fischer 2010), as well as its
distinctiveness from other channels of communication for entrepreneurial firms (Fischer and
Rueber 2014), we lack understanding of the relevant communicative tactics for new ventures
(Fischer and Rueber 2014). Fischer and Reuber (2014) analyze the verbal content of
communication in social media and provide insights into the different types of content and their
effects on the venture‘s legitimacy. In this study, we use theories of symbolic action ( Zott and
Huy 2007; Smith et al. 2010; Li et al. 2015) to argue that: (a) social media enables the delivery

119
of a venture‘s narrative by different narrators; and (b) the selection of narrators can be a non-
verbal symbolic action (i.e., ―action in which the actor displays or tries to draw other people‘s
attention to the meaning of an object or action that goes beyond the object‘s or action‘s intrinsic
content or functional use‖ (Zott and Huy 2007, p. 70)) that affect the venture‘s legitimacy, and
thereby access to financial resources, beyond the content of its verbal narrative.
Approaching angels and venture capitalists is not the only way to access financial resources.
Instead, with the prevalence of crowdfunding, new ventures also extend their promotion
activities to platforms that are more focused on micro-investors. Studying multiple platforms is
therefore important. However, the general literature on WoM (Chevalier and Mayzlin 2006,
Trusov et al. 2009, Burtch et al. 2013) and the literature on WoM for new ventures (Kim and
Hann 2013, Mollick 2014, Thies and Wessel 2014, Lu et al. 2014, Macht and Weatherston 2014)
have focused on single electronic platforms. Thus, less is known about how potentially different
strategies in different platforms generate rents for new ventures, especially in the case of new IT
ventures. Therefore, promotion strategies in platforms that provide communication with micro-
and macro-investors should be studied simultaneously, and cross-effects of actions between the
two platforms need to be understood.
We leverage signaling theories and theories of symbolic actions and theorize about non-
verbal symbolic communications a new venture carries in multiple social media platforms.
Focusing on new ventures active in the Big Data industry, i.e., Big Data ventures (BDVs), we
follow the sequence of narrators in a venture‘s communication, as a form of non-verbal symbolic
communication, in one micro-investor platform, i.e., Twitter, and one macro-investor platform,
i.e., AngelList. Collecting longitudinal data from 2011 to 2014, our empirical study investigates
1,213 BDVs over multiple stages of their fundraising. We address the following specific research

120
questions: 1) Do BDVs that are more successful in raising financial capital follow a converging
sequence of narrators (i.e., the ideal sequence) in their social media communication (RQ1)? 2)
Does similarity to the ideal sequences that are appropriate for the platform (i.e., the quality of
sequence) enable BDVs to increase (a) positive WoM and (b) access to financial capital (RQ2)?
and 3) Does the quality of sequence in one platform show beneficial cross-platform spillovers
(RQ3)?
Theoretical Background
Impression Management
Impression management is a series of actions conducted by an organization, through which
it tries to positively influence its image (Bolino and Turnley 1999; Bozeman and Kacmar 1997;
Goffman 2002). Organizational impression management strategies span a wide range, broadly
classified into two categories. The first category includes strategies that focus on reversing
negative outcomes. These strategies can include restoring legitimacy following a controversial
event (Caillouet and Allen 1996; Elsbach 1994; Elsbach and Sutton 1992; Elsbach et al. 1998;
Graffin et al. 2011) or poor performance (Davidson et al., 2004), or increasing the acceptance of
controversial decisions (Arndt and Bigelow 2000; Elsbach et al. 1998; Graffin et al. 2011). The
second category includes strategies that focus on creating positive outcomes such as attracting
minority job applicants (e.g., Avery and McKay 2006) and creating cognitive legitimacy (e.g.,
Nagy et al. 2012).
New ventures follow different strategies, verbal or non-verbal (e.g., Ellis et al. 2002), in
order to attract much-needed financial resources (Parhankargas and Ehrlich 2014). Impression
management is therefore important for new ventures (REFs). For new ventures at the early stages
of development, creating legitimacy is among the most important impression management

121
strategies (Parhankargas and Ehrlich 2014). Establishing legitimacy is important for new
ventures because they face the challenges of the threats of newness and smallness (e.g., Chen et
al. 2009). As relatively unknown and believed to be too-small-to-compete entities, legitimization
help new ventures reduce investor uncertainty.
Although new ventures, similar to established firms, can face threats of controversial
decisions and their associated negative outcomes, the salience of such threats are often at a lower
level. Because of their limited public base, new ventures are rarely subject to the social scrutiny
that established firms face (e.g., Parhankargas and Ehrlich 2014). Rather, their uncertain and
unknown nature, in addition to their lack of access to major assets and small size, are major
obstacles they face to attract financial capital from investors. Because of the salience of the
threats of newness and smallness, this study focuses on legitimacy strategies in new ventures as
means to reduce uncertainty for investors.
Legitimacy Strategies
―Legitimacy is a generalized perception or assumption that the actions of an entity are
desirable, proper, or appropriate within some socially constructed system of norms, values,
beliefs, and definitions‖ (Suchman 1995, p. 547). Suchman (1995) offers a comprehensive
classification of organizational legitimacies and discusses the context in which each type of
legitimacy is meaningful. Below, we briefly discuss these classes and identify the type of
legitimacy new ventures seek to established with potential investors.
The first class of organizational legitimacies discussed by Suchman (1995) is pragmatic
legitimacy. This type of legitimacy is called pragmatic because it is based on self-interest
calculations in an organization‘s specific contract. A focal organization is deemed legitimate if it
is believed to benefit, or considered to have the potential to benefit, its customers or partners in

122
the context of a specific contract. This type of legitimacy is evaluative since it rests on the
positive outcomes an organization provides, but is subjective, because the positive outcomes for
the subjects of a specific contract are considered.
A second class of legitimacy is referred to as normative legitimacy (Suchman 1995). This
type of legitimacy is also evaluative, but the evaluation is not done by the immediate trade
parties of an organization, or with relation to a certain contract. Rather, the evaluation is made by
observers based on the organization‘s general conformity to socially accepted norms, values, and
beliefs. Therefore, although this second type of legitimacy is also evaluative, it is more objective
compared to the pragmatic legitimacy.
A third class of legitimacy is cognitive legitimacy, also referred to as taken-for-granted
legitimacy (Suchman 1995). This class of legitimacy is not evaluative; that is, an organization is
perceived legitimate if its existence, whether with positive, negative, or neutral outcomes, is
justified in a social system.
The above three classes of organizational legitimacies have clear distinctions. While the first
two are evaluative, the third one is not. Also, pragmatic and normative legitimacy differ in the
agency of the evaluator. In the pragmatic legitimacy, the evaluator has some contractual ties with
the organization. However, in the normative legitimacy, the evaluator is not tied to the
organization with a specific contract18F
25 (Suchman 1995). Based on these differences, we believe
normative legitimacy is the most salient type of legitimacy relevant to new ventures because
potential investors often evaluate a venture and do so while they are not necessarily focused on
an existing contract. Investors choose ventures that are deemed to be successful in a broad
25Although in the future, there might be a specific contract, but the legitimacy is not subject to,
or limited to it. Rather, the evaluation is made in a broader sense and with regards to the
general conduct of the organization.

123
market (e.g., MacMillan et al. 1986), and since the notion of market success is socially-
constructed through what is socially accepted as successful and prosperous for a firm (Zott and
Huy 2007), establishing legitimacy by new ventures through social media is mainly normative.
Normative legitimacy can be established through four broad strategies. First and foremost,
consequential legitimacy is highlighted as a type of legitimacy that is gained when an
organization is believed to produce desirable outcomes for its customers (Suchman 1995). For
example, in the literature about new ventures, focus on legitimizing through quality is
highlighted as a key activity (Fischer and Rueben 2014). High quality products and services are
met with satisfied customers and therefore increased market success. As a result, emphasizing
quality is a way to construct consequential legitimacy. Two other related strategies for
establishing normative legitimacy are procedural legitimacy, where an organization signals
superiority by following desirable organizational procedures, and structural legitimacy, where
the superiority is signaled through adopting well-accepted organizational structures. Finally,
personal legitimacy rests on the competence and passion (Chen et al. 2009) shown by leaders,
founders, and innovators of a new venture (Suchman 1995).
Pursuing Normative Legitimacy in Social Media: Symbolic Communication
The existing literature suggests that organizations follow a set of symbolic actions, i.e.,
―action in which the actor displays or tries to draw other people‘s attention to the meaning of an
object or action that goes beyond the object‘s or action‘s intrinsic content or functional use‖
(Zott and Huy 2007, p. 70), to establish normative legitimacy (Zott and Huy 2007). Specifically,
symbolic communication with the public and/or potential investors is deemed an effective means
for conducting these symbolic actions (e.g., Aldrich and Fiol 1994; Golant and Sillince 2007).
Most notably, Lounsbury and Glynn (2001) suggest that new ventures must use stories, as a type

124
of symbolic communication, to distinguish themselves and reduce the uncertainties that may
exist with regards to their potential for success. For example, Martens et al. (2007) found that
ventures emphasizing a pioneering nature and a track record of supporting it in their
reports/proposals to investors are more successful with regards to their valuation premiums at
initial public offering (IPO). Similarly, Zott and Huy (2007) highlight the role of emphasizing
personal credibility, capability for professional organizing, quality of relationships with partners,
and organizational achievements in a venture‘s narrative to the public, as pertinent to its access
to external resources.
For new ventures, social media is an emerging channel for symbolic communications (e.g.,
Fischer and Rueben 2014). Focusing on verbal cues in communication, Fischer and Reuber
(2014) found that emphasizing quality, a relational orientation, distinctiveness, and positive
affect in the content of venture‘s twitter posts is most likely to positively affect investors‘
perception of the venture‘s quality or distinctiveness.
Although content is a major part of communication, the agency of narrator, i.e., who narrates
the content, is also part of the signal that the audience receives. We suggest that choosing agency
of the narrator can also be a symbolic action by a new venture. For example, both a founder and
a non-affiliated blogger can provide a similar narrative, signaling quality of a venture‘s
innovation. Specifically, social media, such as Twitter, allows a new venture to cast its narrative
by either source. However, the meaning of a narrative being told by the venture‘s founder can be
very different from one that is told by a non-affiliated blogger. A founder‘s signaling of quality
might be perceived as bragging (e.g., Chan et al. 2009), whereas a non-affiliated affirmation of
quality might not be seen as such. Supporting the importance of non-verbal cues, the extant
literature suggests that symbolic actions can also be carried in a non-verbal fashion (Zott and

125
Huy 2007), although such non-verbal cues in communication are under-studied. Taking part in
certification contests (Rao 1994) or displaying artifacts in offices (Clarke 2011) are examples of
non-verbal symbolic actions documented in the existing literature.
Therefore, while the existing literature about the symbolic communication in social media
(Fischer and Rueben 2014) has focused on the verbal aspects (by focusing on the content of
narrative communicated), this paper focuses on non-verbal cues in the communication, by
considering the agency of narrator19F
26 Below, we discuss the social media-enabled capability to
select the narrator of a message and the normative legitimacy strategy that each narrator enacts.
Narrators in Symbolic Communication
In the offline world, Initial Public Offering (IPO) prospectuses are exemplar mediums
through which innovators present their formal communications to investors (Martens et al.
2007). These formal narratives are stories conveyed at a single point of time (Lounsbury and
Glynn 2001) where any interested audience can access it (Fischer and Rueben 2014). Contrary to
these formal communications are symbolic communications that are signals embedded in
interpersonal interactions conveyed across time and accessible only to those who are present at
the point of interaction (Fischer and Rueben 2014). In both formal and symbolic
communications, there is a limited variability in the agency of narrator. IPO prospectuses are
often written by founders, and interpersonal interactions with stakeholders are usually carried by
a venture‘s employees, if not by the founders themselves.
However, symbolic communications carried in social media show distinct attributes. Unlike
offline symbolic communications, those enabled by social media have a broad audience reach.
26In this study, we control for the valence of the content, but since the previous literature has
hypothesized and empirically validated the effects of content, we do not formally hypothesize
about it.

126
More importantly, social media-enabled symbolic communications can be narrated by different
agents. Social media allows transferring of a message by providing a web link to a blog or news
report regarding the venture. It also allows the narrative to be broadcasted by organizational or
personal (e.g., founders‘ or employees‘ account) aliases. For example, in Twitter, a new venture
can post tweets promoting the venture‘s business through four narrators. First, a message can be
posted by the personal Twitter account of founders or employees. An alternative to this approach
is posting content through the official Twitter account of the venture. The third option is
providing a link to a blog post or news article about the venture. Fourth, the venture can re-tweet
the content that the public has created about the venture. Although social media platforms are
different with regards to different narrators that can convey symbolic messages, they share the
ability to allow different narrators to carry conversation with the same audience.
At a broad level, social media enables narrative to be told by organizational, personal, and
external agents. Below, we discuss the type of normative legitimacy that each of these agents
affirm. Well-established firms often communicate through an organizational alias in social
media. For example, news about different products of Sony are broadcasted by Sony‘s official
Twitter account directly to its followers. Therefore, broadcasting with organizational alias is an
institutionally accepted norm. When a new venture broadcasts a message by its official venture
alias, a conformity to well-established norms is maintained. To outsiders, conformity to the
broadcasting behavior of well-established firms signals presence of procedures and structures
that match those of stable organizations. Therefore, we suggest that broadcasting with a venture
alias affirms procedural and structural legitimacy.
On the contrary, a part of new ventures‘ news is communicated by founders or employees
(Fischer and Reuber 2014), a case that rarely happens for well-established firms. Although this

127
behavior does not enhance procedural or structural legitimacy, it may affirm personal legitimacy.
Specifically, Chen et al. (2009) suggest that showing passion by founders and employees is a
strategy to improve personal legitimacy. Passion shows confidence in a new venture‘s innovation
and thereby can signal the positive perceptions of founders and employees about what they do.
When a founder or employee of a new venture personally broadcasts a message, it signals a level
of enthusiasm, reflecting on personal passion. Thus, we suggest that broadcasting through a
personal alias affirms personal legitimacy.
Finally, broadcasting a message through external agents, e.g., news agencies and bloggers,
can signal non-verbal consequential legitimacy. Specifically, external agents‘ talking about a
new venture suggests how well-accepted the new venture is in the social system in which it
operates. Therefore, aside from the content of the message, narration of news by others suggest
that the venture has been influential enough to spark conversation in the outside world, hinting at
its consequential legitimacy. Public approval is regarded as a mode of consequential legitimacy
for firms (Pollock and Rindova 2003).
In viewing non-verbal cues of symbolic communication, we take into account the processual
nature of symbolic communications. Elaborating on the nature of symbolic communications,
Fischer and Reuber (2014) note that such communications are not issued at a single point of time
and rather ―consist of multiple messages conveyed over a span of time‖ and are ―a collage of
individual signals, rather than a unified and integrated narrative‖ (p. 569). In spite of their
theoretical acknowledgement of the processual nature of symbolic communication, Fischer and
Rueben‘s empirical treatment of communication in social media is through a variance approach.
Focusing on the non-verbal cues in symbolic communication, this study considers the sequence
of narrators conveying a venture‘s message as its symbolic action, In other words, we view a

128
new venture‘s non-verbal symbolic communication as the sequence of narrators it chooses to
deliver messages to its audience. A process view enables us to follow a BDV‘s communication
through time, conceptualizing symbolic communication by including the time element. Given the
lack of studies on non-verbal communication cues in social media, this study adopts an inductive
approach to understand symbolic communications that suit new ventures. In doing so, we are
guided by the signaling theory to explain how different symbolic communications can affect the
new venture‘s success in accessing financial capital. Figure 1 summarizes the above discussion
on legitimacy strategies for new ventures and the relevant non-verbal tactics in social media.
Figure 1. A Theoretical View of Impression Management in New Ventures
Signaling Theory
Signaling theory is concerned with reducing information asymmetry between two parties
(Connelly et al. 2011). Information asymmetry is defined as a situation when two parties
involved in an economic transaction have access to two different sources of information related
to the transaction (Spence 2002). Tenets of the signaling theory suggest that when one party is at

129
information disadvantage (i.e., faces uncertainty), peripheral information vis-à-vis the focal
transaction is used as surrogate information (Boulding and Kirmani 2003). For example, a more
recent study shows how CEOs signal the unobservable quality of their firms to potential
investors via the observable quality of their financial statements (Zhang and Wiersema, 2009).
For entrepreneurial firms at the early stages of developing their product/service, when the
initial capital needed to establish the business is raised, potential investors face uncertainty.
Since the final product/service is far from being experienced and evaluated by investors, they
must rely on other informational cues to trust and invest (Elitzur and Gavious, 2003).
We suggest that non-verbal symbolic actions are organizational signals that can be used by
potential investors to reduce the uncertainty. Therefore, the extent of a new venture‘s success to
persuade potential investors depends on the extent to which the new venture‘s symbolic action
reduces the investors‘ uncertainty. New ventures are not homogeneous with regards to the type
of uncertainty their investors face. Specifically depending on their innovative strategy, new
ventures and their investors face different kinds of uncertainties and require different symbolic
actions.
Theoretical Development
Radical vs. Incremental Innovations and Investor Uncertainties
Innovation is at the heart of entrepreneurial firms at the early stages of development (Zott
and Amit 2007). Absent traditional firm resources, such as liquidity, reputation, and extensive
human capital, innovation is the main source of value for these ventures (Zott and Amit 2007).
To develop, grow, and stabilize, new ventures need to attract capital from venture capitalists and
angels, mainly through a persuasive innovation that shows the potential and promise of business
success (Timmons and Bygrave 1986). New ventures follow different strategies in developing

130
their innovations. Some focus on radical novelty, where product/service is a clear and often risky
departure from the existing technology (Ettlie et al. 1984). Others pursue incremental
innovations where the focus is on improvements, modifications, or re-configuration of existing
technology (Ettlie et al. 1984).
Entrepreneurial firms face two major liabilities: liability of smallness and liability of
newness (Rosenbusch et al. 2011). While the first concerns the limited size of new ventures and
their ability to compete with established firms, liability of newness concerns the unknown nature
of the firm‘s product/service and its reception by customers (Rosenbusch et al. 2011). These two
major liabilities are the sources of concern for potential investors, and their limited access to
information about the firm‘s ability to overcome the threats of these liabilities creates
uncertainties. While the two liabilities to some extent exist in all new ventures, the salience of
them can be different depending on the innovative strategy they pursue.
We contend that for radical innovations, the liability of newness is more pronounced than
the liability of smallness. Because of the breakthrough nature of innovation, and thus lack of
benchmarks, evaluating the reception of a radical innovation in the market is hard for investors.
However, due to their uniqueness, less competition is expected to come from established firms;
thereby, the liability of smallness is reduced. On the contrary, liability of smallness is more
pronounced for new ventures pursuing incremental innovations. Since an incremental innovation
is an extension to an already-existing product/service, evaluating market reception is less
cumbersome for potential investors. However, the presence of established firms, as competitors
with the pre-modified version of the service/product, increases the likelihood of head-to-head
competition; thus, the threat of smallness becomes more important. In other words, investors‘

131
uncertainties lie in whether or not the new venture has the required structure to compete with
mature firms.
Symbolic Actions: Radical vs. Incremental Innovations
We suggest that different symbolic actions that establish organizational legitimacy are
required to overcome uncertainties about smallness and newness. Specifically, we contend that
establishing procedural and structural legitimacies suit uncertainties that arise due to the
liabilities of smallness. The more a new venture is capable of showing its conformity to
procedural and structural attributes of established firms, the more its investors are convinced that
the venture has the maturity to compete with larger firms. On the contrary, establishing personal
legitimacy can be more effective for reducing uncertainties due to newness. Absent a track-
record, investors rely on the competence of innovators to evaluate the promise of an innovation
(Suchman 1995; Chen et al. 2009).
Therefore, as a new venture establishes personal legitimacy, the uncertainties about newness
subside. Finally, consequential legitimacy is suitable for uncertainties that arise due to both
smallness and newness of new ventures. Specifically, external affirmation can signal market
enthusiasm and therefore positive reception of a future product/service. Hence, it can address the
liability of newness. On the other hand, external affirmation of quality can signal a favorable
market attention, indicating a capability to attract market attention in the presence of
competition. Therefore, for new ventures pursuing a radical innovation, higher focus on personal
and consequential legitimacy signals are more effective, whereas for those pursuing incremental
innovations, focus on structural, procedural, and consequential legitimacy signals can be more
beneficial. Figure 2 represents a summary of the discussion thus far:

132
Figure 2. An Overview of Legitimacy Strategies and Tactics Suitable for New Ventures
Pursuing Radical vs. Incremental Innovations
Although the existing literature informs us about the different signals required for different
innovative strategies, the sequence of these signals cannot be hypothesized a priori. Specifically,
symbolic actions are carried out over time and thereby, hypothesizing about isolated signals is
theoretically immature. Due to lack of existing literature with regards to the sequence in which
symbolic action should be carried, we adopt an inductive approach and study the sequence of
narrators in organizational communication at social media. Given the difference between
innovative strategies with regards to the signals required to alleviate investor uncertainties, we
propose that:
P1: The ideal sequence of signals sent through selection of narrators differ for
radical and incremental strategies of innovation.
Also, since selection of narrators can help to establish legitimacy and such legitimacy
reduces investor uncertainties, and given the proposed difference in ideal sequence of signals for
ventures pursuing radical and incremental innovations, we propose that:

133
P2: Ventures that follow a sequence of signals closer to the ideal sequence that
suits their innovative strategy, i.e., ventures with higher sequence quality,
become more successful in attracting investors.
WoM as a Mediating Mechanism
At the receiving end of communication messages sent by new ventures is the audience. In
the social media context, in addition to the new venture itself, the audience can also express its
sentiment and opinion (i.e., WoM) about the new venture. A successful symbolic communication
by a new venture can be evidenced by a positive reception from the audience. Successful
persuasion of audience can lead to increasing discussions about the venture (increase volume of
WoM) and also can lead to expressing of positive sentiments about it (increase in valence of
WoM). Therefore, symbolic communications, and specifically the sequence of narrators, can
affect WoM. High volume of WoM and its positivity can then create a positive social disposition
towards the venture and encourage investment. The existing literature in other contexts shows
that volume (e.g., Chevalier and Mayzlin 2006) and positive sentiments about a business (e.g.,
Liu 2006) positively affect the financial gains. Therefore, we propose that:
P3: Ventures that follow a sequence of signals more similar to the ideal sequence
that suits their innovative strategy, i.e., ventures with higher sequence quality,
become more successful in attracting investors by increasing the volume and
positive valence of WoM in the social media.
In the age of crowdfunding and importance of micro-investors, new ventures rarely rely only
on social media that enables interactions with angels and venture capitalists (Agarwal 2011).
Rather, in an effort to access micro-investors, more general social media platforms, such as
Twitter (Fischer and Reuber 2014), are also used to pursue symbolic communication. Therefore,
symbolic communications can be carried out in the multiple platforms. Since communications in
one platform are visible for the audience at the other platform, it is logical to assume that
communication in one platform can have an effect on investors who are the main audience of the
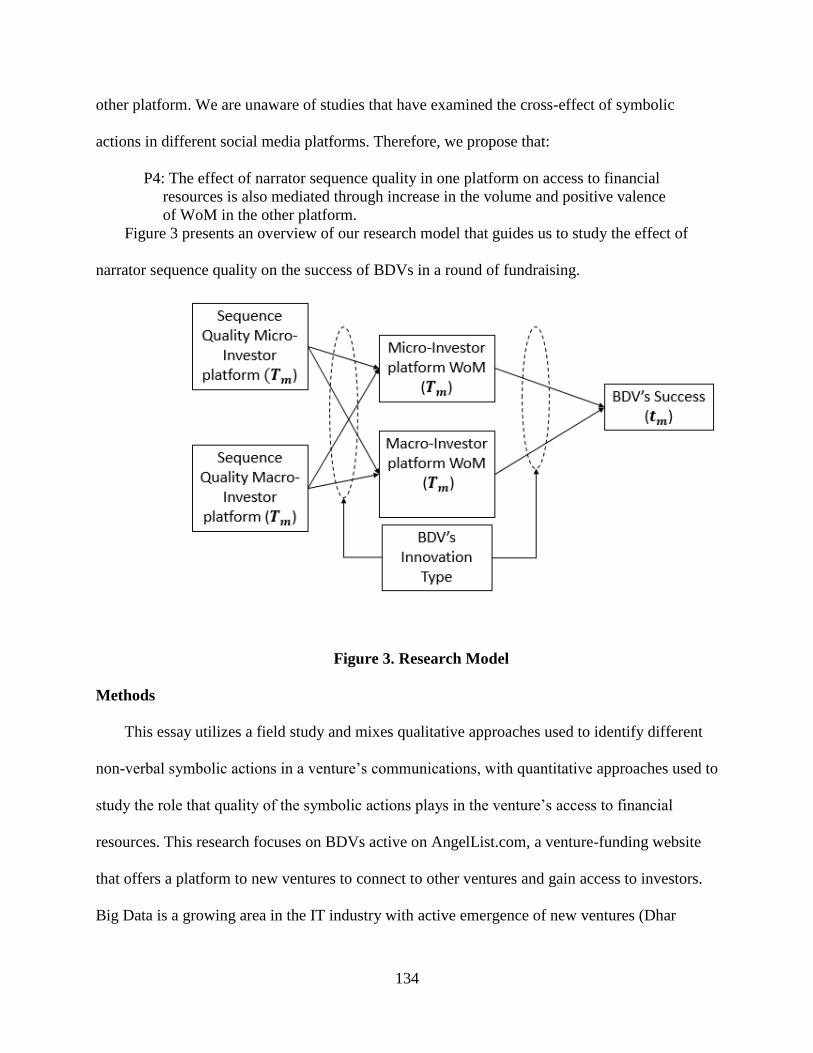
134
other platform. We are unaware of studies that have examined the cross-effect of symbolic
actions in different social media platforms. Therefore, we propose that:
P4: The effect of narrator sequence quality in one platform on access to financial
resources is also mediated through increase in the volume and positive valence
of WoM in the other platform.
Figure 3 presents an overview of our research model that guides us to study the effect of
narrator sequence quality on the success of BDVs in a round of fundraising.
Figure 3. Research Model
Methods
This essay utilizes a field study and mixes qualitative approaches used to identify different
non-verbal symbolic actions in a venture‘s communications, with quantitative approaches used to
study the role that quality of the symbolic actions plays in the venture‘s access to financial
resources. This research focuses on BDVs active on AngelList.com, a venture-funding website
that offers a platform to new ventures to connect to other ventures and gain access to investors.
Big Data is a growing area in the IT industry with active emergence of new ventures (Dhar
135
2013). Following the tradition of focusing on the high-tech industry in entrepreneurial studies
(e.g., Baron and Hannan 2002; Colombo and Grilli 2010; Bertoni et al. 2011; Anderson and Xiao
2016), we select Big Data as a niche high-tech context. A total of 1,213 BDVs were followed
from January 1, 2011 until December 29, 2014, resulting in 4,113 venture-round observations.
These ventures are self-identified as active in the Big Data context. An average BDV in our
sample has raised $4.67 million and has 3.42 co-founders and 11.88 employees. The website
assigns a profile page to each BDV where information such as names and links to personal pages
of founders, employees, investors, and followers of the BDV are identified. Additionally,
information regarding different rounds of capital-raising, amount raised, and contributing
investors in each round is provided. Finally, the profile page includes a section where the BDV‘s
innovation is described and introduced. Using a Python-based web-crawler, the mentioned
information about each BDV is crawled and used as the main source of information. This
information is then supplied by accessing the LinkedIn profile of founders, employees, and co-
founders, where information about professional background, academic background, and the
friend list of each individual is obtained.
Data
The study focuses on Twitter as a social-media platform with high presence of micro-
investors and AngelList.com as a platform highly directed at macro-investors. We treat the
tweets created by the venture‘s official Twitter account (including those with links to other
sources, or re-tweets of others‘ mentioning of the venture) and those created by the founders or
employees of the venture, mentioning the venture‘s official account, as the venture‘s
communication in Twitter. To capture the communications in the AngelList, the content posted
by the venture‘s ―Activity‖ page is tracked. Specifically, the content posted by the page itself or

136
comments inserted by founders or employees of the venture are treated as the venture‘s
communication in AngelList. The narrator of each piece of communication, its content, and the
time at which the communication message is created are stored in a spreadsheet. In Twitter, the
message of the communication can be narrated by: a) venture‘s official Twitter account (venture
alias); b) venture‘s founder or employee (personal alias); c) external piece of news or blog post
(news); or d) followers (through re-tweets; followers). In AngelList, the message of the
communication can be narrated by: a) venture‘s official AngelList account (venture alias); b)
venture‘s founder or employee (through personal comments on the activity page; personal alias);
c) external piece of news or blog post (in the ―press‖ section of the activity page; news).
In order to test the propositions, we focus on the periods between two fundraising events and
panel the new ventures in our sample based on that time stamp. In each period, a sequence of
narrators is identified for each venture in each platform. Each sequence represents the non-verbal
symbolic action carried by a new venture in a given platform. For example, venture
aliasnewspersonal aliasfollowers can be the narrator sequence of a venture in its Twitter
in a given period of fundraising.
Measures
Quality of non-verbal symbolic communications
In order to calculate the quality of non-verbal symbolic communication for each venture in
each platform at each round of fundraising, we calculate the distance between the narrator
sequence of the venture‘s communication in a given platform at time t from the sequences
belonging to the top 10 percent ventures with highest raised capital. We assume that top
performing ventures follow a desirable sequence; therefore, further distance from such desirable
sequences implies lower quality of the non-verbal symbolic action followed by a venture.

137
The distance between two sequences is computed as the least effort needed to transform one
sequence to another, through insertion, deletion and substitution of events. In our sequence, each
narrator type (e.g., venture alias, link) selected for delivering a message is treated as an ―event.‖
Before computing the minimum transformation cost, the cost of one insertion, deletion, and
substitution needs to be identified. For any one process of transforming one sequence into
another, the numbers of insertion, deletion, and substitution operations that are needed for the
transformation, and the costs associated with one operation of each type, are then used to
compute the cost associated with that transformation process. For a given pair of sequences,
numerous alternative transformation process can be identified, each with an associated
transformation cost. The lowest of these transformation costs is then considered as the distance
between the two sequences. Since the number of alternative transformation processes increases
as each of the sequences becomes longer in terms of number of events, and numerous pairs of
sequences may be involved in a project, automating the computation of the lowest transformation
cost is important27
. The optimal matching algorithm (Abbott 1995) has led to such automation
through optimal matching packages in statistical software, including STATA.
In order to ensure that the cost of transforming sequence A into sequence B is the same as
the cost of transforming B into A, insertion and deletion costs need to be kept equal. We set
deletion and insertion costs to 0.5. We assigned cost of 0.6 for substitution of narrators, because
the cost for substitution of events should be smaller than the sum of insertion and deletion (here,
0.5+0.5 =1). Optimal matching through STATA‘s SQ package was then used to compute inter-
sequence distances. For each venture at time t, the average distance from the sequences of top 10
27
To make the inter-sequence distances less sensitive to the size of the two sequence, the inter-
sequence distances are divided by the length of the longer of the two sequences.

138
percent ventures in Twitter and AngelList is calculated, and the inverse ratio of the average
distances is used as the quality of non-verbal symbolic action in the social media platforms.
WoM
Volume of WoM in Twitter for each BDV is calculated by counting the tweets mentioning
the BDV, posted by non-affiliated individuals. The valence of these tweets are evaluated
following Mudambi and Schuff (2010), and the degree of positivity is used as the measure of the
WoM valence. Volume of WoM in AngelList is calculated by counting comments made by non-
affiliated followers in the activity page. The valence of these comments are calculated similar to
the calculations in the case of Tweeter tweets.
Innovation strategy
In order to determine the innovation strategy (radical vs. incremental), we conducted a text
analysis of the product description section of the BDV‘s profile in the AngelList website,
supplemented with blog and news reports about the BDV‘s innovation, obtained from Lexis-
Nexis. We believe a BDV‘s innovation type can be understood by reviewing the product
description section of the BDV‘s webpage because that section is the medium through which the
product is introduced and its potential superiorities to competing products are explained. Further,
news pieces and blog posts provide outsiders‘ view of the BDV‘s innovation. The text-mining
module of R (tm) was used to analyze the product description section of each BDV‘s profile, as
well as related news pieces and blog posts. In order to do so, first, a set of words associated with
radical and incremental innovations was compiled using the existing literature on organizational
innovations. We searched Google Scholar for articles that contained the terms: incremental
innovation, and radical innovation. Over 12,100 articles were identified, and the HTML versions
of these articles were combined to form a corpus. This corpus was text-mined to extract

139
sentences that did not include any of the keywords ―radical innovation‖ or ―incremental
innovation‖ with the exception of sentences that were adjacent to the sentences containing these
words (i.e., one sentence before and one sentence after the sentence containing the keyword).
Then, the sentences containing the mentioned keywords and their adjacent sentences were
analyzed to form a network of words that are closely associated with them. For example, the
words ―original,‖ ―breakthrough,‖ ―pioneering,‖ and ―groundbreaking‖ had the highest
frequency of occurring when the word ―radical innovation‖ was discussed in the corpus of
articles. Also, the words ―revise,‖ ―extend,‖ ―amend,‖ ―combine,‖ ―re-configure,‖ and ―modify‖
were adjacent to the word ―incremental innovation.‖ The adjacent words were then processed to
eliminate the ones that are irrelevant to the concepts of incremental and radical innovations.
Then, a library of refined word for each type of innovation was used to analyze the product
description section of each BDV in the sample. The frequencies of words associated with radical
and incremental innovations in the product description corpus of each BDV are calculated. The
ratio of associated words to the total number of words in the text is calculated to measure
emphasis on a radical vs incremental approach. The two ratios are then compared with a z-test to
determine the category of innovation; the significantly larger ratio determines the category of
radical or incremental innovation. Observations with insignificant z-test are dropped from further
analysis.
Raised capital
The information about the raised capital in each round was collected from AngelList.com‘s
profile of the BDVs20F
28. From the conception to business planning, product development,
commercialization, operationalization, expansion, and eventually public offering, new ventures
28Appendix A presents the correlation matrix for main variables in the study.

140
raise funds from different resources (e.g., Cumming 2007). Depending on the stage of the
venture‘s development, the fundraising round is labeled as seeding (i.e., no stage, often at the
conception and research stage), Stage A, Stage B, Stage C, etc. It is possible that a BDV raises
external funding at multiple rounds in the same stage of development. Therefore, a new venture
might have two or three rounds of seeding. In our operationalization of a fundraising period, we
focus on each round of fundraising and use the raised capital in that round as the dependent
variable. Then, we control for the stage at which the capital is raised.
Controls
Although our focus is on non-verbal symbolic actions, we believe that the content of a
message communicated by the BDV to its audience influences the raised capital. Specifically,
Fischer and Reuber (2014) show that the valence of messages communicated can reduce the
uncertainty for investors. Therefore, a similar algorithm used in evaluating the valence of social
media WoM is used to estimate the valence of messages communicated by a BDV at time t.
As mentioned above, we control for the stage of development where the funding is raised.
We do so because early and late stages of fundraising are different in terms of the funding
providers,21F
29 as well as the amount of the capital needed.22F
30 To best capture the effect of the
fundraising stage, for each stage of development (e.g., seeding, stage A, etc.), we specify a
variable, the value of which indicates the number of fundraising rounds a new venture has
completed in that stage, prior to the current round. Therefore, for BDVs with their first round of
fundraising, the value of seeding, stage A, stage B, and stage B variables is all set at 0. If a
venture has had two rounds of fundraising at the seeding stage, and the current round is its
29
For example, angels contribute more in the early stages of the development, whereas venture
capitalists do so in the later stages close to the initial public offering (IPO). 30
Usually, the financial capital needed in the early stages of development are smaller than the
capital needed in the later stages.

141
second round at stage A, the value of seeding variable is set at 2, the value of stage A variable is
set at 1, and the value of stage B and stage C variables are set at 0.
Also, we control for the number of years since a BDV has been established as the time
elapsed since establishment can have an effect on accessible resources, financially and
intellectually. We control for the location dummy, measured at the city level, whether or not the
venture identifies itself as a business-to-business or business-to-customer (identified by tags
reported in AngelList.com), and the technological scope dummies, which represent the area of
focus in the Big Data context (identified by tags reported in AngelList.com; can be analytics,
security, or infrastructural). Moreover, the number of employees (including co-founders) in the
fundraising period of interest, and average of employees‘ (including co-founders) value of
education are controlled for.
Analysis
We start our inductive approach with understanding the narrator sequences employed in
Twitter and AngelList31
. We start our inquiry by striving to find out if more successful BDVs
adopt a certain sequence of narrators when communicating with their audience. In order to so,
we rank the BDVs in our sample based on their raised capital at each round. Given our focus on
radical and incremental innovations, we first divide our sample based on the innovation strategy
and carry out the analysis in each sub-sample. We treat the top 10% BDVs as successful BDVs
and investigate the similarity of their sequences. If top-performing BDVs follow similar
sequences, it can be an indicator for the existence of an ideal sequence. On the other hand, if the
sequences followed by top-performing BDVs are diverging, it can imply that narrator sequences
might not be understood within a singular underlying ideal theme.
31Appendix B presents examples of promoting events in Twitter and AngelList narrated by
different narrators.

142
To assess the presence of an underlying ideal sequence, we compare the average distance
that a top-performing BDV‘s sequence has from the other top-performing BDVs‘ sequences to
the distance it has with sequences of BDVs in the rest of the sample. For each BDV-period
observation ranked in top 10% (with regards to its raised capital), the sum of inter-sequence
distances from all other BDV-periods in top 10%, as well as the sum of inter-sequence distances
from the BDVs in the rest of the sample, is estimate. Then, and from the two estimates, the
average distance from the top 10% BDVs and the average distance from the BDVs in the rest of
the sample are calculated. If this calculated statistics is significantly different from zero, a
meaningful difference between sequences of top 10% observations and the rest of the sample is
implied. We conduct a series of Z-tests to investigate this hypothesis. Results of the z-test show
(for radical Twitter (z-value: 3.52), for incremental Twitter (z-value: 3.22), for radical
AnagelList (z-value: 3.46), for incremental AngelList (z-value: 3.43)) that we can reject the null
hypothesis that the sequences of top-performing BDVs are similar to the rest of the sample. This
implies that a converging underlying sequence exists for the top-performing BDVs. We call this
sequence an ideal sequence. In order to identify this underlying sequence, we focus on the
centroid sequence of the top-performing BDVs. A centroid sequence in a set of sequences is the
one that has the lowest distance from all of the other sequences in the set (Abbott 1995).
Below, we discuss the four centroid sequences in the set of top-performing BDVs, for both
Twitter and AngelList with radical and incremental innovations. The following is the centroid
sequence in Twitter for BDVs pursuing a radical innovation:
personal alias news venture alias follower news personal alias
follower personal alias

143
For simplicity, we have merged narrators of the same type in cases that the same type of narrator
is chosen for two consecutive messages23F
32. The following is the centroid sequence in Twitter for
BDVs pursing an incremental innovation:
venture alias news personal alias follower news venture alias
news venture alias
The following is the centroid sequence in AngelList for BDVs pursuing a radical innovation:
personal alias news personal alias news
And finally, the following is the centroid sequence in AngelList for BDVs pursuing an
incremental innovation:
news venture alias news
The centroids from top-performing BDVs reveal few important patterns. First, in all four
centroids a degree of alternating between internal (i.e., those messages cast by the venture or
founders/employees) and external narration (i.e., those messages cast by a news link or re-tweets
of external followers). This preferred alternation between the external and internal narrators is
consistent with the previous research findings that suggest too much emphasis on self-promotion
can prove harmful (Parhankargas and Ehrlich 2014).
Second, and for radical innovations, with their greater degree of uncertainty, more emphasis,
especially in beginning and concluding phases of promotion where effects of promotion are
shown to be more influential (e.g., Lu et al. 2014), on establishing legitimacy through passion
(personal legitimacy) is observed; whereas, for incremental innovations, more emphasis on
structural legitimacy is observed when self-promotion is concerned. This is consistent with our
prior discussion about the salience of newness and smallness liabilities for radical and
incremental innovations, respectively. In the critical phases of communication, and when
32For example a hypothetical sequence of ―newsfollowerfollowerfollowerpersonal
alias‖ is presented as ―newsfollowerpersonal alias‖.

144
establishing legitimacy through internal narrators is concerned, personal narration and a focus on
the narrator‘s passion is followed by the top-performing BDVs. This can help a BDV reduce the
uncertainties about liability of newness as the more salient liability when a radical innovation is
pursued. On the contrary, BDVs pursuing an incremental innovation focus on structural
legitimacy (through venture alias communications) in order to reduce uncertainties regarding the
smallness liabilities.
Third, an observed difference between the non-verbal symbolic actions carried in platforms
focused on micro- and macro-investors is the internal or external agency of the narrators. For
platforms focusing on micro-investors (e.g., Twitter), internal narrators (venture or personal
alias) are chosen, whereas for platforms focusing on macro-investors (e.g., AngelList), external
narrators are selected. The concluding phases of fundraising campaigns are important because
more activities with regards to the investments happen in these phases (Lu et al. 2014). Our
findings reveal that for macro-investors, with their explicit processes to evaluate new ventures
(e.g., MacMillan et al. 1986), external affirmation becomes more important. It is likely to assume
that personal legitimacy, and vetting the structural soundness of a new venture is evaluated
earlier in the process of making a judgment about an investment. Therefore, external affirmation
about the potential of a new venture can fortify the already-gathered information about the new
venture and its founders. To the contrary, micro-investors follow less-elaborate processes to land
a decision about making an investment in a new venture (Gerber and Hui 2013). Therefore, it is
logical to assume that micro-investors make more instant decisions putting more weight on the
more recent activities by the new venture. A direct communication between the venture and an
investor (instead of making it by the proxy of news links or blog posts) can be a more direct and
effective approach.

145
In the next step, we evaluate the effect that the quality of sequence of narrators have on the
raised capital by BDVs. Since our calculation of the sequence quality involved reviewing the top
10% performing BDVs, we drop the top 10% and bottom 10% observation from further analysis.
In order to investigate the research propositions, we construct a panel where each BDV is
observed in each round of fundraising (i.e., the BDVs are paneled over the rounds of
fundraising). This resulted in 4,113 venture-round observations. We split the sample to BDVs
pursuing radical and incremental innovations, and the statistical models are run within each sub-
sample. For all the models, and due to the panel structure of the data, the models are processed
using a generalized least squares (GLS) estimation with panel-specific corrections for first-order
auto-correlation and heteroskedasticity. Specifically, we run three models, one with WoM at the
Twitter as the dependent variable, while considering the noted controls in addition to the quality
of narrator sequence at both Twitter and AngelList, their interactions, and controlling for the
effect of WoM in AngelList. The second utilizes WoM at AngelList as the dependent variable,
while considering the noted controls in addition to the quality of narrator sequence at both
Twitter and AngelList, their interactions, and controlling for the effect of WoM in Twitter. The
third model utilizes raised capital as the dependent variable, while considering the noted controls
in addition to the quality of narrator sequence at both Twitter and AngelList, their interactions,
WoM in Twitter and AngelList, as well as their interactions. The interaction terms are analyzed
in a hierarchical fashion, after the direct effect models are examined. Table 1 presents the results,
with WoM in Twitter and AngelList as the dependent variables.
The direct effect models for BDVs pursuing incremental and radical innovations show that
the quality of narrator sequence in one platform is positively and significantly associated with
more positive sentiments in that platform (sequence quality in TwitterTwitter WoM; sequence

146
quality in AngelListAngelList WoM). Fruther, the positivity of WoM sentiment in one
platform is also positively and significantly influenced by the quality of sequence in the other
platform (sequence quality in AngelListTwitter WoM; sequence quality in TwitterAngelList
WoM). This provides evidence that the legitimacy-building actions in one platform spill over in
other social media platforms. To best of our knowledge, this study is the first to document such
cross-platform effects. Finally, the results of the direct-effect models indicate that in BDVs
pursuing radical and incremental innovations, positive sentiment of WoM in one platform
enhances the positivity of another platform‘s WoM (Twitter WoMAngelList WoM; AngelList
WoMTwitter WoM).
The interactions model shows differences between BDVs pursuing radical and incremental
innovations. Specifically, the quality of sequence in the two platforms become complementary
only when a radical innovation is pursued. Our results show a significant and positive interaction
between quality of sequence in the two platforms when effects on the platform WoM are
concerned (sequence quality in Twitter* sequence quality in AngelListTwitter WoM;
sequence quality in Twitter* sequence quality in AngelListAngelList WoM). These results
may imply that investors considering an investment in radical innovations expand their search
for legitimacy cues beyond one platform, and therefore the quality of non-verbal cues in one
platform enhances the effect of the quality of sequence in the other platform. If investors limit
their search for legitimacy cues to only one platform, then the joint effect of quality should not
significantly affect the WoM. This is the case for BDVs pursuing an incremental innovation. The
findings may imply that investors considering investment in ventures pursuing incremental
innovations face a lesser degree of uncertainty, and thus additional cues from multiple platforms

147
might not be considered. Since the investors are more likely to consider cues from one platform,
cues from the other do not make any additional value.
---Insert Table 1 here---
Table 2 presents the result when the raised capital is the dependent variable. Results of the
direct effects model show that the quality of sequence in both platforms remain significantly and
positively associated with the raised capital, in spite of the significant and positive association
between the positivity of the sentiment of WoM in both platforms and the raised capital. Taken
together, these results imply a partial mediation. Also, the results from the interaction model
show that the positivity of sentiments from WoM in Twitter and AngelList are complementary in
the case of radical innovations but not for the incremental innovations33
.
---Insert Table 2 here---
Robustness Tests
Alternative Ideal Sequences
Our estimation of sequence quality relied on calculating distance from top 10% performing
BDVs for radical and incremental innovations, and the extent of the sequence convergence in
these top performing BDVs plays a key role in the validity of our quality measures. Although our
z-tests indicate that the top performing BDVs follow sequences that are distinguished from the
rest of the BDVs, we further investigate to see if there are different archetypes of sequences
within the top performing BDVs. Following Sabherwal and Robey (1993), we conducted a
cluster analysis based on the inter-sequence distance of top 10% performing BDVs, using
33While our main analysis focuses on a processual view of narrators in social media, Appendix C
presents the results of analysis when only frequencies of narrators in each platform is
considered. These results provide evidence that higher frequencies posts made by personal
alias help BDVs with radical innovations whereas higher frequencies of venture alias help
BDVs with incremental innovations more.

148
Ward‘s (1963) technique. The resulting cluster analysis for incremental and radical innovations
in Twitter and AngelList indicatesthe presence of a dominating cluster with higher performance
mean compared to other emerging clusters34
. When only top 8% BDVs are considered, only one
cluster emerges, indicating a high-converging selection of BDVs. To further examine the
robustness of our findings, we calculated the quality of sequence for the middle 84% of BDVs
(we dropped the top and bottom 8% BDVs based on their raised capital) when the quality is
estimated similar to our main measure, but only average distance from the top 8% BDVs is
considered. Models 9 and 10 in Table 2 present these results. The findings remain qualitatively
unchanged to this variation.
Endogneity
It can be argued that a BDV that is more successful in raising capital will attract more
positive discussions among its audience and hence experience a more positive WoM. This can
suggest that the raised capital affects the positivity of sentiments in both Twitter and AngelList.
The reverse causality between the capital raised and the positivity of sentiment of WoM in
Twitter and AngelList can be a potential cause for endogeneity in our specification (Greene
2003). Given the panel structure of our data, we utilize the Arellano-Bover/Blundell-Bond
system of generalized method of moments (GMM) estimator (Arellano and Bond 1991; Arellano
and Bover 1995; Blundell and Bond 1998). Therefore, following prior literature, we treat the
positivity of sentiment of WoM in the two platforms and their interactions as endogenous
covariates (Aral et al. 2012; Bardhan et al. 2013). Then, we conduct a two-step system GMM
34The largest cluster accounted for: 88% of top performing BDVs with radical innovations in
Twitter, 86% of top performing BDVs with radical innovations in AngelList, 86% of top
performing BDVs with incremental innovations in Twitter, and 83% of top performing BDVs
with incremental innovations in AngelList. In all four sub-groups, two other clusters were
emerged in addition to the dominating high-performing cluster.

149
model to obtain estimates that are robust to both heteroskedasticity and autocorrelation and
provide robust standard errors to correct for the possible bias in estimating standard errors.
This method utilizes the second and longer lagged first differences of the endogenous
variables as instruments. The results of AR(2) tests indicate there is no serial correlation in the
second-differences of residuals. Further, the Hansen‘s test of over-identification fails to reject the
null hypothesis that the instruments are orthogonal to the error terms, and the difference-in-
difference Hansen‘s test of exogeneity fails to reject the null hypothesis that the subsets of
instruments used in the level equations are exogenous. The results in Table 2 (models 11 and 12)
show that findings remain qualitatively unchanged after accounting for the threat of endogneiety.
Volume of WoM
In order to further evaluate the robustness of the findings, we run the estimation models
while considering the volume of WoM instead of its sentiment positivity. The results are
presented in Tables 3 and 4. The findings remain similar, although in the model with the raised
capital as the dependent variable the coefficient of sequence quality in either platform becomes
insignificant in the presence of the volume of WoM measures. This can further imply a full
mediation in the model with the volume of WoM.
---Insert Tables 3 and 4 here---
In order to gain further insights about the cross-effects of non-verbal actions in macro-
investor and micro-investor platforms, we conduct our analyses in three sub-samples. In the
context of BDVs, we define the technological scope as the main big data area that the BDV‘s
product/service is focused on. Big data technologies cover diverse technological areas, most
distinctively, big data security (McAfee and Brynjolfsson 2012), analytics applications (LaValle
et al. 2013), and big data infrastructure (e.g., computing) (Jacobs 2009, McAfee and

150
Brynjolfsson 2012). A review of the existing literature on big data suggests that big data
technologies are also diverse in their architectural scope. While some big data technologies (e.g.,
cloud-based computing structures (Grossman and Siegel 2014)) are at the infrastructural level of
the IT architecture (see Weill and Vitale 2002 for a discussion of IT enterprise architecture)
some technologies target the analytics application layer (e.g., data modeling applications
(Grossman and Siegel 2014)). In addition to these more pronounced technological scopes, a third
category exists for big data innovations that are concerned with the security applications that
protect large operations of the big data innovations belonging to the two other technological
scopes.
We discuss that these three scopes can be different with regards to the type of uncertainty
they create for investors; therefore, certain platforms may become more important to deliver non-
verbal cues of legitimacy. Tables 5 through 10 present the results for our sub-sample analysis.
---Insert Tables 5 through 10 here---
Although our results for the analytics and infrastructure sub-sample are qualitatively similar
to the full sample analysis, the findings of these sub-sample analyses suggest that for the security
sub-sample, only the quality of narrator sequence in the micro-investor platform plays a role in
increasing the positive sentiment of WoM in both Twitter and AngelList. Moreover, the results
suggest that only WoM in the micor-investor platform is positively and significantly associated
with the raised capital, although the results of the interaction models indicate that quality of
narrator sequence in macro-investor platform adds to the value of the quality of sequence in the
micro-investor platform, in both affecting the WoM positivity and raised capital for BDVs
pursuing a radical innovation. Further, increasing the positivity of WoM in macro-investor
platform increases the effect that the positivity of the micro-investor platform has on the raised

151
capital. Taken together, the results suggest that considered alone, non-verbal cues for investors in
the security innovations focus on micro-investor platforms, although in case of radical
innovations, the evidence suggest that non-verbal cues from the macro-investment platform can
aid the cues of legitimacy from the micro-investor platform. The reason for such findings can be
explained by the nature of security innovations and their relevance to public reactions. Existing
studies in the context of security breaches suggest that firms endure negative market reactions in
the case of such breaches (Gordon et al. 2011; Yayla and Hu 2011) while the adoption of
security solutions can be greeted by public support (e.g., Chai et al. 2011). Micro-investor
platforms draw on a broader audience, often similar to the future public audience of a firm;
therefore, investors might decide to focus their attention on cues received from the
communications with this broad audience.
Discussion
Social media plays an important role in helping new ventures access the potential investors
and deliver cues that signal legitimacy. Focusing on the non-verbal symbolic actions in a new
venture‘s communication with its audience, this essay draws on the literature on signaling theory
and organizational innovation to theorize about the legitimacy signals sent when different
narrators are selected to promote the venture. Moreover, and considering the prevalence of multi-
platform fundraising, we focus on the cross-effects of non-verbal symbolic actions in one micro-
investor (Twitter) and one macro-investor (AngelList) platform. Conceptualizing the non-verbal
symbolic actions as a sequence of narrators delivering promoting messages to the audience in the
context of BDVs, the findings reveal that ventures that are more successful in raising financial
capital follow a similar sequence of narrators when communicating with their audience,
depending on the innovation strategy and platform in which the communication is carried out.

152
Specifically, we found that successful BDVs alternate between the messages send by agents
internal to the venture (e.g., personal or venture aliases) and those sent by external agents (such
as news agencies or individual followers). Therefore, successful BDVs sequentially change the
mode of promotion from self- to others‘-promotion, or vice versa.
Moreover, our findings suggest that compared to organizational and formal aliases, personal
aliases are more emphasized in the critical phases of raising capital (i.e., the beginning and the
ending of the fundraising period) when a BDV pursues radical innovations. The results suggest
that more personal communications are more effective to reduce the salient threats of newness
that radical innovations face. Personal communications reflect on the passion of the individual
sending a message. It suggests that the individual sees enough value in promoting the venture to
spend his/her own time crafting a message and personally deliver it. On the contrary, with
incremental innovations facing a larger threat of smallness, maintaining structural and procedural
legitimacy through the utilization of a formal alias becomes more effective. Our findings support
our theory that when new ventures follow the norms of communication by delivering messages
in social media through an official account instead of a personal one, potential investors become
more inclined to invest since following the norms may suggest that the new venture has the
required resources and managerial maturity to compete with established firms. Utilizing a formal
alias may indicate the presence of social-media management functions in the venture, and that
may signal the presence of other important functions in the venture. Moreover, utilizing formal
aliases when communicating reflects on the managerial understanding of what are the established
norms of communication, thereby, suggesting managerial legitimacy of the venture‘s founders
and employees. Figures 4a and 4b summarize the ideal sequence of narrators in Twitter and AL.

153
Figure 4a. Ideal Sequence of Narrators in Twitter
Figure 4b. Ideal Sequence of Narrators in AL
Moreover, the findings of the study suggest that following sequences of narrators similar to
those followed by top-performing BDVs increases the positive WoM, as well as the raised
capital. More importantly, our findings reveal that the quality of the sequence of narrators in one
platform can have effects in the positivity of WoM in the other. These results suggest that macro-
and micro-investors may follow legitimacy signals in a platform other than the one in which they
have an active presence. Specifically, when investing in radical innovations is considered, the
highest level of capital-raising is reached when the qualities of sequence of narrators in both

154
platforms are high. This suggests that the signals in both platforms are conjointly evaluated by
investors when radical innovations are considered.
Finally, our sub-sample analysis in the different scopes of the Big Data industry reveals that
in the scopes where the innovation is of high sensitivity to the public (i.e., Big Data Security)
legitimacy signals are mainly received from a micro-investor platform, with its higher
presentation of public opinion. Unlike the case of infrastructural and analytics innovations, the
eventual success of a venture active in the scope of security may be more dependent on the
public audience as the key stakeholder. Taken together, the results of sub-sample analysis
suggest that sub-sections of an industry can be heterogeneous with regards to the type of
uncertainty that investors face, and non-verbal symbolic communications pursued by new
ventures should match such nuances.
Contributions
The theoretical implications of this study are threefold. First, this study extends the existing
literature about symbolic communication in social media platforms (Fischer and Reuber 2014)
by showing that in addition to verbal cues, non-verbal signals can also help a new venture
promote its innovation. Specifically, drawing on the literature about organizational legitimacy
and signaling theory, we provide empirical evidence that selecting narrator of messages sent to
the audience operates as a non-verbal cue embedded in organizational communications the social
media. These findings also contribute to the existing literature about non-verbal symbolic actions
which has evidenced presence of non-verbal cues in mostly physical behaviors but has
overlooked non-verbal cues in communication.
Second, the findings of the study extend the existing literature on social media and WoM in
two distinct ways. While this literature has mostly focused on the effect of WoM on performance

155
outcomes such as sales (e.g., Dewan and Ramaprasad 2012; Dellarocas et al. 2007; Forman et al.
2008), less attention is paid to organizational actions to manage WoM. Focusing on the context
of new ventures, this study suggest that promotional messages sent by an organization to its
audience influence WoM in the social media platforms. More importantly, in spite of the
prevalence of multi-platforming, no research to date has investigated the cross-effect that WoM
in one platform has in another. Our study provides evidence that the audience of a specific
platform may follow the cues generated in other platforms, and that WoM in one platform can
affect the WoM in the other. Therefore, we provide evidence suggesting that benefits from
managerial tactics followed in one platform can spillover to another.
Third, this study contributes to the existing literature on organizational legitimacy by
theorizing about the contingent role that innovation strategies play. The existing literature on
organizational legitimacy (e.g. Suchman 1995) rarely differentiates legitimacy tactics and their
suitability for different firms. However, the literature on strategic management suggests that the
best course of action for one firm might not be as effective for another (Venkatraman 1989).
Especially for new ventures, with innovation as the core driver of the value, we discuss how
different legitimacy tactics suit the type of innovation (radical vs. incremental) a firm pursues.
In addition to its theoretical contributions, this study has two methodological contributions.
First, this study provides an alternative method to evaluate the radicalness of innovation in an
entrepreneurial firm. The existing literature has mostly utilized self-reported measures (e.g.,
Ettlie et al. 1984), however, these measures may be limited by common-method biases and social
desirability threats (e.g., Podsakoff et al. 2003). We suggest that the text-analysis of reports
related to an innovation can provide a more objective alternative measure to evaluate its
radicalness. Second, this study presents sequence analysis as a technique to capture symbolic

156
actions that are carried out over time. Although the existing studies describe symbolic actions as
those that do not happen at a single point of time (e.g., Fischer and Reuber 2014), these actions
are rarely examined over time in an empirical study. Our utilization of sequence analysis enables
researchers to evaluate other types of symbolic actions. Further, our approach in utilizing the
inter-sequence distance to evaluate the quality of the symbolic actions can be extended to similar
contexts.
Managerial Implications
This study provides entrepreneurs a set of actions to be pursed when communicating to
potential investors in the social media. First and foremost, our results suggest paying attention to
selecting the narrator of a message and alternating between self-promotion and others‘-
promotion is an effect way to increase positive response from social media followers and
eventually increase the raised financial capital. Second, our findings suggest that depending on
the type of innovation pursued, entrepreneur should change the mode of self-promotion.
Specifically, when radical innovations are pursued, communication in beginning and ending of
the capital-raising period should be made through direct personal messages. To the contrary, a
formal organizational alias may be utilized in key phases of communication (e.g., beginning and
ending of a fundraising campaign) when the venture is focusing on development of an
incremental innovation. Third, entrepreneurs should divide their attention between different
social media platforms appropriately as investors may look for legitimacy cues in platforms that
they are not primarily active in. Especially for those venture pursuing a radical innovation, a
simultaneous pursuit of effective legitimacy tactics is met with higher payoffs. Finally, our
findings suggest that entrepreneurs in the sections of industry with a more public sensitivity

157
should direct their focus on micro-investing platforms since likely investors pay more attention
to reactions in a platform which is more representative of the key stakeholders‘ opinion.
Limitations
In spite of its contributions, the findings of the study should be interpreted while considering
its limitations. First, in our examination of multiple social media platforms, our data is limited to
two platforms, Twitter and AngelList. We contend that further examination of cross-platform
effect of non-verbal symbolic communication in different platforms can increase the
generalizability of these findings. Further, it is possible that BDVs prioritize their use of micro-
and macro-platforms differently (e.g., using Twitter as the main channel of communication and
AL as a secondary one). Our data is limited to allow us control for this aspect and accounting for
such heterogeneity across BDVs‘ use of their social media platform might change the findings.
Moreover, our data is limited in its evaluation of non-verbal symbolic actions carried out outside
of social media. Specifically, the existing research suggests that offline face-to-face meetings,
especially with macro-investors, are key to promote new ventures (e.g., Birley 1986; Wetzel
1987; Harrison and Mason 1992; Webb et al. 2013; Thai and Turkina 2014). Therefore,
additional research considering offline symbolic actions can shed more light on interactions of
online and offline symbolic behavior and extend the current findings. Finally, our selection of
Big Data industry as the context of the study may limit the generalization of findings. Big Data is
considered to be an advanced area in IT (e.g., Chen et al. 2012) and communicational norms of
IT entrepreneurial firms may be different from those in the other industries. An examination of
similar non-verbal symbolic communications in other industries can shed more light on the
robustness of our findings and its applicability to the non-IT industry.

158
References
Abbott, A. 1995, "Sequence Analysis: New Methods for Old Ideas," Annual Review of
Sociologypp. 93-113.
Aldrich, H. E., and C. M. Fiol. 1994, "Fools Rush in? the Institutional Context of Industry
Creation," Academy of Management Review (19:4), pp. 645-670.
Aral, S., E. Brynjolfsson, and M. Van Alstyne. 2012, "Information, Technology, and Information
Worker Productivity," Information Systems Research (23:3-part-2), pp. 849-867.
Arellano, M., and S. Bond. 1991, "Some Tests of Specification for Panel Data: Monte Carlo
Evidence and an Application to Employment Equations," The Review of Economic Studies
(58:2), pp. 277-297.
Arellano, M., and O. Bover. 1995, "Another Look at the Instrumental Variable Estimation of
Error-Components Models," Journal of Econometrics (68:1), pp. 29-51.
Arndt, M., and B. Bigelow. 2000, "Presenting Structural Innovation in an Institutional
Environment: Hospitals' use of Impression Management," Administrative Science Quarterly
(45:3), pp. 494-522.
Avery, D. R., and P. F. McKay. 2006, "Target Practice: An Organizational Impression
Management Approach to Attracting Minority and Female Job Applicants," Personnel
Psychology (59:1), pp. 157-187.
Bardhan, I., V. Krishnan, and S. Lin. 2013, "Research Note-Business Value of Information
Technology: Testing the Interaction Effect of IT and R&D on Tobin's Q," Information
Systems Research (24:4), pp. 1147-1161.
Baron, J. N., and M. T. Hannan. 2002, "Organizational Blueprints for Success in High-Tech
Start-Ups: Lessons from the Stanford Project on Emerging Companies," California
Management Review (44:3), pp. 8-36.
Belleflamme, P., T. Lambert, and A. Schwienbacher. 2014, "Crowdfunding: Tapping the Right
Crowd," Journal of Business Venturing (29:5), pp. 585-609.
Bertoni, F., M. G. Colombo, and L. Grilli. 2011, "Venture Capital Financing and the Growth of
High-Tech Start-Ups: Disentangling Treatment from Selection Effects," Research Policy
(40:7), pp. 1028-1043.
Birley, S. 1986, "The Role of Networks in the Entrepreneurial Process," Journal of Business
Venturing (1:1), pp. 107-117.

159
Blundell, R., and S. Bond. 1998, "Initial Conditions and Moment Restrictions in Dynamic Panel
Data Models," Journal of Econometrics (87:1), pp. 115-143.
Bolino, M. C., and W. H. Turnley. 1999, "Measuring Impression Management in Organizations:
A Scale Development Based on the Jones and Pittman Taxonomy," Organizational
Research Methods (2:2), pp. 187-206.
Boulding, W., and A. Kirmani. 1993, "A Consumer-Side Experimental Examination of Signaling
Theory: Do Consumers Perceive Warranties as Signals of Quality?" Journal of Consumer
Researchpp. 111-123.
Bozeman, D. P., and K. M. Kacmar. 1997, "A Cybernetic Model of Impression Management
Processes in Organizations," Organizational Behavior and Human Decision Processes
(69:1), pp. 9-30.
Burtch, G., A. Ghose, and S. Wattal. 2013, "An Empirical Examination of the Antecedents and
Consequences of Contribution Patterns in Crowd-Funded Markets," Information Systems
Research (24:3), pp. 499-519.
Caillouet, R. H., and M. W. Allen. 1996, "Impression Management Strategies Employees use
when Discussing their Organization's Public Image," Journal of Public Relations Research
(8:4), pp. 211-227.
Chai, S., M. Kim, and H. R. Rao. 2011, "Firms' Information Security Investment Decisions:
Stock Market Evidence of Investors' Behavior," Decision Support Systems (50:4), pp. 651-
661.
Chen, H., R. H. L. Chiang, and V. C. Storey. 2012, "Business Intelligence and Analytics: From
Big Data to Big Impact," MIS Quarterly (36:4), pp. 1165-1188.
Chen, X., X. Yao, and S. Kotha. 2009, "Entrepreneur Passion and Preparedness in Business Plan
Presentations: A Persuasion Analysis of Venture Capitalists' Funding Decisions," Academy
of Management Journal (52:1), pp. 199-214.
Chevalier, J. A., and D. Mayzlin. 2006, "The Effect of Word of Mouth on Sales: Online Book
Reviews," Journal of Marketing Research (43:3), pp. 345-354.
Clarke, J. 2011, "Revitalizing Entrepreneurship: How Visual Symbols are used in
Entrepreneurial Performances," Journal of Management Studies (48:6), pp. 1365-1391.
Colombo, M. G., and L. Grilli. 2010, "On Growth Drivers of High-Tech Start-Ups: Exploring the
Role of Founders' Human Capital and Venture Capital," Journal of Business Venturing
(25:6), pp. 610-626.
Connelly, B. L., S. T. Certo, R. D. Ireland, and C. R. Reutzel. 2011, "Signaling Theory: A
Review and Assessment," Journal of Management (37:1), pp. 39-67.

160
Cumming, D. 2007, "Government Policy Towards Entrepreneurial Finance: Innovation
Investment Funds," Journal of Business Venturing (22:2), pp. 193-235.
Davidson, W. N., P. Jiraporn, Y. S. Kim, and C. Nemec. 2004, "Earnings Management
Following Duality-Creating Successions: Ethnostatistics, Impression Management, and
Agency Theory," Academy of Management Journal (47:2), pp. 267-275.
Dellarocas, C., X. M. Zhang, and N. F. Awad. 2007, "Exploring the Value of Online Product
Reviews in Forecasting Sales: The Case of Motion Pictures," Journal of Interactive
Marketing (21:4), pp. 23-45.
Dewan, S., and J. Ramaprasad. 2012, "Research Note-Music Blogging, Online Sampling, and the
Long Tail," Information Systems Research (23:3-part-2), pp. 1056-1067.
Dhar, V. 2013, "Data Science and Prediction," Communications of the ACM (56:12), pp. 64-73.
Elitzur, R., and A. Gavious. 2003, "Contracting, Signaling, and Moral Hazard: A Model of
Entrepreneurs,‗angels,‘and Venture Capitalists," Journal of Business Venturing (18:6), pp.
709-725.
Ellis, A. P., B. J. West, A. M. Ryan, and R. P. DeShon. 2002, "The use of Impression
Management Tactics in Structured Interviews: A Function of Question Type?" Journal of
Applied Psychology (87:6), pp. 1200.
Elsbach, K. D. 1994, "Managing Organizational Legitimacy in the California Cattle Industry:
The Construction and Effectiveness of Verbal Accounts," Administrative Science
Quarterlypp. 57-88.
Elsbach, K. D., and R. I. Sutton. 1992, "Acquiring Organizational Legitimacy through
Illegitimate Actions: A Marriage of Institutional and Impression Management Theories,"
Academy of Management Journal (35:4), pp. 699-738.
Elsbach, K. D., R. I. Sutton, and K. E. Principe. 1998, "Averting Expected Challenges through
Anticipatory Impression Management: A Study of Hospital Billing," Organization Science
(9:1), pp. 68-86.
Ettlie, J. E., W. P. Bridges, and R. D. O'keefe. 1984, "Organization Strategy and Structural
Differences for Radical Versus Incremental Innovation," Management Science (30:6), pp.
682-695.
Fischer, E., and A. R. Reuber. 2014, "Online Entrepreneurial Communication: Mitigating
Uncertainty and Increasing Differentiation Via Twitter," Journal of Business Venturing
(29:4), pp. 565-583.

161
Forman, C., A. Ghose, and B. Wiesenfeld. 2008, "Examining the Relationship between Reviews
and Sales: The Role of Reviewer Identity Disclosure in Electronic Markets," Information
Systems Research (19:3), pp. 291-313.
Gerber, E. M., and J. Hui. 2013, "Crowdfunding: Motivations and Deterrents for Participation,"
ACM Transactions on Computer-Human Interaction (TOCHI) (20:6), pp. 34.
Goffman, E. 2002, "The Presentation of Self in Everyday Life. 1959," Garden City, NY.
Golant, B. D., and J. A. Sillince. 2007, "The Constitution of Organizational Legitimacy: A
Narrative Perspective," Organization Studies (28:8), pp. 1149-1167.
Gordon, L. A., M. P. Loeb, and L. Zhou. 2011, "The Impact of Information Security Breaches:
Has there been a Downward Shift in Costs?" Journal of Computer Security (19:1), pp. 33-
56.
Greene, W. H. 2003. Econometric Analysis, 5/e, Pearson Education India.
Grossman, R. L., and K. P. Siegel. 2014, "Organizational Models for Big Data and Analytics,"
Journal of Organization Design (3:1), pp. 20-25.
Harrison, R. T., and C. M. Mason. 1992, "International Perspectives on the Supply of Informal
Venture Capital," Journal of Business Venturing (7:6), pp. 459-475.
Kim, K., and Hann,I. 2013. "Does Crowdfunding Democratize Access to Capital? A
Geographical Analysis," .
LaValle, S., E. Lesser, R. Shockley, M. S. Hopkins, and N. Kruschwitz. 2013, "Big Data,
Analytics and the Path from Insights to Value," MIT Sloan Management Review (21:.
Liu, Y. 2006, "Word of Mouth for Movies: Its Dynamics and Impact on Box Office Revenue,"
Journal of Marketing (70:3), pp. 74-89.
Lounsbury, M., and M. A. Glynn. 2001, "Cultural Entrepreneurship: Stories, Legitimacy, and the
Acquisition of Resources," Strategic Management Journal (22:6‐7), pp. 545-564.
Lu, C., Xie,S., Kong,X., and Yu,P. S. 2014. "Inferring the Impacts of Social Media on
Crowdfunding," pp. 573-582.
———. 2014. "Inferring the Impacts of Social Media on Crowdfunding," pp. 573-582.
Macht, S. A., and J. Weatherston. 2014, "The Benefits of Online Crowdfunding for
Fund‐Seeking Business Ventures," Strategic Change (23:1‐2), pp. 1-14.
MacMillan, I. C., D. M. Kulow, and R. Khoylian. 1989, "Venture Capitalists' Involvement in
their Investments: Extent and Performance," Journal of Business Venturing (4:1), pp. 27-47.

162
Martens, M. L., J. E. Jennings, and P. D. Jennings. 2007, "Do the Stories they Tell Get them the
Money they Need? the Role of Entrepreneurial Narratives in Resource Acquisition,"
Academy of Management Journal (50:5), pp. 1107-1132.
McAfee, A., and E. Brynjolfsson. 2012, "Big Data: The Management Revolution," Harvard
Business Review (90:10), Oct, pp. 60-6, 68, 128.
Mollick, E. 2014, "The Dynamics of Crowdfunding: An Exploratory Study," Journal of Business
Venturing (29:1), pp. 1-16.
Mudambi, S. M., and D. Schuff. 2010, "What Makes a Helpful Review? A Study of Customer
Reviews on Amazon. Com," MIS Quarterly (34:1), pp. 185-200.
Nagy, B. G., J. M. Pollack, M. W. Rutherford, and F. T. Lohrke. 2012, "The Influence of
Entrepreneurs' Credentials and Impression Management Behaviors on Perceptions of New
Venture Legitimacy," Entrepreneurship Theory and Practice (36:5), pp. 941-965.
Parhankangas, A., and M. Ehrlich. 2014, "How Entrepreneurs Seduce Business Angels: An
Impression Management Approach," Journal of Business Venturing (29:4), pp. 543-564.
Podsakoff, P. M., S. B. MacKenzie, J. Lee, and N. P. Podsakoff. 2003, "Common Method Biases
in Behavioral Research: A Critical Review of the Literature and Recommended Remedies."
Journal of Applied Psychology (88:5), pp. 879.
———. 2003, "Common Method Biases in Behavioral Research: A Critical Review of the
Literature and Recommended Remedies." Journal of Applied Psychology (88:5), pp. 879.
Pollock, T. G., and V. P. Rindova. 2003, "Media Legitimation Effects in the Market for Initial
Public Offerings," Academy of Management Journal (46:5), pp. 631-642.
Rao, H. 1994, "The Social Construction of Reputation: Certification Contests, Legitimation, and
the Survival of Organizations in the American Automobile Industry: 1895–1912," Strategic
Management Journal (15:S1), pp. 29-44.
Rosenbusch, N., J. Brinckmann, and A. Bausch. 2011, "Is Innovation always Beneficial? A
Meta-Analysis of the Relationship between Innovation and Performance in SMEs," Journal
of Business Venturing (26:4), pp. 441-457.
Sabherwal, R., and D. Robey. 1993, "An Empirical Taxonomy of Implementation Processes
Based on Sequences of Events in Information System Development," Organization Science
(4:4), pp. 548-576.
Spence, M. 2002, "Signaling in Retrospect and the Informational Structure of Markets,"
American Economic Reviewpp. 434-459.

163
Suchman, M. C. 1995, "Managing Legitimacy: Strategic and Institutional Approaches,"
Academy of Management Review (20:3), pp. 571-610.
Thai, M. T. T., and E. Turkina. 2014, "Macro-Level Determinants of Formal Entrepreneurship
Versus Informal Entrepreneurship," Journal of Business Venturing (29:4), pp. 490-510.
Thies, F., and M. Wessel. 2014, "The Circular Effects of Popularity Information and Electronic
Word-of-Mouth on Consumer Decision-Making: Evidence from a Crowdfunding Platform,"
.
Timmons, J. A., and W. D. Bygrave. 1986, "Venture Capital's Role in Financing Innovation for
Economic Growth," Journal of Business Venturing (1:2), pp. 161-176.
Trusov, M., R. E. Bucklin, and K. Pauwels. 2009, "Effects of Word-of-Mouth Versus Traditional
Marketing: Findings from an Internet Social Networking Site," Journal of Marketing (73:5),
pp. 90-102.
Venkatraman, N. 1989, "The Concept of Fit in Strategy Research: Toward Verbal and Statistical
Correspondence," Academy of Management Review (14:3), pp. 423-444.
Ward Jr, J. H. 1963, "Hierarchical Grouping to Optimize an Objective Function," Journal of the
American Statistical Association (58:301), pp. 236-244.
Webb, J. W., G. D. Bruton, L. Tihanyi, and R. D. Ireland. 2013, "Research on Entrepreneurship
in the Informal Economy: Framing a Research Agenda," Journal of Business Venturing
(28:5), pp. 598-614.
Weill, P., and M. Vitale. 2002, "What IT Infrastructure Capabilities are Needed to Implement e-
Business Models," MIS Quarterly Executive (1:1), pp. 17-34.
Wetzel, W. E. 1987, "The Informal Venture Capital Market: Aspects of Scale and Market
Efficiency," Journal of Business Venturing (2:4), pp. 299-313.
Yayla, A. A., and Q. Hu. 2011, "The Impact of Information Security Events on the Stock Value
of Firms: The Effect of Contingency Factors," Journal of Information Technology (26:1),
pp. 60-77.
Zhang, Y., and M. F. Wiersema. 2009, "Stock Market Reaction to CEO Certification: The
Signaling Role of CEO Background," Strategic Management Journal (30:7), pp. 693-710.
Zott, C., and R. Amit. 2007, "Business Model Design and the Performance of Entrepreneurial
Firms," Organization Science (18:2), pp. 181-199.

164
Tables of Chapter 4
Table 1. Results with WoM as the Dependent Variable
WoM measured by sentiment
Direct effect Interaction effect
Novel Incremental Novel Incremental
Model 1 Model 2 Model 3 Model 4
DV= Twitter WoM AL WoM Twitter WoM AL WoM Twitter WoM AL WoM Twitter WoM AL WoM
Sequence Quality in Twitter 0.121*** 0.094** 0.099** 0.071* 0.138*** 0.082** 0.111*** 0.065*
Sequence Quality in AL 0.062* 0.069* 0.053** 0.078** 0.052* 0.116*** 0.031* 0.091**
Twitter WoM
0.073**
0.066*
0.062*
0.044*
AL WoM 0.058*
0.046*
0.043*
0.021
Sequence Quality in Twitter *
Sequence Quality in AL
0.093** 0.158*** 0.018 0.009
N 2844 2844 1269 1269 2844 2844 1269 1269
Wald’s Chi 5272.33 6317.14 4398.12 5622.67 6718.45 7233.24 5324.89 4315.89
Coefficients of variables number of employees, education of employees, positive language of promotional text, and dummies
representing the scope of the BDV, type of innovation (B2B or B2C), location, and BDV’s year of establishment are not reported
for brevity;
#p < 0.10, * p < 0.05, ** p < 0.01, *** p< 0.001;
GLS estimation with corrections for panel specific AR1 and Heteroskedasticity is used.

165
Table 2. Results with Raised Capital as the Dependent Variable
WoM measured by sentiment
GLS Alternative Sequence AB-GMM
Direct effect Interaction effect Interaction effect Interaction effect
Novel Incremental Novel Incremental Novel Incremental Novel Incremental
Model 5 Model 6 Model 7 Model 8 Model 9 Model10 Model 11 Model 12
DV= Raised capital Raised capital Raised Capital Raised capital
Sequence Quality in
Twitter 0.043* 0.033* 0.038* 0.042*
0.031* 0.065**
0.026* 0.007
Sequence Quality in AL 0.051* 0.028* 0.017* 0.017* 0.011#
0.014* 0.009 0.002
Twitter WoM 0.205*** 0.211* 0.229*** 0.114*** 0.113*** 0.182*** 0.098*** 0.089**
AL WoM 0.082** 0.074* 0.073* 0.044* 0.058* 0.044#
0.033# 0.018#
Sequence Quality in
Twitter * Sequence
Quality in AL
0.092* 0.031
0.203*** 0.014
0.073* 0.003
Twitter WoM * AL WoM
0.127*** 0.011 0.123*** 0.008 0.118*** 0.005
N 2844 1269 2844 1269 2986 1332 2844 1269
Wald’s Chi 6333.12 7809.32 8178.34 7645.23 5321.3 3208.5 8311.1 8340.47
Table 3. Results with WoM as the Dependent Variable (Volume of WoM is Considered)
Coefficients of variables number of employees, education of employees, positive language of promotional text, and dummies
representing the scope of the BDV, type of innovation (B2B or B2C), location, and BDV’s year of establishment are not reported for
brevity;
#p < 0.10, * p < 0.05, ** p < 0.01, *** p< 0.001;
For GLS estimations, corrections for panel specific AR1 and Heteroskedasticity are used.

166
WoM measured by volume
Direct effect Interaction effect
Novel Incremental Novel Incremental
Model 13 Model 14 Model 15 Model 16
DV=
Twitter WoM AL WoM Twitter WoM AL WoM Twitter WoM AL WoM Twitter
WoM
AL
WoM
Sequence Quality in Twitter 0.211*** 0.115*** 0.257*** 0.083** 0.087** 0.119** 0.167*** 0.089*
Sequence Quality in AL 0.028* 0.072** 0.021# 0.092*** 0.041* 0.195*** 0.028# 0.073*
Twitter WoM
0.091***
0.050*
0.032*
0.033*
AL WoM 0.062**
0.039**
0.038*
0.015#
Sequence Quality in Twitter
* Sequence Quality in AL
0.115*** 0.272*** 0.003 0.011
N 2844 2844 1269 1269 2844 2844 1269 1269
Wald’s Chi 6718.23 7129.25 5564.33 6701.23 7782.48 8095.34 6624.24 7639.17
Coefficients of variables number of employees, education of employees, positive language of promotional text, and dummies
representing the scope of the BDV, type of innovation (B2B or B2C), location, and BDV’s year of establishment are not reported for
brevity;
#p < 0.10, * p < 0.05, ** p < 0.01, *** p< 0.001;
GLS estimation with corrections for panel specific AR1 and Heteroskedasticity is used.

167
Table 4. Results with Raised Capital as the Dependent Variable (Volume of WoM is Considered)
WoM measured by volume
GLS AB-GMM
Direct effect Interaction effect Interaction effect
Novel Incremental Novel Incremental Novel Incremental
Model 17 Model 18 Model 19 Model 20 Model 21 Model 22
DV= Raised capital Raised capital Raised capital
Sequence Quality in Twitter 0.022# 0.003 0.028# 0.010# 0.002 0.023*
Sequence Quality in AL 0.019 0.005 0.015 0.012 0.003 0.014*
Twitter WoM 0.355*** 0.407*** 0.375*** 0.227*** 0.082* 0.171***
AL WoM 0.071* 0.098** 0.062* 0.039* 0.025# 0.028*
Sequence Quality in Twitter *
Sequence Quality in AL
0.110** 0.025 0.062# 0.005
Twitter WoM * AL WoM
0.176*** 0.009 0.221* -0.008
N 2844 1269 2844 1269 2844 1269
Wald’s Chi 5582.56 6689.47 7612.28 8124.72 3298.1 2678.33
Coefficients of variables number of employees, education of employees, positive language of promotional text, and
dummies representing the scope of the BDV, type of innovation (B2B or B2C), location, and BDV’s year of
establishment are not reported for brevity;
#p < 0.10, * p < 0.05, ** p < 0.01, *** p< 0.001;
For GLS estimations, corrections for panel specific AR1 and Heteroskedasticity are used.

168
Table 5. Results with WoM as the Dependent Variable- Security Sub-Sample
WoM measured by sentiment
Direct effect Interaction effect
Novel Incremental Novel Incremental
Model 23 Model 24 Model 25 Model 26
DV=
Twitter WoM AL WoM Twitter WoM AL WoM Twitter WoM AL WoM Twitter
WoM
AL WoM
Sequence Quality in
Twitter 0.144*** 0.142*** 0.084* 0.062* 0.229*** 0.128*** 0.173*** 0.127***
Sequence Quality in AL 0.022 0.012 0.013 0.004 0.003 0.008 0.015 0.021#
Twitter WoM
0.114***
0.115*
0.119***
0.094**
AL WoM 0.006
0.008
0.005
0.006
Sequence Quality in
Twitter * Sequence
Quality in AL
0.063* 0.141*** 0.002 0.004
N 740 740 342 342 740 740 342 342
Wald’s Chi 5372.54 6186.87 5328.34 4876.72 5633.25 6772.83 5843.69 6671.32
Coefficients of variables number of employees, education of employees, positive language of promotional text, and dummies
representing the scope of the BDV, type of innovation (B2B or B2C), location, and BDV’s year of establishment are not reported for
brevity;
#p < 0.10, * p < 0.05, ** p < 0.01, *** p< 0.001;
GLS estimation with corrections for panel specific AR1 and Heteroskedasticity is used.

169
Table 6. Results with Raised Capital as the Dependent Variable- Security Sub-Sample
WoM measured by sentiment
Direct effect Interaction effect
Novel Incremental Novel Incremental
Model 27 Model 28 Model 29 Model 30
DV= Raised capital Raised capital
Sequence Quality in Twitter 0.005 0.008 0.004 0.003
Sequence Quality in AL 0.004 0.011 0.008 0.008
Twitter WoM 0.326*** 0.242*** 0.092*** 0.072***
AL WoM 0.007 0.002 0.015 0.004
Sequence Quality in Twitter *
Sequence Quality in AL
0.083* 0.002
Twitter WoM * AL WoM
0.332*** 0.002
N 740 342 740 342
Wald’s Chi 7334.69 7881.45 8234.54 8127.29
Coefficients of variables number of employees, education of employees, positive language of
promotional text, and dummies representing the scope of the BDV, type of innovation (B2B or
B2C), location, and BDV’s year of establishment are not reported for brevity;
#p < 0.10, * p < 0.05, ** p < 0.01, *** p< 0.001;
For GLS estimations, corrections for panel specific AR1 and Heteroskedasticity are used.

170
Table 7. Results with WoM as the Dependent Variable- Analytics Sub-Sample
WoM measured by sentiment
Direct effect Interaction effect
Novel Incremental Novel Incremental
Model 31 Model 32 Model 33 Model 34
DV=
Twitter WoM AL WoM Twitter WoM AL WoM Twitter WoM AL WoM Twitter
WoM
AL WoM
Sequence Quality in Twitter 0.221*** 0.031# 0.026* 0.032** 0.118*** 0.086** 0.088** 0.084**
Sequence Quality in AL 0.098*** 0.152*** 0.062* 0.095** 0.082** 0.153*** 0.048* 0.141***
Twitter WoM
0.019#
0.023*
0.003
0.011#
AL WoM 0.062**
0.078**
0.066*
0.062**
Sequence Quality in Twitter *
Sequence Quality in AL
0.188*** 0.213*** 0.004 0.011
N 1248 1248 519 519 1248 1248 519 519
Wald’s Chi 4356.98 5612.78 57812.35 6783.58 7322.68 6379.33 7334.69 7981.12
Coefficients of variables number of employees, education of employees, positive language of promotional text, and dummies
representing the scope of the BDV, type of innovation (B2B or B2C), location, and BDV’s year of establishment are not reported for
brevity;
#p < 0.10, * p < 0.05, ** p < 0.01, *** p< 0.001;
GLS estimation with corrections for panel specific AR1 and Heteroskedasticity is used.

171
Table 8. Results with Raised Capital as the Dependent Variable- Analytics Sub-Sample
WoM measured by sentiment
Direct effect Interaction effect
Novel Incremental Novel Incremental
Model 35 Model 36 Model 37 Model 38
DV= Raised capital Raised capital
Sequence Quality in Twitter 0.013# 0.035** 0.001 0.004
Sequence Quality in AL 0.018# 0.013# 0.008 0.012
Twitter WoM 0.081* 0.061* 0.082** 0.060**
AL WoM 0.248*** 0.189*** 0.312*** 0.253***
Sequence Quality in Twitter *
Sequence Quality in AL
0.041* 0.008
Twitter WoM * AL WoM
0.182*** -0.005
N 1248 519 1248 519
Wald’s Chi 7652.21 6537.82 8128.9 8256.18
Coefficients of variables number of employees, education of employees, positive language of
promotional text, and dummies representing the scope of the BDV, type of innovation (B2B or
B2C), location, and BDV’s year of establishment are not reported for brevity;
#p < 0.10, * p < 0.05, ** p < 0.01, *** p< 0.001;
For GLS estimations, corrections for panel specific AR1 and Heteroskedasticity are used.

172
Table 9. Results with WoM as the Dependent Variable- Infrastructure Sub-Sample
WoM measured by sentiment
Direct effect Interaction effect
Novel Incremental Novel Incremental
Model 39 Model 40 Model 41 Model 42
DV=
Twitter WoM AL WoM Twitter WoM AL WoM Twitter WoM AL WoM Twitter
WoM
AL
WoM
Sequence Quality in Twitter 0.314*** 0.061* 0.012# 0.025** 0.102** 0.01 0.082* 0.006
Sequence Quality in AL 0.082** 0.182*** 0.078** 0.098*** 0.118*** 0.287*** 0.022# 0.203***
Twitter WoM
0.018#
0.010#
0.004
0.003
AL WoM 0.071*
0.121***
0.048*
0.032*
Sequence Quality in Twitter
* Sequence Quality in AL
0.097*** 0.150*** 0.009 0.015
N 856 856 408 408 856 856 408 408
Wald’s Chi 6378.22 7345.9 5478.34 5682.22 5377.18 6439.86 7845.63 6854.32
Coefficients of variables number of employees, education of employees, positive language of promotional text, and dummies
representing the scope of the BDV, type of innovation (B2B or B2C), location, and BDV’s year of establishment are not reported for
brevity;
#p < 0.10, * p < 0.05, ** p < 0.01, *** p< 0.001;
GLS estimation with corrections for panel specific AR1 and Heteroskedasticity is used.

173
Table 10. Results with Raised Capital as the Dependent Variable- Infrastructure Sub-Sample
WoM measured by sentiment
Direct effect Interaction effect
Novel Incremental Novel Incremental
Model 43 Model 44 Model 45 Model 46
DV= Raised capital Raised capital
Sequence Quality in Twitter 0.012* 0.026** 0.002 0.003
Sequence Quality in AL 0.018* 0.013# 0.011# 0.009
Twitter WoM 0.052* 0.021# 0.062* 0.040*
AL WoM 0.126** 0.317*** 0.224*** 0.184**
Sequence Quality in Twitter *
Sequence Quality in AL
0.038# 0.007
Twitter WoM * AL WoM
0.192*** 0.002
N 856 408 856 408
Wald‘s Chi 5332.21 6782.63 7319.42 8102.8
Coefficients of variables number of employees, education of employees, positive language of
promotional text, and dummies representing the scope of the BDV, type of innovation (B2B or
B2C), location, and BDV’s year of establishment are not reported for brevity;
#p < 0.10, * p < 0.05, ** p < 0.01, *** p< 0.001;
For GLS estimations, corrections for panel specific AR1 and Heteroskedasticity are used.

174
Appendix A. Correlation Matrix
Mean S.D. 1 2 3 4 5 6
1 Sequence quality in Twitter 0.19 0.25
2 Sequence quality in AL 0.23 0.31 0.18**
3 Twitter WoM Sentiment 0.58 0.29 0.23*** 0.16*
4 Twitter WoM Volume 118.21 43.16 0.19*** 0.07# 0.12*
5 AL WoM Sentiment 0.52 0.26 0.14* 0.28*** 0.05 0.07
6 Al WoM Volume 32.42 18.11 0.08# 0.17* 0.02 0.11# 0.10*
7 Raised Capital 1.08 0.32 0.27*** 0.32*** 0.48*** 0.33** 0.18** 0.13#
#p < 0.10, * p < 0.05, ** p < 0.01, *** p< 0.001; N= 4,113.

175
Appendix B. Illustrative Example of Social Media Promotion
Personal Alias
(Twitter) Barricade IO Retweeted
David Coallier @davidcoallier
And this happened (@barricadeio): https://barricade.io/ Venture Alias
(Twitter) Barricade IO @barricadeio
The foundations of #infosec explained in an infographic
https://blog.barricade.io/the-art-of-
security/?utm_source=socialsharing&utm_medium=infographic&utm_term=
The%20Art%20of%20Security%20Information%20Security%20Infographic
&utm_content=infographic&utm_campaign=ArtofSecurityInfographic …#in
fographic#DevOps#Design
News (Twitter) Barricade IO Retweeted
eForensics Magazine @eForensics_Mag
The Art of Security - Explained Visually by
@barricadeiohttp://bit.ly/2bf9EOs #cybersecurity#cybercrime#dfir
Follower
(Twitter) Barricade IO Retweeted
Charlie Taylor @ChasTaylor
Hot off the presses: Sophos has acquired Cork-based start-up @barricadeio,
headed by @davidcoallier
Personal Alias
(AngelList) David Coallier commented on Barricade
Hey Paul, the round has been opened for a while on Angel List. Would love
to jump on a call to clarify when you have time :)
Venture Alias
(AngelList) Barricade
Hey everyone! We've completely redefined our onboarding and would love
if you'd give it a try! https://barricade.io — Cheers!
News
(AngelList) independent.ie
Cork IT security startup to create 35 jobs - Independent.ie
The company has been set up by serial Irish technology entrepreneur David
Coallier, who co-founded Dublin-based Orchestra, sold to US multinational
firm Engineyard in 2011. Barricade's expansion comes shortly after an initial
€1m funding round. Investors

176
Appendix C. The Effect of Narrator Frequencies on Capital Raised
Novel Incremental
Model C1 Model C1
DV= Raised capital
Frequency of Personal Alias (Twitter) 0.112*** 0.019#
Frequency of Venture Alias (Twtter) 0.023 0.076**
Frequency of News (Twitter) 0.065** 0.054**
Frequency of Follower (Twitter) 0.083*** 0.079**
Frequency of Personal Alias (AL) 0.203*** 0.011
Frequency of Venture Alias (AL) 0.033#
0.215***
Frequency of News (AL) 0.037* 0.062**
Twitter WoM 0.029* 0.014#
AL WoM 0.110** 0.081*
N 2844 1269
Wald‘s Chi 4827.1 6339.3
Coefficients of variables number of employees, education of employees,
positive language of promotional text, and dummies representing the
scope of the BDV, type of innovation (B2B or B2C), location, and BDV’s
year of establishment are not reported for brevity;
#p < 0.10, * p < 0.05, ** p < 0.01, *** p< 0.001;
For GLS estimations, corrections for panel specific AR1 and
Heteroskedasticity are used.

177
Chapter 5: Conclusions
This dissertation is motivated by contributing to two emerging topics in IS: new IT ventures,
and the Big Data industry. On the one hand, although IT entrepreneurial firms have been
pioneers of innovation in the field, making the Silicon Valley the symbol of IT advancements,
research has been lacking to understand how these small, organic, and sometimes fragile
organizations grow into giants that define the industry‘s norms and trends. Specifically, the
field‘s understanding of the strategic factors influencing the economic ―success‖ of new IT
ventures has been limited. On the other hand, the organizational research on Big Data
technologies – specifically, how they emerge and grow as IT innovations and how firms benefit
from investing them – is still in the infancy stage (Goes 2014). With most Big Data innovations
driven by new ventures, this dissertation seizes the opportunity to understand the strategic factors
that affect the economic success of new Big Data ventures (i.e., BDVs).
While understanding the strategies followed by new IT ventures is the core theoretical
phenomenon of interest in this dissertation, this phenomenon is investigated in the rich context of
Big Data. This is done in a study of three essays. In developing the essays, we have changed our
theoretical focus from the phenomenon to the context, and vice versa. Focusing on the Big-Data-
specific value propositions offered by BDVs, Chapter 2 has examined the context of Big Data
and shed light on the hierarchy of Big Data technologies‘ 4V emphases. By contrast, essays 2
and 3 have focused on the phenomenon of new IT ventures theoretically, and described this
phenomenon in the highly relevant context of Big Data. In understanding the entrepreneurial
success, essay 2 has drawn a distinction between the Big Data and a medical context, whereas,
essay 3 has pointed to the differences among certain areas within the Big Data context. As a
whole, this dissertation contributes to the literature on: new IT ventures, and Big Data. Below,
we explain the contributions of each essay in detail.

178
Chapter 2 (Essay 1)
Essay 1 is primarily focused on understanding how value is created by Big Data
technologies. The existing literature on Big Data defines Big Data technologies as those helping
organizations handle data that has a high volume and fast flow to organizational systems
(volume), and is gathered from various sources and in various formats (variety), with assuring its
veracity being a challenging task (Chen et al. 2012). These 4V challenges of Big Data, and the
Big Data technology‘s roles in handling these challenges is almost undisputed. However, the
existing literature is unclear about the relative value of tackling each V by different Big Data
technologies. Specifically, it is interesting to know whether Big Data technologies are
homogeneous with regards to their intent in tackling the 4V challenges, or there exists some
heterogeneity.
In this essay, we discussed that Big Data technologies include a wide architectural range,
from infrastructural applications that allow distributed storage and retrieval of data, to analytical
applications that use distributed computing along with advanced statistical algorithms to identify
and model complex trends and behaviors. Therefore, the role of emphasizing each V was studied
in each architectural scope. Our results suggested that for infrastructural technologies, only
emphasizing volume and velocity creates value. However, as the technology moves up the ladder
of architectural hierarchy, emphasizing the veracity and variety aspects become more relevant.
These results suggest that the 4Vs are not homogeneous with regards to value that tackling them
creates. Rather, depending on the scope of the Big Data technology, certain aspects become more
important. The findings also suggest that handling volume and velocity of today‘s data is the
essential part of Big Data technologies, regardless of their scope.

179
In addition to bringing clarity regarding the value of emphasizing each of the 4Vs of Big
Data, the findings show that the verbal communication of a new venture‘s value propositions
effectively influences the financial success of the venture itself, as well as the value created for
its investors. One finding in this essay suggests that verbally communicating value propositions
by a third party (e.g., a news piece, or blog post about the venture) has an effect similar to when
the message is delivered by the venture itself. These findings can direct entrepreneurs‘ attention
towards the third party coverage of their venture as a reliable source to communicate value
propositions to the investors.
Chapter 3 (Essay 2)
While communicating value propositions are important to convince investors,
embeddedness in social networks is another means through which entrepreneurs can promote
their product/service, and access valuable resources that are otherwise inaccessible or can only
be accessed at a higher price (Witt 2004). The existing literature on success of new ventures has
focused on network ties that allow accessing financial capital. Especially at their later stages of
development, where new ventures become economically viable and competitive, financial capital
is essential to maintain a rapid growth. Nonetheless, the role of network embeddedness in the
development of a new venture‘s innovation in the early stages of development is less understood.
The existing literature (e.g., Brüderl and Preisendörfer 1996, Jenssen and Greve 2002, Florin et al.
2003) has focused on new ventures at the later stages of development (e.g., initial public offering,
IPO) and therefore, the focus has been the access to the much needed financial capital, but
accessing intellectual capital has remained understudied. Therefore, the relevance of the network
embeddedness to the intellectual capital necessary for development of innovations is overlooked.
Specifically, Big Data provides a rich context to understand the role that networks play in the

180
development of innovations. We discussed that Big Data technologies have the characteristics of
a technological area where innovations can be socially-constructed. Focusing on the literature on
IT innovations (e.g., Couger 1973; Kautz et al. 2007), we identified the educational and professional
networks as networks that can supply the intellectual capital needed to develop Big Data
innovations.
Our findings suggest that having educational and professional ties to other ventures improve
the economic success of a BDV. We find that these results are in sharp contrast to the
observations from a comparable industry, i.e., medical devices, where we failed to find any
evidence that suggests inter-venture educational or professional ties help a new venture become
economically successful. These results involve important implications. Notably, the findings
suggest that Big Data technologies are developed socially and through associative educational
and professional ties. The existing networks literature suggests that entrepreneurs should spend
time to create social ties with individuals and organizations that can provide access to financial
capital. Our findings suggest that in addition to these networking activities, entrepreneurs,
especially those in industries that resemble the Big Data industry, should consider their
embeddedness in networks that can supply access to intellectual capital. New ventures have
limited resources to recruit a limited number of employees in their early stages of development.
One implication of our findings is that entrepreneurs can use employee recruitment as a means to
better embed their venture in the knowledge network of new ventures where technological
innovations are co-constructed. Screening a prospective employee‘s educational and professional
background and assessing its relevance, i.e., the degree of similarity or distinctiveness, to the
employees of other ventures in the industry can help new ventures become more successful.

181
Also, another finding in this essay suggests that a separate consideration of networks of
different ties can resolve some of the equivocal findings of the previous literature. For example,
the previous literature (Elfting and Hulsink 2003) suggests that a mix of network cohesions, i.e.,
density, and structural holes is required to develop radical innovations. However, network
cohesion and structural holes can rarely co-exist in the same network. Nonetheless, if two
networks are structurally different, one can supply a venture with the needed cohesion, while the
other can supply access to structural holes. Using Kendall‘s rank correlation between the
structural features, e.g., network density or restrictedness, of two different networks we showed
how two networks can be compared to assess their structural differences. Moreover, we
empirically validated the thesis that structurally-different networks can provide a simultaneous
―mix‖ of seemingly-paradoxical network structures. The previous research encourages
superimposing networks of different ties because doing so allows for considering multiplex
relationships between the network edges. However, as networks start becoming different, the
likelihood of having multiplex ties in the superimposed network subsides, and instead the
likelihood of maintaining ambivalence, i.e. access to networks with seemingly paradoxical
features, for actors of the network increases. Essay 2, provides an example of where a separate
consideration of networks of different ties illuminates the importance of network ambivalence
for ventures pursuing a radical innovation.
Chapter 4 (Essay 3)
Essay 1 points to the importance of communicating the worth of a venture to its investors,
and essay 2 points to the importance of network embeddedness. Social media provides a unique
platform for a new venture to both communicate its worth, and create ties with macro- and
micro-investors. Therefore, essay 3 studied the successful promotional strategies that BDVs

182
pursue in their social media. The current literature (Fischer and Rueber 2014) has examined the
effect of the verbal content of promotional messages in social media. Similarly, our findings in
essay 1 indicate the importance of the verbal communication of the venture‘s value propositions
to the investors. However, promotional strategies can extend beyond verbal communications.
Specifically, the previous literature suggests that entrepreneurs often involve in symbolic
communications with investors, signaling certain qualities through executing a sequence of
actions. This essay strived to understand the means through which symbolic communication is
carried in social media. We explained that social media allows promotional messages to be
communicated by different narrators, and that following a sequence of narrators can establish a
form of symbolic communication by itself. We find that over time, the most successful BDVs
alternate the narrators of their promotional messages, and avoid a monotonic communication.
Moreover, our findings suggest that the beneficial sequence of narrators differ for ventures
pursuing radical and incremental innovations. While the previous literature encourages
entrepreneurs to manage the content of their messages in social media, our findings suggest that
selecting the source of delivering the message is also of important. Moreover, our results point to
the superiority of certain rhythms in narrating, suggesting that not only it matters who narrates
the message, it also matters when that narrator delivers it. Also, we showed that the beginning
and the ending periods of a fundraising campaigns are critical points at which the most
influential narrators, depending on the radicalness of strategy, communicate with the investors.
A second contribution of this essay is providing evidence regarding the cross-platform
effects. Specifically, we show that ventures in the today‘s world, broadcasting to micro- and
macro-investors in different platforms, should coordinate their promotional efforts. Our findings
suggest that strategies pursued in one platform affect the positive reactions by the audience in

183
another platform, especially in the case of the more disruptive and radical innovations. Investors
face more uncertainty when considering investment in radical innovations. Our results show that
in the presence of such uncertainty, the search for competency signals can extend to the symbolic
communications that are originally intended to other audiences.

184
References
Brüderl, J., and P. Preisendörfer. 1998, "Network Support and the Success of Newly Founded
Business," Small Business Economics (10:3), pp. 213-225.
Chen, H., R. H. L. Chiang, and V. C. Storey. 2012, "Business Intelligence and Analytics: From
Big Data to Big Impact," MIS Quarterly (36:4), pp. 1165-1188.
Couger, J. D. 1973, "Curriculum Recommendations for Undergraduate Programs in Information
Systems," Communications of the ACM (16:12), pp. 727-749.
Elfring, T., and W. Hulsink. 2003, "Networks in Entrepreneurship: The Case of High-
Technology Firms," Small Business Economics (21:4), pp. 409-422.
Florin, J., M. Lubatkin, and W. Schulze. 2003, "A Social Capital Model of High-Growth
Ventures," Academy of Management Journal (46:3), pp. 374-384.
Fischer, E., and A. R. Reuber. 2014, "Online Entrepreneurial Communication: Mitigating
Uncertainty and Increasing Differentiation Via Twitter," Journal of Business Venturing
(29:4), pp. 565-583.
Goes, P. B. 2014, "Editor's Comments: Big Data and IS Research," MIS Quarterly (38:3), pp. iii-
viii.
Jenssen, J. I., and H. F. Koenig. 2002, "The Effect of Social Networks on Resource Access and
Business Start-Ups," European Planning Studies (10:8), pp. 1039-1046.
Kautz, K., S. Madsen, and J. Nørbjerg. 2007, "Persistent Problems and Practices in Information
Systems Development," Information Systems Journal (17:3), pp. 217-239.
Witt, P. 2004, "Entrepreneurs‘ Networks and the Success of Start-Ups," Entrepreneurship &
Regional Development (16:5), pp. 391-412.