big data and use cases
TRANSCRIPT

BIG DATA AND USE CASESBhaskara Reddy Sannapureddy, Senior Project Manager@Infosys, +91-7702577769

Agenda
The objectives of this presentation are to discuss the benefits of big data and to present use cases and case studies that demonstrate the value of advanced analytics. It also explains how the existing data warehousing environment can be extended to support big data solutions.
Topics that will be covered include:
• Review the history and evolution of big data and advanced analytics
• Explain the role of the data scientist in developing advanced analytics
• Look at the technologies that support big data
• Discuss big data use cases and the benefits they bring to the business

The Evolution of Digital Data
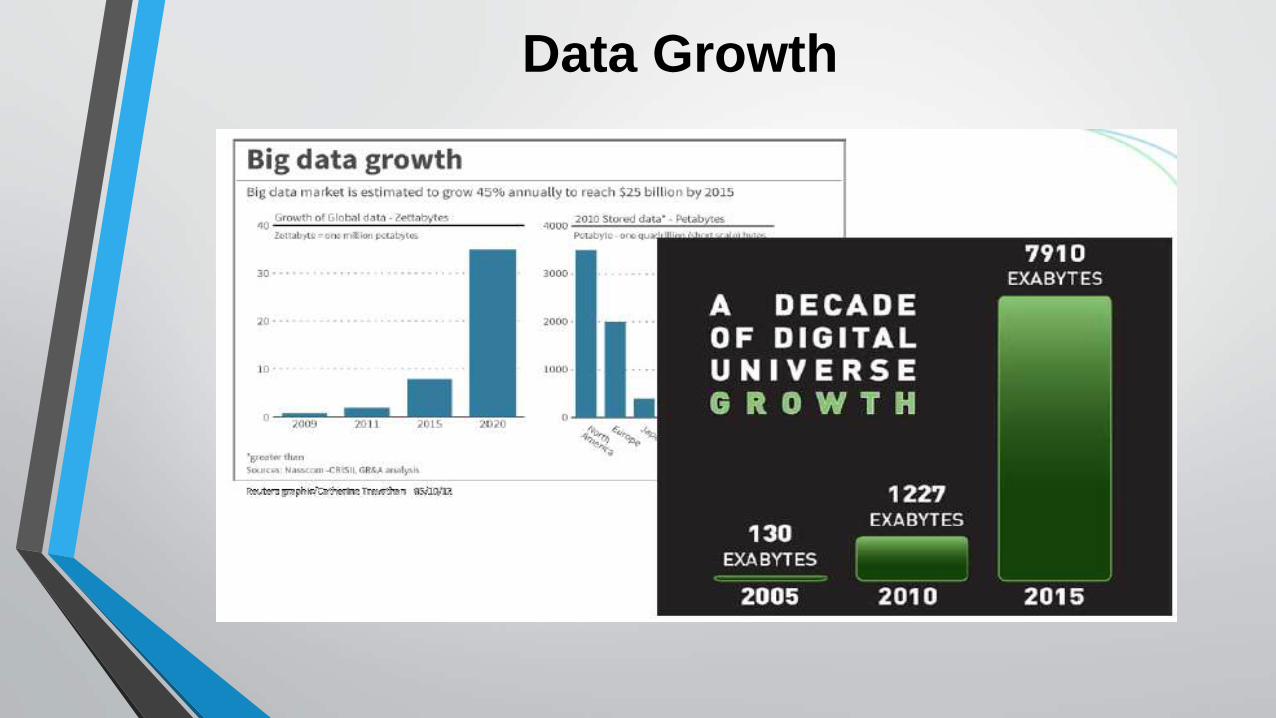
Data Growth

Data Growth – Multi Structured DataDefinition: Data that has unknown, ill-defined or overlapping
schemas
Machine generated data, e.g., sensor data, system logs
Internal/external web content including social computing data
Text, document and XML data
Graph, map and multi-media data
Volume increasing faster than structured data
Usually not integrated into a data warehouse
Increasing number of analytical techniques to extract useful
information from this data
This information can be used to extend traditional predictive
models and analytics
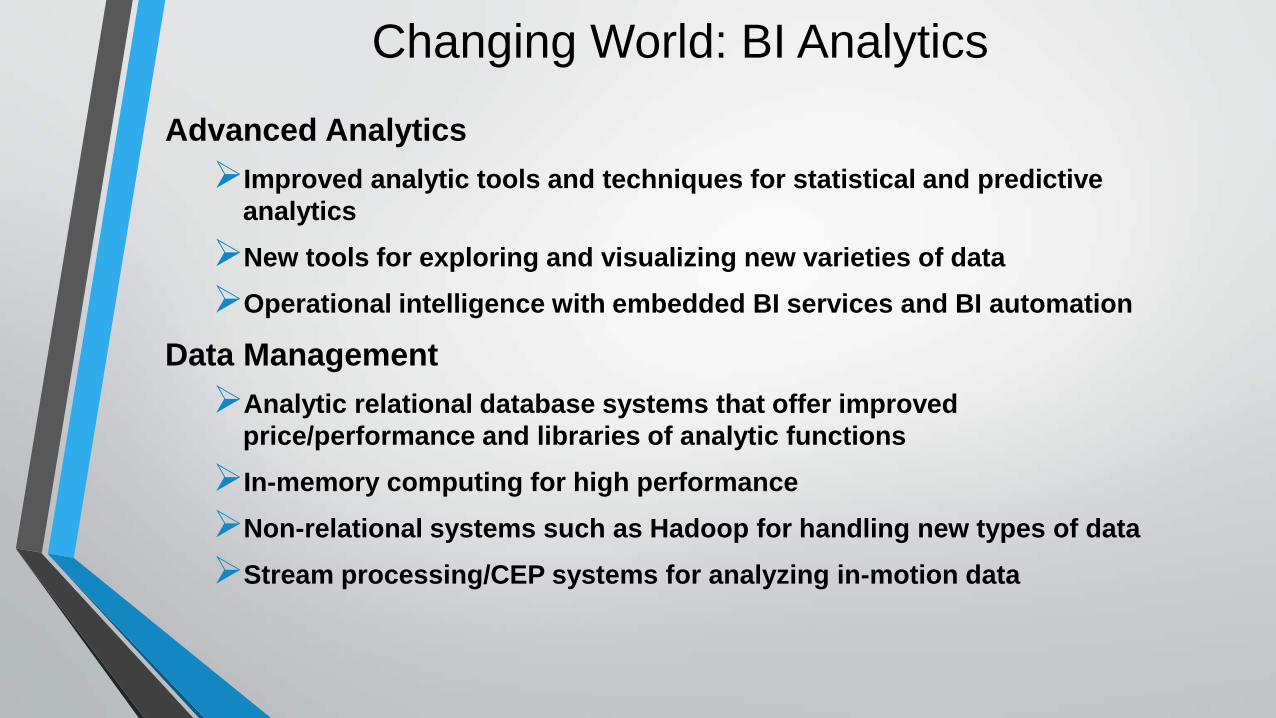
Changing World: BI Analytics
Advanced Analytics
Improved analytic tools and techniques for statistical and predictive
analytics
New tools for exploring and visualizing new varieties of data
Operational intelligence with embedded BI services and BI automation
Data Management
Analytic relational database systems that offer improved
price/performance and libraries of analytic functions
In-memory computing for high performance
Non-relational systems such as Hadoop for handling new types of data
Stream processing/CEP systems for analyzing in-motion data

Advanced Analytics

Advanced Analytics
1. Descriptive analytics – using historical data to describe the business. This is
usually associated with Business Intelligence (BI) or visibility systems. In supply
chain, you use descriptive analytics to better understand your historical demand
patterns, to understand how product flows through your supply chain, and to
understand when a shipment might be late.
2. Predictive analytics – using data to predict trends and patterns. This is
commonly associated with statistics. In the supply chain, you use predictive
analytics to forecast future demand or to forecast the price of fuel.
3. Prescriptive analytics – using data to suggest the optimal solution. This is
commonly associated with optimization. In the supply chain, you use
prescriptive analytics to set your inventory levels, schedule your plants, or route
your trucks.

Data Science Skill Requirements

BIG DATA Application Examples
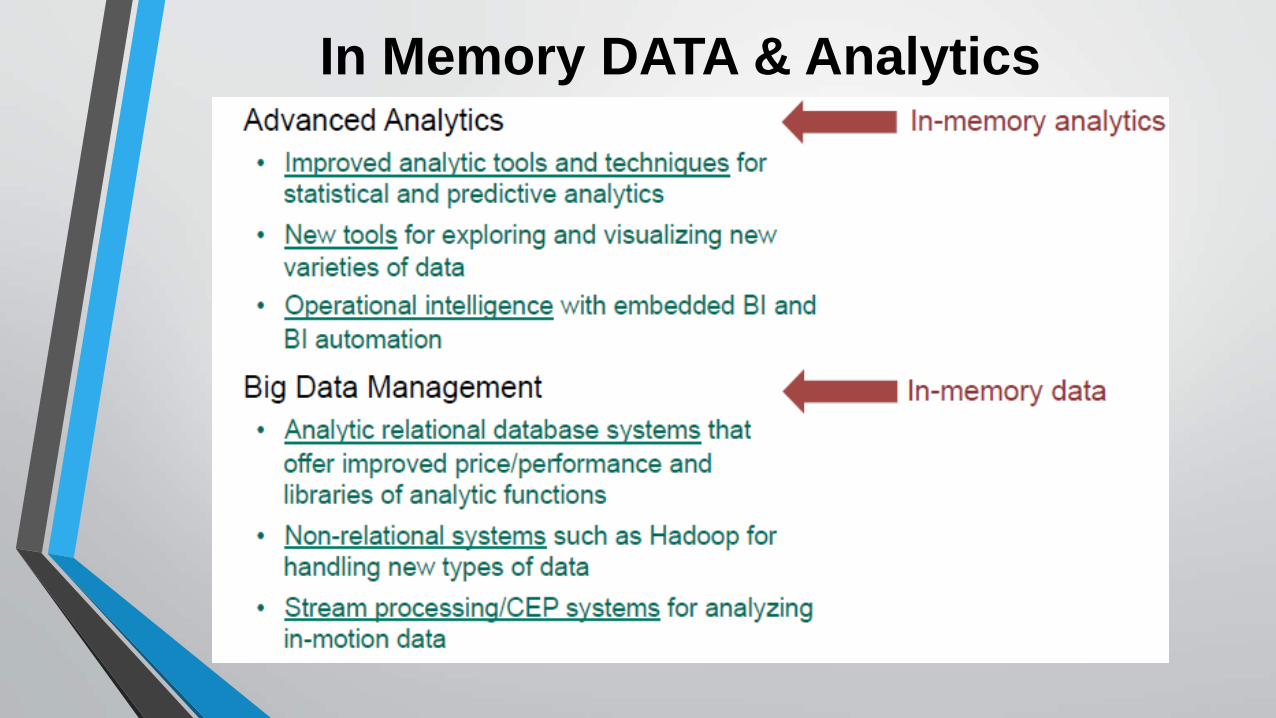
In Memory DATA & Analytics

In Memory Data
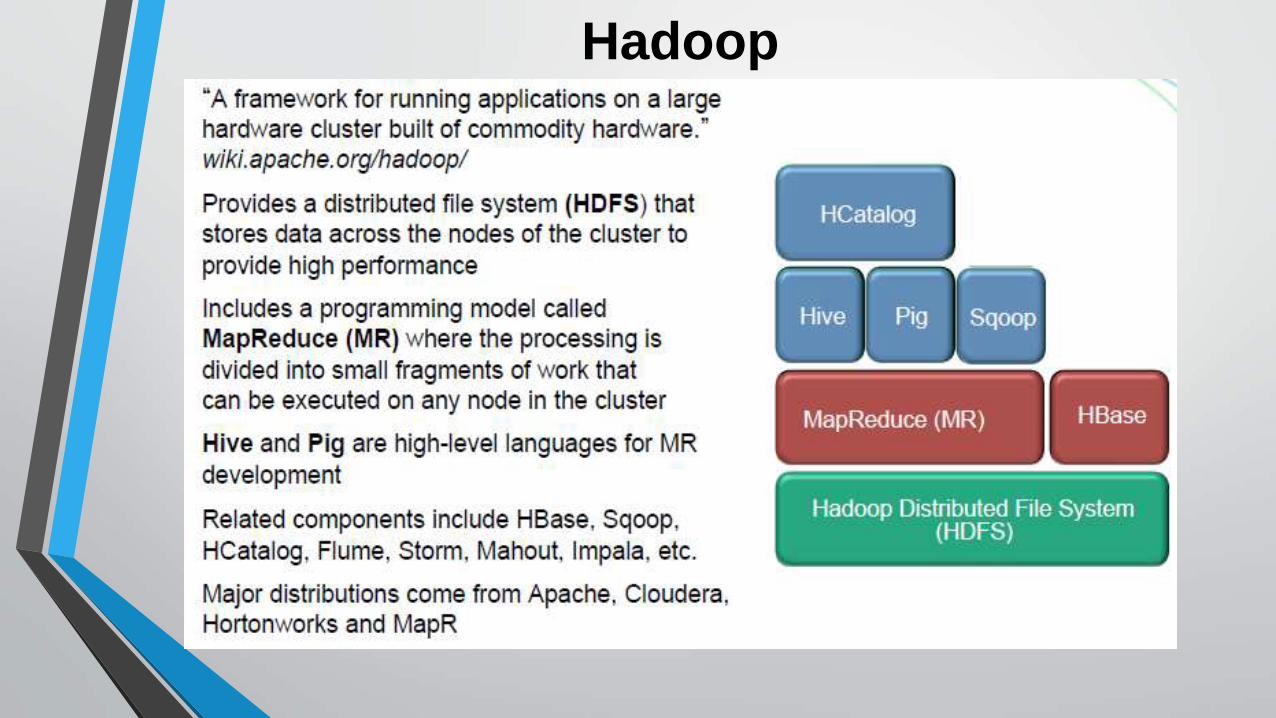
Hadoop

Hadoop Components
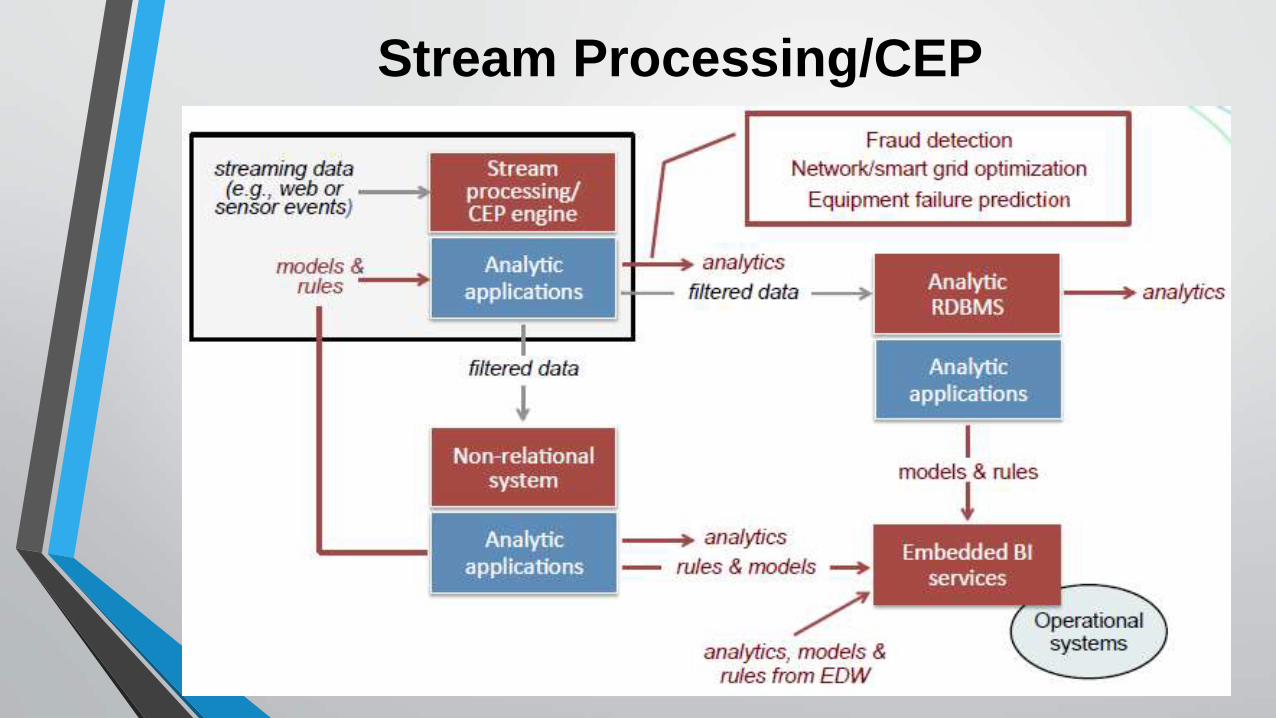
Stream Processing/CEP
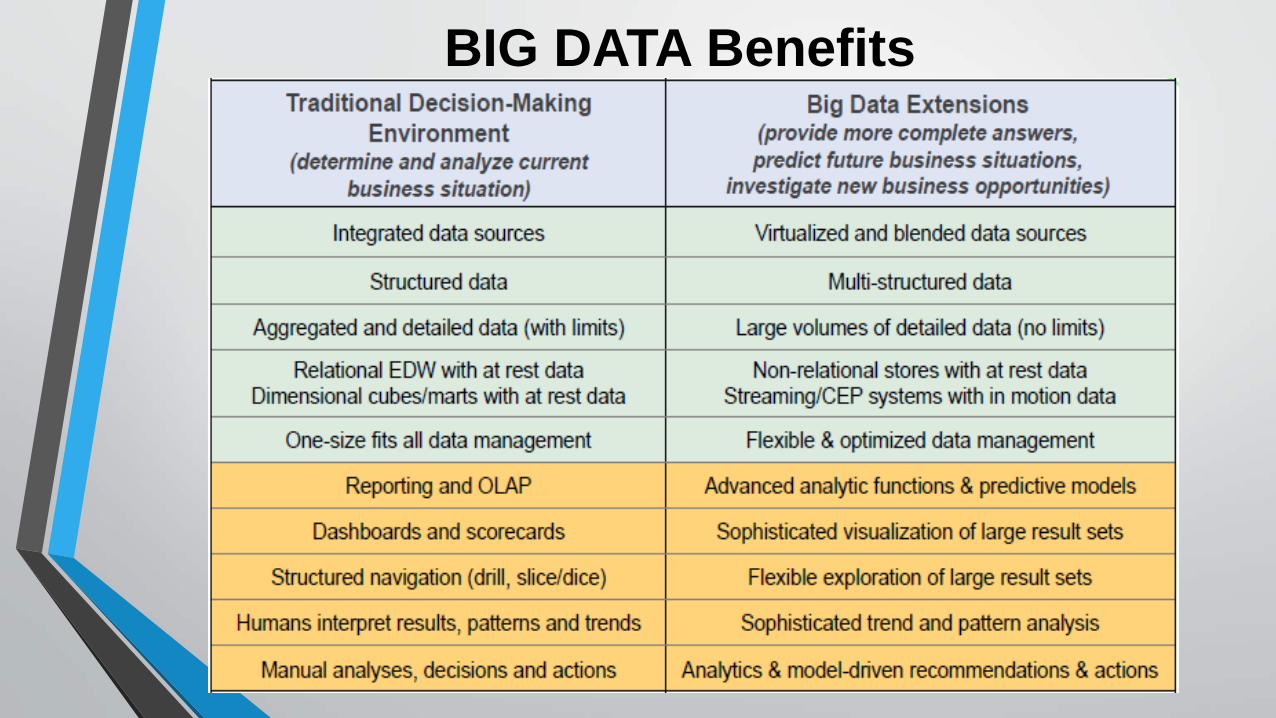
BIG DATA Benefits
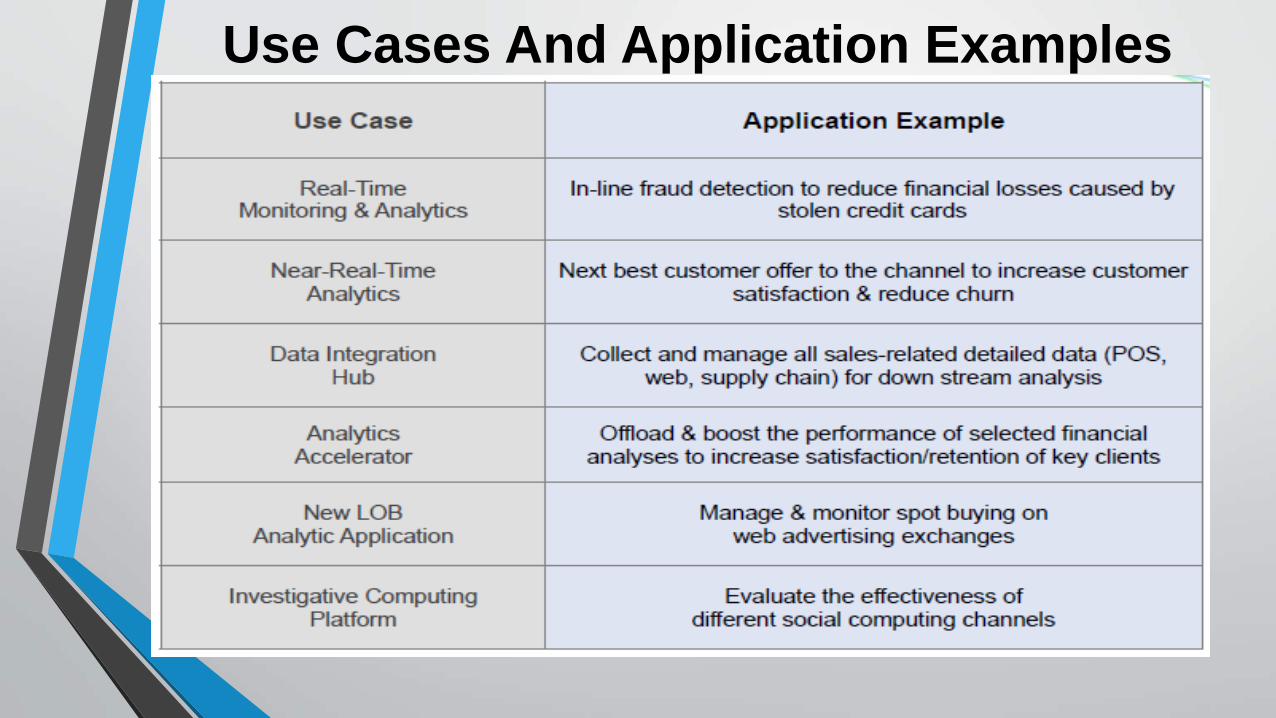
Use Cases And Application Examples
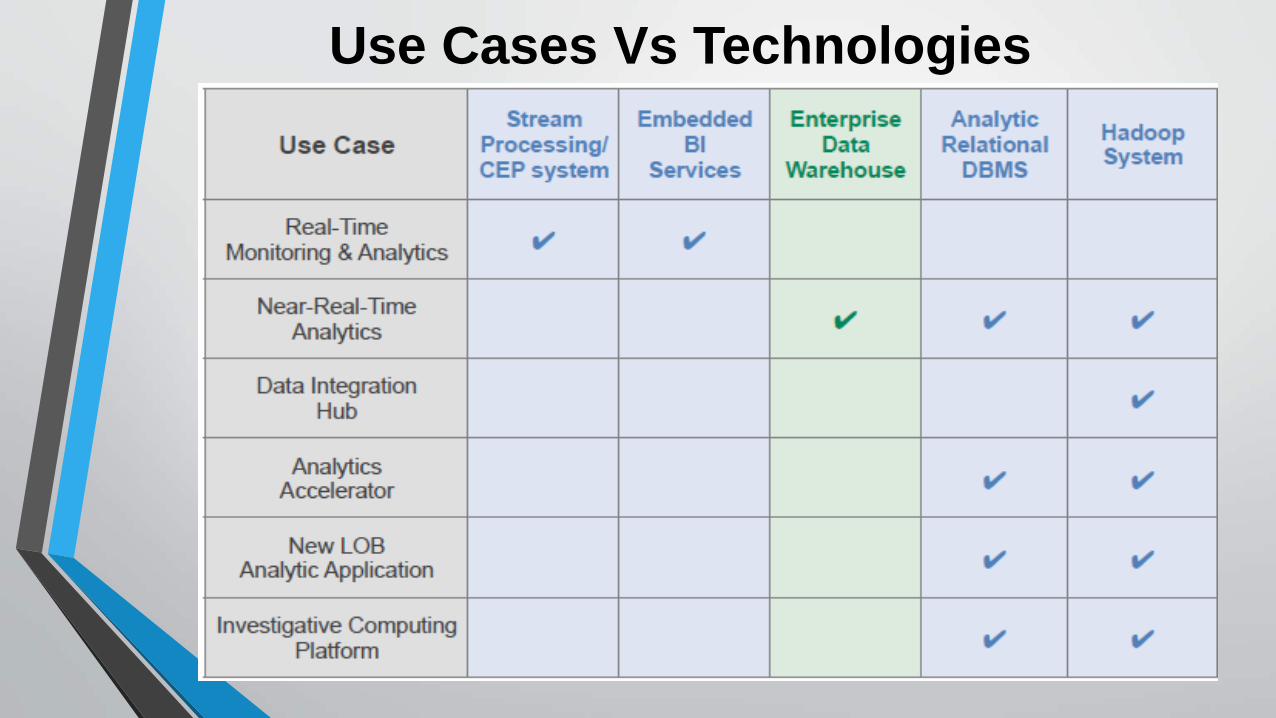
Use Cases Vs Technologies

RDBMS + Hadoop
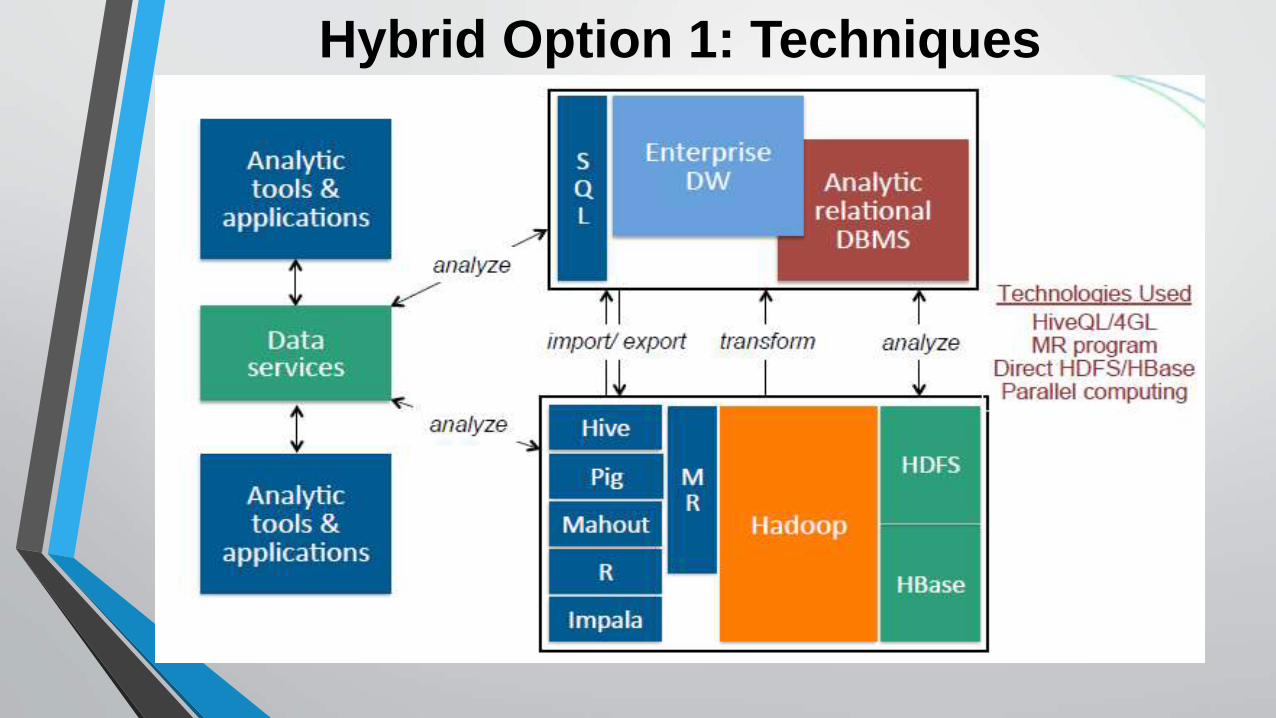
Hybrid Option 1: Techniques

Hybrid Option 1: Product Examples

R R is an integrated suite of software facilities for data manipulation, calculation and graphical display. This open source scripting
language has become an important part of the IT arsenal for analysts and data scientists conducting statistical analysis on big
data.
There are now about 2 million R users worldwide who utilize thousands of open sources packages within the R ecosystem to
enhance productivity in such domains as bioinformatics, spatial statistics, financial market analysis, and linear/non-linear
modeling.
While many developers and analysts run R programs on their personal computers, sometimes they need to do advanced
computations on large amounts of data in a short period of time. To assist these developers, Oracle has created a broad set of
options for conducting statistical and graphical analyses on data stored in Hadoop or Oracle Database, bringing enterprise caliber
capabilities to projects that require high levels of security, scalability and performance.
Oracle Advanced Analytics and Oracle R Connector for Hadoop combine the advantages of R with the power and scalability of
Oracle Database and Hadoop. R programs and libraries can be used in conjunction with these database assets to process large
amounts of data in a secure environment. Customers can build statistical models and execute them against local data stores as
well as run R commands and scripts against data stored in a secure corporate database.
Oracle Advanced Analytics links R to Oracle Database. Oracle Advanced Analytics, an option of Oracle Database Enterprise Edition,
empowers data and business analysts to extract knowledge, discover new insights and make predictions—working directly with
large data volumes in the Oracle Database. Oracle Advanced Analytics offers a combination of powerful in-database algorithms and
open source R algorithms, accessible via SQL and R languages, and provides a range of GUI and IDE options targeting the
spectrum from business users to data scientists.
In addition, Oracle R Connector for Hadoop, one of the Oracle Big Data Connectors, links R to Hadoop. If you have data spread out
in Hadoop Distributed File System (HDFS) clusters, you can use tools like Hive to lend structure to the data and create a table-like
environment. Analysts can then run queries against the HDFS files and execute the latest R packages inside the database.
Oracle Advanced Analytics can be used in conjunction with a multi-threaded version of open source R with enhanced mathematical
libraries. Oracle R Distribution can be readily enhanced with high performance libraries such as Intel’s MK for enhanced linear
algebra and matrix processing. Oracle R Distribution is supported by Oracle. It uses in-database statistical techniques to optimize
data transport and can leverage data-parallelism constructs within the database for enhanced scalability and performance.
Run R with Hadoop
Oracle R Connector for Hadoop (ORCH) is an R package that
provides transparent access to Hadoop and data stored in HDFS.
This Oracle Big Data Connector enables users to run R models
efficiently against large volumes of data, as well as leverage
MapReduce processes without having to leave the R
environment. They can use R to analyze data stored in HDFS with
Oracle supplied analytics, as well as utilize over 3,500 open
source R packages.
ORCH enables R scripts to run on data in Hive tables and files in
HDFS by leveraging the transparency layer as defined in Oracle R
Enterprise. Hadoop-based R programs can be deployed on a
Hadoop cluster. Users don’t need to know about Hadoop
internals, command line interfaces, or the IT infrastructure to
create, run, and store these R scripts.
Big Data Use Cases with Oracle Database
and HadoopUse Case 1: Analyzing Credit Risk
Banks continually offer new services to their customers, but the terms of these offers vary based on each
customer’s credit status. Do they pay the minimum amount due on credit balances, or more? Are their payments
ever late? How much of their credit lines do they use and how many other credit lines do the have? What is the
overall debt-to-income ratio?
All of these variables influence policies about how much credit to award to each customer, and what type of
terms to offer them. A bureau like Equifax or Transunion examines an individual’s overall credit history. But
banks can examine a much more detailed set of records about their customers—down to the level of every
discrete transaction. They need big data analytics to get down to this level of precision with this volume of data.
For example, one Oracle customer in Brazil is running multiple neural network algorithms against hundreds of
millions of records to examine thousands of attributes about each of its customers. Previously the bank had
trouble crunching this massive volume of data to generate meaningful statistics. They solved this problem by
running a specialized algorithm using Oracle R Connector for Hadoop to analyze this data in parallel on the same
cluster that is running the Hadoop file system, Hive, and other tools. The Oracle R Connector for Hadoop
enables analysts to execute R analysis, statistics and models on tables stored in the bank’s large Hadoop file
systems. They can now run complex statistical algorithms against these files systems and Hive tables. They can
also use specialized Mahout algorithms to perform unique analyses.
The Oracle algorithms are transparent to R users and accessed with a couple of lines of code. Behind the scenes,
ORCH provides the interface for executing MapReduce jobs in parallel on multiple processors throughout the
bank’s cluster. Analysts can create these MapReduce algorithms in R and store them in Hadoop as well as easily
surface these models for review, plotting and analysis—and then push them to the database—without having to
utilize Java.
Big Data Use Cases with Oracle Database
and HadoopUse Case 2: Detecting Fraud
Another popular use case involves detecting fraud by analyzing financial transactions. Banks, retailers, credit card
companies, telecommunications firms and many other large organizations wrestle with this issue. When scoring
fraud you typically study transactions as they occur within customer accounts. (Scoring refers to predicting
outcomes using a data-mining model.)
Once you understand the modus operandi – the normal mode of operations – you can then recognize unusual
patterns and suspicious transactions. For example, if you normally shop in Los Angeles and there is a sudden
series of transactions in Rome this would indicate a high likelihood of fraud. Or would it? If you are somebody
who travels a lot, is a surge of activity in Rome an anomaly or a regular pattern? By capturing all previous
transactions and studying these patterns you can develop a model that reflects normal behavior.
R has the ideal algorithms and environment for creating a scoring model that can analyze these transactions. But
because it was conceived as a single user tool it is not multi-threaded. The client and server components are
bundled together as a single executable, much like Excel. Thus with open source R the scoring model is limited
by the memory and processing power of the machine on which it runs. It can’t even leverage the CPU capacity
of a multi-processor laptop without special packages and programming—or without a special implementation.
Oracle Advanced Analytics can handle the massive computational requirements associated with analyzing
customer-purchasing patterns using the R language to define scripts that get pushed down and run in the
database. Organizations can leverage Oracle Exadata, Oracle Big Data Appliance, and Oracle Exalytics to scale
the effort, and integrate Oracle Business Intelligence Enterprise Edition to display the results. R developers can
take the fraud model out of HDFS and put it in Oracle Database where it can rapidly predict behavior at the
transactional level and be part of an enterprise application for real-time predictions.Real-time analysis is important in fraud prevention. It’s one thing to identify a fraudulent transaction that
happened eight hours ago (the length of time it might take to stage data into a laptop and run a detailed analysis
of yesterday’s activities). It’s clearly much more valuable to score that transaction against a model in real-time,
with the potential to block the transaction of flag it for further scrutiny.

Big Data Use Cases with Oracle Database
and HadoopUse Case 3: Preventing Customer Churn
Customer churn is a major problem for many businesses, especially in highly competitive markets such as
telecommunications. For example, as a mobile phone user, if you have problems with reception or experience
too many dropped calls you might think about looking for another service provider. Your existing service
provider is constantly analyzing your behavior to predict how likely you are to defect. They have a statistical
model that says, “90% of our customers with similar issues and behavior have left us for another service
provider.” They can apply that model to your data to create a score that reveals your likelihood of defecting.
Your score relates you to millions of other customers with similar behavior.
Using Oracle Advanced Analytics you can run these R models while a customer is browsing a webpage or using a
mobile app and then make on-the-spot recommendations based on current actions and real time analytics against
an operational data store or data warehouse.
Scoring can also be done offline. For example, you might want to predict which of your 100 million customers
will respond to each of a dozen offers so you can identify which customers should be targeted with a special
offer or ad campaign. With enough processing power and the right scoring model, analysts can provide insight
not only into what the churn rate is but also the reasons behind the churn. One telecommunications company
used Oracle R Connector for Hadoop to make richer, more informed decisions by examining payment records,
calling plans and service histories to detect similarities and trends within its customer databases. This connector
permitted them to run batch jobs in parallel on a large Hadoop cluster.
Oracle provides options for executing these computations from the R environment on data resident in HDFS,
Oracle Database, and local files.

Thank You