big data, big headaches: an agile modeling solution ... group...big data, big headaches: an agile...
TRANSCRIPT

Big Data, Big Headaches: An Agile Modeling Solution Designed for the Information Age
Mariam Seirafi

About the presenterMariam Seirafi is the Sr. Director of Business Solutions and Analytics at Cornerstone.
She is responsible for end to end data strategy, analytics and insights. Mariam and her team play a key role in optimizing the role of data to improve business benefits.
Mariam has 20 years of experience in data mining and analytics for large marketing organizations.

Big Data common business for most industries Big Data has exploded onto the scene as a
tremendous opportunity for companies across mostmajor industries to gain a competitive advantage – IDG, Right
Start: Big Data Projects, Sept 24, 2013

Growth of World of Big Data continues Increase in big data technology and services from $3.2
billion in 2010, to $16.9 billion dollars in 2015 – IDC &
Analytics Magazine, March / April 2016
2010
2015
$3 MM
$17 MM

Forecasted Increase in Big Data & Technology
Growth in all aspects of Big Data support, including human resource
McKinsey Datamatics Survey, 2013
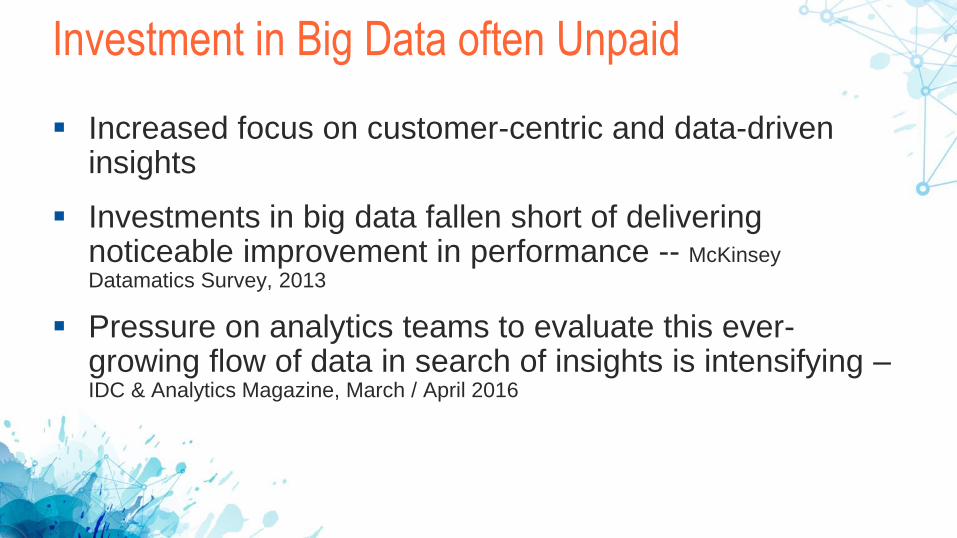
Investment in Big Data often Unpaid
Increased focus on customer-centric and data-driven insights
Investments in big data fallen short of delivering noticeable improvement in performance -- McKinsey
Datamatics Survey, 2013
Pressure on analytics teams to evaluate this ever-growing flow of data in search of insights is intensifying –IDC & Analytics Magazine, March / April 2016

Unsustainable Analytics Supply Model
Image from Balanced
Women’s Blog

Dimension Tension Lackluster delivery of insights due to organizations
failing to embark the issue optimally --McKinsey Datamatics
Survey, 2013
Prioritization a key management requirement when facing high workload
Tension between important strategic analytics and urgent campaign targeting
Image from LinkedIn
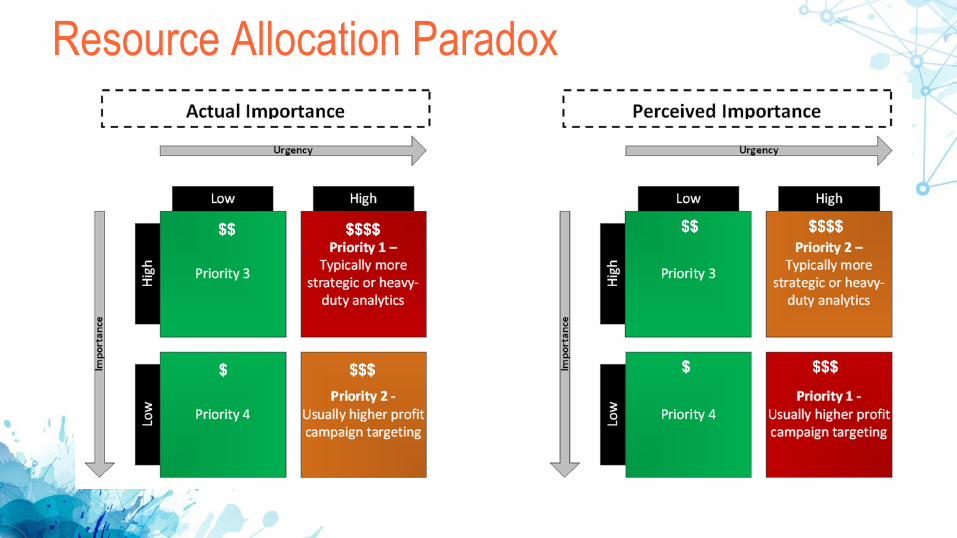
Resource Allocation Paradox

Surge of Automated Analytical Tools
Success in deployment of analytics linked to presence of:
Fully automated data processing and analytics tools
Easy-to-use analytics tools for business users
-- McKinsey Datamatics Survey, 2013
Organizations can create own internal automated tools, purchase pre-built or outsource solutions
Not all tools are created equal!!

Automated Analytical Solutions

Necessity for Automated Analytical Solutions Big Data often associated with social media, web data, ...
Intel 2013 – What happens in an internet minute?

Big “Volume & Velocity” Tools
Noodle data
Massive records counts
Limited number of columns
Big “Variety” tools
Wide data
Record counts limited (maybe)
Massive number of columns (thousands)
Big Data in Different Shapes and Forms
Hadoop
In-Memory
Analytics
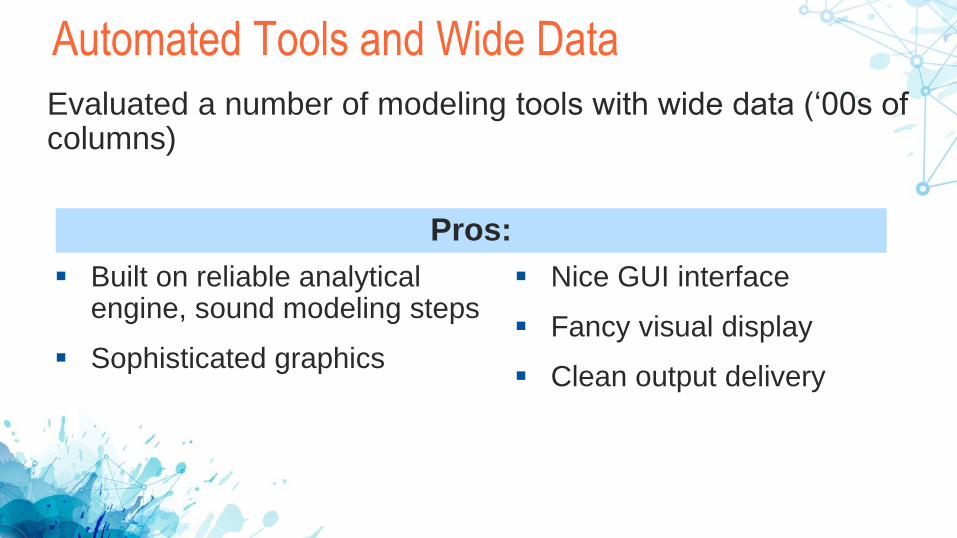
Pros:
Built on reliable analytical engine, sound modeling steps
Sophisticated graphics
Automated Tools and Wide Data
Evaluated a number of modeling tools with wide data (‘00s of columns)
Nice GUI interface
Fancy visual display
Clean output delivery

Cons:
Limited data reduction
Black box solution
Lengthy manual setup
Carpal tunnel syndrome!!
Automated Tools and Wide Data (cont.)
Evaluated a number of modeling tools with wide data (‘00s of columns)
Not an end-to-end tool
Inability to incorporate custom analytics
Designed for a single audience: Tech or bus user
Tools evaluated address Volume and Velocity, but have
limitations when dealing with high Variety of data

Automated Predictive Modeling (APM) SolutionChallenge
Time-savings from existing tools never materialized for wide data:
Manual setup too time-consuming
Automated assumptions in data characteristics often led to false assumptions
Solution
Developed proprietary predictive modeling tool to deal with wide data

Automated Predictive Modeling (APM) Solution
Must-have requirements:
1. Easy and fast setup
2. Minimize need for modeler's time without compromising result
3. Ability to handle very wide data
4. Cater to different audiences (business or technical user)
5. Allow for analytical continuity
6. Ability to setup on any client environment with pre-existing SAS license

Cornerstone’s APM Performance Evaluation
Performance Metrics ≥ 80% of values by experienced
modeler, even with wide data
Speed Prep time < 30 minutes, even with wide data.
No wrong assumptions on data
characteristics!
Business Users
Access to APM
Designed for dual audience. Simple
interface for Business Users

Cornerstone’s APM Approach
Solution Perspective
One-Stop Setup
Run
Setup in Excel
Decision Centre
• Decision Centre: Variable level
wish list
• Excel very efficient to sort through
large variable counts
Reduction of
Modeler’s Time
SMART decisioning
• Machine to assess wish list and
overwrite if required
• Eliminate modeler’s “deadweight
time” for analytical data prep

Cornerstone’s APM Approach
One Stop Setup
Variable-Level Wish List
Treatment of Cat Vars, Missing,
Outlier, Non-linear Transformation,...
Run
Simple GUI interface triggers
SAS
Ability to switch to a more Advanced
interface for more technical Users
Evaluate
All intermediate results saved in SAS and excel
Outputs
Final data in SAS for analytical
continuity
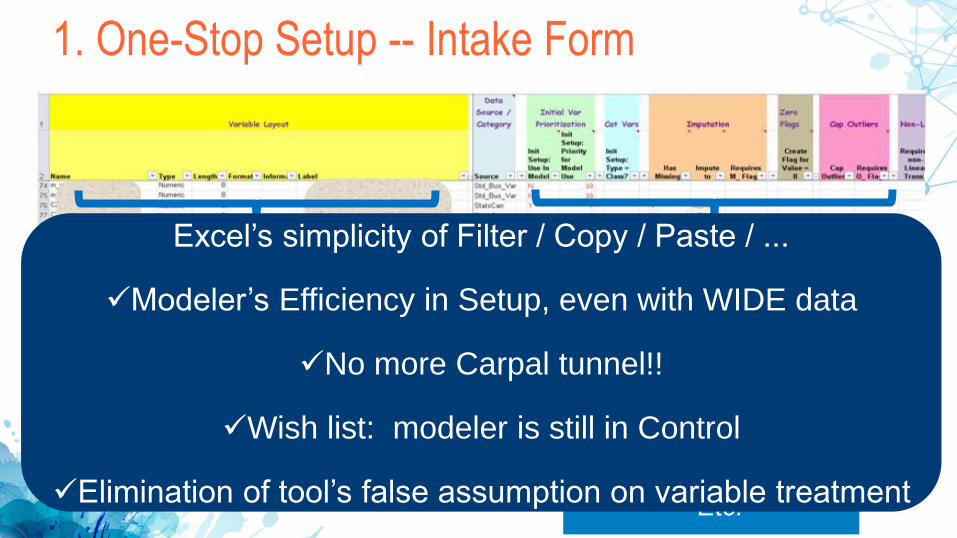
1. One-Stop Setup -- Intake Form
“Proc Content”
of Modeling
Data
Variable Treatment:
• Is Var Categorical?
• Imputation Rule?
• Cap Outliers?
• Non-Linear
Transformation?
• Etc.
Excel’s simplicity of Filter / Copy / Paste / ...
Modeler’s Efficiency in Setup, even with WIDE data
No more Carpal tunnel!!
Wish list: modeler is still in Control
Elimination of tool’s false assumption on variable treatment

2. Run – Simple GUI Interface
• Project Name
• Project
Folder (Location of
Excel Decision
Centre)
• Dataset
Name
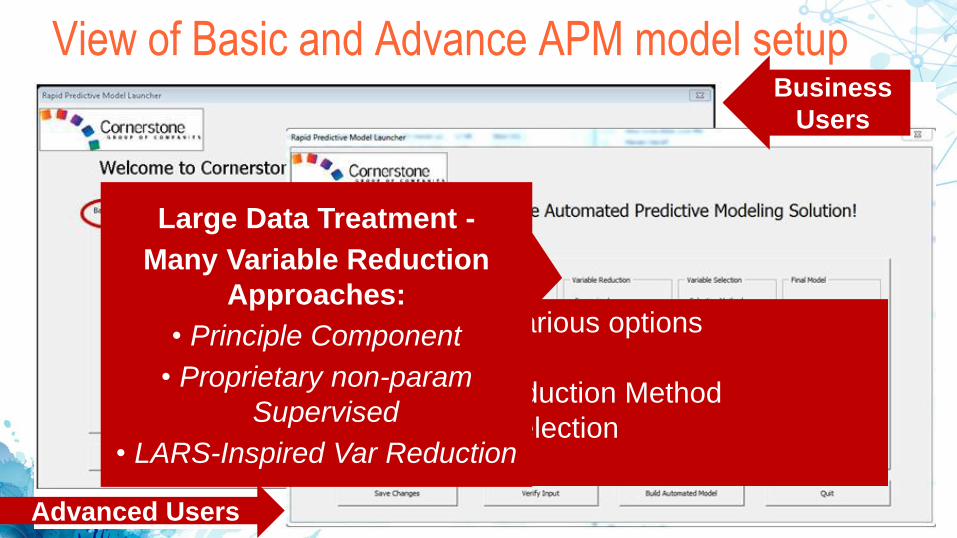
View of Basic and Advance APM model setupBusiness
Users
Advanced Users
Override of various options
• Partition %
• Variable Reduction Method
• Modeling Selection
• Etc.
Large Data Treatment -
Many Variable Reduction
Approaches:
• Principle Component
• Proprietary non-param
Supervised
• LARS-Inspired Var Reduction
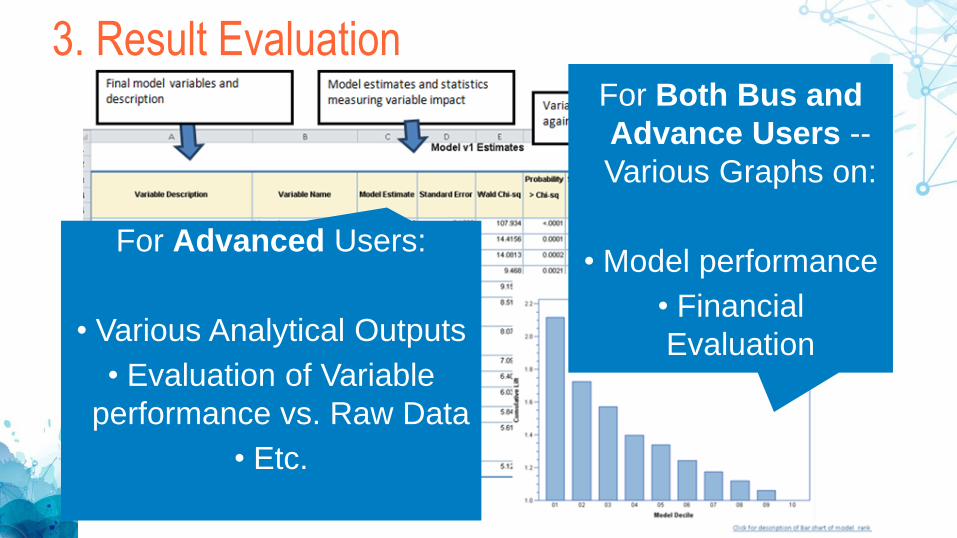
3. Result EvaluationFor Both Bus and
Advance Users --
Various Graphs on:
• Model performance
• Financial
Evaluation
For Advanced Users:
• Various Analytical Outputs
• Evaluation of Variable
performance vs. Raw Data
• Etc.
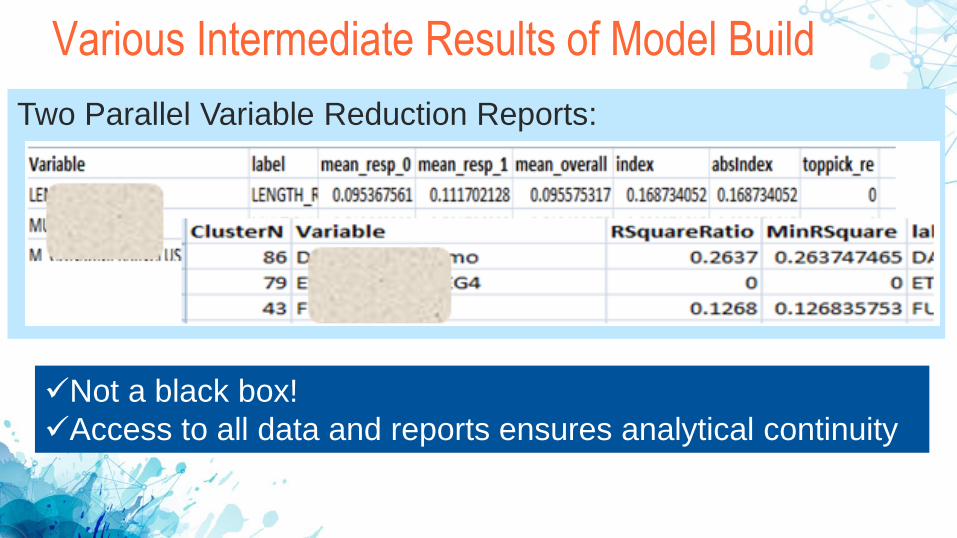
Two Parallel Variable Reduction Reports:
Various Intermediate Results of Model Build
Not a black box!
Access to all data and reports ensures analytical continuity

Evaluation / Dismissal of fields based on distribution:
Proc Means of Numeric Fields:
Various Intermediate Results of Model Build
Early step in model –
Simple Proc Means of all
Input Vars from Decision
Centre
Proc Means augmented to
evaluate variables:
Variable dismissed from
next Modeling Steps:
• 7.7% of records missing
• Non-Missing is ConstantExample of SMART approach:
All wish lists in Decision Centre evaluated
Requests potentially dismissed or tweaked according to
data content
Decision captured with proper explanation (Excel and SAS
dataset)

Conclusion An exponential growth in data, not just in data sources and number of
records but more importantly in the number of attributes per record, putting growing pressure on analytical teams
Unsustainable demand for analytics often leads to a resource allocation paradox. Campaign targeting prioritized over strategic analytics
Automated analytical tools often fall short when dealing with big data with high variety
Agility demands adopting variety: Automated Predictive Modeling Solution designed to manage data with high variety, without
compromising modeling results

Questions?Thank you!!
Appendix Analytics Magazine. “IDC forecasts big growth for Big Data. ” Analytics Magazine
Special Edition. March/April 2016. Available at http://www.analytics-magazine.org/special-articles/546-idc-forecasts-big-growth-for-big-data-
Thomas Bauer, Lars Fiedler, Jeff Jacobs, and Dennis Spillecke. “The Secret To Great Marketing Analytics? Connecting With The Decision Makers.” Forbes. January 6, 2016. Available at http://www.forbes.com/sites/mckinsey/2016/01/06/the-secret-to-great-marketing-analytics-connecting-with-decision-makers/#1c92217752ab
DataMatics. “Using customer analytics to boost corporate performance.” McKinsey & Company. January 2014. Available at http://www.mckinseyonmarketingandsales.com/sites/default/files/pdf/Datamatics.pdf
Ron Bodkin. “Right Start, Big Data Projects.” IDG Connect. September 24, 2016. Available at http://www.idgconnect.com/blog-abstract/3681/right-start-big-data-projects
Intel. “What happens in an internet minute”. 2013. Available at http://www.intel.com/content/dam/www/public/us/en/images/illustrations/embedded-infographic-600-logo.jpg