big data for smart infrastructure: london bridge station ... · big data for smart infrastructure:...
TRANSCRIPT
Big Data for smart infrastructure:
London Bridge Station Redevelopment
Sinan Ackigoz & Krishna Kumar
10.09.15 – Cambridge, UK

1972 vision 2012 vision
2012 vision: The number of platforms will increase and track layout will
accommodate higher capacity trains. Existing bus, train and underground
services will be linked with the largest concourse in the UK
1972 Vision: Two old railway stations will be merged into one with a higher
capacity, giving easy interchange between buses, tube and trains – and direct
access to all service from the spacious concourse with new bars and shops.
Redeveloping the redeveloped station

Challenges and Opportunities
Challenges:
- To forecast the future demands on current
infrastructure – we need data!
- To build lasting infrastructure – we need
data!
Opportunities with improved sensing
(and a lot more data):
- Quantify the performance of current
infrastructure
- Evaluate long term performance of our
structures

Active train station
(Network Rail)
High risk construction
activity
(Costain)
Active Jubilee Line and
tunnels 30m below (London
Underground)
Critical lifelines (Weston
St. sewer) and important
structures (Shard, Guy’s
Hospital, SER Offices)
nearby
1 retrieved from www.paulweston.info on 04.09.14

3 rows of ~20m deep
bored piles were installed
Built in:
1893
Span, Depth and Arch
Thickness:
10m, 3.2m, 0.7m
State:
Uncracked and no water
drainage problems
The structure – Arch E951

Point sensing: which point exactly?
Plan view of Arch E951
Prism target
N
E
Automatic
total station
Control target
(no movement)
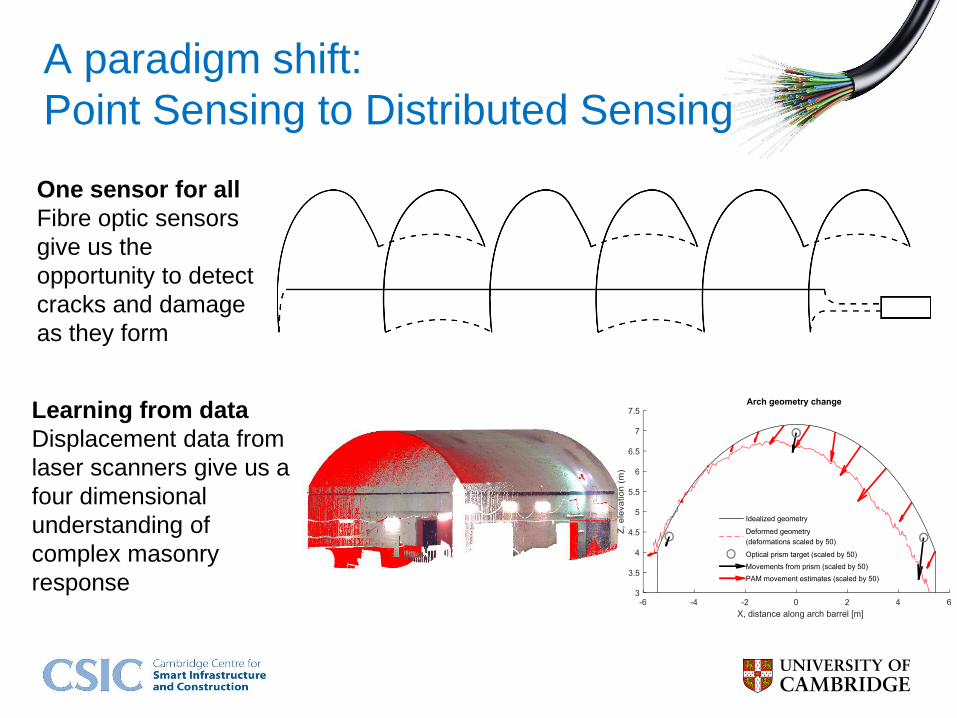
One sensor for all
Fibre optic sensors
give us the
opportunity to detect
cracks and damage
as they form
A paradigm shift:
Point Sensing to Distributed Sensing
Learning from data
Displacement data from
laser scanners give us a
four dimensional
understanding of
complex masonry
response

Making unpredictable predictable
Improve our analytical/predictive
capabilities with real data
Laser scanner data allowed us to
formulate improved structural models
which assess the safety limits for
settlements.
Use data in real-time to predict
events faster than time
By integrating depth sensing and
RGB camera data, we can simulate
passenger congestions in London
Bridge.

Manage assets for the future
Improve assessment or design
guidelines: The current masonry
arch bridge assessment methods are
insufficient – can we improve them?
Enhance public experience when
using infrastructure: Predict crowd
flows in city-scale and simulate
options to manage traffic to prevent
passenger congestion.

Movements
from LIDAR
Real time 3D model constructionFO Monitoring
Analysis
Real time people monitoring
Real time people
movement prediction
Wireless Noise
monitoring
Social Media
tracking

Monitoring a ‘complex infrastructure’
Surveying data
from Costain
for Arches and
Tunnels
Fibre optics data
from CSIC
Design predictions
from WSP
Cloud comparison
data from CSIC
Rail track
displacement
data from
Network Rail
Can we link all this information to:
1) Retrieve a better understanding of response
2) Improve communication between agents
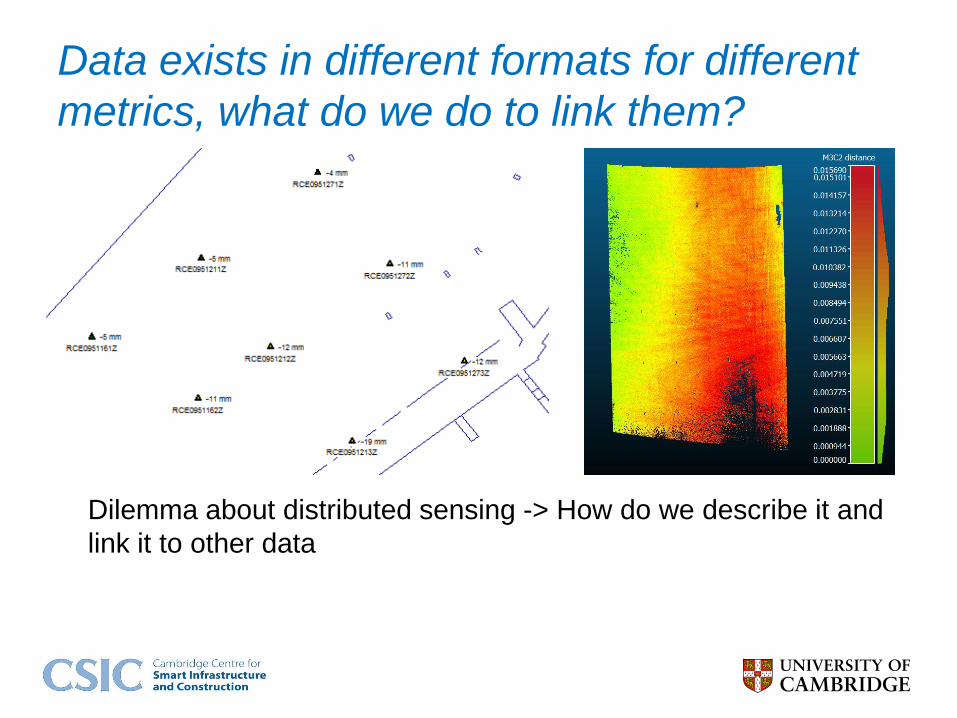
Data exists in different formats for different
metrics, what do we do to link them?
Dilemma about distributed sensing -> How do we describe it and
link it to other data

Raw data is not of interest, evaluated data
with trigger levels interest stakeholders more
Dilemma about assessment of the data – should we link alarms
and triggers? That requires data processing but is an important
aspect that needs to be discussed.

Querying
- At London Bridge Arch E951 area, has there been a black
alarm triggered during the piles constructed 12.13-01.14?
- Is there a crack opening greater than 5mm in the arches,
when the settlement values reached 50mm?
- What is the maximum displacement observed during
tunneling (or other construction activity) within x meters
from the pile.
- Number of data readings required for a strain profile –
within a tolerance of X?
- Effect of analyzer X on scatter / noise in soil layer Y

Spatio-Temporal Query Processing
• Semantic analytics tools have primarily focused on
thematic relationships, but spatial and temporal
relationships are often critical components in analytical
domains.
• Current GIS and spatial database technology does not
support complex thematic analytics operations.
Traditional data models used for GIS excel at modelling
and analysing spatial and temporal relationships among
geospatial entities but tend to model the thematic
aspects of a given domain as directly attached attributes
of geospatial entities. Thematic entities and their
relationships are not explicitly and independently
represented, making analysis of these relationships
difficult.

Why conventional relational dbs won’t cut it?
Sensor Location Date/Time Displacem
ent X
Displacem
ent Y
Displacem
ent Z
42 51°N 0°30W 201509101
2000
2 1.5 3
42 51°N 0°30W 201509101
3000
2.1 1.5 3
Sensor Location Date/Time Temperature
57T 51°N 0°30W 20150910123
00
24
Humidity? Vibration? 3D point cloud data? …

What are smart cities standards?
• Smart cities standard (PAS 182) offers a handful of generic concepts (such
as place, observation, metric etc.) to formulate a common language for
linking data across organizations in a city.
• The main goal is to seamlessly integrate information from multiple
organisations using Linked Data (Semantic Web technology) that can be
shared and edited. Different from BIM, Smart Cities allow for the sharing of
critical but less tangible aspects that relate to the data: such as related
Assumptions and Objectives.

Concept model

Potential benefits?
1. Real-time infrastructure monitoring and prediction
system – save lives and infrastructure.
2. A smart framework that can correlate sensor data with
design and analysis to understand the interactions
between infrastructures and people – Better
engineering understanding
3. Multiple organizations/public benefit from gathered data
that is in a universal format and organically linked to
other critical information
4. Improve communication between agents by uniformly
representing data/related aspects (eliminate
redundancies and misunderstandings)
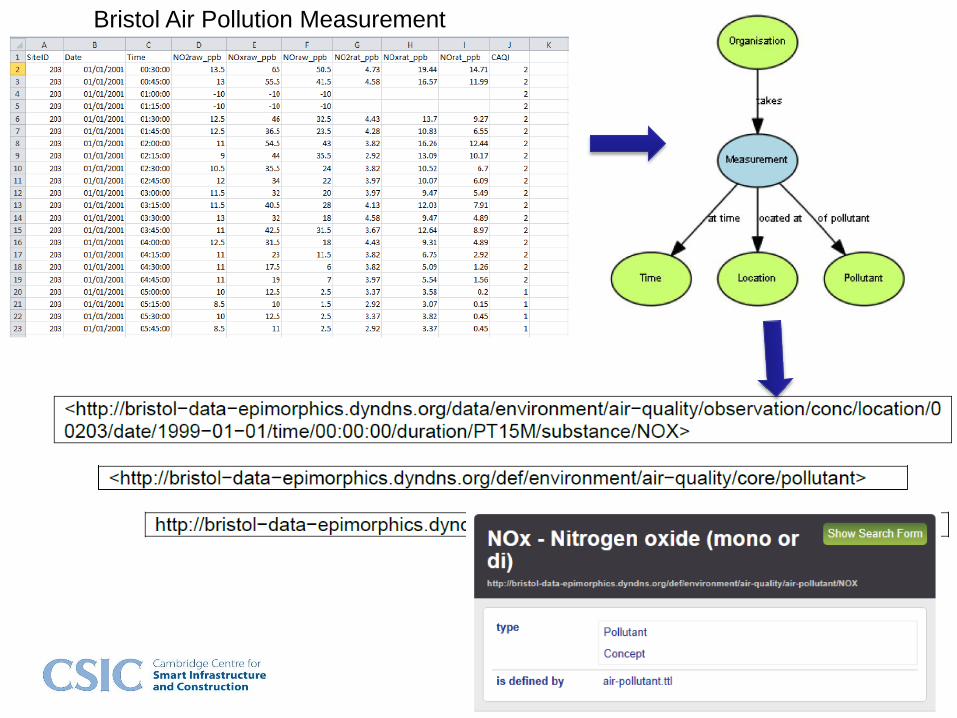
Bristol Air Pollution Measurement

Temporal RDF
• Temporal RDF extends the RDF statement from
a triple to a quad where the fourth element is the
valid time of the RDF statement

Time Slices

Graph processing
Property graph
Sensor
(WSN-#42)
Measurement
(displacement)
measures
Since Sep’15
Key value
12:00 53.5 mm
12:05 53.6 mm
12:10 53.6 mm

Optimisation

Map Reduce (Batch Process) or
In memory (real-time) computation?
• Map Reduce
– Batch processing
– Larger set of data to
extract features and
correlations
• In memory
– Real-time predictions
– Uses features and
correlations from
statistical analysis
– Works on a smaller set
of data and focused
output.
Future direction
• Applying Machine Learning algorithms such as ‘deep-
learning’ techniques to extract features and correlations.
• Real-time prediction of infrastructure behaviour based on
statistical correlations and relationships.
“Transform the future of infrastructure through smarter information”

www.centreforsmartinfrastructure.com
Thank you!