big data for vet and active labour market policy decision makers
TRANSCRIPT

Big data for VET decision makers
Giampaolo MontaletDirettore vicario ARIFL
Regione Lombardia

Outline
• Why big data for decision makers? • Changing visions• Understanding market dynamics• Plan a new generation of VET/ALMP initiatives
• 3 use cases:• Profiling people before enrolling them in VET/ALMP
initiatives• Understanding transitions in the regional labour market• Counterfactual model for policies evaluation
• conclusions
Helping policy makers to change their vision of the market
• Very often vision is based on «common sense/public opinion» perception of labour market;
• Mainly based on static data while market dynamics are more important to understand change and policy planning.
• Introduce evaluation procedures with an impact on resource distribution (avoid the “evaluate for the sake of” effect).

The “big data” we are using
● “Comunicazioni obbligatorie” (compulsory communications) based on employers on-line declarations about labour contracts start, close, extension and transformation;
● From 2008 up to 2015 contains for Lombardy about 40 millions communications about 6 million workers
● Requires extensive data quality to avoid “garbage in – garbage out” effect on statistics;
● Used mainly for career, transition and longitudinal analysis.
A new generation of VET/ALMP initiatives
● A radical change from the national/regional tradition in Italy
● From “projects” and “calls” to “personal budgets” and “available on demand”
● From “public one stop-shop” to “private-public competition and/or cooperation”
● From “paid for action” to “paid for results” ● From “employability” to “employment evaluation”
PROFILING USERS: WHO REALLY NEEDS MORE HELP?
Use case n.1
Using profiling
● Profiling is used to evaluate the probability to find a new employment;
● The lower the probability, the more intense the support;
● A more intense support is a better paid one;● Try to avoid creaming in the private sector employment agencies working with public fundings
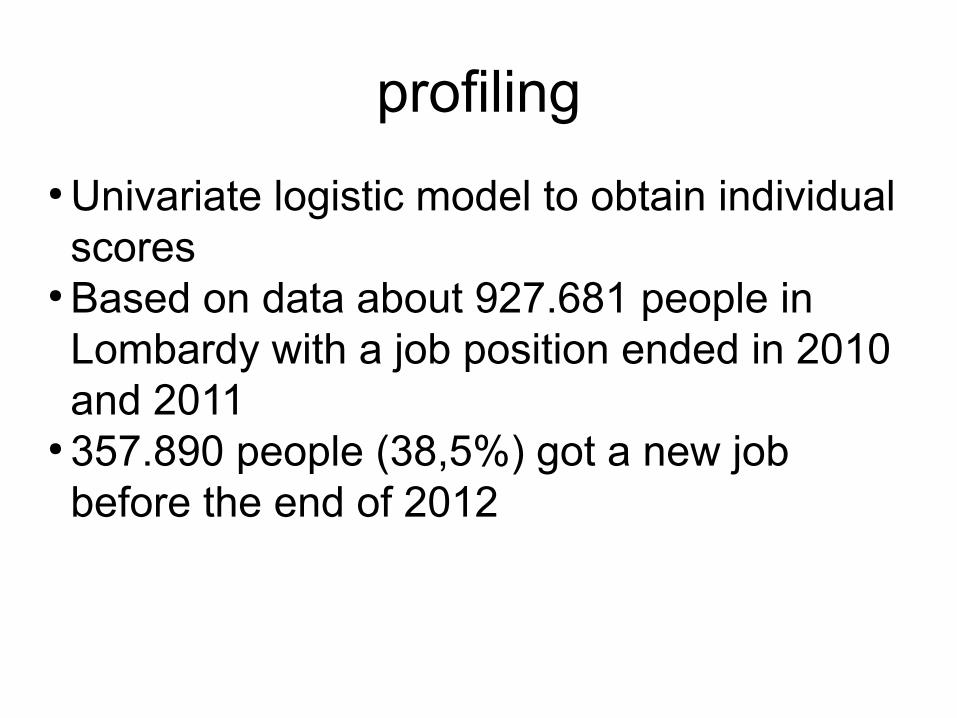
profiling
● Univariate logistic model to obtain individual scores
● Based on data about 927.681 people in Lombardy with a job position ended in 2010 and 2011
● 357.890 people (38,5%) got a new job before the end of 2012
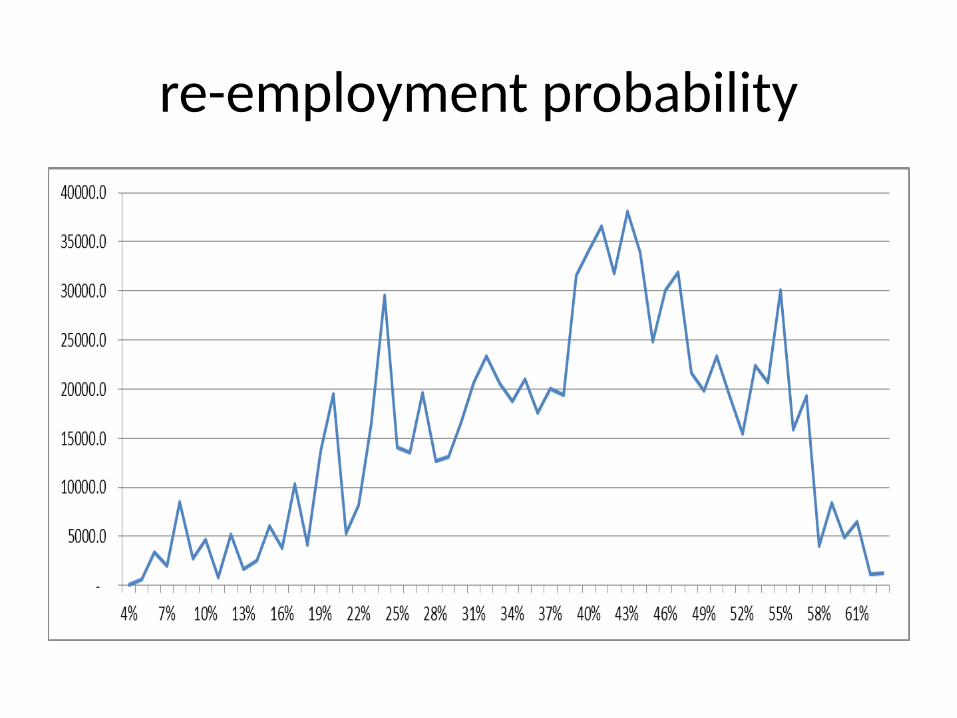
re-employment probability
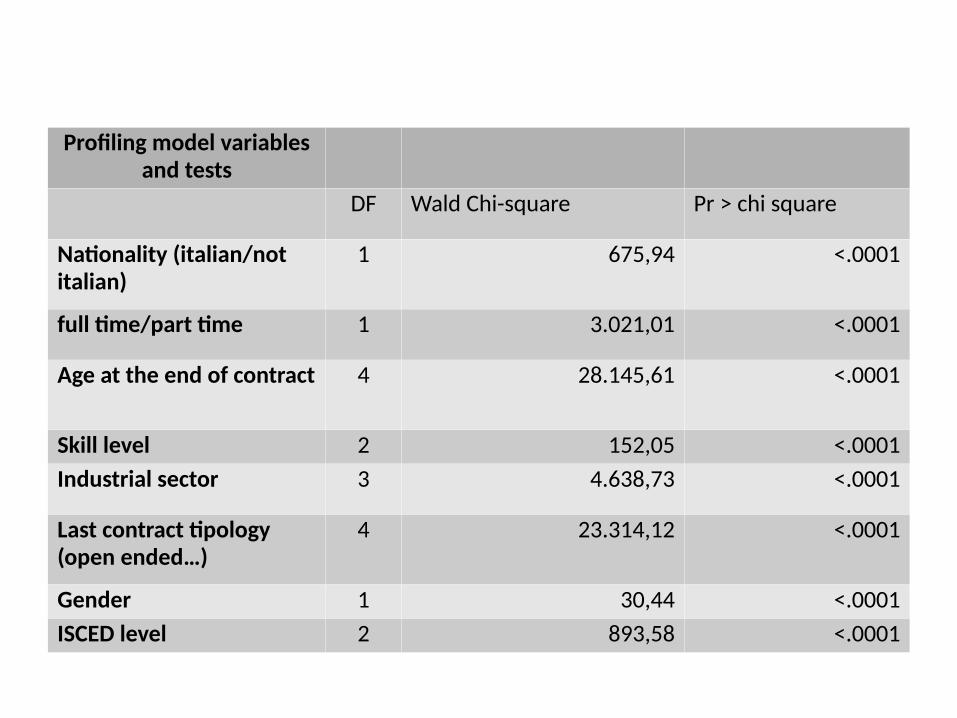
Profiling model variables and tests
DF Wald Chi-square Pr > chi square
Nationality (italian/not italian)
1 675,94 <.0001
full time/part time 1 3.021,01 <.0001
Age at the end of contract 4 28.145,61 <.0001
Skill level 2 152,05 <.0001
Industrial sector 3 4.638,73 <.0001
Last contract tipology (open ended…)
4 23.314,12 <.0001
Gender 1 30,44 <.0001
ISCED level 2 893,58 <.0001
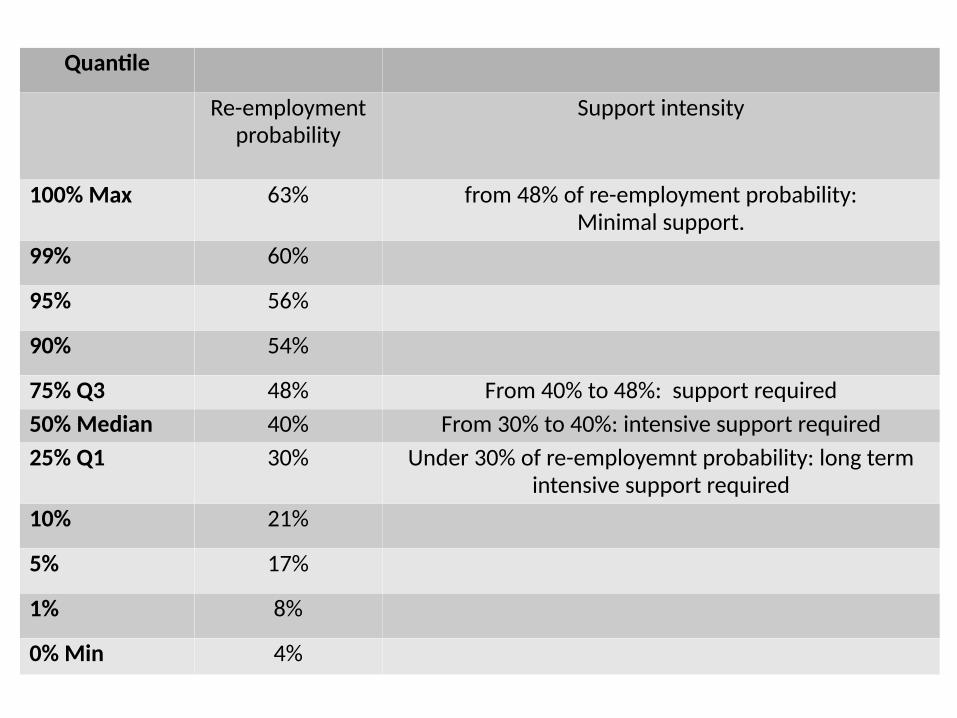
Quantile
Re-employment probability
Support intensity
100% Max 63% from 48% of re-employment probability:Minimal support.
99% 60%
95% 56%
90% 54%
75% Q3 48% From 40% to 48%: support required
50% Median 40% From 30% to 40%: intensive support required
25% Q1 30% Under 30% of re-employemnt probability: long term intensive support required
10% 21%
5% 17%
1% 8%
0% Min 4%

UNDERSTANDING MARKET DYNAMICS:HOW LONG LASTING IS AN OPEN ENDED CONTRACT?
Use case n.2
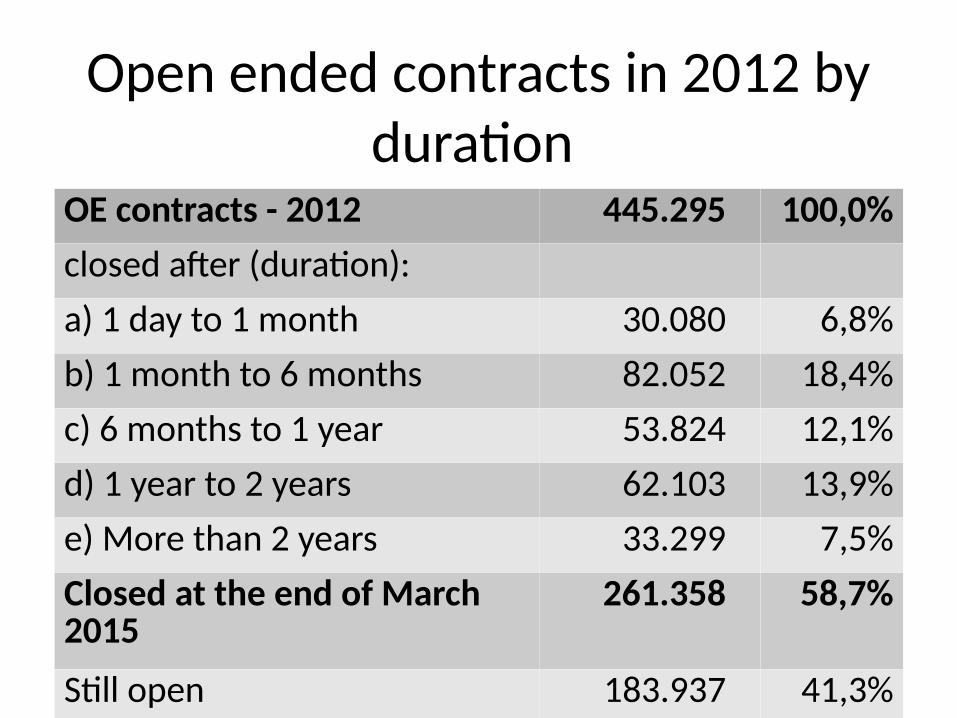
OE contracts - 2012 445.295 100,0%
closed after (duration):
a) 1 day to 1 month 30.080 6,8%
b) 1 month to 6 months 82.052 18,4%
c) 6 months to 1 year 53.824 12,1%
d) 1 year to 2 years 62.103 13,9%
e) More than 2 years 33.299 7,5%
Closed at the end of March 2015
261.358 58,7%
Still open 183.937 41,3%
Open ended contracts in 2012 by duration
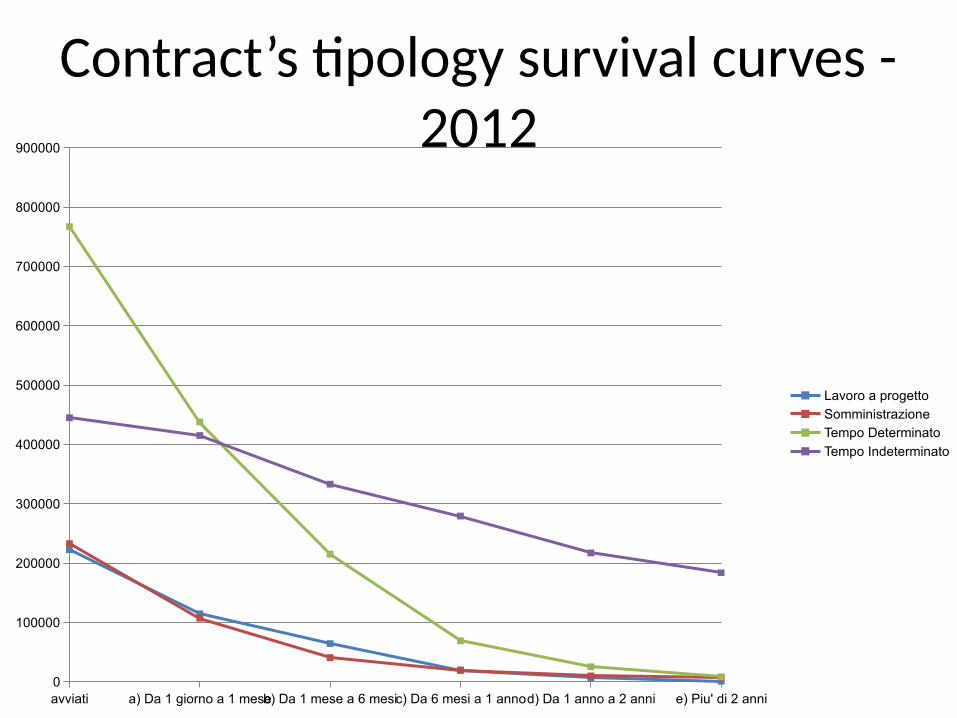
avviati a) Da 1 giorno a 1 meseb) Da 1 mese a 6 mesic) Da 6 mesi a 1 annod) Da 1 anno a 2 anni e) Piu' di 2 anni0
100000
200000
300000
400000
500000
600000
700000
800000
900000
Lavoro a progetto
SomministrazioneTempo Determinato
Tempo Indeterminato
Contract’s tipology survival curves - 2012

UNDERSTANDING MARKET DYNAMICS:WHAT DO THEY DO AFTER INTERNSHIP?WHAT HAPPENS TO PEOPLE LOSING A JOB? WHERE DO THEY GO?
Use case n.2
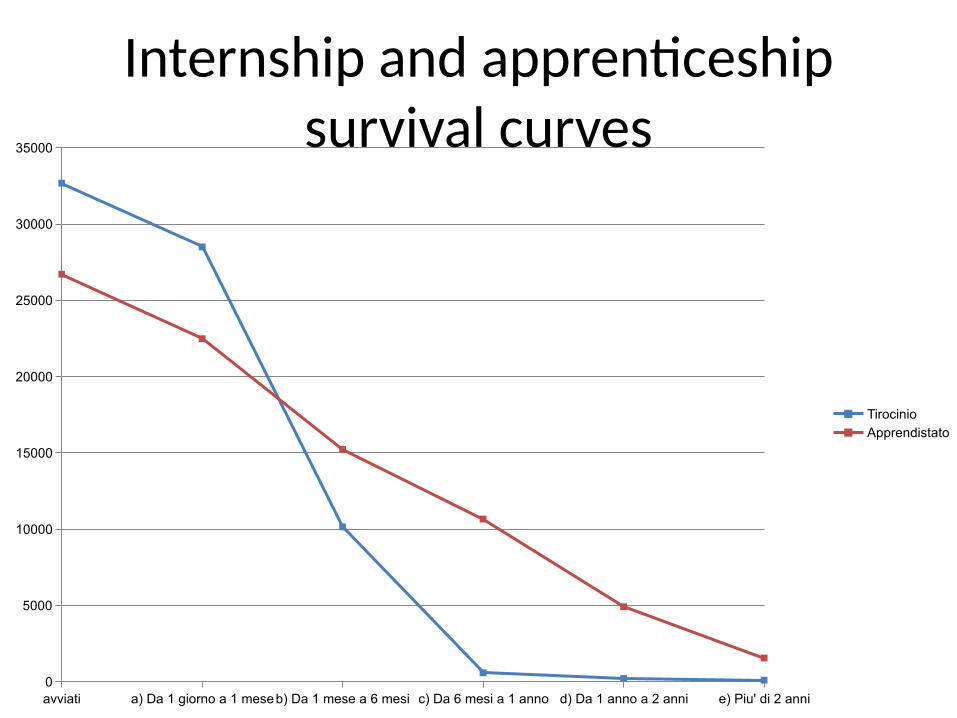
avviati a) Da 1 giorno a 1 meseb) Da 1 mese a 6 mesi c) Da 6 mesi a 1 anno d) Da 1 anno a 2 anni e) Piu' di 2 anni0
5000
10000
15000
20000
25000
30000
35000
TirocinioApprendistato
Internship and apprenticeship survival curves
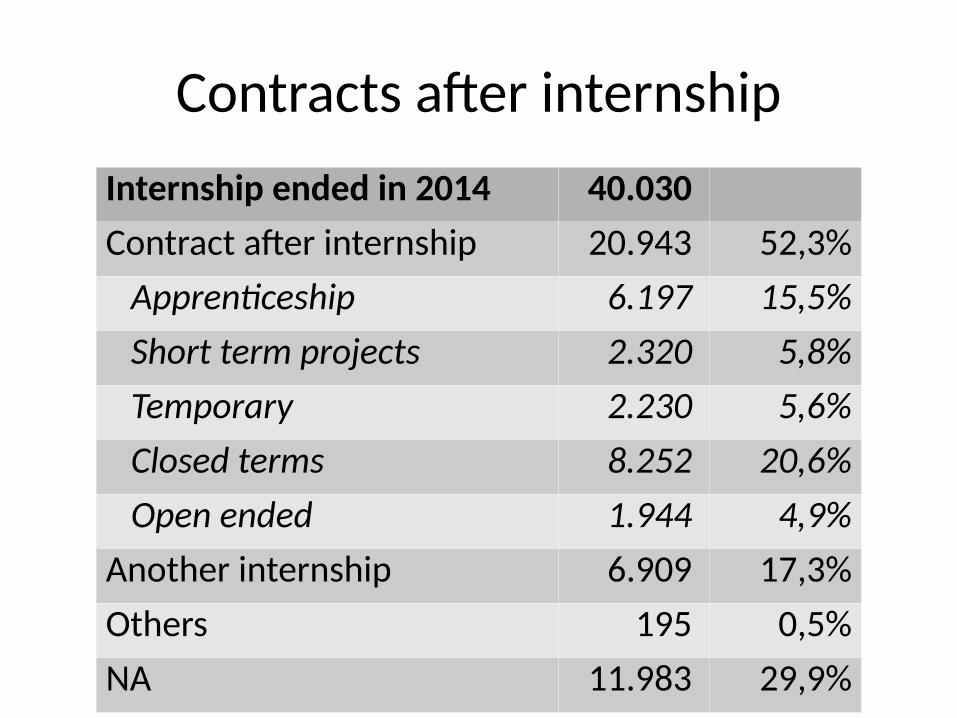
Internship ended in 2014 40.030
Contract after internship 20.943 52,3%
Apprenticeship 6.197 15,5%
Short term projects 2.320 5,8%
Temporary 2.230 5,6%
Closed terms 8.252 20,6%
Open ended 1.944 4,9%
Another internship 6.909 17,3%
Others 195 0,5%
NA 11.983 29,9%
Contracts after internship
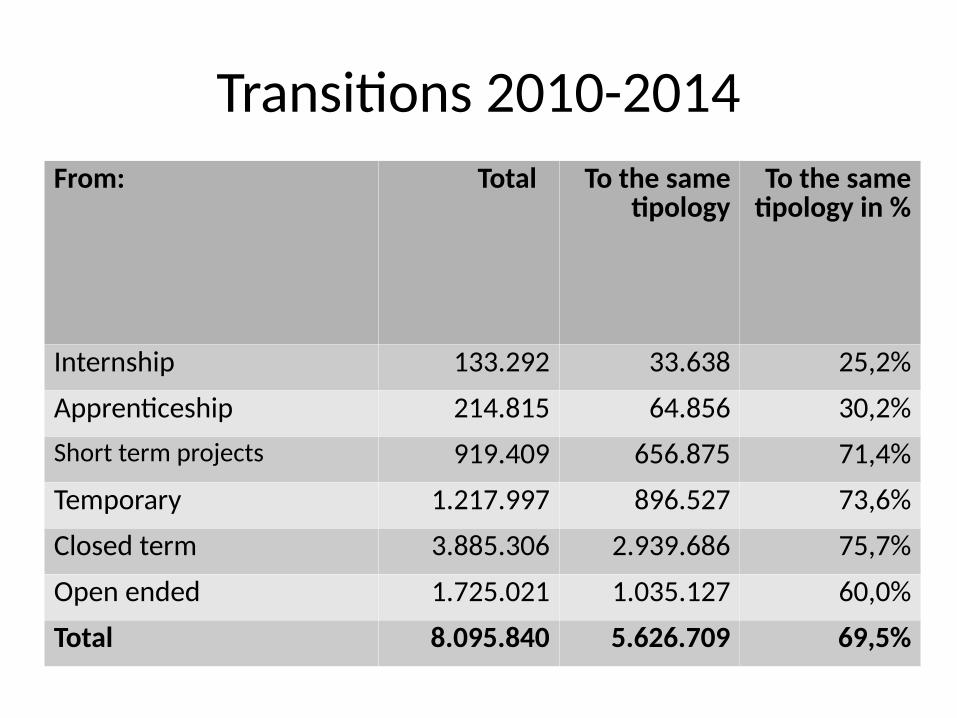
From: Total To the same tipology
To the same tipology in %
Internship 133.292 33.638 25,2%
Apprenticeship 214.815 64.856 30,2%
Short term projects 919.409 656.875 71,4%
Temporary 1.217.997 896.527 73,6%
Closed term 3.885.306 2.939.686 75,7%
Open ended 1.725.021 1.035.127 60,0%
Total 8.095.840 5.626.709 69,5%
Transitions 2010-2014
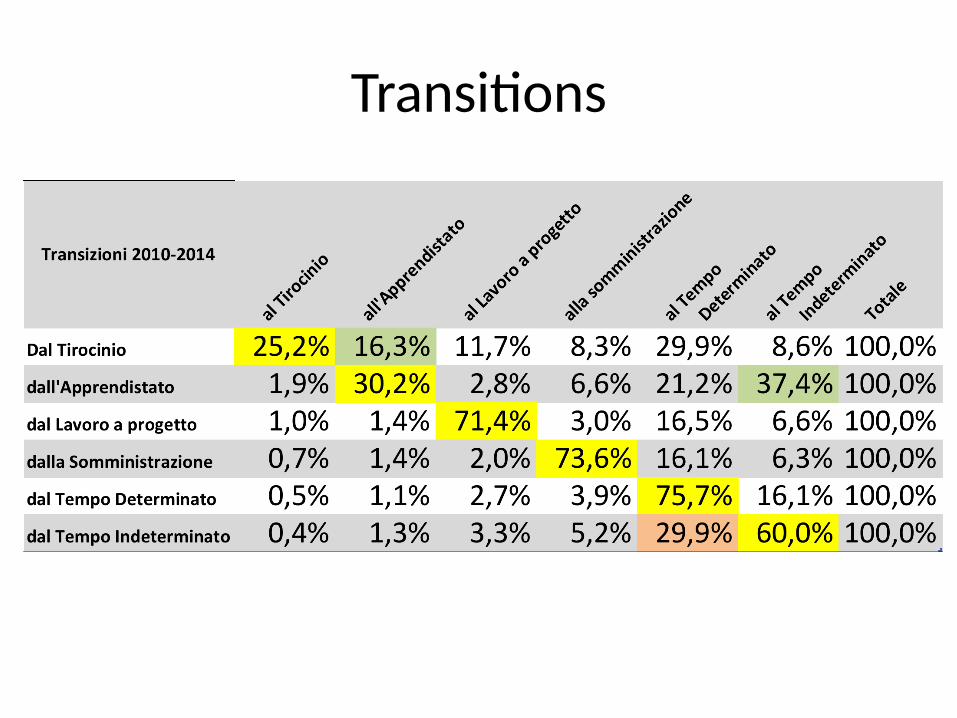
Transitions
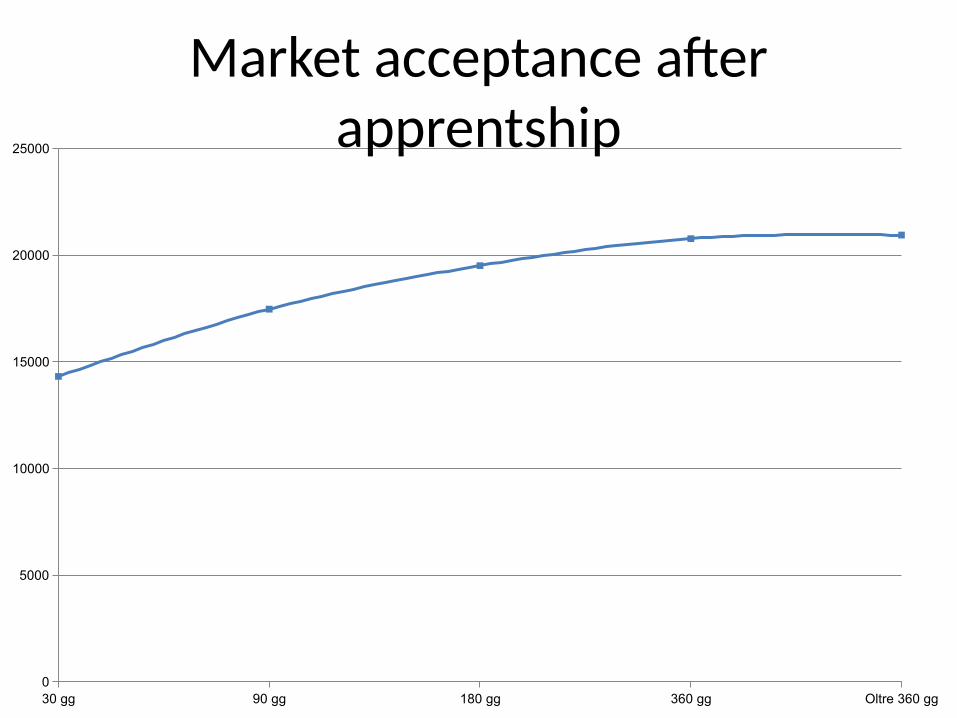
30 gg 90 gg 180 gg 360 gg Oltre 360 gg0
5000
10000
15000
20000
25000
Market acceptance after apprentship

COUNTERFACTUAL MODEL FOR
POLICIES EVALUATION:ARE WE REALLY MAKING A DIFFERENCE FOR PEOPLE ENROLLED IN OUR VET/ALMP PROGRAMS?
Use case n.3
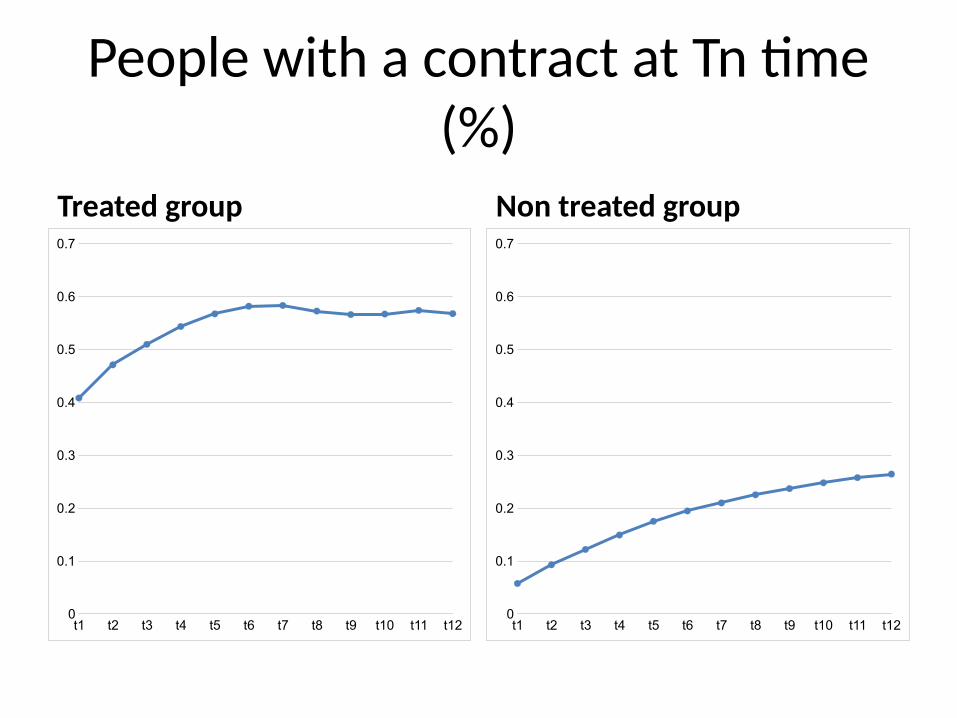
People with a contract at Tn time (%)
Treated group Non treated group
t1 t2 t3 t4 t5 t6 t7 t8 t9 t10 t11 t120
0.1
0.2
0.3
0.4
0.5
0.6
0.7
t1 t2 t3 t4 t5 t6 t7 t8 t9 t10 t11 t120
0.1
0.2
0.3
0.4
0.5
0.6
0.7
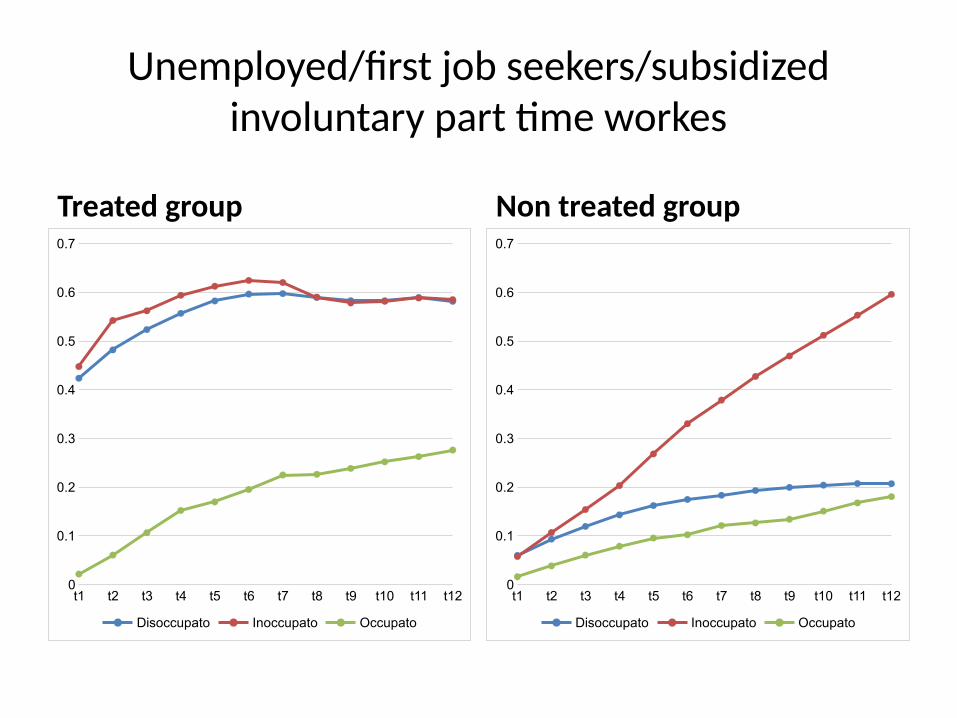
Unemployed/first job seekers/subsidized involuntary part time workes
Treated group Non treated group
t1 t2 t3 t4 t5 t6 t7 t8 t9 t10 t11 t120
0.1
0.2
0.3
0.4
0.5
0.6
0.7
Disoccupato Inoccupato Occupato
t1 t2 t3 t4 t5 t6 t7 t8 t9 t10 t11 t120
0.1
0.2
0.3
0.4
0.5
0.6
0.7
Disoccupato Inoccupato Occupato

Age groups
Treated group Non treated group
t1 t2 t3 t4 t5 t6 t7 t8 t9 t10 t11 t120
0.1
0.2
0.3
0.4
0.5
0.6
0.7
Da 15 a 24 anni Da 25 a 34 anni Da 35 a 44 anni
Da 45 a 54 anni Oltre55 anni
t1 t2 t3 t4 t5 t6 t7 t8 t9 t10 t11 t120
0.1
0.2
0.3
0.4
0.5
0.6
0.7
Da 15 a 24 anni Da 25 a 34 anni Da 35 a 44 anni
Da 45 a 54 anni Oltre55 anni
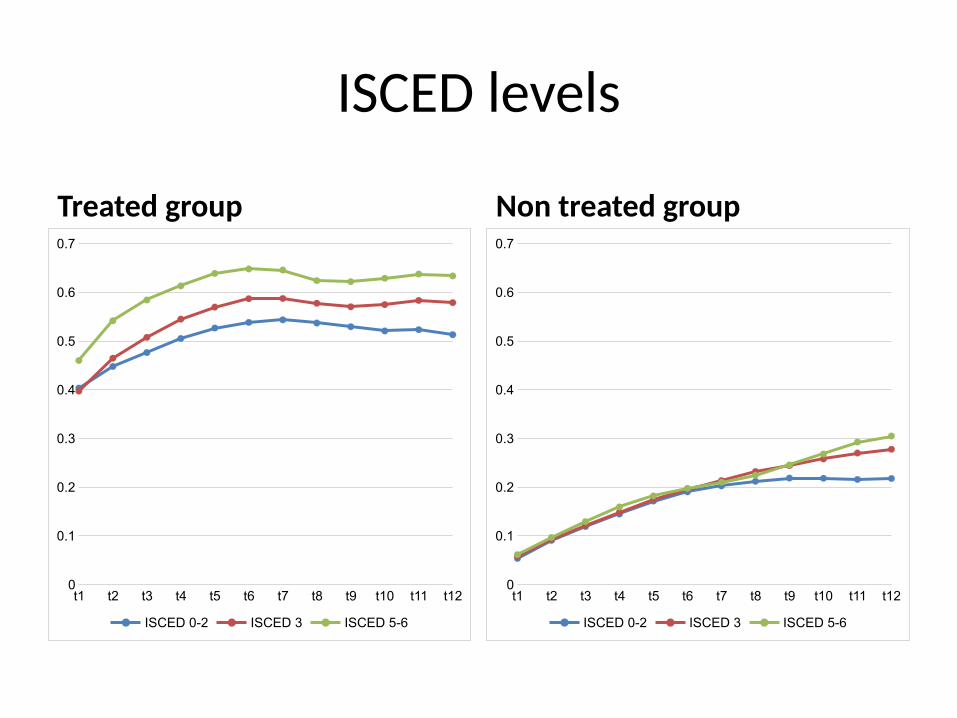
ISCED levels
Treated group Non treated group
t1 t2 t3 t4 t5 t6 t7 t8 t9 t10 t11 t120
0.1
0.2
0.3
0.4
0.5
0.6
0.7
ISCED 0-2 ISCED 3 ISCED 5-6
t1 t2 t3 t4 t5 t6 t7 t8 t9 t10 t11 t120
0.1
0.2
0.3
0.4
0.5
0.6
0.7
ISCED 0-2 ISCED 3 ISCED 5-6
Concluding remarks
● Big data can be used for the usual “information to support planning” game, but already available statistics are much more better to write policy paper introductions.
● Don't let decision makers “play” with big data, it's too expensive, too hard to understand, too risky. Try to get simple bold evidence out of them.
● Big data can be fruitfully used to sustain a change, as to say in segmentation of targets, support to transitions in the labour market and policy results evaluation.