big data moneyball
DESCRIPTION
How Big Data was used in the Money Ball movie. The same principles could be applied to Healthcare industry.TRANSCRIPT

Connecting and leveraging the best data across the health care continuum

TABLE OF CONTENTS
3 Introduction to health care’s Moneyball “Big data” 3 How can we make health care better? 4
5 The fundamentals of big data in health care Claims data 6 Electronic medical records 7 Garbage in, garbage out 8 Knowledge (and data) is meant to be shared 9
10 Analytics Comparative 10 Predictive 11 Incorporating insights 12
13 Leveraging analytics Get started with the knowledge you have 13 Focus on one major, chronic condition 14 Case study: Using analytics to improve diabetic outcomes 15 Case study: Applying analytics to a hypertensive population 16 Accelerating the creation of value 17 Create a blueprint 18 Provider viewpoint: Create high-value care for high-risk patients 19 Case study: Dig into the data to find intervention opportunities 20 Case study: Use technology and data to enable care coordination 21
22 Driving organizational change Leadership 22 Cultural shift 23 Provider viewpoint: Aligning teams with new goals 24 A continuous journey 25 Population health management 26 Prevention and wellness 27
28 Time to get started

Moneyball Analytics©2014 Optum | www.optum.com 3
Big DataThe “big data” buzzword has made its way into health care. Provider and payer organizations, which often create, accept and store petabytes of data, are intrigued by the notion. Who wouldn’t want to find some previously unknown patterns within their vast repositories that will change the way they provide care?
“Big data” doesn’t necessarily mean good data. As with all data, “big data” needs to be extracted and validated, transformed and normalized. And once it’s in a usable form, it needs analytics, so it can be scrutinized and understood.
But, as with most buzz-attracting topics, gaining value through “big data” isn’t as easy as it seems.

4
�n the early 2000s, when the Oakland Athletics turned to a rigorous statistical analysis of baseball talent, they were able to win two-thirds of their games in 2002 and made the playoffs from 2000 to 2003.
They did it with the sixth smallest payroll in Major League Baseball. Thanks to a 2003 book by Michael Lewis,1 their tactics became widely known as “Moneyball.” The metrics helped the A’s focus on the players with the skills that would get on base more often and score the most runs, thus helping the team win more games.
In a New York Times op-ed piece, Billy Beane, Newt Gingrich and John Kerry found parallels between the way traditional baseball and traditional health care operate. The editorial concluded as follows:
“America’s health care system behaves like a hidebound, tradition-based ball club that chases after aging sluggers and plays by the old rules: we pay too much and get too little in return. To deliver better health care, we should learn from the successful teams that have adopted baseball’s new evidence-based methods. The best way to start improving quality and lowering costs is to study the stats.”2
By helping payers and providers focus on the patients and conditions that have the most potential for cost savings and care quality improvement, data and analytics can be a boon to health care. This is especially true for organizations that are transforming from a volume-based business model to a value-based model. In this e-book, we’ll focus on the core competencies your organization will need to be successful in value-based care. We’ll discuss:
• The health care IT infrastructure needed to get started
• The patterns that analytics can draw
• The transformational power of strong leadership
As the federal government’s first “Health IT Czar,” David Brailer, MD, said, “Data has moved center stage, and now it’s time for it to show what it can do.”3
TO DELIVER BETTER HEALTH CARE, WE SHOULD LEARN FROM THE SUCCESSFUL TEAMS THAT HAVE ADOPTED BASEBALL’S NEW EVIDENCE-BASED METHODS. THE BEST WAY TO START IMPROVING QUALITY AND LOWERING COSTS IS TO STUDY THE STATS.
ANALYTICS HAS THE POTENTIAL TO BECOME HEALTH CARE’S “MONEYBALL”
— New York Times
How can we make health care better?STUDY THE STATS

Moneyball Analytics©2014 Optum | www.optum.com 5
ata is to analytics as a baseball is to hitting—you need one for the other to happen. But what comes before “big data”? What needs to go into the pitch (i.e. what data is pulled and how it is processed)
so analytics gleaned create a solid swing at reducing costs and improving health outcomes?
“Big data” is only possible in health care because of the vast amount of claims, clinical and additional data generated and shared through practice management and billing systems, electronic medical records and data warehouses.
These systems generate and facilitate different types of data, all of which are necessary to gain comprehensive insights into improving cost, quality and patient satisfaction. Provider organizations that want to more effectively utilize “big data” for analytics should consider the following infrastructure.
• Claims data, which can be found within a provider organization’s billing system as well as augmented with de-identified data from private sources. Claims data provides a holistic view of a patient’s interaction with the health care system.
• Access to untraditional data resources to glean socio-demographic and care management data.
• An electronic medical record (EMR) that is not only fully installed, but also fully adopted. EHRs include a broad spectrum of data that isn’t included on claims, which are used primarily for reimbursement purposes.
• Ability to connect data across the organization through the EMR, Health Information Exchange (HIE), or other platform.
Each of the four data types has relative strengths and weaknesses; no data provides a complete longitudinal view of the patient. We’ll assess the attributes of various health care data using the following categories:
SENSITIVIT Y or the ability to detect all conditions
SPECIFIC IT Y or the ability to identify conditions accurately
T IMELINESS or the time proximity of the data in relation to the actual event
AVAIL ABILIT Y or the degree to which the data is obtainable
The fundamentals ofDATA IN HEALTH CARE

6
he most commonly available form of health care data, claims data, provides great insight for population health discovery and research
studies. Claims data helps answer questions about:
• Demographics of population who receive care
• Care settings they use
• Categories and types of care delivered
Also, since claims data’s main purpose is for reimbursement, the data is an excellent source for chronicling the cost of care. Claims data helps organizations find retrospective patterns in care. Because most providers submit claims for
reimbursement, claims data is useful for seeing the spectrum of care received by a particular patient.
For all its benefits, this data type is hindered by a number of factors. Doctors must submit claims to insurers if they want to be paid for their services. So, only the data necessary to be paid is available on the claim. And since claims are often processed and paid 30 to 60 days after the service is provided, the data is dated by the time it’s made available.
Like traditional baseball statistics, claims data serves a purpose, but doesn’t tell important parts of the story. It’s directionally accurate, but not precise enough to reflect the practice of medicine and nuances of patient care.
Claims data revealsOVERARCHING CARE PATTERNS
INSENSITIVEHighlights the condition for which the provider is being paid; not all conditions are listed on the claim, since it is transaction-based
information collected at a point in time
NON-SPECIFICOften contains a very general diagnosis; this issue will improve with the onset of ICD-10, which includes more specificity than ICD-9
UNTIMELYUsually not available
until months after date of care
AVAIL ABLEThe most ubiquitous
form of health care data
FRAGMENTEDPatients switch insurance
companies, making longitudinal analysis
particularly challenging
STRENGTHS AND WEAKNESSES OF CLAIMS DATA
Traditional�Claims�provide “trading card data”
Most people who follow baseball recognize its traditional metrics, such as batting average, runs batted in, strikeouts, walks and steals. These have been useful stats for decades, most of them dating back to 19th century.
Claims data is the traditional source of data for health care. Because claims data is based on abstracted data, it is most useful for finding overarching care patterns—like the stats one would find on the back of a baseball card.

Moneyball Analytics©2014 Optum | www.optum.com 7
ealth care providers can now access electronic data to round out the patient picture and help improve care quality and patient satisfaction,
while controlling costs. Such clinical data is found in Electronic Medical Records (EMRs). The data has been collected for years, but until the EMR came into wider use, most clinical data was bound by paper clips, stored in manila folders, stashed onto shelves, and, over time, locked in storage.
Electronic medical records make a rich store of data available for analysis and are found throughout the care continuum, including the emergency department, hospital inpatient records, outpatient/ambulatory, physical therapy and radiology areas. And unlike claims data, they reflect how medicine is actually practiced.
Electronic medical records paint a MORE COMPLETE PATIENT PICTURE
SENSITIVECan show a full picture
of the conditions a patient has exhibited
SPECIFICCan be as specific as the clinician wants it to be
TIMELYAvailable as soon as
information is entered into the EMR
VARIABLY AVAIL ABLE
Data may be incomplete or unstructured since it is not standardized, or simply unavailable if
a provider chooses not to use an EMR
CONTINUOUSBetter access to
longitudinal data, as patients tend to have
longer relationships with health care providers than with insurance
companies
STRENGTHS AND WEAKNESSES OF CLINICAL DATA
Clinical�Dataoffers new stats for healthcare leaders
New measures known as “sabermetrics” made their way into baseball in the late 1970s. But these are not the same stats on the backs of baseball cards we studied as children. Sabermetrics rely on obscure statistics, such as on-base plus slugging (OBS), late-inning pressure situations (LIPS), and total player rating (TPR), to quantify player attributes that lead to the most important statistic: wins.
Franchises have used this data to answer key questions in baseball: When is an attempted steal worth the risk? Whom should we draft, and in what order? Should we re-sign an aging star player and run the risk of paying for past performance rather than future results? For the health care industry, electronic medical records serve as a source of data that can similarly be tapped to guide better decisions.
Hospitals
Specialists
LabsInsurance
Government
Employers
Patients
Physicians
8
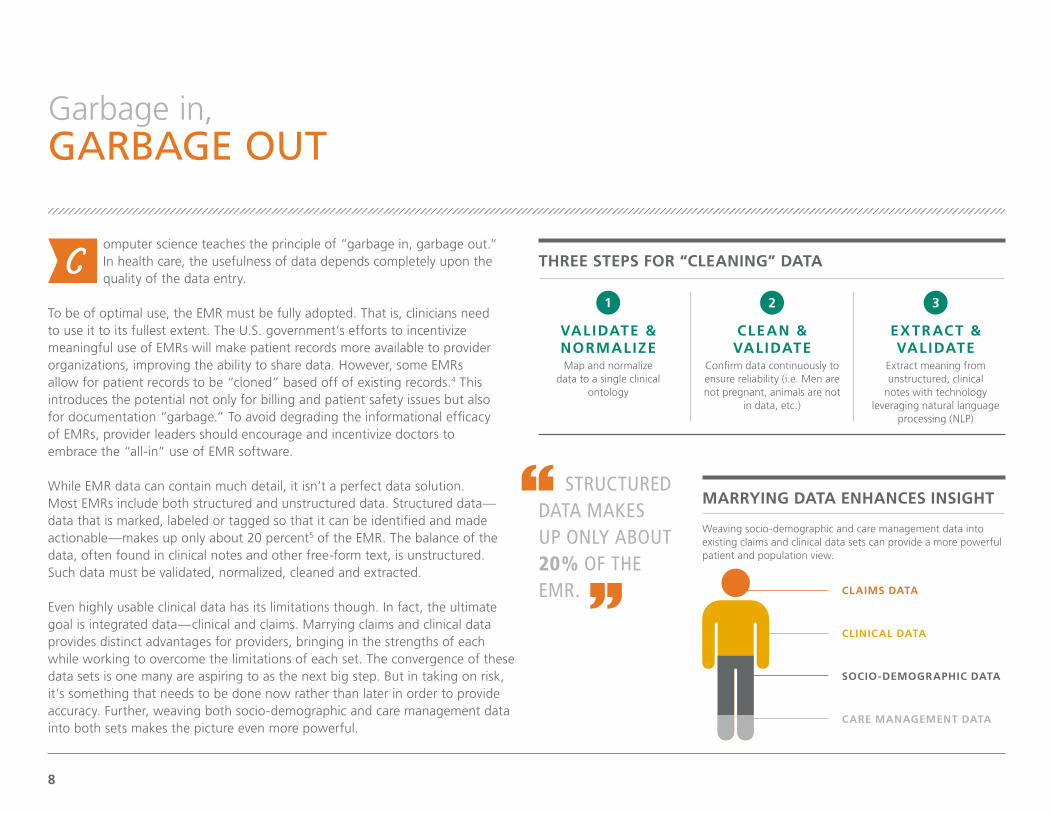
omputer science teaches the principle of “garbage in, garbage out.” In health care, the usefulness of data depends completely upon the quality of the data entry.
To be of optimal use, the EMR must be fully adopted. That is, clinicians need to use it to its fullest extent. The U.S. government’s efforts to incentivize meaningful use of EMRs will make patient records more available to provider organizations, improving the ability to share data. However, some EMRs allow for patient records to be “cloned” based off of existing records.4 This introduces the potential not only for billing and patient safety issues but also for documentation “garbage.” To avoid degrading the informational efficacy of EMRs, provider leaders should encourage and incentivize doctors to embrace the “all-in” use of EMR software.
While EMR data can contain much detail, it isn’t a perfect data solution. Most EMRs include both structured and unstructured data. Structured data—data that is marked, labeled or tagged so that it can be identified and made actionable—makes up only about 20 percent5 of the EMR. The balance of the data, often found in clinical notes and other free-form text, is unstructured. Such data must be validated, normalized, cleaned and extracted.
Even highly usable clinical data has its limitations though. In fact, the ultimate goal is integrated data—clinical and claims. Marrying claims and clinical data provides distinct advantages for providers, bringing in the strengths of each while working to overcome the limitations of each set. The convergence of these data sets is one many are aspiring to as the next big step. But in taking on risk, it’s something that needs to be done now rather than later in order to provide accuracy. Further, weaving both socio-demographic and care management data into both sets makes the picture even more powerful.
Garbage in,GARBAGE OUT
Weaving socio-demographic and care management data into existing claims and clinical data sets can provide a more powerful patient and population view.
VALIDATE & NORMALIZEMap and normalize
data to a single clinical ontology
CLEAN & VALIDATE
Confirm data continuously to ensure reliability (i.e. Men are not pregnant, animals are not
in data, etc.)
EXTRACT & VALIDATE
Extract meaning from unstructured, clinical
notes with technology leveraging natural language
processing (NLP)
THREE STEPS FOR “CLEANING” DATA
MARRYING DATA ENHANCES INSIGHT
CLAIMS DATA
CARE MANAGEMENT DATA
SOCIO-DEMOGRAPHIC DATA
CLINICAL DATA
STRUCTURED DATA MAKES UP ONLY ABOUT 20% OF THE EMR.

Moneyball Analytics©2014 Optum | www.optum.com 9
hough some health care data, like data from the Centers for Medicare and Medicaid Services (CMS), is available for everyone to
review and analyze, it has significant limitations, such as usability and applicability to the broader population. Additionally, almost all information regarding commercially insured individuals is kept within provider and payer silos. One reason for this information being locked up is the incompatibility of electronic information systems—which often aren’t built to share data.
The time for interoperability has come. EMR and HIE represent two of the top technologies now being used to bring more connectivity to health care data.
• Electronic Medical Records For organizations with a fully adopted, single EMR that unites patient records for multiple providers, some platforms can reach directly into their databases to collect information.
• Health care Information Exchange An HIE can connect data between multiple, disparate electronic health record systems existing within an organization or network of providers.
When organizations share information, patients can access needed care faster, providers can review relevant history and provide appropriate care, and organizations can coordinate care and develop best practices.
Knowledge (and data) is MEANT TO BE SHARED
Finding
Hidden�Meaning�in existing data
In the late 1990s and early 2000s, the Oakland A’s management noticed that players who exhibited a knack for getting on base—measured by the “on-base percentage plus slugging” (OBS) sabermetric—were undervalued by the majority of the league. As a team with a relatively low payroll, they pounced on this statistic, signing players with high OBS. The tactic helped the A’s win more than 100 games in both 2002 and 2003.
While the A’s may have opened the floodgates for the use of sabermetrics in baseball, they were simply drawing on the same data that every other team could also access. The difference was that they analyzed it differently. For the health care industry to approach analytics from a similar moneyball view, new technologies are needed to make it easier to link and share data.
OUR LACK OF INTEROPERABILITY AND STANDARDS HURTS PATIENT CARE AND DRAINS USEFULNESS OUT OF DATA. WE NEED TO [APPROACH ANALYTICS] WITH A MONEYBALL VIEW—WE NEED TO LINK DATA. THE VERDICT IS BIG DATA IS HYPE, UNTIL COLLABORATION COMES IN. — Andy Slavitt,
Optum Executive Vice President, Information Week

10
igher quality data and larger samples have opened the door to better comparative analytics. Objective health care analytics can provide clarity and insight to questions such as:
• When adjusting for patient severity, which cardiologist exhibited the best outcomes?
• What breast cancer surgical technique provides the best chance for survival?
Some organizations, particularly health insurers, have had access to large stores of claims data. This data has helped payers utilize comparative analytics to understand care patterns and inform disease management programs. But claims data is limited because it is transactional. It doesn’t contain the depth and detail needed to see the full picture of patient care. That type of data is found in clinical records, stored within provider organizations.
Until recently, most clinical data resided in paper files stored across the country—and in fact, much of the clinical data in the U.S. is still on paper. But as EMRs have begun to take hold over the last decade, the amount of clinical data available to health care organizations has ballooned. Clinical data is easier to get to. As more medical records become digitized, care needs to be taken to ensure data quality and to use the data in the right way—a way that is not just informative but brings value in the form of reducing costs and improving health outcomes.
Comparative analytics uncoverMEANINGFUL PATTERNS
HEALTH CARE LEADERS AND PROFESSIONALS USE COMPARATIVE ANALYTICS TO:
MEASURE COSTS AND OUTCOMES
PINPOINT CLINICAL, SOCIAL AND DEMOGRAPHIC RISK FACTORS
IDENTIFY THEIR SICKEST PATIENTS
FIND PHYSICIAN OUTLIERS
DETERMINE COST AND UTILIZATION DRIVERS

Moneyball Analytics©2014 Optum | www.optum.com 11
branch of analytics known as predictive analytics can provide answers with a high degree of accuracy to such questions as:
• Which pediatric asthma patients are most likely to visit the ER?
• Which heart failure patients are at highest risk of hospitalization in the next 6 months?
If payers and providers could better predict illness and better deliver the right care at the right time in the right setting, the industry could remove billions in unnecessary costs from the system.6
By applying predictive modeling to “big data,” providers can identify a cohort of high-risk patients and schedule interventions to prevent high-cost hospitalizations. Such a capability is a must in the risk-bearing world of accountable care but is extremely difficult to accomplish without the right technology and organizational structure.
Just as sabermetrics gave baseball a new path to success, analytics is giving the U.S. health care industry a new path to improved care. This new knowledge is created by taking all the available data and applying analytic principles. Organizations can identify the chronic conditions most prevalent among their patient population, determine which conditions are the costliest to treat, decide which treatments are the most effective, and pinpoint which doctors do the best job managing patients.
Using predictive analytics, organizations can examine not only clinical data but also demographic data to find accurate predictors of emergency visits,
initial hospitalizations and readmissions. All this knowledge can inform health care leaders about the conditions suffered by the highest risk patients and unveil the interventions that are improving patient satisfaction and bending the cost curve. They can give clinicians
the knowledge of which patients are at highest risk and the treatments that could work best for that individual.
Predictive analytics help driveFUTURE DECISION MAKING
WHY DO WE NEED PREDICTIVE ANALYTICS?
The U.S. healthcare system wastes an estimated:6
PREDICTIVE ANALYTICS ENABLE ORGANIZATIONS TO IDENTIFY THE CHRONIC CONDITIONS MOST PREVALENT AMONG THEIR PATIENT POPULATION, DETERMINE WHICH CONDITIONS ARE THE COSTLIEST TO TREAT, DECIDE WHICH TREATMENTS ARE MOST EFFECTIVE, AND PINPOINT WHICH DOCTORS DO THE BEST JOB MANAGING PATIENTS.
MILLIONeach year on missed prevention opportunities
BILLIONfrom delivery of unnecessary care
BILLIONon inefficiency in service delivery

12
nalytics have the most impact at the point of care. The knowledge and insight that big data can provide is useless until it makes its way into the hands of clinicians.
John Noseworthy, chief executive officer of Mayo Clinic, described the struggle health care providers have in incorporating new knowledge, as follows:
“After researchers discovered that beta blockers benefit patients after heart attacks, it took many years for that practice to spread widely through medicine. Why does it take so long? It’s in large part because we are inundated with new knowledge. More than 1.5 million journal articles are published annually, and there’s no central mechanism for synthesizing and applying this key information.”7
Analytics is part of the solution for disseminating knowledge. Providers have access to tools that make knowledge transfer possible. Among the available applications are decision support at the point of care; business intelligence that can make sense of disparate data; and care management tools to manage evidence-based interventions.
Noseworthy described his organization’s approach: “Deliver knowledge—as fast as it is known—to support health care professionals in their communities, and provide better care locally at lower cost. This is what we’re doing: integration of care—not consolidation, not mergers and acquisitions—integration for our patients.”7
Getting new stats INTO THE RIGHT HANDS
MORE THAN 1.5 MILLION JOURNAL ARTICLES ARE PUBLISHED ANNUALLY, AND THERE’S NO CENTRAL MECHANISM FOR SYNTHESIZING AND APPLYING THIS KEY INFORMATION.7
— John Noseworthy, CEO, The Mayo Clinic
TOP THREE COSTLIEST CONDITIONS8
that predictive analytics can help clinicians address
DIABETES
$116 BILLION
CHRONIC OBSTRUCTIVE PULMONARY DISORDER
(COPD)
$75 BILLION
CONGESTIVE HEART FAILURE (CHF)
$55 BILLION
Total annual U.S. medical expense, 2011.8

Moneyball Analytics©2014 Optum | www.optum.com 13
dentifying patients and applying care management interventions before they require hospitalization is a capability that all health
care providers could use. But not all providers have the data and technology infrastructure to apply predictive analytics. That doesn’t mean, however, they can’t get started with the knowledge they now have.
One consultant—Ted Schwab of Oliver Wyman—says that investments in technology and analytics are important, but it doesn’t take top-of-the-line analytics to get started.
“Everybody wants to say, ‘Let’s go find the heavy utilizers.’ I know where they are. Let’s spend a week in your emergency room and in your hospital and I will have identified 50 percent of your heavy utilizers. Doctors, nurses and even administrators can pick them out of a crowd; we know who they are today. We know which care processes are broken. Pick three, pick one, pick four. Go fix those things as you’re waiting for your technology to come online,” Schwab said.
Get started with the KNOWLEDGE YOU HAVE
If you can’t
Hit�a�Home�Run��off the bat, just get on base
In 1947, Brooklyn Dodgers president Branch Rickey hired Alan Roth to be the team’s full-time statistician.9 With Roth’s analysis, the Dodgers promoted on-base percentage as a more important statistic than batting average.
Still, it took 30 years before sabermetrics started garnering attention and 20 more years before baseball started embracing these “new stats.” If there’s an industry that embraces change slower than health care, it’s professional baseball.
LET’S SPEND A WEEK IN YOUR EMERGENCY ROOM AND IN YOUR HOSPITAL AND I WILL HAVE IDENTIFIED 50 PERCENT OF YOUR HEAVY UTILIZERS. DOCTORS, NURSES AND EVEN ADMINISTRATORS CAN PICK THEM OUT OF A CROWD…
— Ted Schwab, Oliver Wyman

14
Focus on one major, CHRONIC CONDITION
Take�a “Walk”In the eyes of most sabermetricians, a “walk” is as good as a base hit. It may take less skill, and it may be less exciting, but the result is the same. A player is on base, and once that happens, that player can score.
Think of finding your sickest patients as the equivalent of earning a walk in baseball.
IDENTIFY YOUR “1 PERCENTERS”
Analyze patient data to determine which patients are frequent visitors to the emergency department, and why they end up there.
IDENTIFY STAFF WHO CAREHospitals are relying on case managers to make regular phone calls to patients to ensure they’re managing their conditions and regularly taking their medications. The case managers are expected to build trusting relationships.
MAKE THE FIRST MOVEMany hospitals are reaching out to high-frequency patients and inviting them to join programs designed to combat specific chronic conditions, such as congestive heart failure or diabetes.
UNDERSTAND THE DIFFERENCES
Different patients become high utilizers for different reasons. Tailor approaches to their needs.
HOW TO START IDENTIFYING YOUR COSTLIEST PATIENTS From the American Hospital Association’s Hospitals and Health Networks, September 201312
• The healthiest 50 percent of the population accounted for just three percent of the national gross domestic product spent on health care.10
• Around 25 percent of the U.S. population suffers from one or more of five major chronic conditions: diabetes, hypertension, heart disease, asthma and mood disorders.11
Additionally, AHRQ research shows chronic conditions were a major contributor to rising national health care costs. Expenses for people with one chronic condition were twice as great as for those without any chronic conditions. Spending for those with five or more chronic conditions was about 14 times greater than spending for those without any chronic conditions.10
ealth care organizations that are just beginning the data-driven journey can benefit from focusing in on just one population.
As Ted Schwab related, finding the sickest patients is relatively easy and even reducing their utilization by five percent can yield incredible savings.
Multiple studies indicate that the sickest patients account for a disproportionate amount of money spent on health care. Developing care management programs that concentrate on chronic conditions—those most prevalent and costliest among your population—could yield significant dividends.
One study by the Agency for Healthcare Research and Quality (AHRQ) found the following:
• One percent of the U.S. population accounted for 20 percent of the national health care spend.10

Using analytics to improve diabetic outcomes
C A SE STUDY
Many organizations are already developing care protocols for chronic conditions, such as diabetes. But most are hampered by their inability to identify the entire at-risk population. A Humedica clinical intelligence database of nearly 40 million patients reveals that nearly 20 percent of patients with clinical evidence of diabetes lack a coded diagnosis of diabetes. One in five patients, often those at risk, will not appear on reports from electronic medical record systems by diagnosis code, on problem lists or in registries.
Cornerstone Health Care, a 346-provider group practice in the Piedmont Triad area of North Carolina, began in 2010 a journey from fee-for-service reimbursement to a value-based reimbursement model. An important step in that journey was transforming itself into a data-driven organization. Cornerstone engaged Humedica, the clinical intelligence arm of Optum, to help it identify all the at-risk patients within its database.
Cornerstone focused first on its diabetic population, beginning direct outreach to at-risk diabetes patients in early 2011. The outreach initiative targeted higher risk diabetes patients defined as: Patients not seen within the last six months and with any of the following on their last visit:
• HgA1c greater than 9
• LDL greater than 130
• Blood pressure greater than 140/90
Initially, this high-risk cohort included 34 percent of Cornerstone’s total diabetic population. But through targeted interventions, they were able to decrease their number of high-risk diabetics by 12 percent.
CORNERSTONE HEALTHCAREPatient Centered Medical Home, North Carolina
Approximately 1 IN 5 patients with clinical evidence of diabetes lack a coded diagnosis of diabetes. 13
Cornerstone reduced the number of high-risk diabetics in the population by 12 percent through targeted interventions
12%
Moneyball Analytics©2014 Optum | www.optum.com 15
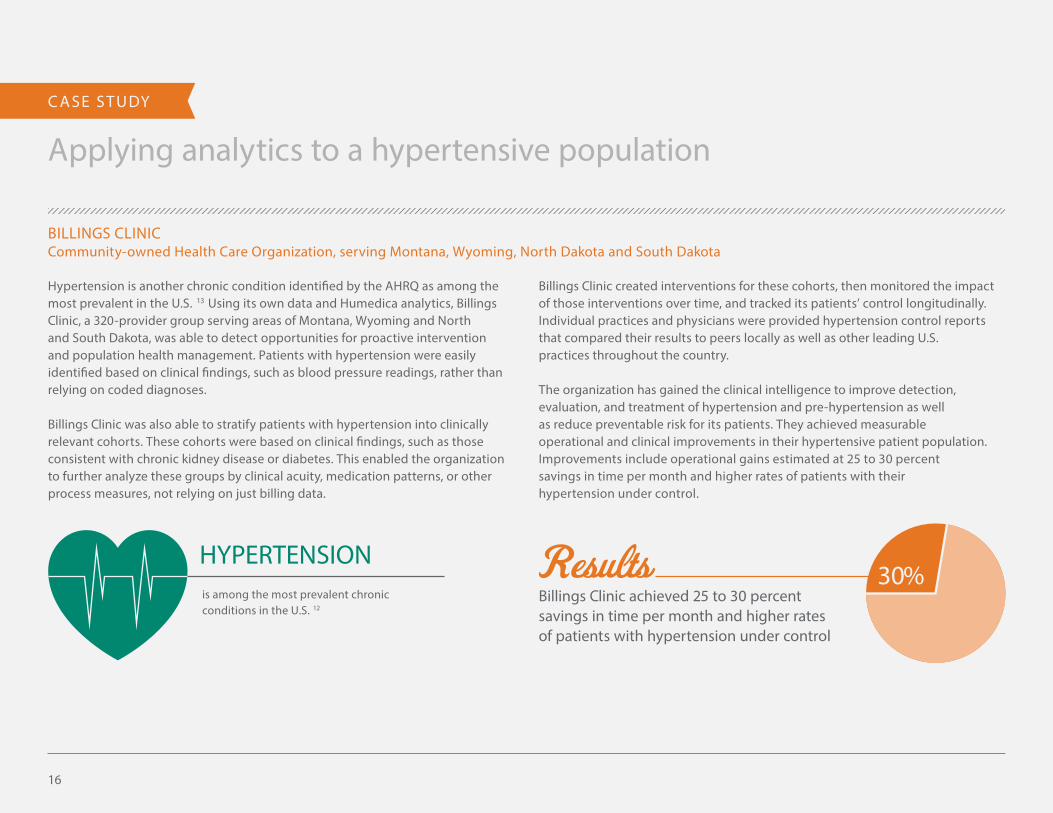
Applying analytics to a hypertensive population
C A SE STUDY
Hypertension is another chronic condition identified by the AHRQ as among the most prevalent in the U.S. 13 Using its own data and Humedica analytics, Billings Clinic, a 320-provider group serving areas of Montana, Wyoming and North and South Dakota, was able to detect opportunities for proactive intervention and population health management. Patients with hypertension were easily identified based on clinical findings, such as blood pressure readings, rather than relying on coded diagnoses.
Billings Clinic was also able to stratify patients with hypertension into clinically relevant cohorts. These cohorts were based on clinical findings, such as those consistent with chronic kidney disease or diabetes. This enabled the organization to further analyze these groups by clinical acuity, medication patterns, or other process measures, not relying on just billing data.
Billings Clinic created interventions for these cohorts, then monitored the impact of those interventions over time, and tracked its patients’ control longitudinally. Individual practices and physicians were provided hypertension control reports that compared their results to peers locally as well as other leading U.S. practices throughout the country.
The organization has gained the clinical intelligence to improve detection, evaluation, and treatment of hypertension and pre-hypertension as well as reduce preventable risk for its patients. They achieved measurable operational and clinical improvements in their hypertensive patient population. Improvements include operational gains estimated at 25 to 30 percent savings in time per month and higher rates of patients with their hypertension under control.
Community-owned Health Care Organization, serving Montana, Wyoming, North Dakota and South Dakota
HYPERTENSION
BILLINGS CLINIC
is among the most prevalent chronic conditions in the U.S. 12
Billings Clinic achieved 25 to 30 percent savings in time per month and higher rates of patients with hypertension under control
30%
16

Moneyball Analytics©2014 Optum | www.optum.com 17
ealth care organizations that are applying analysis to data are starting small and building their analytics aptitude. After early success
with diabetes population health management (PHM), Cornerstone Health Care is applying learnings toward new initiatives around heart failure and coronary artery disease. Billings Clinic is using its PHM success in hypertension as a springboard for management programs around pediatric asthma, diabetes and congestive heart failure.
Speaking about Mayo Clinic’s alliance with Optum Labs, Mayo CEO John Noseworthy said that the use of more complete data could hasten the adoption of value-based care models.
“This [Mayo/Optum] alliance will allow us to create a data-driven, transparent system to identify what works. How much does it cost? Who’s doing it best? It is a necessary springboard for future innovation to drive up the quality of the care that we give and drive down the costs of health care. As results are known and broadly shared, patients, providers and payers can seek and reward those who are providing the highest value.
Noseworthy further notes that “Some have told us that they believe this alliance holds the potential to change everything in health care, and we would not disagree. This alliance will accelerate the creation of value from a brisk walk to a sprinter’s pace.”7
As your organization becomes more data driven,ACCELERATE THE CREATION OF VALUE
Leveraging novel analytics
to�Win�GamesThe Oakland A’s journey to data-driven decisions didn’t start with Billy Beane. It started with Sandy Alderson, Beane’s mentor and predecessor as A’s general manager.14 Early in Alderson’s tenure, he hired two Stanford graduate students to do a regression analysis on his players’ offensive stats. The results of the analysis were that on-base percentage and slugging percentage were the most vital statistics to winning games.
The A’s leveraged this knowledge successfully, becoming one of the major league’s most successful franchises between 1988 and 1992. When Alderson went to work for the league office and turned the keys over to Beane in 1998, the organization was ready to transition to a more data-driven decision making model.
SOME HAVE TOLD US THAT THEY BELIEVE THIS ALLIANCE HOLDS THE POTENTIAL TO CHANGE EVERYTHING IN HEALTH CARE, AND WE WOULD NOT DISAGREE. THIS ALLIANCE WILL ACCELERATE THE CREATION OF VALUE FROM A BRISK WALK TO A SPRINTER’S PACE.7
— John Noseworthy, CEO, The Mayo Clinic
18
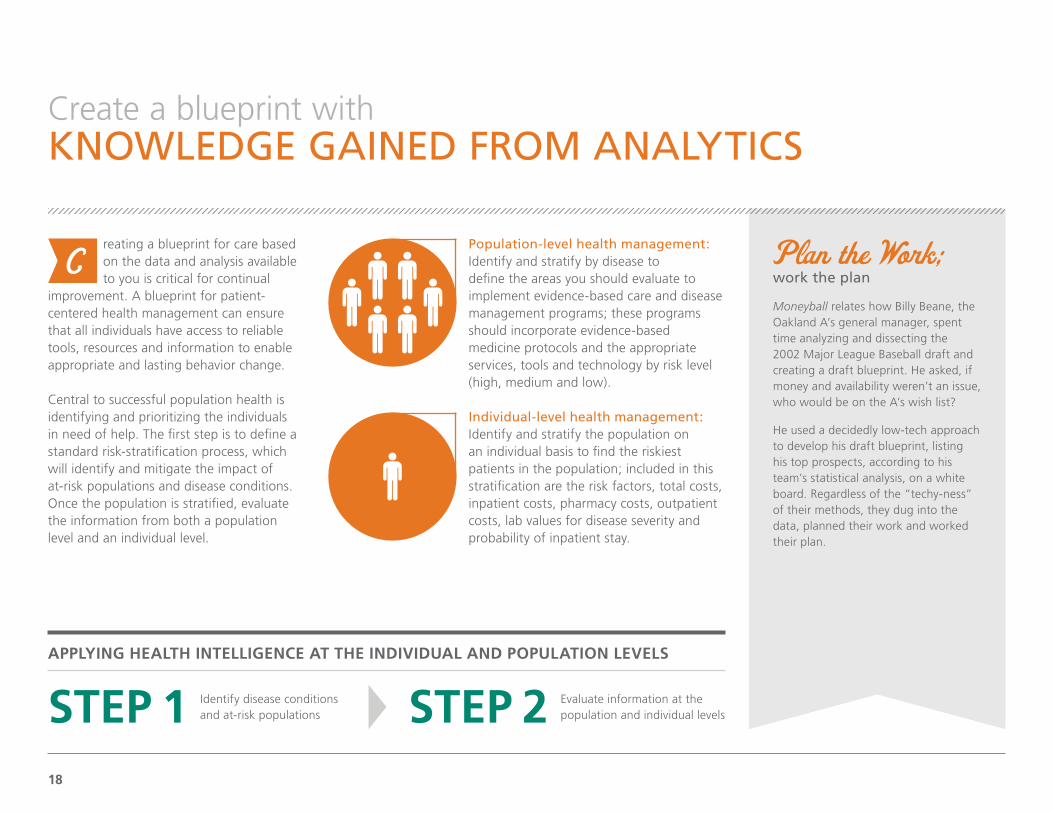
reating a blueprint for care based on the data and analysis available to you is critical for continual
improvement. A blueprint for patient-centered health management can ensure that all individuals have access to reliable tools, resources and information to enable appropriate and lasting behavior change.
Central to successful population health is identifying and prioritizing the individuals in need of help. The first step is to define a standard risk-stratification process, which will identify and mitigate the impact of at-risk populations and disease conditions. Once the population is stratified, evaluate the information from both a population level and an individual level.
Population-level health management: Identify and stratify by disease to define the areas you should evaluate to implement evidence-based care and disease management programs; these programs should incorporate evidence-based medicine protocols and the appropriate services, tools and technology by risk level (high, medium and low).
Individual-level health management: Identify and stratify the population on an individual basis to find the riskiest patients in the population; included in this stratification are the risk factors, total costs, inpatient costs, pharmacy costs, outpatient costs, lab values for disease severity and probability of inpatient stay.
Create a blueprint withKNOWLEDGE GAINED FROM ANALYTICS
Plan�the�Work;�work the plan
Moneyball relates how Billy Beane, the Oakland A’s general manager, spent time analyzing and dissecting the 2002 Major League Baseball draft and creating a draft blueprint. He asked, if money and availability weren’t an issue, who would be on the A’s wish list?
He used a decidedly low-tech approach to develop his draft blueprint, listing his top prospects, according to his team’s statistical analysis, on a white board. Regardless of the “techy-ness” of their methods, they dug into the data, planned their work and worked their plan.
STEP 1 STEP 2Identify disease conditions and at-risk populations
Evaluate information at the population and individual levels
APPLYING HEALTH INTELLIGENCE AT THE INDIVIDUAL AND POPULATION LEVELS

Play it Safe to avoid striking out
High-risk/high-reward players don’t usually pan out. In fact, they often flame out. But major league teams consistently bet on high-risk players.
In 2001, when the A’s director of scouting ran the team’s draft and used its first pick on an 11th-grade high school pitcher, Beane went ballistic. The director of scouting subsequently left the team, the drafted player was traded the following year, and Beane went into Moneyball mode.
Create high-value care for high-risk patients
PROV IDER V IE W P OI NT
In health care, the highest-risk patients oftentimes become the costliest patients. But rather than “cherry pick” the healthiest patients and ignore the most vulnerable, population health management programs that are powered by analytics help health care providers identify risky patients, intervene with evidence-based treatment programs—if possible, before the patient requires hospitalization—and decrease the cost of treating high-acuity patients.
Many organizations who practice population health management stratify their patients with high-, medium- and low-risk designations. Those designations match well with the types of care patients need throughout their lives, said Mayo Clinic’s John Noseworthy:
“Each of us as patients have di�erent health care needs throughout our lives. We all experience a spectrum of care. Most of the time, we need primary care … At other times, however, we may su�er a heart attack or need knee replacement or gall bladder surgery. That requires intermediate care—another part of the spectrum of care … Finally, a small percentage of us … will need complex care because we have become very sick; move to the portion of the spectrum of care where the needs and services and the expertise provide the best care for us and in this situation, the most complex part of the spectrum. And then when our needs are met with either intermediate or complex care, we move rapidly back to the primary care where we can be cared for very well by our own physicians …
“Without recognition of the spectrum of care, it will be impossible to accomplish high-value care delivery linked to value-based payment reform. As physicians and allied health sta� manage the health of a population, they are responsible for helping patients to navigate the spectrum of care to receive the highest quality of care delivered most cost e�ectively. That’s value-based care delivery. With value as the highest common goal, health care professionals in all care settings can turn traditional thinking on its head and find better, more a�ordable ways to care for patients.” 7
THE MAYO CLINIC HEALTH SYSTEM, UNITED STATES
CARE RISK SPECTRUM
LOW
PRIMARY CARE
INTERMEDIATE CARE
COMPLEX CARE
MEDIUM HIGH
Moneyball Analytics©2014 Optum | www.optum.com 19

Dig into the data to find intervention opportunities
C A SE STUDY
When Steward Health Care System received its designation as a Pioneer Accountable Care Organization (ACO) in December 2011, leaders of the Boston-area integrated system knew care management would be key to improving the cost and quality of care for the more than 35,000 lives in the ACO population.
One of the first—and most important steps—toward formulating a strategy was analyzing data. “We knew that we needed world-class actuarial support and analytics expertise,” says Young Joo, director of Steward’s pioneer ACO program. Steward brought in an Optum team with expertise in scrubbing complex Medicare data.
The data analysis confirmed Steward’s perceptions of the challenges and opportunities at hand. The analytics were crucial in determining the highest-impact opportunities for reducing the cost and increasing the continuity of care. One of the most important findings was that a high number of readmissions were going to skilled nursing facilities (SNFs) rather than inpatient facilities. Analytics also allowed the teams to set benchmarks and translate those into cost models to forecast projected savings.
To reduce readmissions, Optum’s population health management programs helped Steward target the critical transition point from acute care to home. They introduced care managers to address patients’ chronic or complex medical conditions and ensure patients followed recommended plans of care, and provided a nurse line for telephonic access and support to patients. A new readmission prevention program connected with patients in SNFs and then provided post-discharge follow-up.
STEWARD HEALTHCARE SYSTEM
— Dominique Morgan-Solomon, Steward’s Director of Care Management
OUR MANTRA IS, ‘PROVIDE THE RIGHT CARE IN THE RIGHT SETTING AT THE RIGHT TIME WITH THE RIGHT RESOURCE.’ MANAGING TOTAL MEDICAL EXPENSE IS OUR BIGGEST TARGET—AND THE BIGGEST AREA THAT OPTUM CARE MANAGEMENT SOLUTIONS ARE HELPING US TARGET.
Accountable Care Organization, New England
Analytics were crucial in determining the highest-impact opportunities for reducing cost and increasing the continuity of care
20

Use technology and data to enable care coordination
Given that AzCC is an ACO whose participants range from four Federally Qualified Health Centers (FQHCs) to multiple small- and medium-sized physician practices, shared analytics and care coordination communications were a critical needed capability. AzCC leveraged IT capabilities from Optum to drive these functions across the ACO in order to inform all participants of actionable care management opportunities, focus their e�orts, and communicate outcomes back to the network physicians.
With this technology infrastructure, data availability and data analysis, AzCC was able to identify areas of waste and improve both cost and quality. After identifying 230 high-risk patients, AzCC developed unique, prospective care interventions, which resulted in a five percent readmission rate reduction, which falls well below the national average. 16
“Being healthy is not something we can get from going to a doctor’s office,” said Je�rey Selwyn, MD, a physician with New Pueblo Medicine and AzCC’s board chairman. “It’s a coordinated e�ort between health care providers and patients.”
ARIZONA CONNECTED CAREAccountable Care Organization, Arizona
C A SE STUDY
Five percent readmission rate reduction
Moneyball Analytics©2014 Optum | www.optum.com 21
Arizona Connected Care (AzCC) is an accountable care collaboration between Tucson Medical Center (TMC) and Tucson-area provider groups. The collaboration’s leaders held a belief that, according to CEO Judy Rich, “we [had] a health care system that is overburdened, with no future success unless something pretty dramatic changes.” 15
Building on a gain-sharing agreement with a local payer and patient-centered medical home arrangements, TMC was chosen to participate in the Brookings–Dartmouth ACO Pilot Program in 2009. As part of AzCC, it built out its care management and care coordination infrastructure, helping patients transition from outpatient to inpatient settings, establishing care coordination teams among all parties, and utilizing multi-disciplinary teams in its primary care settings.
“I see in care coordination the prioritized focus on quality care from a patient’s point of view,” said Brenda Carle, RN, chronic disease coordinator for Tucson Medical Center. “And being able to articulate to multiple providers in an interdisciplinary team what’s important to that patient.”
“We’ve been doing [care coordination] now with some really fascinating technology which is helping us to really do things we’ve never been able to do before as physicians or as hospitals—to follow the patient,” said Palmer Evans, MD, senior advisor for Arizona Connected Care.

22
ecoming a data-driven health care provider also takes strong leadership. Health care is straddling the line between volume and
value, and succeeding in the world of value-based reimbursement takes a significant reliance on metrics. Movement from one payment model to the other takes strong leaders with a vision and tenacity to execute on solid, well-planned strategies. There is a certain necessity in being methodical and adapting as business trends change.
Provider executives need VISION AND DETERMINATION
Driving�ChangeBilly Beane is portrayed as fighting the traditionalists who clung to the old ways of evaluating players. Ironically, Beane himself was a traditionally evaluated player who had all the tools to be great but ended up as a bust.
Beane’s determination to focus on analytics was belittled both inside and outside of the A’s organization. Perhaps his underwhelming playing career had something to do with his determination to make data-driven rather than gut-driven decisions.
WE ARE IN THE MIDST OF A GENERATIONAL BUSINESS MODEL TRANSFORMATION. IT TAKES A STRONG MAN OR WOMAN TO STAND UP IN FRONT OF AN ORGANIZATION AND SAY WE ARE GOING IN A DIFFERENT DIRECTION.
— Ted Schwab, Oliver Wyman
One beneficiary of strong leadership is Cornerstone Health Care in North Carolina, where 100 percent of its contracts include a fee-for-value gain sharing element. Grace Terrell, MD, Cornerstone’s CEO, said the multi-specialty clinic has installed the technology and clinical infrastructure necessary to support care transformation, and it is showing tremendous results. The organization has worked hard to serve high-risk populations, setting up a heart failure clinic, redesigning its oncology clinic, and developing a concierge practice for Medicaid and Medicare dual eligibles. “The results on our Medicare Shared Savings alone show that we are performing far better than our market and far better than the average national ACO,” Terrell said.

Moneyball Analytics©2014 Optum | www.optum.com 23
Becoming a data-driven organization OFTEN REQUIRES A CULTURAL SHIFT
Changing�PerceptionsContrary to the opinion of some, Billy Beane’s Oakland A’s don’t stubbornly focus on analytics to the exclusion of traditional scouting. Their focus is to find undervalued players that can help them build a winning team. For Beane, analytics were simply a means to an end.
Beane did need to change the culture, however, from one that evaluated players on standard measurables to one that trusted data. He needed people in place who both had an eye for talent and a mind for data.
ealth care organizations need to have the people on board that can translate data into knowledge, see analysis and metrics as a tool to help improve quality, bend the cost curve, and increase patient satisfaction.
Organizations that want to rely on data need to build a culture that trusts analytics. Consider these suggestions to help you do so.
Build analytics and metrics into your governance structure
Help everyone understand the role each plays in acting on data
Focus on measurable goals that garner the most ROI
Operationalize the data, interacting regularly as part of the care process
Consistently review the measurables that inform your goals
Make meeting your goals your first priority

On the
Same PageIn the movie version of Moneyball, Billy Beane, played by Brad Pitt, wants Scott Hatteberg, a converted catcher, to play first base. The player is a defensive liability on first base, but Beane insists that his on-base percentage makes up for his fielding struggles.
The A’s manager, Art Howe, depicted by Phillip Seymour Ho�man, wants to play a better-fielding first baseman, Carlos Peña. So Beane trades Peña to the Detroit Tigers for a proverbial bag of chips to force Howe’s hand.
According to the real Hatteberg and Howe, that’s not how it happened (Hollywood has never let the truth get in the way of a good story). But the story illustrates a point: you can’t accomplish a goal if everyone’s not on the same page.
Leaders align their team with their goals
PROV IDER V IE W P OI NT
Community Health Network achieved impressive results aligning independent physicians to a system-wide cancer care protocol. The Community Health Network team worked closely with a highly regarded group of oncology physicians and convinced them to align with the system through a professional service agreement. Then Community Health partnered with MD Anderson Cancer Network out of Houston to become a certified MD Anderson delivery site. All physicians affiliated with Community’s oncology unit, 60 percent of whom were independent, needed to become individually certified for the oncology unit to receive the designation. All of them complied.
“These physicians, whether independent, contracted, or employed, see themselves as partners in this oncology service line,” said Tim Hobbs, MD, chief clinical officer for Community Health Network. The key to making this alignment happen was a change in approach.
“Rather than treating independent physicians like customers, we treated them like partners,” Dr. Hobbs said. “We were trying to please them instead of aligning our mutual interest, and as a result, we were able to move the relationship to a new level.”
COMMUNITY HEALTH NETWORKIndianapolis, Indiana
WESTMED MEDICAL GROUPNew York
Simeon Schwartz, MD, president and CEO of WestMed Medical Group, emphasized the key to physician alignment is transparency. He said:
WE DO NOT TELL PHYSICIANS WHAT TO DO; WE SHOW THEM WHAT THEY ARE DOING. YOU MIGHT HAVE THE BEST ANALYTICS AROUND, BUT ANALYTICS ARE ONLY GOOD IF YOU SHARE THE INFORMATION TRANSPARENTLY. YOU HAVE TO CREATE A PHYSICIAN CULTURE THAT ALLOWS FOR A HIGH LEVEL OF TRANSPARENCY.
— Dr. Schwartz, MD, President and CEO, WestMed Medical Group
24

Moneyball Analytics©2014 Optum | www.optum.com 25
rganizations that are new to high-level analytics are going to have to deal with a learning curve. You’re not going to get it
right all the time. But failures can be springboards to success. If your organization is willing to learn as it goes, it will have a head start on its journey from simply providing care to truly managing health.
So start simple with a population you can impact, and build toward more advanced practices as your organization progresses on its journey from providing care to better managing health.
It’s a continuous journey,NOT A DESTINATION
CONNECT YOUR ORGANIZATION
LEVERAGE THE RIGHT ANALYTICS
ENSURE PHYSICIAN ENGAGEMENT AND STRONG
ORGANIZATIONAL LEADERSHIP
ACCESS THE BEST DATA
TRANSFORM CARE MANAGEMENT

26
hen physicians are on-board with population health management, patients are more likely to engage. But engaging patients requires more than physician buy-in. Provider organizations need to stop
looking at themselves solely as providers of medical services. They also need to look at themselves as facilitators, who not only provide care when needed but also get their patients involved in the management of their health.
Of course, interventions are less likely to be needed when chronic patients are well-managed and healthy patients stay healthy. Therefore, patient programs need a high dose of prevention and wellness. Currently, investments in prevention and wellness programs are low and typically provided by the payer or the employer, due to the long-term pay-off. But as provider organizations move to fee-for-value, they will need to develop programs—independently or in partnership with the payer or employer—to help individuals proactively manage their health.
A multi-channel outreach plan based on the individual’s desired communication and level of activation is essential to engage patients. For high-risk patients, a recommended program involves outreach by the physicians, nurse practitioners and other clinicians, care managers, as well as services, portals and tools that support secure messaging, and social media. Emerging solutions include personal health management tools that provide interactive solutions to support consumers in managing their health and conditions. This can include health and condition education and tools that can help track exercise, diet and medication routines.
High-risk patients need more than communication—they often are in need of one or more interventions. Interventions instituted by care management programs can vary widely, according to Optum’s Doug Allen, from in-home devices that monitor patients to nurse practitioners that check on patients by telephone or in-person. The key is to use data to measure the intervention’s effectiveness.
Medium-to-low-risk patients also need to be engaged, using some portion of the aforementioned communication elements. An important consideration in any program is to try to keep low- and medium-risk patients from becoming high-risk patients. The keys, again, are data and a cost-effective set of interventions that put the data to use.
Use data proactively to MANAGE POPULATION HEALTH
AS PROVIDER ORGANIZATIONS MOVE TO FEE-FOR-VALUE, THEY WILL NEED TO DEVELOP PROGRAMS—INDEPENDENTLY OR IN PARTNERSHIP WITH THE PAYER OR EMPLOYER—TO HELP INDIVIDUALS PROACTIVELY MANAGE THEIR HEALTH.

rganizations utilize population health management programs to keep populations healthy, whether they are high-, medium-
or low-risk patients. Population health management programs need a high dose of prevention and wellness programs, which can be viewed as low-risk, high-reward methods.
Currently, organizations such as payers or employers make investments in prevention and wellness programs due to the relatively low cost-to-benefit ratio and long-term pay-off. But as provider organizations move to fee-for-value, they will need to develop programs—independently or in partnership with the payer or employer—to help individuals proactively manage their health.
Integrate prevention and wellness techniques forLOW-RISK, HIGH-REWARD INTERVENTIONS
Managing�Risk�Billy Beane is constantly managing the talent and finances of the Oakland A’s. His pattern is to draft good pitching, ride the pitchers until they qualify for free agency, then trade them away for good young pitching talent and veteran power hitters who, for whatever reason, may not be living up to their potential.17 In this way, he keeps the A’s stocked with good pitching and power hitting at bargain prices—a low-risk, high-reward method.
Moneyball Analytics©2014 Optum | www.optum.com 27

28
Time to get startedTime to getBecoming a data-driven health care provider doesn’t happen overnight. While most large provider organizations have some background in financial analytics, clinical analytics are another story. Using analytics to identify patterns of care or to compare clinical protocols or to predict hospitalizations is outside the comfort zone of many hospital operations leaders. There are bound to be leaders who cling to old ways.

Moneyball Analytics©2014 Optum | www.optum.com 29
Time to get startedTime to getGame-Changing Analytics
Discover how Optum One clinical analytics can bring you game-changing health intelligence that gives you a clearer picture of patient and population health, and better insight for improving care. Contact Optum to schedule a demonstration.
Call 1-800-765-6619Email [email protected] www.optum.com/analytics

30
ENDNOTES
1 Michael Lewis, Moneyball: The Art of Winning an Unfair Game, (New York: W.W. Norton & Company, 2003).
2 Billy Bean, Newt Gingrich, and John Kerry, “How to Take American Health Care From Worst to First,” New York Times, October 24, 2008.
3 Anna Wilde Mathews, “Researchers Mine Data from Clinic, Big Insurer,” Wall Street Journal, January 15, 2013.
4 Reed Abelson, Julie Creswell, and Griff Palmer, “Medicare Bills Rise as Records Turn Electronic,” New York Times, September 21, 2012.
5 Rebecca L. Kaul (president, UPMC Technology Development Center), interview, December 18, 2012.
6 Annie Lowry, “Study of U.S. Health Care System Finds Both Waste and Opportunity to Improve,” New York Times, September 11, 2012. http://www.nytimes.com/2012/09/12/health/policy/waste-and-promise-seen-in-us-health-care-system.html?_r=0”http://www.nytimes.com/2012/09/12/health/policy/waste-and-promise-seen-in-us-health-care-system.html
7 John Noseworthy, “Three Imperatives to Transform Health Care in America,” (presentation transcript, National Press Club luncheon, Washington, D.C., April 9, 2013). http://newsblog.mayoclinic.org/files/2013/04/Press-Club-Transcript.pdf
8 Agency for Healthcare Research and Quality. Total Expenses and Percent Distribution for Selected Conditions by Source of Payment: United States, 2011. Medical Expenditure Panel Survey Household Component Data. Generated interactively (December 02, 2013). http://meps.ahrq.gov/data_stats/tables_compendia_hh_interactive.jsp?_SERVICE=MEPSSocket0&_PROGRAM=MEPSPGM.TC.SAS&File=HCFY2011&Table=HCFY2011_CNDXP_D&_Debug=
9 Obituary, “Alan Roth, 74, Dies; Baseball Statistician,” New York Times, March 5, 1992; and Alan Schwarz, “A Numbers Revolution,” ESPN.com, July 8, 2004. http://sports.espn.go.com/mlb/columns/story?columnist=schwarz_alan&id=1835745
10 Steven B. Cohen, PhD and William Yu, MA, “Statistical Brief #354: The Concentration and Persistence in the Level of Health Expenditures over Time: Estimates for the U.S. Population, 2008-2009,” Medical Expenditure Panel Survey (Rockville, MD: Agency for Healthcare Research and Quality, January 2012).
11 Mark W. Stanton, MA, “The High Concentration of U.S. Health Care Expenditures,” Research in Action 19, June 2006 (Rockville, MD: Agency for Healthcare Research and Quality). http://www.ahrq.gov/research/findings/factsheets/costs/expriach/index.html
12 Haydn Bush, “Health Care’s Costliest 1%,” Hospitals and Health Networks, September 2012. http://www.hhnmag.com/hhnmag/jsp/articledisplay.jsp?dcrpath=HHNMAG/Article/data/09SEP2012/0912HHN_Coverstory&domain=HHNMAG
13 Humedica clinical intelligence database of nearly 40 million patients.
14 Alan Schwarz, “Alderson the True Father of the On-base Revolution,” ESPN.com, April 28, 2005. http://sports.espn.go.com/mlb/columns/story?columnist=schwarz_alan&id=2048402
15 Kathleen L. Carluzzo, et al, “Tucson Medical Center: A Community Hospital Aligning Stakeholders for Accountable Care,” Toward Accountable Care Case Study Series (New York: The Commonwealth Fund, January 2012).
16 Michelle McNickle, “Health IT Needs Moneyball Technique To Succeed,” Information Week Healthcare, February 13, 2013.
17 Chuck Booth, “The Billy Beane Way of Contracts, and His Trade History Since Moneyball,” MLB Reports (blog), July 3, 2013, http://mlbreports.com/2013/07/03/beaneway/; Brian Costa, “Billy Beane’s Big Mistake: Winning,” Wall Street Journal, September 29, 2012; Skip Bayless, “Beane Will Have the Last Laugh,” ESPN.com, December 23, 2004.


Game-Changing Analytics
Discover how Optum One clinical analytics can bring you game-changing health intelligence that gives you a clearer picture of patient and population health, and better insight for improving care. Contact Optum to schedule a demonstration.
Call 1-800-765-6619Email [email protected] www.optum.com/analytics
6300 Olson Memorial Hwy, Golden Valley, MN 55427
All Optum trademarks and logos are owned by Optum. All other brand or product names are trademarks or registered marks of their respective owners. Because we are continuously improving our products and services, Optum reserves the right to change specifications without prior notice. Optum is an equal opportunity employer.
© 2014 Optum. All Rights Reserved.