big data: what’s the big deal? - uc engage 2014ucengage2014.ucop.edu/pdfs/session-1-data... ·...
TRANSCRIPT

Big Data: What’s the Big Deal?
Ellen D. Wagner Ph.D.
Chief Research and Strategy Officer
PAR Framework
@edwsonoma

Common Definitions for Today
Data are bits of information, everywhere. They comes in all kinds and shapes and sizes.
Analytics are methods and tools to parse streams of digital bits into meaningful patterns that can be explored to help stakeholders make more effective decisions.
Learning analytics are methods and tools to parse streams of digital bits into meaningful patterns that cognition, instruction and academic experience, including student success.
Data-readiness ranges from essential individual knowledge and skills to institutional capacity for creating a culture that values evidence-based decision-making.

Big Data Are Changing
EVERYTHING

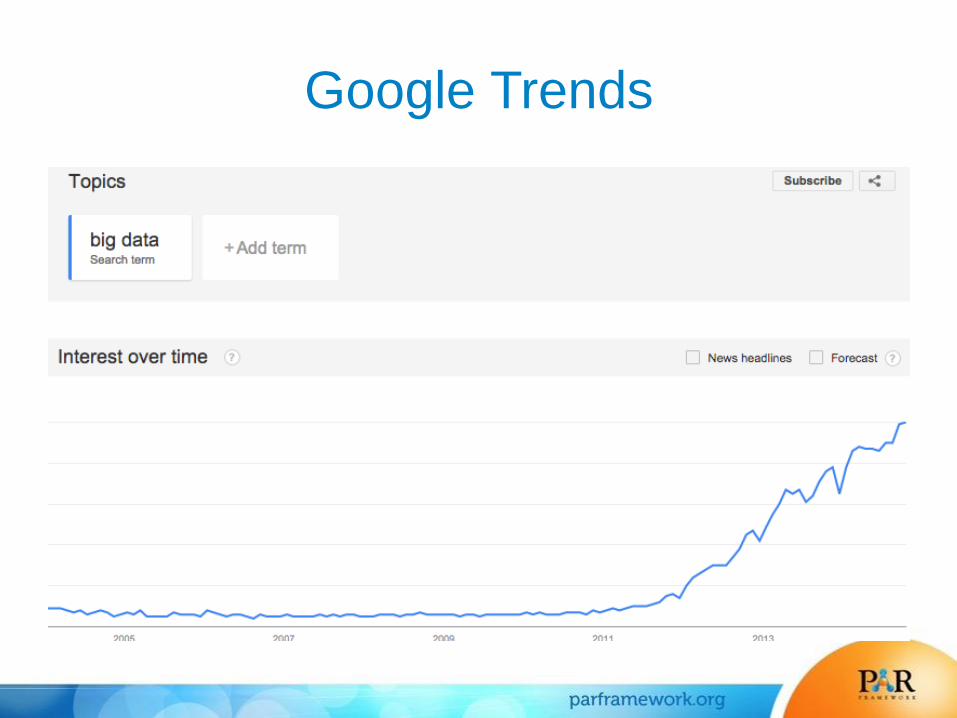
Google Trends

Google Trends

Google Trends

http://bit.ly/1goTBmP

1 Gigabyte = 1,024 Megabytes
1 Terabyte = 1,024 Gigabytes
1 Petabyte = 1,024 Terabytes
1 Exabyte = 1,024 Petabytes
1 Zettabyte = 1,024 Exabytes
1 Yottabyte = 1,024 Zettabytes
1 ZB – 1,000,000,000,000,000,000,000 bytes
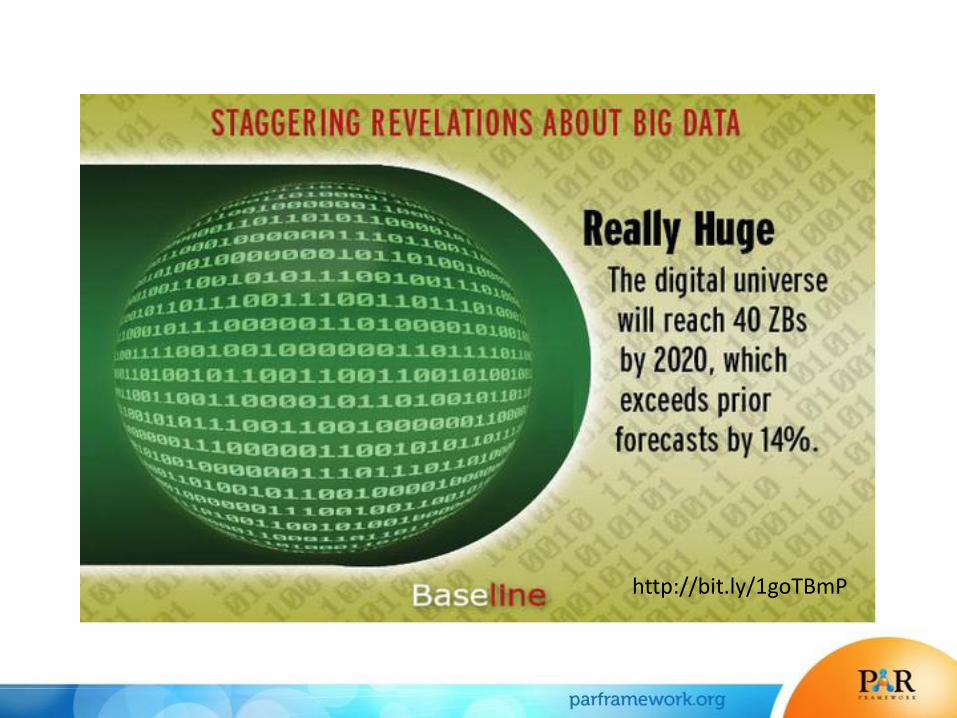
http://bit.ly/1goTBmP

http://bit.ly/1goTBmP

http://bit.ly/1goTBmP

Where are we headed? Business Models Provide Guidance
Courtesy Phil Ice, APUS

http://www.slideshare.net/fullscreen/mjft01/big-data-landscape-matt-turck-may-2014/1

While “Big Data” raise expectations,
student data drive big decisions in .edu

Costs and Completion Rates
Source: New York Times; NCES
0
10
20
30
40
50
60
70
19
96
19
97
19
98
19
99
20
00
20
01
20
02
20
03
20
04
20
05
2-yr colleges
4-yr colleges
Graduation rates at 150% of time
Cohort year

Are You “Scorecard-Ready”?
http://collegecost.ed.gov/

Performance Based Funding and
US Post-Secondary Institutions
http://www.ncsl.org/research/education/performance-funding.aspx

Data Readiness in Higher Ed
Analytics have ramped up everyone’s expectations of personalization, accountability and transparency.
Academic enterprises simply cannot live outside the institutional focus on tangible, measurable results driving IT, finance, recruitment and other mission critical concerns.

What do we want?
The RIGHT Answers!!
When do we want them? NOW!!

Use Case: The Predictive Analytics
Reporting (PAR) Framework • A national, non-profit, multi-institutional collaborative
focused on institutional effectiveness and student success.
• A “massive data” analysis effort using using predictive analytics to identify drivers related to student risk
• PAR uses descriptive, inferential and predictive analyses to create benchmarks, institutional predictive models and to inventory, map and measure student success interventions that have direct positive impact on behaviors correlated with success.

PAR Framework per the Institute for
Higher Education Policy
Draft, August 2014, used with permission, IHEP http://www.ihep.org/,


Structured, Readily Available Data
• Common data definitions = reusable predictive models and meaningful comparisons.
• Openly published via a cc license @ https://public.datacookbook.com/public/institutions/par

PAR Data Inputs
Student Demographics & Descriptive
Gender Race
Prior Credits Perm Res Zip Code
HS Information Transfer GPA Student Type
Student Course Information
Course Location Subject
Course Number Section
Start/End Dates Initial/Final Grade
Delivery Mode Instructor Status
Course Credit
Student Academic Progress
Curent Major/CIP Earned Credential/CIP
Student Financial
Information FAFSA on File – Date
Pell Received/Awarded – Date
Course Catalog Subject
Course Number Subject Long Course Title
Course Description Credit Range
** Future
Lookup Tables Credential Types Offered
Course Enrollment Periods Student Types
Instructor Status Delivery Modes
Grade Codes Institution Characteristics
Possible Additional **
Placement Tests NSC Information SES Information
Satisfaction Surveys College Readiness Surveys
Intervention Measures

PAR Outputs
Descriptive Benchmarks
Show how institutions compare to their peers in student outcomes, by scaling a multi-institutional database for benchmarking and research purposes.
Predictive Models
Identify which students need assistance, by using in-depth, institutional specific predictive models.
Models are unique to the needs and priorities of our member institutions based on their specific data.
Institutions address areas of weakness identified in benchmarks and models by scaling and leveraging a member, data and literature validated framework for examining interventions within and across institutions (SSMx)
Intervention Matrix

5 Steps For Achieving (Learning) Analytics Success
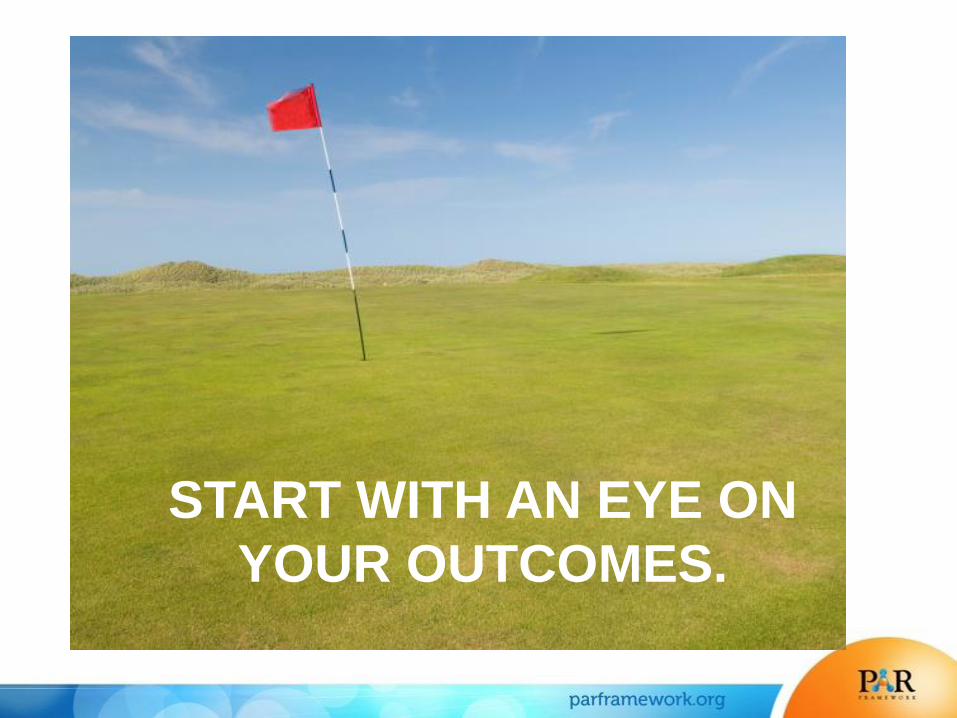
START WITH AN EYE ON
YOUR OUTCOMES.

BE CLEAR ABOUT WHAT YOU
MEAN BY SUCCESS.

SHARED UNDERSTANDINGS ENABLE
COMPARISONS, COLLABORATION.

FOCUS ON INSIGHTS,
NOT JUST ON DATA.

SHARE YOUR WORK

THANK YOU FOR YOUR
INTEREST
For more information about PAR please visit our website:
http://parframework.org
Ellen Wagner:
Twitter http://twitter.com/edwsonoma
Google+ edwsonoma
On email [email protected]