big idea – systems, order, organizationimages.pcmac.org/uploads/newberrycountyschools... · web...
TRANSCRIPT

Grade 8Grade 8OverviewOverview
The focus of the grade-eight science standards is on providing students with the hands-on experiences that give them the active engagement and the concrete examples they require in order to understand basic science concepts. The development of eighth graders’ science skills culminates with their designing an entire controlled scientific investigation, constructing explanations and drawing conclusions from data, and generating questions for further study. Specifically, students explore the life, earth, and physical sciences within the framework of the following topics: “Earth’s Biological History” (Earth’s biological diversity over time); “Earth’s Structure and Processes” (materials and processes that alter the structure of Earth); “Astronomy: Earth and Space Systems” (characteristics, structure, and motions of celestial bodies in the universe); “Forces and Motion” (effects of forces on the motion of an object); and “Waves” (properties and behaviors of waves).
The science standards for grade eight provide the foundation for a course that is based on a rich and wide variety of learning experiences that actively engage students and accommodate a broad range of student learning styles through varied materials and instructional strategies. Students should observe, interact with materials and with people and ask questions as they explore new concepts and expand their knowledge.
The skills and tools listed in the scientific inquiry sections will be assessed on statewide tests independently from the content knowledge in the respective grade or high school core area under which they are listed. Moreover, scientific inquiry standards and indicators will be assessed cumulatively. Therefore, as students progress through the grade levels, they are responsible for the scientific inquiry indicators—including a knowledge of the use of tools—in all their earlier grades. A table of the scientific inquiry standards and indicators for kindergarten through grade twelve is provided in appendix A, which teachers are urged to print out and keep as a ready reference.
The science standards in grades three through eight will be the basis for the development of the science test questions for the state science test. The test is based on the broad standards that address the life, earth, and physical sciences at each grade level. Individual test questions will be aligned with the indicators and will not go beyond the scope and intent of the more specific information in the indicators. While standards at lower grade levels will not be directly assessed, they may be used to formulate multiple-choice distracter items.
GRADE 8 8-1

Scientific Inquiry
Scientific inquiry standards and indicators should be embedded throughout ALL standards.
Standard 8-1: The student will demonstrate an understanding of technological design and scientific inquiry, including process skills, mathematical thinking, controlled investigative design and analysis, and problem solving.
Indicators:
8-1.1 Design a controlled scientific investigation.
8-1.2 Recognize the importance of a systematic process for safely and accurately conducting investigations.
8-1.3 Construct explanations and conclusions from interpretations of data obtained during a controlled scientific investigation.
8-1.4 Generate questions for further study on the basis of prior investigations.
8-1.5 Explain the importance of and requirements for replication of scientific investigations.
8-1.6 Use appropriate tools and instruments (including convex lenses, plane mirrors, color filters, prisms, and slinky springs) safely and accurately when conducting a controlled scientific investigation.
8-1.7 Use appropriate safety procedures when conducting investigations.
Indicator:8-1.1 Design a controlled scientific investigation.
Taxonomy Level: 6.2-C Create Procedural Knowledge
8-2

Previous/Future knowledge : In 4th grade (4-1.3), students summarized the characteristics of a simple scientific investigation that represent a fair test (including a question that identifies the problem, a prediction that indicates a possible outcome, a process that tests one manipulated variable at a time, and results that are communicated and explained). In 5th grade (5-1.3), students planned and conducted controlled scientific investigations, manipulating one variable at a time. In 7th grade, students explained the reasons for testing one independent variable at a time in a controlled scientific investigation (7-1.3) and explained the importance that repeated trials and a well-chosen sample size have with regard to the validity of a controlled scientific investigation (7-1.4).
It is essential for students to know that a controlled scientific investigation determines the effect of an independent variable in an experiment, when all other variables are controlled. Every controlled scientific investigation provides information. This information is called data. Data includes both scientific observations and inferences. A scientific observation is gained by carefully identifying and describing properties using the
five senses or scientific tools and can be classified as quantitative or qualitative.o Quantitative observations are observations that use numbers (amounts) or measurements
(including the unit label) or observations that make relative comparisons, such as more than, all, less than, few, or none.
o Qualitative observations are observations that are made using only the senses and refer to specific properties.
An inference is an explanation or interpretation of an observation based on prior experiences or supported by observations made in the investigation. They are not final explanations of the observation. There may be several logical inferences for a given observation. There is no way to be sure which inference best explains the observation without further investigation.
In order to design a controlled scientific investigation some or all of the following steps should be included: Identify a testable question (tests one variable at a time) that can be investigated Research information about the topic State the hypothesis as a predicted answer to the question, what may be the possible outcome of
the investigation Design an experiment to test the hypothesis, controlling all variables except the independent
variableo Plan for independent and dependent variables with repeated trialso Plan for factors that should be held constant (controlled variables) and/or plan for a
control setupo List the materials needed to conduct the experimento List the procedures to be followedo Plan for recording, organizing and analyzing data
Conduct the experiment and record data (observations) in tables, graphs, or charts Analyze the data in the tables, graphs, or charts to figure out what the data means (describe the
relationship between the variables) Compare the results to the hypothesis and write a conclusion that will support or not support the
hypothesis based on the recorded data Communicate the results to others
o Share conclusions and make recommendations for further study
8-3

NOTE TO TEACHER: The use of the terms manipulated variable and responding variable are no longer essential. Teachers may continue to reference these terms, but students will not be held accountable in testing. However, it is essential for students to use the terms independent variable and dependent variable.
It is also essential for students to know that science is the process of learning about the natural world by asking questions and trying to find the answers to those questions. Technology applies scientific knowledge in order to develop a solution to a problem or create a product to help meet human needs.Technology is usually developed because there is a need or a problem that needs to be solved. Steps in the technological design process include: Identifying a problem or need
o Research and gather information on what is already known about the problem or need Designing a solution or a product
o Generate ideas on possible solutions or productso Evaluate the factors that will limit or restrict the solution or product designo Determine the trade-offs of the solutions or products (what must be given up in order to
create the solution or product) Implementing the design
o Build and test the solution or producto Identify any problems with the solution or producto If necessary, redesign the solution or product to eliminate any problems in the design
Evaluating the solution or the producto Determine if the solution or product solved the problemo Identify the pros and cons of the solution or product
The steps of the design can be communicated using descriptions, models, and drawings. A scientific model is an idea that allows us to create explanations of how the something may
work. Models can be physical or mental.
It is not essential for students to develop a problem statement instead of a question for an investigation, evaluate an investigation as to how it was planned and conducted, or understand a null hypothesis.Students do not need to compare the processes of a controlled scientific investigation and the technological design process or evaluate a technological design or product on the basis of designated criteria (including cost, time, and materials).
Assessment Guidelines:The objective of this indicator is to design a controlled scientific investigation; therefore, the primary focus of assessment should be to devise a plan for conducting a science investigation that tests only one variable at a time. However, appropriate assessments should also require students to recognize steps appropriate for conducting a controlled investigation; detect inappropriate steps in a given investigation; organize the results of the investigation in tables or charts; classify by sequencing the steps of a controlled scientific investigation; or summarize the steps in a controlled scientific investigation.
8-4

Indicator:8-1.2 Recognize the importance of a systematic process for safely and accurately
conducting investigations.Taxonomy Level: 1.1-B Remember Conceptual Knowledge
Previous/Future knowledge : In 4th grade (4-1.3), students summarized the characteristics of a simple scientific investigation that represent a fair test (including a question that identifies the problem, a prediction that indicates a possible outcome, a process that tests one manipulated variable at a time, and results that are communicated and explained). In 5th grade (5-1.3), students planned and conducted controlled scientific investigations, manipulating one variable at a time. In 7th grade, students explained the reasons for testing one independent variable at a time in a controlled scientific investigation (7-1.3) and explained the importance that repeated trials and a
8-5
well-chosen sample size have with regard to the validity of a controlled scientific investigation (7-1.4).
It is essential for students to know that if the results of a scientific investigation are to be considered valid there must be a systematic process for conducting the investigation. This process must be designed safely and accurately.
A scientific investigation that is conducted accurately involves: Using appropriate tools safely and accurately Making careful measurements Using mathematical formulas appropriately Representing numbers with appropriate units of measurement where applicable Recording data in organized graphs, tables, and charts
Assessment Guidelines:The objective of this indicator is to recognize the importance of a systematic process for safely and accurately conducting investigations; therefore, the primary focus of assessment should be to remember that an investigation should be organized, safe, and accurate. However, appropriate assessments should also require students to identify ways to safely and accurately conduct an investigation; or recall conditions necessary for a valid investigation.
Indicator:8-1.3 Construct explanations and conclusions from interpretations of data
obtained during a controlled scientific investigation.Taxonomy Level: 6.3-B Create Conceptual Knowledge
Previous/Future knowledge : In 2nd grade (2-1.4), students inferred explanations regarding scientific observations and experiences. In 3rd grade, students predicted the outcome of a simple investigation and compare the result with the prediction (3-1.4) and inferred meaning from data communicated in graphs, tables, and diagrams (3-1.6). In 5th grade (5-1.6), students evaluated results of an investigation to formulate a valid conclusion based on evidence and communicate the findings of the evaluation in oral or written form. In 7th grade (7-1.6), students critiqued a conclusion drawn from a scientific investigation.
8-6

It is essential for students to know that once the results of an investigation are collected and recorded in appropriate graphs, tables or charts, the data should be analyzed to figure out what the data means.
Inferences are sometimes needed to help form a valid conclusion. An inference is an explanation of the data that is based on facts, but not necessarily direct
observation.
The results of the investigation are then compared to the hypothesis. A valid conclusion can then be written and should include: The relationship between the independent variable and dependent variables based on the
recorded data, and Whether the hypothesis was supported or not supported.
The conclusion is communicated to allow others to evaluate and understand the investigation.
It is not essential for students to understand or develop a null hypothesis.
Assessment Guidelines:The objective of this indicator is to construct explanations and conclusions from interpretations of data obtained during a controlled scientific investigation; therefore, the primary focus of assessment should be to produce an explanation or conclusion for an investigation. However, appropriate assessments should also require students to interpret and analyze data collected in an investigation; recognize a valid conclusion for a given investigation; compare a conclusion to the appropriate investigation; compare the conclusion with a given hypothesis; or select an appropriate conclusion for a given investigation.
Indicator:8-1.4 Generate questions for further study on the basis of prior investigations.
Taxonomy Level: 6.1-B Create Conceptual Knowledge
Previous/Future knowledge : In 3rd grade (3-1.3), students generated questions such as “what if?” or “how?” about objects, organisms, and events in the environment and use those questions to conduct a simple scientific investigation. In 5th grade (5-1.1), students identified questions suitable for generating a hypothesis. In 7th grade, students generated questions that can be answered through scientific investigation (7-1.2) and critiqued a conclusion drawn from a scientific investigation (7-1.6).
8-7

It is essential for students to know that only questions which test one independent variable at a time can be answered through scientific investigation and data collection. The question should include the relationship between the independent and dependent variable.
Once the question is tested and data is collected and analyzed, then explanations and conclusions are made and communicated. When the conclusion is communicated it allows others to evaluate and understand the investigation. Sharing ideas may give new ideas or questions for further study. When new questions are generated, recommendations can be made on changes to the design of the investigation and may produce more reliable results.
Questions that can help decide what further investigations may be: Can the procedure or product be improved? What would happen if another independent variable were tested? What are you wondering now?
It is not essential for students to conduct investigations to validate further questions.
Assessment GuidelinesThe objective of this indicator is to generate questions for further study on the basis of prior investigations; therefore, the primary focus of assessment should be to construct questions that can be tested with an investigation related to a prior investigation. However, appropriate assessments should also require students to exemplify questions that can be tested through scientific investigations; critique a conclusion; identify the experimental variables in the investigation to determine a new investigation design; compare the results of one investigation with a question for further study; explain the relationship between the independent and dependent variable to determine questions for further investigation; or identify questions that are appropriate for previously generated conclusions.
Indicator:8-1.5 Explain the importance of and requirements for replication of scientific
investigations.Taxonomy Level: 2.7-B Understand Conceptual Knowledge
Previous/Future knowledge : In 3rd grade (3-1.7), students explained why similar investigations might produce different results. In 4th grade (4-1.3), students summarized the characteristics of a simple scientific investigation that represent a fair test (including a question that identifies the problem, a prediction that indicates a possible outcome, a process that tests one manipulated variable at a time, and results that are communicated and explained). In 5th grade (5-1.3), students planned and conducted controlled scientific investigations, manipulating one variable
8-8

at a time. In 7th grade (7-1.4), students explained the importance that repeated trials and a well-chosen sample size have with regard to the validity of a controlled scientific investigation.
It is essential for students to know that for an investigation to be scientifically valid, replication within the procedures is important to verify the results and produce valid conclusions. Scientists want to report true results; therefore, they conduct repeated trials so that patterns or trends in the data can be determined. The more data that is collected through replication, the more reliable the results. Without replication, errors in procedures or data collection may not be detected.
While gathering data during an experiment: Data needs to be gathered more than one time under the same conditions and with the same
measurement tools. Repetition ensures that the experiment is valid and that the data is reliable.
o Validity indicates how close the investigation is to being accurate and dependable.o As a result of validity, other investigations repeated the same way should produce
similar results. When possible, measurements should be taken several times, and then the results averaged. Each set of repeated data is called a trial.
An investigation may involve a sample, or a portion of the total number, as a type of estimation. The sample is used to take a representative portion of the objects or population for research. A poorly chosen sample size can be unrepresentative of the whole. Careful observations made from a proper sample size or manipulating variables within that
sample size result in information and conclusions that might apply to the whole population.
If an investigation is designed with too few trials or with an improper (too small) sample size, experimental data and the results will have invalid foundations. Reasons why a repeated investigation could produce different results may be: The setup of the materials was not followed properly. Similar procedures were not followed in the exact same way. Appropriate tools were not chosen to complete the investigation. Tools were not used properly. Measurements were not taken accurately. Different observations were collected. Mistakes were made when recording data such as numbers written incorrectly.
Assessment Guidelines:The objective of this indicator is to explain the importance of and requirements for replication of scientific investigations; therefore, the primary focus of assessment should be to construct a cause-and effect model showing the importance of repeated trials to detect patterns and trends in data. However, appropriate assessments should also require students to summarize reasons why the results of an investigation may produce different results; recall the importance of replication; identify conditions necessary to collect valid data; or exemplify valid investigations.
8-9

Indicator:8-1.6 Use appropriate tools and instruments (including convex lenses, plane
mirrors, color filters, prisms, and slinky springs) safely and accurately when conducting a controlled scientific investigation.Taxonomy Level: 3.2-B Apply Conceptual Knowledge
Previous/Future knowledge: In previous grades, students used magnifiers and eyedroppers (K-1.2), rulers (1-1.2), thermometers, rain gauges, balances, and measuring cups (2-1.2), beakers, meter tapes and sticks, forceps/tweezers, tuning forks, graduated cylinders, and graduated syringes (3-1.5), a compass, an anemometer, mirrors, and a prism (4-1.2), a timing device and a 10x magnifier (5-1.4), a spring scale, beam balance, barometer, and sling psychrometer (6-1.1), and a microscope (7-1.1) safely, accurately, and appropriately. In future grades, students will use these tools when appropriate as well as learn new tools to use when collecting scientific data. A complete list of tools can be found in Appendix A of the Academic Standards.
It is essential for students to know that different tools are needed to collect different kinds of data. Convex lenses are tools used to bend, or refract, light causing objects to be magnified.
8-10

A plane mirror is a tool used to reflect light. A color filter is a tool that blocks certain wavelengths of light and transmits others. A prism is a tool that breaks light into the colors of the spectrum.
o To use a prism appropriately, the light has to enter the prism at the correct angle to the surface in order to separate the white light.
A slinky spring is a tool used to model waves.
It is essential for students to use care when handling these tools when gathering data. Care should be taken not to break or scratch the mirrors, lenses, or prisms. Color filters should not be scraped across each other as they will scratch. Slinky springs should not be over-stretched or twisted.
It is also essential for students to use tools from previous grade levels that are appropriate to the content of this grade level such as eyedroppers, magnifiers, rulers (measuring to millimeters), thermometers (measuring in ºF and ºC), beakers (measuring to milliliters), forceps/tweezers, graduated cylinders (measuring in milliliters), meter sticks and meter tapes (measuring in meters, centimeters, or millimeters), compasses, plane mirrors, prisms, timing devices (measuring in minutes or seconds), or triple beam balances (measuring to grams), tuning forks, and spring scales (measuring in newtons or grams) to gather data.
NOTE TO TEACHER: See information in previous grades regarding how to use each tool.All temperature readings during investigations will be taken using the Celsius scale unless the data refers to weather when the Fahrenheit scale is used.
It is not essential for students to use telescopes, concave or convex mirrors or concave lenses. Tools from previous grades that are not appropriate to the content of this grade level are not essential; however, these terms may be used as distracters (incorrect answer options) for assessment, for example rain gauges, measuring cups, graduated syringes, anemometers, 10X magnifiers, barometers, sling psychrometers, and microscopes. Students do not need to convert measurements from English to metric or metric to English.
Assessment GuidelinesThe objective of this indicator is to use tools safely, accurately, and appropriately when gathering data; therefore, the primary focus of assessment should be to apply correct procedures to the use of convex lenses, plane mirrors, color filters, prisms, and slinky springs, and other tools essential to the grade level that would be needed to conduct a science investigation. However, appropriate assessments should also require students to identify appropriate uses for convex lenses, plane mirrors, color filters, prisms, and slinky springs; illustrate the appropriate tool for an investigation using pictures, diagrams, or words; recall how to accurately determine the measurement from the tool; or recognize ways to use science tools safely, accurately, and appropriately.
8-11
Indicator:8-1.7 Use appropriate safety procedures when conducting investigations.
Taxonomy Level: 3.2-B Apply Factual Knowledge
Previous/Future knowledge: In all grades students use appropriate safety procedures when conducting investigations that are appropriate to their grade, tools, and type of investigations.
It is essential for students to know that care should be taken when conducting a science investigation to make sure that everyone stays safe.
Safety procedures to use when conducting simple science investigations must be Always wear appropriate safety equipment such as goggles or an apron when conducting an
investigation. Be careful with sharp objects and glass. Only the teacher should clean up broken glass. Do not put anything in the mouth unless instructed by the teacher. Follow all directions for completing the science investigation. Keep the workplace neat. Clean up when the investigation is completed. Practice all of the safety procedures associated with the activities or investigations conducted. Tell the teacher about accidents or spills right away. Wash hands after each activity.
It is essential for students to use tools including convex lenses, plane mirrors, color filters, prisms, and slinky springs safely and accurately, when conducting investigations.
NOTE TO TEACHER (safety while working with students):
8-12

Teacher materials have lists of “Safety Procedures” appropriate for the suggested activities. Students should be able to describe and practice all of the safety procedures associated with the activities they conduct.
Most simple investigations will not have any risks, as long as proper safety procedures are followed. Proper planning will help identify any potential risks and therefore eliminate any chance for student injury or harm.
Teachers should review with students the safety procedures before doing an activity. Lab safety rules may be posted in the classroom and/or laboratory where students can view
them. Students should be expected to follow these rules. A lab safety contract is recommended to notify parents/guardians that classroom science
investigations will be hands-on and proper safety procedures will be expected. These contracts should be signed by the student and the parents or guardians and kept on file to protect the student, teacher, school, and school district.
In the event of a laboratory safety violation or accident, documentation in the form of a written report should be generated. The report should be dated, kept on file, include a signed witness statement (if possible) and be submitted to an administrator.
Materials Safety Data Sheets (MSDS) must be on file for hazardous chemicals. For further training in safety guidelines, you can obtain the SC Lab Safety CD or see the Lab
Safety flip-chart (CD with training or flip-chart available from the SC Department of Education).
It is not essential for students to go beyond safety procedures appropriate to the kinds of investigations that are conducted in an eighth grade classroom.
Assessment Guidelines:The objective of this indicator is to use appropriate safety procedures when conducting investigations; therefore, the primary focus of assessment should be to apply correct procedures that would be needed to conduct a science investigation. However, appropriate assessments should also require students to identify safety procedures that are needed while conducting an investigation; or recognize when safety procedures are being used.
8-13
GRADE 8Big Idea – Change
Earth’s Biological History
Standard 8-2: The student will demonstrate an understanding of Earth’s The student will demonstrate an understanding of Earth’s biological diversity over timebiological diversity over time. (Life Science, Earth Science)
(approximately 6 weeks)
Indicators
8-2.1 Explain how biological adaptations of populations enhance their survival in a particular environment. Essential Question:
How do adaptations help organisms survive?
8-2.2 Summarize how scientists study Earth’s past environment and diverse life-forms by examining different types of fossils (including molds, casts, petrified fossils, preserved and carbonized remains of plants and animals, and trace fossils).Essential Question:
What do different kinds of fossils tell us about Earth’s history?
8-2.3 Explain how Earth’s history has been influenced by catastrophes (including the impact of an asteroid or comet, climatic changes, and volcanic activity) that have affected the conditions on Earth and the diversity of its life-forms.Essential Question:
How have catastrophes affected conditions on Earth?
8-2.4 Recognize the relationship among the units—era, epoch, and period—into which the geologic time scale is divided. Essential Question:
How is geologic time divided into units?
8-14
8-2.5 Illustrate the vast diversity of life that has been present on Earth over time by using the geologic time scale. Essential Question:
How are changes of Earth’s organisms related to the geologic time scale?
8-2.6 Infer the relative age of rocks and fossils from index fossils and the ordering of the rock layers. Essential Question:
How can you determine the relative age of rocks and fossils?
8-2.7 Summarize the factors, both natural and man-made, that can contribute to the extinction of a species. Essential Question:
What natural and man-made factors can cause extinction of a species?
Scientific inquiry standards and indicators should be embedded throughout standard 8-2.
Standard 8-1: The student will demonstrate an understanding of technological design and scientific inquiry, including process skills, mathematical thinking, controlled investigative design and analysis, and problem solving.
Indicators
8-1.8 Design a controlled scientific investigation.8-1.9 Recognize the importance of a systematic process for safely and accurately conducting
investigations. 8-1.10 Construct explanations and conclusions from interpretations of data obtained during a
controlled scientific investigation. 8-1.11 Generate questions for further study on the basis of prior investigations.8-1.12 Explain the importance of and requirements for replication of scientific investigations.8-1.13 Use appropriate tools and instruments (including convex lenses, plane mirrors, color filters,
prisms, and slinky springs) safely and accurately when conducting a controlled scientific investigation.
8-1.14 Use appropriate safety procedures when conducting investigations.
8-15

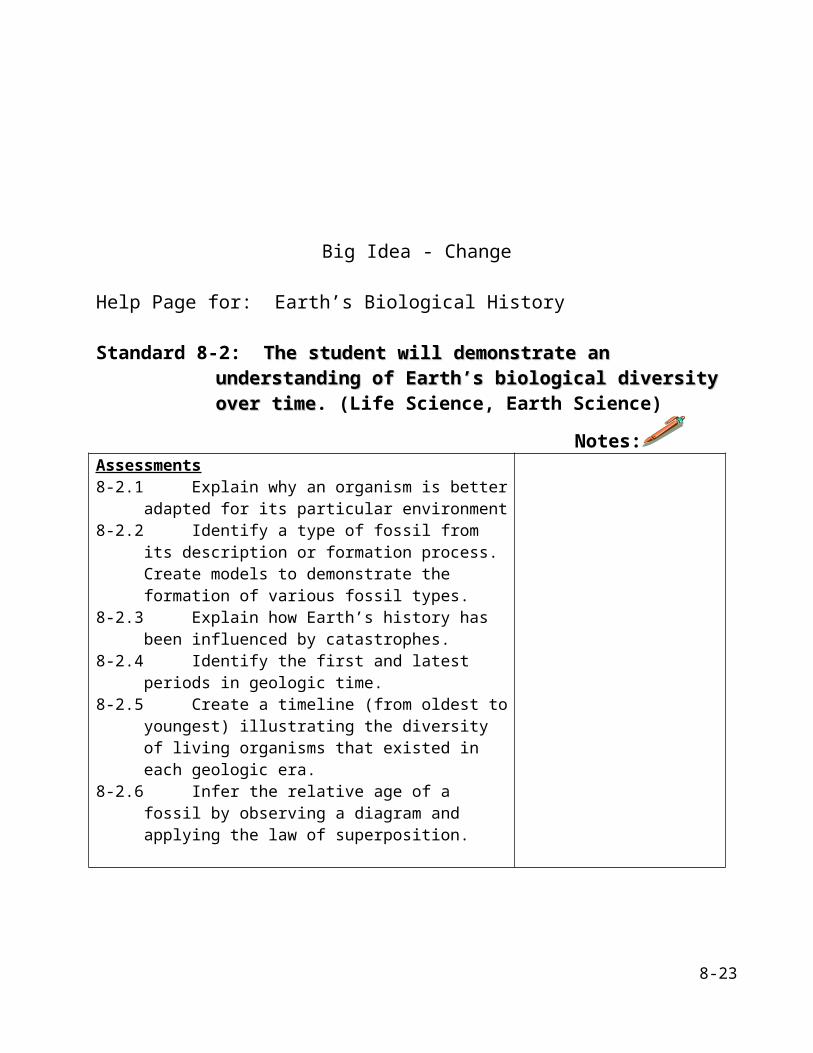
Big Idea - Change
Help Page for: Earth’s Biological History Standard 8-2: The student will demonstrate an understanding of Earth’s The student will demonstrate an understanding of Earth’s
biological diversity over timebiological diversity over time. (Life Science, Earth Science)
Notes:Assessments8-2.1 Explain why an organism is better adapted for its
particular environment8-2.2 Identify a type of fossil from its description or formation
process. Create models to demonstrate the formation of various fossil types.
8-2.3 Explain how Earth’s history has been influenced by catastrophes.
8-2.4 Identify the first and latest periods in geologic time.8-2.5 Create a timeline (from oldest to youngest) illustrating
the diversity of living organisms that existed in each geologic era.
8-2.6 Infer the relative age of a fossil by observing a diagram and applying the law of superposition.
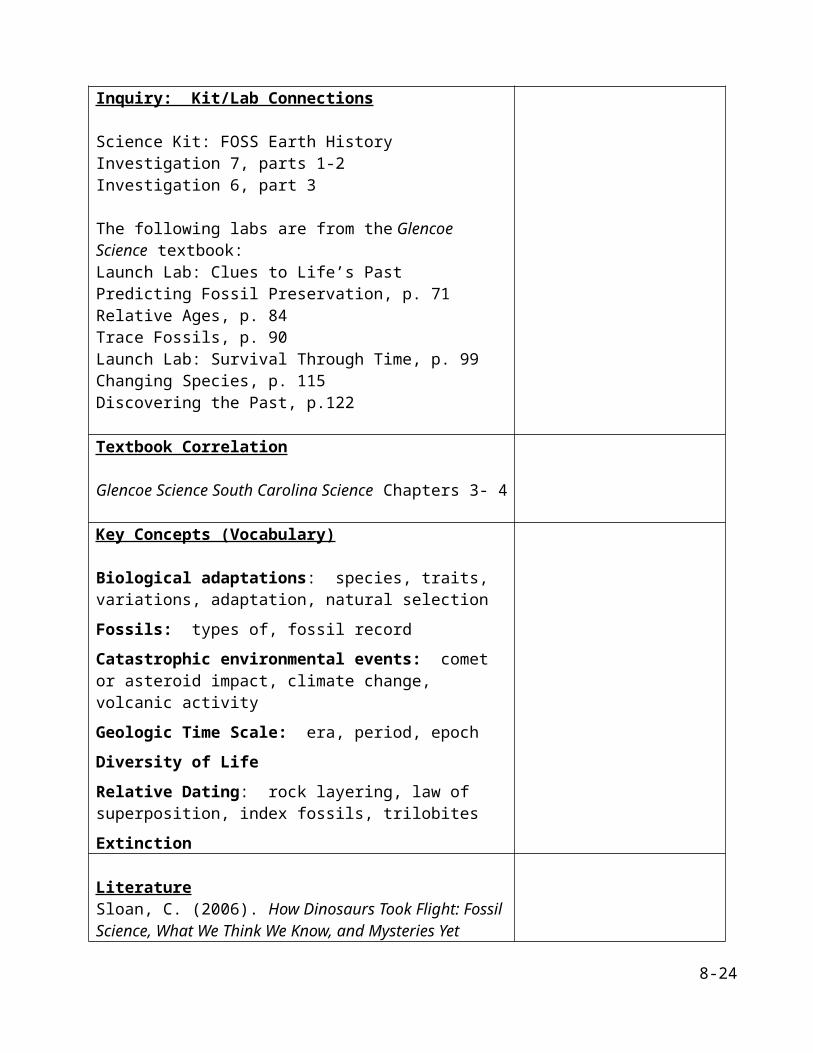
Inquiry: Kit/Lab Connections
Science Kit: FOSS Earth History Investigation 7, parts 1-2Investigation 6, part 3
The following labs are from the Glencoe Science textbook:Launch Lab: Clues to Life’s PastPredicting Fossil Preservation, p. 71Relative Ages, p. 84Trace Fossils, p. 90Launch Lab: Survival Through Time, p. 99Changing Species, p. 115Discovering the Past, p.122
Textbook Correlation
8-16
Glencoe Science South Carolina Science Chapters 3- 4
Key Concepts (Vocabulary)
Biological adaptations: species, traits, variations, adaptation, natural selection
Fossils: types of, fossil record
Catastrophic environmental events: comet or asteroid impact, climate change, volcanic activity
Geologic Time Scale: era, period, epoch
Diversity of Life
Relative Dating: rock layering, law of superposition, index fossils, trilobites
Extinction
LiteratureSloan, C. (2006). How Dinosaurs Took Flight: Fossil Science, What We Think We Know, and Mysteries Yet Unsolved. National Geographic Children’s BooksISBN: 0-7922-7404This book cites evidence that supports the theory that birds are descended from ancient dinosaurs. It also points out the mysteries that are as yet unsolved, awaiting further fossil discoveries.8-2.2
Lindop, L. (2006). Cave Sleuths. Lerner PublishingISBN: 0-7613-2702-9This book describes cave formation and the study of the Earth system and the organisms found in a cave environment and their adaptations.8-2.1
Turner, P. (2006) Gorilla Doctors: Saving Endangered Great Apes. Houghton MifflinISBN: 0-618-44555-2This book describes the Mountain Gorilla Vet. Project, including the impact of human borne diseases on the gorillas and their survival.8-2.7
Grace, K. (2004). Forces of Nature: The Awesome Power of Volcanoes, Earthquakes, and Tornadoes. National Geographic Society 8-17
ISBN: 0-7922-6328This book describes forces of nature and the effects these can have on human populations.8-2.3
Burnie,D. (2004). Endangered Planet. Houghton MifflinISBN: 0-7534-5776-8This book describes natural cycles and habitats and the impact that humans have on the environment.8-2.7
Koppes, S. (2003). Killer Rocks from Outer Space” Asteroids, Comets, and Meteorites.Lerner PublishingISBN: 0-8225-2861-4This book describes the catastrophic effects of pre-historic meteor and comet impacts on planet Earth. 8-2.3
Simon, S. (2000). Gorillas. HarperCollinsISBN: 0-06-023036-3This book includes information explaining what is endangering gorilla populations and what is being done to protect them and their habitat.8-2.7Chorlton, W. (2001). Wooly Mammoth: Life, Death, and Rediscovery. ScholasticISBN: 0-439-24134-0This book describes the excavation of a frozen wooly mammoth and the expertise and technology involved. It also includes theories about the disappearance of these creatures.8-2.3
Goodman, S. (2001). Claws, Coats, and Camouflage: The Ways Animals Fit Into the World. Millbrook PressISBN: 0-7613-1865-8This book has descriptions of how different animals are adapted for surviving in their environments.8-2.1
Sloan, C. (2002). SuperCroc and the Origin of Crocodiles. National Geographic Society.ISBN: 0-7922-6691-9This book is about the Mesozoic Era and the origins of crocodiles. It compares ancient ones to modern ones.8-2.5
Technology:
8-18

Supporting Content Web Sites
“How Was the Geological Time Scale Developed?”http://www.wisegeek.com/how-was-the-geological-time-scale-developed.htmThis is a short, concise description of the origin of the geological time scale.8-2.4
“Rockman”s Geologic Time Chart”http://www.rocksandminerals.com/geotime/geotime.htmThis explains the subdivisions and relationships of the categories of the Geologic Time Chart.8-2.4, 8-2.5
“Endangered Animals-Extinction is Forever”http://www.uen.org/utahlink/activities/view_activity.cgi?activity_id=3820This site explains extinction and the causes of it. It has links to sites of nine extinct animals, including the Carolina Parakeet.8-2.7
“Paleobiology: Fossils And Time”http://www.emc.maricopa.edu/faculty/farabee/biobk/BioBookPaleo1.htmlThis includes a description of Paleobiology, the study of fossils, methods of age dating, the geological time scale with objectives, terms, questions, review and links.8-2.2, 8-2.5
“Species Diversity and Biodiversity”http://www.physicalgeography.net/fundamentals/9h.htmlThis site describes species diversity and biodiversity including the effects of major extinction events. It also includes links to other sites.8-2.3
“Geologic Time”http://pubs.usgs.gov/gip/geotime/contents.htmlThis site has links to information about geologic time, relative time scale, major divisions of geologic time, and index fossils (radiometric time scale and age of the earth are not part of this standard).8-2.4, 8-2.6
“Three High-Altitude Peoples, Three Adaptations to Thin Air” http://news.nationalgeographic.com/news/2004/02/0224_040225_evolution.html 8-19

This site compares three high-altitude people and their adaptations to thin air.8-2.1
“Welcome to Understanding Geologic Time”http://www.ucmp.berkeley.edu/education/explorations/tours/geotime/index.html This is a good site for introducing students to geologic time, including fossils, index fossils, relative dating, geologic time scale, and much more.8-2.4, 8-2.5
“Adaptation”http://en.wikipedia.org/wiki/AdaptationThis site describes different types of biological adaptation.8-2.1
Suggested Streamline Video
Earth Science: History of the EarthPart1: Early Life on EarthPart 5: Sixty-five Million Years Ago: The Cretaceous Period and ExtinctionETV Streamline SCThis video show how things have changed for planet Earth in the past 4.6 billion years.4:37; 4:30 8-2.5, 8-2.7
Our Changing EarthPart 1: The End of the DinosaursPart 2: Earth’s Changing LandscapeETV Streamline SCThis video gives examples of changes, especially changes on Earth with an emphasis on the extinction of dinosaurs. This video also traces the history and causes of Earth’s variety of terrains.7:35, 7:418-2.3
Earth Science: FossilsETV Streamline SCThis video shows scientists at work with fossils. It also explains the formation of amber.20:008-2.2, 8-2.3, 8-2.5, 8-2.7
8-20

TLC Elementary School: Prehistoric EarthAll SectionsThis video covers the nature and divisions of geologic time, prehistoric life-forms, and fossils.24.338-2.2, 8-2.3, 8-2.4, 8-2.6, 8-2.7
Cross Curricular Opportunities
Integrate Social Studies, p.73Applying Math, p.89, 119, 121Science Journal, p.103Chemistry, p.109Social Studies: Discuss catastrophic events in South Carolina’s past and their effects on local species. Discuss the formation of the different regions of South Carolina according to the geologic time scale.Math: Discuss absolute dating and radioactive decay.
Field Trip/Related Experiences
South Carolina State Museum
Career Connections
Paleontologistteaches at colleges or works in museums, especially with fossils. Some of them still work for oil companies, but these positions are dwindling. 8-2.2, 8-2.6
Geoscientistinvestigate the Earth, its soils, oceans, and atmosphere; forecast the weather; develop land-use plans; explore other planets and the solar system; determine environmental impacts; and find new sources of useful Earth materials. These are just a few of the ways geoscientists contribute to our understanding of Earth processes and history.8-2.1, 8-2.2, 8-2.3, 8-2.7
Geobiologist investigates the interactions between biological and geological systems at all scales of space and time; 2) geomicrobiology and biomineralization processes; 3) the role of life in the evolution of the Earth’s system8-2.1,8-2.2
8-21

Geochemistinorganic and organic geochemical processes occurring at or near the earth’s surface now and in the past, and at the broad spectrum of interfaces ranging in scale from planetary and regional to mineral-surface and supramolecular structures.8-2.1, 8-2.2
Space scientistmay be involved in many different areas. One area of interest is the study of meteorites and their impact on the Earth.8-2.3
Big Idea - Change 8-22
Earth’s Biological History
Indicator:8-2.1 Explain how biological adaptations of populations enhance their survival
in a particular environment.Taxonomy level: 2.7-B Understand Conceptual Knowledge
Essential Question(s):How do adaptations help organisms survive?
Previous/future knowledge: Students in 3rd grade (3-2.2) developed understanding of various adaptations of organisms that allow them to survive. The biotic composition of an ecosystem including populations is part of 5th grade ecosystems study (5-3.2). In 7th grade (7-4.1) students summarized the levels of organization within an ecosystem that included populations.
It is essential for students to know that populations in a particular environment that are better adapted to living conditions there, and therefore are able to meet their survival needs, are more likely to survive and reproduce offspring with those traits. There are variations among species of similar populations. Organisms of a species differ from one another in many of their traits. An adaptation is a trait or behavior that helps an organism survive and reproduce. Natural selection is the process that explains this survival and shows how species can change
over time. For example, certain traits or adaptations involving color, camouflage, food gathering (beaks, claws) and other physical traits, sensory abilities, or behaviors enhance the survival of a species.
It is NOT essential for students to know the specifics involved in the theory of evolution, a gradual change in species over time. Natural selection over a long period of time can lead to helpful variations accumulating while unfavorable ones disappear. Studying Darwin’s voyage and data is also not included in this indicator.
Assessment Guidelines:The objective of this indicator is to explain how biological adaptations of populations enhance their survival in a particular environment; therefore, the primary focus of assessment should be to construct a cause-and-effect model of various adaptations resulting in population survival in particular environments. However, appropriate assessments should also require students to compare species of a particular population as to the adaptation that allows them to survive; infer from information about a particular environment the adaptation that a particular organism would need to survive there; or identify an adaptation that enhances survival of an organism based on pictures, diagrams, or word descriptions.
8-23
Big Idea - Change Earth’s Biological History
Indicator:8-2.2 Summarize how scientists study Earth’s past environment and diverse life-
forms by examining different types of fossils (including molds, casts, petrified fossils, preserved and carbonized remains of plants and animals, and trace fossils).Taxonomy level: 2.4-B Understand Conceptual Knowledge
Essential Question:What do different kinds of fossils tell us about Earth’s history?
Previous/future knowledge: In 3rd grade, students recognized types of fossils (including molds, casts, and preserved parts of plants and animals) (3-3.3) and inferred ideas about Earth’s early environments from fossils of plants and animals that lived long ago (3-3.4). In 4th grade (4-2.1) and 6th grade (6-3.1), students classified groups of organisms showing the diversity of life-forms on Earth today. Further study on this topic will be part of high school Earth Science.
It is essential for students to know that a fossil is the preserved remains or traces of an organism that lived in the past, usually more that 10,000 years ago. Fossils give clues to the diversity of living things over the history of Earth, give clues to past climate and surface changes on Earth, and give clues to changes that have occurred within species of organisms over time.
NOTE TO TEACHER: Students need to study the formation process of mold, cast, petrified, preserved, carbonized, and trace fossils.
There are different types of fossils based on how they were formed. The environmental conditions that favor fossil formation are also essential to this study.
Mold fossil – forms when sediments bury an organism and the sediments change into rock; the organism decays leaving a cavity in the shape of the organism.
Cast fossil – forms when a mold is filled with sand or mud that hardens into the shape of the organism.
Petrified fossil (permineralized fossil) – forms when minerals soak into the buried remains, replacing the remains, and changing them into rock.
Preserved fossil – forms when entire organisms or parts of organisms are trapped in ice, tar, or amber and are prevented from decaying.
Carbonized fossil – forms when organisms or parts, like leaves, stems, flowers, fish, are pressed between layers of soft mud or clay that hardens squeezing almost all the decaying organism away leaving the carbon imprint in the rock.
Trace fossil – forms when the mud or sand hardens to stone where a footprint, trail, or burrow of an organism was left behind.
8-24

Millions of fossils have been collected and studied. The fossil record gives important information about past life and environments on Earth. Certain fossilized organisms could only live in specific environments or under particular climate conditions. Extinction of life-forms as well as how and when new life-forms appeared is part of the fossil record.
NOTE TO TEACHER: This is not a study of evolutionary change, but a study of how fossils can show structural similarities and differences in organisms over time revealing the vast diversity of life forms that have and continue to exist here.
It is NOT essential for students to know the evolutionary relationships among organisms that scientists are studying.
Assessment Guidelines:The objective of this indicator is to summarize how scientists study Earth’s past environment and diverse life-forms by examining different types of fossils; therefore, the primary focus of assessment should be to generalize major points about the fossils listed in the indicator, fossil formation, and evidence gleaned from the fossil record. However, appropriate assessments should also require students to identify a type of fossil from its description or formation process; compare one type of fossil to another or one life-form with a related form in Earth history; identify an environmental condition evident because of a fossil presence; or exemplify the changes in a species over time in Earth’s history using the fossil record.
8-25
Big Idea – ChangeEarth’s Biological History
Indicator:8-2.3 Explain how Earth’s history has been influenced by catastrophes
(including the impact of an asteroid or comet, climatic changes, and volcanic activity) that have affected the conditions on Earth and the diversity of its life-forms.Taxonomy level: 2.7-B Understand Conceptual Knowledge
Essential Question:How have catastrophes affected conditions on Earth?
Previous/future knowledge: This is new material for this grade level. This indicator should be studied along with 8-2.5, the diversity of life present on Earth over time using the geologic time scale.
It is essential for students to know that along with the study of the geologic time scale, the changes in life forms, additions and extinctions, are often accompanied by changes in environmental conditions on Earth. These environmental changes have been influenced by the impact of an asteroid or comet, climatic changes, and volcanic activity.
Impact of an asteroid or cometEarth’s atmosphere protects the planet from many of the meteors that enter it, resulting in their burning up before striking the surface.
At the end of the Mesozoic Era, when reptiles, early birds and mammals thrived, many groups of animals disappeared suddenly.
Scientists hypothesize that possibly a large asteroid or comet impacted with Earth. This impact caused dust and smoke to rise into the atmosphere and cause climatic changes, as well as the dying of many forms of plant life and animals that depended on those plants for food.
A major life form that disappeared at this time was the dinosaur.
Climatic changesEarth’s environments have many different climates even today. Climate is an ever-changing condition on Earth.
Earliest life forms were influenced by the climates produced by the forming atmosphere and oceans of Earth.
Life on land developed and flourished in the tropical climates and warm shallow seas during the Paleozoic Era. Throughout this era as different land environments formed and sea levels changed, new life forms developed. Other life forms that could not adapt or find suitable conditions, especially many marine species, disappeared.
During the Mesozoic era, many climate changes occurred due to plate tectonics and the movement of landmasses. Plants and animals that survived through this time had structures and systems that allowed for greater adaptations, such as seed coverings
8-26
for plant seeds and protective body coverings or constant internal temperature for animals.
During the present Cenozoic era, climate conditions continue to change. Major ice ages caused the climate to become much cooler as ice sheets and glaciers covered many areas of Earth. Many mountain ranges formed causing climate differences due to elevation and due to location near those ranges.
Volcanic activityFrom the earliest days while Earth was forming to present day, volcanic activity has been part of the nature of this changing planet.
During the Precambrian time volcanic activity was one of the most natural events, but lava flows, ash clouds in the atmosphere, and heat made conditions for life forms extremely difficult. Those simple life forms often did not survive these conditions.
As continent collided and mountains built up due to plate tectonics, volcanoes also formed. Volcanic activity continued to be common in the Paleozoic era. During the rapid movement of plates in the Mesozoic era, collisions and subduction produced extensive volcanic activity around plate boundaries.
Plate boundaries are still the location of much of Earth’s volcanic activity. Very explosive volcanic activity can send ash and dust high into the atmosphere
where it is carried great distances around the Earth. The Sun can be blocked for long periods of time. This violent type of activity can disrupt many of Earth’s processes and ultimately the life forms that depend on those processes.
The eras of Earth history can be studied in light of conditions on Earth, the effect of those conditions on life-forms, and the possibilities of rapid changes to both (environmental conditions and life forms) due to catastrophes.
It is NOT essential for students to know exact causes of the many extinctions during Earth’s geologic history, but understanding of how an impact, or climatic change, or volcanic activity can affect conditions for life forms to survive generally on Earth is important.
Assessment Guidelines:The objective of this indicator is to explain how Earth’s history has been influenced by catastrophes; therefore, the primary focus of assessment should be to construct a cause-and effect model of a catastrophic event’s impact on the conditions and diversity of life-forms on Earth. However, appropriate assessments should also require students to identify an event that would be catastrophic to Earth; infer changes in conditions and life-forms that occurred during the recent ice ages; or compare the changes in environmental conditions during Earth’s geologic history.
Big Idea - Change 8-27
Earth’s Biological History
Indicator:8-2.4 Recognize the relationship among the units – era, period, and epoch – into
which the geologic time scale is divided.Taxonomy level: 1.1-A,B Remember Factual and Conceptual Knowledge
Essential Question:How is geologic time divided into units?
Previous/future knowledge: The geologic time scale is new material for this grade. Further study will take place in high school Earth Science.
It is essential for students to know that the geologic time scale divides Earth’s long history into units of time:
eras are divided into periods; periods can be further divided into epochs.
Major information found on the geologic time scale includes: Precambrian is the name given to the earliest span of time in Earth history. Geologists divide the time between Precambrian and the present into three long units called
eras (Paleozoic, Mesozoic, Cenozoic). The names of the eras are important, as is the order from oldest era to most recent. Eras are subdivided into units called periods. Cambrian being the first period is important. With a more complete fossil record available, the periods of the Cenozoic era are subdivided
further into epochs. Present day Earth is in the Cenozoic era and the Quaternary period in the Holocene epoch. Geologic time has not ended.
It is NOT essential for students to know the dates involved with each era or period. Students do not need to memorize the names or order of the periods of Earth history.
Assessment Guidelines:The objective of this indicator is to recognize the relationship among the units of the geologic time; therefore, the primary focus of assessment should be to locate this knowledge within the presented material on the relationships among the units (era, epoch, and period) and how they are subdivided. However, appropriate assessments should also require students to identify a unit’s place in sequence; recall the three major era divisions; identify the first period of geologic history or the period of present day geologic time; or recognize that geologic history is ongoing – it has not ended.
8-28

Big Idea – Change Earth’s Biological History
Indicator:8-2.5 Illustrate the vast diversity of life that has been present on Earth over time
by using the geologic time scale.Taxonomy level: 2.2-B Understand Conceptual Knowledge
Essential Question:How are changes of Earth’s organisms related to the geologic time scale?
Previous/future knowledge:
Relating diversity of life to the geologic time scale is new content for this grade. This concept will be further studied in high school Earth Science.
It is essential for students to know that the geologic time scale is a record of the major events and diversity of life forms present in Earth’s history.
The geologic time scale began when Earth was formed and goes on until the present. At the end of each era a mass extinction occurred, many kinds of organisms died out,
although there were other extinctions going on during each period of geologic time. Using the fossil record, paleontologists have created a picture of the different types of
common organisms in each geologic period.Paleozoic Era
Began with the early invertebrates, such as trilobites and brachiopods; continued to develop early vertebrate fish, then arachnids and insects; later came the first amphibians, and near the era’s end the reptiles became dominant.
Early land plants included simple mosses, ferns, and then cone-bearing plants. By the end of the era, seed plants were common. The mass extinction that ended the era caused most marine invertebrates as well as
amphibians to disappear.Mesozoic Era
Reptiles were the dominant animals of this era, including the various dinosaurs. Small mammals and birds also appeared. Toward the end of the era, flowering plants appeared and the kinds of mammals increased. The mass extinction that ended the era caused the dinosaurs to become extinct.
Cenozoic Era New mammals appeared while others became extinct. The diversity of life forms increased. Flowering plants became most common. Humans are also part of the most recent period of this era.
Various models, diagrams, and pictures can be used to illustrate the vastness of time involved in geologic time and to show the diversity of life evident across geologic time. Through the illustrations, not only does the diversity of life-forms increase, but the complexity of those life-forms also increases.
8-29

It is NOT essential for students to know in detail the myriads of organisms that appeared during the various periods. They do not have to include the geologic events of each era and/or period, but reference to major geologic changes especially continental changes due to plate tectonics is helpful.
Assessment Guidelines:The objective of this indicator is to illustrate the diversity of life that has been present on Earth over time; therefore, the primary focus of assessment should be to give illustrations of these concepts or use illustrations to show understanding of diversity of life over geologic time. However, appropriate assessments should also require students to interpret a diagram of life forms over geologic time; exemplify major life forms that dominated an era; or compare life forms in one era with those in another.
8-30
Big Idea - ChangeEarth’s Biological History
Indicator:8-2.6 Infer the relative age of rocks and fossils from index fossils and the
ordering of rock layers.Taxonomy level: 2.5-B Understand Conceptual Knowledge
Essential Question:How can you determine the relative age of rocks and fossils?
Previous/future knowledge:
The concept of relative age using ordering of rock layers and index fossils is new content for this grade. This concept will be further studied in high school Earth Science.
It is essential for students to know that the relative age means the age of one object compared to the age of another object. Relative age does not tell the exact age of an object. The relative age of rocks and fossils can be determined using two basic methods: ordering of rock layers and index fossils:
Ordering of Rock Layers Scientists read the rock layers knowing that each layer is deposited on top of other layers. The law of superposition states that each rock layer is older than the one above it. So using this layering, the relative age of the rock or fossil in the rock is older if farther
down in the rock layers. Relative dating can be used only when the rock layers have been preserved in their original
sequence.
Index FossilsCertain fossils, called index fossils, can be used to help find the relative age of rock layers. To be an index fossil –
an organism must have lived only during a short part of Earth’s history; many fossils of the organism must be found in rock layers; the fossil must be found over a wide area of Earth; the organism must be unique.
The shorter time period a species lived, the better an index it is. A key example of an organism used as an index fossil are trilobites, a group of hard-shelled animals whose body had three sections, lived in shallow seas, and became extinct about 245 million years ago. Therefore, if a trilobite is found in a particular rock layer, it can be compared with trilobites from other layers to estimate the age of the layer in which it was found.
Fossils that are found in many rock layers, therefore living long periods of time, do not qualify as index fossils.
8-31

It is NOT essential for students to know how to interpret complex layering due to intrusions and extrusions, faults, or unconformities, although some students may be challenged with this task. Complex layering is part of the high school Earth Science course. It is also not essential for students to know the processes involved in absolute dating using radioactive element decay.
Assessment Guidelines:The objective of this indicator is to infer relative age of rocks and fossils; therefore, the primary focus of assessment should be to draw conclusions about relative age from presented material on layering of rocks and index fossils. However, appropriate assessments should also require students to interpret drawings or diagrams that show data about rock layer and fossils; compare rock layers in order to determine common points of relative time; or recall the law of superposition.
8-32
Big Idea – Change Earth’s Biological History
Indicator:8-2.7 Summarize the factors, both natural and man-made, that can contribute
to the extinction of a species.Taxonomy level: 2.4-B Understand Conceptual Knowledge
Essential Question:What natural and man-made factors can cause extinction of a species?
Previous/future knowledge: Students in 1st, 2nd, and 3rd grade studied factors that plants and animals need in order to survive. In 6th grade, students illustrated animal behavioral responses (6-3.5) and internal stimuli (6-3.6) that ensure their survival. In 7th grade (7-4.3), students explained how natural hazards and limiting factors affect populations. This is the first time that extinction of species is a concept.
It is essential for students to know that a species is extinct if no members of that species are still alive. Most organisms that have ever lived on Earth are now extinct.
Natural factors can cause extinctions such as has happened throughout Earth history. Organisms that could not survive changes due to volcanic eruptions and global warming,
global cooling during ice ages, changes in oxygen levels in seawater, or a massive impact from an asteroid or comet became extinct.
Natural extinctions have occurred throughout geologic history. Not all have been necessarily negative in that extinctions often clear the way for new kinds
of life.
Man-made factors have caused extinctions in more recent times, such as the cutting of the rainforest regions, removing natural habitats, over-harvesting, and pollution.
Many plants and animals are likely to become extinct in the near future if humans do not make changes in way they are damaging Earth, and removing the survival needs of many organisms.
Human effects on the environment could threaten some biological resources that humans may need.
Species that have recently become extinct or that are endangered can be studied to discover what natural or man-made survival resources caused the extinction or endangerment and what could have been or could be done to prevent it from happening.
It is NOT essential for students to know the specifics about the extinction of any particular species. Students do not need to make value or moral judgments about what man has or has not done with regards to extinction or endangerment of species; they are not evaluating the topic.
8-33

Assessment Guidelines:The objective of this indicator is to summarize the factors that contribute to the extinction of a species; therefore, the primary focus of assessment should be to generalize major points about natural and man-made contributions to extinction. However, appropriate assessments should also require students to infer whether presented information could lead to extinction of a species; compare natural factors with man-made factors that could cause extinction; or exemplify species that are presently extinct due to natural factors or human factors.
8-34

GRADE 8Big Idea – Change/ Form and Function
Earth’s Structure and Processes
Standard 8-3: The student will demonstrate an understanding of materials that determine the structure of Earth and the processes that have altered this structure. (Earth Science)(approximately 9- 12 weeks)
Indicators
8-3.1 Summarize the three layers of Earth—crust, mantle, and core—on the basis of relative position, density, and composition.Essential Question: How would you summarize the three layers of the Earth on the basis of position,
density, and composition?
8-3.2 Explain how scientists use seismic waves—primary, secondary, and surface waves—and Earth’s magnetic fields to determine the internal structure of Earth.Essential Question: How do scientists use seismic waves to determine the internal structure of Earth?
8-3.3 Infer an earthquake’s epicenter from seismographic data. Essential Question: How can you locate the epicenter of an earthquake?
8-3.4 Explain how igneous, metamorphic, and sedimentary rocks are interrelated in the rock cycle. Essential Question: How are all rocks linked by the rock cycle?
8-3.5 Summarize the importance of minerals, ores, and fossil fuels as Earth resources on the basis of their physical and chemical properties. Essential Question: How are the properties of minerals, ores, and fossil fuels useful to us?
8-3.6 Explain how the theory of plate tectonics accounts for the motion of the lithospheric plates, the geologic activities at the plate boundaries, and the changes in landform areas over geologic time. Essential Question: How does the theory of plate tectonics explain changes in landforms over time?
8-3.7 Illustrate the creation and changing of landforms that have occurred through geologic processes (including volcanic eruptions and mountain-building forces).
Essential Question:
8-35
What effect do volcanic eruptions and mountain-building forces have on landforms?
8-3.8 Explain how earthquakes result from forces inside Earth.Essential Question: What causes earthquakes?
8-3.9 Identify and illustrate geologic features of South Carolina and other regions of the world through the use of imagery (including aerial photography and satellite imagery) and topographic maps. Essential Question: How can you identify the geologic features of South Carolina on a map or photograph?
Scientific inquiry standards and indicators should be embedded throughout standard 8-3.
Standard 8-1: The student will demonstrate an understanding of technological design and scientific inquiry, including process skills, mathematical thinking, controlled investigative design and analysis, and problem solving.
Indicators
8-1.1 Design a controlled scientific investigation.8-1.2 Recognize the importance of a systematic process for safely and accurately conducting investigations. 8-1.3 Construct explanations and conclusions from interpretations of data obtained during a
controlled scientific investigation. 8-1.4 Generate questions for further study on the basis of prior investigations.8-1.5 Explain the importance of and requirements for replication of scientific investigations.8-1.6 Use appropriate tools and instruments (including convex lenses, plane mirrors, color filters,
prisms, and slinky springs) safely and accurately when conducting a controlled scientific investigation.
8-1.7 Use appropriate safety procedures when conducting investigations.
Big Idea – Change/ Form and Function
8-36
Earth’s Structure and Processes
Help Page for: Earth’s Structure and Processes
Standard 8-3: The student will demonstrate an understanding of materials that determine the structure of Earth and the processes that have altered this structure. (Earth Science)
Notes:Assessments
8-3.1 Compare the layers of the Earth by creating a model and presenting it to the class.
8-3.2 Summarize how seismic waves and magnetic field data can be used to infer what the inside of Earth looks like.
8-3.3 Infer an earthquake’s epicenter by using triangulation.8-3.4 Explain the interrelationships of the three rock types by
acting out the parts of the rock cycle in groups.8-3.5 Give examples of Earth resources that are minerals,
ores, or fossil fuels.8-3.6 Explain how the landforms of Earth are changing due to
the movement of plates.8-3.7 Compare the different stress forces that act on the
Earth’s landforms.8-3.8 Explain how earthquakes result from forces inside Earth.8-3.9 Use SC Aerial Photos and Topographic Maps to identify
geologic features on Earth.
Inquiry: Kit/Lab Connections
Science Kit: FOSS Earth HistoryInvestigation 4, parts 3-6Investigation 5, parts 1-2Investigation 8, parts 1-2
The following labs are from Glencoe Science South Carolina Science:Launch Lab: Reassemble an Image, p. 133Lab: Seafloor Spreading Rates, p. 141Lab: Predicting Tectonic Activity, p.152Launch Lab: Why do Earthquakes occur? , p. 161Lab: Epicenter Location, p. 174Lab: Earthquake Depths, p. 182Launch Lab: Observe a Rock, p. 191 8-37

Lab: Modeling How Fossils Form Rocks, p. 206Lab: Gneiss RiceLab: Classify Minerals, p. 214-215Launch Lab: Finding Energy Reserves, p. 223Lab: Soaking Up Solar Energy, p. 240Lab: Home Sweet Home, p. 246
Textbook Correlation
Glencoe Science South Carolina Science Chapters 5-9
Key Concepts (Vocabulary)
Earth Layers: crust, mantle, core
Seismic waves: primary, secondary, surface
Earthquake: epicenter, seismograph
Rock types: Igneous, Sedimentary, Metamorphic
Rock cycle
Earth Resources: minerals, ores, fossil fuels
Plate Tectonics: lithospheric plates, plate boundaries
Geologic Processes: volcanic eruptions, mountain building
Geologic Imagery: aerial photography, satellite imagery, topographic maps
Literature
Ford, Brent A. (1996) Project Earth Science: Geology. Arlington, VA: NSTA PressISBN: 0-87355-131-1The main theme of this book is plate tectonics. Explanations of volcanoes, earthquakes and other geologic events are explored.Indicators: 8-3.6
Downs, Sandra (2000) Earth’s Fiery Fury. Frederick, MD: Twenty-First Century BooksISBN: 0-7613-1413-XThis book provides a good picture of the dynamic forces that constantly change our Earth. It is a good resource to teach the structure of the Earth.Indicators: 8-3.6 , 8-3.7
8-38

Johnson, Rebecca L. (2005) Plate Tectonics. Twenty-First Century Books/Lerner Publishing GroupISBN: 0-8225-3056-2This volume describes in excellent detail the chronology of the plate tectonics theory and the evidence that finally led to its acceptance. It is a superb example of the arduous journey from hypothesis to scientific theory.Indicators: 8-3.6
Maslin, Mark (2000) Restless Planet Series: Earthquakes. Chicago IL. Raintree PublishersISBN: 0-7398-1328-5This book addresses the causes of earthquakes and uses historic earthquake disasters to illustrate the magnitude of the events. Indicators: 8-3.8
Technology
Supporting Content Web Sites
The Earth’s Layers http://volcano.und.nodak.edu/vwdocs/vwlessons/lessons/Earths_layers/Earths_layers1.htmlUsing diagrams and text, this website explains the layers of Earth including relative position, density, and composition.Indicators 8-3.1
Seismic Waveshttp://aspire.cosmic-ray.org/labs/seismic/index.htmThrough animations, text, and questions, this website explains the 3 types of seismic waves.Indicators: 8-3.2
Michigan Tech UPSeishttp://www.geo.mtu.edu/UPSeis/studying.htmlThrough diagrams, illustrations, and text, this website gives information on seismographs, seismograms, and how to locate the epicenter.Indicators: 8-3.3
World of Rockshttp://www.albany.edu/dept/sisp/jjpowers/WebCollabS05/rocks/index2.htmlThis website explains the 3 large classifications of rock and using a diagram explains the rock cycle. A notes page is provided for students to use.
8-39

Indicators: 8-3.4
Mountain Maker, Earth Shakerhttp://www.pbs.org/wgbh/aso/tryit/tectonicsUsing animations, this website explains the geologic activity at the plate boundaries.Indicators: 8-3.6
Volcanoes Onlinehttp://library.thinkquest.org/17457/english.htmlThis website is designed as a tool to teach students about the structure of volcanoes, how they erupt, and the effects/advantages.Indicators: 8-3.7
The Southern California Integrated GPS Network Education Module http://scign.jpl.nasa.gov/learn/plate6.htmThrough animation and text, this website explains the various stresses that cause faults.Indicators: 8-3.7
Suggested Data Streaming Video
Earth Science: Earthquakes (ETV Streamline SC)Segments : Plate Tectonics- The Science of Earthquakes (4:20) & Fault lines and Earthquakes (3:02)This video explains how the earth’s crust floats on tectonic plates that shift and collide causing seismic activity.Indicators: 8-3.6 & 8-3.8
Earthquakes-Our Restless Planet (ETV Streamline SC) This video will show students how earthquakes are triggered by movements in the great plates that form a shell around the earth. They will better understand terms such as faults, seismic waves, focus, epicenter, magnitude and seismograph. (20:00)Indicators: 8-3.1, 8-3.2, 8-3.6
Greatest Discoveries With Bill Nye (ETV Streamline SC)Segments: Inside Our Planet: The Outer Core (3.07) and The Inner Core (3:50)This video will explain the inner and outer cores of the earth and how scientist used seismic wave to determine the internal structure of Earth.Indicators: 8-3.1 & 8-3.2
8-40

Earth Science: Rocks and Minerals (ETV Streamline SC)Segment: Introduction to Rocks and Minerals (3:18)This video clip explains how different kinds of rocks are constantly being eroded and reformed in a process called the rock cycle.Indicators: 8-3.4
Basics of Geology-Formation of Continents and Mountains (ETV Streamline SC)Segments: Lesson One-B The Structure of the Earth (2:07)Lesson Two-Mountains, Volcanoes and Earthquakes (11:12)This video clip demonstrates the dynamics of the plate tectonics theory. Concepts such as folding and buckling, subduction, volcanism, undersea mountains and earthquakes are explored.Indicators: 8-3.1, 8-3.7
Earth Science: Mapping the Earth (ETV Streamline SC)Segment: Remote Sensing: Satellites: Observe the earth from above (3:59)Satellites orbiting Earth gather visual images and measure radio waves to paint a very accurate picture of the planet.Indicators: 8-3.9
Cross Curricular Opportunities
Social Studies: SC Maps, South Carolina Mining Operations, Economic Impacts of EarthquakesChemistry, p. 139Math, p. 140
Field Trip/Related Experiences
Diamond Del’s Gem Mining Adventure, www.diamonddel.com (will come to your school)
Career ConnectionsGeologistsStudy the composition, processes, and history of the Earth. They try to find out how rocks were formed and what has happened to them since their formation. They also study the evolution of life by analyzing plant and animal fossils.
Volcanologists study the remains of either dead or dormant volcanoes, or monitor volcanoes that are dormant, but may become active or
8-41
"reawaken.” A significant portion of a volcanologist’s work is also done in the laboratory and office, analyzing rock samples,
reading and writing scientific papers, performing computer modeling of various aspects of eruptions, and interpreting the data that they have collected from the field. Basically, the goals of volcanology are to understand how and why volcanoes erupt, how to predict eruptions, their impacts on the history of the Earth and how they may affect humans and their environment. It is also important for volcanologists to be able to interpret and publish/present their findings in such a way that it is easy for the general public to understand.
Seismologists
are scientists who study earthquakes and seismic waves. They study the earth movements - like mini earthquakes - that may precede a major volcanic eruption. The Seismologist may also set up monitoring equipment near to the volcano. The seismologist is an important scientific member of the team in helping scientists predict eruptions. They may be helped in their task in predicting an eruption by the geo-chemist and others who will measure the gases from the volcano.
Big Idea – Change/ Form and FunctionEarth’s Structure and Processes
Indicator:
8-42

8-3.1 Summarize the three layers of Earth – crust, mantle, and core – on the basis of relative position, density, and composition.Taxonomy level: 2.4-B Understand Conceptual Knowledge
Essential Question(s):How would you summarize the three layers of the Earth on the basis of position, density, and composition?
Previous/future knowledge:Students in 3rd grade (3-3.5, 3-3.6) focused on Earth’s surface features, water, and land. In 5th grade (5-3.2) students illustrated Earth’s ocean floor. The physical property of density was introduced in 7th grade (7-5.9). Students have not been introduced to areas of Earth below the surface. Further study into Earth’s internal structure based on internal heat and gravitational energy is part of the content of high school Earth Science (ES-3.2).
It is essential for students to know that Earth has layers that have specific conditions and composition.
Layer Position Density CompositionCrust Outermost layer; thinnest
under the ocean, thickest under continents; crust & top of mantle called the lithosphere
Least dense layer overall; Oceanic crust (basalt) is more dense than continental crust (granite)
Solid rock – mostly silicon and oxygenOceanic crust – basalt; Continental crust - granite
Mantle Middle layer, thickest layer; top portion called the asthenosphere
Density increases with depth because of increasing pressure
Hot softened rock; contains iron and magnesium
Core Inner layer; consists of two parts – outer core and inner core
Heaviest material; most dense layer
Mostly iron and nickel; outer core – slow flowing liquid, inner core - solid
It is not essential for students to know specific depths or temperatures of the layers. Students do not need to explain the heat transfer systems within the layers.
Assessment Guidelines:The objective of this indicator is to summarize major points about the layers of Earth; therefore, the primary focus of assessment should be to generalize major points about the crust, mantle, and core of Earth. However, appropriate assessments should also require students to compare the layers;
8-43

classify by sequencing the layers using property information; or identify the layer with a certain set of properties.
8-44
Big Idea – Change/ Form and FunctionEarth’s Structure and Processes
Indicator:8-3.2 Explain how scientists use seismic waves – primary, secondary, and
surface waves – and Earth’s magnetic fields to determine the internal structure of Earth.Taxonomy level: 2.7-B Understand Conceptual Knowledge
Essential Question(s):How do scientists use scientific waves to determine the internal structure of Earth?How does the magnetic field determine internal structures?
Previous/future knowledge: Seismic waves and Earth’s magnetic fields are new material for this grade. Earth’s internal structure (8-3.1) was also new content. The understanding of waves is also part of the 8th grade indicator 8-6.1-3 and can enhance the understanding of seismic waves in this context.
It is essential for students to know that earthquakes produce three types of waves with different behaviors as they travel through materials.
Primary (P) waves Move out from the earthquake focus, the point where the energy is released Travel the fastest of the three waves Move through solid and liquid layers of Earth Push and pull rock creating a back-and-forth motion in the direction the wave is moving
(longitudinal wave)
Secondary (S) waves Move out from the earthquake focus Move slower than primary waves Can only move through solid rock Move at right angles to primary waves causing rocks to move up and down and side to
side (transverse wave)
Surface waves Form when P and S waves reach the surface Can cause the ground to shake making rock sway from side to side and roll like an ocean
wave
Scientists use the principle that the speed and direction of a seismic wave depends on the material it travels through. Because of the behavior of these different waves, scientists have indirect evidence for the solid inner core and liquid outer core of Earth; because earthquake waves travel faster through the mantle than through the crust, scientists know that the mantle is denser than the crust.
8-45

It is also essential for students to know that the movement of materials in the outer core of Earth is inferred to be the cause of Earth’s magnetic field. A compass needle will align with the lines of force of Earth’s magnetic field. Iron and nickel are metals that easily magnetize, and are inferred to be the metals in Earth’s core.
It is NOT essential for students to know how to measure an earthquake with the Richter or Mercalli scale. The study of Earth’s magnetosphere is also not necessary here.
Assessment Guidelines:The objective of this indicator is to explain how scientists use data from seismic waves andEarth’s magnetic field; therefore, the primary focus of assessment should be to construct a cause and-effect model of what data from these sources allow scientists to determine about Earth’s internal structure. However, appropriate assessments should also require students to summarize how seismic waves and magnetic field data can be used to infer what the inside of Earth looks like; interpret a diagram of seismic wave properties; compare the waves as to movement or effect on Earth material; identify a layer of Earth’s interior based on evidence presented; or recall how a compass will behave within the Earth’s magnetic field.
Big Idea – Change/ Form and Function 8-46

Earth’s Structure and Processes
Indicator:8-3.3 Infer an earthquake’s epicenter from seismographic data.
Taxonomy level: 2.5-B Understand Conceptual Knowledge
Essential Question(s): How can you locate the epicenter of an earthquake?
Previous/future knowledge: In the 3rd grade (3-3.8) students were introduced to earthquakes as a rapid process that changes Earth’s surface. In 5th grade (5-3.1) earthquakes are explained as a natural process that can have effects on both Earth’s land and oceans. The measuring of earthquake waves involving the interpretation of seismic data is a new concept for this grade. Understanding of the properties of waves as part of 8-6.3 will help students to read and interpret seismographic data.
It is essential for students to know the epicenter is the point on Earth’s surface directly above where the energy is released in an earthquake; energy that reaches the surface is greatest at this point.
The energy spreads outward in all directions as vibrations called seismic waves. Seismic waves can be measured and recorded by a seismograph.
The vibration record, called a seismogram, looks like jagged lines on paper. Measuring the time between the arrival of the P and S waves determines the distance
between the recording seismograph and the earthquake epicenter. Triangulation identifies the epicenter of an earthquake. The location of an earthquake’s
epicenter is found by plotting circles on a map from the records of three seismograph stations and finding the point where the three circles intersect.
It is NOT essential for students to determine the magnitude of an earthquake based on seismographic data.
Assessment Guidelines:The objective of this indicator is to infer an earthquake’s epicenter; therefore, the primary focus of assessment should be to draw a logical conclusion as to an earthquake’s epicenter given data from seismographs. However, appropriate assessments should also require students to recognize that a seismogram is used to determine the distance from the earthquake epicenter to the seismograph; or interpret a diagram with seismographic data plotted; or recognize how seismic waves move from the focus of the earthquake.
8-47

Big Idea – Change/ Form and FunctionEarth’s Structure and Processes
Indicator:8-3.4 Explain how igneous, metamorphic, and sedimentary rocks are
interrelated in the rock cycle.Taxonomy level: 2.7-B Understand Conceptual Knowledge
Essential Question(s):How are all rocks linked by the rock cycle?
Previous/future knowledge: Rocks were introduced in 1st grade (1-4.1,2) as materials from Earth that can be classified by their physical appearance. In 3rd grade (3-3.1) students classified rocks as sedimentary, igneous, and metamorphic based on their properties. No additional study of rocks has been done since 3rd grade. The concept of a rock cycle is new to this grade. The classification of minerals and rocks based on physical and chemical properties is part of high school Earth Science (ES-3.7)
It is essential for students to know that there are three large classifications of rocks – igneous, metamorphic, and sedimentary. Each type of rock is formed differently and can change from one type to another over time.
Igneous Forms when molten rock (magma) cools and hardens. If cooling takes place slowly beneath Earth’s surface, the igneous rock is called
intrusive. If the cooling takes place rapidly on Earth’s surface, the igneous rock is called extrusive.
Metamorphic Forms when rocks are changed into different kinds of rocks by great heat and/or pressure
– they are heated, squeezed, folded, or chemically changed by contact with hot fluids.
Sedimentary Forms from the compaction and/or cementation of rock pieces, mineral grains, or shell
fragments called sediments. Sediments are formed through the processes of weathering and erosion of rocks exposed
at Earth’s surface. Sedimentary rocks can also form from the chemical depositing of materials that were
once dissolved in water.
The rock cycle is an ongoing process. The sample diagram illustrates the series of natural processes that can change rocks from one kind to another:
8-48

It is NOT essential for students to classify individual rocks, chemical composition, or the minerals from which they are made, based on their properties.
Assessment Guidelines:The objective of this indicator is to explain the interrelationships of the three rock types; therefore, the primary focus of assessment should be to construct a cause-and-effect model about the forming of a rock based on the process(es) involved. However, appropriate assessments should also require students to interpret a rock cycle diagram; compare how rocks can be changed by particular processes; or identify a rock type by the method with which it is formed.
8-49

Big Idea – Change/ Form and FunctionEarth’s Structure and Processes
Indicator:8-3.5 Summarize the importance of minerals, ores, and fossil fuels as Earth
resources on the basis of their physical and chemical properties. Taxonomy level: 2.4-B Understand Conceptual Knowledge
Essential Question(s):How are the properties of minerals, ores, and fossil fuels useful to us?
Previous/future knowledge: In 3rd grade (3-3.2) students identified common minerals based on their properties; they also gave examples of how Earth materials were used (3-3.7). In 7th grade (7-4.6) Earth resources were classified as renewable or nonrenewable. Understanding the importance of minerals, ores, and fossil fuels based on their properties is new to this grade; ores have never been introduced.
It is essential for students to know that Earth resources (minerals, ores, and fossil fuels) have properties that make them important and useful. Properties that determine the usefulness of an ore or mineral may be identified using a chart, diagram or dichotomous key. The two types of properties are:
Physical properties; for example, hardness, luster, color, texture, the way a mineral splits, or density
Chemical properties; for example, the ability to burn, the reactivity to acids
Three common Earth resources that have importance based on their properties are:
Minerals Natural, solid materials found on Earth that are the building blocks of rock; each has a certain chemical makeup and set of properties that determine their use and value.
Ores Minerals that are mined because they contain useful metals or nonmetals.
Fossil fuels Natural fuels that come from the remains of living things; fuels give off energy when they are burned.
It is NOT essential for students to classify individual minerals for the purpose of identification, but understanding the meaning of the physical properties by examining some common minerals would be helpful.
8-50

Assessment Guidelines:The objective of this indicator is to summarize the importance of certain Earth resources; therefore, the primary focus of assessment should be to generalize major points about the importance of minerals, ores, and fossil fuels because of their physical and chemical properties. However, appropriate assessments should also require students to interpret a chart of important/useful Earth resources; exemplify Earth resources that are minerals, ores, or fossil fuels; or identify properties that would make an Earth resource important.
Big Idea – Change/ Form and Function
8-51
Earth’s Structure and Processes
Indicator:8-3.6 Explain how the theory of plate tectonics accounts for the motion of the
lithospheric plates, the geologic activities at the plate boundaries, and the changes in landform areas over geologic time.Taxonomy level: 2.7-B Understand Conceptual Knowledge
Essential Question(s):How does the theory of plate tectonics explain changes in landforms over time?
Previous/future knowledge: The theory of plate tectonics is new material for this grade.
It is essential for students to know that the theory of plate tectonics explains why and how large sections of Earth’s crust, called lithospheric plates, move. A hypothesis of continental drift was developed before the present theory of plate tectonics. It was based on continent shape, fossil evidence, rock, and climate clues. This hypothesis later led to the theory of plate tectonics when evidence was found as to why the plates could move. Plate tectonics explains how many Earth features form.
Motion of the Lithospheric Plates Plates float on the lower part of the mantle. Convection currents deep inside Earth can cause the asthenosphere to flow slowly carrying
with it the plates of the lithosphere. This movement of plates changes the sizes, shapes, and positions of Earth’s continents and
oceans.
Geologic Activities at Plate BoundariesDivergent boundary - where two plates are moving apart;
most located along mid-ocean ridge (sea-floor spreading); new crust forms because magma pushes up and hardens between
separating plates.
Convergent boundary - where two plates come together and collide; activity depends upon the types of crust that meet; more dense oceanic plate slides under less dense continental plate or
another oceanic plate – subduction zone, some crust is destroyed; two continental plates converge, both plates buckle and push up into
mountain ranges;
Transform boundary - where two plates slide past each other; 8-52
crust is neither created nor destroyed; earthquakes occur frequently along this type of boundary.
Changes in Landform areas over Geologic Time Plates move at very slow rates – from about one to ten centimeters per year; At one time in geologic history the continents were joined together in one large landmass that
was called Pangaea. As the plates continued to move and split apart, oceans were formed, landmasses collided and
split apart until the Earth’s landmasses came to be in the positions they are now; Evidence of these landmass collisions and splits comes from fossils, landform shape, features,
and rock structures, and climate change; Landmass changes can occur at hot spots within lithospheric plates; Earth’s landmasses will continue to move and change during the geologic time of the future.
It is NOT essential for students to know name specific plates, but interpreting a world map of plates with direction of motion would be helpful.
Assessment Guidelines:The objective of this indicator is to explain how the theory of plate tectonics accounts for changes in the landforms of Earth; therefore, the primary focus of assessment should be to construct a cause-and-effect model of why the plates move, what type of motion takes place as plates collide, and what changes result in the landforms of Earth. However, appropriate assessments should also require students to interpret diagrams that show varying aspects of these factors; compare the activities at plate boundaries or the shape/movement of landmasses over time; or classify a plate boundary based on the motion of plates and/or landforms that result.
8-53

Big Idea – Change/ Form and FunctionEarth’s Structure and Processes
Indicator:8-3.7 Illustrate the creation and changing of landforms that have occurred
through geologic processes (including volcanic eruptions and mountain-building forces).Taxonomy level: 2.2-B Understand Conceptual Knowledge
Essential Question(s):What affect do volcanic eruptions and mountain-building forces have on landforms?
Previous/future knowledge:
Volcanic eruptions as a natural process were introduced in 3rd grade (3-3.8). In 5th grade (5-3.1) volcanic eruptions were explained as to how they affect Earth’s oceans and land. Mountain-building forces are new to this grade as is the concept of how these processes create and change landforms. Additional crustal changes due to forces from plate tectonic activity are part of high school Earth Science (ES-3.4).
It is essential for students to know that the landforms of Earth can be changed by volcanic eruptions and mountain-building forces.
Volcanic Eruptions Volcanic eruptions are constructive in that they add new rock to existing land and form new
islands. Volcanic eruptions can be destructive when an eruption is explosive and changes the landscape of and around the volcano.
Magma from the mantle rises to Earth’s surface and flows out an opening called a vent. Magma that reaches Earth’s surface is known as lava. The vent as well as the mountain that forms around it from cooled lava, ash, cinders, and
rock is called a volcano. Most volcanoes occur along plate boundaries; an area in the Pacific Ocean where volcanoes
are common is called the Ring of Fire.
Mountain-building forces Forces, or stresses, that cause rocks to break or move are:
o Tension—forces that pull rocks aparto Compression—forces that push or squeeze rocks togethero Shearing—forces that cause rocks on either side of faults to push in opposite
directions Forces or stresses (for example, tension and compression) on rocks in the lithosphere can
cause them to bend and stretch.o This bending and stretching can produce mountain ranges.o If pressure is applied slowly, folded mountains form.
8-54

Forces or stresses (for example, tension, compression, or shearing) great enough to cause rocks to break can create faults. Faults are places in Earth where the rocks break. There are three types of faults:
o Normal fault – caused by tension forceso Reverse fault – caused by compression forceso Strike-slip fault – caused by shearing forces
If normal faults uplift a block of rock, a fault-block mountain forms.
It is NOT essential for students to know the various types of volcano cones and how they form or the landforms that result when magma fails to reach the surface. The formation of anticlines, synclines, and plateaus are not essential at this time.
Assessment Guidelines:The objective of this indicator is to illustrate the creation and changing of landforms due to volcanic eruptions and mountain-building forces; therefore, the primary focus of assessment should be to give illustrations of these concepts or use illustrations to show understanding of landforms resulting from volcanic eruptions and mountain-building forces through diagrams, pictures, and word descriptions. However, appropriate assessments should also require students to interpret diagrams that show varying aspects of these concepts; compare the various stresses and the resulting landforms; or recognize the basic components of a volcano’s structure that contribute to the creation or changes of the landscape..
Big Idea – Change/ Form and Function 8-55

Earth’s Structure and Processes
Indicator:8-3.8 Explain how earthquakes result from forces inside Earth.
Taxonomy level: 2.7-B Understand Conceptual Knowledge
Essential Question(s):What causes earthquakes?
Previous/future knowledge:
Students were introduced to earthquakes in 3rd grade (3-3.8). Further study on the effects of earthquakes continued in 5th grade (5-3.1). The explanation of earthquakes as related to internal forces within Earth is new to this grade.
It is essential for students to know that the forces and stresses (8-3.7– tension, compression, and shearing) along faults can build up as blocks of rock are pushed (compression or shearing) or pulled apart (tension). If the pressure or stress becomes too great, the rock breaks at a weak point along the fault and energy is released.
The energy spreads outward in all directions as vibrations called seismic waves. The focus of the earthquake is the point in the crust, or mantle, where energy is released. The epicenter is the point on Earth’s surface directly above the focus; energy that reaches
the surface is greatest at this point.
It is NOT essential for students to explain the magnitude or intensity of an earthquake; factors that affect the amount of damage done by an earthquake are also not necessary at this time.
Assessment Guidelines:The objective of this indicator is to explain how earthquakes result from forces inside Earth; therefore, the primary focus of assessment should be to construct a cause-and-effect mode that shows how internal forces along a fault can cause an earthquake. However, appropriate assessments should also require students to compare the focus or epicenter of an earthquake in terms of location and energy.
Big Idea – Change/ Form and Function
8-56

Earth’s Structure and Processes
Indicator:8-3.9 Identify and illustrate geologic features of South Carolina and other
regions of the world through the use of imagery (including aerial photography and satellite imagery) and topographic maps.
Taxonomy levels: 1.2-A Remember Factual Knowledge; 2.2-B Understand Conceptual Knowledge
Essential Question(s):How can you identify the geologic features of South Carolina on a map or photograph?
Previous/future knowledge: This indicator contains new conceptual material.
It is essential for students to know that geologic features on Earth can be identified and visually modeled through the use of aerial photography, satellite imagery, and topographic maps.
Imagery: Highflying aircraft and satellites high above Earth use sensors and cameras to gather
information about Earth’s landforms and resources. Computers create images from the data; scientists identify specific features by the combination
of colors and shapes that the feature makes on the satellite image.
Geologic features (for example, mountains, river & tributary flow, lakes, farmland, forests, Carolina bays, or coastal features) can be identified using South Carolina satellite images and aerial photographs, as well as other imagery from regions of the world.
Topographic maps: These are maps that use symbols to portray the land as if viewed from above. They provide information on elevation, relief, and slope of the ground surface, as well as the
location of roads, buildings, swamps, and other features, natural and man-made. Along with the scale and symbols, the contour lines and the contour interval are critical to
understanding the topographic map.
Geologic features can be identified on a topographic map using the contour lines and interval spacing as well as the symbols on the map. Students can also illustrate the geologic feature with a three-dimensional model or profile based on the topographic data.
8-57
It is NOT essential for students to know how satellite imagery and aerial photographs use the electromagnetic spectrum to capture the information.
Assessment Guidelines:One objective of this indicator is to identify features on Earth using aerial photography, satellite images, and topographic maps; therefore, the primary focus of assessment should be to locate this information on the appropriate materials. Another objective of this indicator is to illustrate geologic features found on aerial photography, satellite images, and topographic maps; therefore, the primary focus of assessment should also be to give illustrations of these concepts or use illustrations to show understanding of these materials. However, appropriate assessments should also require students to recall the shape or illustrated property of the geologic feature; to identify symbols and colors used on these images or maps; or to compare features, details, or contours on one topographic map with another in a different landform region.
GRADE 8Big Idea – Systems
Astronomy: Earth and Space Systems 8-58

Standard 8-4: The student will demonstrate an understanding of the Standard 8-4: The student will demonstrate an understanding of the characteristics, structure, and predictable motions of celestial characteristics, structure, and predictable motions of celestial bodies.bodies. (Earth Science) (approximately 7-8 weeks)
Indicators8-4.1 Summarize the characteristics and movements of objects in the solar system (including
planets, moons, asteroids, comets, and meteors).Essential Question:
What are the characteristics and movements of planets, moons, asteroids, comets, and meteors?
8-4.2 Summarize the characteristics of the surface features of the Sun: photosphere, corona, sunspots, prominences, and solar flares.Essential Question:
What are the surface features of the sun?
8-4.3 Explain how the surface features of the Sun may affect Earth.Essential Question:
How might the surface features of the Sun affect Earth?
8-4.4 Explain the motions of Earth and the Moon and the effects of these motions as they orbit the Sun (including day, year, phases of the Moon, eclipses, and tides).Essential Question(s):
How does the Earth and Moon move? What effects does this movement have as they orbit the Sun?
8-4.5 Explain how the tilt of Earth’s axis affects the length of the day and the amount of heating on Earth’s surface, thus causing the seasons of the year.Essential Question:
What are the effects of Earth’s tilt?
8-4.6 Explain how gravitational forces are influenced by mass and distance.Essential Question:
What influence do mass and distance have on gravitational forces?
8-4.7 Explain the effects of gravity on tides and planetary orbits.Essential Question:
How are tides and planetary orbits affected by gravity?
8-4.8 Explain difference between mass and weight by using the concept of gravitational force.Essential Question:
What is the difference between mass and weight?
8-59

8-4.9 Recall the Sun’s position in the universe, the shapes and composition of galaxies, and the distance measurement unit (light year) needed to identify star and galaxy locations.Essential Question(s):
Where is the Sun located in the Universe? What are the shapes and composition of galaxies?
8-4.10 Compare the purposes of the tools and the technology that scientists use to study space (including various types of telescopes, satellites, space probes, and spectroscopes).Essential Question(s):
Which tools do scientists use to study space? How does the technology of these tools help scientists learn about space?
Scientific inquiry standards and indicators should be embedded throughout standard 8-2.
Standard 8-1: The student will demonstrate an understanding of technological design and scientific inquiry, including process skills, mathematical thinking, controlled investigative design and analysis, and problem solving.
Indicators
8-1.1 Design a controlled scientific investigation.8-1.2 Recognize the importance of a systematic process for safely and accurately conducting
investigations. 8-1.3 Construct explanations and conclusions from interpretations of data obtained during a
controlled scientific investigation. 8-1.4 Generate questions for further study on the basis of prior investigations.8-1.5 Explain the importance of and requirements for replication of scientific investigations.8-1.6 Use appropriate tools and instruments (including convex lenses, plane mirrors, color filters,
prisms, and slinky springs) safely and accurately when conducting a controlled scientific investigation.
8-1.7 Use appropriate safety procedures when conducting investigations.
Big Idea - Systems
Help Page for: Astronomy
8-60

Standard 8-4: The student will demonstrate an understanding of the Standard 8-4: The student will demonstrate an understanding of the characteristics, structure, and predictable motions of celestial characteristics, structure, and predictable motions of celestial bodies.bodies. (Earth Science)
Notes:Assessments8-5.1 Compare the characteristics of the planets by creating a
model of objects in the solar system.8-5.2 Summarize the characteristics of the surface features of
the Sun.8-5.3 Explain how the surface features of the Sun may affect
Earth.8-5.4 Draw and label phases of the moon in correct order.8-5.5 Explain how the tilt of Earth’s axis causes the seasons.8-5.6 Interpret a diagram to infer whether the Sun or the Moon
has a more direct effect on Earth’s tides.8-5.7 Recognize the factors that keep planets in orbit around
the Sun.8-5.8 Compare mass and weight and infer whether an object
would be heavier or lighter based on gravitational pull.8-5.9 Recall the Sun’s position in the universe, the shapes and
composition of galaxies, and the measurement unit light year.
8-5.10 Compare the purposes of different tools and technology that scientists use to study space by creating working models.
Inquiry: Kit/Lab Connections
Science Kit: STC Earth In SpaceLessons 2-9, 11, 14-16, and 22
The following labs are from Glencoe Science South Carolina Science:Launch Lab: Model Rotation and Revolution, p.285Lab: Moon phases and Eclipses, p.301Lab: Tilt and Temperature, p.306Launch Lab: What causes ocean currents?, p.315Lab: Wave properties, p. 333Lab: Sink or Float, p. 334Launch Lab: Model Crater Formation, p. 343Lab: Planetary Orbits, p.349Lab: Solar System Distance Model, p.368Launch Lab: Why do clusters of galaxies move apart?, p.377Lab: Sunspots, p.387Lab: Measuring Parallax, p.400 8-61

Launch Lab: An Astronomer’s View, p.409Lab: Building a Reflecting Telescope, p.416Lab: Star Sightings, pp.432-433
Textbook Correlation
Glencoe Science South Carolina Science Chapters 10-14Key Concepts (Vocabulary)
Solar system: planet, moon, asteroid, comet, meteor/meteoroid/meteorite
Sun: photosphere, corona, sunspots, prominences, solar flares, solar wind, auroras
Movements: revolution, rotation, day, axis, year, seasons, equinox, elliptical orbit
Moon: phases of the Moon, eclipses, solar eclipse, lunar eclipse, tides, spring tide, neap tide
Gravity: mass, weight
Galaxies: elliptical, spiral, irregular, light year
Tools: telescopes, satellites, space probes, spectroscopes
Literature
Nardo, D. (2003). The Lucent library of science and technology-comets and asteroids. Chicago, IL: Lucent Books. ISBN: 1590182863Lexile: not availableSummarizes how comets were formed, outlines their shapes, sizes, and orbits and explains the danger of a potential impact with Earth. The text also discusses several space flights that have collected data from comets and asteroids.8-4.1, 8-4.10
Ride, S. & O’Shaughnessy, T. (2003). Exploring our solar system. New York, NY: Crown Books.ISBN: 0375812040Lexile: not availablePhotographs and satellite imagery illustrate a journey that begins at the sun and moves past each of the planets. Graphics and charts are used to outline the physical characteristics of each planet, while the accompanying discussion by astronaut Sally Ride compares how the planets were formed, what surface conditions are like, and the probability of finding life on each one.
8-62

8-4.1, 8-4.2
Jackson, E. (2002). Looking for life in the universe. Boston, MA: Houghton Mifflin.ISBN 0618128948Lexile: not available An intriguing look at cutting-edge space science from the viewpoint of Jill Tartar, an astrophysicist at the SETI institute. Includes a pictorial daily journal of the work of a SETI researcher and an in-depth discussion of how a radio telescope is used to collect information from deep space. 8-4.10
Spangenburg, R. & Moser, K. (2001). A look at the sun. New York, NY: Franklin Watts.ISBN: 0531165655Lexile: 1180A detailed summary of the structural components of the sun as provided by evidence from solar probes. Includes a discussion of the impact of the Sun on Earth including providing energy for photosynthesis and creating disturbances of communication systems.8-4.2, 8-4.3, 8-4.10
Carruthers, M. W. (2003). The moon. New York, NY: Franklin Watts.ISBN: 0531163733Lexile: 1040Summarizes what we know about the moon from observations made on Earth and evidence collected during space missions with a special emphasis on the geology and landforms of the Moon’s surface in comparison to that of Earth. Includes a discussion of phases of the moon, lunar eclipses, and gravity.8-4.1, 8-4.6, 8-4.7, 8-4.8
Kerrod, R. (2002). The far planets. Austin, TX: Raintree Steck-Vaughn.ISBN: 0739828207Lexile: not availableCombining this book with The Near Planets (ISBN: 0739828193), which is also a part of this Exploring the Universe Series, would provide a comprehensive comparison of the atmospheric and surface characteristics of the planets.8-4.1
Dickinson, T. (1998). Nightwatch: a practical guide to viewing the universe. Ontario, Canada: Firefly Books.ISBN: 1552093026 8-63

Lexile: not availableConsidered to be one of the best nighttime field guides for the beginning sky-watcher, the photographs in this book were actually taken by amateur astronomers.8-4.1, 8-4.10
Bond, P. (1999). DK Guide to space: a photographic journey through the universe. New York, NY: DK Publishing. ISBN: 0-7894-3946-8Lexile: not availableTwo-page layouts include images from the Hubble Telescope and other space probes to give an illustration of the physical characteristics of the Sun, the Moon, planets, comets, and galaxies. The photographs are accompanied by detailed captions and descriptive text. Also includes images and explanation of a solar eclipse.8-4.1, 8-4.4
Scott, E. (1994). Close encounters: exploring the universe with the Hubble Space Telescope. New York: Hyperion Books. ISBN: 0786801476Lexile: not availableImages from the Hubble Space Telescope are accompanied by engaging narration of the significance of the images. Includes encounters with Mars, Venus, and Saturn as well as the deepest view we have of outer space.8-4.1, 8-4.10
Miller, R. (2005). Stars and galaxies (worlds beyond). Breckenridge CO: Twenty-First Century Books.ISBN: 0761334661Lexile: not availableThough the first chapters discuss characteristics and life cycles of stars which are beyond the scope of the standards, chapters six and seven provide excellent information about The Milky Way and other galaxies.8-4.9
Technology
Supporting Content Web Sites
Solar and Heliospheric Observatory (SOHO)http://sohowww.nascom.nasa.gov/Provides the most recent images of the Sun as well as an extensive archive of information and animations about solar
8-64
phenomenon. Includes images of flares, prominences, eclipses, and sunspots.8-4.2, 8-4.3, 8-4.4
NASA Astronomy Picture of the Dayhttp://antwrp.gsfc.nasa.gov/apod/astropix.htmlA daily image from a satellite, telescope, or observatory that is accompanied by an astronomer’s description of the significance of the picture. There is an extensive archive of previous entries and each image is hyperlinked to additional related images.8-4.1, 8-4.10
NASA Jet Propulsion Laboratory: Welcome to the Planetshttp://pds.jpl.nasa.gov/planets/welcome.htmProvides factual information for each planet and some smaller bodies with details about the exploratory missions that have provided the information. Also includes a gallery of images for each artifact collected during recent expeditions.8-4.1, 8-4.10
University Corporation for Atmospheric Research: Windows to the Universe Solar System Newshttp://www.windows.ucar.edu/tour/link=/headline_universe/solar_system/solar_system.htmlAn extensive collection of links to news articles and press releases about recent space expeditions including those of the most recent space probes. Hyperlinked terms will reveal additional information about shuttle missions, probes, satellites and telescopes.8-4.10 AmazingSpace Online Explorationshttp://amazing-space.stsci.edu/resources/explorations/Home page for nine on-line explorations and interactive games that include Galaxies Galore, Galaxy Hunter, Build a Comet, Comet Facts, Myths, and Legends, Planet Impact, and Telescopes from the Ground Up. 8-4.1, 8-4.9, 8-4.10
AmazingSpace Comparison of Galaxieshttp://amazing-space.stsci.edu/resources/organizers/galaxy.php.p=Astronomy+basics%40%2Ceds%2Castronomy-basics.php&a=%2CedsGraphic organizer that compares spiral, elliptical, and irregular galaxies.8-4.9
Nova Online: To the Moon Lunar Puzzlers 8-65
http://www.pbs.org/wgbh/nova/tothemoon/puzzlers.htmlInteractive site showing an animation of the relationship of the motion of the Moon relative to the Earth. Includes an explanation of the lunar calendar and phases of the moon.8-4.4Nova Online: Sinking City of Venice What Causes the Tides?http://www.pbs.org/wgbh/nova/venice/tides.htmlWhat Causes the Tides is an animation of the Sun-Earth-Moon system that illustrates the effect of gravity on tides, the relationship between distance, mass, and gravity, and a comparison of tides during different phases of the moon. Tidal Anomalies provides explanations of single high tides, neap tides, and time lags.8-4.4, 8-4.6, 8-4.7
Atlas of the Universehttp://www.anzwers.org/free/universe/This universal equivalent of Mapquest provides multiple representations of the universe at various light-years from our Sun. Each frame is 10-20 times farther out than the preceding one.8-4.9
Suggested Streamline Video Resources
Physical Science: Forces and GravityGravity in SpaceETV Streamline SCBegins with a comparison of the gravity on Earth and on the Moon, and then describes the role of gravity in keeping moons and planets in their orbits. Summarizes the process of launching rockets, satellites, and probes into space by controlling the balance of forces, and then illustrates how probes are sent farther into space using the gravitational pull of other planets.(3:54)8-4.6, 8-4.7, 8-4.8, 8-4.10
A Spin Around the Solar System: How the Solar System WorksGravity and InertiaETV Streamline SCColorful, animated graphics illustrate the combined effect of mass and distance on the force of gravity between the Sun and its planets, the effect of gravity and inertia on the orbit of planets around the Sun, and the role of inertia in keeping the planets spinning on their axes.
8-66

(2:01)8-4.6, 8-4.7
Basics of Physics: Exploring GravityMass and Weight ETV Streamline SCSegment one very clearly compares mass to weight using both video from lunar expeditions and graphic animations. (2:07) 8-4.8
What’s Out There? Our Solar System and BeyondThe SunETV Streamline SCProvides video of the major features of the sun including the corona during an eclipse and solar prominences. Discusses the elliptical orbits of the planets around the Sun and the role of gravity in creating those orbits.(2:38)8-4.2
What’s Out There? Our Solar System and BeyondThe Inner PlanetsETV Streamline SCDescribes the characteristics of each of the outer planets using entire and composite photographs taken during space exploration missions and computer animations and simuations. (10:04)8-4.1
What’s Out There? Our Solar System and BeyondThe Outer PlanetsETV Streamline SCDescribes the characteristics of each of the outer planets using entire and composite photographs taken during space exploration missions and computer animations and simulations.(10:17)8-4.1, 8-4.10
What’s Out There? Our Solar System and BeyondOther Heavenly Bodies: Asteroids, Meteors, and CometsETV Streamline SCAnimated comparison of the composition of the smaller heavenly bodies including facts about Galileo’s encounter with the asteroid Gaspar and the collision of comet Shoemaker Levy with Jupiter.(2:16)
8-67

8-4.1, 8-4.10
What’s Out There? Our Solar System and BeyondOther Galaxies, Other Planets: Are We Alone?ETV Streamline SCDiscusses the future of space exploration and recent expeditions including the Hubble Telescope. (2:55) 8-4.10
A Spin Around the Solar System: Moon DanceThe Moon and TidesETV Streamline SCSummarizes the role of the Moon in producing Earth’s tides with animations to clearly illustrate the rise and fall of the tides. (4:00)8-4.4
Exploring Weather: The Atmosphere in MotionThe Sun and WeatherETV Streamline SCExplains the effect of the Sun’s energy on the surface of the Earth and ability of different earth materials to absorb or reflect that heat. The second half of the segment summarizes how the tilt of the Earth creates the seasons of the year.(6:48)8-4.3, 8-4.5
Cross Curricular Opportunities
Journal, p.293,346,397,413Math, (Calculating distances, mass, weight, density, light years) p.319,324,354,355,367,393,415,418,424,431Social Studies (Calendars, NASA History, Politics)Language Arts: Greek Mythology
Field Trip/Related Experiences
Challenger Learning Center, Columbia, SCRoper Mountain Center Planetarium, Greenville, SCUniversity of South Carolina Planetarium, Columbia, SCSC State Museum Planetarium, Columbia, SC
8-68

Career Connections:
Aerospace engineerAerospace engineers design, construct, and test aircraft, aerospace vehicles, and propulsion systems. They research, develop and test new materials, engines, body shapes, and structures that could lead to an increase in speed and strength of planes, jets, helicopters, gliders, missiles, and spacecraft.
Planetarium director/educatorPlanetarium directors use their degree in astronomy to write and produce planetarium programs to educate the community about phenomenon related to space science. They maintain and operate specialized computer and presentation equipment and serve as the community media contact when remarkable events in space occur.
AstrogeologistAstrogeologists study the origin, history, composition, and structure of planets and other celestial bodies. They must be knowledgeable in chemistry, physics, math, biology, and astronomy to analyze data and specimens. Most of their work is done on a computer and not in the field.
Payload SpecialistPayload specialists are assigned to a space mission to oversee a specific research project or mechanical task in their field of expertise. The specialist is not necessarily a professional astronaut, but has general knowledge of astronomy and space exploration and trains with the astronauts in order to be physically prepared for the mission.
Science journalistScience journalists with a degree in astronomy or earth science report on space missions and significant discoveries or events in space for magazines, newspapers, radio and television. They require strong oral and written communication skills.
Big Idea – Systems 8-69

Astronomy: Earth and Space Systems
Indicator:8-4.1 Summarize the characteristics and movements of objects in the solar
system (including planets, moons, asteroids, comets, and meteors).Taxonomy level: 2.4-B Understand Conceptual Knowledge
Essential Question(s):What are the characteristics and movements of planets?
Previous/future knowledge: Most of these objects in the solar system are being dealt with for the first time. Students in 4th grade (4-3.1) have studied Earth as one of the planets that revolve around the Sun. Revolution and rotation as movements have also been studied (4-3.4,5). They have compared the characteristics of planet Earth to the Sun and to Earth’s moon (4-3.2). No other planets or moons have been studied. A complete study of the properties of the Moon that make it unique among other moons in the solar system is studied in high school Earth Science (ES-2.2).
It is essential for students to know that objects that are found in the solar system have characteristics based on surface features and atmosphere (if there is one). These objects have movement, usually some type of orbit/revolution and possibly rotation also.
Planets Planets may have a terrestrial or rocky surface or a gaseous surface. Gaseous planets are
considerably larger than terrestrial planets. Planets may have rings. Some planets have a unique surface characteristic, for example
color or an atmospheric storm. Movement of planets is based on revolution around the Sun and rotation on the planet’s axis.
Moons Moons are studied in relation to the planet they orbit. Not all planets have moons. Most are rocky bodies covered with craters, but some have unique characteristics. Movement of moons is based on revolution around their planets.
Asteroids Most asteroids are rocky bodies that orbit in a region in the solar system known as the
asteroid belt between Mars and Jupiter. They vary in size and shape. Movement is based on their revolution around the Sun. Some asteroids outside the asteroid belt have orbits that cross Earth’s orbit; scientists
monitor the positions of these asteroids.
Comets
8-70

Comets have a main body or head (ices of water, methane and ammonia and dust) and a tail that emerges as the comet gets closer to the Sun during its orbit.
The tail always points away from the Sun. Comets have unique long, narrow elliptical orbit.
Meteoroids Meteoroids are chunks of rock that move about within the solar system. Location and movement result in the different terms:
o Meteor – when the chunk of rock burns up in a planet’s atmosphere; oro Meteorite – when the chunk of rock strikes the surface of a planet or moon.
It is NOT essential for students to know specific data about each planet, for example, exact distance from the Sun, time of revolution or rotation or the diameter. Students do not need to identify the names of or number of moons a planet has.
Assessment Guidelines:The objective of this indicator is to summarize the characteristics and movements of objects in the solar system; therefore, the primary focus of assessment should be to generalize major points about characteristics and movements of planets, moons, asteroids, comets and meteors.However, appropriate assessments should also require students to interpret a diagram of the objects in the solar system; compare objects in the solar system; classify objects in the solar system based on characteristics; classify by sequencing planets in order from the Sun or by size; or identify an object in the solar system based on its unique characteristics or movements.
Big Idea - Systems Astronomy: Earth and Space Systems
Indicator:
8-71

8-4.2 Summarize the characteristics of the surface features of the Sun: photosphere, corona, sunspots, prominences, and solar flares.Taxonomy level: 2.4-A, B Understand Factual & Conceptual Knowledge
Essential Question(s):What are the surface features of the Sun?
Previous/future knowledge: In the 1st grade (1-3.1) the Sun was a feature in the daytime sky. In 4th grade (4-3.2) the Sun, a star, is compared to Earth. Studying nuclear fusion in stars and the formation of elements from that fusion is part of high school Earth Science (ES-2.4).
It is essential for students to know the characteristics of the surface features of the Sun. The Sun’s atmosphere includes the photosphere and the corona:
The photosphere emits light and is the most prominent layer of the Sun’s atmosphere. During a total eclipse when the photosphere is blocked, the corona, the outer layer of the Sun’s
atmosphere that looks like a white halo, can be seen.
Other features on or above the Sun’s surface are sunspots, prominences, and solar flares. Sunspots are areas of gas on the sun that are cooler than the surrounding gases and therefore do
not give off as much light and appear as dark spots on the photosphere. Prominences are huge, looping eruptions of gas, usually near sunspots, that arch out from the
photosphere into the outer layers of the Sun’s atmosphere. Solar flares are explosions of hot gas that occur when prominences connect. They shoot from
the Sun’s surface releasing tremendous amounts of energy into space.
It is NOT essential for students to know the layers of the Sun’s interior, nor the specific temperature data of the Sun’s layers. The nuclear fusion process that releases the light and heat does not need to be explained. Since the chromosphere is so seldom visible, it is not being dealt with in this indicator.
Assessment Guidelines:The objective of this indicator is to summarize major points about the characteristics of the surface features of the sun; therefore, the primary focus of assessment should be to generalize major points about these characteristics (including photosphere, corona, sunspots, prominences, and solar flares). However, appropriate assessments should also require students to interpret a diagram containing these features; compare these features; or identify the feature based on its unique characteristics.
8-72

Big Idea - SystemsAstronomy: Earth and Space Systems
Indicator:8-4.3 Explain how the surface features of the Sun may affect Earth.
Taxonomy level: 2.7-B Understand Conceptual Knowledge
Essential Question(s):How might the surface features of the Sun affect Earth?
Previous/future knowledge: In 1st grade (1-3.2) the Sun is recognized as the source of light and heat on Earth. In 4th grade (4-3.3,4) students also explained the Sun’s affects on Earth and relate heat and light to seasons.
It is essential for students to know that: The Sun’s photosphere radiates light and heat from its surface and some of it reaches Earth. The corona sends out electrically charged particles, called solar wind. Most of these particles
do not reach Earth’s surface because of the atmosphere and the magnetic field around Earth. Near the poles, the auroras can form when these particles cause gases in the atmosphere to
glow. Solar flares and prominences increase the particles in the solar wind that in turn affect magnetic
storms in Earth’s atmosphere. Magnetic storms often disrupt radio, telephone, and television signals.
It is NOT essential for students to know the entire spectrum of radiation that comes from the Sun, or the theories of the effects of sunspot activity on Earth’s climate over time.
Assessment Guidelines:The objective of this indicator is to explain how the surface features of the Sun may affect Earth; therefore, the primary focus of assessment should be to construct a cause-and-effect model of the various solar features on Earth. However, appropriate assessments should also require students to infer a solar feature based on a description of an event on Earth; or recognize terms that would identify a particular cause or effect.
8-73

Big Idea - SystemsAstronomy: Earth and Space Systems
Indicator:8-4.4 Explain the motions of Earth and the Moon and the effects of these
motions as they orbit the Sun (including day, year, phases of the Moon, eclipses, and tides).Taxonomy level: 2.7-B Understand Conceptual Knowledge
Essential Question(s):How do the Earth and Moon move?What effects does this movement have as they orbit the Sun?
Previous/future knowledge:Eclipses are a new concept to the content at this grade level. In 4th grade (4-3.5), students explained the effects of the rotation of Earth. The effect on the length of a shadow based on the position of the Sun in the sky during the day was studied in 4th grade (4-3.7). In 1st grade (1-3.4), the patterns of change in the Moons appearance were illustrated but not related to motion. In 4th grade (4-3.6), students illustrated the phases of the Moon and the effect of the Moon on tides but not the Sun’s effect.
It is essential for students to know that Earth and the Moon both revolve and rotate and these motions have effects that can be observed on Earth.
Day A day is based on the 24 hours it takes Earth to rotate. Earth rotates on its axis counterclockwise from west to east; as a result, the Sun appears to
rise in the east and set in the west.
Year A year is based on the 365¼ days it takes Earth to revolve around the Sun. Earth revolves around the Sun in an elliptical orbit.
Lunar Movement The Moon revolves with Earth around the Sun as the Moon is revolving around Earth. The Moon revolves around Earth in 29½ Earth days. Similarly to Earth, as the Moon revolves, it is rotating or spinning on its axis. The rotation time for the Moon is a little over 27 Earth days. Because the Moon rotates and revolves in nearly the same amount of time, the same side of
the Moon always faces Earth.
Phases of the Moon As the position of the Moon changes as it revolves around Earth, the observations of the Moon from Earth are seen as phases (new moon, waxing crescent, first quarter, waxing
gibbous, full moon, waning gibbous, third quarter, waning crescent) 8-74

The cause of the phases of the Moon depends on how much of the sunlit side of the Moon faces Earth.
Eclipses Eclipses of the Sun and Moon are a result of an alignment of Earth, Sun, and Moon. A solar eclipse occurs when the Moon is directly in-between the Sun and Earth, blocking the Sun’s light casting a shadow over a certain area on Earth. A lunar eclipse occurs when Earth is directly in-between the Sun and the Moon, blocking
the Sun’s light so that Earth’s shadow hits the Moon casting a shadow over the Moon.
Tides Tides are changes in the surface levels of Earth’s ocean water caused by the effects of the
Moon’s and Sun’s gravity on Earth. The effects of tides are most noticeable along ocean shorelines.
As the Moon orbits Earth, the waters of Earth closest to the Moon bulge outward toward the Moon; this bulge is the high tide. Another high tide occurs on the opposite side of Earth. Low tides occur in the areas between the two high tides. When the Sun and the Moon are aligned the high tides are higher and the low tides are
lower; these are called spring tides. When the Sun and the Moon are at right angles to each other, the high and low tides, there is the least difference in the tidal range at the shore; these tides are called neap tides.
It is NOT essential for students to know the various calendars that result from interpretation of Earth’s day and year or the lunar cycle calendars, or about time zones around Earth.
Assessment Guidelines:The objective of this indicator is to explain the motions of Earth and the Moon and the effects of these motions as they orbit the Sun; therefore, the primary focus of assessment should be to construct a cause-and-effect model of Earth and lunar movements with their results. However, appropriate assessments should also require students to interpret diagrams of the movements or the effects that result from the movement; illustrate the phases of the moon in sequence; or identify periods of time related to Earth or lunar movements.
Big Idea - Systems Astronomy: Earth and Space Systems
8-75

Indicator:8-4.5 Explain how the tilt of Earth’s axis affects the length of the day and the
amount of heating on Earth’s surface, thus causing the seasons of the year.Taxonomy level: 2.7-B Understand Conceptual Knowledge
Essential Question(s):What are the effects of Earth’s tilt?
Previous/future knowledge: In 4th grade (4-3.4), students explained how the tilt of Earth’s axis and revolution around the Sun resulted in seasons, but not the effect of direct or indirect rays of the Sun on the amount of heating that takes place.
It is essential for students to know that: The angle of the Sun’s rays due to the position of Earth in its orbit, the tilt of Earth’s axis, and the number of daylight hours causes the differences in the seasons.
The number of daylight hours changes throughout the year because as Earth revolves around the Sun, the tilt of its axis (23½ degrees) determines the amount of time that the Sun is shining on that portion of Earth. The tilt remains at the same angle and points at the same direction as Earth revolves around the Sun.
If the tilt of Earth is toward the Sun, there is a longer length of day, the season is summer. If it is neither tilted toward or away from the Sun, the length of day and night is equal, the season is fall and spring. If the tilt of Earth is away from the Sun, there is a shorter length of day, the season is winter.
Earth has seasons because its axis is tilted in the same direction as it moves around the Sun not because of any distance difference between the Sun and Earth.
The combination of direct rays from the Sun that strike Earth at higher angles (closer to 90 degrees) and more daylight hours causes the hemisphere of Earth tilted toward the Sun to have warmer temperatures.
The combination of indirect rays from the Sun that strike Earth at lower angles and less hours of daylight in the hemisphere of Earth angled away from the Sun have cooler temperatures.
The day when the tilt of Earth causes the length of day to be the longest or the shortest, a solstice occurs. This is the start of summer and winter.
The day when the tilt of Earth causes the length of day and night to be equal, an equinox occurs. This is the start of spring and autumn.
NOTE TO TEACHER: Students may have a misconception about the distance between Earth and the Sun causing Earth to be warmer or cooler since their experiences have shown them that the closer something is to a heat source the warmer/hotter it gets. This is not the case with seasons on Earth.
It is NOT essential for students to know the specific dates that each season begins. Students might discuss the height of the Sun above the horizon at various seasons of the year, but it is not essential to this indicator.
8-76

Assessment Guidelines:The objective of this indicator is to explain the tilt of Earth’s axis affects the length of the day and the amount of heating on Earth’s surface, thus causing the seasons; therefore, the primary focus of assessment should be to construct a cause-and-effect model of how Earth’s tilt results in varied daylight hours and unequal heating of Earth’s hemispheres and seasonal change.However, appropriate assessments should also require students to interpret diagrams of unequal heating resulting from the tilt; illustrate the position of Earth with its tilted axis at various seasons; or recall when solstices and equinoxes occur.
Big Idea - Systems Astronomy: Earth and Space Systems
Indicator:8-4.6 Explain how gravitational forces are influenced by mass and distance.
Taxonomy level: 2.7-B Understand Conceptual Knowledge
8-77

Essential Question(s):What influence do mass and distance have on gravitational forces?
Previous/future knowledge:
The pull of gravity and its effect on motion was introduced in 3rd grade (3-5.4). In 5th grade (5-5.1) students will identify gravity as a force that affects motion. High school Physical Science and Physics classes continue the study of gravity as related to acceleration, projectile motion, and gravitational potential energy.
It is essential for students to know that the force of gravity is a pull between all objects in the universe. This force is influenced by the mass of the objects and the distance between them.
A more massive object has the greater pull on the less massive objects; the Sun being most massive object in the solar system has the greatest pull on objects, like planets, in the solar system.
The closer the distance between objects the greater the pull; the Moon has a greater effect on Earth’s tides than the Sun because it is closer to Earth.
These two factors of gravitational force have numerous applications on motions of celestial bodies, for example the gravitational pull between the Sun and the planets and between Earth and its Moon cause distinct motions between and among these bodies (8-4.7).
It is NOT essential for students to know the inverse square law relationship of gravity to distance or mass. The concept of acceleration due to gravity is also not essential to the indicator.
Assessment Guidelines:The objective of this indicator is to explain how gravitational forces are influenced by mass and distance; therefore, the primary focus of assessment should be to construct a cause-and-effect model of objects varying these factors. However, appropriate assessments should also require students to interpret diagrams that show varying aspects of these factors; or infer how a change in one factor would change the force of gravity.
Big Idea - SystemsAstronomy: Earth and Space Systems
Indicator:8-4.7 Explain the effects of gravity on tides and planetary orbits.
Taxonomy level: 2.7-B Understand Conceptual Knowledge
Essential Question: 8-78
How are tides and planetary orbits affected by gravity?
Previous/future knowledge:
Tides as an effect of the Moon was illustrated in 4th grade (4-3.6), but being an effect of the pull of gravity is new conceptual material. Gravity effecting planetary orbits is a new concept in this grade. High school Earth Science students will study further the effect of gravity on the formation and shapes of galaxies (ES-2.8).
It is essential for students to know that tides and planetary orbits are caused by the pull of gravity.
Effects of Gravity on Tides The Moon being closer to Earth than the Sun (distance) has the greatest pulling
effect on tides, the rise and fall of ocean water in this case. The Sun also pulls on Earth and
o can combine its force with the Moon causing even higher tides, spring tideso or can be a right angles, pulling against the Moon’s pull, causing very little
tidal change, neap tides.Effects of Gravity on Planetary Orbits
The Sun’s gravitational attraction, along with the planet’s inertia (continual forward motion) keeps the planets moving in elliptical orbits (Earth’s orbit is slightly oval) and determines how fast they orbit.
Planets nearer the Sun move/orbit faster than planets farther from the Sun because the gravitational attraction is greater.
When a planet is farther from the Sun, the gravitational attraction between them decreases and the planet moves/orbits slower.
It is NOT essential for students to know how gravitational force causes the high tides on both sides of Earth, or how to produce an elliptical orbit using two foci.
Assessment Guidelines:The objective of this indicator is to explain the effects of gravity’s pull on tides and planetary orbits; therefore, the primary focus of assessment should be to construct a cause-and-effect model that varies the effect of the pull of gravity in different ways. However, appropriate assessments should also require students to interpret diagrams that show varying aspects of tidal pull or planetary orbits; infer how a change in the force of gravity would change other factors; or recognize the factors that keep planets in orbit around the Sun.
8-79

Big Idea - SystemsAstronomy: Earth and Space Systems
Indicator:8-4.8 Explain difference between mass and weight by using the concept of
gravitational force.Taxonomy level: 2.7-B Understand Conceptual Knowledge
Essential Question(s):What is the difference between mass and weight using gravitational force?
Previous/future knowledge:
Students were introduced to the use of a balance for measuring mass (2-1.2, and also in math), and mass as a property of solids and liquids (2-4.1), in 2nd grade. The use of the spring scale was introduced in 6th grade (6-1.1). This concept of the difference between mass and weight, although they are related, is new to this grade. Students may come with a misconception that they are the same since instruction in previous grades has dealt with objects on Earth where there is very little difference noted in the measurement of mass and weight and the standard English units are the same.
It is essential for students to know that the concept of gravitational force can be used to explain the difference between mass and weight.
Mass Mass is the amount of matter in an object; it does not depend on forces acting on it. Mass is the same no matter where the object is located as long as the object does not
gain or lose any of its matter. An object that has mass can be pulled on by gravitational force. Mass is measured on a balance.
Weight Weight is a measure of the pull of gravity on an object. Weight is related to mass but they are not the same. Weight on Earth is based on the pull of gravity toward the center of Earth. Weight can change on Earth since the pull of gravity is not the same everywhere. Weight is measured using a spring scale. Weight can change if an object is located on another object in space, for example, the
Moon or Mars. The mass of that larger object determines the pull of gravity and therefore the weight
of the object. Weight may change due to the change in gravitational force, but mass stays the
same.It is NOT essential for students to calculate weight differences between an object on Earth and the Moon, or convert mass in kilograms to weight in newtons.
8-80

Assessment Guidelines:The objective of this indicator is to explain the difference between mass and weight using the concept of gravitational force; therefore, the primary focus of assessment should be to construct a cause-and-effect model that shows how gravitational force affects mass and weight but makes them different. However, appropriate assessments should also require students to compare mass and weight; or infer whether an object would be heavier or lighter based on gravitational pull.
8-81

Big Idea - SystemsAstronomy: Earth and Space Systems
Indicator:8-4.9 Recall the Sun’s position in the universe, the shapes and composition of
galaxies, and the distance measurement unit (light year) needed to identify star and galaxy locations.Taxonomy level: 1.2-A Remember Factual Knowledge
Essential Question(s):Where is the Sun located in the Universe?
What are the shapes and composition of galaxies?
What measurement is used to identify stars and galaxies?
Previous/future knowledge:
This indicator contains new conceptual material. Students will expand on this knowledge in high school Earth Science as they then develop understanding of the classifications of stars (ES-2.5), the life cycle of stars (ES-2.7), and how gravity and motion affect the formation and shapes of galaxies (ES-2.8).
It is essential for students to know that: The Sun is a star in the Milky Way galaxy located in a spiral arm about two-thirds of the
way from the center of the galaxy.
Galaxies are made up of billions of stars and have different shapes – o elliptical – spherical or flattened disks, o spiral – a nucleus of bright stars and two or more spiral arms, or o irregular – no definite shape.
Because distances in space are so great that conventional numbers are too large to work with, astronomers use a unit of measurement called light year to measure the distance to stars and galaxies in space. The distance in one light year is equal to the distance light travel in one year.
NOTE TO TEACHER: Students may come with a misconception that the Milky Way galaxy is in the solar system because they may have seen the band of stars in the night sky. The relationship between objects within the solar system and those out in the universe is an important concept to form accurately at this time.
It is NOT essential for students to know other characteristics of the Milky Way galaxy, or how galaxies came to have their shapes, or the characteristics of the stars in the various galaxies. The study of stars, their magnitudes, classifications and life cycle, is not included with this 8-82

indicator. Using the measurement, astronomical unit, and parallax to determine distances in space is also not necessary.
Assessment Guidelines:The objective of this indicator is to recall the Sun’s position in the universe, the shapes and composition of galaxies, and the measurement unit light year; therefore, the primary focus of assessment should be to remember what is needed to identify star and galaxy locations.However, appropriate assessments should also require students to identify the name of Earth’s galaxy or the meaning of light year.
8-83
Big Idea - SystemsAstronomy: Earth and Space Systems
Indicator:8-4.10 Compare the purposes of the tools and the technology that scientists
use to study space (including various types of telescopes, satellites, space probes, and spectroscopes).
Taxonomy level: 2.6-B Understand Conceptual Knowledge
Essential Question(s):Which tools do scientists use to study space?
How does the technology of these tools help scientists learn about space?
Previous/future knowledge:
This indicator is mostly new material for this grade. Only, the purpose of telescopes, in general, as a tool of astronomy is recognized in 4th grade (4-3.8).
It is essential for students to know that astronomers use telescopes, satellites, space probes, and spectroscopes to make observations and collect data about objects in the solar system and outside of the solar system. These tools and the associated technology that allow astronomers to analyze and interpret the data help scientists learn about Earth and about the universe.
Telescopes
Refracting and reflecting optical telescopes collect visible light, then use convex lenses or mirrors to focus the light producing larger, brighter images of distant objects in space.
Radio telescopes receive radio waves emitted from objects in space, including from very distant stars and galaxies; it can receive information in any weather and during day or night.
Other telescopes “read” infrared or x-ray signals but have to be placed where Earth’s atmosphere does not block or absorb the signals.
Satellites Satellites are placed in orbit around Earth with special instruments and telescopes
that collect information from space which is sent back to Earth where it is interpreted.
Data gathered from satellites are not hampered by Earth’s atmosphere.
Space Probes
8-84

Space probes contain instruments to collect data and travel out of Earth’s orbit to explore places that would be too dangerous for astronomers; the instruments that a probe contains depends upon the space mission.
Spectroscopes
Spectroscopes collect the light from distant stars and separate that light into bands of different colors; by studying these bands, astronomers identify the elements in a star.
It is NOT essential for students to know how the light waves are refracted and reflected within each optical telescope. The names of telescopes, satellites, or space probe missions are not necessary.
Assessment Guidelines:The objective of this indicator is to compare the purposes of the tools and technology used to study space; therefore, the primary focus of assessment should be to detect similarities and differences between various types of telescopes, satellites, space probes, and spectroscopes.However, appropriate assessments should also require students to identify a tool based on a given purpose; compare optical telescopes to a radio telescope; illustrate the uses of different tools and technology: or recognize the appropriate tool or technology required for a particular task.
Big Idea – Change/ Form and Function 8-85
Help Page for: Force and Motion
Standard 8-5: The student will demonstrate an understanding of the effects of forces on the motion of an object. (Physical Science)
Notes:Assessments
8-5.1 Match a data table with its appropriate motion graph.8-5.2 Recall the formula for average speed and use it to solve
real-world problems.8-5.3 Analyze the effects of gravity and friction on the speed
and direction of objects.8-5.4 Predict how varying the amount of force or mass will
affect the motion of an object.8-5.5 Analyze the effects of balanced and unbalanced forces
on the magnitude and direction of moving objects.8-5.6 Summarize the concept of inertia and recall the meaning
of inertia.
Inquiry: Kit/Lab Connections
Science Kit: FOSS Forces and MotionInvestigation 2, parts 1-3Investigation 6, parts 1-2
Have students work in groups to design their own scientific investigations involving the calculation of average speed, and then present their findings to the class.
The following labs are from Glencoe Science South Carolina Science:Launch Lab, p.443, p.471Speed of a Swimmer, p.446Measuring Average Speed, p.447Collisions, p.461Observing Friction, p.476Balloon Races, p. 491
Textbook Correlation
Glencoe Science South Carolina Science Chapters 15 and 16
Key Concepts (Vocabulary)
8-86

Motion: motion, position, reference point, direction, speed, time-distance graph,
Average speed: v=d/t, total distance, total time, real-world problems
Effect of Forces: gravity, friction, force, mass, magnitude, balanced and unbalanced forces
Inertia
Literature
Macaulay, D. (2000). Building big. Boston, MA: Houghton Mifflin.ISBN: 0395963311Lexile: In this celebration of engineering, detailed, labeled cut-away drawings illustrate the forces that architects and engineers must consider when designing and building large structures such as domes, bridges, skyscrapers, tunnels, and dams. The examples used are actual structures such as the Hoover Dam, the Channel Tunnel, and the Golden Gate Bridge.8-5.5, 8-5.6
Fullick, A. (2004). Under pressure: forces. Portsmouth, NH: Heinemann Library.ISBN: 1403448183Lexile: not availableIn its description of everyday situations that are familiar to students, this book illustrates gravity, friction, balanced and unbalanced forces in a format that includes detailed captions, diagrams, and strange-but-true facts.8-5.3, 8-5.4, 8-5.5
Doherty, P., Rathen, J. et al. (1996). The spinning blackboard and other dynamic experiments on force and motion. Indianapolis, IN: Jossey-Bass.ISBN: 0471115142Lexile: not availableIncludes over 20 experiments and demonstrations from the Exploratorium that can be performed by students at home using materials that are relatively easy to locate. The procedures are easy-to follow and are accompanied by a thorough explanation of the concepts, which include inertia, gravity, and balance and unbalanced forces. Some content is beyond the scope of the 8th grade curriculum, but would be interesting introductions for advanced students.8-5.3, 8-5.4, 8-5.5, 8-5.6
Riley, P. (2000). Science topics: forces and motion. Portsmouth,
8-87

NH: Heinemann Library.ISBN: 1575727722Lexile: Not availableThe detailed diagrams, illustrations, photographs, fact boxes, and side bars provide explanations of the relationship between weight and gravity, the different types of friction, the relationship between mass and speed, and how force is measured. Also includes do-at-home activities so students can experience the concepts. 8-5.3, 8-5.4, 8-5.5, 8-5.6
Sauvain, P. (1992). Motion (the way it works). New York, NY: Macmillan.ISBN: 0027810771Lexile: not availableDefines motion and relates it to escalators and other machinery.8-5.3, 8-5.4, 8-5.5, 8-5.6
Lafferty, P. (2001). Forces and motion. Austin, TX: Raintree Steck-Vaughn.ISBN: 0739810073Lexile: Not availableRich in detailed drawings, charts, and diagrams, this book contains several other components to provide students with opportunities to learn more through research. Sections include side-bars of interesting facts, biographical insights, and insights about the future of the study of forces and motion.8-5.1, 8-5.2, 8-5.3, 8-5.4, 8-5.5, 8-5.6
Salvadori, M. G. (2002). Why buildings stand up: the strength of architecture. New York, NY: W. W. Norton.
ISBN: 0393306763
Lexile: not available
A structural description of significant buildings in the world and the forces and technology that keep them upright. This book would be especially appreciated by students who have an interest in history, architecture, art, engineering, or construction. 8-5.3, 8-5.4, 8-5.5, 8-5.6
Levy, M. & Salvadori, M. G. (2004). Why buildings fall down: how structures fail. New York, NY: W. W. Norton Company. ISBN: 039331152X
Lexile: not available
8-88
As a companion to Why Buildings Stand Up, this book completes the cycle of engineering problem solving. The structural flaws that contributed to the unbalanced forces of the collapsed structures are accompanied by suggestions of how those flaws could have been averted. Some structural failures are attributed more to human error and poor decision making than to mechanical failure. 8-5.3, 8-5.4, 8-5.5, 8-5.6
Technology
Supporting Content Web Sites
Mr. Mont’s Teacher’s Lounge: Crash Test Simulatorhttp://www.mrmont.com/games/crashtest.htmlAn interactive site that allows students to alter the results of the crash simulation by changing the speed and the mass of the vehicle.8-5.4
NCTM: Graphing Runnershttp://standards.nctm.org/document/eexamples/chap5/5.2/index.htm#APPLETTwo runners can be manipulated to design a race by changing the stride of the runners and their starting positions. When the program is started, students watch as a distance-time graph evolves that represents the speed of each runner.8-5.1
PBS Online: The Racehttp://teacherline.pbs.org/teacherline/resources/activities/race/readings/race.htmIntroductory page provides a link to an applet that initiates a race among three runners, each of whom moves at a different speed. Graphs are generated as the race develops, students can compare the graphs of actual and average speed for each runner, then calculate the speeds using data from the graph.8-5.1, 8-5.2
Fear of Physics: Frictionhttp://www.fearofphysics.com/Friction/frintro.htmlIn this test of driver decision making, students are provided information about the physics of friction then directed to an animation of a traffic jam. The mass of the vehicle, the type of surface (dry, wet, snowy, icy), and the braking distance can be manipulated to determine the conditions necessary to avert a
8-89

rear-end collision.8-5.3, 8-5.4
Engineering Interact: Gravityhttp://www.engineeringinteract.org/resources/parkworldplot/flash/concepts/gravity.htmThis animation explains gravity in examples on Earth and in space by emphasizing relative masses and balanced/unbalanced forces. Students make predictions then test them; when predictions are not correct, an explanation and redirection are provided.8-5.3, 8-5.4, 8-5.5
Exploratorium: Skateboard Sciencehttp://www.exploratorium.edu/skateboarding/trick.htmlA multi-frame illustrated web-text about the forces of friction and gravity acting on a skateboarder. Photographs show skateboard tricks in freeze-frame action and the text explains the forces involved and the tricks-of-the-trade for accomplishing the feat.8-5.3, 8-5.4, 8-5.5, 8-5.6
PBS On-line: Building Big Skyscraper Basicshttp://www.pbs.org/wgbh/buildingbig/skyscraper/basics.htmlStudents are provided background information on the structure of skyscrapers, and then are directed to several engineering problems involving skyscrapers. Students must use their knowledge of gravity and balanced and unbalanced forces to determine the correct solution.8-5.4, 8-5.5
PBS On-line: Building Big Shapes Lab http://www.pbs.org/wgbh/buildingbig/lab/shapes.htmlAn interactive opportunity for students to test the strength and observe the directional forces on shapes used in architecture. When the shape is tested for strength, students are shown how to reinforce it, and are directed to do a comparison of increasing mass to determine which structure is the strongest.8-5.4, 8-5.5
Athens Academy: The Truck and Ladderhttp://www.geocities.com/Athens/Academy/9208/il.htmlThis animation is accompanied by a thorough explanation of inertia and the motion of a car, a truck, and a ladder in a rear-end collision.8-5.6
8-90
Suggested Streamline Video Resources
The Ups and Downs of TechnologyConstant MotionETV Streamline SCAn explanation of the forces acting on a racing cyclist and a sky diver uses on screen force arrows and speedometer to help students see how motion changes due to the forces of gravity and friction. Includes a description of the how the athletes make adjustments to balance forces in order to maintain constant speed. Segment 4: 6:268-5.3, 8-5.4, 8-5.5
Physical Science: Forces and GravityETV Streamline SCSegment 1: Introduction to Forces and Gravity (3:18)Segment 2: Friction (3:10)A very good conceptual overview of the laws governing the motion of an object in vivid action-packed examples from the world of sports, architecture, and recreation. The segment includes descriptions of balanced and unbalanced forces, gravity, inertia, and friction ending with the technology of space transportation. 0:00-6:288-5.3, 8-5.4, 8-5.5, 8-5.6
Physical Science: Forces and GravitySegment 5: Forces at Work in an Amusement Park (3:00)ETV Streamline SCProvides examples of inertia and gravity in amusement park rides. Also includes a discussion of centrifugal and centripetal forces which are beyond the scope of this standard.8-5.3, 8-5.6
Basics of Physics: Exploring the Laws of MotionSegment 2: Newton’s First Law of Motion: Force, Friction, and Inertia (4:40)ETV Streamline SCIllustrates the concept of inertia through several demonstrations including the table cloth trick and penny-in-a-cup and explains the relationship of gravity and friction to the inertia and motion of an object. Key concepts and definitions are displayed in large type on the screen as they are introduced. Explanations that accompany the remaining demonstrations in this segment contain anthropomorphism and should be avoided.8-5.3, 8-5.4, 8-5.5, 8-5.6 8-91

Mathematical Eye: MeasurementSegment 5: Measuring Speed (4:34)ETV Streamline SCShows the unique way British law enforcement officers measure the speed of a motorist using the distance between two bridges, and then presents students a problem for determining the speed of the flow of a river. The latter provides a good opportunity to design an inquiry that includes the best procedure for controlling variables and obtaining the most accurate data. 8-5.2
Discovering Math: Concepts in AlgebraSegment 2: Speed of a Car (3:30)ETV Streamline SCExplains the variables in the equation for speed, indicates the placement of the variables in a data table, and illustrates the correct placement of these variables on a distance-time graph. The constant motion of a car is graphed and used to calculate the speed of the car. 8-5.1, 8-5.2
Discovering Math: Concepts in AlgebraSegment 3: Speed of a Bungee Jumper (1:42)ETV Streamline SCThe distances and times from three bungee jumps are used to calculate the average speed of the jumper. The average speed graph that results is shown. 8-5.1, 8-5.2
Simply Science: Energy TransformationsSegment 4: A Graphic Illustration (4:47 min)ETV Streamline SCDiscusses the design of a distance-time graph to determine the speed of an elevating bucket in a grain silo, including the correct placement of the variables and using a line of best fit for the data. Also shows how the slope of the line formed is used to calculate the speed of the conveyor belt and considers how plotting two lines on the same graph could be used to determine the comparative speed of two objects. Best used with students who have had or are taking Algebra I and can understand more advanced algebra applications.8-5.1, 8-5.2Cross Curricular Opportunities
Math: Calculating average speedP.E.: Mass and forces in sports
8-92

Applying Math, p. 446, 456Integrate Social Studies, p.456Integrate History, p.479
Field Trip/Related Experiences
Roper Mountain Science Center in Greenville, SCFirst Lego League Competition (Robotics)Fort Discovery in Augusta, Georgia (www.nscdiscovery.org )
Career ConnectionsAir traffic controllerAir traffic controllers use radar and visual observation to organize the flow of planes traveling through an airport’s airspace by controlling the speed of the planes and the distance between them. They also keep pilots informed of weather changes such as wind shear (sudden change in velocity of the wind).
ArchitectArchitects design the overall aesthetics and structure of a building, prepare drawings of all the structural systems, and specify the building materials that will support the design by counteracting forces acting on it.
Athletic trainerAthletic trainers, under the supervision of a licensed physician, utilize an understanding of forces and biomechanics to prevent and treat musculoskeletal injuries by advising people on the correct use of training equipment and body posture.
Failure analysis engineerThis specialized engineer recreates a system malfunction or catastrophic structural failure to determine what happened, and then recommends needed changes to avoid having the problem occur again. Crash test engineers belong in this category.
Robotics technicianRobotics technicians work in industrial settings to install, service, maintain, troubleshoot, and repair robots and automated production systems through an understanding of the way the robots were designed to move and the forces such as friction that might create wear on the moving parts.
Big Idea – Change / Form and FunctionForce and Motion
8-93

Indicator:8-5.1 Use measurement and time-distance graphs to represent the motion of an
object in terms of position, direction, or speed.Taxonomy level: 3.2-B Apply Conceptual Knowledge
Essential Question(s):How do measurement and time-distance graphs represent an object’s motion?
How can position, direction, and speed describe or measure motion?
Previous/Future knowledge: Students have been introduced to the concept of motion in terms of speed and direction in 3rd grade (3-5.2) and to position, speed, and direction in 5th grade (5-5.2). 5th grade students constructed a line graph (5-1.5) with the proper placement of the variables, as well as used a graph to illustrate motion (5-5.5). Students will further develop the concept of measuring and graphing motion using equations in high school Physical Science (PS-5.6).
It is essential for students to know that motion occurs when there is a change in position of an object with respect to a reference starting point. The final position of an object is determined by measuring the change in position and direction of the segments along a trip. The following terms are used to describe and determine motion:
Position Position is the location of an object. An object changes position if it moves relative to a reference point. The change in position is determined by the distance and direction of an object’s change in
position from the starting point (displacement).
Direction Direction is the line, or path along which something is moving, pointing, or aiming. Direction is measured using a reference point with terms such as up, down, left, right,
forward, backward, toward, away from, north, south, east, or west.
For example, given the following data table, determine the change in the object’s position based on its final position, distance, and direction, from a starting point.
Draw a line to scale representing 10 meters in an easterly direction. At the end of that line, draw a line representing 7 meters in a northerly direction.
8-94

From the end of the second line, draw a line representing 10 meters in a westerly direction. Connect the end of the third line to the starting point. Measure the distance and direction from the starting point to the end of the third line. The position at the end of the trip is 7 meters north of the starting point.
Motion can also be described by the relationship between distance an object travels and the period of time it travels. This measurement of motion is a rate.
Speed Speed is a measure of how fast something moves a particular distance (for example, meters)
over a given amount of time (for example, seconds). Therefore, speed is the rate of change of the position of an object, or how far something will
move in a given period of time. Speed does not necessarily mean that something is moving fast.
NOTE TO TEACHER: Calculations for speed will be done in the next indicator (8-5.2).
It is essential for students to use (construct and interpret) a distance-time graph to represent the motion of an object in terms of speed. Students should graph objects moving in only one direction away from the reference point (starting point).
Distance-Time Graph A graph that can be used to represent how both speed and distance change with time. For this type of graph, time (the independent variable) is plotted on the x-axis and the
distance (the dependent variable) is plotted on the y-axis.
Speed The slope of the line can tell the relative speed of the object. When the slope of the line is steep, the speed is faster than if the slope were flatter. When the slope of the line is flatter, the speed is slower. When the slope of the line is horizontal to the x-axis, the speed is zero (the object is not
moving). For example:
8-95

NOTE TO TEACHER: Classroom experiments should be designed so that time is being manipulated (the independent variable) and distance is the dependent variable.
Data can be represented in a table. For example:
This data can then be represented on a distance-time graph.
8-96

This distance-time graph can then be used to describe the speed of the object. For example, the speed of segment A is slower than segment C. The speed of segment B is zero, the object is not moving.
It is not essential for students to know that speed in a given direction is called velocity or that the rate of changing velocity is called acceleration. Students do not need to interpret distance time graphs in terms of the direction or position of the object. Students do not need to calculate the slope of the graphs. Students do not need to address speed-time (acceleration) graphs.
Assessment Guidelines:The objective of this indicator is to use measurements and time-distance graphs to represent motion of objects in terms of position, distance, or speed; therefore, the primary focus of assessment should be to apply measurement and graphing skills to demonstrate the motion of objects in terms as listed in the indicator. However, appropriate assessments should also require students to recognize the variables (position, direction, speed) of motion; interpret the motion of an object from data on a graph; match a data table with its appropriate motion graph; compare faster and slower speed using the slope of a graph; or represent the motion of an object (with respect to a reference point) with a scale drawing using appropriate terms for position and direction.
8-97
A
C
B

Big Idea – Change / Form and FunctionForce and Motion
Indicator:
8-5.1 Use the formula for average speed, v=d/t, to solve real world problems. Taxonomy level: 3.2-B Apply Conceptual Knowledge
Essential Question(s):How can the formula for average speed solve real world problems?
Previous/Future knowledge: Students have been introduced to the concept of speed and direction in 3rd grade (3-5.2) and to position, speed, and direction in 5th grade (5-5.2). Students have not been introduced to the concept of average speed or calculating speed using the formula, v=d/t in previous grades. Students will further develop the concepts of using motion formulas to solve problems in high school Physical Science (PS-5.2).
It is essential for students to know that average speed can be calculated by dividing the total distance the object travels by the total amount of time it takes to travel that distance.
While the speed of the object may vary during the total time it is moving, the average speed is the result of the total distance divided by the total time taken.
Speed measurements contain a unit of distance divided by a unit of time. Examples of units of speed might include “meters per second” (m/s), “kilometers per hour” (km/h), or “miles per hour” (mph or mi/hr).
Average speed can be calculated using the formula v=d/t where the variables are:o v is the average speed of the objecto d is the total distance or length of the path of the objecto t is the total time taken to cover the path
NOTE TO TEACHER: Students need to recall the formula v=d/t and use the formula to calculate problems involving average speed.
It is NOT essential for students to know that velocity is the speed in a given direction or that acceleration is the rate of change in velocity. Students do not need to solve problems for time or distance.
Assessment Guidelines:The objective of this indicator is to use the formula for average speed to solve real-world problems; therefore, the primary focus of assessment should be to solve problems using the formula v=d/t. However, appropriate assessments should require students to identify the variables involved in solving problems related to speed; recognize appropriate units for representing average speed; or recall the formula for average speed.
8- 98

Big Idea – Change / Form and FunctionForce and Motion
Indicator:
8-5.2 Analyze the effects of forces (including gravity and friction) on the speed and direction of an object.Taxonomy level: 4.1-B Analyze Conceptual Knowledge
Essential Question(s):What effect do gravity and friction have on the speed and direction of an object?
Previous/Future knowledge: Students have been introduced to the concept the pull of gravity in 3rd grade (3-5.4) and to the concepts of the effects of forces of gravity and friction on the motion of objects in 5th
grade (5-5.1). Students have not been analyzed the effects of forces of gravity and friction with regards to the speed and direction of an object in previous grade levels. Students will further develop the concepts of the effects of gravity quantitatively in high schoolPhysical Science (PS-5.5)
It is essential for students to know that forces (including gravity and friction) can affect the speed and direction of an object.Gravity
Gravity is a force that always attracts or pulls objects toward each other without direct contact or impact.
Gravitational attraction depends on the mass of the two objects and the distance they are apart.
Objects on Earth are pulled toward the center of Earth. The force of gravity, like all other forces, can cause changes in the speed of
objects. As an object falls, its speed will continually increase as Earth’s gravity continually pulls it downward. When air resistance is ignored, all objects will speed up at the same rate as they fall.
Gravity can also cause an object that is thrown into the air to change its upward motion, slow down, and fall back toward Earth’s surface.
The pull of Earth’s gravity keeps the Moon in orbit; the moon is constantly changing direction because of gravity.
Friction Friction is a force that occurs when one object rubs against another object. Two
factors determine the amount of friction – (1) the kinds of surfaces, and (2) the force pressing the surfaces together.
Friction is the force that acts to resist sliding between two surfaces that are touching. It can slow down or stop the motion of an object.
o The slowing force of friction always acts in the direction opposite to the force causing the motion.
8- 99

o For example, friction slows or stops the motion of moving parts of machines.
o Another example would be athletic shoes with tread grooves to increase friction have better traction for starting or stopping motion than smooth-soled dress shoes.
Friction can also be the force that makes it difficult to start an object moving. Enough force must be applied to a nonmoving object to overcome the friction between the touching surfaces.
The smoother the two surfaces are, the less friction there is between them; therefore, the moving object will not slow down as quickly.
o Friction between surfaces can be reduced, in order for objects to move more easily, by smoothing the surfaces, using wheels or rollers between the surfaces, or lubricating/oiling the surfaces.
o If friction could be removed, an object would continue to move. The greater the force pushing the two surfaces together, the stronger friction prevents
the surfaces from moving.o As an object gets heavier, the force of friction between the surfaces becomes
greater.o To move a heavy object, a greater force must be applied to overcome the
friction between the surfaces.
It is NOT essential for students to know how to calculate acceleration due to gravity, calculate weight, or the effect of gravity on different masses. Students do not need to differentiate between static, sliding, or rolling friction.
Assessment Guidelines:The objective of this indicator is to analyze the effects of gravity and friction on the speed and direction of objects; therefore, the primary focus of assessment should be to determine how the forces of gravity and friction relate to the overall concept of speed and direction of objects. However, appropriate assessments should also require students to explain the effects of gravity or friction on the speed and direction of objects; infer whether gravity or friction could be causing a given change in the speed or direction of an object; or exemplify effects of gravity or friction on the speed and direction of an object.
8- 100

Big Idea – Change / Form and FunctionForce and Motion
Indicator:
8-5.3 Predict how varying the amount of force or mass will affect the motion of an object. Taxonomy level: 2.5-B Understand Conceptual Knowledge
Essential Question(s):How will varying amounts of force and mass affect the motion of an object?
Previous/Future knowledge: Students have been introduced to the concept of the importance of pushing and pulling to cause a change in motion in the 1st grade (1-5.2). In the 3rd grade students have studied how the motion of an object is affected by the strength of the push or pull on an object (3-5.3) and the relationship between the motion of an object and the pull of gravity (3-5.4). Students have been introduced to the concept of forces and how they affect motion in 5th grade (5-5.1) as well as to the concept of how mass can affect motion (5-5.6) Students will further develop the concept of the how force and mass affect motion quantitatively in high school Physical Science (PS-5.8).
It is essential for students to know that varying the amount of force or mass will affect the motion of an object.
Force If an object is in motion and more force is applied to it, the object will begin
moving faster. If two objects have the same mass and a greater force is applied to one of the
objects, the object which receives the greater force will change speeds more quickly. For example if a ball is hit harder, it will speed up faster.
If an object must be slowed down quickly, the force applied to the object must be greater than what is needed for a gradual slowing down. For example, the greater the force applied to the brakes of a bicycle, the more quickly it will slow down or stop.
Varying the amount of force applied to a moving object can also change the direction that the object is moving more or less quickly. For example, a baseball pitched toward the batter may quickly change direction and speed if hit very hard, or may change direction and speed more slowly if hit softly as with a bunt.
Mass If a heavy (more massive) object is in motion, more force must be applied to get
the object moving faster. If the same force is applied to two objects, the object with the smaller mass will
change speeds more quickly. For example if a baseball and a bowling ball are thrown with the same force the baseball will speed up faster.
8- 101

In order to slow down or stop a heavier (more massive) object, the force on that object must be greater than for a less massive object. For example, if the same braking force is applied to a small car and a large truck, the car will slow down more quickly.
It is more difficult to change the direction of a heavy moving object, than one that is lighter in mass.
It is NOT essential for students to know the specific quantitative relationships among force, mass, and movement of objects (F = ma) or Newton’s Laws of Motion.
Assessment Guidelines:The objective of this indicator is to predict how varying the amount of force or mass will affect the motion of an object; therefore, the primary focus of assessment should be to infer from the presented material how the amount of force or mass will affect the motion of an object in terms of change in speed and/or direction. However, appropriate assessments should also require students to exemplify ways that varying the amount of force exerted on an object affect the motion of the object; or exemplify how changes in mass affect the motion of objects; or explain how varying the amount of force or mass will affect the motion of an object.
8- 102
Big Idea – Change / Form and FunctionForce and Motion
Indicator:
8-5.4 Analyze the resulting effect of balanced and unbalanced forces on an object’s motion in terms of magnitude and direction. Taxonomy level: 3.1-B Apply Conceptual Knowledge
Essential Question(s):What is the effect of balanced and unbalanced forces on an object’s motion in terms of magnitude and direction?
Previous/Future knowledge: Students have been introduced to the concept of unbalanced forces and rate and direction of motion in 5th grade (5-5.3). In 6th grade, students measured force in Newtons using a spring scale (6-5.6). Students have not been introduced to the concept of balanced and unbalanced forces in previous grades. The quantitative concepts that affect the magnitude and direction of moving objects will be further developed in high school Physical Science (PS-5.8).
It is essential for students to know that forces have a magnitude (strength) and a direction. Forces can be represented as arrows with the length of the arrow representing the magnitude of the force and the head of the arrow pointing in the direction of the force. Using such arrows, the resulting force (net force) and direction can be determined. Forces acting on an object can be balanced or unbalanced.Balanced forces will cause no change in the motion of an object.
Balanced forces acting on an object in opposite directions and equal in strength, as shown in the arrows below, do not cause a change in the speed/magnitude or direction of a moving object.
Objects that are not moving will not start moving if acted on by balanced forces.o For example, in arm wrestling where there is no winner, the force exerted
by each person is equal, but they are pushing in opposite directions. The resulting force (net force) is zero.
5N 5No Or, in a tug of war, if there is no movement in the rope, the two teams are
exerting equal, but opposite forces that are balanced. Again, the resulting force (net force) is zero.
5N 5N
8- 103

Unbalanced forces are not equal, and they always cause the motion of an object to change the speed and/or direction that it is moving.
When two unbalanced forces are exerted in opposite directions, their combined force is equal to the difference between the two forces.
o The magnitude and direction of the net force affects the resulting motion.o This combined force is exerted in the direction of the larger force. For
example, if two students push on opposite sides of a box sitting on the floor, the student on the left pushes with less force (small arrow) on the box than the student on the right side of the box (long arrow). The resulting action (net force: smaller arrow to the right of the =) shows that the box will change its motion in the direction of the greater force as shown below:
5N 10 N 5N
o Or, if in a tug of war, one team pulls harder than the other, the resulting action (net force) will be that the rope will change its motion in the direction of the force with the greater strength/magnitude as shown below:
5N 10N 5N If unbalanced forces are exerted in the same direction, the resulting force (net
force) will be the sum of the forces in the direction the forces are applied.o For example, if two people pull on an object at the same time in the same
direction, the applied force on the object will be the result of their combined forces (net force or longer arrow to the right of the =) as shown below:
55N + 10N = 15N When forces act in the same direction, their forces are added. When forces act in
opposite directions, their forces are subtracted from each other. Unbalanced forces also cause a nonmoving object to change its motion.
If there is no net force acting on the object, the motion does not change. If there is net force acting on an object, the speed of the object will change in the direction of the net force.
It is NOT essential for students to know how to determine net force when the forces act at an angle. Students do not need to calculate problems with more than two forces acting on an object.
Assessment Guidelines:The objective of this indicator is to analyze the effects of balanced and unbalanced forces on the magnitude and direction of moving objects; therefore, the primary focus of
8- 104
assessment should be to determine from the factors presented how the balanced or unbalanced forces affect the magnitude and direction of moving objects. However, appropriate assessments should also require students to recognize whether forces acting on an object are balanced or unbalanced; illustrate forces as balanced or unbalanced depending on their magnitude and direction of moving objects; infer the resulting force of two balanced or unbalanced forces acting in opposite directions; use arrows to show balanced and unbalanced forces; or use the correct procedure (add or subtract) to calculate the net force.
Big Idea – Change / Form and FunctionForce and Motion
Indicator: 8-5.5 Summarize and illustrate the concept of inertia.
8- 105

Taxonomy level: 2.2, 2.4-B Understand Conceptual Knowledge
Essential Question(s):How can inertia be illustrated?
Previous/Future knowledge: Students have not been introduced to the concept of inertia in previous grades. They will further develop the concept of inertia in high school Physical Science (PS-5.7) in relation to Newton’s first law of motion.
It is essential for students to know that inertia is the tendency of objects to resist any change in motion. Inertia is a property of the object; it is not a force.
It is the tendency for objects to stay in motion if they are moving or to stay at rest if they are not moving unless acted on by an outside force.
The more mass an object has, the harder it is to start it in motion, to slow it down or speed it up, or to turn it.
In other words, the more mass an object has, the more inertia it has.
Examples of the effects of inertia might include: ·Inertia causes a passenger in a car to continue to move forward even though the
car stops. This is the reason that seat belts are so important for the safety of passengers in
vehicles. Inertia is the reason that it is impossible for vehicles to stop instantaneously. Inertia is the reason that it is harder to start pushing a wheelbarrow full of bricks
than to start pushing an empty wheelbarrow. The filled wheelbarrow has more mass and therefore, more inertia.
Inertia is also the reason that it is harder to stop a loaded truck going 55 miles per hour than to stop a car going 55 miles per hour. The truck has more mass resisting the change of its motion and therefore, more inertia.
It is NOT essential for students to know that the concept of inertia as Newton’s first law of motion. Students do not need to know how momentum relates to inertia or to calculate momentum.
Assessment Guidelines : One objective of this indicator is to summarize the concept of inertia; therefore, the primary focus of assessment should be to generalize the major points concerning the concept of inertia. However, appropriate assessments should also require students to recall the meaning of inertia. Another objective of this indicator is to illustrate the concept of inertia; therefore, the primary focus of assessment should be to give illustrations of this concept or use illustrations to show understanding of inertia using pictures, diagrams, or word descriptions. However, appropriate assessments should also
8- 106

require students to exemplify inertia with moving objects or with objects at rest resisting motion.
GRADE 8Big Idea – Form and Function
Waves and Light
Standard 8-6: The student will demonstrate an understanding of the Standard 8-6: The student will demonstrate an understanding of the properties and behaviors of wavesproperties and behaviors of waves. (Physical Science)(approximately 6 weeks)
Indicators8-6.1 Recall that waves transmit energy but not matter.
8- 107
Essential Question:
How do waves transmit energy but not matter?
8-6.2 Distinguish between mechanical and electromagnetic waves.
Essential Question:
What is the difference between mechanical and electromagnetic waves?
8-6.3. Summarize factors that influence the basic properties of waves (including frequency, amplitude, wavelength, and speed).
Essential Questions:
What are the four basic properties of waves? How do the factors of these properties influence waves?
8-6.4 Summarize the behaviors of waves (including refraction, reflection, transmission, and absorption).
Essential Question:
What are the behaviors of waves?
8-6.5 Explain hearing in terms of the relationship between sound waves and the ear.
Essential Question:
What is the relationship between sound waves and the ear?
8-6.6 Explain sight in terms of the relationship between the eye and the light waves emitted or reflected by an object.
Essential Question:
What is the interaction between the eye and light?
8-6.7 Explain how the absorption and reflection of light waves by various materials result in the human perception of color.Essential Question:
How do humans see color?
8-6.8 Compare the wavelength and energy of waves in various parts of the electromagnetic spectrum (visible light, infrared, and ultraviolet radiation).
8- 108
Essential Question:
What is the electromagnetic spectrum?
Scientific inquiry standards and indicators should be embedded throughout standard 8-2.
Standard 8-1: The student will demonstrate an understanding of technological design and scientific inquiry, including process skills, mathematical thinking, controlled investigative design and analysis, and problem solving.
Indicators
8-1.1 Design a controlled scientific investigation.8-1.2 Recognize the importance of a systematic process for safely and accurately
conducting investigations. 8-1.3 Construct explanations and conclusions from interpretations of data obtained
during a controlled scientific investigation. 8-1.4 Generate questions for further study on the basis of prior investigations.8-1.5 Explain the importance of and requirements for replication of scientific
investigations.8-1.6 Use appropriate tools and instruments (including convex lenses, plane mirrors,
color filters, prisms, and slinky springs) safely and accurately when conducting a controlled scientific investigation.
8-1.7 Use appropriate safety procedures when conducting investigations.
Big Idea – Form and FunctionWaves and Light
Help Page for: Waves and Light
Standard 8-6: The student will demonstrate an understanding of the Standard 8-6: The student will demonstrate an understanding of the properties and behaviors of wavesproperties and behaviors of waves. (Physical Science)
Notes:Assessments
8-6.1 Recall the ways that waves travel and what causes waves.
8- 109

8-6.2 Distinguish between mechanical and electromagnetic waves.
8-6.3 Summarize factors that influence the basic properties of waves.
8-6.4 Recognize the behaviors of waves, exemplify the behaviors of waves based on descriptions of these behaviors, and illustrate wave properties.
8-6.5 Interpret a diagram of the ear that depicts how sound is transferred and transmitted at each part.
8-6.6 Summarize the transfer of light through the major parts of the eye.
8-6.7 Infer what is being reflected and what is being absorbed by a colored material.
Inquiry: Kit/Lab Connections
Science Kit: STC LightLessons 1, 7-12, 16-17, 19-20, 24-25
The following labs are from Glencoe Science South Carolina Science:Launch Lab: Wave Properties, p. 501Lab: Sound Waves in Matter, p.514Lab: Bending Light, p. 522Launch Lab: Bending Light (Foldables), p. 531Lab: Reflection from a Plane Mirror, p.543Lab: Image Formation by a Convex Lens, p.554Textbook Correlation
Glencoe Science South Carolina Science Chapters 17 and 18
Key Concepts (Vocabulary)
Waves: matter vs. energy, mechanical vs. electromagneticWave properties: frequency, amplitude, wavelength, speedWave behaviors: refraction, reflection, transmission, and
absorptionHearing: sound waves, ear structureSight: eye structure, light waves emitted or reflectedColor: absorption and reflection of light wavesElectromagnetic spectrum: wave energy, wavelengths, visible light, infrared & ultraviolet radiation Literature
Isaacs, A. (2005). Characteristics and behaviors of waves: understanding sound and electromagnetic waves. New York: Rosen Publishing Group.
8- 110
ISBN: 1404203311Lexile: not availableDescribes the parts, behavior, and properties of waves and gives definitions of terms related to waves. Also includes descriptions of the occurrence of waves in real world situations.8-6.2, 8-6.3, 8-6.4, 8-6.8
Parker, S. (2005). Making waves: sound. Portsmouth, NH: Heinemann Library.ISBN: 1403448140Lexile: not availableDiscusses how sound waves are formed and the properties of sound waves including pitch, volume, and speed. Also includes information about how humans and other animals perceive sound and how sound is generated and managed in technological applications. 8-6.3, 8-6.5
Stille, D. (2006). Waves: energy on the move. Mankato, MN: Compass Point Books. ISBN: 075651259XLexile: not availableColorful diagrams illustrate the structure of water, sound, light, radio, and seismic waves.8-6.1, 8-6.2, 8-6.5, 8-6.6
Parker, S. (2001). Light and sound. Austin, TX: Raintree Steck-Vaughn.ISBN: 0739810111Lexile: not availableExtensive use of figures, charts, diagrams, and photographs to describe the nature of light and sound. Includes a discussion of color and brightness, ears and hearing, and sound and light phenomena such as echoes, sonar, lasers, and holograms.8-6.2, 8-6.5, 8-6.6, 8-6.7
Ball, J. (Ed.). (2003). Sound. New York: G. Stevens for the Discovery Channel.ISBN: 0836833635Lexile: not available Information and activities related to the principles of sound, animal and human hearing, sound applications in medicine and noise pollution.8-6.5
Burnie, D. (2000). Light. NewYork: Dorling Kindersley.
8- 111
ISBN: 0789467097Lexile: 1000The familiar Eyewitness format includes numerous color photographs with extensive captions to illustrate the wave properties of light, the phenomenon of color, refraction and reflection, and the principles of optics. 8-6.4, 8-6.6, 8-6.7, 8-6.8
Silverstein, A. (2001). Hearing. Breckingridge, CO: Twenty-First Century Books.ISBN: 0761316663Lexile: not availableExplains hearing from the mechanics of the sound wave to the perception of sounds in the human brain. Includes labeled diagrams of the human ear and discusses technology that has been developed to assist the hearing impaired. 8-6.5
Gardner, R. (2004). Light, sound, and waves science fair projects: using sunglasses, guitars, CDs, and other stuff. Berkeley Heights, NJ: Enslow Publishers.ISBN: 0766021262 Lexile: not availableThis is not your ordinary science fair fare. The novelty of the materials used will provide an engaging experience for students as they investigate the principles of sound, color, vision, refraction, and reflection.8-6.4, 8-6.5, 8-6.6, 8-6.7
Stille, D. (2006). Manipulating light: reflection, refraction, and absorption. Mankato, MN: Compass Point Books.ISBN: 0756512581Lexile: not availableHigh interest, lower reading level introduction to reflection, refraction, and absorption that includes explanations of how mirrors, prisms, and telescopes work.8-6.4
Skurzynski, G. (2005). Waves: the electromagnetic universe. Washington, DC: National Geographic.ISBN: 0792235207Lexile: not availableColor photographs and easily understood diagrams provide information about the ranges of wavelengths in the electromagnetic spectrum and the modern technologies that are derived from them.
8- 112
8-6.7, 8-6.8
Technology
Supporting Content Web Sites
University of Illinois: Weather World 2010 Projecthttp://ww2010.atmos.uiuc.edu/(Gh)/guides/mtr/opt/home.rxmlLight and Optics section. Photographs and graphics are used to explain meteorological optical phenomena caused by the reflection, scattering, refraction, and diffraction of the suns rays through water droplets, particulates, and ice crystals.8-6.3, 8-6.4, 8-6.8
Oregon Museum of Science and Technology: Dangerous Decibelshttp://www.dangerousdecibels.org/virtualexhibit.cfm#A virtual tour that includes interactive models of the propagation of a sound wave, the movement of a sound wave through the human ear, variations in sound frequency, and the measurement of the intensity of everyday sounds. 8-6.3, 8-6.5
Nova Online: Voyage to the Mystery Moonhttp://www.pbs.org/wgbh/nova/titan/sounds.htmlCassini-Huygens researcher Bruce Betts explains how sounds were used to collect data about Titan. The interactive site begins with an explanation of how sound is transmitted on Earth and how humans perceive sound, then provides a sample of two sounds that were recorded by the Huygens probe with an accompanying explanation of what those sounds revealed about Titan.8-6.1, 8-6.2, 8-6.5
Nova Online: Wave That Shook the World Anatomy of a Tsunamihttp://www.pbs.org/wgbh/nova/tsunami/anatomy.htmlInteractive overview of the 2004 Indian Ocean tsunami that includes an animation and explanation of the propagation of the seismic wave including the effect of the ocean’s depth at various locations on the wavelength, amplitude, and speed of the wave.8-6.1, 8-6.2, 8-6.3
Nova Online: Death Star A Self-Guided Tour of the
8- 113

Electromagnetic Spectrum http://www.pbs.org/wgbh/nova/gamma/spectrum.htmlMoving the cursor across the electromagnetic spectrum reveals the characteristics of each range and the technological applications of each. The interactive site also relates the connection of each section of the electromagnetic spectrum to the exploration of space.8-6.1, 8-6.2, 8-6.8
Amazing Space Catch the Waves and Making Waveshttp://amazing-space.stsci.edu/resources/explorations/light/CatchWaves_activation-frames.htmlSite includes an interactive prism, generation of a water wave, comparison of ranges of the electromagnetic spectrum to similar sized objects, comparison of views of the Sun as seen through different wavelengths of light, and a summary of concepts that have been explained. Making Waves allows students to manipulate the wavelength and frequency of a “rope” wave.8-6.3, 8-6.8
An Interactive Diagram of the Human Eyehttp://www.nei.nih.gov/health/eyediagram/index.aspSlide the hand lens across the diagram to magnify each of the major parts of the eye. Click on the target symbols to read a description of the function of each part.8-6.6
Fear of Physics: What is Sound?http://www.fearofphysics.com/Sound/dist.htmlAnimation and explanation of the movement of air molecules during the propagation of a sound wave. The final frame shows how the air molecules interact with a human ear, and then provides a link to sounds of various frequencies and an explanation of the universal frequencies used on touch tone phones.
Comparison of Wavelength and Frequencyhttp://www.acoustics.salford.ac.uk/schools/lesson1/flash/wavelength.swfA series of four interactive slides that illustrate the generation of waves of different wavelength. A comparison is then made between the wavelengths of the waves and their frequencies.8-6.3
Colors of Lighthttp://www.mic-d.com/java/additiveprimaries/index.html
8- 114

Tutorial allows students to manipulate disks of “light” in primary colors to illustrate the relationship between colors, white light, and the mixing of wavelengths of light to produce other colors. Also provides accompanying text that explains the relationship between light and the perception of color.8-6.7
Suggested Streamline Video Resources
Breaking the Silence: An Introduction to SoundSegment 3: Energy and Sound: Loudness and Frequency (3:33)Segment 4: What is Pitch? (2:05)ETV Streamline SCRelates the energy of a sound wave to the amplitude of the wave, and then shows how this is different from the frequency of the wave. The segment presents demonstrations that students can easily reproduce to illustrate the concepts. 8-6.3, 8-6.5
Breaking the Silence: An Introduction to SoundSegment 8: Energy and Sound: How Do Sound Vibrations Reach Our EarsETV Streamline SCThis segment includes an animation of the vibration of molecules in air producing a compression wave, as well as an animation of the wave interacting with a human ear.3:298-6.5
Science Investigations Physical Science: Investigating Sound and LightAll About TelescopesETV Streamline SCBegins with a brief history of the development of the microscope then quickly moves to a comparison of refracting and reflecting telescopes. The last part of the segment describes the Hubble Telescope and how its images are transmitted to Earth.9:208-4.10, 8-6.4
Science Investigations Physical Science: Investigating Sound and LightEcholocation and DolphinsETV Streamline SC
8- 115

Describes how dolphins use echolocation to navigate and find food in dark water. Includes an animation that shows how the sound wave is generated as a vibration by the dolphin and how that wave is reflected off of a distant object.3:388-6.1, 8-6.4
Exploring Light and ColorSegment 3: Light and Color (6:39)Segment 5: Mirrors and Lenses (3:14)ETV Streamline SCSegment begins with an animation of refraction by a prism to produce a visible spectrum and shows the relationship of visible light to the electromagnetic spectrum, while focusing on the ultraviolet and infrared segments found in sunlight. It continues with an explanation of absorption and reflection of light, our perception of color, primary colors of light, and the potential confusion with primary colors in pigments. 8-6.3, 8-6.4, 8-6.6, 8-6.7, 8-6.8
Exploring Light and ColorSegment 2: Light and the Sense of SightETV Streamline SCProvides a summary of the major structural components of the human eye (pupil, iris, cornea, lens, retina, optic nerve) and the interaction of each part with a reflected light wave. Also provides information about vision in other animals as compared to that of humans.4:548-6.6
Inquiring Minds: From Sky to SeaSegment 1: Blue SkyETV Streamline SCUses the concepts of absorption, reflection, refraction, and emission to explain why the sky is blue, sunsets are red, space is black, and why water is clear in a small container, but blue in a large body like the ocean. Provides several animations of the refraction of the wavelengths of visible light by air and water molecules.5:058-6.3, 8-6.4, 8-6.7, 8-6.8
Physical Science: LightSegment 3: Magic of Sight: How Our Eyes WorkETV Streamline SC
8- 116
Excellent diagrams of the parts of the eye and how they function. 2:24
Physical Science: LightSegment 4: The Electromagnetic SpectrumETV Streamline SCA survey of the segments of the electromagnetic spectrum through an exploration of the universe. The discussion of each range of the spectrum is accompanied by visual images of the universe from telescopes and space probes that gather the wavelengths of light in that range. 3:028-6.8, 8-4.10
Cross Curricular Opportunities
Health: Effects of ultraviolet radiation on the skinMusic: Sound waves and pitchTechnology: Modern developments in fiber opticsMath: p. 506, 508, 513, 548, 553Cultural Diversity: p. 545Social Studies: Cultural effects of tsunamis
Field Trip/Related Experiences
Fort Discovery, Augusta, GASC State Museum, Columbia, SC
Career Connections
Acoustical architectAcoustical architects develop building designs that most efficiently distribute desirable sounds (music, conversation, oral communication) while reducing undesirable sounds (background noise, mechanical noise). This specialized architect would be involved in the design of music halls, theaters, museums, recording studios, and TV/movie sets and would require a deep understanding of transmission, absorption, and reflection of waves.
Acoustical engineerAcoustical engineers are specialized mechanical engineers who
8- 117

have an equally strong background in electrical engineering. They develop transducers (devices that convert sound energy into another type of energy or vice versa) and sound measuring instruments such as those used in seismic surveying, sound recording, and medical diagnostics.
AudiologistAn audiologist is a licensed medical care provider that examines and provides intervention services for persons with speech and hearing disorders to help them improve their ability to communicate. They require a thorough understanding of the mechanics of sound waves and the structure and function of the human ear.
SonographerSonographers (ultrasonographers) are medical technicians who specialize in the use of high frequency sound waves to produce dynamic visual images of organs, tissues, or blood flow inside the body. They select equipment settings, use a transducer to collect the image, look for visual cues of an unhealthy image, take measurements, calculate values and analyze results to relay to a physician.
OptometristOptometrists examine eyes to diagnose vision problems and diseases, test patients’ visual acuity, depth perception, color perception, ability to focus and coordinate the eyes, and prescribe eyeglasses and contact lenses to correct vision problems. An optometrist would require knowledge of the refraction of light through lenses, color perception, and the structure of the human eye.
8- 118
Big Idea – Form and FunctionWaves and Light
Indicator:8-6.1 Recall that waves transmit energy but not matter.
Taxonomy level: 1.2-B Remember Conceptual Knowledge
Essential Question(s):How do waves transmit energy but not matter?
Previous/Future knowledge: Students have been introduced to the concept of energy in 1st grade related to plants (1-2.1), related to animals in 2nd grade (2-2.1), to light and electricity as forms of energy in 4th grade (4-5.2); and to forms and transformations of energy in 6th grade (6- 5.2). Students have not been introduced to the concept of energy being transmitted in waves in previous grades. Students will further develop the quantitative concepts energy transmission in
waves in high school Physical Science (PS-7.3 and PS-7.4).
It is essential for students to know that wave is a repeating disturbance or vibration that transfers or moves energy from place to place.
Waves are created when a source of energy (force) causes a vibration. A vibration is a repeated back-and-forth or up-and-down motion.
8- 119
Waves carry energy through empty space or through a medium without transporting matter.
While all waves can transmit energy through a medium, certain waves can also transmit energy through empty space.
A medium is a material through which waves can travel. It can be a solid, liquid, or gas.
When waves travel through a medium, the particles of the medium are not carried along with the wave.
When there is no medium, certain waves (electromagnetic) can travel through empty space.
It is NOT essential for students to know the mechanisms (the oscillations of the fields) by which energy is transferred through empty space.
Assessment Guidelines:The objective of this indicator is to recall that waves transmit energy but not matter; therefore, the primary focus of assessment should be to remember that waves as disturbances or vibrations that transfer energy. However, appropriate assessments should also require students to recall the definition of a wave and a medium; recognize types of media; recall the ways that waves travel; or recall what causes waves.
Big Idea – Form and FunctionWaves and Light
Indicator:8-6.2 Distinguish between mechanical and electromagnetic waves.
Taxonomy level: 4.1-B Apply Conceptual Knowledge
Essential Question(s):What is the difference between mechanical and electromagnetic waves?
Previous/Future knowledge: Students have not been introduced to the concept of mechanical and electromagnetic waves in previous grades. Students will further develop the concepts of the different types of waves in high school Physical Science (PS-7.1-2).
It is essential for students to know the following characteristics of mechanical and electromagnetic waves:Mechanical waves
Mechanical waves require the particles of the medium to vibrate in order for energy to be transferred.
For example, water waves, earthquake/seismic waves, sound waves, and the waves that travel down a rope or spring are also mechanical waves.
Sound waves, as with all mechanical waves, cannot be transferred or transmitted through empty space (vacuum).
Electromagnetic waves
8- 120

Electromagnetic waves are waves that can travel through matter or empty space where matter is not present.
Some examples are radio waves, microwaves, infrared rays, visible light, ultraviolet rays and x-rays that all travel in electromagnetic waves.
Another way to classify waves is by how they move: Mechanical waves in which the particles of matter in the medium vibrate by
pushing together and moving apart parallel to the direction in which the wave travels are called compressional or longitudinal waves. The place on the wave that is pushed together is called the compression and the place that is moving apart is the rarefaction. Examples of mechanical compressional/longitudinal waves might include sound waves and some seismic waves.
Mechanical waves in which the particles of matter in the medium vibrate by moving back and forth and perpendicular (at right angles) to the direction the wave travels are called transverse waves. The highest point of a transverse wave is the crest and the lowest point is called a trough. Examples of mechanical transverse waves might include some waves in a slinky spring, waves on a rope, strings in a musical instrument, and some seismic waves
Electromagnetic waves are transverse waves that can travel without a medium through empty space.
It is not essential for students to know that electromagnetic waves are caused by vibrating electric charges, or that they transfer energy between vibrating electric and magnetic fields.
Assessment Guidelines:The objective of this indicator is to distinguish between mechanical and electromagnetic waves; therefore, the primary focus of assessment should be to make distinctions between the characteristics of electromagnetic and mechanical waves. However, appropriate assessments should require students to compare electromagnetic and mechanical waves; classify waves as mechanical or electromagnetic based on their characteristics; exemplify types of mechanical and electromagnetic waves and/or compressional and transverse waves; or compare ways that waves can move.
8- 121

Big Idea – Form and FunctionWaves and Light
Indicator:8-6.3 Summarize factors that influence the basic properties of
waves (including frequency, amplitude, wavelength, and speed).
Taxonomy level: 2.4-B Understand Conceptual Knowledge
Essential Question(s):What are the four basic properties of waves?How do the factors of these properties influence waves?
Previous/Future knowledge: Students have not been introduced to the concept of waves in previous grade levels. Students will further develop the concept of waves quantitatively in high school Physical Science (PS-7.4)
It is essential for students to know that the basic properties of waves are influenced by several factors.
Frequency Frequency is a measure of how many waves pass a point in a certain amount of
time. The higher the frequency, the closer the waves are together and the greater the
energy carried by the waves will be.Amplitude
Amplitude is a measure of the distance between a line through the middle of a wave and a crest or trough.
8- 122
The greater the force that produces a wave, the greater the amplitude of the wave and the greater the energy carried by the wave.
In a transverse wave the higher the wave, the higher the amplitude. Sounds with greater amplitude will be louder; light with greater amplitude will be
brighter.Wavelength
Wavelength is a measure of the distance from the crest on one wave to the crest on the very next wave.
Shorter wavelengths are influenced by the frequency. A higher frequency causes a shorter wavelength and greater energy.
Speed Speed is a measure of the distance a wave travels in an amount of time. The speed of a wave is determined by the type of wave and the nature of the
medium. As a wave enters a different medium, the wave’s speed changes. Waves travel at
different speeds in different media. All frequencies of electromagnetic waves travel at the same speed in empty space.
NOTE TO TEACHER: Properties of waves will be diagrammed using transverse waves only.
It is not essential for students to know how to calculate the speed of a wave or how to diagram these properties on a longitudinal wave.
Previous/Future knowledge: Students have not been introduced the concept of waves in previous grade levels. Students will further develop the concepts of waves quantitatively in 9th grade Physical Science (PS-7.4)
It is essential for students to know the basic properties of waves and factors that influence them as follows:
Wavelength Wavelength is the distance between one point on a wave and the nearest point just like it. The wavelength is the measure of the distance between any two successive identical parts of wave. The greater the energy carried by waves, the smaller the wavelength.
Frequency Frequency is the number of full wavelengths that pass a point each second. The frequency of a wave also measures how rapidly vibrations occur in the medium, at the source of the wave, or both. The greater the energy carried by waves, the greater the frequency.
Amplitude Amplitude is the greatest distance that vibrations in a wave move from their normal position when a wave passes by. The greater the wave’s amplitude, the more energy the wave carries.
8- 123

Speed Speed is the distance per time that a given wave travels. A particular type of wave has a wave speed that is constant in a specific medium or in space. As a wave enters a different medium, the wave’s speed changes. Waves travel at different speeds in different mediums. All electromagnetic waves travel at the same speed in empty space—300 million m/sec.
It is NOT essential for students to know the quantitative relationships among these wave properties or the factors that influence them.
Assessment Guidelines:The objective of this indicator is to summarize factors that influence the basic properties of waves; therefore, the primary focus of assessment should be to generalize major points about how properties of waves (including frequency, amplitude, wavelength, and speed). However, appropriate assessments should also require students to recognize the basic properties of waves; recall the factors that influence the basic properties of waves; or interpret or illustrate diagrams of transverse waves by identifying specific characteristics stated previously.
8- 124

Big Idea – Form and FunctionWaves and Light
Indicator:8-6.4 Summarize the behaviors of waves (including refraction,
reflection, transmission, and absorption).
Taxonomy level: 2.4-B Understand Conceptual Knowledge
Essential Question(s):What are the behaviors of waves?
Previous/Future knowledge:In 4th grade (4-5.3), students summarized how light travels and explained what happens when it strikes an object (including reflection, refraction, and absorption). Students have not been introduced to the concept transmission in previous grade levels. Students will further develop the concept of the behavior of waves in Physical Science (PS-7.6).
It is essential for students to know that waves have the following behaviors:
Refraction Refraction is the bending of waves caused by a change in their speed as they pass
from one medium to another. As waves pass at an angle from one medium to another, they may speed up or slow down. The greater the change in speed of the waves, the more the waves will bend.
Refraction of light going from air through a convex lens, for example, can make images appear larger as the light waves bend.
Prisms or diffraction gratings separate white light into its different components or colors by bending the light at different angles depending on the frequencies of the light passing through the prism or diffraction grating. Different colors of light have different frequencies.
Reflection Reflection is the bouncing back of a wave when it meets a surface or boundary
that does not absorb the entire wave’s energy. All types of waves can be reflected. Reflections of sound waves, for example, are called echoes and help bats and
dolphins learn about their environments. Plane mirrors and other smooth surfaces reflect light to form clear images.
Transmission Transmission of waves occurs when waves pass through a given point or medium. Sound waves are transmitted through solids, liquids, and gases.
8- 125
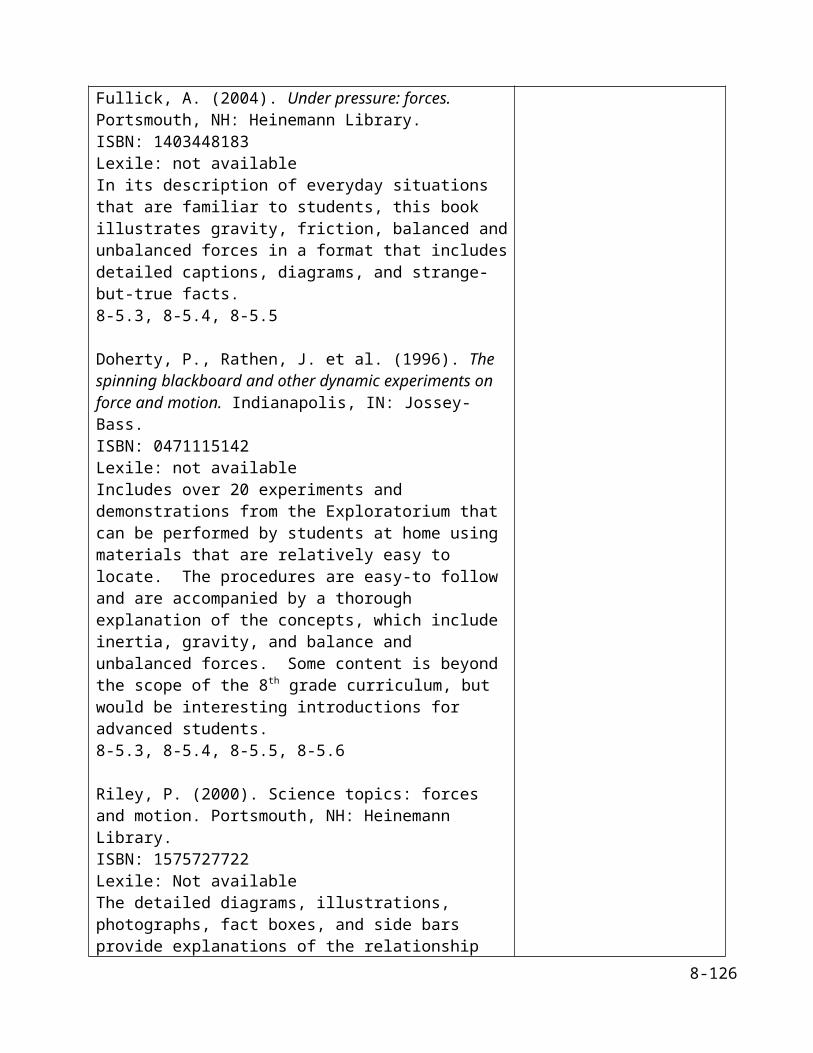
Light waves are transmitted through transparent materials (may be clear or colored material such as filters) that allow most of the light that strikes them to pass through them.
Only a small amount of light is reflected or absorbed. Opaque materials allow no light waves to be transmitted through them. Translucent materials transmit some light, but cause it to be scattered so no clear
image is seen.Absorption
Absorption of certain frequencies of light occurs when the energy is not transferred through, or reflected by, the given medium.
Objects or substances that absorb any wavelength of electromagnetic radiation become warmer and convert the absorbed energy to infrared radiation.
It is not essential for students to know the quantitative relationships in refraction, reflection, absorption, or transmission of waves. Students do not have to know about the behavior of diffraction or about polarization of light. Measuring angles of reflection or refraction is not essential. Behaviors using concave lenses or convex mirrors and concave mirrors are beyond this indicator.
Assessment Guidelines : The objective of this indicator is to summarize the behaviors of waves; therefore, the primary focus of assessment should be to generalize major points about the interactions of waves with various materials based on behaviors (including refraction, reflection, transmission, and absorption). However, appropriate assessments should also require students to recognize the behaviors of waves; exemplify the behaviors of waves based on descriptions of these behaviors interpret diagrams of wave behaviors; illustrate wave properties; or explain the major effects of wave behavior.
8- 126

Big Idea – Form and FunctionWaves and Light
Indicator:8-6.5 Explain hearing in terms of the relationship between sound
waves and the ear.
Taxonomy level: 2.7-B Understand Conceptual Knowledge
Essential Question(s):What is the relationship between sound waves and the ear?
Previous/Future knowledge: In 3rd grade (3-5.5), students recalled that vibrating objects produce sound and that vibrations can be transferred from one material to another. Students have not been introduced to the concepts of sound waves or their interactions with the ear in previous grades. Students will further develop the concepts of sound waves in high school Physical Science (PS-7.7).
It is essential for students to know the relationship between the ear and sound waves to explain hearing as follows:
Sound waves are gathered by the outer ear which is shaped to help capture the sound waves (energy transferred in particles of air) and send them through the ear canal, which transfers them to the eardrum.
The vibrations of air particles cause the eardrum to vibrate.o If the vibrations follow each other slowly (low frequency) the sound is
heard as a low pitch. If the vibrations follow each other in rapid succession (high frequency), the sound is heard as a high pitch.
o Sound waves with large amplitudes push on the eardrum with more force and are heard as loud sounds. Sound waves with small amplitudes push on the eardrum with less force and are heard as soft sounds.
Vibrations from the ear drum are transmitted to three small bones of the middle ear, which transmit the vibrations to the inner ear.
The vibrations in the liquid of the inner ear cause the tiny hairs to vibrate. The vibrating tiny hairs transmit the energy to nerves attached to the hairs.
The nerve impulses are transmitted to the brain and interpreted as hearing.
It is not essential for students to know the specific anatomy of the three main parts of the ear in more detail than what is listed above (for example, names of ear bones).
Assessment Guidelines:
8- 127

The objective of this indicator is to explain hearing in terms of the relationship between sound waves and the ear; therefore, the primary focus of assessment should be to develop a cause-and effect model that shows the functions of the three main parts of the ear and how they transmit and transfer sound waves for hearing to occur in the brain. However, appropriate assessments should also require students to recognize the three major parts of the ear; summarize how the major parts of the ear transfer sound waves to the brain for interpretation; or interpret a diagram of the ear that depicts how sound is transferred and transmitted at each part.
8- 128

Big Idea – Form and FunctionWaves and Light
Indicator:8-6.6 Explain sight in terms of the relationship between the eye and the
light waves emitted or reflected by an object.Taxonomy level: 2.7-B Understand Conceptual Knowledge
Essential Question(s):What is the interaction between the eye and light?
Previous/Future knowledge: Students have not been introduced to the concept of the relationship between the eye and light waves in previous grades. They will further develop the concept of light in high school Physical Science (PS-7.6).
It is essential for students to know that the interaction the eye and light emitted or reflected by an object to allow sight to occur as follows:
Light waves that have been emitted or reflected by an object, enter the eye and first pass through the transparent layer called the cornea where they are refracted.
The light rays are then refracted again as they pass through the transparent lens (convex).
The lens focuses the light waves on the retina, located on the back of the inside of the eye.
The retina is composed of tiny light sensitive nerves that transfer the energy of the light waves to nerve impulses transmitted through the optic nerve to the brain for interpretation as sight.
It is not essential for students to know about vision problems, such as being nearsighted or farsighted, but these might be interesting topics for discussion.
Assessment Guidelines : The objective of this indicator is to explain sight in terms of the relationship between the eye and the light waves emitted or reflected by an object; therefore, the primary focus of assessment should be to construct a cause-and-effect model of the eye indicating how it interacts with light waves to allow sight to occur. However, appropriate assessments should also require students to recognize the functions of the major parts of the eye; interpret a diagram of the major parts eye and their functions in transmitting and transferring light to nerve impulses in the brain for sight; interpret a diagram showing how light rays travel through the eye; or summarize the transfer of light through the major parts of the eye.
8- 129
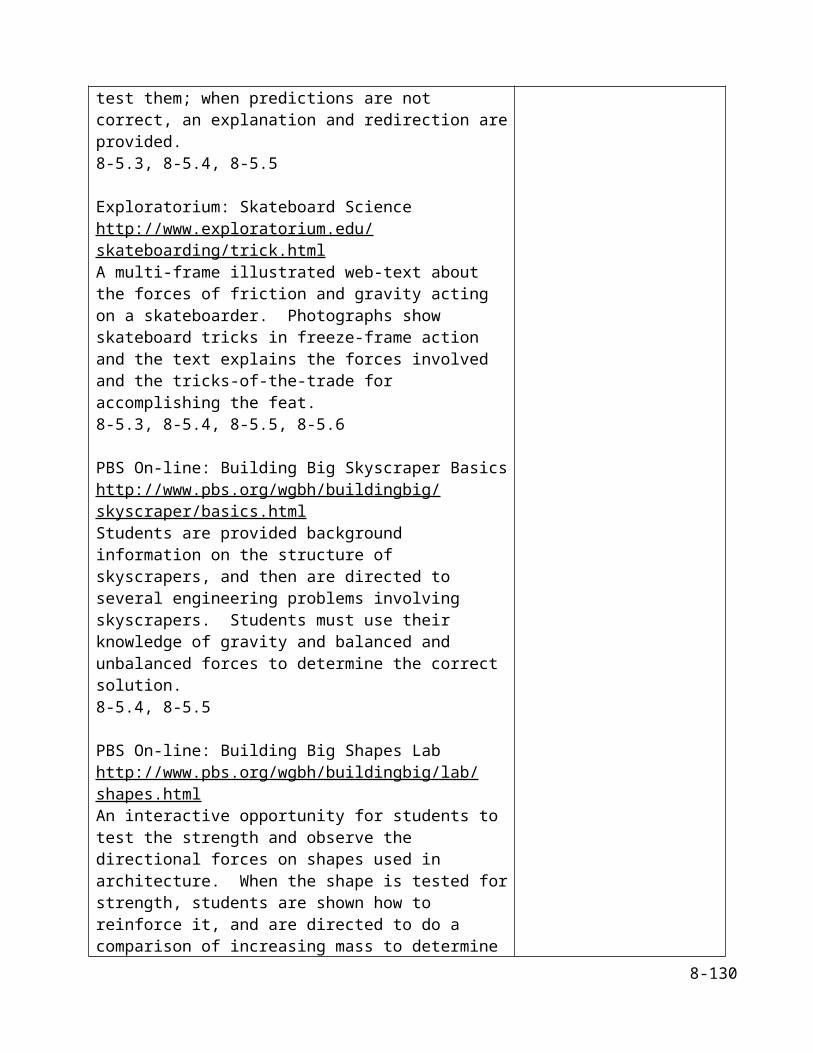
Big Idea – Form and FunctionWaves and Light
Indicator:8-6.7 Explain how the absorption and reflection of light waves by
various materials result in the human perception of color.Taxonomy level: 2.7-B Understand Conceptual Understanding
Essential Question(s):How do humans see color?
Previous/Future knowledge: Students have been introduced to the concept of color (4-5.2) and absorption and reflection of light (4-5.3) in 4th grade. Students have not been introduced to concept of the human perception of color in previous grades. Indicator 8-6.4 also relates color to the wave behaviors of reflection and absorption. Students will further develop the concepts of reflection and interference of light waves in Physical Science (PS-7.6).
It is essential for students to know that the absorption and reflection of light waves by various materials results in human perception of color as follows:
Most materials absorb light of some frequencies and reflect the rest. If a material absorbs a certain frequency of light, that frequency will not be
reflected, so its color will not be perceived by the observer. If the material does not absorb a certain frequency of light, that frequency will be
reflected, so its color will be perceived by the observer. If all colors of light are reflected by a material, it will appear white. If all colors of
light are absorbed by a material, it will appear black. The color that we see depends on (1) the color of light that is shined on the object
and (2) the color of light that is reflected by the object. For example, if an object reflects red wavelengths and absorbs all others, the object will appear red in color.
Color filters allow only certain colors of light to pass/transmit through them; they absorb or reflect all other colors. For example, a blue filter only transmits blue light. Objects seen through a blue filter will look blue if the objects reflect blue; objects of other colors will appear black because the other color wavelengths are being absorbed by the filter.
It is not essential for students to know which frequencies of light are perceived as which colors. The mixing of primary colors of light or of primary pigments is also not essential.
Assessment Guidelines :
8- 130

The objective of this indicator is to explain how the absorption and reflection of light waves by various materials result in the human perception of color; therefore, the primary focus of assessment should be to develop a cause-and-effect model that depicts absorption and reflection of light resulting in certain colors being seen. However, appropriate assessment should also require students to recall that light is made up of various frequencies that relate to the color perceived by humans; interpret a diagram of how colored materials reflect or absorb light; infer what is being reflected and what is being absorbed by a colored material; summarize the process by which light is absorbed or reflected by various materials; or exemplify of light being absorbed or reflected by various materials.
8- 131
Big Idea – Form and FunctionWaves and Light
Indicator:8-6.8 Compare the wavelength and energy of waves in various parts of
the electromagnetic spectrum (visible light, infrared, and ultraviolet radiation).Taxonomy level: 2.6-B Understand Conceptual Knowledge
Essential Question(s):What is the electromagnetic spectrum?
Previous/Future knowledge: Students have not been introduced to the concept of the electromagnetic spectrum in previous grades. Students are introduced to the concept of electromagnetic waves in this unit in 8th grade (8-6.2). Students will further develop the concept of quantitative relationships in properties of waves in high school Physical Science (PS-7.5).
It is essential for students to know that electromagnetic waves have a wide range of wavelengths. The entire range of wavelengths is called the electromagnetic spectrum. The relationship between the wavelength and energy of waves in various parts of the electromagnetic spectrum can be shown as follows:
http://molaire1.club.fr/e_quantic.html
8- 132
Visible light Visible light is the range of electromagnetic waves that can be detected by the
human eye. The entire range of visible light is called the visible light spectrum. The wavelengths of visible light are in the middle range of
wavelengths/frequencies of electromagnetic waves. The longer the wavelength, the lower the energy of the wave is. The human eye reacts to different energies and frequencies of light so that
different colors are seen.o Higher frequencies (shorter wavelengths) are perceived as colors toward
the blue-violet range and have higher energy.o Lower frequencies (longer wavelengths) are perceived as colors toward
the orange-red range and have lower energy.
Infrared radiation Infrared radiation is the range of electromagnetic waves with frequencies lower
than red on the visible spectrum, thereby having longer wavelengths and less energy than red wavelengths.
All objects emit infrared radiation, and hotter objects emit more infrared radiation than cooler objects.
Heat energy is transmitted by infrared radiation. When objects absorb infrared radiation, they become warmer.
Ultraviolet radiation Ultraviolet radiation is the range of electromagnetic waves with frequencies
higher than violet on the visible spectrum, thereby having shorter wavelengths and more energy than violet wavelengths.
Because of the high energy of ultraviolet radiation, too much exposure is damaging to the eyes and skin.
It is not essential for students to know the specific wavelengths of the various types of electromagnetic radiation, nor do students have to know the relative wavelengths and energies of other forms of radiation than visible light, infrared, and ultraviolet radiation.
Assessment Guidelines:The objective of this indicator is to compare the wavelength and energy of waves in specific parts of the electromagnetic spectrum; therefore, the primary focus of assessment should be to detect similarities and differences related to wavelengths (and therefore frequency) and the energy of infrared, visible, light and ultraviolet waves. However, appropriate assessments should also require students to recognize specific parts of the electromagnetic spectrum that are higher or lower in energy, shorter or longer in wavelengths, and higher or lower in frequency; interpret a diagram of the electromagnetic spectrum; infer which specific parts are higher or lower in wavelength, energy, and frequency; or classify waves by specific characteristics.
8- 133