biglari holdings inc. holdings... · 1 biglari holdings inc. page no. part i – financial...
TRANSCRIPT
UNITED STATES
SECURITIES AND EXCHANGE COMMISSION
Washington, D.C. 20549
FORM 10-Q
QUARTERLY REPORT PURSUANT TO SECTION 13 OR 15(d) OF THE SECURITIES EXCHANGE
ACT OF 1934 For the quarterly period ended December 22, 2010
or
TRANSITION REPORT PURSUANT TO SECTION 13 OR 15(d) OF THE SECURITIES EXCHANGE
ACT OF 1934 For the transition period from ___ to ___
Commission file number 0-8445
BIGLARI HOLDINGS INC. (Exact name of registrant as specified in its charter)
INDIANA 37-0684070
(State or other jurisdiction of incorporation) (I.R.S. Employer Identification No.)
175 East Houston Street, Suite 1300 78205
San Antonio, Texas
(Address of principal executive offices) (Zip code)
(210) 344-3400
(Registrant’s telephone number, including area code)
Not Applicable
(Former name, former address and former fiscal year, if changed since last report)
Indicate by check mark whether the registrant (1) has filed all reports required to be filed by Section 13 or 15(d) of the
Securities Exchange Act of 1934 during the preceding 12 months (or for such shorter period that the registrant was required to file
such reports), and (2) has been subject to such filing requirements for the past 90 days. Yes No �
Indicate by check mark whether the registrant has submitted electronically and posted on its corporate Website, if any, every
Interactive Data File required to be submitted and posted pursuant to Rule 405 of Regulation S-T (Section 232.405 of this chapter)
during the preceding 12 months (or for such shorter period that the registrant was required to submit and post such files). Yes�
No�
Indicate by check mark whether the registrant is a large accelerated filer, an accelerated filer, a non-accelerated filer or a
smaller reporting company. See the definitions of “large accelerated filer,” “accelerated filer," and “smaller reporting company”
in Rule 12b-2 of the Exchange Act.
Large accelerated filer � Accelerated filer Non-accelerated filer � Smaller reporting company �
Indicate by check mark whether the registrant is a shell company (as defined in Rule 12b-2 of the Act). Yes � No
As of January 25, 2011 1,433,927 shares of the registrant’s Common Stock, $.50 stated value, were outstanding.
1
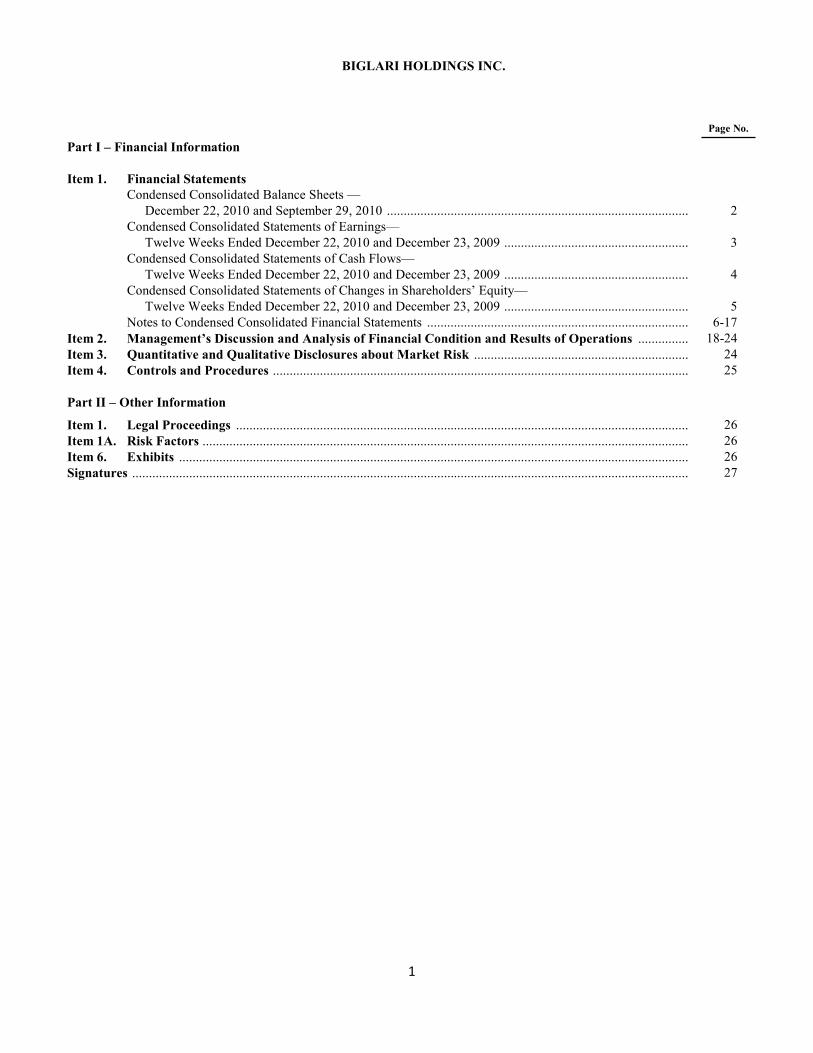
BIGLARI HOLDINGS INC.
Page No.
Part I – Financial Information
Item 1. Financial Statements
Condensed Consolidated Balance Sheets —
December 22, 2010 and September 29, 2010 .......................................................................................... 2
Condensed Consolidated Statements of Earnings—
Twelve Weeks Ended December 22, 2010 and December 23, 2009 ....................................................... 3
Condensed Consolidated Statements of Cash Flows—
Twelve Weeks Ended December 22, 2010 and December 23, 2009 ....................................................... 4
Condensed Consolidated Statements of Changes in Shareholders’ Equity—
Twelve Weeks Ended December 22, 2010 and December 23, 2009 ....................................................... 5
Notes to Condensed Consolidated Financial Statements .............................................................................. 6-17
Item 2. Management’s Discussion and Analysis of Financial Condition and Results of Operations ............... 18-24
Item 3. Quantitative and Qualitative Disclosures about Market Risk ................................................................ 24
Item 4. Controls and Procedures ............................................................................................................................ 25
Part II – Other Information
Item 1. Legal Proceedings ....................................................................................................................................... 26
Item 1A. Risk Factors ................................................................................................................................................. 26
Item 6. Exhibits ........................................................................................................................................................ 26
Signatures ...................................................................................................................................................................... 27
2
Part I Financial Information
Item 1. Financial Statements
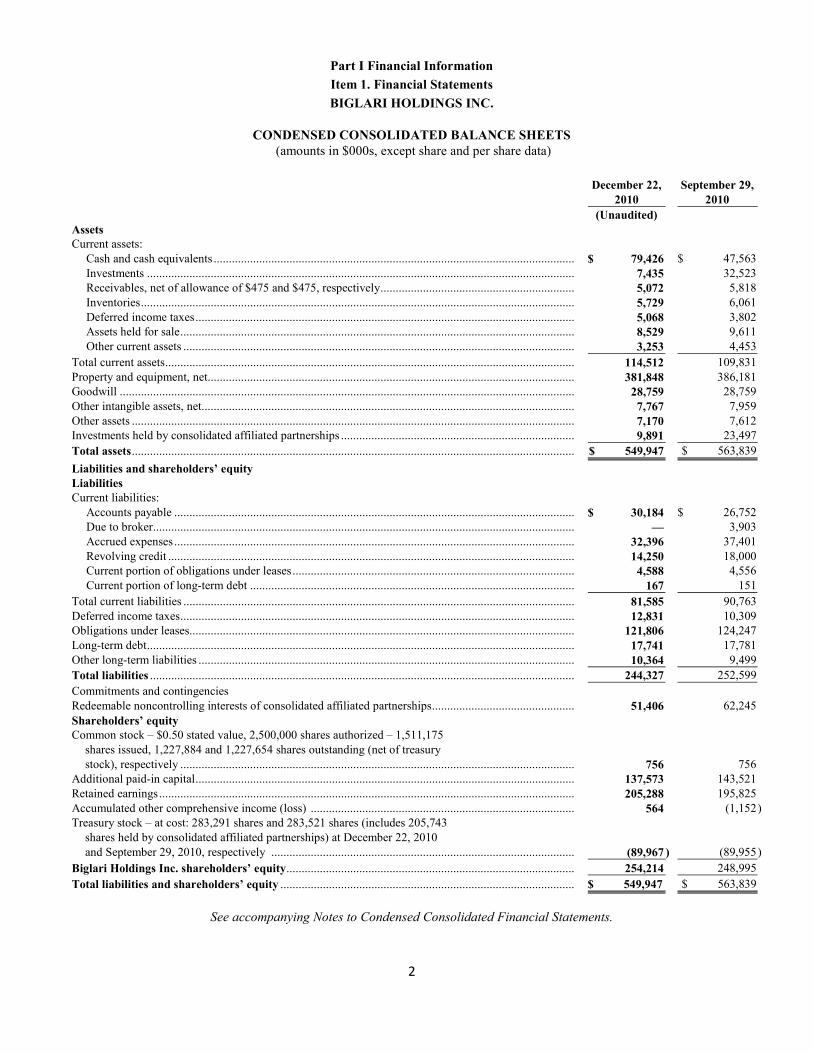
BIGLARI HOLDINGS INC.
CONDENSED CONSOLIDATED BALANCE SHEETS
(amounts in $000s, except share and per share data)
December 22,
2010
September 29,
2010
(Unaudited)
Assets
Current assets:
Cash and cash equivalents ....................................................................................................................... $ 79,426 $ 47,563
Investments ............................................................................................................................................. 7,435 32,523
Receivables, net of allowance of $475 and $475, respectively ................................................................ 5,072 5,818
Inventories ............................................................................................................................................... 5,729 6,061
Deferred income taxes ............................................................................................................................. 5,068 3,802
Assets held for sale .................................................................................................................................. 8,529 9,611
Other current assets ................................................................................................................................. 3,253 4,453
Total current assets ....................................................................................................................................... 114,512 109,831
Property and equipment, net ......................................................................................................................... 381,848 386,181
Goodwill ...................................................................................................................................................... 28,759 28,759
Other intangible assets, net ........................................................................................................................... 7,767 7,959
Other assets .................................................................................................................................................. 7,170 7,612
Investments held by consolidated affiliated partnerships ............................................................................. 9,891 23,497
Total assets .................................................................................................................................................. $ 549,947 $ 563,839
Liabilities and shareholders’ equity
Liabilities
Current liabilities:
Accounts payable .................................................................................................................................... $ 30,184 $ 26,752
Due to broker ........................................................................................................................................... — 3,903
Accrued expenses .................................................................................................................................... 32,396 37,401
Revolving credit ...................................................................................................................................... 14,250 18,000
Current portion of obligations under leases ............................................................................................. 4,588 4,556
Current portion of long-term debt ........................................................................................................... 167 151
Total current liabilities ................................................................................................................................. 81,585 90,763
Deferred income taxes .................................................................................................................................. 12,831 10,309
Obligations under leases............................................................................................................................... 121,806 124,247
Long-term debt ............................................................................................................................................. 17,741 17,781
Other long-term liabilities ............................................................................................................................ 10,364 9,499
Total liabilities ............................................................................................................................................ 244,327 252,599
Commitments and contingencies
Redeemable noncontrolling interests of consolidated affiliated partnerships ............................................... 51,406 62,245
Shareholders’ equity
Common stock – $0.50 stated value, 2,500,000 shares authorized – 1,511,175
shares issued, 1,227,884 and 1,227,654 shares outstanding (net of treasury
stock), respectively ..................................................................................................................................
756
756
Additional paid-in capital ............................................................................................................................. 137,573 143,521
Retained earnings ......................................................................................................................................... 205,288 195,825
Accumulated other comprehensive income (loss) ....................................................................................... 564 (1,152 )
Treasury stock – at cost: 283,291 shares and 283,521 shares (includes 205,743
shares held by consolidated affiliated partnerships) at December 22, 2010
and September 29, 2010, respectively ....................................................................................................
(89,967 )
(89,955 )
Biglari Holdings Inc. shareholders’ equity ............................................................................................... 254,214 248,995
Total liabilities and shareholders’ equity ................................................................................................. $ 549,947 $ 563,839
See accompanying Notes to Condensed Consolidated Financial Statements.
3
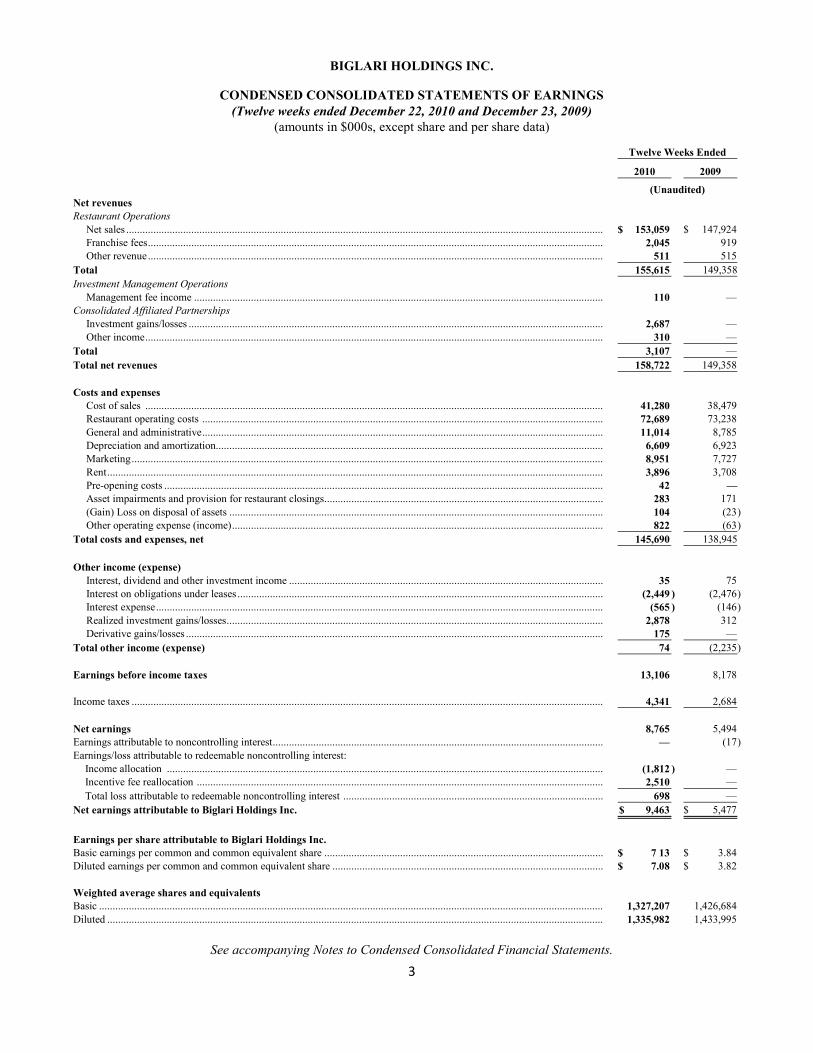
BIGLARI HOLDINGS INC.
CONDENSED CONSOLIDATED STATEMENTS OF EARNINGS
(Twelve weeks ended December 22, 2010 and December 23, 2009)
(amounts in $000s, except share and per share data)
Twelve Weeks Ended
2010 2009
(Unaudited)
Net revenues
Restaurant Operations
Net sales ................................................................................................................................................................................ $ 153,059 $ 147,924
Franchise fees ........................................................................................................................................................................ 2,045 919
Other revenue ........................................................................................................................................................................ 511 515
Total 155,615 149,358
Investment Management Operations
Management fee income ....................................................................................................................................................... 110 —
Consolidated Affiliated Partnerships
Investment gains/losses ......................................................................................................................................................... 2,687 —
Other income ......................................................................................................................................................................... 310 —
Total 3,107 —
Total net revenues 158,722 149,358
Costs and expenses
Cost of sales ......................................................................................................................................................................... 41,280 38,479
Restaurant operating costs .................................................................................................................................................... 72,689 73,238
General and administrative .................................................................................................................................................... 11,014 8,785
Depreciation and amortization............................................................................................................................................... 6,609 6,923
Marketing .............................................................................................................................................................................. 8,951 7,727
Rent ....................................................................................................................................................................................... 3,896 3,708
Pre-opening costs .................................................................................................................................................................. 42 —
Asset impairments and provision for restaurant closings ....................................................................................................... 283 171
(Gain) Loss on disposal of assets .......................................................................................................................................... 104 (23 )
Other operating expense (income) ......................................................................................................................................... 822 (63 )
Total costs and expenses, net 145,690 138,945
Other income (expense)
Interest, dividend and other investment income .................................................................................................................... 35 75
Interest on obligations under leases ....................................................................................................................................... (2,449 ) (2,476 )
Interest expense ..................................................................................................................................................................... (565 ) (146 )
Realized investment gains/losses ........................................................................................................................................... 2,878 312
Derivative gains/losses .......................................................................................................................................................... 175 —
Total other income (expense) 74 (2,235 )
Earnings before income taxes 13,106 8,178
Income taxes .............................................................................................................................................................................. 4,341 2,684
Net earnings 8,765 5,494
Earnings attributable to noncontrolling interest .......................................................................................................................... — (17 )
Earnings/loss attributable to redeemable noncontrolling interest:
Income allocation ................................................................................................................................................................. (1,812 ) —
Incentive fee reallocation ...................................................................................................................................................... 2,510 —
Total loss attributable to redeemable noncontrolling interest ................................................................................................ 698 —
Net earnings attributable to Biglari Holdings Inc. $ 9,463 $ 5,477
Earnings per share attributable to Biglari Holdings Inc.
Basic earnings per common and common equivalent share ....................................................................................................... $ 7 13 $ 3.84
Diluted earnings per common and common equivalent share .................................................................................................... $ 7.08 $ 3.82
Weighted average shares and equivalents
Basic .......................................................................................................................................................................................... 1,327,207 1,426,684
Diluted ....................................................................................................................................................................................... 1,335,982 1,433,995
See accompanying Notes to Condensed Consolidated Financial Statements.
4
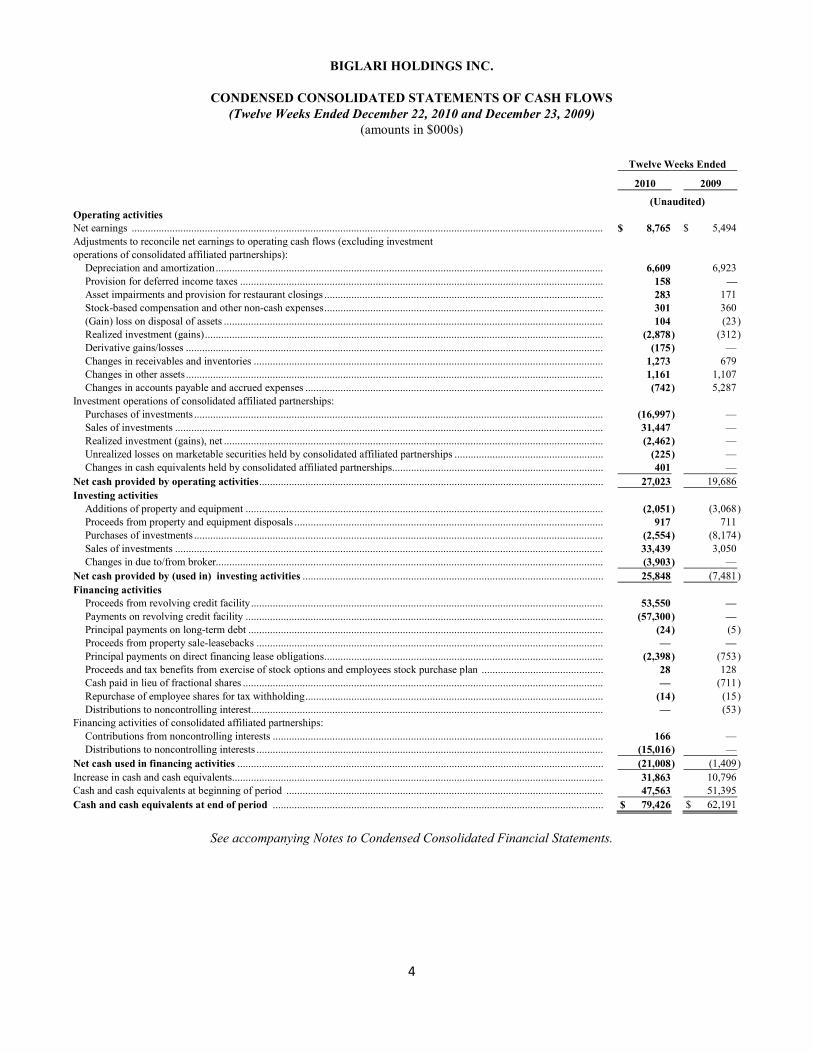
BIGLARI HOLDINGS INC.
CONDENSED CONSOLIDATED STATEMENTS OF CASH FLOWS
(Twelve Weeks Ended December 22, 2010 and December 23, 2009)
(amounts in $000s)
Twelve Weeks Ended
2010 2009
(Unaudited)
Operating activities
Net earnings .............................................................................................................................................................................. $ 8,765 $ 5,494
Adjustments to reconcile net earnings to operating cash flows (excluding investment
operations of consolidated affiliated partnerships):
Depreciation and amortization ............................................................................................................................................... 6,609 6,923
Provision for deferred income taxes ...................................................................................................................................... 158 —
Asset impairments and provision for restaurant closings ....................................................................................................... 283 171
Stock-based compensation and other non-cash expenses ....................................................................................................... 301 360
(Gain) loss on disposal of assets ............................................................................................................................................ 104 (23 )
Realized investment (gains) ................................................................................................................................................... (2,878 ) (312 )
Derivative gains/losses .......................................................................................................................................................... (175 ) —
Changes in receivables and inventories ................................................................................................................................. 1,273 679
Changes in other assets .......................................................................................................................................................... 1,161 1,107
Changes in accounts payable and accrued expenses .............................................................................................................. (742 ) 5,287
Investment operations of consolidated affiliated partnerships:
Purchases of investments ....................................................................................................................................................... (16,997 ) —
Sales of investments .............................................................................................................................................................. 31,447 —
Realized investment (gains), net ............................................................................................................................................ (2,462 ) —
Unrealized losses on marketable securities held by consolidated affiliated partnerships ....................................................... (225 ) —
Changes in cash equivalents held by consolidated affiliated partnerships .............................................................................. 401 —
Net cash provided by operating activities ............................................................................................................................... 27,023 19,686
Investing activities
Additions of property and equipment .................................................................................................................................... (2,051 ) (3,068 )
Proceeds from property and equipment disposals .................................................................................................................. 917 711
Purchases of investments ....................................................................................................................................................... (2,554 ) (8,174 )
Sales of investments .............................................................................................................................................................. 33,439 3,050
Changes in due to/from broker............................................................................................................................................... (3,903 ) —
Net cash provided by (used in) investing activities ............................................................................................................... 25,848 (7,481 )
Financing activities
Proceeds from revolving credit facility .................................................................................................................................. 53,550 —
Payments on revolving credit facility .................................................................................................................................... (57,300 ) —
Principal payments on long-term debt ................................................................................................................................... (24 ) (5 )
Proceeds from property sale-leasebacks ................................................................................................................................ — —
Principal payments on direct financing lease obligations ....................................................................................................... (2,398 ) (753 )
Proceeds and tax benefits from exercise of stock options and employees stock purchase plan ............................................. 28 128
Cash paid in lieu of fractional shares ..................................................................................................................................... — (711 )
Repurchase of employee shares for tax withholding .............................................................................................................. (14 ) (15 )
Distributions to noncontrolling interest.................................................................................................................................. — (53 )
Financing activities of consolidated affiliated partnerships:
Contributions from noncontrolling interests .......................................................................................................................... 166 —
Distributions to noncontrolling interests ................................................................................................................................ (15,016 ) —
Net cash used in financing activities ....................................................................................................................................... (21,008 ) (1,409 )
Increase in cash and cash equivalents ......................................................................................................................................... 31,863 10,796
Cash and cash equivalents at beginning of period ..................................................................................................................... 47,563 51,395
Cash and cash equivalents at end of period .......................................................................................................................... $ 79,426 $ 62,191
See accompanying Notes to Condensed Consolidated Financial Statements.
5
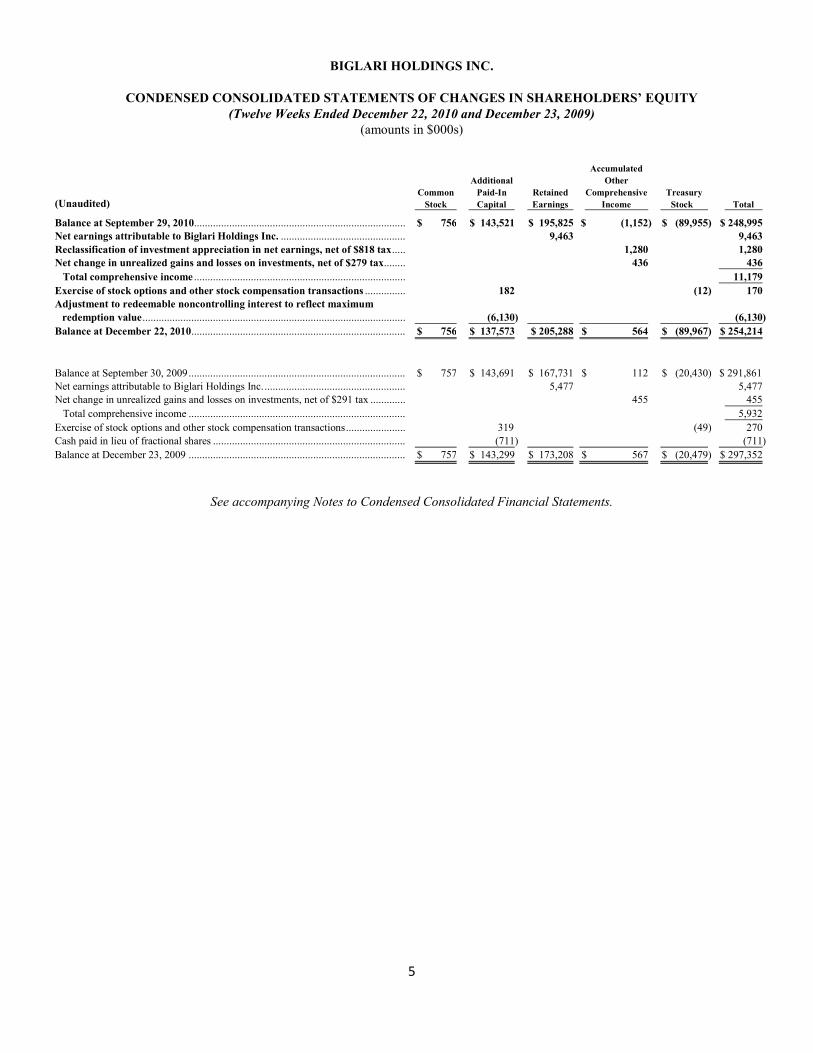
BIGLARI HOLDINGS INC.
CONDENSED CONSOLIDATED STATEMENTS OF CHANGES IN SHAREHOLDERS’ EQUITY
(Twelve Weeks Ended December 22, 2010 and December 23, 2009)
(amounts in $000s)
(Unaudited) Common
Stock
Additional
Paid-In
Capital
Retained
Earnings
Accumulated
Other
Comprehensive
Income
Treasury
Stock Total
Balance at September 29, 2010.............................................................................. $ 756 $ 143,521 $ 195,825 $ (1,152) $ (89,955) $ 248,995
Net earnings attributable to Biglari Holdings Inc. .............................................. 9,463 9,463
Reclassification of investment appreciation in net earnings, net of $818 tax ..... 1,280 1,280
Net change in unrealized gains and losses on investments, net of $279 tax ........ 436 436
Total comprehensive income .............................................................................. 11,179
Exercise of stock options and other stock compensation transactions ............... 182 (12) 170
Adjustment to redeemable noncontrolling interest to reflect maximum
redemption value .................................................................................................
(6,130)
(6,130)
Balance at December 22, 2010 ............................................................................... $ 756 $ 137,573 $ 205,288 $ 564 $ (89,967) $ 254,214
Balance at September 30, 2009 ................................................................................ $ 757 $ 143,691 $ 167,731 $ 112 $ (20,430) $ 291,861
Net earnings attributable to Biglari Holdings Inc. .................................................... 5,477 5,477
Net change in unrealized gains and losses on investments, net of $291 tax ............. 455 455
Total comprehensive income ................................................................................ 5,932
Exercise of stock options and other stock compensation transactions ...................... 319 (49) 270
Cash paid in lieu of fractional shares ....................................................................... (711) (711)
Balance at December 23, 2009 ................................................................................ $ 757 $ 143,299 $ 173,208 $ 567 $ (20,479) $ 297,352
See accompanying Notes to Condensed Consolidated Financial Statements.
6
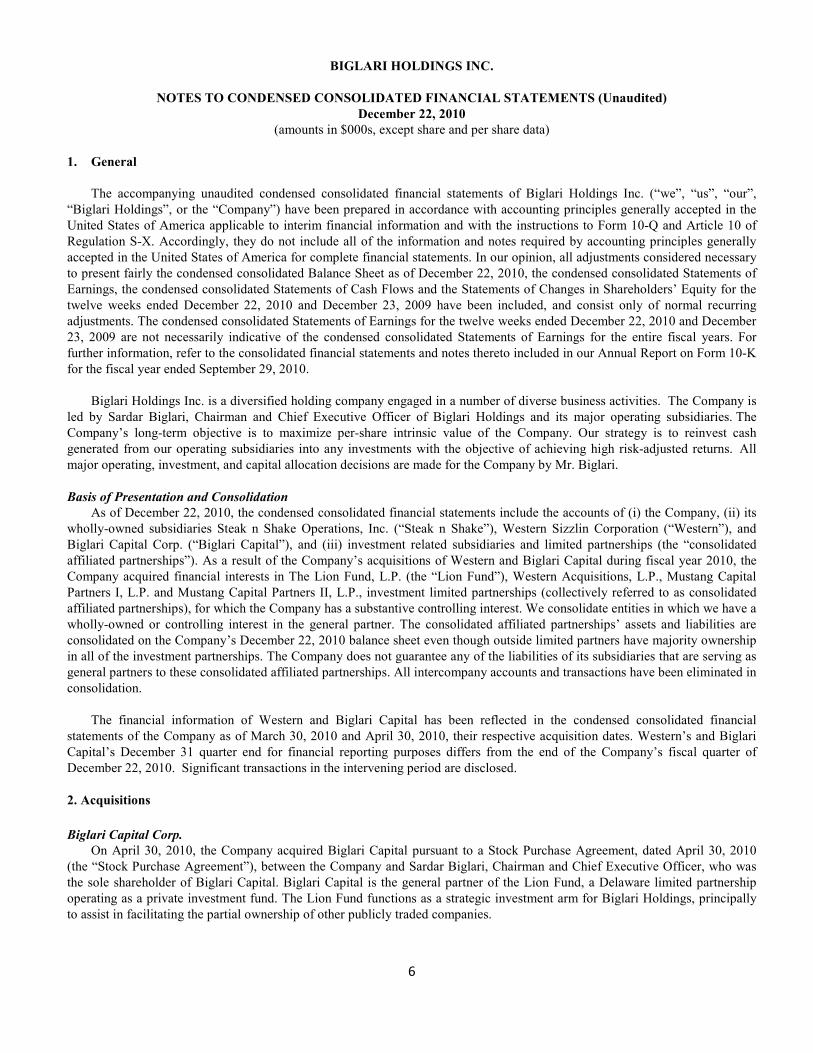
BIGLARI HOLDINGS INC.
NOTES TO CONDENSED CONSOLIDATED FINANCIAL STATEMENTS (Unaudited)
December 22, 2010
(amounts in $000s, except share and per share data)
1. General
The accompanying unaudited condensed consolidated financial statements of Biglari Holdings Inc. (“we”, “us”, “our”,
“Biglari Holdings”, or the “Company”) have been prepared in accordance with accounting principles generally accepted in the
United States of America applicable to interim financial information and with the instructions to Form 10-Q and Article 10 of
Regulation S-X. Accordingly, they do not include all of the information and notes required by accounting principles generally
accepted in the United States of America for complete financial statements. In our opinion, all adjustments considered necessary
to present fairly the condensed consolidated Balance Sheet as of December 22, 2010, the condensed consolidated Statements of
Earnings, the condensed consolidated Statements of Cash Flows and the Statements of Changes in Shareholders’ Equity for the
twelve weeks ended December 22, 2010 and December 23, 2009 have been included, and consist only of normal recurring
adjustments. The condensed consolidated Statements of Earnings for the twelve weeks ended December 22, 2010 and December
23, 2009 are not necessarily indicative of the condensed consolidated Statements of Earnings for the entire fiscal years. For
further information, refer to the consolidated financial statements and notes thereto included in our Annual Report on Form 10-K
for the fiscal year ended September 29, 2010.
Biglari Holdings Inc. is a diversified holding company engaged in a number of diverse business activities. The Company is
led by Sardar Biglari, Chairman and Chief Executive Officer of Biglari Holdings and its major operating subsidiaries. The
Company’s long-term objective is to maximize per-share intrinsic value of the Company. Our strategy is to reinvest cash
generated from our operating subsidiaries into any investments with the objective of achieving high risk-adjusted returns. All
major operating, investment, and capital allocation decisions are made for the Company by Mr. Biglari.
Basis of Presentation and Consolidation
As of December 22, 2010, the condensed consolidated financial statements include the accounts of (i) the Company, (ii) its
wholly-owned subsidiaries Steak n Shake Operations, Inc. (“Steak n Shake”), Western Sizzlin Corporation (“Western”), and
Biglari Capital Corp. (“Biglari Capital”), and (iii) investment related subsidiaries and limited partnerships (the “consolidated
affiliated partnerships”). As a result of the Company’s acquisitions of Western and Biglari Capital during fiscal year 2010, the
Company acquired financial interests in The Lion Fund, L.P. (the “Lion Fund”), Western Acquisitions, L.P., Mustang Capital
Partners I, L.P. and Mustang Capital Partners II, L.P., investment limited partnerships (collectively referred to as consolidated
affiliated partnerships), for which the Company has a substantive controlling interest. We consolidate entities in which we have a
wholly-owned or controlling interest in the general partner. The consolidated affiliated partnerships’ assets and liabilities are
consolidated on the Company’s December 22, 2010 balance sheet even though outside limited partners have majority ownership
in all of the investment partnerships. The Company does not guarantee any of the liabilities of its subsidiaries that are serving as
general partners to these consolidated affiliated partnerships. All intercompany accounts and transactions have been eliminated in
consolidation.
The financial information of Western and Biglari Capital has been reflected in the condensed consolidated financial
statements of the Company as of March 30, 2010 and April 30, 2010, their respective acquisition dates. Western’s and Biglari
Capital’s December 31 quarter end for financial reporting purposes differs from the end of the Company’s fiscal quarter of
December 22, 2010. Significant transactions in the intervening period are disclosed.
2. Acquisitions
Biglari Capital Corp.
On April 30, 2010, the Company acquired Biglari Capital pursuant to a Stock Purchase Agreement, dated April 30, 2010
(the “Stock Purchase Agreement”), between the Company and Sardar Biglari, Chairman and Chief Executive Officer, who was
the sole shareholder of Biglari Capital. Biglari Capital is the general partner of the Lion Fund, a Delaware limited partnership
operating as a private investment fund. The Lion Fund functions as a strategic investment arm for Biglari Holdings, principally
to assist in facilitating the partial ownership of other publicly traded companies.
7
Pursuant to the Stock Purchase Agreement, Mr. Biglari sold all of the shares of Biglari Capital to the Company for a
purchase price of $1.00 plus (i) an amount equal to Biglari Capital’s adjusted capital balance in its capacity as general partner of
the Lion Fund, and (ii) an amount equal to the total incentive reallocation allocable to Biglari Capital for the period from January
1, 2010 through April 30, 2010, less any distributions in respect of such amounts previously received by Mr. Biglari. The
payments set forth in clauses (i) and (ii) total $4,107.
In accordance with the Stock Purchase Agreement, the Company prepared and filed with the Securities and Exchange
Commission on September 29, 2010, proxy materials for a special meeting of its shareholders. At the special meeting, held
November 5, 2010, the Company submitted the Incentive Bonus Agreement (which the Company entered into with Mr. Biglari)
for approval by its shareholders for purposes of Section 162(m) under the Internal Revenue Code of 1986, as amended (the
“Code”), in order to preserve the tax deductibility to the Company of the performance-based compensation payable to Mr.
Biglari under such agreement. The Incentive Bonus Agreement was approved by the shareholders.
Because Biglari Capital is the general partner of the Lion Fund and has a substantive controlling interest, the Company has
consolidated the Lion Fund. The Lion Fund is an investment fund that accounts for its investments at fair value. The fair value of
the noncontrolling interest approximated the net asset value of the Lion Fund attributable to investors other than the Company,
less the accrued incentive reallocation at the time of the acquisition. The Lion Fund investors may redeem their interests in the
Lion Fund upon certain occurrences.
At the acquisition date, the Lion Fund owned 76,421 shares of common stock of the Company as well as $7,540 of the
Company’s debentures. The fair value of the Company stock owned by the Lion Fund was $29,900, which was recorded as
Treasury stock yet the shares remain outstanding. The debentures owned by the Lion Fund were recorded as a debt
extinguishment. As the debentures had just been issued by the Company 30 days before the acquisition, the fair value of the
debentures approximated their cost, and no gain or loss was recorded on the debt extinguishment (the debentures remain
outstanding). The noncontrolling interest in the Lion Fund had a fair value of $44,193 as of April 30, 2010.
The Company accounted for the acquisition in accordance with ASC Topic 805, whereby the purchase price paid is
allocated to the assets acquired and liabilities assumed from Biglari Capital based on their estimated fair values as of the closing
date.
The following table represents the Company’s assessment of the total purchase consideration allocated to the estimated fair
values of the assets acquired and liabilities assumed from Biglari Capital as of April 30, 2010:
Purchase
Allocation
Investments ................................................................................................................................................................. $ 10,926
Company debentures .................................................................................................................................................. 7,540
Total assets acquired ................................................................................................................................................ 18,466
Current liabilities ........................................................................................................................................................ 66
Redeemable noncontrolling interests of consolidated affiliated partnerships ............................................................. 44,193
Treasury stock ............................................................................................................................................................ (29,900)
Total liabilities assumed and treasury stock acquired .............................................................................................. 14,359
Net assets acquired ..................................................................................................................................................... $ 4,107
Western Sizzlin Corporation
On March 30, 2010, the Company, through its wholly-owned subsidiary, Grill Acquisition Corporation (“Merger Sub”),
acquired 100% of the outstanding equity interests of Western, pursuant to an Agreement and Plan of Merger among the
Company, Merger Sub and Western, dated as of October 22, 2009 (the “Merger Agreement”). Sardar Biglari, Chairman and
Chief Executive Officer, was also Chairman and Chief Executive Officer of Western at the time of the acquisition. Pursuant to
the Merger Agreement, Merger Sub merged with and into Western, with Western continuing as the surviving corporation and as
a wholly-owned subsidiary of the Company. Western, which is primarily engaged in the franchising of restaurants, includes (i)
Western Sizzlin Franchise Corporation, Western Sizzlin Stores, Inc., Western Sizzlin Stores of Little Rock, Inc., Austins of
Omaha, Inc., Western Investments, Inc., and Western Properties, Inc., wholly-owned subsidiaries, (ii) Western Acquisitions,
L.P., (iii) Western Real Estate, L.P., (iv) Western Mustang Holdings, L.L.C. and Mustang Capital Management, L.L.C., (v)
8
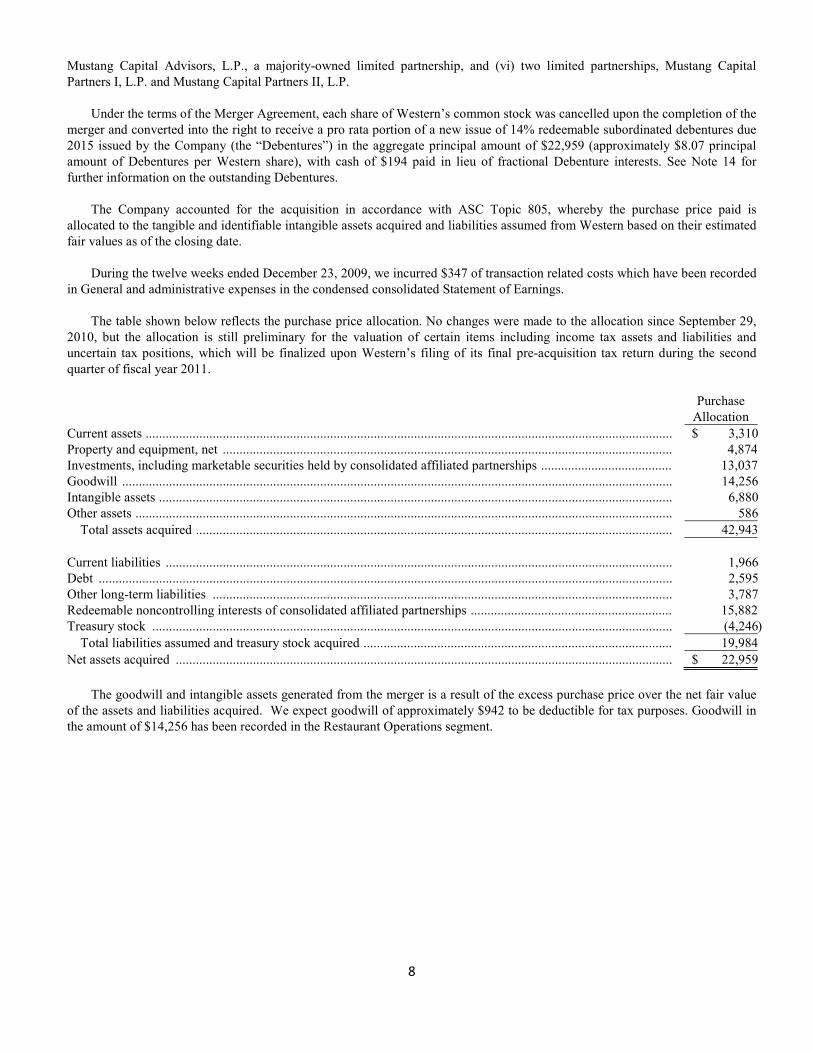
Mustang Capital Advisors, L.P., a majority-owned limited partnership, and (vi) two limited partnerships, Mustang Capital
Partners I, L.P. and Mustang Capital Partners II, L.P.
Under the terms of the Merger Agreement, each share of Western’s common stock was cancelled upon the completion of the
merger and converted into the right to receive a pro rata portion of a new issue of 14% redeemable subordinated debentures due
2015 issued by the Company (the “Debentures”) in the aggregate principal amount of $22,959 (approximately $8.07 principal
amount of Debentures per Western share), with cash of $194 paid in lieu of fractional Debenture interests. See Note 14 for
further information on the outstanding Debentures.
The Company accounted for the acquisition in accordance with ASC Topic 805, whereby the purchase price paid is
allocated to the tangible and identifiable intangible assets acquired and liabilities assumed from Western based on their estimated
fair values as of the closing date.
During the twelve weeks ended December 23, 2009, we incurred $347 of transaction related costs which have been recorded
in General and administrative expenses in the condensed consolidated Statement of Earnings.
The table shown below reflects the purchase price allocation. No changes were made to the allocation since September 29,
2010, but the allocation is still preliminary for the valuation of certain items including income tax assets and liabilities and
uncertain tax positions, which will be finalized upon Western’s filing of its final pre-acquisition tax return during the second
quarter of fiscal year 2011.
Purchase
Allocation
Current assets ............................................................................................................................................................. $ 3,310
Property and equipment, net ...................................................................................................................................... 4,874
Investments, including marketable securities held by consolidated affiliated partnerships ....................................... 13,037
Goodwill .................................................................................................................................................................... 14,256
Intangible assets ......................................................................................................................................................... 6,880
Other assets ................................................................................................................................................................ 586
Total assets acquired .............................................................................................................................................. 42,943
Current liabilities ....................................................................................................................................................... 1,966
Debt ........................................................................................................................................................................... 2,595
Other long-term liabilities ......................................................................................................................................... 3,787
Redeemable noncontrolling interests of consolidated affiliated partnerships ............................................................ 15,882
Treasury stock ........................................................................................................................................................... (4,246 )
Total liabilities assumed and treasury stock acquired ............................................................................................ 19,984
Net assets acquired .................................................................................................................................................... $ 22,959
The goodwill and intangible assets generated from the merger is a result of the excess purchase price over the net fair value
of the assets and liabilities acquired. We expect goodwill of approximately $942 to be deductible for tax purposes. Goodwill in
the amount of $14,256 has been recorded in the Restaurant Operations segment.
9
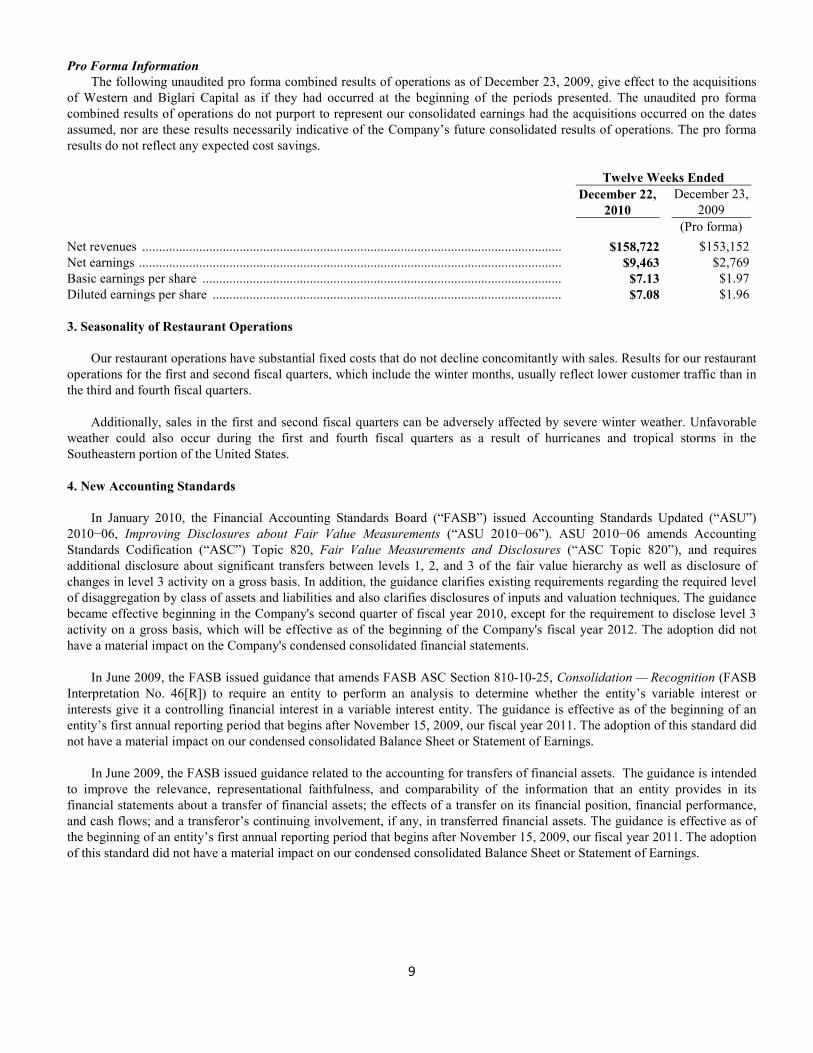
Pro Forma Information
The following unaudited pro forma combined results of operations as of December 23, 2009, give effect to the acquisitions
of Western and Biglari Capital as if they had occurred at the beginning of the periods presented. The unaudited pro forma
combined results of operations do not purport to represent our consolidated earnings had the acquisitions occurred on the dates
assumed, nor are these results necessarily indicative of the Company’s future consolidated results of operations. The pro forma
results do not reflect any expected cost savings.
Twelve Weeks Ended
December 22,
2010
December 23,
2009
(Pro forma)
Net revenues ............................................................................................................................. $158,722 $153,152
Net earnings .............................................................................................................................. $9,463 $2,769
Basic earnings per share ........................................................................................................... $7.13 $1.97
Diluted earnings per share ........................................................................................................ $7.08 $1.96
3. Seasonality of Restaurant Operations
Our restaurant operations have substantial fixed costs that do not decline concomitantly with sales. Results for our restaurant
operations for the first and second fiscal quarters, which include the winter months, usually reflect lower customer traffic than in
the third and fourth fiscal quarters.
Additionally, sales in the first and second fiscal quarters can be adversely affected by severe winter weather. Unfavorable
weather could also occur during the first and fourth fiscal quarters as a result of hurricanes and tropical storms in the
Southeastern portion of the United States.
4. New Accounting Standards
In January 2010, the Financial Accounting Standards Board (“FASB”) issued Accounting Standards Updated (“ASU”)
2010−06, Improving Disclosures about Fair Value Measurements (“ASU 2010−06”). ASU 2010−06 amends Accounting
Standards Codification (“ASC”) Topic 820, Fair Value Measurements and Disclosures (“ASC Topic 820”), and requires
additional disclosure about significant transfers between levels 1, 2, and 3 of the fair value hierarchy as well as disclosure of
changes in level 3 activity on a gross basis. In addition, the guidance clarifies existing requirements regarding the required level
of disaggregation by class of assets and liabilities and also clarifies disclosures of inputs and valuation techniques. The guidance
became effective beginning in the Company's second quarter of fiscal year 2010, except for the requirement to disclose level 3
activity on a gross basis, which will be effective as of the beginning of the Company's fiscal year 2012. The adoption did not
have a material impact on the Company's condensed consolidated financial statements.
In June 2009, the FASB issued guidance that amends FASB ASC Section 810-10-25, Consolidation — Recognition (FASB
Interpretation No. 46[R]) to require an entity to perform an analysis to determine whether the entity’s variable interest or
interests give it a controlling financial interest in a variable interest entity. The guidance is effective as of the beginning of an
entity’s first annual reporting period that begins after November 15, 2009, our fiscal year 2011. The adoption of this standard did
not have a material impact on our condensed consolidated Balance Sheet or Statement of Earnings.
In June 2009, the FASB issued guidance related to the accounting for transfers of financial assets. The guidance is intended
to improve the relevance, representational faithfulness, and comparability of the information that an entity provides in its
financial statements about a transfer of financial assets; the effects of a transfer on its financial position, financial performance,
and cash flows; and a transferor’s continuing involvement, if any, in transferred financial assets. The guidance is effective as of
the beginning of an entity’s first annual reporting period that begins after November 15, 2009, our fiscal year 2011. The adoption
of this standard did not have a material impact on our condensed consolidated Balance Sheet or Statement of Earnings.
10
5. Reclassifications
Certain prior year amounts have been reclassified to conform to the current year’s presentation. The reclassifications
primarily relate to the reorganization of our condensed consolidated Statement of Earnings to better align with the Company’s
new holding company structure and diversification into other industries. The reclassifications had no effect on net earnings, total
assets, or cash flows. Amounts reclassified for the twelve weeks ended December 23, 2009 included:
• Reclassification of $2,622 from interest expense previously included in Costs and expenses to Interest on
obligations under leases and Interest expense within Other income;
• Reclassification of $515 from Other operating income to Other revenue within restaurant operations, primarily
representing revenue generated from rental income;
• Reclassification of $338 from Other operating income to Net sales, primarily representing revenue from ancillary
sources.
The remaining reclassifications were immaterial individually and in the aggregate.
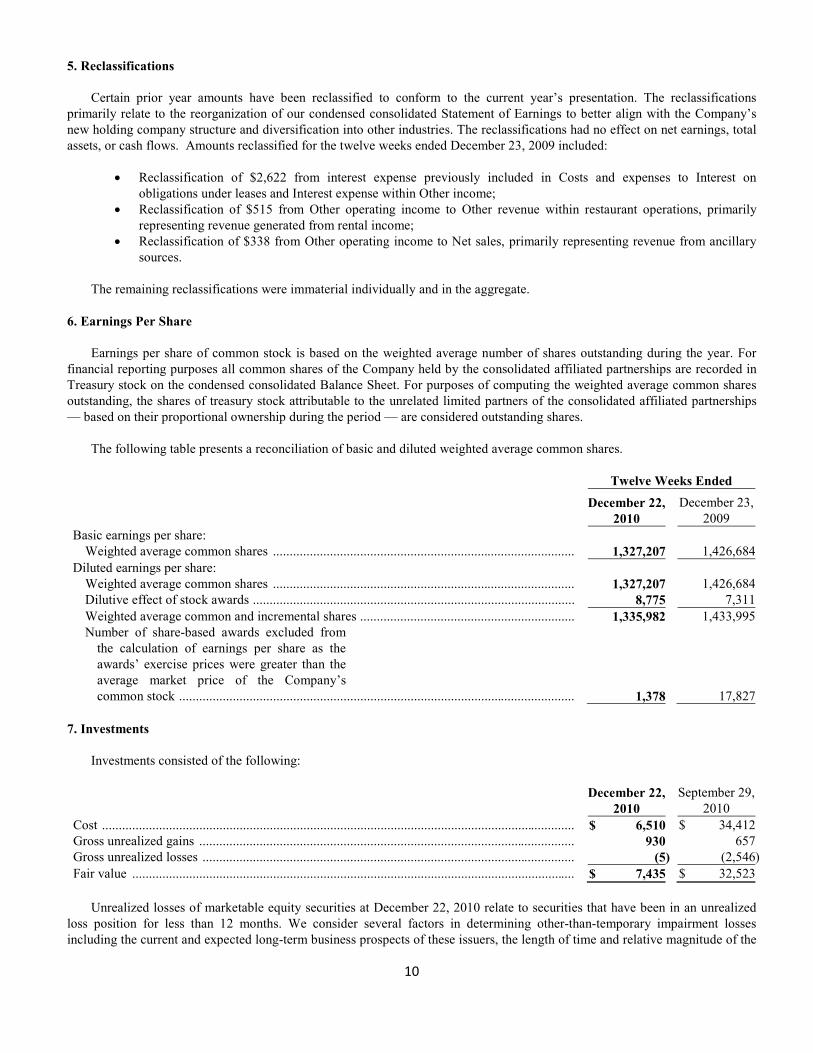
6. Earnings Per Share
Earnings per share of common stock is based on the weighted average number of shares outstanding during the year. For
financial reporting purposes all common shares of the Company held by the consolidated affiliated partnerships are recorded in
Treasury stock on the condensed consolidated Balance Sheet. For purposes of computing the weighted average common shares
outstanding, the shares of treasury stock attributable to the unrelated limited partners of the consolidated affiliated partnerships
— based on their proportional ownership during the period — are considered outstanding shares.
The following table presents a reconciliation of basic and diluted weighted average common shares.
Twelve Weeks Ended
December 22, December 23,
2010 2009
Basic earnings per share:
Weighted average common shares .......................................................................................... 1,327,207 1,426,684
Diluted earnings per share:
Weighted average common shares .......................................................................................... 1,327,207 1,426,684
Dilutive effect of stock awards ................................................................................................ 8,775 7,311
Weighted average common and incremental shares ................................................................ 1,335,982 1,433,995
Number of share-based awards excluded from
the calculation of earnings per share as the
awards’ exercise prices were greater than the
average market price of the Company’s
common stock ......................................................................................................................
1,378
17,827
7. Investments
Investments consisted of the following:
December 22, September 29,
2010 2010
Cost ............................................................................................................................................. $ 6,510 $ 34,412
Gross unrealized gains ................................................................................................................ 930 657
Gross unrealized losses ............................................................................................................... (5) (2,546)
Fair value .................................................................................................................................... $ 7,435 $ 32,523
Unrealized losses of marketable equity securities at December 22, 2010 relate to securities that have been in an unrealized
loss position for less than 12 months. We consider several factors in determining other-than-temporary impairment losses
including the current and expected long-term business prospects of these issuers, the length of time and relative magnitude of the
11
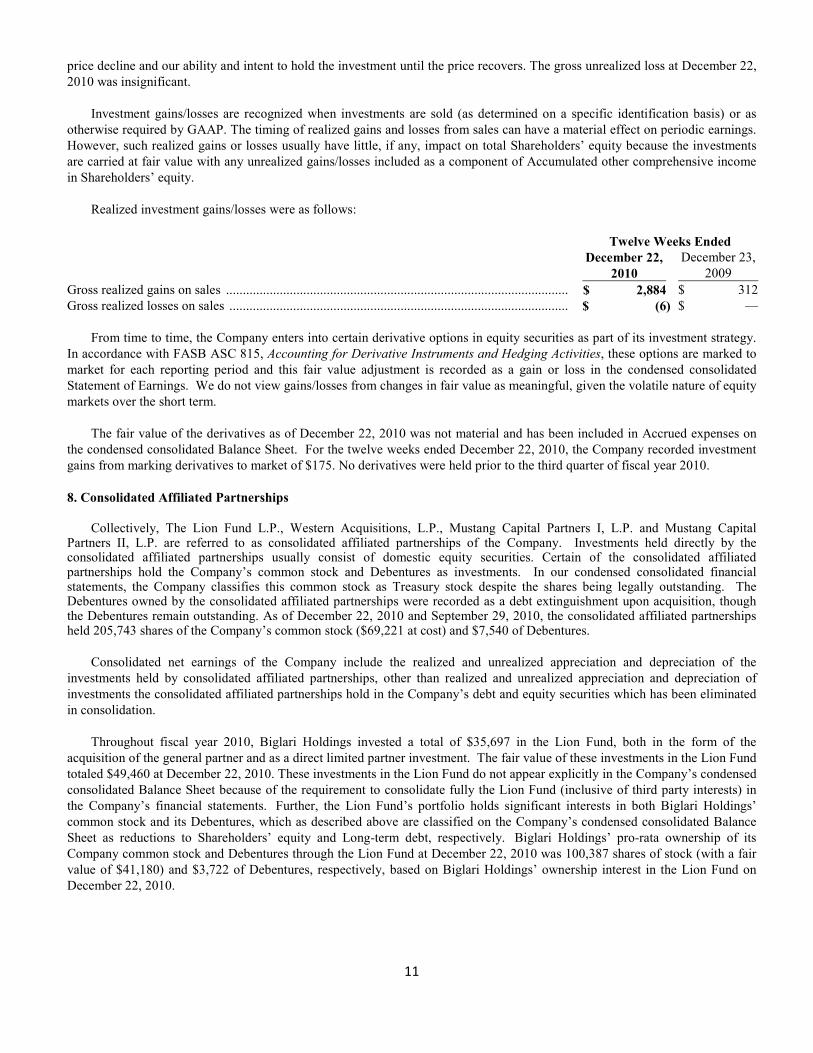
price decline and our ability and intent to hold the investment until the price recovers. The gross unrealized loss at December 22,
2010 was insignificant.
Investment gains/losses are recognized when investments are sold (as determined on a specific identification basis) or as
otherwise required by GAAP. The timing of realized gains and losses from sales can have a material effect on periodic earnings.
However, such realized gains or losses usually have little, if any, impact on total Shareholders’ equity because the investments
are carried at fair value with any unrealized gains/losses included as a component of Accumulated other comprehensive income
in Shareholders’ equity.
Realized investment gains/losses were as follows:
Twelve Weeks Ended
December 22, December 23,
2010 2009
Gross realized gains on sales ...................................................................................................... $ 2,884 $ 312
Gross realized losses on sales ..................................................................................................... $ (6) $ —
From time to time, the Company enters into certain derivative options in equity securities as part of its investment strategy.
In accordance with FASB ASC 815, Accounting for Derivative Instruments and Hedging Activities, these options are marked to
market for each reporting period and this fair value adjustment is recorded as a gain or loss in the condensed consolidated
Statement of Earnings. We do not view gains/losses from changes in fair value as meaningful, given the volatile nature of equity
markets over the short term.
The fair value of the derivatives as of December 22, 2010 was not material and has been included in Accrued expenses on
the condensed consolidated Balance Sheet. For the twelve weeks ended December 22, 2010, the Company recorded investment
gains from marking derivatives to market of $175. No derivatives were held prior to the third quarter of fiscal year 2010.
8. Consolidated Affiliated Partnerships
Collectively, The Lion Fund L.P., Western Acquisitions, L.P., Mustang Capital Partners I, L.P. and Mustang Capital
Partners II, L.P. are referred to as consolidated affiliated partnerships of the Company. Investments held directly by the consolidated affiliated partnerships usually consist of domestic equity securities. Certain of the consolidated affiliated partnerships hold the Company’s common stock and Debentures as investments. In our condensed consolidated financial statements, the Company classifies this common stock as Treasury stock despite the shares being legally outstanding. The Debentures owned by the consolidated affiliated partnerships were recorded as a debt extinguishment upon acquisition, though the Debentures remain outstanding. As of December 22, 2010 and September 29, 2010, the consolidated affiliated partnerships held 205,743 shares of the Company’s common stock ($69,221 at cost) and $7,540 of Debentures.
Consolidated net earnings of the Company include the realized and unrealized appreciation and depreciation of the
investments held by consolidated affiliated partnerships, other than realized and unrealized appreciation and depreciation of
investments the consolidated affiliated partnerships hold in the Company’s debt and equity securities which has been eliminated
in consolidation.
Throughout fiscal year 2010, Biglari Holdings invested a total of $35,697 in the Lion Fund, both in the form of the
acquisition of the general partner and as a direct limited partner investment. The fair value of these investments in the Lion Fund
totaled $49,460 at December 22, 2010. These investments in the Lion Fund do not appear explicitly in the Company’s condensed
consolidated Balance Sheet because of the requirement to consolidate fully the Lion Fund (inclusive of third party interests) in
the Company’s financial statements. Further, the Lion Fund’s portfolio holds significant interests in both Biglari Holdings’
common stock and its Debentures, which as described above are classified on the Company’s condensed consolidated Balance
Sheet as reductions to Shareholders’ equity and Long-term debt, respectively. Biglari Holdings’ pro-rata ownership of its
Company common stock and Debentures through the Lion Fund at December 22, 2010 was 100,387 shares of stock (with a fair
value of $41,180) and $3,722 of Debentures, respectively, based on Biglari Holdings’ ownership interest in the Lion Fund on
December 22, 2010.
12
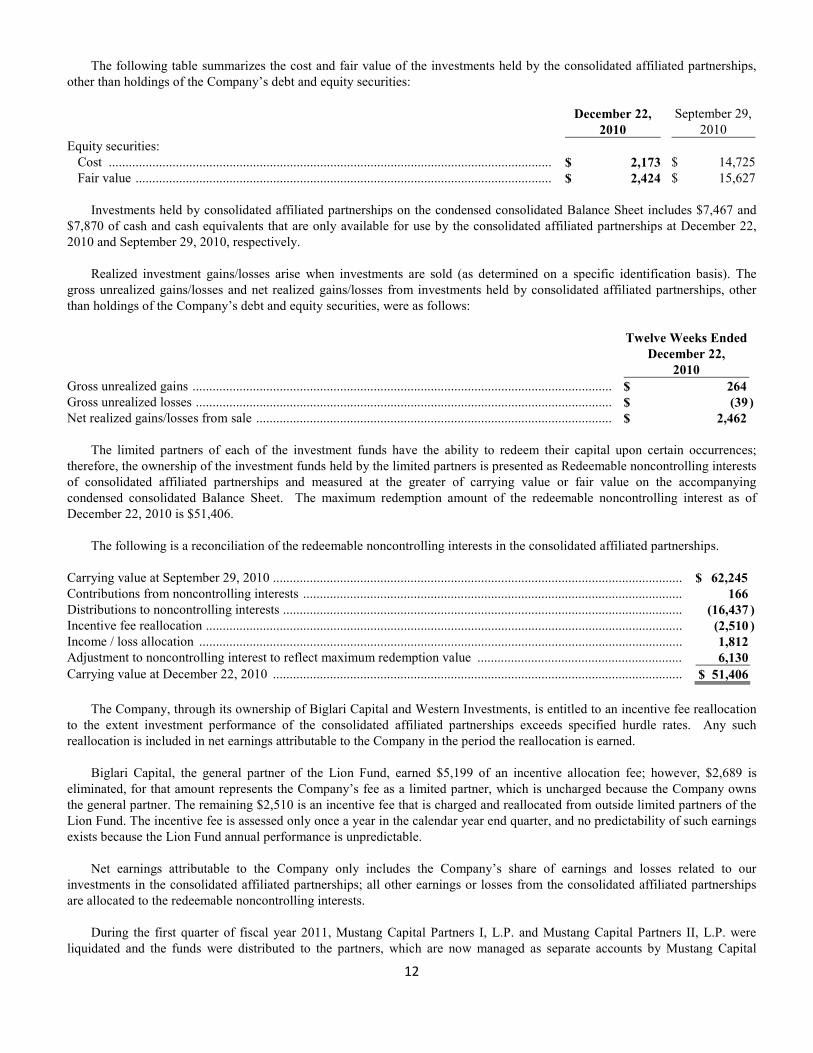
The following table summarizes the cost and fair value of the investments held by the consolidated affiliated partnerships,
other than holdings of the Company’s debt and equity securities:
December 22,
2010
September 29,
2010
Equity securities:
Cost .................................................................................................................................... $ 2,173 $ 14,725
Fair value ............................................................................................................................ $ 2,424 $ 15,627
Investments held by consolidated affiliated partnerships on the condensed consolidated Balance Sheet includes $7,467 and
$7,870 of cash and cash equivalents that are only available for use by the consolidated affiliated partnerships at December 22,
2010 and September 29, 2010, respectively.
Realized investment gains/losses arise when investments are sold (as determined on a specific identification basis). The
gross unrealized gains/losses and net realized gains/losses from investments held by consolidated affiliated partnerships, other
than holdings of the Company’s debt and equity securities, were as follows:
Twelve Weeks Ended
December 22,
2010
Gross unrealized gains ............................................................................................................................. $ 264
Gross unrealized losses ............................................................................................................................ $ (39 )
Net realized gains/losses from sale .......................................................................................................... $ 2,462
The limited partners of each of the investment funds have the ability to redeem their capital upon certain occurrences;
therefore, the ownership of the investment funds held by the limited partners is presented as Redeemable noncontrolling interests
of consolidated affiliated partnerships and measured at the greater of carrying value or fair value on the accompanying
condensed consolidated Balance Sheet. The maximum redemption amount of the redeemable noncontrolling interest as of
December 22, 2010 is $51,406.
The following is a reconciliation of the redeemable noncontrolling interests in the consolidated affiliated partnerships.
Carrying value at September 29, 2010 .......................................................................................................................... $ 62,245
Contributions from noncontrolling interests ................................................................................................................. 166
Distributions to noncontrolling interests ....................................................................................................................... (16,437 )
Incentive fee reallocation .............................................................................................................................................. (2,510 )
Income / loss allocation ................................................................................................................................................ 1,812
Adjustment to noncontrolling interest to reflect maximum redemption value ............................................................. 6,130
Carrying value at December 22, 2010 .......................................................................................................................... $ 51,406
The Company, through its ownership of Biglari Capital and Western Investments, is entitled to an incentive fee reallocation
to the extent investment performance of the consolidated affiliated partnerships exceeds specified hurdle rates. Any such
reallocation is included in net earnings attributable to the Company in the period the reallocation is earned.
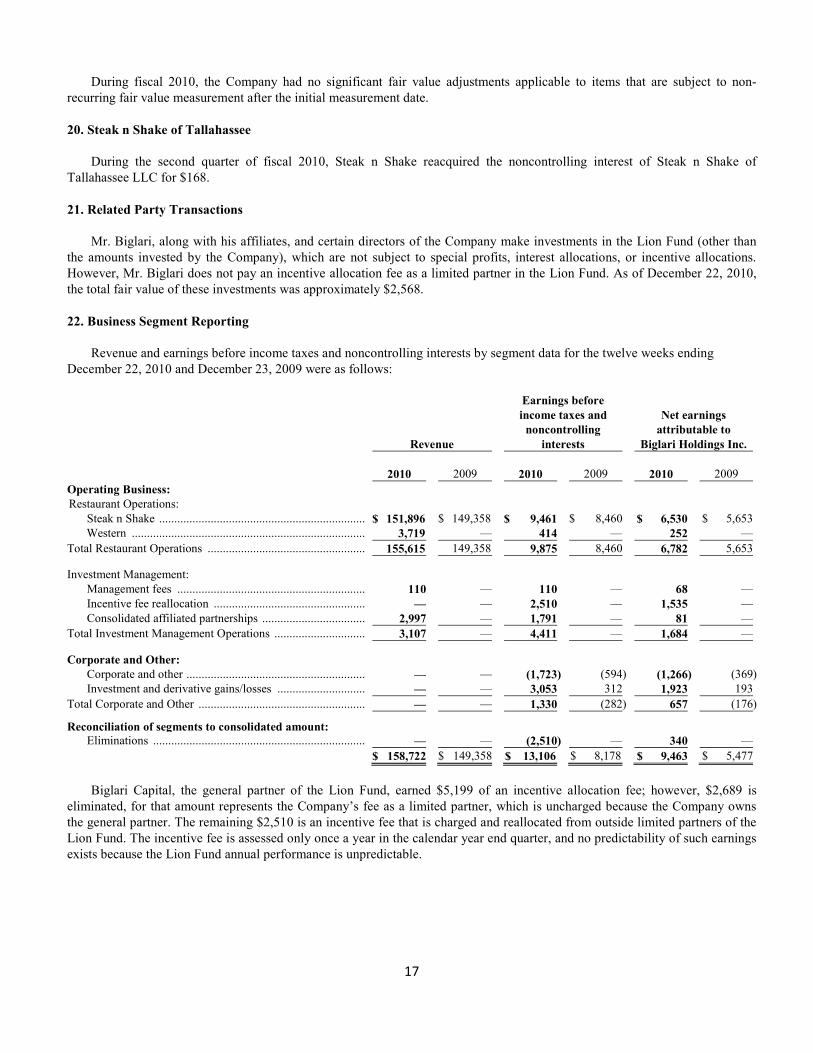
Biglari Capital, the general partner of the Lion Fund, earned $5,199 of an incentive allocation fee; however, $2,689 is
eliminated, for that amount represents the Company’s fee as a limited partner, which is uncharged because the Company owns
the general partner. The remaining $2,510 is an incentive fee that is charged and reallocated from outside limited partners of the
Lion Fund. The incentive fee is assessed only once a year in the calendar year end quarter, and no predictability of such earnings
exists because the Lion Fund annual performance is unpredictable.
Net earnings attributable to the Company only includes the Company’s share of earnings and losses related to our
investments in the consolidated affiliated partnerships; all other earnings or losses from the consolidated affiliated partnerships
are allocated to the redeemable noncontrolling interests.
During the first quarter of fiscal year 2011, Mustang Capital Partners I, L.P. and Mustang Capital Partners II, L.P. were
liquidated and the funds were distributed to the partners, which are now managed as separate accounts by Mustang Capital
13
Advisors, L.P. The distribution of $15,660, including $1,421 of noncash distributions, is included in the Distributions to
noncontrolling interests line in the above reconciliation.
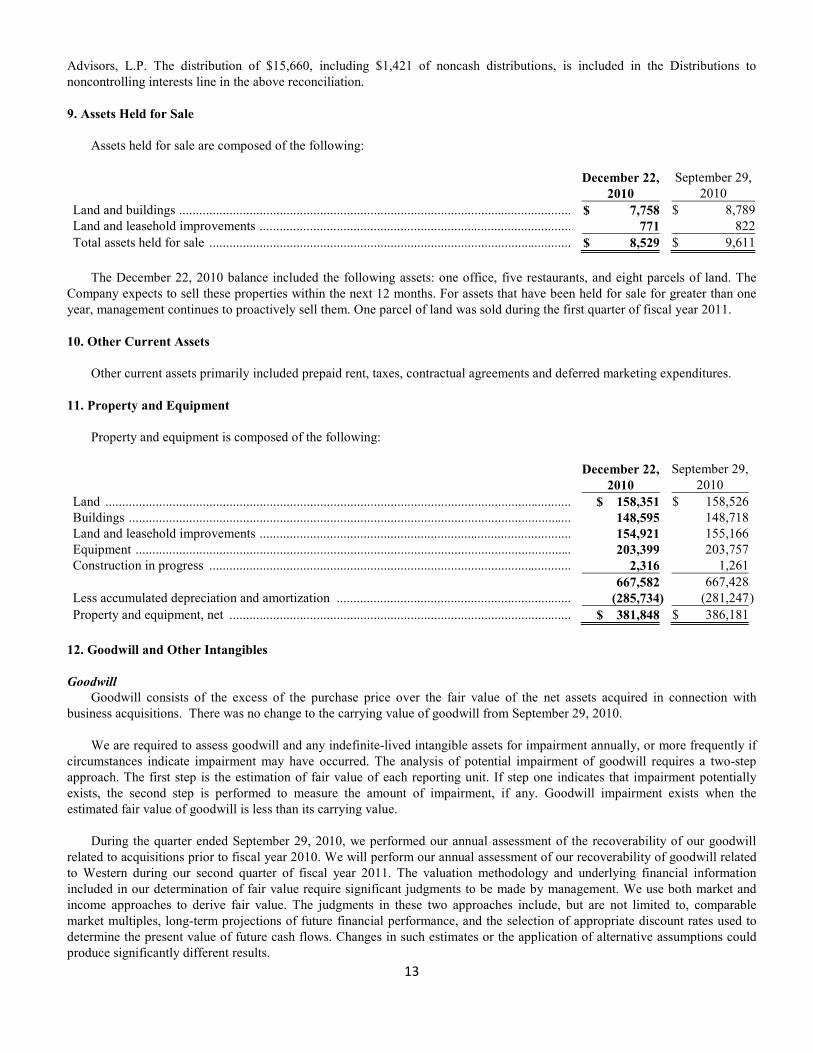
9. Assets Held for Sale
Assets held for sale are composed of the following:
December 22, September 29,
2010 2010
Land and buildings ..................................................................................................................... $ 7,758 $ 8,789
Land and leasehold improvements ............................................................................................. 771 822
Total assets held for sale ............................................................................................................ $ 8,529 $ 9,611
The December 22, 2010 balance included the following assets: one office, five restaurants, and eight parcels of land. The
Company expects to sell these properties within the next 12 months. For assets that have been held for sale for greater than one
year, management continues to proactively sell them. One parcel of land was sold during the first quarter of fiscal year 2011.
10. Other Current Assets
Other current assets primarily included prepaid rent, taxes, contractual agreements and deferred marketing expenditures.
11. Property and Equipment
Property and equipment is composed of the following:
December 22, September 29,
2010 2010
Land ........................................................................................................................................... $ 158,351 $ 158,526
Buildings .................................................................................................................................... 148,595 148,718
Land and leasehold improvements ............................................................................................. 154,921 155,166
Equipment .................................................................................................................................. 203,399 203,757
Construction in progress ............................................................................................................ 2,316 1,261
667,582 667,428
Less accumulated depreciation and amortization ...................................................................... (285,734) (281,247)
Property and equipment, net ...................................................................................................... $ 381,848 $ 386,181
12. Goodwill and Other Intangibles
Goodwill
Goodwill consists of the excess of the purchase price over the fair value of the net assets acquired in connection with
business acquisitions. There was no change to the carrying value of goodwill from September 29, 2010.
We are required to assess goodwill and any indefinite-lived intangible assets for impairment annually, or more frequently if
circumstances indicate impairment may have occurred. The analysis of potential impairment of goodwill requires a two-step
approach. The first step is the estimation of fair value of each reporting unit. If step one indicates that impairment potentially
exists, the second step is performed to measure the amount of impairment, if any. Goodwill impairment exists when the
estimated fair value of goodwill is less than its carrying value.
During the quarter ended September 29, 2010, we performed our annual assessment of the recoverability of our goodwill
related to acquisitions prior to fiscal year 2010. We will perform our annual assessment of our recoverability of goodwill related
to Western during our second quarter of fiscal year 2011. The valuation methodology and underlying financial information
included in our determination of fair value require significant judgments to be made by management. We use both market and
income approaches to derive fair value. The judgments in these two approaches include, but are not limited to, comparable
market multiples, long-term projections of future financial performance, and the selection of appropriate discount rates used to
determine the present value of future cash flows. Changes in such estimates or the application of alternative assumptions could
produce significantly different results.
14
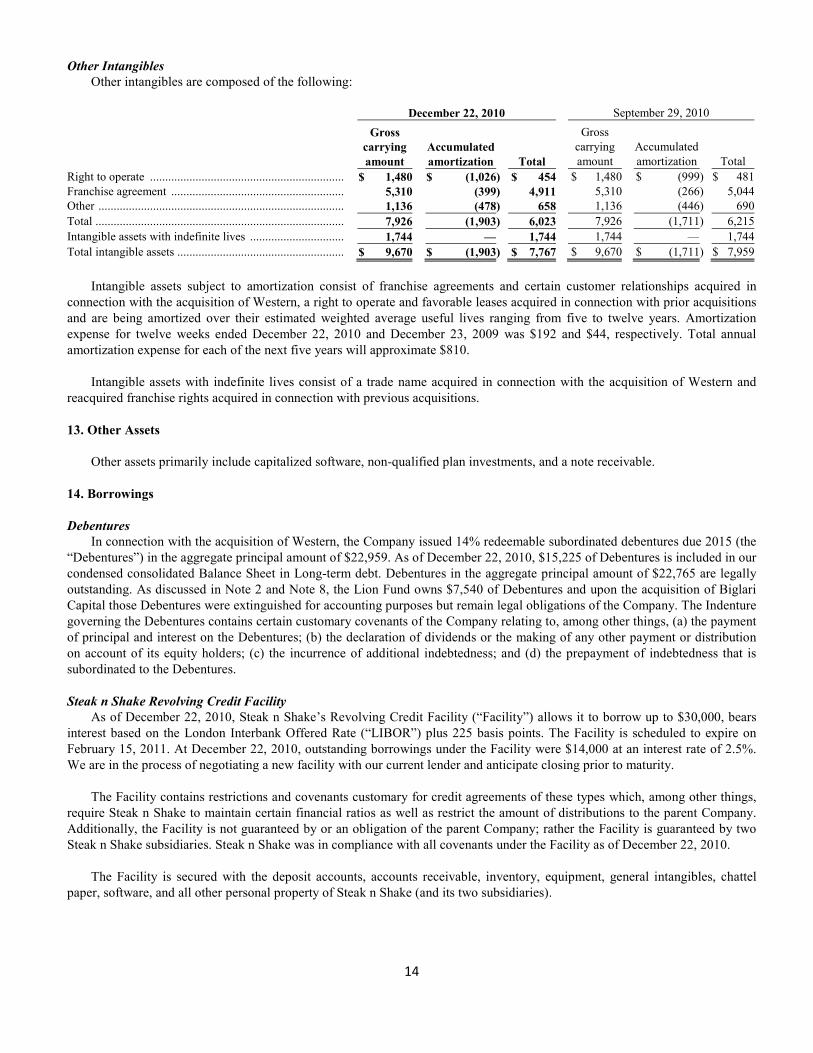
Other Intangibles
Other intangibles are composed of the following:
December 22, 2010 September 29, 2010
Gross
carrying
amount
Accumulated
amortization Total
Gross
carrying
amount
Accumulated
amortization Total
Right to operate ................................................................ $ 1,480 $ (1,026) $ 454 $ 1,480 $ (999) $ 481
Franchise agreement ......................................................... 5,310 (399) 4,911 5,310 (266) 5,044
Other ................................................................................. 1,136 (478) 658 1,136 (446) 690
Total .................................................................................. 7,926 (1,903) 6,023 7,926 (1,711) 6,215
Intangible assets with indefinite lives ............................... 1,744 — 1,744 1,744 — 1,744
Total intangible assets ....................................................... $ 9,670 $ (1,903) $ 7,767 $ 9,670 $ (1,711) $ 7,959
Intangible assets subject to amortization consist of franchise agreements and certain customer relationships acquired in
connection with the acquisition of Western, a right to operate and favorable leases acquired in connection with prior acquisitions
and are being amortized over their estimated weighted average useful lives ranging from five to twelve years. Amortization
expense for twelve weeks ended December 22, 2010 and December 23, 2009 was $192 and $44, respectively. Total annual
amortization expense for each of the next five years will approximate $810.
Intangible assets with indefinite lives consist of a trade name acquired in connection with the acquisition of Western and
reacquired franchise rights acquired in connection with previous acquisitions.
13. Other Assets
Other assets primarily include capitalized software, non-qualified plan investments, and a note receivable.
14. Borrowings
Debentures
In connection with the acquisition of Western, the Company issued 14% redeemable subordinated debentures due 2015 (the
“Debentures”) in the aggregate principal amount of $22,959. As of December 22, 2010, $15,225 of Debentures is included in our
condensed consolidated Balance Sheet in Long-term debt. Debentures in the aggregate principal amount of $22,765 are legally
outstanding. As discussed in Note 2 and Note 8, the Lion Fund owns $7,540 of Debentures and upon the acquisition of Biglari
Capital those Debentures were extinguished for accounting purposes but remain legal obligations of the Company. The Indenture
governing the Debentures contains certain customary covenants of the Company relating to, among other things, (a) the payment
of principal and interest on the Debentures; (b) the declaration of dividends or the making of any other payment or distribution
on account of its equity holders; (c) the incurrence of additional indebtedness; and (d) the prepayment of indebtedness that is
subordinated to the Debentures.
Steak n Shake Revolving Credit Facility
As of December 22, 2010, Steak n Shake’s Revolving Credit Facility (“Facility”) allows it to borrow up to $30,000, bears
interest based on the London Interbank Offered Rate (“LIBOR”) plus 225 basis points. The Facility is scheduled to expire on
February 15, 2011. At December 22, 2010, outstanding borrowings under the Facility were $14,000 at an interest rate of 2.5%.
We are in the process of negotiating a new facility with our current lender and anticipate closing prior to maturity.
The Facility contains restrictions and covenants customary for credit agreements of these types which, among other things,
require Steak n Shake to maintain certain financial ratios as well as restrict the amount of distributions to the parent Company.
Additionally, the Facility is not guaranteed by or an obligation of the parent Company; rather the Facility is guaranteed by two
Steak n Shake subsidiaries. Steak n Shake was in compliance with all covenants under the Facility as of December 22, 2010.
The Facility is secured with the deposit accounts, accounts receivable, inventory, equipment, general intangibles, chattel
paper, software, and all other personal property of Steak n Shake (and its two subsidiaries).
15
Other Debt
Other debt amounts include a promissory note secured by 23 acres of real property, line of credit, and notes payable.
The carrying amounts for debt reported in the condensed consolidated Balance Sheet do not differ materially from their fair
values at December 22, 2010.
15. Other Long-term Liabilities
Other long-term liabilities include deferred rent expense, non-qualified plan obligations, deferred gain on sale-leaseback
transactions, uncertain tax positions, deferred compensation, and a purchase obligation.
16. Income Taxes
Our effective income tax rate for the twelve weeks ended December 22, 2010 was 33.1%, which is relatively consistent with
32.8% in the same period in the prior year.
As of December 22, 2010, we had approximately $1,557 of unrecognized tax benefits, which are included in Other long-
term liabilities in the condensed consolidated Balance Sheet.
17. Common Stock Plans
Employee Stock Options − During the twelve weeks ended December 22, 2010, employees exercised 728 options under
plans approved by our shareholders. Employees and non-employee directors forfeited 1,355 options during the fiscal quarter.
Pre-tax stock-based compensation expense recorded during the twelve weeks ending December 22, 2010 for the stock option
plans totaled $93. The Company has placed an indefinite moratorium on the issuance of stock options.
Restricted Shares − During the twelve weeks ended December 22, 2010, no restricted shares were forfeited and 682
restricted shares vested. Pre-tax stock-based compensation expense recorded during the twelve weeks ending December 22, 2010
for the plan totaled $62. The Company has placed an indefinite moratorium on the issuance of restricted stock.
Our compensation philosophy, including the various equity plans, has changed to reflect present management’s view on the
most effective method to create shareholder value. The new incentives, which are cash based, are designed to ensure alignment
with the Company’s objective to maximize intrinsic business value on a per share basis. During the first quarter of fiscal year
2010, we resolved to suspend, indefinitely, all future option grants under the 2008 Employee Stock Option Plan, we terminated
the 2009 Employee Stock Option Plan, under which no options had been granted to date, we placed an indefinite moratorium on
the issuance of restricted stock, and we terminated the Employee Stock Purchase Plan.
18. Commitments and Contingencies
We are involved in various legal proceedings and have certain unresolved claims pending. We believe, based on
examination of these matters and experiences to date, that the ultimate liability, if any, in excess of amounts already provided in
our condensed financial statements is not likely to have a material effect on our results of operations, financial position or cash
flows.
19. Fair Value of Financial Assets and Liabilities
The fair value framework as established in ASC paragraph 820-10-50-2 requires the categorization of assets and liabilities
into three levels based upon the assumptions (inputs) used to price the assets or liabilities. Level 1 provides the most reliable
measure of fair values, whereas Level 3 generally requires significant management judgment. The three levels are defined as
follows:
• Level 1: Unadjusted quoted prices in active markets for identical assets and liabilities.
• Level 2: Observable inputs other than those included in Level 1. For example, quoted prices for similar assets
or liabilities in active markets or quoted prices for identical assets or liabilities in inactive markets.
• Level 3: Unobservable inputs reflecting management’s own assumptions about the inputs used in pricing the
asset or liability.
16
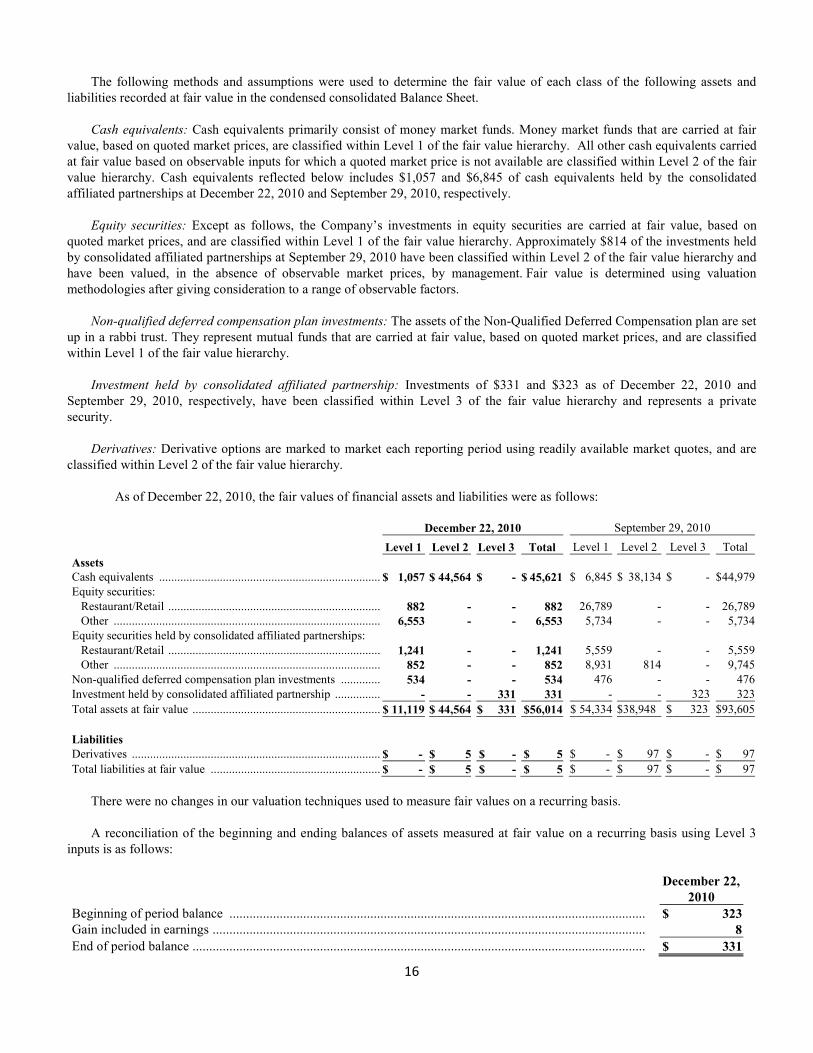
The following methods and assumptions were used to determine the fair value of each class of the following assets and
liabilities recorded at fair value in the condensed consolidated Balance Sheet.
Cash equivalents: Cash equivalents primarily consist of money market funds. Money market funds that are carried at fair
value, based on quoted market prices, are classified within Level 1 of the fair value hierarchy. All other cash equivalents carried
at fair value based on observable inputs for which a quoted market price is not available are classified within Level 2 of the fair
value hierarchy. Cash equivalents reflected below includes $1,057 and $6,845 of cash equivalents held by the consolidated
affiliated partnerships at December 22, 2010 and September 29, 2010, respectively.
Equity securities: Except as follows, the Company’s investments in equity securities are carried at fair value, based on
quoted market prices, and are classified within Level 1 of the fair value hierarchy. Approximately $814 of the investments held
by consolidated affiliated partnerships at September 29, 2010 have been classified within Level 2 of the fair value hierarchy and
have been valued, in the absence of observable market prices, by management. Fair value is determined using valuation
methodologies after giving consideration to a range of observable factors.
Non-qualified deferred compensation plan investments: The assets of the Non-Qualified Deferred Compensation plan are set
up in a rabbi trust. They represent mutual funds that are carried at fair value, based on quoted market prices, and are classified
within Level 1 of the fair value hierarchy.
Investment held by consolidated affiliated partnership: Investments of $331 and $323 as of December 22, 2010 and
September 29, 2010, respectively, have been classified within Level 3 of the fair value hierarchy and represents a private
security.
Derivatives: Derivative options are marked to market each reporting period using readily available market quotes, and are
classified within Level 2 of the fair value hierarchy.
As of December 22, 2010, the fair values of financial assets and liabilities were as follows:
December 22, 2010 September 29, 2010
Level 1 Level 2 Level 3 Total Level 1 Level 2 Level 3 Total
Assets
Cash equivalents ......................................................................... $ 1,057 $ 44,564 $ - $ 45,621 $ 6,845 $ 38,134 $ - $44,979
Equity securities:
Restaurant/Retail ...................................................................... 882 - - 882 26,789 - - 26,789
Other ........................................................................................ 6,553 - - 6,553 5,734 - - 5,734
Equity securities held by consolidated affiliated partnerships:
Restaurant/Retail ...................................................................... 1,241 - - 1,241 5,559 - - 5,559
Other ........................................................................................ 852 - - 852 8,931 814 - 9,745
Non-qualified deferred compensation plan investments ............. 534 - - 534 476 - - 476
Investment held by consolidated affiliated partnership ............... - - 331 331 - - 323 323
Total assets at fair value .............................................................. $ 11,119 $ 44,564 $ 331 $56,014 $ 54,334 $38,948 $ 323 $93,605
Liabilities
Derivatives .................................................................................. $ - $ 5 $ - $ 5 $ - $ 97 $ - $ 97
Total liabilities at fair value ........................................................ $ - $ 5 $ - $ 5 $ - $ 97 $ - $ 97
There were no changes in our valuation techniques used to measure fair values on a recurring basis.
A reconciliation of the beginning and ending balances of assets measured at fair value on a recurring basis using Level 3
inputs is as follows:
December 22,
2010
Beginning of period balance ............................................................................................................................ $ 323
Gain included in earnings ................................................................................................................................. 8
End of period balance ....................................................................................................................................... $ 331
17
During fiscal 2010, the Company had no significant fair value adjustments applicable to items that are subject to non-
recurring fair value measurement after the initial measurement date.
20. Steak n Shake of Tallahassee
During the second quarter of fiscal 2010, Steak n Shake reacquired the noncontrolling interest of Steak n Shake of
Tallahassee LLC for $168.
21. Related Party Transactions
Mr. Biglari, along with his affiliates, and certain directors of the Company make investments in the Lion Fund (other than
the amounts invested by the Company), which are not subject to special profits, interest allocations, or incentive allocations.
However, Mr. Biglari does not pay an incentive allocation fee as a limited partner in the Lion Fund. As of December 22, 2010,
the total fair value of these investments was approximately $2,568.
22. Business Segment Reporting
Revenue and earnings before income taxes and noncontrolling interests by segment data for the twelve weeks ending
December 22, 2010 and December 23, 2009 were as follows:
Revenue
Earnings before
income taxes and
noncontrolling
interests
Net earnings
attributable to
Biglari Holdings Inc.
2010 2009 2010 2009 2010 2009
Operating Business:
Restaurant Operations:
Steak n Shake .................................................................... $ 151,896 $ 149,358 $ 9,461 $ 8,460 $ 6,530 $ 5,653
Western ............................................................................. 3,719 — 414 — 252 —
Total Restaurant Operations .................................................... 155,615 149,358 9,875 8,460 6,782 5,653 Investment Management:
Management fees .............................................................. 110 — 110 — 68 —
Incentive fee reallocation .................................................. — — 2,510 — 1,535 —
Consolidated affiliated partnerships .................................. 2,997 — 1,791 — 81 —
Total Investment Management Operations .............................. 3,107 — 4,411 — 1,684 —
Corporate and Other:
Corporate and other ........................................................... — — (1,723) (594) (1,266) (369)
Investment and derivative gains/losses ............................. — — 3,053 312 1,923 193
Total Corporate and Other ....................................................... — — 1,330 (282) 657 (176) Reconciliation of segments to consolidated amount:
Eliminations ...................................................................... — — (2,510) — 340 —
$ 158,722 $ 149,358 $ 13,106 $ 8,178 $ 9,463 $ 5,477
Biglari Capital, the general partner of the Lion Fund, earned $5,199 of an incentive allocation fee; however, $2,689 is
eliminated, for that amount represents the Company’s fee as a limited partner, which is uncharged because the Company owns
the general partner. The remaining $2,510 is an incentive fee that is charged and reallocated from outside limited partners of the
Lion Fund. The incentive fee is assessed only once a year in the calendar year end quarter, and no predictability of such earnings
exists because the Lion Fund annual performance is unpredictable.
18
Item 2.
Management’s Discussion and Analysis of Financial Condition and Results of Operations
(Amounts in $000s, except per share data)
Biglari Holdings Inc. is a diversified holding company engaged in a number of diverse business activities. The Company is
led by Sardar Biglari, Chairman and Chief Executive Officer of Biglari Holdings, Steak n Shake, Western, and Biglari
Capital. The Company’s long-term objective is to maximize per-share intrinsic value of the Company. The Company’s strategy
is to reinvest cash generated from its operating subsidiaries into any investments with the objective of achieving high risk-
adjusted returns. All major operating, investment, and capital allocation decisions are made for the Company by Mr. Biglari.
On March 30, 2010, the Company, through Merger Sub, acquired 100% of the outstanding equity interests of Western,
pursuant to the Merger Agreement. Upon the consummation of the merger pursuant to the Merger Agreement, Merger Sub
merged with and into Western, with Western continuing as the surviving corporation and as a wholly-owned subsidiary of the
Company.
The Company’s Restaurant Operations consist of Steak n Shake and Western. As of December 22, 2010, Steak n Shake
operated 412 company-owned restaurants and franchised 75 units in 22 states. Western operated 5 company-operated restaurants
and franchised 90 units in 17 states.
On April 30, 2010, the Company acquired Biglari Capital pursuant to the Stock Purchase Agreement between the Company
and our CEO, who was the sole shareholder of Biglari Capital. Biglari Capital is the general partner of the Lion Fund, a limited
partnership operating as a private investment fund whose objective is to achieve above-average, long-term growth of capital from
investments in stocks of simple, predictable businesses that generate substantial cash flow, yet trade at a significant discount to
intrinsic value. The Lion Fund functions as a strategic investment arm for Biglari Holdings principally to assist in facilitating the
partial ownership of other publicly traded companies.
Overview
In the following discussion, the term “same-store sales” refers to the sales of only those units open at least 18 months as of
the beginning of the current fiscal period being discussed and which remained open through the end of the fiscal period.
Investment gains/losses in any given period will vary; therefore, for analytical purposes, management measures operating
performance by analyzing earnings before realized and unrealized investment gains/losses.
The condensed consolidated financial statements include the accounts of (i) Biglari Holdings Inc., (ii) the wholly and
majority owned subsidiaries of Biglari Holdings Inc. in which control can be exercised and (iii) limited partnership investment
companies in which we have a controlling interest as the general partner. In evaluating whether we have a controlling interest in
entities that we would consolidate, we consider the following: (1) for voting interest entities, we consolidate those entities in
which we own a majority of the voting interests; and (2) for limited partnership entities, we consolidate those entities if we are
the general partner of such entities and for which no substantive removal rights exist. All material intercompany accounts and
transactions have been eliminated in consolidation. The analysis as to whether to consolidate an entity is subject to a significant
amount of judgment. Some of the criteria considered include the determination as to the degree of control over an entity by its
various equity holders and the design of the entity.
First Quarter Fiscal Year 2011
We recorded net earnings of $9,463 for the first quarter of fiscal year 2011, as compared with net earnings of $5,477 in the
first quarter of fiscal year 2010. The increase was primarily driven by the performance of our operating businesses, realized
investment gains, and inclusion of Western’s results. Additionally, the increase was impacted by the $2,510 of incentive fee
reallocation earned by Biglari Holdings as recorded in noncontrolling interests.
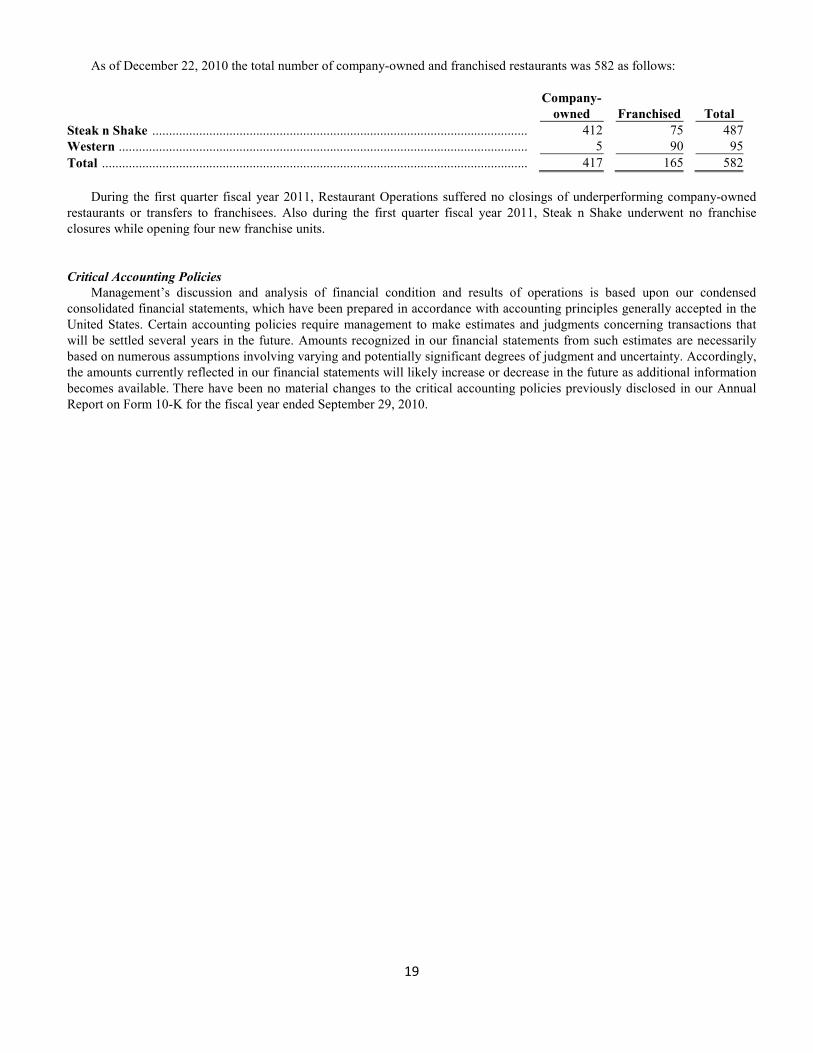
19
As of December 22, 2010 the total number of company-owned and franchised restaurants was 582 as follows:
Company-
owned Franchised Total
Steak n Shake ................................................................................................................ 412 75 487
Western .......................................................................................................................... 5 90 95
Total ............................................................................................................................... 417 165 582
During the first quarter fiscal year 2011, Restaurant Operations suffered no closings of underperforming company-owned
restaurants or transfers to franchisees. Also during the first quarter fiscal year 2011, Steak n Shake underwent no franchise
closures while opening four new franchise units.
Critical Accounting Policies
Management’s discussion and analysis of financial condition and results of operations is based upon our condensed
consolidated financial statements, which have been prepared in accordance with accounting principles generally accepted in the
United States. Certain accounting policies require management to make estimates and judgments concerning transactions that
will be settled several years in the future. Amounts recognized in our financial statements from such estimates are necessarily
based on numerous assumptions involving varying and potentially significant degrees of judgment and uncertainty. Accordingly,
the amounts currently reflected in our financial statements will likely increase or decrease in the future as additional information
becomes available. There have been no material changes to the critical accounting policies previously disclosed in our Annual
Report on Form 10-K for the fiscal year ended September 29, 2010.
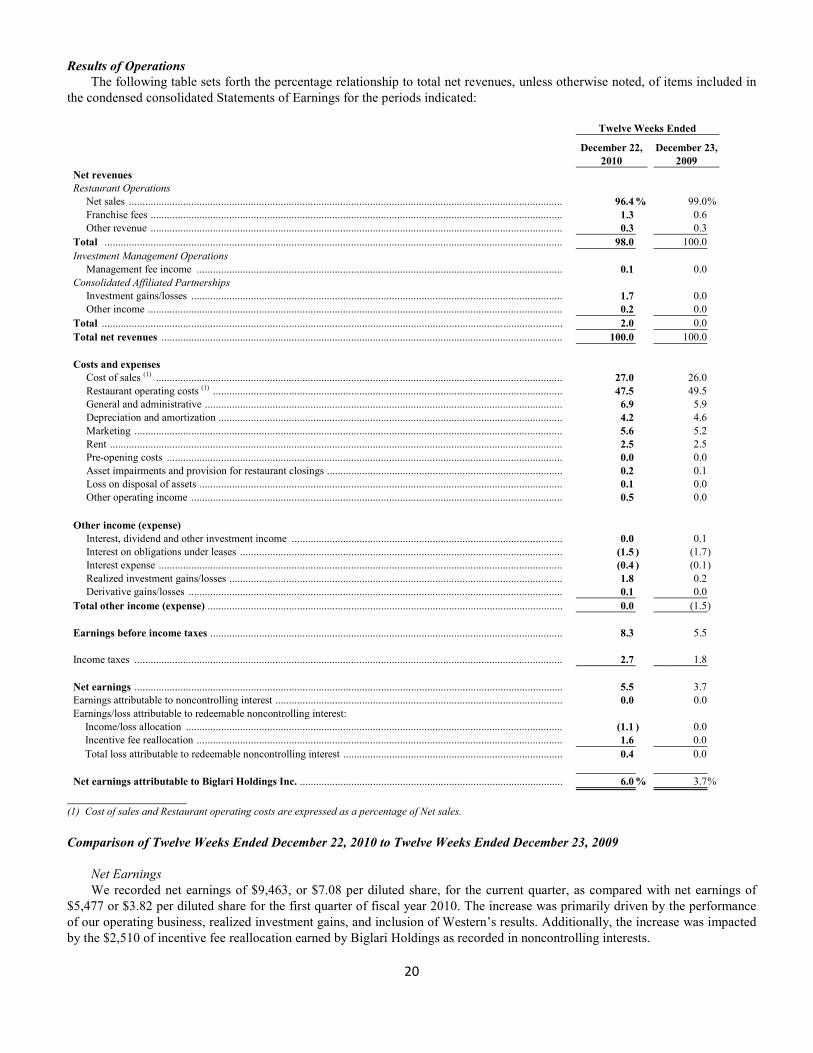
20
Results of Operations
The following table sets forth the percentage relationship to total net revenues, unless otherwise noted, of items included in
the condensed consolidated Statements of Earnings for the periods indicated:
Twelve Weeks Ended
December 22,
2010
December 23,
2009
Net revenues
Restaurant Operations
Net sales ................................................................................................................................................................ 96.4 % 99.0 %
Franchise fees ........................................................................................................................................................ 1.3 0.6
Other revenue ........................................................................................................................................................ 0.3 0.3
Total ......................................................................................................................................................................... 98.0 100.0
Investment Management Operations
Management fee income ....................................................................................................................................... 0.1 0.0
Consolidated Affiliated Partnerships
Investment gains/losses ......................................................................................................................................... 1.7 0.0
Other income ......................................................................................................................................................... 0.2 0.0
Total .......................................................................................................................................................................... 2.0 0.0
Total net revenues .................................................................................................................................................... 100.0 100.0
Costs and expenses
Cost of sales (1) ...................................................................................................................................................... 27.0 26.0
Restaurant operating costs (1) ................................................................................................................................. 47.5 49.5
General and administrative .................................................................................................................................... 6.9 5.9
Depreciation and amortization ............................................................................................................................... 4.2 4.6
Marketing .............................................................................................................................................................. 5.6 5.2
Rent ....................................................................................................................................................................... 2.5 2.5
Pre-opening costs .................................................................................................................................................. 0.0 0.0
Asset impairments and provision for restaurant closings ....................................................................................... 0.2 0.1
Loss on disposal of assets ...................................................................................................................................... 0.1 0.0
Other operating income ......................................................................................................................................... 0.5 0.0
Other income (expense)
Interest, dividend and other investment income .................................................................................................... 0.0 0.1
Interest on obligations under leases ....................................................................................................................... (1.5 ) (1.7 )
Interest expense ..................................................................................................................................................... (0.4 ) (0.1 )
Realized investment gains/losses ........................................................................................................................... 1.8 0.2
Derivative gains/losses .......................................................................................................................................... 0.1 0.0
Total other income (expense) ................................................................................................................................... 0.0 (1.5 )
Earnings before income taxes .................................................................................................................................. 8.3 5.5
Income taxes .............................................................................................................................................................. 2.7 1.8
Net earnings .............................................................................................................................................................. 5.5 3.7
Earnings attributable to noncontrolling interest .......................................................................................................... 0.0 0.0
Earnings/loss attributable to redeemable noncontrolling interest:
Income/loss allocation ........................................................................................................................................... (1.1 ) 0.0
Incentive fee reallocation ....................................................................................................................................... 1.6 0.0
Total loss attributable to redeemable noncontrolling interest ................................................................................. 0.4 0.0
Net earnings attributable to Biglari Holdings Inc. ................................................................................................. 6.0 % 3.7 %
(1) Cost of sales and Restaurant operating costs are expressed as a percentage of Net sales.
Comparison of Twelve Weeks Ended December 22, 2010 to Twelve Weeks Ended December 23, 2009
Net Earnings
We recorded net earnings of $9,463, or $7.08 per diluted share, for the current quarter, as compared with net earnings of
$5,477 or $3.82 per diluted share for the first quarter of fiscal year 2010. The increase was primarily driven by the performance
of our operating business, realized investment gains, and inclusion of Western’s results. Additionally, the increase was impacted
by the $2,510 of incentive fee reallocation earned by Biglari Holdings as recorded in noncontrolling interests.
21
Net Sales
In the first quarter of fiscal year 2011, net sales increased 3.5% from $147,924 to $153,059, mainly because of the
performance of our Restaurant Operations, including the increase in Steak n Shake’s same-store sales. Steak n Shake’s same
store sales advanced 2.1% during the first quarter of fiscal year 2011, the consequence of increased guest traffic by 3.5%, but
partially offset by lower average selling prices. The acquisition of Western increased total net sales by $2,953 or 1.9%.
Franchise fees increased $1,126 or 122.5% compared to the first quarter of fiscal year 2010. The number of franchised units
increased from 73 at December 23, 2009 to 165 at December 22, 2010, primarily because of the inclusion of Western franchised
units.
Costs and Expenses
Cost of sales was $41,280 or 27.0% of net sales, compared with $38,479 or 26.0% of net sales in the first quarter of fiscal
year 2010.
Restaurant operating costs were $72,689 or 47.5% of net sales, compared with $73,238 or 49.5% of net sales in the first
quarter of fiscal year 2010. The percentage decrease of net sales stemmed from the implementation of several operating
initiatives, which have produced higher productivity and labor efficiency.
General and administrative expenses increased as a percentage of total net revenues from 5.9% to 6.9% because of the
inclusion of Western’s general and administrative expenses, incentive compensation expense, legal costs, and the integration of
certain business functions such as supply chain management. For strategic purposes, the Company over the last several months
of fiscal year 2010 transitioned to and centralized selected business functions at the Company’s headquarters in San Antonio,
namely, supply chain management, franchise development, human resources, and training.
Depreciation and amortization expense was $6,609 or 4.2% of total net revenues, versus $6,923 or 4.6% of total net
revenues in the first quarter of fiscal year 2010.
Marketing expense was $8,951 or 5.6% of total net revenues, versus $7,727 or 5.2% of total net revenues in the first quarter
of fiscal year 2010.
Rent expense remained consistent as a percentage of total net revenues at 2.5%, compared to the first quarter of fiscal year
2010.
Asset impairments and provision for restaurant closings for the first quarter of fiscal year 2011 amounted to $283 or 0.2% of
total net revenues, versus $171 or 0.1% of total net revenues in the first quarter of fiscal year 2010.
Loss on disposal of assets was $104 in the first quarter of fiscal year 2011, versus a gain of $23 in the first quarter of fiscal
year 2010.
Interest expense on obligations under leases was $2,449 or 1.5% of total net revenues, versus $2,476 or 1.7% of total net
revenues in the first quarter of fiscal year 2010.
Our effective income tax rate was 33.1% in the first quarter of fiscal year 2011, a figure relatively consistent with the
income tax rate of 32.8% in the first quarter of fiscal year 2010.
Biglari Holdings Investment Gains
We recorded net realized investment gains of $2,878 for the current quarter connected primarily to dispositions of
marketable equity securities and investment gains of $175 related to the change in fair value of derivatives and dispositions. We
recorded $312 of realized gains on investments during the first quarter of fiscal year 2010. These investments are retained
directly by Biglari Holdings, not by our consolidated affiliated partnerships.
Consolidated Affiliated Partnerships Investment Gains (Losses)
We recorded a net realized gain of $2,462 for the current quarter related to dispositions of investments held by our
consolidated affiliated partnerships and an unrealized investment gain of $225. These amounts were offset by $1,812 related to
earnings attributable to redeemable noncontrolling interests to determine earnings allocated to the Company.
22
Consolidated Affiliated Partnerships
Investments held directly by the consolidated affiliated partnerships usually consist of domestic equity securities. Certain of
the consolidated affiliated partnerships hold the Company’s common stock and Debentures as investments. In our condensed
consolidated financial statements, the Company classifies this common stock as Treasury stock despite the shares being legally
outstanding. The Debentures owned by the consolidated affiliated partnerships were recorded as a debt extinguishment upon
acquisition, though the Debentures remain outstanding. As of December 22, 2010 and September 29, 2010, the consolidated
affiliated partnerships held 205,743 shares of the Company’s common stock ($69,221 at cost) and $7,540 of Debentures.
Throughout fiscal year 2010, Biglari Holdings invested a total of $35,697 in the Lion Fund, both in the form of the
acquisition of the general partner and as a direct limited partner investment. The fair value of these purchases of the Lion Fund
totaled $49,460 on December 22, 2010. These investments in the Lion Fund do not appear explicitly in the Company’s
condensed consolidated Balance Sheet because of the requirement to consolidate fully the Lion Fund (inclusive of third party
interests) in the Company’s financial statements. Further, the Lion Fund’s portfolio holds significant interests in both Biglari
Holdings’ common stock and its Debentures, which are classified on the Company’s condensed consolidated Balance Sheet as
reductions to Shareholders’ equity and Long-term debt, respectively. Biglari Holdings’ pro-rata ownership of its Company
common stock and Debentures through the Lion Fund at December 22, 2010 was 100,387 shares of stock (with a fair value of
$41,180) and $3,722 of Debentures, respectively, based on Biglari Holdings’ ownership interest in the Lion Fund on December
22, 2010.
Liquidity and Capital Resources
We generated $27,023 in cash flows from operations during the first quarter of fiscal year 2011 as compared to $19,686
during the first quarter of fiscal year 2010. The increase was based primarily on net earnings in the first quarter of fiscal year
2011, timing of receipts and payment of disbursements related to operating activities, and the inclusion of investment operations
of consolidated affiliated partnerships.
Net cash provided by investing activities of $25,848 during the first quarter of fiscal year 2011 was primarily a result of net
sales of investments. Net cash used in investing activities of $7,481 during the first quarter of fiscal year 2010 included
purchases of investments of $8,174.
Net cash used in financing activities during the first quarter of fiscal year 2011 was $21,008 compared to net cash used of
$1,409 during the first quarter of fiscal year 2010. The increase resulted primarily from the consolidated affiliated partnerships’
distributions to noncontrolling interests.
Our balance sheet continues to maintain significant liquidity. We intend to meet the working capital needs of our operating
subsidiaries principally through anticipated cash flows generated from operations, existing credit facilities, and the sale of excess
properties and investments. We continually review available financing alternatives. In addition, we may consider, on an
opportunistic basis, strategic decisions to create value and improve operating performance.
Debentures
The Company acquired 100% of the outstanding equity interests of Western. Under the terms of the Merger Agreement,
each share of Western’s common stock was cancelled upon the completion of the merger and converted into the right to receive a
pro rata portion of a new issue of 14% redeemable subordinated debentures due 2015 issued by the Company (the “Debentures”)
in the aggregate principal amount of $22,959 with cash paid in lieu of fractional Debenture interests. The Company paid $194 in
lieu of fractional Debentures.
As of December 22, 2010, Debentures in the aggregate principal amount of $22,765 are legally outstanding. Lion Fund
owns $7,540 of Debentures and upon the acquisition of Biglari Capital those Debentures were extinguished for accounting
purposes but remain legal obligations of the Company.
Steak n Shake Revolving Credit Facility
As of December 22, 2010, Steak n Shake’s Revolving Credit Facility (“Facility”) allows it to borrow up to $30,000 and
bears interest based on LIBOR plus 225 basis points. At December 22, 2010, outstanding borrowings under the Facility were
$14,000 at an interest rate of 2.5%. The Facility is scheduled to expire on February 15, 2011. We are in the process of
negotiating a new facility with our current lender and anticipate closing prior to maturity.
23
The Facility contains restrictions and covenants customary for credit agreements of these types which, among other things,
require Steak n Shake to maintain certain financial ratios as well as restrict the amount of distributions to the parent Company.
Additionally, the Facility is not guaranteed by or an obligation of the parent Company; rather the Facility is guaranteed by two
Steak n Shake subsidiaries. These restrictions and covenants include requirements to limit the ratio of total liabilities to tangible
net worth (as defined in the Facility) to a maximum of 1.50 and to maintain a minimum fixed charge coverage ratio (as defined
in the Facility) of 1.75. Steak n Shake was in compliance with all covenants under the Facility as of December 22, 2010.
The Facility is secured with the deposit accounts, accounts receivable, inventory, equipment, general intangibles, chattel
paper, software, and all other personal property of Steak n Shake (and its two subsidiaries).
The carrying amounts for debt reported in the condensed consolidated Balance Sheet do not differ materially from their fair
values at December 22, 2010.
New Accounting Standards
See Note 4 of Notes to Condensed Consolidated Financial Statements in Part I, Item 1 of this Form 10-Q.
Effects of Governmental Regulations and Inflation
Most employees are paid hourly rates related to federal and state minimum wage laws. Any increase in the legal minimum
wage would directly increase the Company’s operating costs. The Company is also subject to various federal, state and local
laws related to zoning, land use, safety standards, working conditions, and accessibility standards. Any changes in these laws that
require improvements to its restaurants would increase operating costs. In addition, the Company is subject to franchise
registration requirements and certain related federal and state laws regarding franchise operations. Any changes in these laws
could affect its ability to attract and retain franchisees.
Inflation in food, labor, fringe benefits, energy costs, transportation costs, and other operating costs also directly affect our
restaurant operations.
24
Risks Associated with Forward-Looking Statements
This report includes forward-looking statements within the meaning of the Private Securities Litigation Reform Act of 1995.
In general, forward-looking statements include estimates of future revenues, cash flows, capital expenditures, or other financial
items, and assumptions underlying any of the foregoing. Forward-looking statements reflect management’s current expectations
regarding future events and use words such as “anticipate,” “believe,” “expect,” “may,” and other similar terminology. A
forward-looking statement is neither a prediction nor a guarantee of future events or circumstances, and those future events or
circumstances may not occur. Investors should not place undue reliance on the forward-looking statements, which speak only as
of the date of this report. These forward-looking statements are all based on currently available operating, financial, and
competitive information and are subject to various risks and uncertainties. Our actual future results and trends may differ
materially depending on a variety of factors, many beyond our control, including, but not limited to:
• the ability of the restaurant operations to increase store traffic on a profitable basis;
• competition in the restaurant industry for customers, staff, locations, and new products;
• disruptions in the overall economy and the financial markets;
• the Company’s ability to comply with the restrictions and covenants to its debt agreements;
• declines in the market price of our common stock, which could adversely affect our goodwill impairment analysis;
• the potential to recognize additional impairment charges on our long−lived assets;
• fluctuations in food commodity and energy prices and the availability of food commodities;
• the ability of our franchisees to operate profitable restaurants;
• the poor performance or closing of even a small number of restaurants;
• changes in customer preferences, tastes, and dietary habits;
• changes in minimum wage rates and the availability and cost of qualified personnel;
• harsh weather conditions or losses due to casualties;
• unfavorable publicity relating to food safety or food−borne illness;
• exposure to liabilities related to the ownership and leasing of significant amounts of real estate;
• our ability to comply with existing and future governmental regulations;
• our ability to adequately protect our trademarks, service marks, and other components of our brand;
• changes in market prices of our investments; and
• other risks identified in the periodic reports we file with the Securities and Exchange Commission.
Accordingly, such forward-looking statements do not purport to be predictions of future events or circumstances and may
not be realized. Additional risks and uncertainties not currently known to us or that are currently deemed immaterial may also
become important factors that may harm our business, financial condition, results of operations or cash flows. We assume no
obligation to update forward-looking statements except as required in our periodic reports.
Item 3.
Quantitative and Qualitative Disclosures about Market Risk
Our investments are generally concentrated in common stocks. A significant decline in the general stock market or in the
price of major investments may produce a large decrease in our consolidated Shareholders’ equity and under certain
circumstances may require the recognition of losses in the condensed consolidated Statement of Earnings. Decreases in values of
equity investments can have a material adverse effect on our consolidated Shareholders’ equity.
At December 22, 2010 the Facility bore interest at a rate based upon LIBOR plus 225 basis points. Historically, we have not
used derivative financial instruments to manage exposure to interest rate changes. At December 22, 2010, a hypothetical 100
basis point increase in short-term interest rates would have an impact of approximately $85 on our net earnings.
Steak n Shake and Western purchase certain food products which may be affected by volatility in commodity prices due to
weather conditions, supply levels, and other market conditions, which we do not expect to have a material impact on us.
We do not have exposure to foreign currency exchange rate fluctuations, as we do not transact business in international
markets and are not a party to any material non-U.S. dollar denominated contracts.

25
Item 4.
Controls and Procedures
Based on an evaluation of our disclosure controls and procedures (as defined in Exchange Act Rules 13a-15(e) and 15d-15
(c)), our Chief Executive Officer and Interim Chief Financial Officer have concluded that our disclosure controls and procedures
were effective as of December 22, 2010.
There have been no changes in our internal control over financial reporting that occurred during the quarter ended December
22, 2010 that have materially affected, or that are reasonably likely to materially affect, our internal control over financial
reporting.
26
Part II Other Information
Item 1.
Legal Proceedings
See Note 18 of the Notes to Condensed Consolidated Financial Statements in Part I, Item 1 of this Form 10-Q.
Item 1A.
Risk Factors
An investment in the common stock of any company involves a degree of risk. Investors should consider carefully the risks
and uncertainties described in the Company’s Annual Report on Form 10−K filed with the SEC, and those other risks described
elsewhere in this report, before deciding whether to purchase our common stock. Additional risks and uncertainties not currently
known to us or that we currently deem immaterial may also become important factors that may harm the Company’s business,
financial condition, and results of operations. The occurrence of risk factors could harm the Company’s business, financial
condition, and results of operations. The trading price of the Company’s common stock could decline due to any of these risks
and uncertainties, and stockholders may lose part or all of their investment.
There have been no material changes in the risk factors described in the Company’s Annual Report on Form 10-K for the
year ended September 29, 2010.
Item 6. Exhibits
Exhibit
Number Description
31.01 Rule 13(a)-14(a)/15d-14(a) Certification of Chief Executive Officer
31.02 Rule 13(a)-14(a)/15d-14(a) Certification of Chief Financial Officer
32.01 Section 1350 Certifications
27
SIGNATURES
Pursuant to the requirements of the Securities Exchange Act of 1934, the registrant has duly caused this report to be signed
on its behalf by the undersigned thereunto duly authorized.
Date: January 28, 2011
BIGLARI HOLDINGS INC.
By: /s/ Duane E. Geiger
Duane E. Geiger
Interim Chief Financial Officer