bii 2015 investment outlook
TRANSCRIPT

BlackRock Investment InstItute
DealInG WItH DIveRGence 2015 INVESTMENT OUTLOOK
dEcEMbEr 2014

[ 2 ] 2 0 15 I n v e s t m e n t o u t l o o k
dealing With divergence} divergent economic growth and monetary policy underpin our 2015 base case.
We expect tightening financial conditions in the U.S. and U.K. due to a pickup in growth and improving labor markets. Lackluster growth and low inflation expectations support looser monetary policy elsewhere. Falling oil prices should support growth in most countries and hinder it in a few.
} Financial markets and economies are diverging as well. The financial cycle has leapfrogged the business cycle in most countries. Asset valuations and investor complacency are high, likely triggering bursts of market volatility. bonds are becoming less effective diversifiers for equities due to ultra-low yields.
} Many asset owners have embraced momentum trades. This makes for sudden stops when the driver hits the brakes. It is smart to hedge against downside in this climate and cut back on “me-too” investments.
} The world is characterized by many regional “zero-sum conflicts” that have no quick solutions (think Ukraine and Middle East). The specter of a European Union (EU) breakup could return with a Greek vote and U.K. elections that will likely pave the way for a referendum on its EU membership.
} The prospect of U.S. rate hikes and a shrinking trade deficit support a stronger dollar—but we brace ourselves for temporary reversals. We see the U.S. Federal reserve (Fed) ending its rate rises at a lower level than in recent decades. A global hunger for yield should cap any spikes in 10-year Treasury yields. cyclical stocks should outperform defensive equities as growth ticks up.
} The eurozone is a low-flying plane that constantly hits air pockets. This causes occasional lifts and near-death experiences. A falling euro and the prospect of more monetary stimulus support European equities and credit sectors. Solid U.K. growth, by contrast, sets the scene for a bank of England (boE) rate hike.
} bank of Japan (boJ) Governor Haruhiko Kuroda has upped the ante on his massive monetary stimulus, and the country’s largest pension fund is more than doubling its equity allocation. Aside from “Kurodanomics,” we like Japanese equities due to cheap valuations, rising dividends and a new focus on return on equity.
} Emerging markets (EM) are really diverging markets. We prefer countries implementing reforms to open up their economies; a little reform can go a long way in boosting asset values. We like hard-currency EM debt due to relatively high yields. Equity valuations are cheap—but free cash-flow growth is hard to find.
} How to deal with all this divergence? It calls for very active risk management and extending investment horizons through longer holding periods. The main point is to have a plan: readiness rules in 2015.
Ewen Cameron Watt Global Chief Investment Strategist, BlackRock Investment Institute
Nigel BoltonChief Investment Officer, BlackRock International Fundamental Equity
Russ Koesterich Global Chief Investment Strategist, BlackRock Investment Institute
Poppy Allonby Portfolio Manager, Natural Resources Equities Team
Rick RiederChief Investment Officer, BlackRock Fundamental Fixed Income
Jean BoivinDeputy Chief Investment Strategist, BlackRock Investment Institute
The opinions expressed are as of december 2014 and may change as subsequent conditions vary.
IntRoDuctIon .....................2–5Summary ..............................................2base case ............................................3First Words ................................... 4–5
maRkets .............................. 6–12Valuations ......................................6–7Volatility ......................................... 8–9currency ....................................10–11Political risk ................................... 12
GeoGRaPHIes ..................13–19Japan ...................................................13United States .........................14–15Europe .........................................16–17 Emerging Markets ...............18–19

[ 3 ]I n t R o D u c t I o n
Sources: BlackRock Investment Institute and IMF, October 2014. Notes: Nominal growth forecasts are from the IMF World Economic Outlook. Global GDP weights of economies are based on purchasing power parity, rather than on current exchange rates. Financial conditions are BlackRock’s estimates of monetary policy, fiscal policy, exchange rates and credit conditions.
LE
SS
MO
RE
F I N A N C I A L C O N D I T I O N S TIGHT(ER)LOOSE(R)
NO
MIN
AL
GR
OW
TH
India
China
Brazil
United Kingdom
EurozoneJapan
United States
12%
9
6
3
Line thickness reflects an economy’s share of global GDP based on purchasing power parity.
2014 2015
CLICK FOR INTERACTIVE DATA
tHe yeaR of lIvInG DIveRGentlyGdP Growth and Financial conditions in Selected Economies, 2014–2015
2015 base case
GROWTH AND POLICY} U.S. growth is on an upswing.
We expect the Fed to start raising rates in 2015 and the yield curve to flatten.
} Eurozone growth could surprise on the upside due to rock-bottom expectations. The European central bank (Ecb) looks likely to deliver on market hopes for full quantitative easing (QE).
} Japan’s monster bet on monetary stimulus brings both short-term opportunities (equities) and long-term risks (debt blowout).
} china is digging deeper in its monetary policy tool box to stave off an even bigger growth downdraft as it attempts reforms—a balancing act.
OUR INVESTMENTS} We like Japanese and European
equities due to cheap valuations and monetary boosters. We favor U.S. cyclicals over defensives as the Fed tightens.
} We prefer credit sectors such as U.S. high yield and European bank debt over sovereign debt. We like hard-currency EM debt, and favor U.S. Treasuries over other safe-haven bonds.
} We like income-paying real assets such as property and infrastructure, but want to get compensated for being illiquid.
} Our contrarian idea: beaten- up natural resources equities as a hedge if U.S. dollar strength fades.
AIR POCKETS} Nominal risk-free rates should
stay low for long. This means low rates of return—unless assets become oversold or investors use leverage.
} The foundation for a strong U.S. dollar is in place, yet the journey to long-term appreciation is tricky. Expect a bumpy ride.
} Volatility is set to return. Elevated valuations and a voodoo-like belief in momentum raise the cost of mistakes. The key is to have a plan beforehand.
} Stocks and bonds could fall in lock step, challenging traditional diversification. relative value strategies and alternative investments can help.

[ 4 ] 2 0 15 I n v e s t m e n t o u t l o o k
First Words
REAL GDP
Developed Emerging
October 2011
April 2012
April 2013
April 2014
October 2012
October 2013
October 2014
0 2 4 6%
PERCENTAGE POINTS
China
India
U.S.
U.K.
Eurozone
Brazil
Japan
Canada
Australia
-1 1%0-2
Norway
Russia
Developed Emerging
Sources: BlackRock Investment Institute and IMF, November 2014. Note: IMF growth forecasts are five-year-ahead real GDP growth projections.
Sources: BlackRock Investment Institute and UBS, November 2014. Note: The chart shows the simulated impact on GDP after one year from a permanent $25 decline in the price of oil, as estimated by UBS in an econometric model that takes into account linkages between economies, GDP and inflation.
faDInG oPtImIsm IMF real GdP Growth Forecasts, 2011–2014
oIl slIckGdP Impact of $25 Oil Price Fall
Some 120 blackrock portfolio managers and executives discussed what is in store for markets next year at our 2015 Outlook Forum in mid-November in London. The semi-annual event, the seventh of its kind, was marked by intense investment debates in small and large groups.
One exercise featured a pre-mortem: “It’s mid-2015 and one of your investments has blown up. Which one, and how could you have hedged it?” We pushed ourselves to re-examine these lower-conviction positions, many of them pro-growth or relying on price momentum. We debated our high-conviction investments in another—less morbid—session and have sprinkled them throughout this publication.
The reason for introspection: The financial market cycle has moved ahead of the economic one in many countries, partly as a result of QE. A torrent of monetary stimulus did not just suppress volatility, but pulled forward financial activity as well.
Valuations in most markets are rich and investor faith in monetary policy underpinning asset prices is high (pages 6–7). We reminded ourselves that periods of high returns are usually followed by low ones; the trick is picking the turning points. bursts of market volatility from the current low levels are likely—and have the potential to wrong-foot investors (page 8). Easy hedges are tougher as stock and bond prices may start moving in the same direction. Also, yields are so low that bonds risk losing their role as shock absorbers (page 9).
Growth scares and tumbling resources prices have led to sharp falls in inflation expectations. The worry for central bankers: Even medium-term inflation expectations (which discount swings in energy prices) are falling fast, particularly in the eurozone. This suggests central banks alone cannot prevent disinflation. Increased public spending may be needed to reflate economies—but many governments are unwilling (or unable) to loosen their purse strings.
The global recovery from the 2008 financial crisis has been an unusually tepid one. Nominal growth in 2015 is expected to be below the 15-year trend in most economies, according to International Monetary Fund (IMF) forecasts, with the U.S. and Japan notable exceptions.
Many pro-growth assumptions—rising wages and inflation, a behind-the-curve Fed and an uptick in global growth—did not pan out in 2014. GdP forecasts have a history of downward revisions. See the chart to the left. The oil price decline, if sustained, could reverse this trend in 2015 as it should boost real growth in major economies. See the chart above.
The price fall should dampen headline inflation in the developed world. This could strengthen calls for monetary stimulus in weak economies and help keep a lid on bond yields in stronger ones. Lower energy prices benefit many EM nations due to improved trade balances, reduced government subsidies and lower inflation. India, Indonesia and Thailand should be winners, we believe. Oil exporter Nigeria could be a casualty.

[ 5 ]I n t R o D u c t I o n
General ElectionMay 7
Congress ElectionJuly
Key Fed MeetingsJan 29–30Mar 19–20Apr/May 30–1 Jun 18–19
Debt CeilingMar 15
General ElectionOct 19
Presidential ElectionOctober
Joins EuroJan 1
General ElectionOctober
National AssemblyElectionJun 13
Budget ReleaseFebruary
CANADA LITHUANIA
POLAND
TURKEY
INDIA
General ElectionFeb 14
NIGERIA
General Electionby Oct 11
General ElectionDec 20
SPAINPORTUGALARGENTINA
U.S.
MEXICO
U.K.
Source: BlackRock Investment Institute, November 2014.
maRk youR calenDaREvents to Watch in 2015
QE2Total
ECBLTRO
U.S. Federal Reserve
BIL
LIO
N
-400
0
400
$800
Bank of JapanTotal
European Central BankBank of England
QE1
QE3
2009 2010 2011 2012 2013 2014
Kurodanomics
Sources: BlackRock Investment Institute and Citi Research, November 2014. Notes: Liquidity injections are net securities purchases plus long-term repos. Data are rolling three-month averages. LTRO is long-term refinancing operation, the ECB program to provide financing to eurozone banks.
PassInG tHe Buckcentral bank Liquidity Injections, 2009–2014
LIQUIDITY DRAIN?Monetary policy around the globe is increasingly diverging, with tightening financial conditions in the U.S. and U.K. and mostly looser policies elsewhere (page 3). The Fed may start raising rates as wages rise in an improving labor market, but halt its tightening cycle at a historically low level (pages 14–15). The strengthening U.S. dollar is a dampener on global liquidity (pages 10–11).
Liquidity injections by global central banks slowed in 2014 as the Fed wound down its bond buying program. The boJ has grabbed the baton and doubled down on its monetary stimulus. See the chart on the right. does 120 yen of boJ QE really equal $1 of Fed QE? Some of Kuroda’s largesse will undoubtedly pass through Narita Airport, but its effect on most global markets is likely limited.
The eurozone is in a rut (pages 16–17). The Ecb is committed to expanding its balance sheet and may finally unleash the monetary stimulus markets have been hoping for: buying of sovereign bonds. Japan is holding off on raising its sales tax as its economy has again dipped into recession (page 13).
Nominal growth in many emerging markets is subdued, according to the latest IMF forecasts, as export machines throttle back (pages 18–19). India and china are still growing at very high absolute levels, however, and both countries are relaxing monetary policy. china’s growth is coming off an ever larger base, meaning its absolute demand for commodities and machinery is still increasing.
regional political and military conflicts abound (page 12) and could trigger wholesale “risk-off” market moves if not contained. Next year’s calendar is led by the U.K. elections, which could revive talk of an EU breakup, but is lighter on key emerging market polls than 2014 (Nigeria is an exception). See the map below for other key events.
[ 6 ] 2 0 15 I n v e s t m e n t o u t l o o k
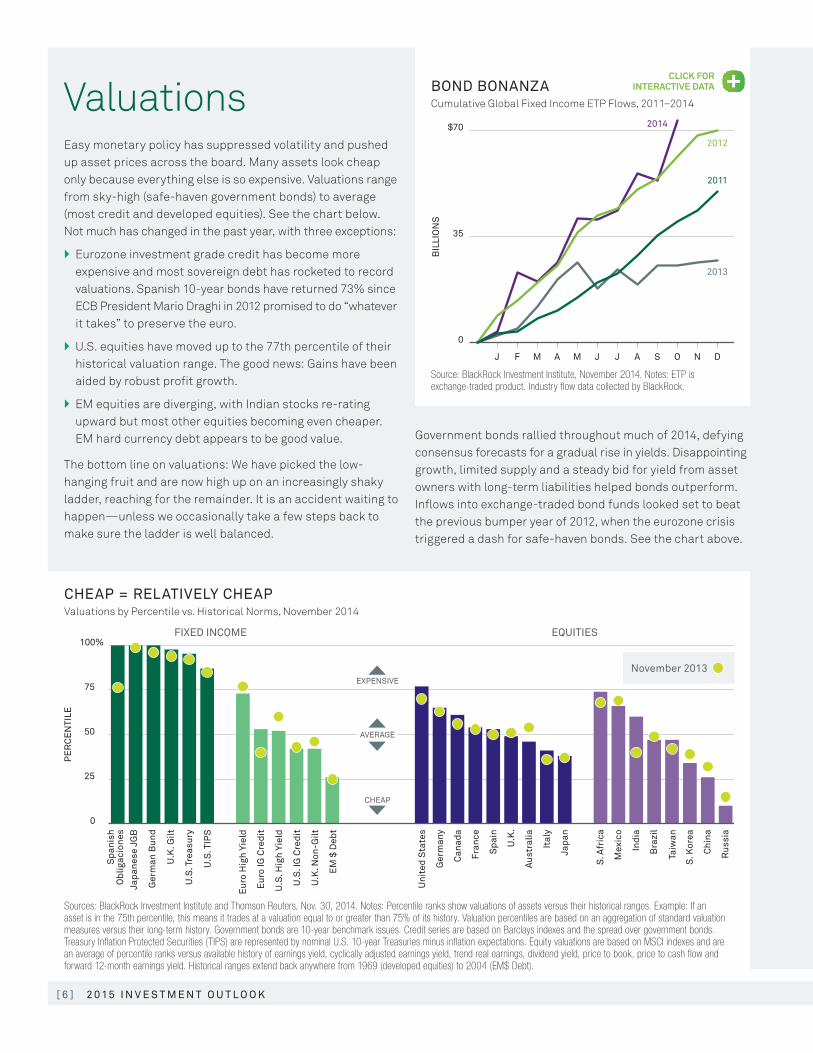
Sources: BlackRock Investment Institute and Thomson Reuters, Nov. 30, 2014. Notes: Percentile ranks show valuations of assets versus their historical ranges. Example: If an asset is in the 75th percentile, this means it trades at a valuation equal to or greater than 75% of its history. Valuation percentiles are based on an aggregation of standard valuation measures versus their long-term history. Government bonds are 10-year benchmark issues. Credit series are based on Barclays indexes and the spread over government bonds. Treasury Inflation Protected Securities (TIPS) are represented by nominal U.S. 10-year Treasuries minus inflation expectations. Equity valuations are based on MSCI indexes and are an average of percentile ranks versus available history of earnings yield, cyclically adjusted earnings yield, trend real earnings, dividend yield, price to book, price to cash flow and forward 12-month earnings yield. Historical ranges extend back anywhere from 1969 (developed equities) to 2004 (EM$ Debt).
cHeaP = RelatIvely cHeaP Valuations by Percentile vs. Historical Norms, November 2014
100%
75
50
25
0
Japa
nese
JG
B
Spa
nish
Obl
igac
ione
s
Ger
man
Bun
d
U.K
. Gilt
U.S
. Tre
asur
y
U.S
. TIP
S
Eur
o H
igh
Yiel
d
U.S
. Hig
h Yi
eld
EM
$ D
ebt
U.S
. IG
Cre
dit
U.K
. Non
-Gilt
Eur
o IG
Cre
dit
Rus
sia
Chi
na
S. K
orea
Bra
zil
Taiw
an
Indi
a
Mex
ico
S. A
fric
a
Japa
n
Ital
y
Spa
in
Aus
tral
ia
U.K
.
Fran
ce
Ger
man
y
Can
ada
Uni
ted
Sta
tes
PE
RC
EN
TILE
CHEAP
EXPENSIVE
EQUITIESFIXED INCOME
AVERAGE
November 2013
BIL
LIO
NS
$70
0
35
J F M A M J J A S O N D
2011
2012
2013
2014
Source: BlackRock Investment Institute, November 2014. Notes: ETP is exchange-traded product. Industry flow data collected by BlackRock.
BonD BonanZacumulative Global Fixed Income ETP Flows, 2011–2014
Easy monetary policy has suppressed volatility and pushed up asset prices across the board. Many assets look cheap only because everything else is so expensive. Valuations range from sky-high (safe-haven government bonds) to average (most credit and developed equities). See the chart below. Not much has changed in the past year, with three exceptions:
} Eurozone investment grade credit has become more expensive and most sovereign debt has rocketed to record valuations. Spanish 10-year bonds have returned 73% since Ecb President Mario draghi in 2012 promised to do “whatever it takes” to preserve the euro.
} U.S. equities have moved up to the 77th percentile of their historical valuation range. The good news: Gains have been aided by robust profit growth.
} EM equities are diverging, with Indian stocks re-rating upward but most other equities becoming even cheaper. EM hard currency debt appears to be good value.
The bottom line on valuations: We have picked the low-hanging fruit and are now high up on an increasingly shaky ladder, reaching for the remainder. It is an accident waiting to happen—unless we occasionally take a few steps back to make sure the ladder is well balanced.
Government bonds rallied throughout much of 2014, defying consensus forecasts for a gradual rise in yields. disappointing growth, limited supply and a steady bid for yield from asset owners with long-term liabilities helped bonds outperform. Inflows into exchange-traded bond funds looked set to beat the previous bumper year of 2012, when the eurozone crisis triggered a dash for safe-haven bonds. See the chart above.
CLICK FOR INTERACTIVE DATAValuations

[ 7 ]m a R k e t s
“ High yield is a canary-in-the-coal-mine kind of asset. It should have a lot of dispersion (of returns). When you get to these periods where high yield doesn’t have dispersion, it’s telling you something. I call that complacency.” — Tom Parker
Deputy Chief Investment Officer, BlackRock Model-Based Fixed Income
12
Black Monday
Surprise Fed Hike
Asia Crisis
FinancialCrisis
EuroCrisis
8
4
RAT
IO
0
2011 20141986 1991 1996 2001 2006
Russia Default
Source: BlackRock Investment Institute, November 2014. Notes: The BlackRock Complacency Gauge measures the level of cross-sectional dispersion in the U.S. high yield market. Grey bars represent periods when the ratio was in the bottom decile.
tHe canaRy In tHe coal mIneblackrock complacency Gauge, 1986–2014
COMPLACENCYThe U.S. high yield market is a canary in the coal mine. It is at the bottom of the capital structure (only equities are lower), where defaults first bite. The performance of high yield bonds, therefore, should be company specific and varied. If you are not getting dispersed returns in this asset class, something is wrong: Investors are too complacent.
Whenever dispersion falls to trough levels (we define these as the 10th decile of a range going back to the mid-1980s), markets often reverse sharply. See the chart below. Our complacency gauge once again is flashing red. Note: We still expect U.S. high yield to perform well in the near term due to solid U.S. growth and low default rates. Yet our gauge suggests we are closer to the end of the financial cycle than the economic cycle.
bottom line: There appears to be more downside if we are wrong than upside if we are right. So perhaps it is time to insulate portfolios. Go up in quality and liquidity. Use no or less leverage. Avoid large positions in markets that are running on momentum fumes. Position for future relative value opportunities. Accept lower returns now to get ready for bigger ones later.
ALTERNATIVE ASSESSMENT Heady valuations, low dispersion and lots of volatility: The case for alternative investments has rarely been stronger. Or has it? It depends in large part on whether investors are adequately compensated for taking liquidity risk (the risk of locking up funds and forgoing opportu-nities elsewhere). Here is a rundown:
Private equity (Pe): Valuations are frothy. PE outfits are selling everything they can in public markets at valuations well above 2006 levels. be selective: Leverage can never turn a bad asset into a good one. The market has not peaked yet, in our view. beware when PE firms start buying publicly listed stocks rather than private assets.
Infrastructure: The infrastructure story is tantalizing—trillions of dollars needed in infrastructure upgrades and a global wall of money seeking yield. Yet the investable universe is small and funds take a long time to invest. Infrastructure debt is long-duration (up to 25 years or more) with limited liquidity. This is fine, as long as you are in for the long haul and get paid for your patience. We typically avoid riskier greenfield projects.
Real estate: Inflows from frustrated fixed income investors have increased liquidity—but also inflated valuations. Yet opportunities remain as prices vary widely within regions, markets and property types. We favor U.S. core real estate, especially office buildings and multi-family dwellings, as U.S. growth and the dollar are set to rise. We expect above-average annual returns over 2015–2017 in this area. We also see opportunities to refurbish office buildings in major Western European markets. And we like china. A credit crunch in the real estate sector has left over-leveraged projects in need of equity injections. We particularly like shopping centers in second-tier chinese cities.
credit: debt covenants offer ever less protection in public credit markets. Investors willing to take on liquidity risk can negotiate better terms in private markets. Other opportunities include peer-to-peer lending (although here, too, an influx of new investors is starting to depress returns) and the stable and unglamorous business of mortality risk in insurance portfolios. distressed credit is largely dormant. We prefer to wait for a spike in default rates to 5% or more to sift through the wreckage.
[ 8 ] 2 0 15 I n v e s t m e n t o u t l o o k
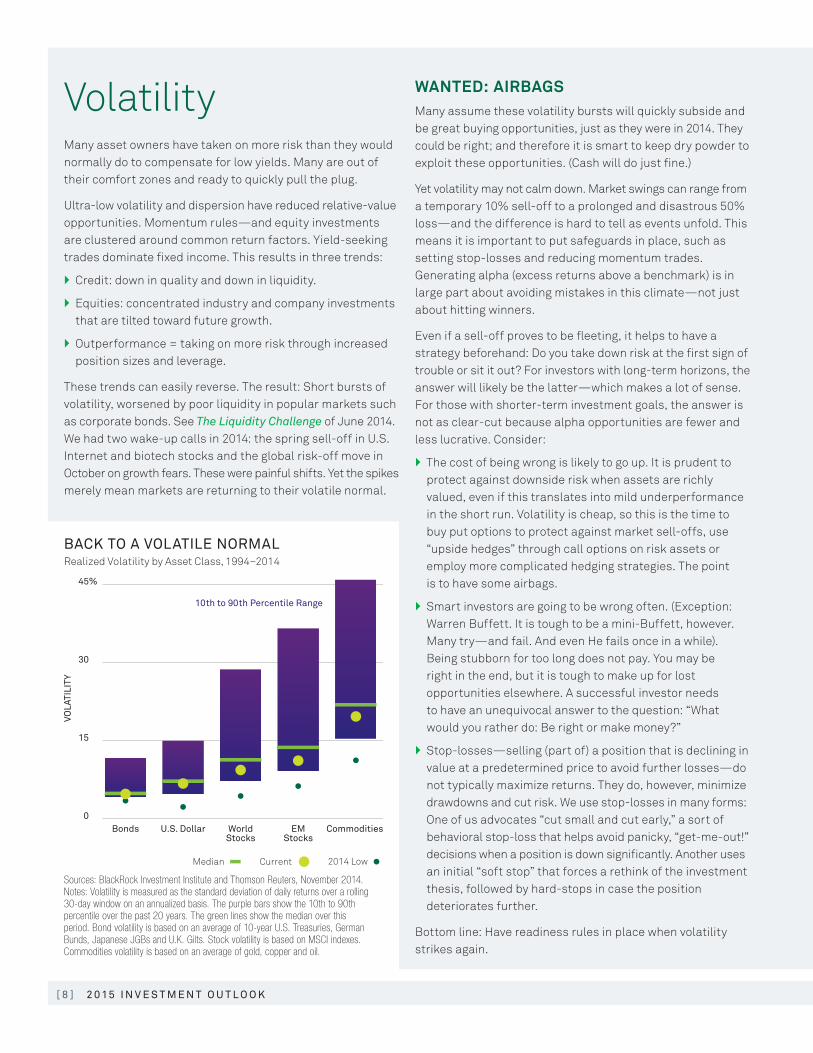
Sources: BlackRock Investment Institute and Thomson Reuters, November 2014. Notes: Volatility is measured as the standard deviation of daily returns over a rolling 30-day window on an annualized basis. The purple bars show the 10th to 90th percentile over the past 20 years. The green lines show the median over this period. Bond volatility is based on an average of 10-year U.S. Treasuries, German Bunds, Japanese JGBs and U.K. Gilts. Stock volatility is based on MSCI indexes. Commodities volatility is based on an average of gold, copper and oil.
Back to a volatIle noRmalrealized Volatility by Asset class, 1994–2014
45%
30
15
2014 Low
VOLA
TILI
TY
0World
StocksEM
StocksCommoditiesU.S. DollarBonds
CurrentMedian
10th to 90th Percentile Range
Many asset owners have taken on more risk than they would normally do to compensate for low yields. Many are out of their comfort zones and ready to quickly pull the plug.
Ultra-low volatility and dispersion have reduced relative-value opportunities. Momentum rules—and equity investments are clustered around common return factors. Yield-seeking trades dominate fixed income. This results in three trends:
} credit: down in quality and down in liquidity.
} Equities: concentrated industry and company investments that are tilted toward future growth.
} Outperformance = taking on more risk through increased position sizes and leverage.
These trends can easily reverse. The result: Short bursts of volatility, worsened by poor liquidity in popular markets such as corporate bonds. See The Liquidity Challenge of June 2014. We had two wake-up calls in 2014: the spring sell-off in U.S. Internet and biotech stocks and the global risk-off move in October on growth fears. These were painful shifts. Yet the spikes merely mean markets are returning to their volatile normal.
WANTED: AIRBAGSMany assume these volatility bursts will quickly subside and be great buying opportunities, just as they were in 2014. They could be right; and therefore it is smart to keep dry powder to exploit these opportunities. (cash will do just fine.)
Yet volatility may not calm down. Market swings can range from a temporary 10% sell-off to a prolonged and disastrous 50% loss—and the difference is hard to tell as events unfold. This means it is important to put safeguards in place, such as setting stop-losses and reducing momentum trades. Generating alpha (excess returns above a benchmark) is in large part about avoiding mistakes in this climate—not just about hitting winners.
Even if a sell-off proves to be fleeting, it helps to have a strategy beforehand: do you take down risk at the first sign of trouble or sit it out? For investors with long-term horizons, the answer will likely be the latter—which makes a lot of sense. For those with shorter-term investment goals, the answer is not as clear-cut because alpha opportunities are fewer and less lucrative. consider:
} The cost of being wrong is likely to go up. It is prudent to protect against downside risk when assets are richly valued, even if this translates into mild underperformance in the short run. Volatility is cheap, so this is the time to buy put options to protect against market sell-offs, use “upside hedges” through call options on risk assets or employ more complicated hedging strategies. The point is to have some airbags.
} Smart investors are going to be wrong often. (Exception: Warren buffett. It is tough to be a mini-buffett, however. Many try—and fail. And even He fails once in a while). being stubborn for too long does not pay. You may be right in the end, but it is tough to make up for lost opportunities elsewhere. A successful investor needs to have an unequivocal answer to the question: “What would you rather do: be right or make money?”
} Stop-losses—selling (part of) a position that is declining in value at a predetermined price to avoid further losses—do not typically maximize returns. They do, however, minimize drawdowns and cut risk. We use stop-losses in many forms: One of us advocates “cut small and cut early,” a sort of behavioral stop-loss that helps avoid panicky, “get-me-out!” decisions when a position is down significantly. Another uses an initial “soft stop” that forces a rethink of the investment thesis, followed by hard-stops in case the position deteriorates further.
bottom line: Have readiness rules in place when volatility strikes again.
Volatility
[ 9 ]m a R k e t s
“ The cost of being wrong is going up. The best we can do is to have a plan. It’s not clear it’s going to work, but usually plan beats no plan.”
— Raffaele SaviCo-Head, BlackRock’s
Scientific Active Equities Team
CO
RR
ELA
TIO
N
-90
60%
30
0
-30
-60
1900 1920 1940 1960 1980 2000 2014
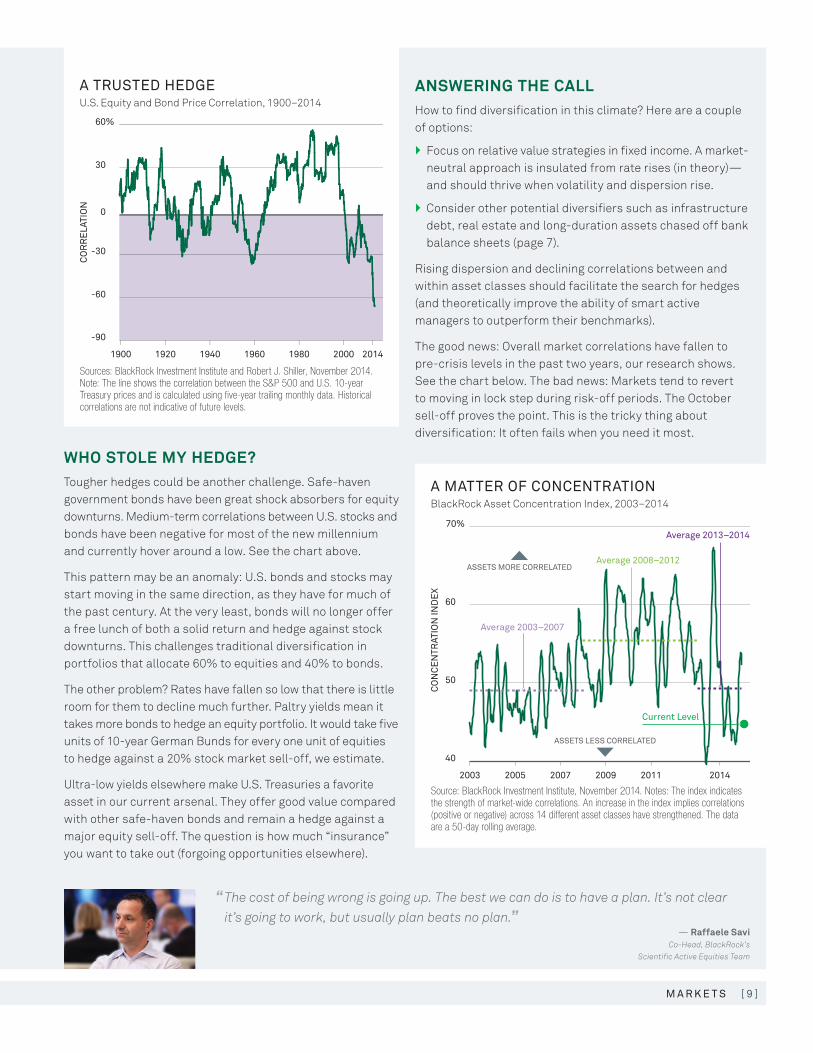
Sources: BlackRock Investment Institute and Robert J. Shiller, November 2014. Note: The line shows the correlation between the S&P 500 and U.S. 10-year Treasury prices and is calculated using five-year trailing monthly data. Historical correlations are not indicative of future levels.
a tRusteD HeDGeU.S. Equity and bond Price correlation, 1900–2014
Source: BlackRock Investment Institute, November 2014. Notes: The index indicates the strength of market-wide correlations. An increase in the index implies correlations (positive or negative) across 14 different asset classes have strengthened. The data are a 50-day rolling average.
a matteR of concentRatIonblackrock Asset concentration Index, 2003–2014
70%
Average 2003–2007
Average 2013–2014
Average 2008–2012
Current Level
CO
NC
EN
TRAT
ION
IND
EX
40
50
60
2003 2005 2007 2009 2011 2014
ASSETS MORE CORRELATED
ASSETS LESS CORRELATED
WHO STOLE MY HEDGE?Tougher hedges could be another challenge. Safe-haven government bonds have been great shock absorbers for equity downturns. Medium-term correlations between U.S. stocks and bonds have been negative for most of the new millennium and currently hover around a low. See the chart above.
This pattern may be an anomaly: U.S. bonds and stocks may start moving in the same direction, as they have for much of the past century. At the very least, bonds will no longer offer a free lunch of both a solid return and hedge against stock downturns. This challenges traditional diversification in portfolios that allocate 60% to equities and 40% to bonds.
The other problem? rates have fallen so low that there is little room for them to decline much further. Paltry yields mean it takes more bonds to hedge an equity portfolio. It would take five units of 10-year German bunds for every one unit of equities to hedge against a 20% stock market sell-off, we estimate.
Ultra-low yields elsewhere make U.S. Treasuries a favorite asset in our current arsenal. They offer good value compared with other safe-haven bonds and remain a hedge against a major equity sell-off. The question is how much “insurance” you want to take out (forgoing opportunities elsewhere).
ANSWERING THE CALLHow to find diversification in this climate? Here are a couple of options:
} Focus on relative value strategies in fixed income. A market-neutral approach is insulated from rate rises (in theory)—and should thrive when volatility and dispersion rise.
} consider other potential diversifiers such as infrastructure debt, real estate and long-duration assets chased off bank balance sheets (page 7).
rising dispersion and declining correlations between and within asset classes should facilitate the search for hedges (and theoretically improve the ability of smart active managers to outperform their benchmarks).
The good news: Overall market correlations have fallen to pre-crisis levels in the past two years, our research shows. See the chart below. The bad news: Markets tend to revert to moving in lock step during risk-off periods. The October sell-off proves the point. This is the tricky thing about diversification: It often fails when you need it most.
[ 1 0 ] 2 0 15 I n v e s t m e n t o u t l o o k
“ Whenever there’s a consensus that’s so unanimous on the stronger dollar, my gut tells me it’s wrong.”
— Teun DraaismaPortfolio Manager,
BlackRock’s Global Equities Team
550
450
350
Russell 2000
S&P 500
U.S. dollarstarts to rise
U.S. High Yield
140
120
IND
EX
LEVE
LS
SP
RE
AD
(INVE
RTE
D)
100
2013 2014
Sources: BlackRock Investment Institute and Thomson Reuters, November 2014. Notes: The high yield spread is in basis points and based on the Barclays U.S. Corporate High Yield Index. Stock index levels are rebased to 100 on Jan. 1, 2013.
lIQuIDIty DRaInU.S. Small caps, S&P 500 and High Yield, 2013–2014
6%
TRA
DE
DE
FIC
IT S
HA
RE
OF
GD
P
0
2
4
20111995 1997 1999 2001 2003 2005 2007 2009 2014
Petroleum Products
Other Goods & Services
Sources: BlackRock Investment Institute, U.S. Census Bureau and U.S. Bureau of Economic Analysis, November 2014.
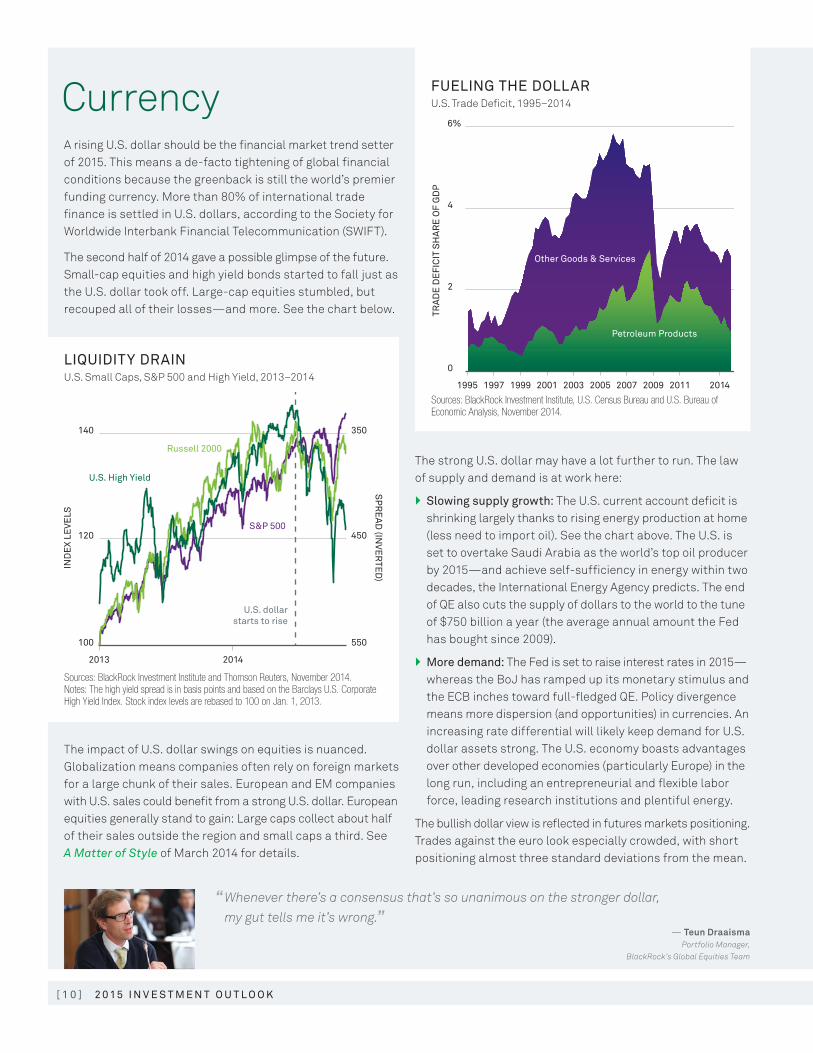
fuelInG tHe DollaRU.S. Trade deficit, 1995–2014
A rising U.S. dollar should be the financial market trend setter of 2015. This means a de-facto tightening of global financial conditions because the greenback is still the world’s premier funding currency. More than 80% of international trade finance is settled in U.S. dollars, according to the Society for Worldwide Interbank Financial Telecommunication (SWIFT).
The second half of 2014 gave a possible glimpse of the future. Small-cap equities and high yield bonds started to fall just as the U.S. dollar took off. Large-cap equities stumbled, but recouped all of their losses—and more. See the chart below.
The impact of U.S. dollar swings on equities is nuanced. Globalization means companies often rely on foreign markets for a large chunk of their sales. European and EM companies with U.S. sales could benefit from a strong U.S. dollar. European equities generally stand to gain: Large caps collect about half of their sales outside the region and small caps a third. See A Matter of Style of March 2014 for details.
The strong U.S. dollar may have a lot further to run. The law of supply and demand is at work here:
} slowing supply growth: The U.S. current account deficit is shrinking largely thanks to rising energy production at home (less need to import oil). See the chart above. The U.S. is set to overtake Saudi Arabia as the world’s top oil producer by 2015—and achieve self-sufficiency in energy within two decades, the International Energy Agency predicts. The end of QE also cuts the supply of dollars to the world to the tune of $750 billion a year (the average annual amount the Fed has bought since 2009).
} more demand: The Fed is set to raise interest rates in 2015— whereas the boJ has ramped up its monetary stimulus and the Ecb inches toward full-fledged QE. Policy divergence means more dispersion (and opportunities) in currencies. An increasing rate differential will likely keep demand for U.S. dollar assets strong. The U.S. economy boasts advantages over other developed economies (particularly Europe) in the long run, including an entrepreneurial and flexible labor force, leading research institutions and plentiful energy.
The bullish dollar view is reflected in futures markets positioning. Trades against the euro look especially crowded, with short positioning almost three standard deviations from the mean.
currency

[ 1 1 ]m a R k e t s
Sources: BlackRock Investment Institute and U.S. Federal Reserve, November 2014. Note: The shaded areas show the periods of a rising U.S. dollar.
DollaR PeRsPectIveTrade-weighted U.S. dollar Index, 1973–2014
140
120
100
80
60
1973 1978 1983 1988 1993 1998 2003 2008 2014
DO
LLA
R IN
DE
X
EM EMERGENCY?EM countries typically bear the brunt of a stronger U.S. dollar as funding sources dry up. Subsequent buying of local currencies to prevent them from sliding effectively tightens domestic financial conditions, we find.
rising issuance of U.S. dollar corporate debt has created pockets of vulnerability. Yet EM local currency issuance is rising, reducing overall exposure to foreign exchange mismatches. Another positive: International investment positions (the difference between external financial assets and liabilities) are pretty strong (page 19). Most governments are now net creditors. (Warning: companies often are debtors.)
EM countries will likely compete for liquidity by raising rates. This will cause slowdowns and currency gyrations. Plus, short-term asset price movements are often about flows and investor sentiment—which both can turn on a rupee. The good news: EM currencies and equities were relatively cheap when the U.S. dollar started its rise. A lot of adjustment has already happened.
A rising U.S. dollar also creates challenges for EM currencies linked to the greenback. The big question: Will china devalue? The chinese renminbi (rMb) has appreciated sharply against the yen and euro, and china’s current account is about balanced. This makes it tough to imagine the rMb appreciating further against the U.S. dollar. devaluation has pros (loosening financial conditions to offset a property slowdown and making exports more competitive) and cons (volatility and risk of deposit flight).
JOURNEY BEATS DESTINATIONIs the bullish view on the U.S. dollar already priced in? And is further strength in the currency really a sure thing? We spent some time debating this. Highlights:
} Forecasting currency movements has created many orphans. Over the long run (five years or more), currencies track fundamentals such as interest rate differentials. Valuation often does not work in the short or medium term.
} Getting the direction right is one thing; getting the timing right is another. Appreciation cycles in the trade-weighted U.S. dollar typically last six to seven years. See the chart on the right. Expect air pockets along the way. The journey is more important than the destination. For example, the dollar may fall for a year, but rally over five years (requiring patience).
} different paths to a stronger U.S. dollar could have different portfolio implications. The benign version: Stronger U.S. growth and rising rates lift the currency. A malign path: A global growth slowdown triggers safe-haven buying. bottom line: be humble about forecasting the U.S. dollar.
WHY WE COULD BE WRONGThe U.S. dollar’s rise has been muted compared with huge rallies seen in the early 1980s and late 1990s, especially given the wealth of intellectually tantalizing arguments for appreciation. See the chart below.
There are three possible explanations for this:
1. We are underestimating markets’ Pavlovian tendencies. Investors these days are conditioned to wait for monetary policy to dictate market moves. Markets are standing by until the Fed says: “Go!” result: The U.S. dollar will only take off when Fed chair Janet Yellen fires off her first rate hike.
2. The monetary policy divergence story is wrong. Most of us believe the U.S. economy should power ahead in 2015 (page 14), but some see a chance of growth disappointing (it has happened before). In that case, the Fed could delay its first rate hike to 2016. An even worse scenario for dollar bulls: U.S. economic momentum stalls, leading to expectations for a fourth round of QE. Or try this scenario across the Atlantic: The eurozone’s economy performs slightly better than expected (from a very low base), giving air cover for the Ecb to hold back from further (controversial) monetary easing.
3. The arguments for a stronger dollar could be too good to be true. Whenever a consensus is so unanimous, our gut tells us it is wrong. Stretched positioning means even a mild disappointment to dollar bulls could prompt a sell-off in the currency. This would be a double whammy for those expecting a stronger U.S. dollar versus the euro, but a boon for EM assets and commodities.

[ 1 2 ] 2 0 15 I n v e s t m e n t o u t l o o k
“ The world today is characterized by a large number of unstable and volatile regional situations. These are zero-sum conflicts.”
— Tom DonilonSenior Director,
BlackRock Investment Institute
Political risk
Source: BlackRock Investment Institute, November 2014.
Source: BlackRock Investment Institute, November 2014.
a WoRlD of RIskSummary of Geopolitical risks
scenaRIo PlannInGKey Scenarios for russia and Ukraine conflict
Risk Central Case Impact
China TensionsProvocations in South
china Sea; china-Japan tensions in East china Sea
Asia (particularly Philippines or
Vietnam)
Cyber Security Ongoing attacks Financial sector
India/PakistanPossible Pakistani terror
attack in India; escalation of Kashmir violence
Indian markets and currency
Iran Negotiations
Negotiations extendedIran and energy
sector
Middle East/Islamic State
Ongoing conflict; possible terrorist actions in West
Middle East; U.S. and/or Europe
North KoreaProvocations with
South KoreaSouth Korea
Ukraine Conflict Frozen conflict russia, Europe
Outcomes Probability Economic Fallout Market Impact
frozen conflict and continued sanctions
meDIum to HIGH
}European capex, exports and consumption hit. }russian economic slowdown and inflation.
DIscounteD} Partial reversal of losses in russian stocks,
sovereigns and high yield bonds.
overt Russian invasion, more sanctions and Russian retaliation
meDIum
} European economic slowdown and concern over gas supplies.
} Appropriation of foreign assets. } russian political unrest.
RIsk-off} russian stocks and ruble fall; sovereign and high
yield bond spreads widen sharply. } Global equities fall, particularly in Europe. } Flight into German bunds and U.S. dollar.
Russian actions in the Baltics and elsewhere
loW} Escalation of the above: risk of military conflict
and NATO involvement.
GloBal RIsk-off } Major sell-off in global equities.} Oil prices spike.
truce and resolution with some sanctions lifted
loW} European business confidence and
activity rebound.
RIsk on} Huge rally in russian stocks; European equities
tick up. } German (and global) yields rise; russian bond
spreads compress.
We generally worry more about economic risks (a china slowdown, rapid Fed rate hikes, deflation in the eurozone) than political risks. Yet the world is a very unstable place, characterized by a large number of regional “zero-sum conflicts.” These are disputes that are unlikely to be resolved by diplomacy; it is hard to imagine anybody negotiating peace treaties with the Islamic State or boko Haram.
The conflict between russia and the West over Ukraine and other former Soviet states is perhaps the greatest threat. President Vladimir Putin has proven he’s willing to cut off the nose (and more) to spite the face.
Our risk and Quantitative Analysis group has a framework to assess political risks and their potential impact on economies, markets and our portfolios. See an example below for our key scenarios on the Ukraine conflict (minus portfolio impact). The status quo—frozen conflict—is already reflected in deeply discounted russian equity markets. Yet an (unlikely) escalation of the conflict would reverberate beyond russia and hit risk assets hard globally, we believe.
Other risks lurking in the background include territorial spats between china and its neighbors and the possibility of terrorist attacks in the West. See the table above.

[ 1 3 ]G e o G R a P H I e s
Japan
Source: Goldman Sachs, November 2014. Note: The analysis is based on 1,689 Tokyo Stock Exchange-listed companies. 2014 and 2015 are Goldman Sachs estimates.
DIvvyInG uPJapanese buybacks and dividend Payouts, 2005–2015
15 6%
0
2
4
Return on Equity
10
5
Dividends
TRIL
LIO
NS
OF
YEN
RE
TUR
N O
N E
QU
ITY
0201520132011200920072005
Buybacks
Japan is all in—on a high-stakes bet that monetary stimulus will jump-start the country’s economy. The central bank’s balance sheet has swollen to almost 60% the size of Japan’s GdP, roughly three times the Ecb’s balance sheet as a share of the eurozone’s economy.
The boJ is even buying equities. This is a big boon to asset markets, especially as Japan’s bellwether $1.2 trillion Government Pension Investment Fund (GPIF) is wading in. The fund aims to more than double its benchmark allocation to Japanese and foreign equities to 25% each—and slash its allocation to Japanese government bonds (JGbs).
The boJ is effectively printing money to buy the Japanese pension fund’s government bonds—and finance its equity buying. The path of least resistance is likely to be up (further) for Japanese equities and down for the yen. A collapse in the trade-weighted yen has been mirrored by a rally in Japanese equities since 2012.
Other pension funds and households may start mirroring the GPIF’s move and shift some of their cash piles into stocks.
BEYOND THE BOJ’S BAzOOKAThe case for Japanese equities is not just about the boJ’s bazooka. Japan Inc. is changing (really). consider:
} Almost 45% of Japanese companies announced dividend hikes in 2014, according to SMbc Nikko, the highest percentage since data became available in 1995. dividends and buybacks have risen to the highest level in six years—and are poised to climb further, Goldman Sachs forecasts. See the chart on the right.
} corporate reforms are a key driver. These include the creation and adoption of corporate governance and stewardship codes. The new JPX-Nikkei 400 Index— which only includes companies with high returns on equity (rOE)—provides an incentive for Japanese cEOs to become more shareholder friendly. Nobody wants to be on the other side of this (admittingly long) velvet rope. The GPIF and other large domestic investors are already tracking the index.
} Japanese equities are the cheapest in the developed world (page 6). Yet these numbers understate Japan’s cheapness. Japanese accounting standards are more conservative than elsewhere (thanks to differences such as higher depreciation charges). We like both beneficiaries of a weak yen (exporters) and of domestic reflation (financials).
The biggest near-term risk for Japan is a loss of momentum for “Abenomics,” Prime Minister Shinzo Abe’s three-pronged plan to revitalize the economy and drag Japan out of a two-decade economic funk. Abenomics could give way to “Kurodanomics”—with boJ Governor Kuroda pressing harder and harder on the monetary accelerator, but structural reforms going nowhere. This would likely end in tears.
Abe has called a snap election and delayed a sales tax rise. The size of his parliamentary majority will affect his ability to deliver his “third arrow” structural reforms detailed in Rising Sun, Setting Sun of March 2014.
PLAYING WITH FIREbeing bullish on Japanese equities has become somewhat mainstream in the last two years. Foreign investors dominate trading, with a 60% share of volume on the Tokyo Stock Exchange. A loss of confidence in Abenomics could cause market gyrations. reforms to develop a stronger equity culture would reduce Japan’s vulnerability to the mood swings of global investors, but this will take time.
The boJ is playing with fire. What if the central bank actually succeeds and inflation starts to take off quickly? The nightmare scenario would be a spike in JGb rates leading to a fiscal crisis. Japan’s public debt load stands at almost 250% of GdP, according to the IMF, the highest in the G7.
[ 1 4 ] 2 0 15 I n v e s t m e n t o u t l o o k
“ I’m starting to worry about operational leverage. We have had five or six different events where companies stretched too far.”
— Sarah ThompsonHead of BlackRock’s
U.S. Liquid Credit Research
United StatesThe U.S. economy is in a cyclical upswing—and is one of the world’s few major economies expected to accelerate in 2015. Steady growth in employment, a moderate (yet patchy) housing recovery and rising capital expenditures (capex) all point to a sustainable recovery. So much for “secular stagnation” or any other catch phrases to denote a long-term growth decline.
A rise in household wealth and falling oil prices bode well for consumer spending, which accounts for about 70% of the U.S. economy. (Wealthier consumers are happier—and spend more.) Ultra-loose monetary policy has inflated U.S. equity and home values, boosting the net worth of U.S. households by $23.1 trillion, U.S. Federal reserve data show. Other positives include:
} rock-bottom interest rates have helped households reduce debt levels, and debt servicing payments have fallen to the lowest level in decades. Another boon for consumers: falling energy prices. The average hourly paycheck now buys 7.5 gallons of gasoline versus just over four in 2008, our calculations show.
} companies are hiring, with payrolls expanding at a pace of around 240,000 a month in 2014, according to the bureau of Labor Statistics. They are investing, too: capex jumped almost 11% in the third quarter, the latest quarterly GdP scorecard shows.
} Fiscal challenges are subsiding. The impact of rises in payroll taxes and government spending cuts—a drag on the economy in 2013—has largely faded. Even state and local governments are starting to spend again.
} Monetary policy should remain highly stimulatory. Even if the Fed were to hike by a full percentage point, real short-term interest rates would still be negative.
So when will the Fed raise rates—and by how much? It depends on the pace of recovery in the labor market, and on how soon wage growth starts to feed into higher inflation.
The headline U.S. unemployment rate stands at 5.8%, and is falling by around 0.1% per month. That means by mid-2015 unemployment could be homing in on 5%. This is the Fed’s rough estimate of the non-accelerating inflation rate of unemployment (NAIrU)—the threshold for inflationary pressures to build up.
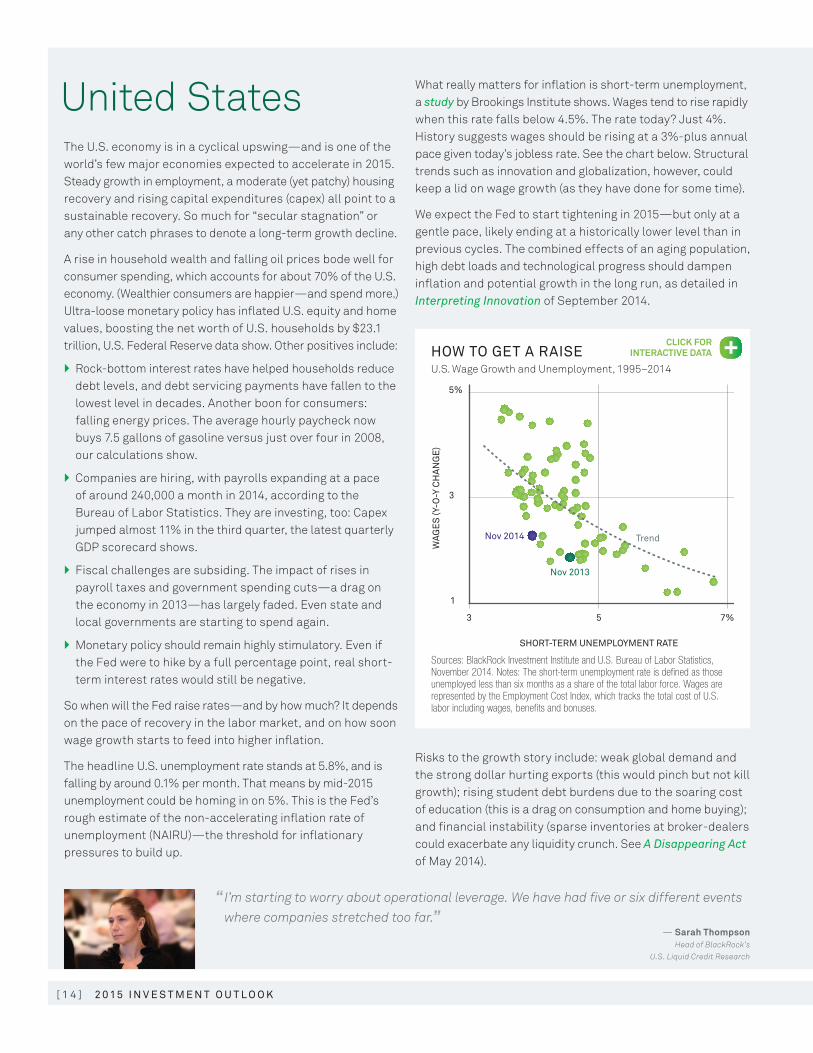
What really matters for inflation is short-term unemployment, a study by brookings Institute shows. Wages tend to rise rapidly when this rate falls below 4.5%. The rate today? Just 4%. History suggests wages should be rising at a 3%-plus annual pace given today’s jobless rate. See the chart below. Structural trends such as innovation and globalization, however, could keep a lid on wage growth (as they have done for some time).
We expect the Fed to start tightening in 2015—but only at a gentle pace, likely ending at a historically lower level than in previous cycles. The combined effects of an aging population, high debt loads and technological progress should dampen inflation and potential growth in the long run, as detailed in Interpreting Innovation of September 2014.
risks to the growth story include: weak global demand and the strong dollar hurting exports (this would pinch but not kill growth); rising student debt burdens due to the soaring cost of education (this is a drag on consumption and home buying); and financial instability (sparse inventories at broker-dealers could exacerbate any liquidity crunch. See A Disappearing Act of May 2014).
5%
3
1
WAG
ES
(Y-O
-Y C
HA
NG
E)
SHORT-TERM UNEMPLOYMENT RATE
3 7%5
Nov 2013
Nov 2014 Trend
Sources: BlackRock Investment Institute and U.S. Bureau of Labor Statistics, November 2014. Notes: The short-term unemployment rate is defined as those unemployed less than six months as a share of the total labor force. Wages are represented by the Employment Cost Index, which tracks the total cost of U.S. labor including wages, benefits and bonuses.
HoW to Get a RaIseU.S. Wage Growth and Unemployment, 1995–2014
CLICK FOR INTERACTIVE DATA

[ 1 5 ]G e o G R a P H I e s
AVE
RAG
E M
ON
THLY
RE
TUR
N
MONTHLY YIELD CHANGE (BASIS POINTS)
1.5%
-0.5
0
0.5
1
High Beta
Low Beta
-20 -10 100 20
Source: BlackRock Investment Institute, November 2014. Notes: The analysis plots the monthly performance of two portfolios of U.S. stocks (one high-beta and one low-beta) against monthly yield changes in 10-year U.S. Treasuries. The average monthly returns are excess returns above the risk-free rate and are based on a rolling window of 30% of the available history. Historical returns are not indicative of future performance.
Rate sWeet sPotU.S. High- and Low-beta Stocks vs. Yield changes, 1953–2013
Sources: BlackRock Investment Institute and Credit Suisse, November 2014. Notes: All figures are net of coupons and U.S. Federal Reserve purchases. 2014 and 2015 are Credit Suisse estimates.
lImIteD suPPlyNet U.S. debt Issuance, 2000–2015
$3
2
1
0
-1
-2
-3
Total
Mortgages
ABS
Treasury
Corporate
Other
TRIL
LIO
N
2000 2002 2004 2006 2008 2010 2012 2015
How high will U.S. rates rise in 2015? The median projection of Fed members points to a federal funds rate of around 1.4% by the end of the year. Markets are pricing in a rate of just under 0.5%. Short-term yields could rise a lot faster than expected if the Fed’s projections are on the mark.
We expect rates to drift higher, but only moderately. The U.S. dollar should strengthen and the yield curve flatten. credit and long bonds should do fine as yield-hungry insurers and pension funds dampen any yield spikes. Our model—which takes into account factors such as inflation and policy expectations—points to a fair value of around 2.7% for the U.S. 10-year Treasury yield, some 0.4% above current levels.
Yet U.S. Treasuries today look like good value compared with ultra-low-yielding Japanese and European bonds in depreciating currencies. German bund yields have become a big driver of Treasury yields over the past year, our research shows. This means the biggest risk for U.S. Treasuries in 2015 may not be the Fed—but European growth. Fiscal stimulus in Germany, unlikely as it may seem currently, would be a game-changer. Every 10-basis-point increase in the 10-year bund yield would boost U.S. yields by five basis points, we estimate.
The other side of the rate puzzle is supply. Net issuance of U.S. fixed income is expected to rise to the highest level in six years in 2015, driven by a halt in the Fed’s bond buying and increased corporate issuance. Yet total issuance should remain well short of pre-crisis years. See the chart above.
What would higher rates mean for U.S. equities? If history is any guide, there is likely to be a big difference between the performance of low-beta stocks (defensives) and high-beta stocks (cyclicals). U.S. defensives usually do well when interest rates are falling (and vice versa), as detailed in Risk and Resilience of September 2013. They tend to lose money when the 10-year yield rises more than 15 basis points in a month, our research shows. See the chart below.
U.S. cyclicals do best when rates rise—but only when the rise is mild. returns start to taper off when yields rise more than around 10 basis points in a month. This bodes well for cyclical stocks in 2015 (if history repeats itself). Even if the Fed hikes rates sharply, solid demand for longer-term bonds should dampen the rise in 10-year yields.
corporate earnings are a key risk. Analysts predict double-digit growth in 2015, yet such high expectations will be tough to meet. companies have picked the low-hanging fruit by slashing costs since the financial crisis. How do you generate 10% earnings-per-share growth when nominal GdP growth is just 4%?
It becomes tempting to take on too much leverage, use financial wizardry to reward shareholders or even stretch accounting principles. S&P 500 profits are 86% higher than they would be if accounting standards of the national accounts were used, Pelham Smithers Associates notes. And the gap between the two measures is widening, the research firm finds.

[ 1 6 ] 2 0 15 I n v e s t m e n t o u t l o o k
“ It’s amazing to me how dividends are overlooked by equity investors. There is still value in the space, and enough value may offset the drag that will come if we see a reversal in low-beta stocks.”
— Alice GaskellPortfolio Manager,
BlackRock’s European Equities Team
Europe
130
1960–2006 Recession Range
120
110
100
RE
AL
GD
P
90
-2 6420
AverageRecession
1960–2006
Eurozone
U.S.
Big-FiveFinancial Crises
YEARS AFTER RECESSIONYEARS BEFORERECESSION
Sources: BlackRock Investment Institute, Thomson Reuters and IMF, November 2014. Notes: Real GDP is rebased to 100. The big five financial crises are Spain (1977), Norway (1987), Finland (1991), Sweden (1991) and Japan (1992). The average recession (two straight quarters of contraction) is based on advanced G20 countries since 1960. The recession range is based on an average of the three best and worst recessions.
out of tHe Zonecurrent vs. Past recoveries from recession, 1960–2014
The eurozone is an economic laggard. Its recovery from the recent financial crisis has fallen far short of that from previous crises around the world—and dramatically short of the typical recovery from past recessions. See the chart below. The U.S. is following the script of an economic recovery after a financial crisis. As a result, the gap between the two blocks is growing.
Outright deflation is a palpable risk in the eurozone (although some of us would say it is a marketing tool used by central bankers to justify QE). All economies are undershooting the Ecb’s 2% inflation target. A thorny problem: Inflation in eurozone locomotive Germany is too low at just 0.5%. Higher German inflation would help weak peripheral economies such as Greece, Spain and Italy to regain competitiveness. Yet the fear of inflation is deeply ingrained in the bundesbank’s psyche, and Germans are already complaining the Ecb’s low rates are destroying their savings. draghi risks losing the support of his major stakeholder.
FRENCH FAULT LINEThe Ecb has vowed to combat deflation by boosting its balance sheet by 50% to €3 trillion. Markets are counting on full-blown QE (direct purchases of sovereign bonds). Germany is opposed to such a move—but we think it will (reluctantly) be dragged to the sovereign QE altar. The Ecb could extend asset purchases to include corporate bonds as a preliminary step.
Would QE help? The jury is out. QE’s “wealth effect” (the knock-on impact on consumer spending from boosting asset prices) would not mirror the U.S. experience due to lower equity and home ownership rates in Europe, we think. Germans have just 22% of their savings in equities versus 47% for Americans, according to McKinsey. European individual investors hold a majority of their non-housing assets in cash—earning a negative nominal and real yield—our research shows. Still, QE could have a big impact on confidence.
France is fast becoming the eurozone’s fault line. The country could become more competitive by implementing reforms: freeing up labor markets and cutting red tape. Yet its politicians appear to have little appetite for tackling sacred cows (which exceed the bovine population of Normandy). France’s 2015 budget will be a key test for the likelihood of decisive reforms.
ANNUS HORRIBILIS Skeptics argue the eurozone cannot survive without greater economic and financial integration. Our view: The current system can muddle through for another five years but does not look sustainable in the long run. It is bound to either integrate deeper over time—or break up.
Policymakers have shown great determination in ensuring the currency union survives. The consequences of any nation leaving are just too uncertain (and are not even a discussion point in Germany at this time). Yet further integration beyond a banking union is tough, as eurozone institutions are seen as lacking democratic legitimacy.
Events could come to a head in 2017, a likely annus horribilis with a trio of key political hurdles for the European project: German and French elections and a possible U.K. referendum on EU membership. See the sidebar on the next page. A more immediate test would be a victory of populist parties in the upcoming Greek elections—a much under-clubbed risk.

[ 1 7 ]G e o G R a P H I e s
SH
AR
E
50%
30
40
Stay In EU
Leave EU
2011 2012 20142013
Sources: BlackRock Investment Institute and YouGov, November 2014. Note: Responses are based on the question “If there was a referendum on Britain’s membership of the European Union, how would you vote?”
sHoulD I stay oR sHoulD I Go?Opinion Polls on U.K. EU Membership, 2011–2014
Portugal
SH
AR
E O
F E
UR
OZO
NE
GD
P
-3
2%
1
0
-1
-2
IrelandGreece
1999 2002 2005 2008 2011 2014
Spain
Germany
France
Italy
Sources: BlackRock Investment Institute and Eurostat, November 2014. Note: Current account balances are 12-month moving averages and are expressed as a share of total eurozone GDP.
ImBalanceD unIonSelected Eurozone current Account balances, 1999–2014
LOW-FLYING PLANEImbalances are growing in the eurozone. Germany’s current account surplus is equivalent to more than 2% of the region’s GdP (and a whopping 7.3% of its own). See the chart on the right. In the “one-size-fits-all” monetary union, Germany has a hopelessly undervalued currency.
A “grand bargain” with Germany ramping up fiscal stimulus in exchange for structural reforms in France would be a game-changer for markets. We are not holding our breath. Germany on its own has little need for stimulus, many Germans argue.
It is not all doom and gloom:
} The Ecb ’s Asset Quality review helped shore up confidence in the region’s shaky banking system—and in its own role as a new pan-European banking regulator with teeth. banks eased lending standards for the second straight quarter, following seven years of tightening, its most recent survey showed.
} The trade-weighted euro has fallen more than 5% since March, boosting prospects for European exporters.
bottom line: The eurozone is a low-flying plane that constantly hits air pockets. This causes both occasional lifts and near-death experiences. The upside (in the near term): Expectations are so depressed even a moderate cyclical rebound would be a booster for European risk assets. The bar is low: Greece is set to be one of the fastest growing eurozone economies in 2015.
BREXIT BANTER 2015 could shape up as a big year for the U.K. Key events include a general election and the prospect of the boE’s first rate hike since 2007.
An election win by the ruling conservative Party would pave the way for a 2017 referendum on EU membership. A “brexit” is unlikely—opinion polls point to a steady rise in the “Stay in the EU” camp. See the chart on the left. Yet the political noise (and market gyrations) could make the Scottish referendum look like child’s play. A left-leaning coalition win would likely hurt business confidence—and could upset (consensus) expectations for a rate rise and strong sterling.
The boE is on a similar track as the U.S. Fed. Unemployment has been falling, yet there are few signs of wage growth. The central bank is set to raise rates from the 320-year low of 0.5%, provided election uncertainty does not derail the economy in 2015. We expect sterling to rise but gilts to fare poorly. Selling by foreigners (who own a near-record 29% of gilts) could exacerbate any bond market moves.
Some selected ideas on how to exploit this: cyclicals such as European automakers look cheap—with many companies trading near 2008–2009 lows. consider contrarian investments in beaten-down luxury goods makers and integrated oil majors. We like subordinated bank debt in fixed income. These bonds look like better value than peripheral sovereigns—and would likely benefit from Ecb liquidity provision.

[ 1 8 ] 2 0 15 I n v e s t m e n t o u t l o o k
“ As a fund manager, I’m always worried: Are all these reforms actually going to happen?”
— Helen zhuHead of BlackRock
China Equities
Emerging Marketsdivergence in the emerging world is becoming more evident due to tightening U.S. monetary policy and falling commodities prices. (We should start calling them diverging markets.) Satellites of the eurozone and Asia will likely import dovish monetary policies from the Ecb and boJ, respectively. They will have room to cut rates to spur growth. commodities producers such as russia and brazil might have to hike rates to defend their currencies. Yet still others, such as Mexico and china, stand to gain from U.S. economic momentum.
These diverse countries have one thing in common: Traditional export models are challenged. The reasons are weak global demand from the developed world and a deceleration in the emerging world’s engine, china. Export growth has been essentially flat for the past three years. See the chart below.
Weak EM currencies and equity prices have offset the lack of export growth to some extent. Yet countries could do more to unlock their potential: improve infrastructure, institutions and education, and enact reforms to make their economies more competitive.
REFORMING MARKETSA little reform can go a long way—especially if starting expectations are low.
china’s leaders are (gently) tapping the growth brakes as they attempt their biggest reform since the 1980s: cutting the economy’s dependence on investment and raising the share of consumption. There are plenty of subtleties along the way:
} china’s recent interest rate cut was the latest in a series of targeted easing measures to loosen financial conditions and provide a stable growth foundation for structural reforms. rate cuts often have come in a series, accompanied by fiscal stimulus. We could see this scenario play out again.
} We see economic growth and demand for resources slowing, but not falling off a cliff. remember growth is coming off an increasingly large base. Also, high growth is not necessarily good for markets. china’s economy powered ahead in the new millennium, yet equities underperformed as structural problems such as over-investment increased.
} The trading link between the Shanghai and Hong Kong stock exchanges over time should boost investor confidence in china’s domestic markets and increase their index weighting. Falling property prices, a string of scandals surrounding asset-backed securities schemes and cheap valuations make equities look (relatively) attractive to domestic investors.
India is riding a wave of optimism after pro-business Narendra Modi won the elections. Indian debt looks like good value with inflation falling. robust earnings growth supports (pretty heady) equity valuations, but visible progress on reforms is needed for markets to advance further. See India Under New Management of September 2014.
mexico is well along on the reform path, including freeing up the key energy sector. benefits take years to become evident, and reforms often stoke a backlash in the short term.
The reform magic is at work in Indonesia as well, with the election of hands-on Joko Widodo. The country has cut fuel subsidies (as has India), but further reforms will be a hard slog—Widodo does not have a parliamentary majority.
Long-suffering holders of south korea’s stocks are pinning their hopes on reform measures that incentivize companies to raise dividends. A more immediate catalyst could be further easing by the bank of Korea.
Y-O
-Y C
HA
NG
E
-40
-20
20
0
40%
2004 2006 2008 2010 2012 2014
Sources: BlackRock Investment Institute and IMF, November 2014. Note: The line shows the annual change in the value of goods exports in U.S. dollars.
tRaDInG DoWnEM Export Growth, 2004–2014
CLICK FOR INTERACTIVE DATA

[ 1 9 ]G e o G R a P H I e s
Source: BlackRock Investment Institute, November 2014. Notes: The chart shows the top-13 emerging markets by GDP based on IMF data. The countries are ranked by their overall score in our 50-country BSRI. Major BSRI components Fiscal Space, External Finance Position and Financial Sector Health are broken down by their subcomponents.
Ru cn Pl tH co BR mX ID Za tR In nG aR
100% BSRI Ranking 21 22 23 26 29 32 33 34 35 38 39 41 45
40% fiscal space n n n n n n n n n n n n n
Proximity to distress n n n n n n n n n n n n n
distance From Stability n n n n n n n n n n n n n
30% Willingness to Pay n n n n n n n n n n n n n
20% external finance Position n n n n n n n n n n n n n
External debt Position n n n n n n n n n n n n n
External debt Term Structure n n n n n n n n n n n n n
current Account Position n n n n n n n n n n n n n
10% financial sector Health n n n n n n n n n n n n n
bank Stability n n n n n n n n n n n n n
capital Adequacy n n n n n n n n n n n n n
credit bubble risk n n n n n n n n n n n n n
banking Share of Economy n n n n n n n n n n n n n
DIveRGInG maRketsblackrock Sovereign risk Index (bSrI) EM Scorecards, September 2014
YIE
LD
4
8
Free Cash Flow Yield
Earnings YieldCHEAP
EXPENSIVE
0
12%
2002 2004 2006 2008 2010 2012 2014
Sources: BlackRock Investment Institute and MSCI, November 2014. Note: The chart is based on weighted average valuations of stocks in the MSCI Emerging Markets Index through September 2014.
WHeRe’s tHe casH?EM Equity Valuations, 2002–2014
AGE OF CHERRY-PICKING Fast-changing growth models in the emerging world mean future winners are likely to be different than the winners of the past. companies catering to the rising middle classes should gain. resource industries and capital equipment providers will likely lose ground as countries rebalance growth. The problem: These expectations are often already priced in.
The divergence theme within the emerging world is getting stronger. Examples abound: cheaper oil, a slowdown in chinese wage growth and a strong U.S. economy bode well for Taiwanese companies with factories on the mainland. russia, by contrast, resembles a slow-motion T-90 tank crash. Slumping oil prices, economic sanctions, capital outflows, a cratering currency and rising inflation: russian assets could get cheaper yet.
The divergence is illustrated by the dispersion of EM rankings and the variation in their component scores in our 50-country BlackRock Sovereign Risk Index (bSrI). See the chart below. Note: The bSrI is a slow-moving indicator, and small changes in scores can result in large shifts in rankings as some countries are bunched up in the index.
Most EM countries get poor marks in our Willingness to Pay category, which gauges a government’s perceived effectiveness. External finance is a key component to watch. History shows EM countries with large current account deficits and foreign currency debts often see their currencies depreciate (or fall off a cliff) when funding dries up. See Emerging Markets on Trial of February 2014. We prefer hard-currency EM debt.
EM equity valuations are generally cheap, relative to both developed market stocks and their own history (page 6). Yet these metrics can be deceptive. Average valuations are dragged down by chinese banks and russian stocks. Free cash flow yields have been well below the average earnings yield. See the chart above. This is a key indicator as many EM companies are poor stewards of capital and tend to over-invest. Hopes for more (public) shareholder-friendly policies are often dashed. bottom line: company selection is key.
CLICK FOR INTERACTIVE DATA
n > 0.5 BsRI score n -0.5 to 0.5 n < -0.5

BLACKROCK INVESTMENT INSTITUTEThe BlackRock Investment Institute leverages the firm’s expertise across asset classes, client groups and regions. The Institute’s goal is to produce information that makes blackrock’s portfolio managers better investors and helps deliver positive investment results for clients.
WHY BLACKROCK®
blackrock helps millions of people, as well as the world’s largest institutions and governments, pursue their investing goals. We offer:
} a comprehensive set of innovative solutions
} Global market and investment insights
} sophisticated risk and portfolio analytics
We work only for our clients, who have entrusted us with managing $4.5 trillion,* earning blackrock the distinction of being the world’s largest fiduciary investment manager.†
blackrock.com | Financial Advisors: Investment Directions | Individual Investors: The List
Want to know more?
EXEcUTIVE dIrEcTOrLee Kempler
GLObAL cHIEF INVESTMENT STrATEGISTS Ewen cameron Watt and russ Koesterich
EXEcUTIVE EdITOrJack reerink
Unless indicated otherwise, all publications mentioned are issued by BlackRock Investment Institute and can be found on its website.
This material is part of a series prepared by the BlackRock Investment Institute and is not intended to be relied upon as a forecast, research or investment advice, and is not a recommendation, offer or solicitation to buy or sell any securities or to adopt any investment strategy. The opinions expressed are as of December 2014 and may change as subsequent conditions vary. The information and opinions contained in this paper are derived from proprietary and nonproprietary sources deemed by BlackRock to be reliable, are not necessarily all-inclusive and are not guaranteed as to accuracy. As such, no warranty of accuracy or reliability is given and no responsibility arising in any other way for errors and omissions (including responsibility to any person by reason of negligence) is accepted by BlackRock, its officers, employees or agents. This paper may contain “forward-looking” information that is not purely historical in nature. Such information may include, among other things, projections and forecasts. There is no guarantee that any forecasts made will come to pass. Reliance upon information in this paper is at the sole discretion of the reader.
In the EU issued by BlackRock Investment Management (UK) Limited (authorised and regulated by the Financial Conduct Authority). Registered office: 12 Throgmorton Avenue, London, EC2N 2DL. Registered in England No. 2020394. Tel: 020 7743 3000. For your protection, telephone calls are usually recorded. BlackRock is a trading name of BlackRock Investment Management (UK) Limited. Issued in Australia by BlackRock Investment Management (Australia) Limited ABN 13 006 165 975 AFSL 230 523 (BIMAL). This document contains general information only and is not personal advice. This document has been prepared without taking into account any person’s objectives, financial situation or needs. Before making any investment decision based on this document, a person should assess whether this document is appropriate in regard to the person’s objectives, financial situation and needs. A person should consult his or her financial, tax, legal, accounting or other professional advisor about the points raised in this document. This document is not intended for distribution to, or use by any person or entity in any jurisdiction or country where such distribution or use would be contrary to local law or regulation. BIMAL is the issuer of financial products and acts as an investment manager in Australia. BIMAL is a part of the global BlackRock Group which comprises of financial product issuers and investment managers around the world. This document has not been prepared specifically for Australian investors. It may contain references to dollar amounts which are not Australian dollars. It may contain financial information which is not prepared in accordance with Australian law or practices. In Singapore, this is issued by BlackRock (Singapore) Limited (Co. registration no. 200010143N). In Hong Kong, this document is issued by BlackRock Asset Management North Asia Limited 貝萊德資產管理北亞有限公司 and has not been reviewed by the Securities and Futures Commission of Hong Kong. In South Korea this material is intended for permitted clients only including Financial Intermediaries. Not approved for distribution in Taiwan or Japan. In Canada, this material is intended for permitted clients only. In Latin America this piece is intended for use with Institutional and Professional Investors only. This material is solely for educational purposes and does not constitute investment advice, or an offer or a solicitation to sell or a solicitation of an offer to buy any shares of any funds (nor shall any such shares be offered or sold to any person) in any jurisdiction within Latin America in which such an offer, solicitation, purchase or sale would be unlawful under the securities laws of that jurisdiction. If any funds are mentioned or inferred to in this material, it is possible that some or all of the funds have not been registered with the securities regulator of Brazil, Chile, Colombia, Mexico, Peru or any other securities regulator in any Latin American country, and thus, might not be publicly offered within any such country. The securities regulators of such countries have not confirmed the accuracy of any information contained herein.
The information provided here is neither tax nor legal advice. Investors should speak to their tax professional for specific information regarding their tax situation. Investment involves risk. The two main risks related to fixed income investing are interest rate risk and credit risk. Typically, when interest rates rise, there is a corresponding decline in the market value of bonds. Credit risk refers to the possibility that the issuer of the bond will not be able to make principal and interest payments. International investing involves risks, including risks related to foreign currency, limited liquidity, less government regulation, and the possibility of substantial volatility due to adverse political, economic or other developments. These risks are often heightened for investments in emerging/developing markets or smaller capital markets. Any investment strategies mentioned may not be suitable for all investors. Investments in non-investment-grade debt securities (“high yield” bonds) may be subject to greater market fluctuations and risk of default or loss of income and principal than securities in higher rating categories.
The foregoing is for informational purposes only and is not an offer to buy or sell, or a solicitation of an offer to buy or sell an interest in any alternative products or any other security or instrument or to participate in any trading strategy. Any offering of interests in an alternative product may only be made through a confidential private placement memorandum, which will more fully describe the alternative product, including investment strategies and risk factors. Prospective investors should not rely on this material in making any investment decisions.
* AUM as of 9/30/14. † Source: Pensions & Investments as of 12/31/13.
©2014 BlackRock, Inc. All Rights Reserved. BLACKROCK, is a registered trademark of BlackRock, Inc. All other trademarks are those of their respective owners.
Lit. No. BII-OUTLOOK-2015 2689A-BII-1214 / BII-0027