bilenko i. a.¹, tavastsherna k. s.²
TRANSCRIPT
1
FORMATION AND EVOLUTION OF CORONAL HOLES DURING THE RISING PHASE OF
CYCLE 23
Bilenko I. A.¹, Tavastsherna K. S.²
1Moscow State University, Sternberg Astronomical Institute, Moscow, Russia,
e-mail: [email protected]
2Central Astronomical Observatory at Pulkovo of RAS, St. Petersburg, Russia
Regularities of formation of coronal holes (CH) at the rising phase of cycle 23 are investigated. The
period from 01.01.1997 to 01.03.2000 (Carrington rotations (CRs) 1918-2059) is considered in de-
tail. The evolution of the global magnetic field (GMF) of the Sun from the zonal to the sectorial
structure is analyzed. It is shown that the zonal structure is quasi-stable. The sum of zonal harmon-
ics dominated up to CR 1941, although a stable four-sector structure of GMF was formed in 1932.
In CRs 1941-1950 the contribution of the zonal and sectorial components becomes approximately
equal and from CR 1950 the sectorial structure of GMF was dominated. Sectorial structure of GMF
undergoing sharp changes from four-sector, at the beginning of growth of the sectorial harmonics
(CR 1926), to the two-sector structure, then back to four-sector and then again to the two-sector
structure. CHs clearly trace all evolutionary changes in the GMF. The structure of the polarity of the
GMF uniquely determines the zones of photospheric magnetic fields where the CHs are formed.
1. INTRODUCTION
Coronal holes (CHs) are one of the most important factors determining the space weather and
affecting the geomagnetic activity. The origin of both high- and low-speed solar wind streams is
related to CHs (Nolte et al., 1976; Sheeley and Harvey, 1981; Temmer et al., 2007). CHs are ob-
served at different levels in the solar atmosphere. The corona images in the EUV and X-ray show
them as regions with reduced brightness and according to observations in the HeI 10830 Å chromo-
spheric line, they appear as enhanced brightness objects (Harvey and Sheeley, 1979; Kahler et al.,
1983).
In several studies it was found that CHs are located in the unipolar magnetic field regions
(Harvey et al., 1982; Timothy et al., 1975; Varsic et al. 1999), although the degree of unipolarity in
the different parts of photospheric magnetic fields associated with the CH region may be different
(Bilenko, 2005).
The dynamics of CHs is known to show 11-year and 22-year periodicity associated with the
solar activity cycles. There are polar and non-polar CHs. Their dynamics in the cycles of solar ac-
tivity is very different (Bilenko and Tavastsherna, 2016). Ikhsanov and Ivanov (1999) showed that
long-lived equatorial CHs have approximately the same differential rotation as sunspots, while
long-lived polar CHs have rigid rotation. In general, CHs well trace evolutionary changes in the
global magnetic field (GMF) (Insley et al., 1995; Sanchez-Ibarra and Barraza-Paredes, 1992; McIn-
tosh, 2003; Bilenko and Tavastsherna, 2016). Ivanov and Obridko (2014) noted that large-scale
magnetic fields play an important role in the organization of all solar activity. Bilenko and
Tavastsherna (2017) have found that the majority of CHs are formed during the periods of stable
structure of the GMF. As the rate of structural changes in GMF increases, the number of CHs and
the values of their parameters decrease. The correlation between area, extension in latitude and lon-
gitude, magnet-flux of CHs and intensity of the GMF is higher in the cycles with higher values of
the magnetic field and a more stable structure of the GMF (Bilenko and Tavastsherna, 2017).
Despite the great attention paid recently to the study of CHs, the regularities of their for-
mation, the processes that determine the dynamics of CHs in solar cycles, the relationship of CHs
with other phenomena of solar activity are still not clear. Therefore, the study of the regularities of
formation of CHs and their evolutionary changes in the solar cycles is important for understanding
the processes occurring in the Sun, and for the space weather and geomagnetic activity forecast.
The purpose of this work is a detailed consideration of the formation and dynamics of CHs at
2
the rising phase of cycle 23, as it is at the growth phase of solar activity is a sharp change in the
parameters of all processes in the Sun, which has a direct impact on the interplanetary medium and
the Earth's magnetosphere.
2. DATA
The period from 01.01 1997 to 01.03.2000, which corresponds to Carrington rotations (CRs)
1918-2059 is investigated. Data from the Kitt Peak observatory were used to compare the CHs with
photospheric magnetic fields. The CH boundaries obtained from daily observations in the HeI
10830 Å line were superimposed on the data of daily observations of the photospheric magnetic
fields of the full disk of the Sun in the line FeI λ=8688 Å, and the synoptic data of the CH locations
were superimposed on synoptic maps of magnetic fields.
In the study of the dependences of CH dynamics on GMF dynamics, the synoptic magnetic
field maps calculated in a potential approximation on the source surface (2.5 Rs) of the WSO (Wil-
cox Solar Observatory) (Altschuler and Newkirk, 1969; Altschuler et al. 1975; Hoeksema and
Scherrer, 1986; Schatten et al., 1969) were used. The data of harmonic coefficients of the large-
scale magnetic field decomposition on the spherical components of the WSO were also used.
Data from the SOHO/EIT space observatory in the FeXII 195 Å line were used to illustrate
the location of CHs in the corona.
3. EVOLUTIONARY CHANGES OF THE GLOBAL MAGNETIC FIELD DURING THE RIS-
ING PHASE OF CYCLE 23
The dynamics of the solar GMF is determined by the evolutionary changes in the large-scale
magnetic fields of the Sun, which also govern the interplanetary magnetic field, in the behavior of
the low-frequency components of the spherical decomposition of the photospheric magnetic fields
of the Sun (Berdichevskaya, 1987), in the change of the sign of the magnetic field at the poles in the
maxima of solar activity (Harvey and Recely, 2002; Bilenko, 2002). Figure 1a shows the changes in
the magnetic fields of positive and negative polarity and the sum of their module obtained from the
longitudinal distribution diagram of the magnetic fields of the Sun on the source surface (2.5 Rs),
calculated in the potential approximation for each CR for the period under consideration (Bilenko,
2014; Bilenko and Tavastsherna, 2016). The thin lines correspond to the data for each CR, and the
thick lines correspond to that averaged for 7 CRs.
The solar magnetic field can be described as a function of latitude and longitude (r, θ, φ) (Alt-
schuler and Newkirk, 1969; Chapman and Bartels, 1940):
where: – are the associated Legendre polynomials, and $N$ is the number of harmon-
ics. The coefficients: are calculated by fitting with the least squares method of the observed
radial component of photospheric magnetic fields in a potential approximation. On the basis of the
coefficients it is possible to obtain the power spectrum of various harmonic components
from the spherical harmonic decomposition of the global magnetic field of the Sun (Altschuler et
al., 1977; Levine, 1977; Stix, 1977):
The transition from the zonal structure of the distribution of magnetic fields to the sectorial in
the rising phase and the inverse transformation from the sectorial structure of the distribution of
magnetic fields to the zonal one in the late declining phase of the of solar activity is a manifestation
of the cyclic evolution of GMF. This topological change of magnetic fields is essential, because

3
Figure 1. (а) Changes in the magnetic fields of positive- and negative-polarity magnetic fields and
the sum of their modules on the source surface (2.5 Rs), calculated in the potential approximation;
(b) The sum of zonal (dashed line) and the sum of sectorial harmonics (solid line); (c) The ratio of
the sum of the sectorial to zonal harmonics; (d) the axisymmetric components of the dipole (dashed
line) and equatorial dipole (solid line); (e) Axisymmetric and antisymmetric relative to the equator
harmonic spectrum; (f) Axisymmetric and symmetric with respect to the equator harmonics; (g)
Changes in the polar angle of the dipole component. The thin lines correspond to the data for each
CR, and thick lines correspond to the average for 7 CRs.
during this period the general level of solar activity, as well as the parameters of all solar activity
phenomena, changes dramatically. Figure 1b shows the changes in the sum of the zonal (dashed
line) and the sum of the sectorial harmonics (solid line). The ratio of their values is shown in Figure
1c. Changes in the axisymmetric dipole component (dashed line) and the equatorial dipole (solid
line) are shown in Figure 1d. The axisymmetric and antisymmetric relative to the equator harmonics
spectrum is shown in Figure 1e, and axisymmetric and symmetric relative to the equator harmonic
spectrum is shown in Figure 1f. The evolution of the polar angle of the dipole component is shown
4
in Figure 1g. From Figure 1 it follows that during the rising phase of the cycle 23 with the growth
of the magnetic field the contribution of sectorial GMF structures increased, and zonal decreased.
The increase in the sectorial components began from about CR 1926, but prior to CR 1940 a zonal
structure of the GMF was dominated (Figure 1c). In 1941, the level of the sum of zonal and sectori-
al harmonics became equal in magnitude, and, since 1950, the sectorial structure of GMF were
dominated. The axisymmetric dipole component (dashed line) gradually decreased throughout the
rising phase of cycle 23, and the component of the equatorial dipole (solid line) began to grow
slowly from CR 1927, approximately simultaneously with the growth of the sectorial component
and the growth of the polar angle of the dipole component, and its growth increased sharply from
CR 1941, i.e. from the moment when the contribution of sectorial and zone harmonics became
equal. The contribution of the axisymmetric and antisymmetric relative to the equator harmonics
(Figure 1e) decreased rapidly from CR 1948, and axisymmetric and symmetric relative to the equa-
tor harmonic increased (Figure 1f), reaching respectively the maximum and minimum in CR 1955.
Then, the level of axisymmetric and antisymmetric harmonics with respect to the equator began to
grow, and axisymmetric and symmetrical relative to the equator harmonics declined. The polar an-
gle of the dipole component underwent sharp fluctuations during CRs 1949-1959.
4. EVOLUTIONARY CHANGES OF CHs DURING THE RISING PHASE OF CYCLE 23
CHs are known to be good tracers of cyclic variations of solar GMF (Ikhsanov, Ivanov, 1999;
Mogilevsky, Obridko, Shilova, 1997; Obridko, Shelting, 1989; Bilenko, 2002; Bilenko and
Tavastsherna, 2016; Bilenko, Tavastsherna, 2017). During the solar activity minimum when the
zonal structure of the GMF was dominated, the CHs followed GMF structure. Figure 2 shows the
examples of the structure of GMF, as well as the distribution of photospheric magnetic fields and
CHs according to daily data during the domination of the zonal structure. Figures 1a5, b5, c5, d5
demonstrate distribution of GMF calculated in the potential approximation on the source surface
(2.5 Rs) for CRs 1919, 1922, 1924, and 1929. The images of the full disk of the Sun in the line 195
Å according to SOHO/EIT (a1, A2, b1, b2, c1, c2, d1, d2) and combined images of daily data of
photospheric magnetic fields and CHs in the line HeI 10830 Å from the Kitt Peak observatory (a3,
a4, b3, b4, c3, c4, d3, d4) for different longitudinal intervals are shown above. The arrows on the
magnetic field maps indicate the dates of the daily CH images for the left and right images respec-
tively. It is seen that during the zonal structure domination the large CHs are observed at the poles.
Often they have large extensions to low latitudes. Sometimes these extensions are disconnected
from the polar CHs and form separate CHs in the same hemisphere in the regions of photospheric
magnetic fields of the same polarity as the magnetic fields of the corresponding pole of the Sun. It
is known that almost all high-latitude CHs are genetically related to the corresponding polar CHs
(Bohlin, 1977). At low latitudes, separate small short-lived CHs are formed in the regions of mag-
netic fields with the polarity of the polarity of the magnetic field at the corresponding pole. The
zonal structure of GMF and the zonal distribution of CHs, despite short-term disturbances, in gen-
eral, remained stable during its dominance in the cycle minimum up to CR 1941. Since the begin-
ning of the growth of sectorial harmonics (CR 1926), short-term disturbances of the neutral magnet-
ic field line on the source surface have been observed.
With the growth of activity and the growth of sectorial harmonics of GMF (CR 1941) the dis-
tribution of CHs was also changed. Dynamics of the latitudinal distribution of non-polar CHs traced
changes in the structure of the GMF from the zonal to the sectorial. The CHs of one polarity occu-
pied the regions extended in latitude and longitude (Bilenko, 2002; Bilenko and Tavastsherna,
2016). Figure 3 shows some examples of different GMF topologies on the source surface at differ-
ent states of the sectorial structure for CRs 1943, 1948, 1951, and 1958 (Figure 3, a5, b5, c5, d5)
and daily CH images in EUV 195 Å (a1, a2, b1, b2, c1, c2, d1, d2) and line HeI 10830 Å, combined
with photospheric magnetic fields (a3, a4, b3, b4, c3, c4, d3, d4). It is seen that the polar CHs de-
creasd sharply. They disappeared to the maximum of the cycle and reappeared after the change of
the sign of the GMF. Non-polar CHs, corresponding to the photospheric magnetic fields of one po

5
Figure 2. Examples of zonal structure of GMF and distribution of daily photospheric magnetic
fields and CHs. GMF calculated in potential approximation on the source surface (2.5 Rs) for CRs
1919, 1922, 1924, and 1929 (a5, b5, c5, d5), images of the full disk of the Sun in the line 195 Å ac-
cording to SOHO/EIT (a1, A2, b1, b2, c1, c2, d1, d2) and combined images of daily data of photo-
spheric magnetic fields and CHs in the line HeI 10830 Å of the Kitt Peak observatory (a3, a4, b3,
b4, c3, c4, d3, d4). The arrows indicate the dates of the daily CH images for the left and right imag-
es, respectively.

6
Figure 3. Examples of the sectorial structure of GMF for CRs 1943, 1948. 1951, and 1958. The ar-
rangement of the images and their designations are identical to Figure 2.

7
larity, began to form extended latitudinal-longitudinal CHs, reflecting the distribution of GMF. The
location of the CHs in the regions of photospheric magnetic fields of positive or negative polarity
on the solar disk corresponded to the topology of the GMF in the corresponding CR. Thus, CHs
corresponding to positive photospheric magnetic fields are located in the zones of extended latitude
and longitude of GMF structures of the same polarity.
In contrast to the zonal structure, the sectorial structure of the GMF was not stable, but un-
derwent sharp changes, which were reflected in the latitudinal-longitudinal redistribution of posi-
tive- and negative-polarity magnetic fields. During the rising phase of cycle 23, the transformations
of the structure from four-sector to two-sector and inversely were observed. Figures 4-6 show the
synoptic maps of GMF, on the right, and combined maps of photospheric magnetic fields and CHs,
on the left, for successive CRs during the period of domination of the sectorial structure of GMF.
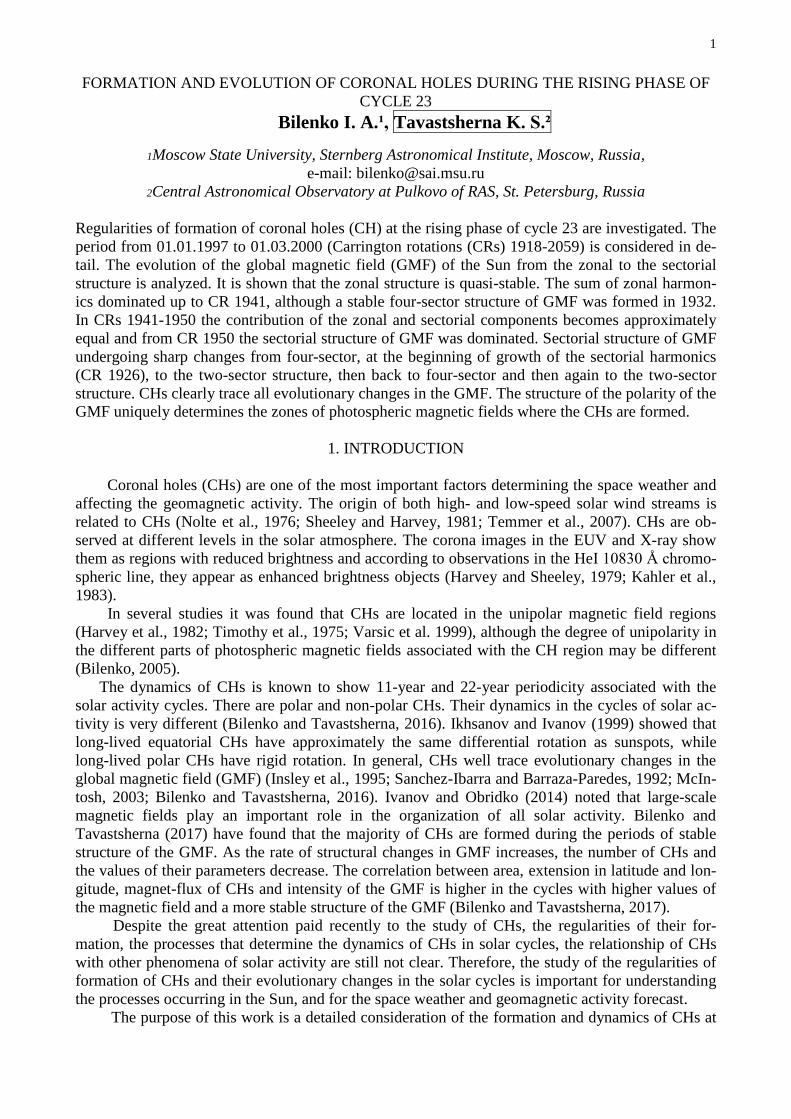
From CR 1932 a clear four-sector structure of the GMF was observed (Figure 4). At the longitudes
of about 60° to 180° and 330°-360° magnetic fields of negative-polarity, and at the longitudes 0°-
60° and 180°-330° the positive-polarity magnetic fields were dominated. This structure of the GMF,
undergoing minor changes, remained approximately the same in CR 1933. In CRs 1934-1936 the
zone of domination of positive-polarity magnetic fields sharply shifted from longitudes 180°-330°
to longitudes 120°-240°, but, in general, the topology of GMF remained the same. The location of
the CHs clearly corresponded to the distribution of GMF and followed its changes. Attention should
be paid to the formation of CHs in the region of positive GMF (~180° longitude and ~40° latitude,
southern hemisphere). The latitudinal redistribution of positive and negative magnetic fields began
from CR 1937. In 1937, the structure of GMF for a short time became two-sector. In CRs 1938-
1949 there were quite significant changes in the topology of the magnetic field, although the overall
structure of the GMF remained four-sector (Figure 4, 5). From CR 1940 to CR 1943 there was a
fairly stable four-sector structure with the dominance of negative-polarity magnetic fields at the
longitudes of about 45°-150° and 270°-340°, and positive-polarity magnetic fields at the longitudes
of about 0°-45°, 150°-270° and 340°-360°. CHs were also formed in the regions of negative-
polarity GMF only in the regions of negative photospheric magnetic fields, and in the regions of
positive-polarity GMF only in the regions of positive photospheric magnetic fields. In CR 1944 the
structure dramatically transformed into the two-sector. Figure 5 shows the period from CR 1943 to
CR 1951 when this reorganization of the GMF occurred. On the longitudes of 30°-180° the of nega-
tive-polarity and in the longitudes 180°-360° the positive-polarity magnetic fields were dominated.
During CRs 1945-1948, this structure became more pronounced, and from CR 1949 the shift of the
zone of domination of positive magnetic fields to the decreasing longitude continuing until CR
1952, when the distribution of magnetic fields changed to the opposite with respect to that existing
during the CRs 1944-1948. At the same time, the structure remained two-sector all the time. The
change in the distribution of CHs corresponding to positive- and negative-polarity photospheric
magnetic fields followed the dynamics of GMF. In CR 1947 at the longitudes 0°-140° negative-
polarity GMF were dominated and CHs formed in the regions of negative-polarity photospheric
magnetic fields, and at the longitudes 150°-360° positive-polarity photospheric magnetic fields
were dominated and CHs formed in the regions of positive photospheric magnetic fields. In CRs
1948-1950, the GMF was reorganized, which was accompanied by an increase in the contribution
of the axisymmetric and symmetric relative to equator components and a decrease in the axisym-
metric but antisymmetric components relative to the equator, and by CR 1951 the distribution of the
magnetic fields of the GMF changed to the opposite. CHs were also formed at longitudes 0°-150° in
the regions of positive-polarity photospheric magnetic fields to CR 1951, and at longitudes 160°-
360° on the regions of negative-polarity photospheric magnetic fields. In CR 1953, the structure of
GMF and the distribution of CHs again sharply changed and a stable four-sector structure was
formed, existing up to CR 1955 inclusive with the distribution of positive-polarity magnetic fields
at longitudes from about 80° to 180° and from 240° to 315°, and negative-polarity ones at longi-
tudes 0°-80°, 180°-240° and 315°-360° (Figure 6). Since CR 1956, the GMF structure has been
transformed into a two-sector one with the formation of separate closed structures of one polarity,
which is typical for the period of solar activity maximum, when a single neutral magnetic field line,
8
Figure 4. Dynamics of the sectorial structure of GMF, CRs 1932-1941. Left – distribution of GMF
on the source surface, right – CHs superimposed on the photospheric magnetic fields. Light tones
denote positive-polarity magnetic fields, while dark tones denote negative-polarity ones.
which is the base of the heliospheric current sheet, forms a complex topology within the two-sector
structure of the GMF. As example, this can be seen in CRs 1958, 1959 (Figures 3, 6). It should be
noted that during the periods of sharp reorganization of GMF the area of CHs decreases, or CHs are
not formed at all.
Comparison of changes in the zones of formation of CHs with the dynamics of local magnetic

9
Figure 5. Dynamics of the sectorial structure of GMF, CRs 1943-1951. The description of the im-
ages is identical to Figure 4.
fields of active regions (AOs) showed that for a number of CHs observed during this period, the
changes were not associated with the appearance or dissipation of specific AO. Thus, the appear-
ance of a number of high-latitude CHs in the regions of photospheric magnetic fields of opposite
polarity to the sign of the field of the corresponding pole, for example in CRs 1935, 1936, 1945,
1946, were not associated with AOs. With the growth of activity, the number of AOs increased
greatly and it is difficult to separate the evolutionary changes in CHs and AOs. It is important to
10
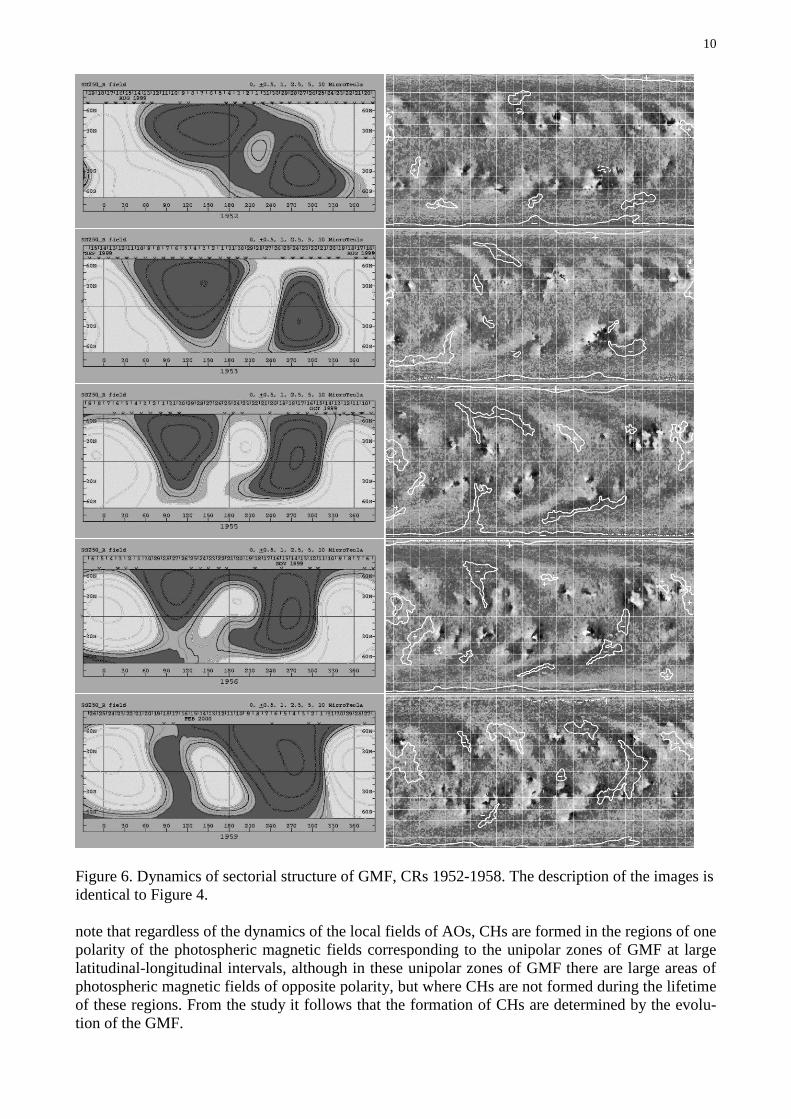
Figure 6. Dynamics of sectorial structure of GMF, CRs 1952-1958. The description of the images is
identical to Figure 4.
note that regardless of the dynamics of the local fields of AOs, CHs are formed in the regions of one
polarity of the photospheric magnetic fields corresponding to the unipolar zones of GMF at large
latitudinal-longitudinal intervals, although in these unipolar zones of GMF there are large areas of
photospheric magnetic fields of opposite polarity, but where CHs are not formed during the lifetime
of these regions. From the study it follows that the formation of CHs are determined by the evolu-
tion of the GMF.

11
5. SUMMARY
The paper considers the dependence of the dynamics of CHs on the evolutionary changes in
the structure of GMF at the rising phase of cycle 23 from 01.01 1997 to 01.03.2000 (CRs 1918-
2059).
It was shown that at the rising phase of solar activity in cycle 23 there was a transition from
the zonal to the sectorial structure of GMF. The zonal structure was quasi-stable. The sum of zonal
harmonics dominated up to CR 1941, although a stable four-sector structure of GMF was formed
from 1932. In CRs 1941-1950 the contribution of the zonal and sectoral component became approx-
imately equal, and from CR 1950 the sectorial structure of GMF was dominated.
Sectorial structure of GMF underwent sharp a change from four-sector in the early growth of
the sectorial harmonics to the two-sector, then back to four-sector and then again to the two-sector.
CHs unambiguously traced all evolutionary changes of GMF and its reorganizations from the zonal
structure to the sectorial and further topological changes in the sector structure of GMF. Longitude-
latitude distribution of CHs corresponded directly to the longitude-latitude distribution of the GMF.
While large areas of photospheric magnetic fields located near the CHs, that were in the regions of
photospheric magnetic fields with a polarity corresponding to the sign of the GMF, may have the
polarity opposite to the polarity of the GMF for this zone, the CHs were not formed on them.
During the reorganization of the structure of GMF, the area of CHs either decreased or they
were not formed at all.
Since the evolution of GMF and, accordingly, CHs, are cyclical, the obtained results may be
of interest for the purposes of the space weather and geomagnetic activity forecast.
ACKNOWLEDGEMENTS
Wilcox Solar Observatory data used in this study were obtained via the web site
http://wso.stanford.edu at 2018:03:11 01:13:34 PST courtesy of J.T. Hoeksema. The Wilcox Solar
Observatory is currently supported by NASA.
NSO/Kitt Peak data used here were produced cooperatively by NSF/NOAO, NASA/GSFC,
and NOAA/SELL.
SOHO/EIT data were used. SOHO is a project of international cooperation between ESA and
NASA.
REFERENCES
— Altschuler M.D., Newkirk G.Jr. Magnetic fields and the structure of the solar corona // Solar
Phys. V. 9. P. 131-149. 1969.
— Altschuler M.D., Trotter D.E., Newkirk G.Jr., Howard R. Tabulation of the harmonic coeffi-
cients of the solar magnetic fields // Solar Phys. V. 41. P. 225-226. 1975.
— Altschuler M.D., Levine R.H., Stix M., Harvey J. High resolution mapping of the magnetic field
of the solar corona // Solar Phys. V. 51. P. 345-375. 1977.
— Berdichevskaya, V.S. The global magnetic field of the Sun and solar activity cycle // Astron. Zh.
V. 64. P. 835-839. 1987.
— Bilenko I.A. Coronal holes and the solar polar field reversal // Astron. Astrophys. V. 396. P.
657-666. 2002.
— Bilenko I.A. Identification of the sources of the high-speed and low-speed streams of the solar
wind // IJGA V. 6. GI1009. P. 1-10. 2005.
— Bilenko I.A. Influence of the solar global magnetic-field structure evolution on CMEs // Solar
Phys. V. 289. P. 4209-4237. 2014.
— Bilenko I.A., Tavastsherna K.S. Coronal hole and solar global magnetic field evolution in 1976-
2012 // Solar Phys. V. 291. P. 2329-2352. 2016.
— Bilenko I.A., Tavastsherna K.S. Coronal holes as tracers of the Sun’s global magnetic field
in cycles 21–23 of solar activity // Geomagn. Aeronomy. V. 57. P. 803-813. 2017.

12
— Bohlin J.D. Extreme-ultraviolet observations of coronal holes. I - Locations, sizes and evolution
of coronal holes, June 1973-January 1974 // Solar Phys. V. 51. P. 377-398. 1977.
— Chapman S., Bartels J. Geomagnetism. V.2. Oxford. 1050 p. 1940.
— Harvey J.W., Sheeley N.R., Jr. Coronal holes and solar magnetic fields // Space Sci. Rev. V. 23.
P. 139-158. 1979.
— Harvey K.L., Sheeley N.R., Jr., Harvey J.W. Magnetic measurements of coronal holes during
1975-1980 // Solar Phys. V. 79. P. 149-160. 1982.
— Harvey K.L., Recely F. Polar coronal holes during cycles 22 and 23 // Solar Phys. V. 211. P. 31-
52. 2002.
— Hoeksema J.T., Scherrer P.H. An atlas of photospheric magnetic field observations and
computed coronal magnetic fields: 1976–1985 // Solar Phys. V. 105. P. 205-211. 1986.
— Ikhsanov R.N., Ivanov V.G. Properties of space and time distribution of solar coronal holes //
Solar Phys. V. 188. P. 245-258. 1999.
— Insley J.W., Moore V., Harrison R.A. The differential rotation of the corona as indicated by cor-
onal holes // Solar Phys. V. 160. P. 1-18. 1995.
— Ivanov E.V., Obridko V.N. Role of the large-scale solar magnetic field structure in the global
organization of solar activity // Geomagn. Aeronomy. V. 54. P. 996-999. 2014.
— Kahler S.W., Davis J.M., Harvey J.W. Comparison of coronal holes observed in soft X-ray and
He I 10830 Å spectroheliograms // Solar Phys. V. 87. P. 47-56. 1983.
— Levine R.H. Evolution of photospheric magnetic field patterns during SKYLAB // Solar Phys.
V. 54. P. 327-341. 1977.
— McIntosh P.S. Patterns and dynamics of solar magnetic fields and HeI coronal holes in cycle 23
// International Solar Cycle Studies Symposium SP-535, ESA. P. 807-818. 2003.
— Mogilevsky E.I., Obridko V.N., Shilova N.S., Large-scale magnetic field structures and coronal
holes on the Sun // Solar Phys. V. 176. P. 107-121. 1997.
— Nolte J.T., Krieger A.S., Timothy A.F., Gold R.E., Roelof E.C., Vaiana G., Lazarus A.J., Sulli-
van J.D., McIntosh P.S. Coronal holes as sources of solar wind // Solar Phys. V. 46. P. 303-322.
1976.
— Obridko V.N., Shelting B.D Coronal holes as indicators of large-scale magnetic fields in the co-
rona // Solar Phys. V. 124. P. 73-80. 1989.
– Sanchez-Ibarra A., Barraza-Paredes M., Catalog of coronal holes, 1970-1991, Report UAG-102,
Boulde: World Data Center A for solar-terrestrial physics, National Geophysical Data Center,
1992.
— Schatten K.H., Wilcox J.M., Ness N.F. A model of interplanetary and coronal magnetic fields //
Solar Phys. V. 6. P. 442-455. 1969.
— Sheeley N.R., Harvey J.W. Coronal holes, solar wind streams, and geomagnetic disturbances
during 1978 and 1979 // Solar Phys. V. 70. P. 237-249. 1981.
— Stix M. Coronal holes and the large-scale solar magnetic field // Astron. Astrophys. V. 59. P. 73-
78. 1977.
— Temmer M., Vrsnak B., Veronig A.M. Periodic appearance of coronal holes and the related vari-
ation of solar wind parameters // Solar Phys. V. 241. P. 371-383. 2007.
— Timothy A.F., Krieger A.S., Vaiana G.S. The structure and evolution of coronal holes // Solar
Phys. V. 42. P. 135-156. 1975.
— Varsik J.R., Wilson P.R., Li Y. High-resolution studies of the solar polar magnetic fields // Solar
Phys. V. 184. P. 223-237. 1999.