bill miller, director - missouri office of administration · 2013-06-20 · as we move forward, ......
TRANSCRIPT

DIVISION OF PERSONNEL 2010 ANNUAL REPORT
1
Bill Miller, Director
S T A T E O F M I S S O U R I
O F F I C E O F A D M I N I S T R A T I O N
DIVISION OF PERSONNEL 2010 ANNUAL REPORT
2
Division of Personnel
FY2010 Annual Report
DIVISION OVERVIEW WORKFORCE ANALYSIS AND STATISTICS
EMPLOYEE DATA BY COUNTY PLANNING AND PROJECTIONS EVENTS AND ACHIEVEMENTS
PROFESSIONAL DEVELOPMENT
Bill Miller, Director Guy Krause, Deputy Director Manager, Pay, Leave and Reporting
Allan Forbis, Manager Center for Management and Professional Development
Doug Smentkowski, Manager Employee Services
Division of Personnel Staff Contributing to this Report:
Christy Klenklen Cathy Philbert Susan Nichols Lori Gilmore Denise Osborne
C o n t e n t s
Missouri State Government
The Division of Personnel
Overview
Distribution of Resources
Accomplishments
WeSave Employee Discount Program
The State Employee Planning and Appraisal Process
The State of Missouri’s Application Process
Applicant Characteristics
The State Workforce
Employee Data by County
Number of State Employees
Age
Ethnicity
Gender
Length of State Service
Classification and Pay Systems
Employee Pay Distribution
Executive Branch Turnover
Retirements
Labor Relations
Professional Development
Center for Management and Professional Development
Agency Training Reports
Employee Recognition Programs
The Division of Personnel’s Annual Report is
coordinated and created by the Division’s
Center for Management and Professional Development.
4
5
6
7
8
9
10
11
12
16
17
18
19
20
21
22
23
24
25
26
28
30
Division of Personnel Director Bill Miller speaking at the 2010 State Employee Recognition Day event at the State Capitol
Photo: Allan Forbis
Cover Photos: Luci Branyan, Missouri Division of Tourism

DIVISION OF PERSONNEL 2010 ANNUAL REPORT
3
Dear Colleagues,
It is a privilege to present the Division of Personnel’s 2010 Fiscal Year report.
Over the past year, virtually every state in the nation has been faced with unprecedented economic challenges. Budget reductions and belt tightening have added to an already long list of issues for all state agencies. Despite these challenges, Missouri has been able to maintain a strong workforce, while continuing to flourish with fresh ideas, quality services and winning achievements.
It is likely, however, that in the coming year, Missouri state government, along with other public and private employers, will face continued challenges to improve services with fewer human and financial resources.
While this report presents information about some of the Division of Personnel’s accomplishments, it also provides a “snapshot” of workforce demographics, pay data, professional development, various statistics and more. Our intent is to provide useful fact-based data from both a statewide and agency perspective, for informational purposes as well as future human resource planning and decision making.
It is our hope that this report will enable agencies, legislators and constituents to make proactive decisions that are in the best interest of our continued commitment to excellence in all aspects of service delivery in state government.
As we reflect on the achievements of FY10 and the challenges that await us in 2011, I would like to thank each Division of Personnel staff member for their hard work while doing even more with fewer resources. As we move forward, we welcome your observations about how well we have accomplished our work and how we can serve you in the future. Sincerely,
Bill Miller, Director
Jeremiah W. (Jay) Nixon Governor
Kelvin L. Simmons Commissioner
State of Missouri OFFICE OF ADMINISTRATION
Division of Personnel 301 West High Street, 430 Truman Building
P.O. Box 388 Jefferson City, Missouri 65102
INTERNET: http://www.oa.mo.gov/pers
E-MAIL: [email protected]
Bill Miller Director
(573) 751-4162 FAX (573) 751-8641

DIVISION OF PERSONNEL 2010 ANNUAL REPORT
4
Missouri Citizens
MISSOURI STATE GOVERNMENT
Approximately 40,000 state employees in six Executive Branch agencies and selected sections of three other agencies comprise the Merit System administered by the Division of Personnel.
Totally Merit & Uniform Classification and Pay (UCP)*
Office of Administration
Department of Corrections
Department of Health & Senior Services
Department of Mental Health
Department of Natural Resources
Department of Social Services
Partially Merit & UCP
Department of Economic Development
Department of Labor and Industrial Relations
Department of Public Safety
Non-Merit Executive Branch Agencies
Department of Agriculture (UCP)
Department of Conservation
Department of Elementary and Secondary Education (to be partially UCP)
Department of Higher Education (UCP)
Department of Insurance (UCP)
Department of Revenue (UCP)
Department of Transportation
*UCP agencies are further defined on page 23
Employees in Executive Branch agencies equal approximately 91% of the total number of state workers.
The Division of Personnel within the Office of Administration provides consultation and expertise in personnel management to all Executive Branch agencies.
Missouri Revised Statutes Chapter 36 State Personnel Law (36.030) Merit and (36.031) Uniform Classification and Pay Plan (UCP)
To further define the structure of Executive Branch agencies and the scope of the Division of Personnel’s work, the State Personnel Law identifies the state agencies that are in the Merit System.
The Missouri Merit System is based on the principles of merit and fitness derived from competitive examinations for employment and advancement, objective and consistent human resource management policies and procedures and the ability of employees to appeal disciplinary actions. Chapter 36 (36.030) provides that the Division of Personnel will be charged with the implementation and administration of Merit System practices.
The Legislative Branch
The Senate has 34 members, elected for four-year terms.
The House of Representatives has 163 members, elected during
each general election for a two-year term.
The Judicial Branch
The Supreme Court, the state’s highest court holds statewide
jurisdiction;
The Court of Appeals, districts established by the General
Assembly; and
Circuit Courts have original jurisdiction over all cases and
matters, civil and criminal.
The Executive Branch
Governor
Lieutenant Governor
Secretary of State
State Auditor
State Treasurer
Attorney General
And…
16 Executive Branch Agencies
4

DIVISION OF PERSONNEL 2010 ANNUAL REPORT
5
Division of Personnel Overview
Purchase & Supply
Fiscal & Personnel Transactions
Budget Preparation
Testing Operations
Administrative Support
Employee Services Section
Evaluates New and Existing Positions within the UCP System
Administers the Merit System Employment Application Process
Develops and Maintains Job Classifications within the UCP System
Develops and Updates Merit System Examinations
Administers Statewide Performance Appraisal System (PERforM)
Pay, Leave & Reporting Section
Maintains Registers of Qualified Applicants for Merit System Agencies
Audits/Approves Transactions from UCP Agencies through SAM II HR
Administers Rules on Pay, Leave, Hours of Work, Overtime, Certification, Removal from Registers, Transfers, Political Activity, Conflicting Employment and Layoff
Maintains the UCP System Pay Plan
Maintains HR Related Tables in the SAM II HR/Payroll System, MAIRS and EASe
Develops and Executes Statewide Labor Relations Policies, Objectives and Strategies
DIRECTOR
Functional Organization Chart
HUMAN RESOURCES
MANAGER
23 FTE
HUMAN RESOURCES
MANAGER
15 FTE
FISCAL & ADM. MANAGER
4.97 FTE
Center for Management and Professional Development
Develops and/or Provides Supervisory, Managerial and Executive Development Training Programs for State Agencies, City and County Government and Private Sector Businesses
Administers Statewide Recognition Programs that include State Employee of the Month, Governor’s Award for Quality and Productivity, State Employee Recognition Week and Day
Administers the State Employee Suggestion System
Coordinates the WeSave Employee Discount Program
HUMAN RESOURCES
MANAGER
5 FTE

DIVISION OF PERSONNEL 2010 ANNUAL REPORT
6
Personal Services Budget by Function
$284,259
$159,360
$1,000,692
$162,969
$300,593
$202,349
Distribution of Resources
FTE by Function
Administrative Support and Testing Operations
Audit/Approval of Transactions
Employee Services – Selection & Classification, MAIRS and EASe Administration
Maintenance of Registers
SAM II HR/Payroll Reporting, Pay, Leave, Reporting and Labor Relations
Center for Management and Professional Development
Administrative Support &
Testing Operations
Audit/Approval of Transactions
Employee Services -
Selection & Classification,
MAIRS and EASe
Administration
Maintenance of Registers
SAMII HR/Payroll
Reporting, Pay, Leave,
Reporting & Labor Relations
Center for Management
and Professional Development
6
5
6 6.97
5
24
The Division of Personnel believes in the value and effectiveness of the programs and services each of our sections provides in relation to the monetary cost of delivering the product or service.

DIVISION OF PERSONNEL 2010 ANNUAL REPORT
7
What you get by
achieving your
goals is not as
important as what
you become by
achieving your
goals. Zig Ziglar
7
Division of Personnel 2010 Annual Report
Accomplishments A sampling of the diverse breadth and scope of services provided by dedicated Division of Personnel staff in FY10.
Processed 46,238 Employment Status Maintenance
Transactions (ESMTs) to ensure employees were paid accurately and on time
Issued 3,880 Certificates of Eligibles (excludes trial certificates) providing 158,083 names of applicants to agencies on a timely basis
Provided technical support and analysis to assist the Personnel Advisory Board in finalizing their FY2011 Pay Plan Recommendation
Maintained all labor agreements to ensure the state can effectively manage its operations and workforce while upholding the legal rights of employees and the labor organizations who represent them. This included conducting labor contract negotiations for the following bargaining units: AFSCME/Direct Care and Craft & Maintenance Bargaining Units; SEIU/Probation and Parole Assistants; CWA/DSS and DHSS (Division of Senior and Disability Services & Division of Regulation and Licensure, Section for Long-Term Care). Negotiations were also conducted for the newly certified SEIU/Probation and Parole Assistants Bargaining Unit.
Maintained electronic and paper merit application processes allowing 41,332 job applicants to apply for 153,879 job classifications
Reviewed and allocated 608 new positions for merit agencies
Processed 17,905 additions to merit registers via written, or written and E&E (education and experience) merit exams
Added 74,263 names to merit registers via exams with a 100% E&E component
Offered 123 professional development workshops and webinars attended by 1,414 participants
Published quarterly ―Solutions‖ e-magazines disseminating practical information to help managers develop the best in themselves and in those who work with them
Collected and processed 160 suggestions through the Missouri Relies on Everyone (MoRE), state employee suggestion program
Coordinated and administered State Employee of the Month ceremonies for each winning state employee; State Employee Recognition Week activities, including a ceremony at the State Capitol recognizing employee contributions; and the Governor’s Award for Quality and Productivity recognizing the accomplishments of state employee work teams

DIVISION OF PERSONNEL 2010 ANNUAL REPORT
8
During FY10, in an effort to find alternative ways to help state employees maximize their household budgets in difficult economic times, the Office of Administration with assistance from the Division of Personnel entered into a cooperative agreement with WeSave.com to provide a new state employee discount program.
WeSave is a relatively new for-profit marketing company that promotes loyalty benefits for public employees in the United States. Currently in its fifth year of operation, WeSave serves the states of Georgia, Louisiana, Missouri, Nebraska, North Carolina, South Carolina and West Virginia.
An additional feature unique to Missouri’s program is the added value of a one percent cash back donation from WeSave to the Missouri State Employees Charitable Campaign based upon total employee online shopping purchases.
WeSave is available to state employees who voluntarily elect to activate their membership online using a personal or home email address. There is no cost to state government, or state employees to participate in the program. State employees who activate their membership have access to cost saving opportunities that include:
A customized online portal to access savings, coupons, giveaways and promotions.
Discounts and special offers from national, regional and local Missouri merchants.
Online shopping with cash back on every purchase. An online user account to manage shopping
preferences, track purchases, and redeem cash back rewards
State employees can also nominate merchants they would like to see included in the program by using WeSave’s online ―Nominate a Merchant‖ form. WeSave staff contact these merchants to solicit their participation and also work with the Missouri Chamber of Commerce to identify and include other merchants. These combined efforts serve to help Missouri merchants and strengthen the economy of local Missouri communities.
The intent of WeSave Missouri is to help employees save money on goods and services they primarily purchase online. As employees save money on items they need or want, they may have more money to purchase other household items, or add to their savings accounts, education or
retirement funds.
The WeSave program serves as evidence to state employees that state leaders are working on their behalf; and is an added benefit to work in Missouri state government. Following a pre-registration phase, the new WeSave program was activated on August 16, 2010 in conjunction with State Employee Recognition Week. At the beginning of FY11, nearly 20,000 state employees had registered for the WeSave Missouri program.
8

DIVISION OF PERSONNEL 2010 ANNUAL REPORT
9
Using standardized performance components and the electronic storage of ratings – agency leaders can easily identify employees who are performing at established levels of successful performance and above, and implement strategies to assist employees who need help in one or more components of their job.
To assist state agencies in their implementation of PERforM, the DOP continues to present training programs on PERforM to new supervisors and managers. These programs focus on system navigation, as well as the ―human element‖ of the appraisal cycle – the one-on-one process of establishing performance objectives, observing and providing feedback, and objectively determining and communicating performance ratings.
The DOP provides additional information and training resources for PERforM on the PERforM website at www.perform.mo.gov. The website contains a Contact Us link which allows users/agency representatives to ask DOP staff questions about the system, and seek clarification on PERforM Guidelines. During FY11, the DOP will convene a review team comprised of agency users, DOP staff and IT professionals to re-evaluate PERforM, and determine what enhancements can further improve the functionality and usage of the system for all PERforM users.
Creating performance objectives for employees and appraising employees uniformly across state government can be challenging. Left unresolved, determining proper formats, what critical work areas to include on planning documents and being able to easily retrieve and update employee performance data can interfere with critical supervisor/employee communication.
The Productivity, Excellence and Results for Missouri (PERforM) employee performance planning and appraisal system championed by the Division of Personnel (DOP) provides raters (supervisors) and reviewers (second-level supervisors) the ability to easily complete the appraisal process on-line.
PERforM creates a standardized “across-the-board” approach for evaluating the performance of state employees, enabling consistent reporting and a shared understanding of the appraisal process – not just for supervisors (raters) but just as importantly for state employees who need to clearly understand what they must achieve. It establishes a process for accountability in the execution of tasks that entails goal setting, planning, and ongoing feedback.
Productivity, Excellence and Results for Missouri (PERforM) Employee Performance
Planning and Appraisal System
PERforM Components
All state employees, regardless of job classification, are rated on 5 specific job components.
1. Knowledge of Work 2. Quality of Work 3. Situational Responsiveness 4. Initiative 5. Dependability
Supervisors/Managers:
In addition to the 5 components listed above, individuals designated as supervisors by their agency that have performance appraisal responsibility for one or more employees are evaluated on 3 additional components:
1. Performance Planning and Documentation
2. Leadership 3. Management Skills
FY10 PERforM Statistics
Raters and Reviewers (Combined) 6,805
Probationary Appraisals 2,888
Special Appraisals 1,317
Annual Appraisals 32,189
*Breakdown of Employee Annual Appraisal Ratings per Performance Category:
Needs Improvement – 316 (0.9%)
Successful – 24,278 (75.4%)
Outstanding – 7,088 (22.0%)
Exceptional – 507 (1.6%) *Employee number and percentages based on 32,189 completed Annual Appraisals

DIVISION OF PERSONNEL 2010 ANNUAL REPORT
10
U P D A T E:
The State of Missouri’s
Application Process
EASe
96% of all applicants (39,846) applied for merit jobs through EASe
27,542 applicants registered with EASe in FY10 bringing the total number of registered users to 177,624
Many questions about EASe are covered in the FAQs about the system. Please visit the DOP’s website for more information, including questions and answers about EASe, at www.ease.mo.gov.
During FY10, using the State of Missouri’s Electronic Application System (EASe), qualified applicants were added to merit registers immediately upon submitting their application and related information. State agencies were provided with applicants more quickly; and agency personnel staff were able to view applications at their computers and correspond with applicants using e-mail. While the Division of Personnel (DOP) continues to administer a small number of written merit exams, scheduling and exam results are sent to applicants electronically to significantly reduce the cost of postage.
How does EASe work?
Applying through EASe is very similar to applying with a paper application – but faster – with all of the required applicant information securely maintained. To use EASe, applicants must have an email address and access to a personal computer. To get started, the applicant provides information about their work history, education, licenses and certificates and veterans preference. Then the applicant selects the job class for which they are interested from postings on the DOP web site and answers a series of questions designed to determine their eligibility for the job class. If qualified, and depending on the job class applied for, the applicant is presented with more questions from which a rating score of their relevant education and work experience is determined.
When applying for a job class requiring only a rating of education and experience, EASe applicants are added to registers almost immediately upon completing the electronic application.
As with any system, as questions and comments are submitted, DOP staff respond to each one individually and continue to make system enhancements. In FY11, the DOP will establish an EASe review team comprised of DOP staff and representatives from various agencies to examine the current application process – and make recommendations to further streamline and improve the system.
FY10 Total Applicants
FY10 EASe Applicants
FY10 Total Applications for Job Classes
FY10 Job Classes Applied for Through EASe
FY10 Job Classes Applied for Using Paper Application
Applicants Registered Through EASe in FY10
Total Number of Applicants Registered Through EASe
Total Number of UCP Job Classes
Total Classes Converted to EASe in FY10
Total Number of Classes Converted to EASe
41,332
39,846
153,897
149,160
4,719
27,542
177,624
706
10
443
General Application Data

DIVISION OF PERSONNEL 2010 ANNUAL REPORT
11
Applicant Characteristic Survey Results
Ethnicity of Applicants Number of Applicants by Education Level
Number of Applicants by Gender Number of Applicants by Age Range
6,683(16%)
7,798(19%)
10,815(26%) 8,456
(20%)5,468(13%) 944
(2%)
0
2,000
4,000
6,000
8,000
10,000
12,000
16-24 25-29 30-39 40-49 50-59 60 or more years
Applican
ts
24,547(59%)
15,946(39%)
0
5,000
10,000
15,000
20,000
25,000
30,000
Female MaleApplican
ts
609(1%)
9,907(24%)
13,981(34%) 11,924
(29%)
4,138(10%)
0
2,000
4,000
6,000
8,000
10,000
12,000
14,000
16,000
Does not have HS
Diploma or GED
Has HS Diploma or
GED
Post HS training
including college courses
B.S., or B.S., or
comparable bachelor's
degree
Masters degree or
higher
Applican
ts
Black7,993(19%)
Other1,904(5%)
White30,368(73%)
As part of the electronic or paper application process, applicants have the option of submitting voluntary demographic data that in no way affects their application. However, the results of the data help to provide a demographic snapshot of job applicants.
19% African American
59% Female
45% Between the ages of 25 – 39
29% Possessed a Bachelor’s degree 73% White
33% Between the ages of 40 -59
Data based on 41,332 FY10 applicants who submitted the optional survey:
Age Range – 40,164 (1,168 applicants did not indicate their age) Gender – 40,493 (839 applicants did not indicate their gender) Ethnicity – 40,265 (1,067 applicants did not indicate their ethnicity) Education Level – 40,559 (773 applicants did not indicate their education level)

DIVISION OF PERSONNEL 2010 ANNUAL REPORT
12
Reside: Number of employees by county of residence as
listed in the SAM II HR Payroll System.
Work: Number of employees with work locations assigned to
this county as of June 30, 2010.
Applicants: Number of residents from this location who
applied for at least one job classification between July 1, 2009 and June 30, 2010.
Classes: Number of total job classes for which applicants
residing in each county applied. Applications are “active” for six months, during which time applicants can add classes to an application. This data includes those additions.
Register Additions: Number of residents who submitted an
application between July 1, 2009 and June 30, 2010. Register types include Reinstatement, Open, Promotional, Reemployment and Transfer.
Received Appointments: Number of residents who received an appointment to a Merit System position between July 1, 2009 and June 30, 2010.
Work
156
51
26
760
120
46
86
52
33
632
1,624
731
26
2,040
179
740
Legend:
Metropolitan Statistical Area (MSA): Counties included in an MSA are part of an urbanized area typically consisting of at least 50,000 persons. Based on 2008 population estimates, 73% of Missouri residents live in MSAs. Missouri has seven (7) MSAs comprised of 33 counties:
Columbia: Boone, Howard
Jefferson City: Callaway, Cole, Moniteau, Osage
Joplin: Jasper, Newton
Kansas City: Bates, Caldwell, Cass, Clay, Clinton, Jackson,
Lafayette, Platte, Ray
Springfield: Christian, Dallas, Greene, Polk, Webster
St. Joseph: Andrew, Buchanan, DeKalb
St. Louis: Franklin, Jefferson, Lincoln, St. Charles, St. Louis
County, Warren, Washington, St. Louis City
County data continued on the following pages…
County
Adair
Andrew
Atchison
Audrain
Barry
Barton
Bates
Benton
Bollinger
Boone
Buchanan
Butler
Caldwell
Callaway
Camden
Cape Girardeau
Metropolitan Statistical Area
NA
St. Joseph
NA
NA
NA
NA
Kansas City
NA
NA
Columbia
St. Joseph
NA
Kansas City
Jefferson City
NA
NA
Register Additions
285
198
39
665
172
65
68
181
139
4,165
2,166
781
235
3,070
579
1,249
Received Appointments
6
4
0
43
4
0
2
2
6
116
90
29
24
128
16
20
Classes
425
357
57
1,162
283
109
91
370
199
6,277
3,748
1,370
378
5,005
906
2,020
Applicants
124
115
15
382
86
28
44
83
54
1,552
1,014
361
122
1,249
243
520
Reside
186
298
53
653
163
167
125
127
105
2,034
1,191
514
278
2,779
268
711
Employee Data by County Employees, Applicants, Registers and Appointments
12

DIVISION OF PERSONNEL 2010 ANNUAL REPORT
13
Employee Data by County
Metropolitan Statistical Area
NA
NA
Kansas City
NA
NA
Springfield
NA
Kansas City
Kansas City
Jefferson City
NA
NA
NA
Springfield
NA
St. Joseph
NA
NA
NA
St. Louis
NA
NA
Springfield
NA
NA
NA
NA
NA
Columbia
NA
NA
Kansas City
Joplin
St. Louis
NA
Reside
153
93
275
152
96
410
42
643
400
7,116
362
212
55
108
244
338
193
102
241
581
170
104
1,329
136
142
167
56
78
133
365
235
2,609
548
878
471
Work
34
43
159
96
24
133
28
428
1,288
14,461
405
88
21
55
29
73
66
41
189
271
34
56
1,788
55
42
90
34
30
29
441
25
3,440
607
461
400
Applicants
93
37
278
59
52
354
9
274
323
2,616
272
145
22
48
148
133
126
80
174
632
184
63
1,231
125
70
90
23
35
101
187
120
3,361
421
927
315
Classes
357
89
976
217
164
1,322
23
863
1,107
11,865
1,001
423
59
155
489
392
424
313
584
1,890
632
224
4,867
425
226
324
79
91
265
775
387
11,946
1,565
3,156
1,094
Register Additions
215
46
569
135
93
830
18
548
649
7,723
559
224
43
98
295
252
235
175
323
1,126
402
122
3,206
243
140
182
55
50
176
463
255
7,119
1,044
1,869
682
Received Appointments
5
3
8
3
3
12
1
12
45
307
27
11
0
2
15
21
5
8
13
45
18
4
60
8
12
2
0
4
7
10
12
136
23
61
22
County
Carroll
Carter
Cass
Cedar
Chariton
Christian
Clark
Clay
Clinton
Cole
Cooper
Crawford
Dade
Dallas
Daviess
DeKalb
Dent
Douglas
Dunklin
Franklin
Gasconade
Gentry
Greene
Grundy
Harrison
Henry
Hickory
Holt
Howard
Howell
Iron
Jackson
Jasper
Jefferson
Johnson

DIVISION OF PERSONNEL 2010 ANNUAL REPORT
14
Employee Data by County
Metropolitan Statistical Area
NA
NA
Kansas City
NA
NA
St. Louis
NA
NA
NA
NA
NA
NA
NA
NA
NA
NA
Jefferson City
NA
NA
NA
NA
Joplin
NA
NA
Jefferson City
NA
NA
NA
NA
NA
NA
Kansas City
Springfield
NA
NA
Reside
36
200
612
362
51
251
275
433
52
369
304
295
381
26
640
227
732
153
217
284
176
250
259
65
948
57
115
107
329
502
473
215
157
270
38
Work
26
150
621
377
37
173
67
562
55
405
33
24
366
24
100
500
368
41
123
42
112
133
310
35
24
34
126
46
215
626
613
91
90
84
21
Applicants
14
169
233
177
32
232
147
297
134
202
120
194
37
24
333
168
362
78
152
183
120
94
159
42
282
24
68
79
260
383
274
72
78
285
13
Classes
71
800
759
559
114
799
468
1,164
405
755
474
635
107
58
1,279
543
1,498
210
504
640
451
328
581
200
1,030
63
272
380
935
1,480
792
285
268
1,013
46
Register Additions
44
450
476
331
64
509
276
641
247
412
284
391
64
36
835
259
926
147
296
382
261
210
333
120
688
39
133
244
529
895
509
177
179
632
27
Received Appointments
0
10
21
13
2
18
16
26
8
18
9
20
1
3
47
17
42
11
20
20
10
5
19
0
43
2
1
7
16
25
38
6
5
23
0
County
Knox
Laclede
Lafayette
Lawrence
Lewis
Lincoln
Linn
Livingston
McDonald
Macon
Madison
Maries
Marion
Mercer
Miller
Mississippi
Moniteau
Monroe
Montgomery
Morgan
New Madrid
Newton
Nodaway
Oregon
Osage
Ozark
Pemiscot
Perry
Pettis
Phelps
Pike
Platte
Polk
Pulaski
Putnam

DIVISION OF PERSONNEL 2010 ANNUAL REPORT
15
Employee Data by County
Metropolitan Statistical Area
NA
NA
Kansas City
NA
NA
St. Louis
NA
NA
NA
St. Louis
NA
NA
NA
NA
NA
NA
NA
NA
NA
NA
NA
NA
St. Louis
St. Louis
NA
Springfield
NA
NA
St. Louis
Reside
211
393
128
62
101
838
58
150
1,936
4,168
789
43
49
599
111
91
331
105
35
170
482
374
112
410
154
257
43
165
2,125
53,298
44
1,211
54,553
Work
22
563
60
43
52
649
39
41
2,479
4,126
762
22
46
524
41
32
123
53
30
157
540
429
73
463
75
240
18
67
3,342
54,530
1
22
54,553
Applicants
67
319
75
44
78
1,169
19
88
1,459
1,339
287
11
18
408
51
32
224
76
20
162
281
79
117
359
90
215
24
104
6,081
37,937
3,137
258
41,332
Classes
255
973
260
133
320
4,555
55
328
6,097
5,434
1,013
33
42
1,358
156
94
733
292
47
686
1,052
304
311
1,363
244
725
116
427
23,842
142,740
10,133
1,006
153,879
Register Additions
170
626
150
75
195
2,863
29
179
3,696
3,169
636
18
25
752
97
63
424
209
25
422
578
159
193
763
140
434
62
277
13,791
86,487
6,461
614
93,562
Received Appointments
7
24
4
3
3
43
0
4
124
47
31
1
1
31
4
3
14
2
0
6
26
7
6
37
5
23
2
6
254
2,655
106
14
2,775
County
Ralls
Randolph
Ray
Reynolds
Ripley
St. Charles
St. Clair
Ste. Genevieve
St. Francois
St. Louis County
Saline
Schuyler
Scotland
Scott
Shannon
Shelby
Stoddard
Stone
Sullivan
Taney
Texas
Vernon
Warren
Washington
Wayne
Webster
Worth
Wright
St. Louis City
State Sub Total
Unknown
Out of State
Total

DIVISION OF PERSONNEL 2010 ANNUAL REPORT
16
Classified employees are those whose duties, responsibilities, qualifications and job titles are prepared, adopted, maintained and administered by the Division of Personnel under the authority of the Personnel Advisory Board for Uniform Classification and Pay (UCP) System agencies. The UCP System applies to employees in nine “merit system” agencies and four other executive branch “non-merit” agencies. *Data is for employees listed as >=50% and permanent in the SAM II HR Payroll System
Number of Missouri State Employees: A Comparison between FY09 and FY10
Office of Adm.
Agriculture
Insurance
Economic Dev.
Higher Education**
Health & Sr. Serv
Labor & Ind. Rel.
Mental Health
Natural Resources
Public Safety**
Revenue
Social Services
Corrections
TOTALS
FY09
1,812
261
286
857
0
1,701
670
7,553
1,584
2,327
1,295
8,011
10,940
37,297
FY09
84
26
212
98
74
47
89
194
52
2,414
95
132
89
3,606
FY10%
4.3%
9.1%
46.3%
10.0%
100.0%
2.9%
10.3%
2.5%
3.8%
51.5%
6.6%
1.7%
0.8%
9.2%
Agency
Legislature
Judiciary
Public Defender
Governor
Lt. Governor
Secretary of State
State Auditor
State Treasurer
Attorney General
Conservation
Elem & Sec Education**
Transportation
TOTAL
FY 09 Count
562
3,351
559
34
6
249
119
46
380
1,512
1,893
6,426
15,137
Elected Officials and Non-UCP Agencies*
FY 10 Count
573
3,341
564
33
6
256
116
47
350
1,443
1,823
6,163
14,724
Loss/Gain
11
-10
5
- 1
0
7
- 3
1
- 30
- 69
- 61
- 263
- 413
FY10
88
26
234
97
64
47
85
180
57
2,466
88
133
88
3,653
Classified
Unclassified
Loss or Gain
4
0
22
- 1
- 10
0
- 4
- 14
5
52
- 7
1
- 1
47
Loss or Gain
136
- 4
- 15
13
0
-112
67
- 547
- 161
- 51
- 43
- 536
- 68
- 1,321
FY 10 Totals*
Total Count
2,040
284
505
968
64
1,638
823
7,209
1,482
4,792
1,343
7,615
11,066
39,829
Loss or Gain
139
- 3
6
10
- 10
- 115
62
- 568
- 157
- 3
- 51
- 532
- 70
- 1,292
UCP
Agencies
* The total count and percentages for some agencies are higher than their combined number and percentage of classified and unclassified employees because some employees were not designated
as either classified or unclassified in the SAM II HR Payroll System.
** The Department of Elementary and Secondary Education, the Department of Higher Education and the Highway Patrol civilian employees are not converted to the UCP System.
FY10
1,948
257
271
870
0
1,589
737
7,006
1,423
2,276
1,252
7,475
10,872
35,976
FY10 %
95.5%
90.5%
53.7%
89.9%
0.0%
97.0%
89.6%
97.2%
96.0%
47.5%
93.2%
98.2%
98.2%
90.3%

DIVISION OF PERSONNEL 2010 ANNUAL REPORT
17
All
Female
Male
The most common age of a state employee is 50
1,821 state employees are under 25
18,591 state employees are under 40
34,856 state employees are between 40 and 64
1,082 state employees are 65 and older
The average age of a male or female state employee is 45
Native American
Asian/Pacific Islander
African American
Hispanic
White
Ethnicity
40
50
Average Age by Ethnicity and Gender
43 43 43 43 43
42
44 45 45 45
47 47 47
Average Age by Ethnicity
Native American = 47 Asian/Pacific Islander = 44 African American = 43 Hispanic = 42 White = 45
Age
Age Distribution for Missouri State Employees
Age Distribution of Missouri State Employees
1,821
4,748
5,558
6,464
7,151
8,566 8,678
6,671
3,790
1,082
10,000
5,000
0
- 25 25-29 30-34 35-39 40-44 45-49 50-54 55-59 60-64 65 +
Age
40
Average Age of
Employees by Agency
On average, employees begin state service when they are 34 years old. Note: Entry age is calculated using the Leave Progression Start Date. Where the employee had a break in service, this date may not accurately reflect the actual date the employee entered state service.
Average Age
Employees Begin State Service by
Agency
AGENCY/ OFFICE
Legislature
Judiciary
Public Defender
Governor
Lt. Governor
Secretary of State
State Auditor
State Treasurer
Attorney General
Office of Administration
Agriculture
Insurance
Conservation
Economic Development
Elem & Sec Education
Higher Education
Health & Senior Services
Transportation
Labor & Industrial Relations
Mental Health
Natural Resources
Public Safety
Revenue
Social Services
Corrections
36
35
33
30
28
33
28
31
34
32
35
33
31
37
36
30
34
31
34
34
33
33
31
33
35
47
47
42
42
37
44
39
42
43
46
48
44
44
48
47
39
47
44
47
44
46
43
43
44
45
45
17
Data based on total employee count of 54,553. 24 employees had an invalid or missing birthdate in the SAM II HR Payroll System. Of those with valid birthdays, 92 employees had invalid or no ethnicity listed.
Division of Personnel 2010 Annual Report

DIVISION OF PERSONNEL 2010 ANNUAL REPORT
18
11.5% African Americans
1.9% Hispanic, Asian Pacific Islander and Native American descent
86.4% White
Employee Count
Native American
%
Asian/Pacific Islander
%
%
Hispanic
%
White
%
Agency
Legislature
Judiciary
Public Defender
Governor
Lt. Governor
Secretary of State
State Auditor
State Treasurer
Attorney General
Office of Adm
Agriculture
Insurance
Conservation
Economic Dev.
Elem & Sec Edu
Higher Education
Health & Senior Ser
Transportation
Labor & Industrial Rel
Mental Health
Natural Resources
Public Safety
Revenue
Social Services
Corrections
TOTALS
2
3
2
0
0
1
1
0
3
5
1
0
5
11
3
0
7
109
3
18
1
27
6
26
26
260
0.35%
0.09%
0.35%
0.00%
0.00%
0.39%
0.86%
0.00%
0.86%
0.25%
0.35%
0.00%
0.35%
1.14%
0.16%
0.00%
0.43%
1.77%
0.36%
0.25%
0.07%
0.56%
0.45%
0.34%
0.23%
0.48%
0
11
8
0
0
4
0
0
1
22
2
2
5
14
13
0
17
31
3
112
17
37
21
26
39
385
0.00%
0.33%
1.42%
0.00%
0.00%
1.56%
0.00%
0.00%
0.29%
1.08%
0.70%
0.40%
0.35%
1.45%
0.71%
0.00%
1.04%
0.50%
0.36%
1.55%
1.15%
0.77%
1.56%
0.34%
0.35%
0.71%
43
311
47
1
0
21
12
2
19
112
6
22
44
142
209
5
161
342
73
2,143
51
443
65
1,319
670
6,263
7.50%
9.31%
8.33%
3.03%
0.00%
8.20%
10.34%
4.26%
5.43%
5.49%
2.11%
4.36%
3.05%
14.67%
11.41%
7.81%
9.83%
5.55%
8.87%
29.73%
3.44%
9.24%
4.84%
17.32%
6.05%
11.48%
2
20
4
0
0
1
0
0
2
7
1
2
6
6
12
0
12
63
7
60
6
34
8
69
82
404
0.35%
0.60%
0.71%
0.00%
0.00%
0.39%
0.00%
0.00%
0.57%
0.34%
0.35%
0.40%
0.42%
0.62%
0.66%
0.00%
0.73%
1.02%
0.85%
0.83%
0.40%
0.71%
0.60%
0.91%
0.74%
0.74%
523
2,962
499
32
6
227
103
45
324
1,888
274
479
1,381
792
1,595
59
1,441
5,607
734
4,863
1,406
4,251
1,242
6,166
10,237
47,136
91.27%
88.66%
88.48%
96.97%
100.00%
88.67%
88.79%
95.74%
92.57%
92.55%
96.48%
94.85%
95.70%
81.82%
87.06%
92.19%
87.97%
90.98%
89.19%
67.46%
94.87%
88.71%
92.48%
80.97%
92.51%
86.40%
573
3,341
564
33
6
256
116
47
350
2,040
284
505
1,443
968
1,832
64
1,638
6,163
823
7,209
1,482
4,792
1,343
7,615
11,066
54,553
Ethnicity by Agency*
Ethnicity
African American
* 105 employees have unknown ethnicity designated in the SAM II HR Payroll System.
**Ethnicity in UCP Managerial Positions:
Native American = 0.4% Asian/Pacific Islander = 0.5% African American = 5.7% Hispanic = 0.3% White = 92.6%
** Managerial totals based upon 1,218 employees in the Uniform Classification and Pay System broadbanded manager classes. One employee had no ethnicity code listed in the SAM II HR Payroll System
DIVISION OF PERSONNEL 2010 ANNUAL REPORT
19
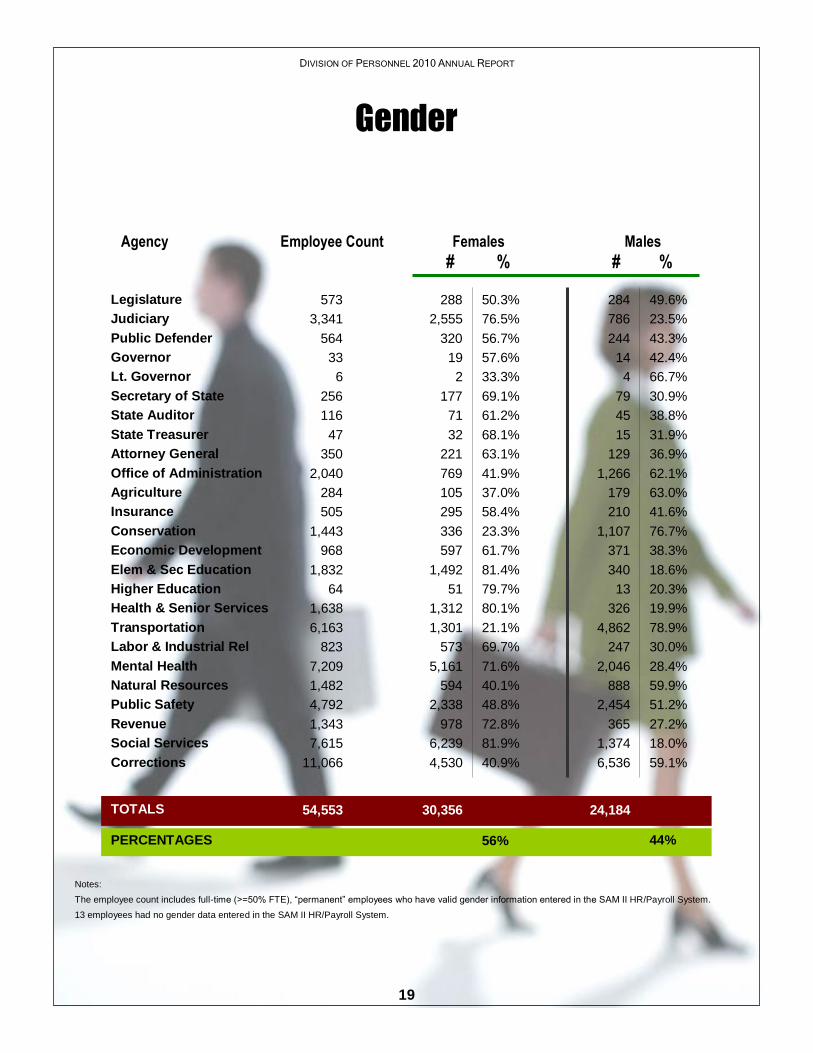
Notes:
The employee count includes full-time (>=50% FTE), “permanent” employees who have valid gender information entered in the SAM II HR/Payroll System.
13 employees had no gender data entered in the SAM II HR/Payroll System.
573
3,341
564
33
6
256
116
47
350
2,040
284
505
1,443
968
1,832
64
1,638
6,163
823
7,209
1,482
4,792
1,343
7,615
11,066
54,553
284
786
244
14
4
79
45
15
129
1,266
179
210
1,107
371
340
13
326
4,862
247
2,046
888
2,454
365
1,374
6,536
24,184
Females Males
# % # % Agency Employee Count
288
2,555
320
19
2
177
71
32
221
769
105
295
336
597
1,492
51
1,312
1,301
573
5,161
594
2,338
978
6,239
4,530
30,356
Legislature
Judiciary
Public Defender
Governor
Lt. Governor
Secretary of State
State Auditor
State Treasurer
Attorney General
Office of Administration
Agriculture
Insurance
Conservation
Economic Development
Elem & Sec Education
Higher Education
Health & Senior Services
Transportation
Labor & Industrial Rel
Mental Health
Natural Resources
Public Safety
Revenue
Social Services
Corrections
TOTALS
PERCENTAGES
50.3%
76.5%
56.7%
57.6%
33.3%
69.1%
61.2%
68.1%
63.1%
41.9%
37.0%
58.4%
23.3%
61.7%
81.4%
79.7%
80.1%
21.1%
69.7%
71.6%
40.1%
48.8%
72.8%
81.9%
40.9%
56%
49.6%
23.5%
43.3%
42.4%
66.7%
30.9%
38.8%
31.9%
36.9%
62.1%
63.0%
41.6%
76.7%
38.3%
18.6%
20.3%
19.9%
78.9%
30.0%
28.4%
59.9%
51.2%
27.2%
18.0%
59.1%
44%
Gender
19

DIVISION OF PERSONNEL 2010 ANNUAL REPORT
20
The average length of service on:
6/30/10 was 11 years and 4 months.
6/30/09 was 10 years and 11 months
6/30/08 was 10 years and 10 months.
6/30/07 was 10 years and 10 months.
6/30/06 was 10 years and 9 months.
Office of Administration
Agriculture
Insurance
Conservation
Economic Development
Elem & Sec Education
Higher Education
Health & Sr. Services
Transportation
Labor & Ind Relations
Mental Health
Natural Resources
Public Safety
Revenue
Social Services
Corrections
14/05
13/08
11/04
13/11
11/08
12/04
9/05
12/09
12/11
12/11
10/04
13/05
10/03
13/04
11/05
9/09
Length of State Service
Years of Service
<1 Year
1 – 4 Years
5 – 9 Years
10 – 14 Years
15 – 19 Years
20 + Years
2006
3,940
11,747
12,220
8,162
6,070
8,570
2007
4,494
11,213
11,884
8,522
5,804
8,588
2008
4,505
11,387
11,343
8,809
5,890
8,632
2009
4,239
12,072
10,778
9,081
5,911
8,871
2010
2,595
12,021
10,431
9,092
6,018
9,110
Employee Count by Year
Comparison of Years of Service Categories
Service data based on the following employee totals:
06/30/06 – 50,709 06/30/07 – 50,506 06/30/08 – 50,566 06/30/09 – 50,952 06/30/10 – 49,267
Data was counted for EXECUTIVE BRANCH full-time (>=50% FTE), “permanent” employees only, as entered in the SAM II HR/Payroll System
Approximately 30% of the workforce has been employed with the state less than 5 years
Average Years/Months of Service for Executive
Branch Agencies

DIVISION OF PERSONNEL 2010 ANNUAL REPORT
21
Merit System Agencies Office of Administration
Department of Corrections
Department of Health and Senior
Services
Department of Mental Health
Department of Natural Resources
Department of Social Services
Department of Economic
Development Housing Development Commission
Public Counsel
Tourism
Workforce Development
Department of Labor and Industrial
Relations Administration Operations
Employment Security
Labor Standards (partially Merit)
Department of Public Safety Adjutant General (SEMA)
Capitol Police
Veterans’ Commission
Certification, Selection,
Appointment, Probation, Classification and Pay
Hours of Work, Overtime, Leave, Political Activity
Performance Appraisal
Mgmt & Supervisory Training
Labor Relations Coordination Separation, Suspension,
MAIRS, EASe, PERforM & SAM II HR/Payroll Table Maintenance, Reporting and Assistance
Management Consultation
Non-Merit System Agencies
Department of Agriculture
Department of Elementary and
Secondary Education 1 and 2
Department of Higher Education
(Coordinating Board only) 1
Department of Insurance, Financial
Institutions and Professional
Registration
Department of Revenue Lottery Commission
State Tax Commission
Department of Economic
Development Administrative Services
Arts Council
Business & Community Services
Public Service Commission
Women’s Council
Department of Labor & Industrial
Relations Commission on Human Rights
Labor & Industrial Relations Commission
Workers Compensation
Department of Public Safety Adjutant General (National Guard)
Fire Safety
Gaming Commission
Alcohol & Tobacco Control
Office of Director
MSHP Civilian Employees 1 MSWP Civilian Employees
Classification and Pay
Hours of Work, Overtime, Leave
Performance Appraisal
Mgmt & Supervisory Training
Labor Relations Coordination
PERforM & SAM II HR/Payroll Table
Maintenance, Reporting and Assistance
Management Consultation
Uniform Classification and Pay
The majority of employees in Executive Branch agencies are under the Uniform Classification and Pay (UCP) System. The UCP System was established under Chapter 36, RSMo, and is under the direction of the Office of Administration, Director of Personnel and the Personnel Advisory Board.
The UCP System provides for a coordinated classification and compensation policy, which promotes consistent compensation practices among participating state departments. A majority of state agencies are already part of the UCP System.
Exclusions
Employees in the Departments of Conservation, Elementary and Secondary Education, Transportation and state colleges and universities, as well as uniformed members of the Highway Patrol and Water Patrol are not part of the UCP System. Members and employees of the Legislative and Judicial Branches and other elected officials are also excluded from the UCP System.
Classification and Pay Systems
Uniform Classification and Pay System (UCP)
1 The Department of Elementary and Secondary Education, the Department of Higher Education and the Highway Patrol Civilian employees are not converted to the UCP System. 2 Attorney General’s Opinion #120-91 indicates that constitutional provisions exempt ―professional‖ employees from UCP coverage. 3 Hours of Work, Overtime and Leave apply to Executive Branch agencies. Non-executive agencies for the most part follow suit. Provisions on Hours of Work, Overtime, Leave and Appeals of Dismissal do not apply to colleges and universities.
Non-Merit & Non-UCP 3
Office of Administration Ethics
Commission
Department of Conservation
Department of Elementary and
Secondary Education 2
Department of Transportation
Department of Insurance, Financial
Institutions and Professional
Registration Financial Examiners
Market Conduct Examiners
Division of Finance
Division of Credit Unions
Department of Public Safety MSHP Uniformed Members
MSWP Uniformed Officers
Non-Executive Branch
Elected Officials
Legislative Branch
Judicial Branch
State Public Defender
State Colleges & Universities
Hours of Work, Overtime, Leave
Mgmt & Supervisory Training
Labor Relations Coordination
SAM II HR/Payroll Table
Maintenance, Reporting and Assistance
Functions and Services Provided by the Division of Personnel

DIVISION OF PERSONNEL 2010 ANNUAL REPORT
22
Employee Pay Distribution Pay Distribution of Employees by Agency as of June 30, 2010
Legislature
Judiciary
Public Defender
Governor
Lt. Governor
Secretary of State
State Auditor
State Treasurer
Attorney General
Office of Administration
Agriculture
Insurance
Conservation
Economic Development
Elem & Sec Education
Higher Education
Health & Senior Services
Transportation
Labor & Industrial Relations
Mental Health
Natural Resources
Public Safety
Revenue
Social Services
Corrections Employees by Salary Level
% of Employees by Salary Level
Cumulative Totals by Salary Level
Cumulative % by Salary Level
525
3,088
554
33
6
250
116
43
341
2,021
275
489
1,441
965
950
64
1,622
6,108
814
7,033
1,430
4,676
1,330
7,506
10,949
74
1,349
118
3
1
95
5
12
83
365
36
130
276
281
182
8
317
845
222
4,394
331
1,639
759
3,259
6,243
21,027
40.0%
21,351
41.0%
268
680
90
6
0
84
19
13
51
559
147
119
451
266
277
32
521
2,651
335
1,177
424
1,037
300
3,473
3,926
16,906
32.1%
38,257
72.9%
83
218
156
3
0
39
42
10
97
541
54
56
369
206
341
10
478
1,458
124
590
442
723
131
601
638
7,410
14.1%
44,667
86.9%
54
362
2
4
3
13
16
2
39
328
21
54
201
99
91
7
210
705
62
369
158
473
76
90
90
3,529
6.7%
49,196
93.6%
25
54
164
3
0
7
15
1
22
151
7
36
101
63
44
2
51
239
18
150
42
324
45
44
29
1,637
3.1%
50,833
96.6%
11
7
8
3
0
6
8
0
26
46
3
51
26
22
7
3
31
121
5
54
18
229
9
16
13
723
1.4%
51,556
98.0%
9
6
7
1
2
2
8
3
4
9
7
27
8
13
1
0
8
46
4
29
7
86
6
11
8
312
0.6%
51,868
98.6%
1
1
2
2
0
3
0
1
10
13
0
11
8
7
4
1
2
30
30
13
3
36
0
6
1
185
0.3%
52,053
98.9%
0
411
5
8
0
1
3
1
9
8
0
5
1
8
3
1
4
12
14
57
5
9
4
6
1
576
1.1%
52,629
100.0%
0
0
2
0
0
0
0
0
0
1
0
0
0
0
0
0
0
1
0
200
0
120
0
0
0
324
0.6%
324
0.7%
Based on full-time (100% FTE), salaried, permanent employees.
$5000- $19999
$20000- $29999
$30000- $39999
$40000- $49999
$50000- $59999
$60000- $69999
$70000- $79999
$80000- $89999
$90000- $99999
Greater Than
$100000
Agency and Employee Count

DIVISION OF PERSONNEL 2010 ANNUAL REPORT
23
Executive Branch Turnover by Agency
Division of Personnel 2010 Annual Report
23
Agency
Office of Administration
Agriculture
Insurance
Conservation
Economic Development
Elem & Sec Education
Higher Education
Health & Senior Services
Transportation
Labor & Ind. Relations
Mental Health
Natural Resources
Public Safety
Revenue
Social Services
Corrections
TOTALS
Percent Turnover by Reason
Employees
1,969
285
502
1,475
977
1,859
69
1,690
6,294
801
7,420
1,556
4,810
1,375
7,874
11,089
50,042
Total
Turnover Percentage
7.6%
8.8%
10.6%
6.4%
12.8%
10.7%
24.8%
12.3%
7.3%
12.7%
21.4%
14.3%
17.8%
10.5%
12.9%
8.6%
12.4%
Voluntary
Turnover Percentage
3.1%
3.5%
5.6%
2.2%
7.6%
4.0%
17.5%
6.0%
2.2%
5.0%
9.8%
4.8%
9.9%
5.6%
9.0%
5.1%
6.4%
Total
Separation Actions
150
25
53
95
125
198
17
208
457
102
1,590
222
854
144
1,016
951
6,207
Reasons for Leaving Employment
Resigned Agency (*)
15
2
11
33
17
45
3
25
6
19
311
43
200
21
77
37
865
1.7%
Resigned State (**)
47
8
17
0
57
30
9
76
133
21
418
31
274
56
632
531
2,340
4.7%
Dismissals
10
3
7
3
7
16
0
28
94
10
324
3
232
15
70
138
960
1.9%
Retirement
56
5
13
54
34
74
1
59
174
42
209
49
98
43
199
227
1,337
2.7%
Other
22
7
5
5
10
33
4
20
50
10
328
96
50
9
38
18
705
1.4%
(*) ―Resigned Agency‖ indicates the employee resigned from one agency and was employed by another agency.
(**) ―Resigned State‖ indicates the employee resigned from state government entirely. These two columns represent ―voluntary‖ turnover for the state. ―Other‖ indicates such separation reasons as End of Appointment, End of Term, Layoff, Deceased, etc.
Personnel Actions designating the ―Reasons for Leaving Employment‖ were counted for the period July 1, 2009 through June 30, 2010.
Data was counted for full-time (>=50% FTE), ―permanent‖ employees only, as entered in the SAM II HR/Payroll System.

DIVISION OF PERSONNEL 2010 ANNUAL REPORT
24
Retirements Employees Eligible for Retirement by Agency and Year
Source: Missouri State Employees Retirement System (MOSERS) and MoDOT (Transportation) and Patrol Employees Retirement System (MPERS)
Year Eligible for Retirement
Total
2,305
1,682
378
462
428
1,710
229
479
8
552
319
318
122
99
543
56
10
21
64
0
4
95
772
150
10,806
2,083
12,889
% Agency
20.8%
22.1%
28.1%
9.6%
28.9%
23.7%
27.8%
29.2%
12.5%
30.1%
33.0%
22.0%
24.2%
34.9%
26.6%
16.0%
21.3%
18.1%
25.0%
0.0%
12.1%
16.8%
23.1%
26.2%
2014
423
242
62
80
55
256
41
66
2
85
51
55
15
15
66
11
1
3
14
0
0
14
109
12
1,678
330
2,008
2013
370
235
50
68
57
294
23
67
1
82
29
61
21
19
72
14
2
3
11
0
2
9
99
23
1,612
306
1,918
2012
325
237
59
72
51
272
22
82
2
78
47
44
21
14
86
9
2
6
7
0
1
20
95
20
1,572
312
1,884
2011
301
201
48
52
52
204
28
65
1
62
36
41
12
6
71
6
2
1
9
0
0
14
81
16
1,309
268
1,577
2010*
886
767
159
190
213
684
115
199
2
245
156
117
53
45
248
16
3
8
23
0
1
38
388
79
4,635
867
5,502
Agency
Corrections
Social Services
Revenue
Public Safety
Natural Resources
Mental Health
Labor and Industrial Relations
Health and Senior Services
Higher Education
Elementary and Secondary Education
Economic Development
Conservation
Insurance
Agriculture
Office of Administration
Attorney General
State Treasurer
State Auditor
Secretary of State
Lt. Governor
Governor
Public Defender
Judiciary
Legislature
MOSERS Total
MPERS Total
Grand Total
% Total Ees
4.2%
3.1%
0.7%
0.8%
0.8%
3.1%
0.4%
0.9%
0.0%
1.0%
0.6%
0.6%
0.2%
0.2%
1.0%
0.1%
0.0%
0.0%
0.1%
0.0%
0.0%
0.2%
1.4%
0.3%
19.8
3.8
23.6
*Data includes active employees eligible to retire on June 30, 2010. Many of these employees were previously eligible to retire.

DIVISION OF PERSONNEL 2010 ANNUAL REPORT
25
Labor Relations
Distribution of Union Representation and Membership
Labor Organization*
AFSCME
AFSCME
SEIU
SEIU
SEIU
CWA
CWA
MOCOA
MONA
IAFF
IUOE
MFT
Bargaining Unit
Patient Care Support
Craft and Maintenance
Probation and Parole Officers
Patient Care Professional
Probation and Parole Assistants
Social Services
Health & Senior Services
Corrections Officers
Mental Health/ Registered Nurses
Firefighters (Adjutant General)
Operating Engineers Transportation
Elementary & Secondary Education
TOTAL
(64%)
(86%)
(78%)
(95%)
(89%)
(85%)
(91%)
(51%)
(92%)
(46%)
(97%)
(98%)
(75%)
2,784
1,911
974
939
221
4,966
385
2,712
317
12
2,215
398
17,834
26,169
1585
314
270
48
27
875
40
2,645
26
14
63
7
5,914
19,461
Total Represented Employees
Number of Members
% of Total Represented Employees
Number of Non-Members
% of Total Represented Employees
(36%)
(14%)
(22%)
(05%)
(11%)
(15%)
(09%)
(49%)
(08%)
(54%)
(03%)
(02%)
(25%)
4,369
2,225
1,244
987
248
5,841
425
5,357
343
26
2,278
405
23,748
* Labor Organizations:
AFSCME: The American Federation of State, County and Municipal Employees, Council 72 (AFL-CIO affiliated)
SEIU: Service Employees International Union, Local 2000
CWA: Communication Workers of America, Local 6355 (AFL-CIO affiliated)
MOCOA: Missouri Corrections Officers Association
MONA: Missouri Nurses Association (AFL-CIO affiliated)
IAFF: International Association of Firefighters (AFL-CIO affiliated)
IUOE: International Union of Operating Engineers (AFL-CIO affiliated)
MFT: Missouri Federation of Teachers (AFL-CIO affiliated)
Approximately 23,748 state employees (43.5% of the workforce) are represented by various labor organizations
At the end of FY10, approximately 23,748 state employees (43.5% of the workforce) were represented by various labor organizations serving as their exclusive bargaining representatives. These employees are represented by one of 12 different bargaining units in which they share a community of interest with the other employees within their bargaining unit. The distribution of these bargaining units along with the number and percent of union members and non-members is listed below.

DIVISION OF PERSONNEL 2010 ANNUAL REPORT
26
United We Stand. Building a Stronger Missouri: A New Direction in FY10
State of Missouri
FOR
AND
To aid and enhance the productivity and economic growth of Missouri businesses and public entities, the Division of Personnel’s Center for Management and Professional Development revitalized its mission in FY10 by expanding its customer base. In addition to providing best practice leadership training for state agencies, the Center also began to focus on helping private sector businesses and government entities cultivate and enhance the management skills of their current and potential leaders through the delivery of innovative, participant-centered training programs.
This outreach initiative may have a positive impact in key business areas that include:
Helping Missouri employers of all sizes and sectors to improve the skills of their supervisors, managers and team leaders as a way to improve their business performance.
Encouraging Missouri businesses and entities to value and realize the benefits that increasing leadership competency through training can provide.
Providing an affordable resource for Missouri employers to unlock staff potential, increase productivity and improve their bottom line, thus strengthening Missouri’s economy.
Leadership training prepares current and future supervisors and managers to handle the challenges present in any organization in both good and bad times – things like goal setting and execution, maintaining a culture of trust, decision making, communication and other day-to-day issues that, left unresolved, can potentially derail any forward momentum the business or organization hopes to sustain or achieve.
The Center for Management and Professional Development will help leaders:
Ensure employees work together when it is important to pull together. Leverage the performance and productivity of employees to achieve cost-effective and better
services for customers. Maintain their employer’s competitive edge, while helping to develop and retain their workforce. Achieve higher morale and a renewed commitment to quality in the products and services
Missouri businesses and government provide.

DIVISION OF PERSONNEL 2010 ANNUAL REPORT
27
Training in FY10…
The Division of Personnel offered 123 training
programs in FY10 attended by 1,414 supervisors and managers
The Division offers over 60 distinct training programs designed to develop specific supervisory and managerial competencies. For a complete list and description of each program, visit www.training.oa.mo.gov
Throughout FY10, the Center for Management and Professional Development offered leadership and professional development training programs to managers and supervisors using best practice leadership strategies from training partners such as FranklinCovey, the Center for Leadership Studies, Achieve Global, Development Dimensions International (DDI), the University of Missouri, and other contracted trainers.
The Center also continued to sponsor membership to the Institute for Management Studies (IMS), an international educational and professional development organization offering specialized training programs each month in Kansas City and St. Louis conducted by leading practitioners, authors and authorities in the area of management. IMS sessions offer state executives, managers and supervisors the opportunity to participate and interchange with their professional counterparts in the private sector.
The Center’s “Special Invitation Leadership Seminars” continued to reach large numbers of state supervisors and managers with content focusing on today’s critical leadership issues.
To compliment its training programs, the Center continues to publish an on-line magazine, aptly named Solutions, which disseminates practical information to help managers develop the best in themselves and in those who work with and for them. Solutions is published quarterly in PDF format at www.training.oa.mo.gov/Solutions.pdf.
In partnership with Missouri State University, the Center supported the state’s first Certified Public Manager program. The CPM program helps to refine and improve the management skills of both emerging leaders and existing supervisors and managers so that they can confidently provide the highest possible service to Missouri citizens in today’s dynamic public management environment.
Online Learning
During FY10, the Center championed the use of online learning strategies to reach employees in a more efficient and cost effective manner. While traditional classroom programs were still preferred by many participants, the practical aspects of webinars and other online venues gained in momentum. The Center provided LiveClicks webinars powered by FranklinCovey content and conducted by Division trainers – and pioneered their own Advantage brand webinars to increase the number of webinars available to Center customers.
The Center continued to encourage the use of MyQuickCoach – a new online coaching system that brings on-demand business and leadership advice from a variety of respected thought leaders directly to an individual’s computer desktop. The sytem contains over 1,400 ―smartbytes,‖ each 5 – 7 minutes in length on a wealth of leadership and professional development topics that can be shared with other team members via email (even if they are not MyQuickCoach users). To promote the system and provide continuous learning to Center customers, periodic ―smartbytes‖ are sent throughout the year to individuals included in the Center’s online distribution list.
Lively and Animated!
Strengthening Missouri’s Future
Missouri Certified Public Manager Program
27
Division of Personnel 2010 Annual Report

DIVISION OF PERSONNEL 2010 ANNUAL REPORT
28
Agriculture
In FY10, 85% of managers and supervisors were compliant with the Training Rule. The agency provides on-line training programs that are cost effective and allows employees to receive training when it fits their work schedule. Employees will also have the opportunity to
participate in training provided by the Office of Administration, professional organizations and conferences as resources allow. During FY11, the agency will strive to enhance training opportunities for all employees and managers in accordance with Office of Administration guidelines.
Corrections
During FY10, Regional Management Trainers presented 243 supervisory and management
programs to 4,051 participants. In addition, many managers attended outside programs presented by OA and other organizations. Ninety-one percent of new supervisors/managers completed the 40 hour Training Rule requirement; and 70% of all supervisors/managers attended at least 16 hours of training. The agency also conducted annual training audits of all Correctional Institutions based on the calendar year to stay in line with the PERforM rating period. The focus in FY11 will be on several new classes: FMLA, Addressing Harassment, Discrimination and Retaliation in the Workplace, and revising Basic Supervision.
Economic Development
In FY10, a new on-line New Employee Orientation PowerPoint presentation was made accessible to all new and current employees. The NEO presentation includes instructions on completing benefit and employment related forms as well as the department’s policies and procedures.
Public Service Commission During FY10, the Commission provided staff with training opportunities at minimal cost with
a total of 94% of managers and 75% of supervisors in compliance with the Training Rule. During FY11, the Commission will continue to focus on industry and technical training specific to the utility industry. Managers and supervisors will continue to be required to attend bi-annual Diversity training.
Elementary and Secondary Education
With the continuing decrease in the number of personnel, the department has found it
increasingly difficult to meet the requirement of the Management Training Rule. The Department does fully embrace the intent of this rule and in an attempt to increase compliance, beginning in FY11 new staff will be provided a mentor for 24 hours of the training requirements. The remaining 16 hours will focus on areas that include: accountability, customer service, decisiveness, financial management, flexibility, planning, problem solving, and team work.
Health and Senior Services
During FY10, the agency offered 67 classroom sessions attended by 1195 participants. Topics included: Effective Writing, Grammar and Punctuation, Customer Service, Team Effectiveness, Developing Team Agility, Generational Differences, and Gossip in the Workplace. Quarterly management courses were held for new supervisors to help with their supervisory role and to meet the Management Training Rule. New e-learning courses were developed for employees working with Missouri residents requesting in home care services. These courses were accessed 1026 times. Required yearly training in Continuity of Operations, Preventing Sexual Harassment, and Time Coding were completed online with
7,025 participants. In FY11, the department will continue to pursue e-learning technologies with the goal of providing quality training while reducing costs.
Insurance, Financial Institutions and Professional Registration
In FY10, 90% of managers and supervisors were compliant with the Training Rule. Credit Unions plan on obtaining professional development through NCUA, SHRM and SHRMC for FY11. Insurance plans to encourage the use of e-learning for all staff, including managers. New managers/supervisors are encouraged to attend a core group of supervisor training programs offered by OA. HR will be attending SHRM and SHRMC to meet requirements.
Agency Training
Reports
The Management Training Rule
Chapter 36 prescribes that the Division of Personnel will develop, initiate and implement a central training program for executive, managerial and supervisory development in Missouri state government.
The Management Training Rule (1 CSR 20-6.010) establishes guidelines and standards for training management and supervisory staff in state government (other than elective offices and institutions of higher learning). The Rule affirms that the professional development of supervisors and managers is of paramount importance to the continuous improvement of individuals and agencies. The Rule requires a new supervisor or manager to complete a minimum of 40 hours of training within his or her first year in the position; and thereafter at least 16 hours of continuing competency-based training each year. The Rule provides a framework for developing and maintaining 24 specific leadership competencies consistent with the mission of each department and specific job responsibilities of each employee. Each year, the Division of Personnel requests state agencies to provide information about the development of their managers and supervisors to include in this report. The following information reflects data received from Executive Branch agencies that responded to our request. It should be noted that all state agencies, regardless of their inclusion in this report strive to provide training for managers and supervisors (and employees in general) throughout the year.

DIVISION OF PERSONNEL 2010 ANNUAL REPORT
29
Mental Health
During FY10, the total number of courses available through e-learning increased from 866 to 1,959. Online programs account for 1,488 of the total. Classroom based training programs tracked through e-learning increased to 475 courses. The Department continues to advance the use of electronic training and training tracking through the e-learning platform. All employees have access to e-learning and have e-learning accounts. Thirty-two DMH service providers have established e-learning accounts for their employees, enabling them to receive the same training consistent with DMH policies and best practices. Online training programs are cost effective and enable staff to participate in multiple training classes with limited
time away from their primary work responsibilities.
Office of Administration
During FY10, approximately 42% of identified executives, managers and supervisors within OA complied with the requirements of the Training Rule. The agency does not have a centralized training function specifically for its employees. The training function and arrangements are coordinated at the division level. Some training is provided through programs offered through the Division of Personnel. Some training is done through outside vendors and, on a limited basis, internally. Throughout FY10, many divisions continued to encourage employees to seek out low cost training options due to limited training budgets. Divisions, when possible, continued to provide the requisite amount of training required of its employees by virtue of their professional standards and Office of Administration policies, subject to funding constraints. It is anticipated that budgetary restrictions during FY11 will continue to impact the ability to expand professional development of staff.
State Tax Commission Budget restraints in FY10 resulted in delaying the anticipated development of a management training policy. As resources become available, the Commission plans to implement programs providing educational and managerial opportunities for managers and supervisors. During FY11, the Commission will participate in seminars or training sessions provided by the Office of Administration or other agencies as resources allow.
Social Services
In FY10, the agency achieved 99% compliance with the 40-hour training rule and 92.8% compliance with the 16 hour requirement.
Agency trainers provided more than 440 classes in over 65 staff development subject areas. Civil Rights and Diversity training was provided to new and tenured staff as required every three years. The agency continues to utilize the Employee Learning Center to track and monitor training and distribute DSS Administrative Manual Policy
Updates. In FY11, the agency will focus on offering a wide selection of staff development classes such as Continuous Process Improvement, Clinical Supervision Learning Labs, Managing Change, Employee Retention and The Power of Positive Relationships in the Workplace.
Transportation
In FY10, 86% of MoDOT supervisory staff met the requirements of the Management Training Rule with an average for all supervisors of 40.7 hours. For the agency’s entire workforce, the average number of hours of training per employee was 31.1 hours. The agency will continue to provide training for all levels of the organization using a blend of in-house and vendor provided instruction. Training will continue with the 40-hour High Performance Supervision curriculum for new supervisors, and the 96-hour Management Development Institute curriculum for middle managers. The agency will continue their 40-hour Introduction to Supervision curriculum available for team-lead employees
and continue technical training, technology training, and safety programs. Quarterly training programs will continue to be provided through the Accelerated Leadership Development program. The agency will also begin implementing Kirkpatrick Level 3 and 4 evaluation of snow removal training—and continue to manage and track training via their web-based Learning
Management System.
29
Agency Training Reports – Cont’d.
Public Safety
Missouri Veterans Commission During FY10, the Commission implemented a personality-based training program (Synergy) modeled after the Jung-Meyers-Briggs typology/Kiersey Temperament research to identify individual personality types and to promote and facilitate professional development.
The program will be used as a foundation to develop other courses for the Commission’s leadership team. Agency training for managers and supervisors include: Cultural Diversity, Preventing Sexual Harassment, and Performance Management. The Commission is developing other training for new managers and supervisors to include: Supervisory Liability; FMLA/ADA; Interviewing Skills; Merit System; Labor Relations; Addressing Difficult Employees; Team Building; Conflict Resolution; Managing Performance Problems; and Media Relations. An e-learning system was also selected for basic ongoing education of direct care staff. In FY11, the feasibility of providing training for other programs through this system will be explored.
Revenue
During FY10, 100% of managers and supervisors were compliant with the 16-hour component of the Training Rule; and 94% of all first year managers and supervisors completed their prescribed 40 hours of training. The Department developed webinar classes and offered a total of 1,325 hours of webinar training on technical skills to 608 participants. All staff viewed a webinar on the importance of maintaining confidentiality and preventing the unauthorized release of information. The Department will continue to offer training on both ―hard and soft‖ skills,
emphasizing the use of webinars to minimize travel and related expenses. Upcoming training in FY11 will include courses on motivation that help promote a positive work environment in non-monetary ways; a course that encourages employees to rethink business processes by educating staff on continuous process improvement; and a program to increase staff
customer relations skills.
Lottery In FY10, 80% of supervisors/managers were compliant with the Training Rule with focus being on three competencies: Technical Knowledge, Workforce Management, and Accountable. It should be noted that 89% of those compliant exceeded the 16 hour requirement. During FY11, training efforts will focus on Sales, Customer Service, Project Management, Leadership, Teambuilding, Technology, and Human Effectiveness.

DIVISION OF PERSONNEL 2010 ANNUAL REPORT
30
State Employee of
the Month
The Division of Personnel assumed the administrative duties for the State Employee of the Month Program in 1990. All departments and offices of elected officials may submit the name of their winning Department/Agency Employee of the Month for State Employee of the Month consideration. Nominations are voted upon by a selection committee comprised of members of the State Training Advisory Council (STAC). Each State Employee of the Month is typically honored during a ceremony held in the Governor’s Office where he or she is presented with an engraved plaque in recognition of their extraordinary service.
THE GOVERNOR’S
AWARD FOR QUALITY
AND PRODUCTIVITY
The Governor’s Award for Quality and Productivity (GAQP) is an annual award designed to recognize outstanding accomplishments of state government employee work teams. As part of a continuous process to improve government efficiencies, the GAQP may recognize winning teams in four major categories: Customer Service; Efficiency and Process Improvement; Innovation, and Technology in Government. The goal: to establish clear winners that can serve as a statewide model of efficiency, quality, and effectiveness. A selection committee comprised of state executives evaluates each nomination and selects one winning team for each category. The committee recommends their choices for winning teams to the Governor for final approval. In 2010, the selection process was revised to create a new Pinnacle award – given, if in the opinion of the selection committee, one nomination encompasses multiple award categories, or exceeds all other nominations. In FY10, a recognition ceremony for GAQP winners was held in the Capitol Rotunda where OA Commissioner Kelvin Simmons presented awards to winning agencies and team members. Photos: Allan Forbis
State Employee Suggestion Program
The Missouri Relies on Everyone (MoRE) State Employee Suggestion Program provides state employees with a venue to submit their ideas, suggestions or recommendations on how to improve customer service, reduce cost, generate revenue, and improve work processes. The program also provides a way to recognize and reward the ingenuity and commitment to excellence of state employees for their suggestions. An online tracking system initiated by the Division of Personnel allows decentralization of the review and award process of employee suggestions to each state agency. During FY10, approximately 160 suggestions were submitted to state agencies for review. Twelve suggestions were held for further review. Four suggestions received monetary awards totaling $300.00. Other suggestions received Certificates of Recognition.
State Employee
Recognition Week
Missouri State Employee Recognition Week was celebrated during the week of August 16 - 20, 2010. The week is set aside to give state agencies the opportunity to voice their appreciation to state employees for their dedication to public service. In addition, it serves as an education and community outreach vehicle designed to inform the public about the broad variety of services provided by state government employees. In conjunction with this week, a special Employee Recognition Day event held on August 20 on the Capitol lawn coordinated by the Division of Personnel was attended by approximately 4,500 state employees. Over 80 vendors comprised of state agencies, local merchants and businesses; and staff from the WeSave Employee Discount Program participated. During this special week, Governor Jay Nixon also recognized selected state employees for their local, state, national, or international achievement and valor.
MoRE
Employee Recognition Programs The Division of Personnel through the Center for Management and Professional Development proudly sponsors and coordinates four distinct programs designed to recognize and reward the creativity, ingenuity and dedication of state employees.
Photos from top to bottom:
Governor Jay Nixon greeting State Employee Award of Distinction winners, their families and fellow employees
State Employee Recognition Day on the Capitol lawn
OA Commissioner Kelvin Simmons congratulating winners of the Governor’s Award for Quality and Productivity

DIVISION OF PERSONNEL 2010 ANNUAL REPORT
31