bimanual interaction, passive-haptic …web.cs.wpi.edu/~gogo/papers/lindeman_thesis.pdf · jim...
TRANSCRIPT
BIMANUAL INTERACTION, PASSIVE-HAPTIC FEEDBACK,
3D WIDGET REPRESENTATION, AND SIMULATED SURFACE CONSTRAINTS
FOR INTERACTION IN IMMERSIVE VIRTUAL ENVIRONMENTS
By
Robert William Lindeman
B.A. in Computer Science, May 1987, Brandeis University
M.S. in Systems Management, December 1992, The University of Southern California
A Dissertation submitted to
The Faculty of
The School of Engineering and Applied Science
of The George Washington University in partial satisfaction
of the requirements for the degree of the Doctor of Science
May 16, 1999
Dissertation directed by
Dr. James K. Hahn
Associate Professor of Engineering and Applied Science

ii
© Copyright by Robert William Lindeman 1999
All Rights Reserved
iii
ABSTRACT
Bimanual Interaction, Passive-Haptic Feedback, 3D Widget Representation, and Simulated
Surface Constraints for Interaction in Immersive Virtual Environments
by Robert William Lindeman
Directed by Associate Professor James K. Hahn
The study of human-computer interaction within immersive virtual
environments requires us to balance what we have learned from the design and use of desktop
interfaces with novel approaches that allow us to work effectively in three dimensions. This
dissertation presents empirical results from four studies into different techniques for indirect
manipulation in immersive virtual environments. These studies use a testbed called the Haptic
Augmented Reality Paddle (or HARP) system to compare different immersive interaction
techniques.
The results show that the use of hand-held windows as an interaction technique can
improve performance and preference on tasks requiring head movement. Also, the use of a
physical prop registered with the visual representation of an interaction surface can
significantly improve user performance and preference compared to having no physical
surface. Furthermore, even if a physical surface is not present, constraining user movement for
manipulating interface widgets can also improve performance.
Research into defining and classifying interaction techniques in the form of a taxonomy
for interaction in immersive virtual environments is also presented. The taxonomy classifies
interaction techniques based on three primary axes: direct versus indirect manipulation;
discrete versus continuous action types; and the dimensionality of the interaction. The results
of the empirical studies support the classification taxonomy, and help map out the possible
techniques that support accomplishing real work within immersive virtual environments.
iv
AcknowledgementsMany people have contributed to my success in completing this doctoral work. My advisor
James Hahn first opened my eyes to the incredible world of computer graphics. His gifted
teaching skills made computer graphics both accessible and intriguing. He gave me the
support I needed, and the freedom necessary to pursue my research. His critical comments
helped strengthen my work greatly.
John Sibert took me into his HCI group, and treated me like one of his own students. His
ever-present enthusiasm for HCI research, support for group interaction, eye towards rigor,
and timely feedback, energized me to progress towards finishing. Without his generosity, I
never could have finished.
Shelly Heller provided me with guidance and support, especially in the early part of my work.
Her door was always open, and I never felt like I was intruding on her time. She is a solid
role-model for what a professor should be.
Jim Templeman and his group at the Naval Research Labs, including Linda Sibert, provided
many insights into my work. Jim was especially supportive in helping develop the Clamping
technique described in this work. Through Jim, I also received some funding from the Office
of Naval Research, for which I am grateful. I want to thank Joe Psotka for his feedback and
for being on my committee. Marc Sebrechts was helpful during the proposal stage of my
work.
Early in my studies, the Multimedia Group at GW provided the formative knowledge for the
framing of my research. I also received extremely precise and critical feedback from the HCI
group at GW on many occasions. In terms of the design and implementation issues of the
HARP system and the associated experiments, these meetings were especially helpful. I also
want to thank the other Lab Rats in the Institute for Computer Graphics at GW for the
patience and support they showed while I was conducting my experiments.
v
Two fellow students in particular contributed to my success and love for graphics. Suneil
Mishra gave me some much-needed distraction from my work by forcing me to play soccer
(okay "football") regularly. We also had many discussions about graphics concepts, and his
great knack for cutting to the chase helped drive some difficult concepts home. Amit Shalev
and I had many discussions about haptics, and Amit's work was a major influence on my own. In
addition, Amit's love for film, wry sense of humor, and seemingly-continuous production of
"interesting" ideas helped keep me sane.
Jim Rowan helped find funding for me from sources too numerous to name, allowing me to
concentrate on my research without too much worry about how I was going to pay for it all.
Marilyn Henry, Yvonne Hood, Barbara Edwards, Debbie Swanson, and Lawrence Cheeks
gave me administrative support, supplies, laughs, and jellybeans. I want to thank Bhagi
Narahari for all the moral support, critical feedback, and coffee breaks.
My family has helped me retain my sanity by patiently listening to me talk about my struggles,
usually during a troughing session. My father helped in designing and building the mounting
frame for the HARP system, and encouraged me through his boundless curiosity. My mother
helped me "recharge my batteries" when they ran low by always being there when I called.
My strongest thanks must go to my wife and shinyu Kaori. More than any single person, she
has been a pillar of strength and support through this long process. Her laughter, reflection,
and encouragement have enabled me to see my work through to the end. I only hope I have
the opportunity to return the favor sometime.
vi
Table of Contents
Abstract .............................................................................................................Error! Bookmark not defined.
Acknowledgements....................................................................................................................................... iv
Table of Contents......................................................................................................................................... vi
List of Figures.............................................................................................................................................viii
List of Tables................................................................................................................................................. x
1 Introduction ................................................................................................................................................ 1
1.1 General Overview................................................................................................................................. 11.2 Definitions............................................................................................................................................ 21.3 Problem Statement................................................................................................................................ 21.4 A Word About The Senses.................................................................................................................... 41.5 Original and Significant Contributions ................................................................................................. 6
2 Literature Review....................................................................................................................................... 8
2.1 Current IVE Interaction Techniques ..................................................................................................... 82.2 The Neurophysiology of Menu Interfaces.............................................................................................. 9
2.2.1 Interaction in 2D spaces................................................................................................................ 92.2.2 Interaction in 3D spaces.............................................................................................................. 12
2.3 Unimanual Interfaces.......................................................................................................................... 132.4 Bimanual Interfaces............................................................................................................................ 14
2.4.1 Symmetrical Interaction .............................................................................................................. 142.4.2 The Asymmetry of the Hands ....................................................................................................... 15
2.5 Haptic Interfaces................................................................................................................................. 192.5.1 Active-Haptic Interfaces.............................................................................................................. 192.5.2 Passive-Haptic Interfaces............................................................................................................ 19
2.6 Proprioception.................................................................................................................................... 21
3 Virtual Environment Taxonomies............................................................................................................ 22
3.1 Previous Taxonomy Work................................................................................................................... 223.2 Taxonomy of Direct and Indirect Manipulation Techniques................................................................ 28
3.2.1 Direct Manipulation.................................................................................................................... 283.2.2 Indirect Manipulation ................................................................................................................. 303.2.3 The Structure of the Taxonomy.................................................................................................... 323.2.4 Using the Taxonomy.................................................................................................................... 36
4 HARP System Testbed............................................................................................................................. 39
4.1 System Overview................................................................................................................................ 394.2 Hardware............................................................................................................................................ 434.3 Software............................................................................................................................................. 454.4 The Virtual Environment.................................................................................................................... 504.5 Summary............................................................................................................................................ 53
5 Empirical Studies..................................................................................................................................... 54
5.1 Introduction........................................................................................................................................ 54
vii
5.2 Motivation.......................................................................................................................................... 545.3 UI Interaction Decomposition............................................................................................................. 545.4 Experiments I and II ........................................................................................................................... 55
5.4.1 IVE UI Approaches ..................................................................................................................... 565.4.2 Haptic Augmented Reality........................................................................................................... 575.4.3 Experimental Method .................................................................................................................. 57
5.5 Experiments III and IV ....................................................................................................................... 825.5.1 Surface Type ............................................................................................................................... 835.5.2 2D versus 3D Widget Representations......................................................................................... 845.5.3 Experimental Method .................................................................................................................. 85
6 Conclusions..............................................................................................................................................111
6.1 Contributions.....................................................................................................................................1126.2 Future Work ......................................................................................................................................113
6.2.1 Constrained Interaction .............................................................................................................1136.2.2 Mismatched Feedback................................................................................................................1136.2.3 Additional Interface Tasks..........................................................................................................1136.2.4 Compound Applications .............................................................................................................1146.2.5 Combined Direct and Indirect Techniques..................................................................................1146.2.6 Non-Immersive Environments.....................................................................................................1146.2.7 Further Data Analysis ................................................................................................................1146.2.8 Further Taxonomic Work...........................................................................................................115
6.3 Summary...........................................................................................................................................115
7 References ...............................................................................................................................................116
8 Appendices...............................................................................................................................................124
viii
List of FiguresFigure 2.1: Sample Cascading Pull-Down Menu Structure ............................................................................ 11Figure 3.1: The AIP Cube (from [Zelt92])..................................................................................................... 22Figure 3.2: 6-DOF Input Taxonomy (from [Zhai94])..................................................................................... 26Figure 3.3: IVE Interaction Taxonomy.......................................................................................................... 32Figure 3.4: Parameter Manipulation Type Continuum................................................................................... 32Figure 3.5: Manipulation Technique Placement ............................................................................................ 34Figure 3.6: Action Type Continuum.............................................................................................................. 35Figure 3.7: Degrees-of-Freedom Continuum.................................................................................................. 36Figure 3.8: IVE Interaction Taxonomy with Examples .................................................................................. 37Figure 4.1: The HARP Mounting Frame with Calibration Dots ..................................................................... 40Figure 4.2: The Paddle (a) The Physical Paddle; (b) The Virtual Paddle........................................................ 41Figure 4.3: The HARP System...................................................................................................................... 41Figure 4.4: The Virtual Dominant Hand........................................................................................................ 42Figure 4.5: Flow of Audio and Video to the User........................................................................................... 43Figure 4.6: Flow of Tracker Data From User (Tracker Sensors in bold outline)............................................. 45Figure 4.7: Class Hierarchy of the HARP software........................................................................................ 46Figure 4.8: Code Snippet for Creating a Simple Slider .................................................................................. 48Figure 4.9: Slider-Bar Example: (a) Object Hierarchy;.................................................................................. 49Figure 4.10: Orientation Aids: (a) Blue Cube to the Left; (b) Green Cone to the Right .................................. 51Figure 4.11: Texture Maps: (a) Tiled Floor; (b) Blue Sky.............................................................................. 52Figure 4.12: Manipulation Cues: (a) Yellow Fingertip; (b) Red Drop-Cursor; (c) Widget Highlighting and
Audio Feedback..................................................................................................................................... 52Figure 5.1: The Physical Paddle .................................................................................................................... 60Figure 5.2: The Docking Task....................................................................................................................... 62Figure 5.3: Shape Start and Target Positions for the Docking Task ............................................................... 63Figure 5.4: Selection Task (a) The Signpost; (b) Paddle with Four Shapes..................................................... 63Figure 5.5: Overhead View of Physical Layout.............................................................................................. 64Figure 5.6: The Dominant-Hand Avatar (a) From the Back; (b) From the Side.............................................. 67Figure 5.7: The Opening Display .................................................................................................................. 68Figure 5.8: Composite Preference Value × Main Effects (Exp. I & II)........................................................... 71Figure 5.9: Docking Time × Main Effects (Exp. I)........................................................................................ 73Figure 5.10: End Distance × Main Effects (Exp. I)........................................................................................ 73Figure 5.11: Selecting Time × Main Effects (Exp. II).................................................................................... 74Figure 5.12: Correct × Main Effects (Exp. II)................................................................................................ 75Figure 5.13: Docking Time and Selecting Time by Treatment (Exp. I & II) .................................................. 76Figure 5.14: End Distance and Correct by Treatment (Exp. I & II)................................................................ 77Figure 5.15: Composite Preference Value by Treatment (Exp. I & II)............................................................ 78Figure 5.16: Composite Preference Value Learning Effects (Exp. I & II)....................................................... 80Figure 5.17: Docking Time and End Distance Learning Effects (Exp. I) ....................................................... 81Figure 5.18: Selecting Time and Correct Learning Effects (Exp. II) .............................................................. 81Figure 5.19: Clamping (a) Fingertip Approaches Work Surface; ...................................................................83Figure 5.20: 3D Widget Representation......................................................................................................... 85Figure 5.21: Sliding Task Paddle Layout....................................................................................................... 90Figure 5.22: Sliding Task Signpost ............................................................................................................... 90Figure 5.23: Paddle Layout for the Sliding Task;........................................................................................... 91Figure 5.24: Sliding Task with 3D Widget Representations........................................................................... 92Figure 5.25: Docking Time × Main Effects (Exp. III).................................................................................... 97Figure 5.26: End Distance × Main Effects (Exp. III)..................................................................................... 97Figure 5.27: Composite Preference Value × Main Effects (Exp. III).............................................................. 97

ix
Figure 5.28: Sliding Time × Main Effects (Exp. IV).....................................................................................100Figure 5.29: End Distance × Main Effects (Exp. IV)....................................................................................100Figure 5.30: Composite Preference Value × Main Effects (Exp. IV).............................................................101Figure 5.31: Docking Time and Sliding Time by Treatment (Exp. III & IV) ................................................103Figure 5.32: End Distance by Treatment (Exp. III & IV)..............................................................................104Figure 5.33: Composite Preference Value by Treatment (Exp. III & IV).......................................................105Figure 5.34: Docking Time and Sliding Time Learning Effects (Exp. III & IV) ...........................................109Figure 5.35: End Distance Learning Effects (Exp. III & IV).........................................................................110Figure 5.36: Composite Preference Value Learning Effects (Exp. III & IV)..................................................110

x
List of Tables
Table 1.1: Table of Definitions........................................................................................................................ 2Table 3.1: The Media Taxonomy (from [Hell95]).......................................................................................... 24Table 3.2: Hand Motion Taxonomy (from [Stur89])...................................................................................... 25Table 3.3: Parameter Manipulation Types ..................................................................................................... 33Table 3.4: Taxonomy Placement for Sample Techniques............................................................................... 37Table 5.1: Hypotheses for Experiments I & II................................................................................................ 58Table 5.2: 2 × 2 Design ................................................................................................................................. 59Table 5.3: Trial and Treatment Orderings (Exp. I & II)................................................................................. 62Table 5.4: Task, Trial, and Treatment Orderings........................................................................................... 65Table 5.5: Performance and Subjective Measures for Experiments I & II....................................................... 70Table 5.6: 2 × 2 Factorial MANOVA for Experiments I & II......................................................................... 70Table 5.7: 2 × 2 Factorial ANOVA of Subjective Measures for Experiments I & II........................................ 72Table 5.8: 2 × 2 Factorial ANOVA of Performance Measures for Experiment I............................................. 74Table 5.9: 2 × 2 Factorial ANOVA of Performance Measures for Experiment II............................................ 75Table 5.10: Homogeneous Means for Treatment Docking Time (Exp. I)........................................................ 76Table 5.11: Homogeneous Means for Treatment Selecting Time (Exp. II)..................................................... 76Table 5.12: Homogeneous Means for Treatment End Distance (Exp. I)......................................................... 77Table 5.13: Homogeneous Means for Treatment Correct (Exp. II)................................................................. 77Table 5.14: Homogeneous Means for Treatment Composite Preference Value (Exp. I & II)........................... 78Table 5.15: Hypothesis Table for Experiments I & II..................................................................................... 79Table 5.16: Homogeneous Means for Docking Time (Exp. I)........................................................................ 81Table 5.17: Homogeneous Means for Selecting Time (Exp. II)...................................................................... 82Table 5.18: Hypotheses for Experiments III & IV.......................................................................................... 86Table 5.19: 2 × 3 Design ............................................................................................................................... 87Table 5.20: Trial and Treatment Orderings (Exp. III & IV)........................................................................... 89Table 5.21: Performance and Subjective Measures for Experiments III & IV................................................. 95Table 5.22: 2 × 3 Factorial MANOVA for Experiments III & IV................................................................... 96Table 5.23: 2 × 3 Factorial ANOVA of Performance and Subjective Measures for Experiment III................. 99Table 5.24: 2 × 3 Factorial ANOVA of Performance and Subjective Measures for Experiment IV................102Table 5.25: Homogeneous Means for Treatment Docking Time (Exp. III)....................................................103Table 5.26: Homogeneous Means for Treatment Sliding Time (Exp. IV)......................................................104Table 5.27: Homogeneous Means for Treatment End Distance (Exp. III)......................................................104Table 5.28: Homogeneous Means for Treatment End Distance (Exp. IV).....................................................105Table 5.29: Homogeneous Means for Treatment Composite Preference Value (Exp. III)...............................105Table 5.30: Homogeneous Means for Treatment Composite Preference Value (Exp. IV)..............................106Table 5.31: Factorial ANOVA of Surface Type for.......................................................................................106Table 5.32: Hypothesis Table for Experiments III & IV................................................................................108Table 5.33: Homogeneous Means for Docking Time (Exp. III).....................................................................109Table 5.34: Homogeneous Means for Sliding Time (Exp. IV).......................................................................109
1
1 Introduction
1.1 General Overview
This dissertation deals with the use of two-dimensional interfaces in three-dimensional virtual
environments. Following the initial excitement and hype about how Virtual Reality (VR) was
going to radically change the way people interact with computers, and each other, researchers
have now started to engage in rigorous investigation into the nature of this interaction in VR.
User interface designers in particular have been attempting to locate new techniques. Given
what we have learned over the past few decades about Human-Computer Interaction (HCI) in
a basically 2D domain, how can we best apply this knowledge to the design of user interfaces
in these new 3D worlds? How can we make the transition from 2D to 3D as painless as
possible for users?
One type of manipulation that has become routine in 2D worlds, but that has proven difficult
in 3D worlds, is that of accomplishing precise movements requiring exact motor control.
Traditional CAD/CAM applications typically use a tabletop pointing device, such as a mouse,
puck, or stylus, to allow the user to make precise manipulations of the design objects. Because
these devices receive support from the surface upon which they are moving, the user’s hand is
steadied, and therefore capable of performing quite exact movements.
In 3D spaces, the interactions typically employed are more freeform, with the user pointing a
finger, or some other pointing device [Henr91], to perform actions on objects in the world.
These interaction techniques are prone to errors, limiting the precision that the user can rely
on for object manipulation.
The research described here organizes current VR interfaces into a coherent framework, and
explores new approaches for providing immersive VR users with precision that is sufficiently
high as to allow them to perform necessary tasks adequately and conveniently. First, a
common set of definitions for major terms within the field of VR research will be provided,
followed by a concise statement of the problem addressed in this dissertation.
2
1.2 Definitions
This research draws on previous work done by researchers and practitioners in a diverse set of
fields, such as computer graphics, simulation, Human-Computer Interaction (HCI),
psychology, and physiology. Unfortunately, most fields of study create their own terminology
to describe key concepts. In order to combine ideas from multiple disciplines, it is necessary to
agree on the meaning of shared terms. Also, though a fair amount of work has been done to
create user interfaces for VEs, the field is still very young and ill-defined. Many researchers
within the field use different terms for the same thing, or use the same term for different
things. The following is a list of terms, along with a description of how they are used in this
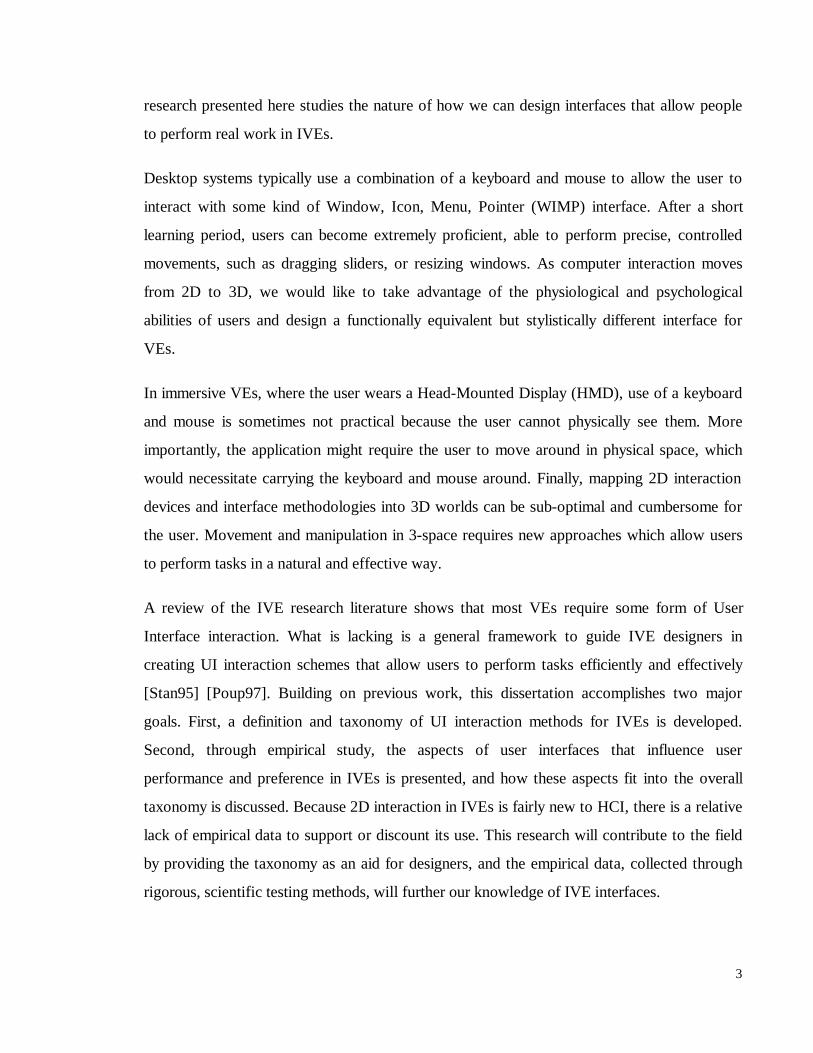
dissertation. In Table 1.1, an attempt has been made to adopt the most common definitions for
most cases, but new ones have been forwarded where appropriate.
Term DefinitionThe Senses Visual (see), Auditory (hear), Olfactory (smell), Haptic (touch), Gustatory
(taste), Proprioceptive (musculature/kinesthetic).Virtual Reality (VR) Fooling the senses into believing they are experiencing something that they
are not actually experiencing.Augmented Reality (AR) The combination of real and virtual stimulation increasing the fidelity of
the experience.Virtual Environment (VE) An interactive VR or AR world experienced by users which is produced
using a combination of hardware, software, and/or peripheral devices.Immersive VE (IVE) A VE that a user interacts with using devices that block out all elements of
the real world that are not part of the experience.User Interface (UI) The part of a VE system which allows the user to affect change on objects
in the VE or on the VE itself.Avatar An object in a VE that is used to represent a real-world object.
Table 1.1: Table of Definitions
1.3 Problem Statement
The growth in use of VEs has presented researchers with new challenges for providing
effective user interfaces. There have been some attempts at applying 2D interface techniques,
initially developed for desktop systems, to 3D worlds. Two-dimensional approaches are
attractive because of their proven acceptance and wide-spread use on the desktop. With
current methods of using 2D techniques in VEs, however, it is difficult for users of 3D worlds
to perform precise movements, such as dragging sliders, unless haptic feedback is present. The
3
research presented here studies the nature of how we can design interfaces that allow people
to perform real work in IVEs.
Desktop systems typically use a combination of a keyboard and mouse to allow the user to
interact with some kind of Window, Icon, Menu, Pointer (WIMP) interface. After a short
learning period, users can become extremely proficient, able to perform precise, controlled
movements, such as dragging sliders, or resizing windows. As computer interaction moves
from 2D to 3D, we would like to take advantage of the physiological and psychological
abilities of users and design a functionally equivalent but stylistically different interface for
VEs.
In immersive VEs, where the user wears a Head-Mounted Display (HMD), use of a keyboard
and mouse is sometimes not practical because the user cannot physically see them. More
importantly, the application might require the user to move around in physical space, which
would necessitate carrying the keyboard and mouse around. Finally, mapping 2D interaction
devices and interface methodologies into 3D worlds can be sub-optimal and cumbersome for
the user. Movement and manipulation in 3-space requires new approaches which allow users
to perform tasks in a natural and effective way.
A review of the IVE research literature shows that most VEs require some form of User
Interface interaction. What is lacking is a general framework to guide IVE designers in
creating UI interaction schemes that allow users to perform tasks efficiently and effectively
[Stan95] [Poup97]. Building on previous work, this dissertation accomplishes two major
goals. First, a definition and taxonomy of UI interaction methods for IVEs is developed.
Second, through empirical study, the aspects of user interfaces that influence user
performance and preference in IVEs is presented, and how these aspects fit into the overall
taxonomy is discussed. Because 2D interaction in IVEs is fairly new to HCI, there is a relative
lack of empirical data to support or discount its use. This research will contribute to the field
by providing the taxonomy as an aid for designers, and the empirical data, collected through
rigorous, scientific testing methods, will further our knowledge of IVE interfaces.
4
1.4 A Word About The Senses
The one aspect of VE research that most differentiates it from other areas of computer science
is the very tightly-coupled relationship between action and reaction. Indeed, the very basis of
VEs is the (almost) instantaneous feedback that these systems must provide, in order for the
experience to be "believable." This response applies to all sensory channels currently being
stimulated. Delays in response to user movement will quickly destroy the illusion of
immersion, and can even cause disorientation or motion sickness.
This high degree of interaction, however, comes at a price. In the field of computer graphics,
there have always been two camps of researchers: those seeking to improve image quality,
with little regard for rendering time, and those concerned with guaranteeing interactive frame
rates, at the cost of image quality [Broo88]. For VEs, both quality and speed are important.
Either poor image quality or image display lag can destroy the feeling of immersion.
Therefore, VE research must focus on ways of improving both; speeding rendering time, while
maintaining high image quality.
The approach has been a combination of increasing the processing power of the hardware
[Akel93] while studying ways to reduce the complexity of scenes, in order to reduce the
number of polygons which need to be rendered [Funk93]. Some research has also focused on
the nature of the environment being simulated, in order to optimize for that specific type of
environment, such as architectural building walkthroughs [Tell91]. This two-front approach
has provided fairly good results, and much work is still being done using these methods.
For the most part, it is still the visual sense that has received the most attention. Some work
has been done on fooling the other senses. The aural sense has received the most attention
from researchers, after visuals. Some researchers have focused on the nature of sounds; in
other words, analytically identifying the components of sounds [Hahn98b]. Others take a more
pragmatic approach, and try to recreate how people hear by using digital signal processing
[Wenz92] [Pope93]. In the area of haptics, some researchers have used robotic arms
[Broo90] [Yama94], force-feedback gloves [Gome95], or master manipulators [Iwat90] to
5
provide force-feedback systems. Recently, the area of passive haptics has gained more
attention [Hinc94a] [Shal98] [Fitz95]. The proprioceptive sense has also recently received
some attention [Mine97a]. The senses of smell and taste have received less attention, because
of their inherently intrusive nature.
In each one of these cases, the researchers involved have concluded that it is not enough to
address only one of the senses; that to give a deeper sense of immersion, multiple senses need
to be stimulated simultaneously. Furthermore, providing more than one type of stimuli allows
researchers to achieve adequate results using lower "resolution" displays. For example, lower-
quality visual images can be combined with haptic feedback to give a similar level of
immersion that might be achieved using only high-quality visuals. This reduces the cost of
rendering, allowing interactive frame rates to be achieved.
There are a number of factors effecting the degree of immersion felt by occupants of VEs. It
has been shown that the fidelity of visual display devices significantly influences perception
in VEs [Nemi94], and that a loss of fidelity degrades performance of tasks in VEs [Liu93].
What it means to provide an "acceptable level" of cues is a major question that has yet to be
answered by the literature. Studies have been conducted comparing wireframe to shaded
images [Kjel95], stereo to monoscopic images [Liu93] [Kjel95], and differing fields of view.
Mostly, it was found that stereo is an important cue, but more work needs to be done to
determine exactly which cues are functionally important for a given task [Nemi94]. In
general, the current resolution of HMDs is insufficient for many tasks [Bric93], though it has
generally been found that the use of HMDs promotes a feeling of presence [Liu93].
Another factor that can detract from a feeling of presence is delay in updating any of the
display devices [Liu93]. Not only does performance degrade, but participants sometimes
experience motion sickness, because what they experience is not what their senses expect.
Along the same lines, if multimodal kinesthetic and sensory feedback cues are given, but do
not correspond in a "natural" way, then presence will degrade [Trau94]. Poor 3D audio cues
can also detract from the feeling of presence felt by the user [Dede96].
6
Much of the literature equates immersion with presence. In fact, there are several types of
immersion, each of which contributes to the overall feeling of presence by the user
[Dede96]. Actional immersion empowers the participant in a VE to initiate actions that have
novel, intriguing consequences. This means that the environment responds in a believable,
reproducible, if not predictable, way to actions performed by the user. For example, in the
physically-correct NewtonWorld [Dede95], pushing on a ball should produce motions that
adhere to the laws of Newtonian physics.
Symbolic immersion triggers powerful semantic associations via the content of a VE. This
means that the user can make sense of the objects populating the VE, as well as their
relationship to each other, and possibly to objects in other, related contexts. To continue with
the NewtonWorld example, if the user takes the position of one of the balls, and understands
that another ball coming towards them will effect them in some way, we can say that the user
is symbolically immersed in the environment.
Finally, sensory immersion involves manipulating human sensory systems to enable the
suspension of disbelief that one is surrounded by a virtual world. This is probably what most
people equate with the term presence, and goes along with the general notion of fooling the
senses into believing they are experiencing something they are not. For the NewtonWorld
example, this means, for example, that any sound in the environment presented to the ears
should be synchronized with visuals presented to the eyes. Each of these types of immersion is
of concern in the current research.
1.5 Original and Significant ContributionsThe main contribution of this dissertation is the systematic study of user interaction techniques
in virtual environments. Many different approaches have been proposed in the literature, but
very few attempts to gather empirical data have been made. Most VE systems are designed
around a particular application, and the interfaces have been chosen mostly using intuition, or
anecdotal feedback. The work in this dissertation steps away from the application-driven VE
interface design approach, and tries to add some order to the design process. Building on
interface design approaches successfully employed in the design of desktop UI techniques, a
7
taxonomy is constructed to organize the different immersive approaches into a framework.
The empirical studies are then used to fill in some of the more underrepresented areas of the
taxonomy.
Two peer-reviewed publications have resulted directly from this dissertation work. In
[Lind99b], the testbed developed for running the empirical studies is described, and in
[Lind99a] results of the first two empirical studies using the testbed are presented.
8
2 Literature Review
This chapter presents a review of the literature pertinent to the study of interaction in IVEs.
Current interaction techniques are presented, and recent physiological work into the use of 2D
windows is described. Finally, the three main aspects of interaction that will be explored
empirically are underscored: bimanual interaction, passive-haptic feedback, and
proprioception.
2.1 Current IVE Interaction Techniques
Some IVE applications have abandoned desktop interface devices for more freeform interface
methods. Glove interfaces allow the user to interact with the environment using gestural
commands [Brys91] [Fish86] [Fels95] [Stur89] or menus "floating" in space [Mine97a]
[Brys91] [Fein93] [Cutl97] [Mine97b] [Post96] [vanT97] [Deer96] [Jaco92] [Butt92]. The
latter use either the user's finger or some sort of laser-pointer, combined with a physical
button-click, to manipulate widgets. Using these types of interfaces, however, it is difficult to
perform precise movements, such as dragging a slider to a specified location, or selecting from
a pick list. Part of the difficulty in performing these tasks comes from the fact that the user is
pointing in free space, without the aid of anything to steady the hands [Mine97a].
A further issue with the floating windows interfaces comes from the inherent problems of
mapping a 2D interface into a 3D world. One of the reasons the mouse is so effective, is that it
is a 2D input device used to manipulate 2D (or 2.5D) widgets on a 2D display. Once we move
these widgets to 3-space, the mouse is no longer tractable as an input device. Feiner et al
[Fein93] attempted to solve this problem for Augmented Reality (AR) environments by
modifying an X-Windows server to composite X widgets with a background of real world
images, and using a normal mouse as a locator. This method works well, but is restricted by
the need for a mouse, which constrains user movement to be within arm's reach of the mouse.
Some approaches address the 2D/3D mapping by using a type of virtual "laser pointer"
[Brys91] [Mine97a] [vanT97] [Jaco92]. This type of interface requires either a clutch
(physical button) or a gesture to execute a selection, which require a steady hand.
9
In a slightly different approach, Deering uses hybrid 2D/3D menu widgets organized in a disk
layout [Deer96]. The disk is parallel to the view plane, and the user selects items with a 3-
button, 6-Degree of Freedom (DOF) wand held in the dominant hand of the user. When
invoked, the menu pops up in a fixed position relative to the tip of the wand. With practice,
the user learns where the menu is in relation to the wand tip, so the depth can be learned.
Similarly, Wloka et al use menus that pop-up in the same location relative to a 6-DOF mouse,
then use the mouse buttons to cycle through menu entries [Wlok95] [Sowi94]. These hand-
relative window placement approaches strike a balance between incorporating the advantages
of 2D window interfaces, and providing the necessary freedom for working in 3-space.
Edwards et al [Edwa97] and Angus et al [Angu95] use a similar approach to aid in navigation
tasks. They use a simple 6-DOF mouse to allow maps of the environment to be displayed to
the user in a number of modes. Angus also allows the user to teleport to a given location
simply by touching a point on the map [Angu95].
Each of these methods, however, provides limited user precision because of a lack of physical
support for manipulations. To counter this, some researchers have introduced the use of "pen-
and-tablet" interfaces [Angu96] [Bill97a] [Bowm98a] [Bowm98b] [Szal97] [Fuhr98]. These
approaches register interface windows with a prop held in the non-dominant hand, and allow
the user to interact with them using either a finger, or a stylus held in the dominant hand. One
important aspect of these interfaces is their asymmetric use of the hands.
2.2 The Neurophysiology of Menu Interfaces
Interface techniques can be compared from a physiological point of view. This work can be
broken down into studies that have looked at purely two-dimensional interaction, and those
that have looked at three-dimensional approaches.
2.2.1 Interaction in 2D spacesFitts explored the area of one-handed pointing tasks [Fitt54]. Kabbash et al describe Fitts'
work as formulating the time required to articulate the necessary actions in simple, serial

10
motor tasks [Kabb94]. Fitts derived, and empirically supported, a general formula for
computing the index of performance for tasks involving the motor control of different limbs.
His formula reads:
It
W
Apa= −
1
22log bits / sec.
Where Ip is the index of performance of a tapping action taking time t, for a target of width Wa
and an amplitude range A. "The basic rationale is that the minimum amount of information
required to produce a movement having a particular average amplitude plus or minus a
specified tolerance (variable error) is proportional to the logarithm of the ratio of the tolerance
to the possible amplitude range" [Fitt54]. He found, using results from his empirical studies,
that the arm may have a lower information capacity (i.e. lower-resolution of motion) than the
hand, and much lower than the fingers working in concert.
Building on the work started by Fitts, Accot et al devised formulas for path tracing through
simple and complex 2D environments using a stylus-based interface [Acco97]. They rewrite
the original Fitts equation in terms of time T:
T a bA
Wc= + +
log2
This formula predicts that the time T needed to point to a target of width W at a distance A is
logarithmically related to the inverse spatial relative error A
W, where a and b are empirically
determined constants, and c is 0.0, 0.5, or 1.0. The factor log2
A
Wc+
, called the index of
difficulty (ID), describes the difficulty to accomplish the task: the greater ID, the more
difficult the task [Acco97]. Through a series or empirical studies using paths of increasing
difficulty and shape (e.g. curves and spirals), Accot et al determined that a global expression
11
for the time required to navigate a curve is directly related to the sum of the instantaneous IDs
along the curve:
( )T a bds
W sc c= + ∫
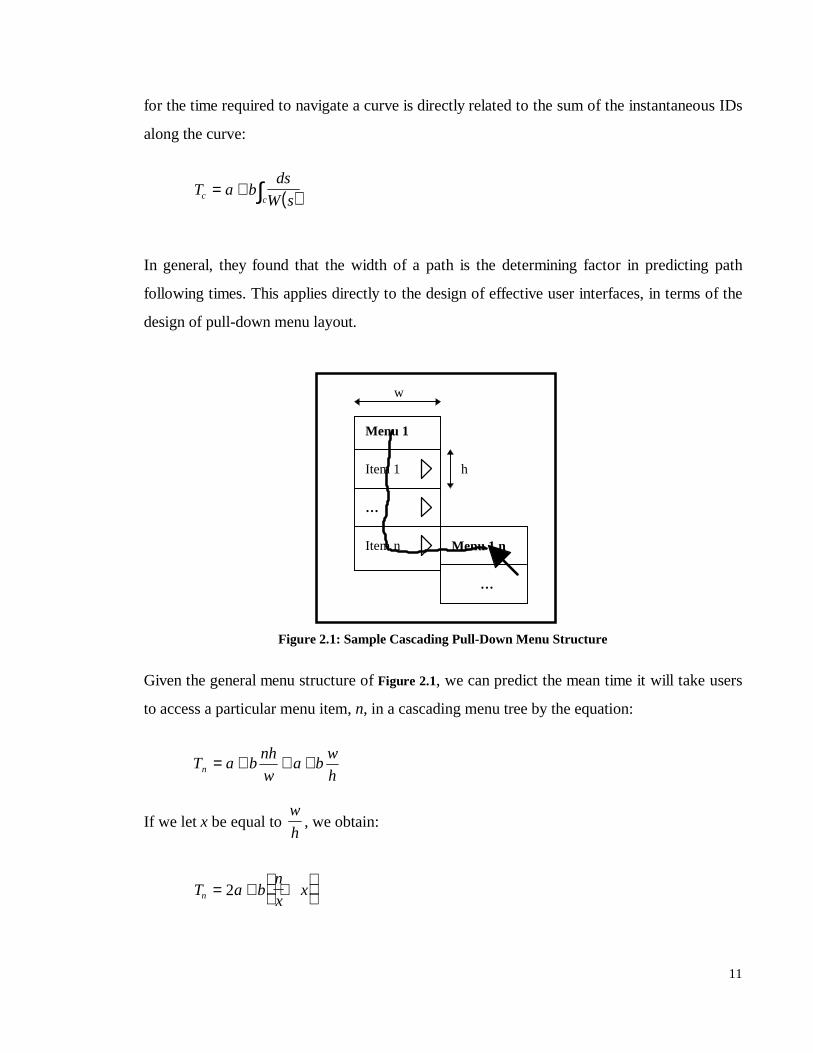
In general, they found that the width of a path is the determining factor in predicting path
following times. This applies directly to the design of effective user interfaces, in terms of the
design of pull-down menu layout.
Figure 2.1: Sample Cascading Pull-Down Menu Structure
Given the general menu structure of Figure 2.1, we can predict the mean time it will take users
to access a particular menu item, n, in a cascading menu tree by the equation:
h
wba
w
nhbaTn +++=
If we let x be equal to w
h, we obtain:
T a bn
xxn = + +
2
Menu 1
Item 1
…
Item n Menu 1.n
…
h
w
12
This work is useful when designing menu structures based on access time for one-handed
tasks.
We can see from range of motion data of the human body [Laub78] that the elbow, wrist, and
finger joints all provide a level of dexterity that is probably underused in current, mouse-based
interfaces. Using physical "splints" to restrict undesired motions, Balakrishnan et al collected
empirical data comparing input control of the finger, wrist, and forearm, and of a stylus
[Bala97]. They used a Fitts' Law test, with targets arranged along the horizontal axis, and
devices that restricted movement to only a single limb segment (except for the stylus
treatment). Similar to the other researchers, they found the use of a stylus to be the fastest of
all the treatment groups they tested, followed by the forearm, wrist, and finger. The finger
performed worst mainly because only one finger was used. When the thumb and index finger
were allowed to work in concert (stylus), the results were the best. From this we can
conjecture that allowing the user to manipulate input devices using more muscle groups will
increase performance.
2.2.2 Interaction in 3D spacesThe previous research focused on 2D tasks. Interaction in a 3D world might require the user
to engage different muscle groups than manipulations in 2D. Zhai et al compared different
muscle groups in a 6-DOF docking task [Zhai96]. Subjects used either a buttonball interface
(a ball with a clutch) or a glove with a palm-mounted clutch to rotate and position 3D shapes
in a desktop VR system. Both the buttonball and the glove used 6-DOF trackers to monitor
position and orientation. Their results show that input devices and techniques that incorporate
manipulation by the fingers allow subjects to perform 6-DOF docking tasks faster than those
that only involve the large muscle groups, such as the wrist, elbow, and shoulder.
Frohlich reports on a study comparing coordinated bimanual interaction using control knobs
for controlling 2D drawing tasks [Froh88] (similar to an "Etch-a-Sketch"). The tasks were
symmetric, with both hands being required to perform the same movements at the same time.
He reported the need for constraining the degrees of freedom of each hand until the user has
13
had time to reason about what results each action, and combination of actions, has in terms of
input control. This points out the ability of users to learn how to use their hands in
coordinated effort for tasks requiring very high precision.
Fitzmaurice et al looked at using special, versus general-purpose, input devices for bimanual
input tasks, as well as the notion of time- versus space-multiplexed input [Fitz97]. They had
subjects perform 2D target position and orientation tracking tasks using general physical
tools, or specialized physical tools which closely resembled their graphical representations.
Also, they compared whether users could switch between physical devices (space-
multiplexing) or virtual devices (time-multiplexing) faster. They found that a combination of
space-multiplexed, specialized physical devices allowed users to perform the tasks fastest.
Ayers et al proposed a similar idea using reconfigurable blocks, knobs, and dials [Ayer96].
These interfaces support the choice of specialized, passive-haptic devices, instead of general
devices, such as the mouse.
2.3 Unimanual Interfaces
Fukumoto et al [Fuku97] introduce a unimanual, wireless, chorded keyboard interface, freeing
the user from the traditional keyboard. Their "FingeRing" system uses a set of five ring-shaped
transmitters, one at the base of each finger, that measure the acceleration of the fingers, in
order to detect when a finger taps a surface. Using combinations of finger taps, both in
parallel and in serial, they define a set of chords that the user taps out, with each chord being
mapped to a different character or macro command. In this way, the user can tap on almost
any surface (e.g. a desk or forearm), and communicate with the computer.
Bass et al report on work they have been doing designing a wearable computer with a
unimanual interface [Bass97]. Since this device was designed for a specific data-collection
task, it uses a specialized controller. The user views a 2D screen, and selects from items
arranged in a circle by turning a single control knob on the belt-mounted computer. The knob
is roughly triangular, and has a divot at one corner to allow the user to orient the hand
without actually looking at the knob.
14
Mapes et al define CordGloves, where touching the fingertips of one hand together (e.g. index
finger and thumb), or the fingertips with the palm, produces chords that are mapped to input
macros [Mape95a]. Furthermore, using two such gloves, inter-hand contacts can also be used
to trigger events. This interface provided both one- and two-handed interaction methods. It
was found that most users tended to use two-handed interaction techniques, though only six
subjects were involved in the study.
Wloka et al have developed a multipurpose instrument [Wlok95], based on the Tricorder from
Star Trek [Rodd66]. The user holds a 6-DOF mouse in the dominant hand, and an avatar of
the object mimics the 6-DOF motions of the mouse. Since the two objects are registered, the
user can utilize the proprioceptive sense to aid in manipulation. This Virtual Tricorder can be
put into several modes, simulating different tools, such as a magnifying glass. In this way, it is
a general tool, rather than being designed to work in a prespecified manner.
Gobbetti et al describe an architecture for defining and using virtual interaction tools in VEs
[Gobb93]. These tools are dynamically bound to objects in the VE, and are manipulated using
one-handed interaction handles. Because the tools can be bound and unbound to virtual
objects dynamically, a single tool set is used for interacting with many virtual objects.
2.4 Bimanual Interfaces
A number of interface designers have adopted the notion of providing tools which allow the
user to use both hands for HCI. Some of the systems utilize the hands in a symmetrical
fashion, while others have the hands working in concert to perform coordinated actions.
2.4.1 Symmetrical Interaction
Some researchers have explored the idea of simply adding a second mouse for use by the non-
dominant hand. Chatty identifies three types of two-handed interaction for multiple-mouse-
based interfaces [Chat94]. Independent interaction is where either mouse may be used to
execute any given action, such as acknowledging an error message. Parallel interaction is
where one mouse performs an action while the other performs a different action. Dragging
15
two separate files to the waste basket would be an example of this. Coordinated interaction is
where both hands work together to perform a compound action. A two-handed scaling action,
where each mouse controls handles on opposite corners of a control box, would be a typical
example of this.
Bolt et al describe a hybrid approach, where verbal commands are supplemented with hand
gestures [Bolt92]. These co-verbal gestures are typically used for gross movements, such as
rotation. For instance, the user might say "Rotate," while looking at an object, and move their
hands like a bus driver making a turn (i.e. hand-over-hand), which would rotate the object
about the view vector.
Cutler et al have implemented both unimanual and bimanual tools for interacting with VEs
[Cutl97]. The one-handed techniques are typically used to wield a virtual tool, such as a
cutting plane. The two-handed tools are designed for more gross object manipulation tasks,
such as object translation, rotation, or zooming. Both symmetric and asymmetric actions are
utilized, based on the nature of the desired action. For instance, a rotational axis might be
specified with one hand, while the angle of rotation is specified with the other hand.
2.4.2 The Asymmetry of the Hands
Current physiology and psychology literature has advocated a move away from the traditional
view that people are either right or left handed [Guia87]. Instead, Guiard observed that most
tasks we do are accomplished using two hands, but that each hand performs a different role.
In discussing two hands as a kinematic chain, Guiard describes several relationships between
the hands with regard to coordinated action [Guia88]. First, the role of the non-dominant
hand (ND) is not only to provide stability to the object acted upon by the dominant hand (D),
but also to provide a reference frame for work done by D. Second, ND has a much coarser
resolution of motion than D, and D can, therefore, successfully carryout actions requiring
more precision. Third, ND actions have temporal precedence over D actions; the frame of
reference must be set (ND) before precise actions are undertaken (D).
16
His studies have shown that even the task most closely associated with handedness, writing, is
actually composed of the two hands working in concert [Guia87]. When writing, the dominant
hand is used to perform the task of creating the words on the page, while the non-dominant
hand provides a frame-of-reference for the dominant hand to work in, as well as holding the
paper flat. The dominant hand is performing a precision task, while the non-dominant hand
performs a gross task.
Goble et al use two hands in an asymmetric fashion, and allow the non-dominant hand to
provide a frame of reference for exploring volumetric medical data [Gobl95]. The dominant
hand is then used to wield either a stylus, for trajectory planning, or a Plexiglas plate for
controlling a cutting plane for inspection of interior structure. They report rapid mastery of
the interface by novice computer users, and wide acceptance by medical domain experts
[Hinc94a] [Hinc97a].
In a related study, Hinckley et al looked at user performance on precision tasks requiring
asymmetric coordination of the hands [Hinc97b]. In a 2 × 3 × 2 × 2 design, they compared a
stylus versus a plate tool, a cube versus a puck versus a triangular solid docking shape, a
simple versus a hard task, and a preferred versus a reversed grip. Among their findings, using
the preferred grip, the users were significantly faster, and correctly positioning the stylus
versus the plate was significantly faster. They hypothesize that this is due to the additional
degree of freedom alignment required to correctly dock the plate.
In a direct comparison of bimanual and unimanual compound pointing tasks, Kabbash et al
had subjects perform tasks using four different types of interaction: one unimanual, one
symmetric bimanual, and two asymmetric bimanual [Kabb94]. Their study had users perform a
connect-the-dots task, requiring each subject to select the color of the line from a palette. It
was found that the asymmetric bimanual group scored significantly better in terms of mean
task completion time than the other groups. Furthermore, the researchers found that the use of
two hands did not show any additional cognitive load on the users. Finally, they caution that
simply requiring the use of two hands in an interface will not always speed interaction.
17
Specifically, if the hands are assigned independent tasks, users will work slower, because of
increased cognitive load and motor control requirements.
Angus et al present a system whereby 2D interaction techniques are embedded in 3D worlds
using a paddle [Angu95], similar to the approach presented in this dissertation. They place the
2D interaction surface on the surface of a virtual paddle, and allow the user to interact with it
using the index finger or a stylus. The authors suggest registering the virtual paddle with a
clipboard, but do not report investigating the usability of this approach.
Pausch et al describe a simple, but elegant, view-orientation control mechanism involving
asymmetric use of the hands [Paus97]. The user holds a gun-like instrument in the non-
dominant hand, and with the dominant hand, adjusts the camera yaw by rotating it about the
handle, and the camera pitch by tilting it forward or back (roll is held constant).
Zeleznik et al report on a system using two-mice in an asymmetric fashion to control 3D
objects in a desktop VR system [Zele97]. The non-dominant hand is used to anchor rotational
actions, and to perform translation movements. The system does not seem to make a clear
distinction between the functions of the individual hands, and, therefore, suffers in terms of
usability. They postulate that choosing mappings of degrees of freedom to cursor movement
that have physical analogues would enhance user performance and reduce confusion.
Bier et al describe a taxonomy for interacting with bimanual tools, where one of the tools is a
transparent "sheet" called a toolglass [Bier94]. The toolglass resides on a layer between the
cursor and the underlying application. The user clicks through tools that are arranged on the
toolglass palette, triggering actions made up of (possibly) complex events, such as selecting
and positioning a shape in a drawing application. This type of interface was seen as very
natural for artistic applications.
In related research, Kurtenbach et al also used an asymmetric bimanual interface based on a
tablet, two-hands, and transparency [Kurt97]. They implemented a drawing package which
positioned the drawing tools on a semi-opaque palette whose position was controlled by the
non-dominant hand. The dominant hand then selected tools or attributes from the palette, and
18
applied them directly to the underlying drawing area. The palette was controlled using a puck,
while drawing and selecting was controlled by a stylus in the dominant hand. The researchers
found that the ease of use of the interface allowed artists to concentrate on content, rather
than on the computer interface.
Sachs et al describe the 3-Draw system, which is a bimanual interaction technique for
CAD/CAM design [Sach91]. They attached a 6-DOF sensor to a palette, held in the non-
dominant hand, and allowed the user to draw 2D curves on the palette. The user could also
join curves together to form 3D shapes. The viewpoint was controlled by orienting the palette.
This technique was later used in the Worlds in Miniature approach [Stoa95]. 3-Draw also
took advantage of passive-haptic feedback support for precision drawing, as well as the
proprioceptive sense because of the proximity of the hands to each other.
In recent work, Mine et al study the use of proprioception as it effects user performance in
bimanual interfaces in IVEs [Mine97a]. They state some important reasons why VEs have not
(for the most part) gotten out of the laboratory:
1. Precise manipulation of virtual objects is hard. Beyond the gross positional, rotational,and scaling abilities, VE interfaces lack:
• Haptic Feedback• Easy Tool Selection Capabilities• Robust Voice Command Input• Real Measuring Tools• Easy Alphanumeric Input Capabilities
2. There is no unifying framework for what interaction should look, feel, and sound like.
To solve these problems, the authors suggest incorporating the "built-in" proprioceptive sense
into IVE interface design. They use a modified Go-Go interaction technique [Poup96] to
allow the user to carryout manipulation actions using motions relative to the body. A hand
movement is interpreted in relation to other parts of the body, instead of in relation to objects
or the virtual world. They describe a number of actions, such as grabbing, zooming, and
accessing menus, that involve movements of the hands in relation to the body. This work is
intuitive because it balances direct and indirect manipulation. Finally, the authors suggest
19
using passive-haptics as a way of interacting with virtual menus. This is a method similar to
the research described in this dissertation.
2.5 Haptic Interfaces
Haptic interfaces provide stimuli to the receptors serving the sense of touch. In general, haptic
interface devices can be broken down into several groups. The main distinction can be made
between active and passive devices.
2.5.1 Active-Haptic Interfaces
Active-haptic devices use a computer to produce the output stimuli fed to the user, through
some electric, electronic, or mechanical hardware. This type of haptic feedback is the most
well known. Typically, active haptic feedback devices are force reflecting linkages (arms),
which have sensors to measure the position of the end-effector, and motors to apply torque at
each of the joints of the arm [Sens93]. There are a number of devices that have been
developed for input from, and force-feedback output to, the human hand through some sort of
glove [Burd94] [Broo90] [Iwat90] [Gome95] [Elli91] or through a hand-held force-feedback
stylus [Yama93] [Thom97].
In terms of desktop devices, some researchers have outfitted traditional mice with some tactile
feedback capabilities [Akam94a] [Akam94b] which prick the user's finger when a widget
boundary is crossed. Some devices have built-in feedback [Zhai93b], by providing tension
when the device is moved from its "home" position. Special-purpose devices provide feedback
specific to a given application. Surgical simulator feedback devices are the most common
example of these [Hahn98a].
2.5.2 Passive-Haptic Interfaces
Passive-haptic "devices" are physical objects which provide feedback to the user simply by
their shape, texture, or other inherent properties. In contrast to active-haptic feedback
systems, the feedback provided by passive-haptic feedback devices is not controlled by a
20
computer. These objects can be either rigid or deformable. Hinckley et al [Hinc94a]
introduced the use of passive-haptic "props" as interaction devices, and report rapid mastery
of the interface. Their system was designed for the visualization of neurosurgical volumetric
data. The user holds a dolls head in their non-dominant hand, and a small, rectangular piece of
Plexiglas in their dominant hand. Both objects are tracked, and their positions and orientations
are reported to the computer, which updates the visual display accordingly. The doll's head is
used to control the orientation of the volumetric dataset on the display, and the Plexiglas is
used to control a cutting plane through the data. This allows the user to easily and intuitively
explore the dataset.
Fitzmaurice et al [Fitz95] use cube-like "bricks" to provide users with anchors for
manipulating 2D interaction handles. The bricks rest on a surface, and their positions and
orientations are monitored. As an interaction example, a brick might be used to reposition an
object simply by sliding it to a new position on the surface. Multiple bricks can be used as
scaling handles, representing opposite corners of a bounding square. The user can scale the
object by sliding one brick away from the other. Finally, multiple bricks could be used as
control points for a spline. The brick interface is intuitive, but is limited to movements in 2D.
The passive-haptic feedback provided by this system does, however, allow the user to make
very precise movements.
Stoakley et al provide users with a tablet, held in the non-dominant hand, and a buttonball for
the dominant hand [Stoa95]. With this IVE interface, the tablet represents a miniature version
of the IVE, and the user can rotate and translate it about freely. Each object in the IVE is
represented by a miniature object in the miniature IVE, similar to a diorama. Using the
buttonball, the user can select and manipulate these miniatures, and thereby manipulate the
large objects they represent. This approach provides rapid placement and orientation of
objects within the IVE. Beyond these gross movements, this system is limited in its ability to
perform other actions.
21
2.6 ProprioceptionRecent work by Mine et al uses body-relative motions as an interaction technique, which takes
advantage of the proprioceptive sense [Mine97a]. People have the ability to gauge movements
of their hands relative to their own bodies. They describe three types of motion:
Direct Manipulation allows (possibly distant) objects to be manipulated as though
they were in the user's hands. The technique automatically scales the world down to
bring the grabbed object within the normal range of the hands. Manipulation then takes
place in the familiar space of the user's own body. Releasing the object automatically
returns the world to its former size.
Physical Mnemonics are 3D body-relative widgets. The researchers describe a pull-
down menu which "hides" directly out of view above the user's head, and is accessed
using a gesture. Another example is a scaling widget that allows the hands to work in
concert to scale an object by moving the hands apart.
Gesture Commands are recognized by the system as having a specific meaning, such
as the "over-the-shoulder deletion" gesture. To delete an object, the user simply
throws it over their shoulder.
This approach shows the possibilities of working within arm's reach, and supports the notion
of combining direct and indirect manipulation into a single framework. Mine et al, however,
point out that one of the major problems with current IVE interaction techniques is the lack of
haptic feedback for precise movements.
The research presented in this dissertation builds on these principles, and derives a more
general approach to the use of passive haptics for 2D interaction. The use of passive haptics in
IVEs has great potential, because of the low-cost, wide availability, flexibility, and intuitive
use.
22
3 Virtual Environment Taxonomies
As with many emerging computer technologies, virtual reality is ill-defined, over-hyped, and
generally misunderstood. A comprehensive look at different ways of applying the technology,
accompanied by a means of classifying the different effects of the many sensory stimuli,
interaction techniques, and possible application areas, would help add some order to the
confusion. We need to shape the wild possibilities of VR into a coherent form, in order to
extract order from the chaos, by cleaving the set of possible systems into a small number of
disjoint sets [Robi92]. A common vehicle for doing this in research is a taxonomy. Because of
the interdisciplinary nature of VEs, taxonomies from separate, but related, fields will be
described here.
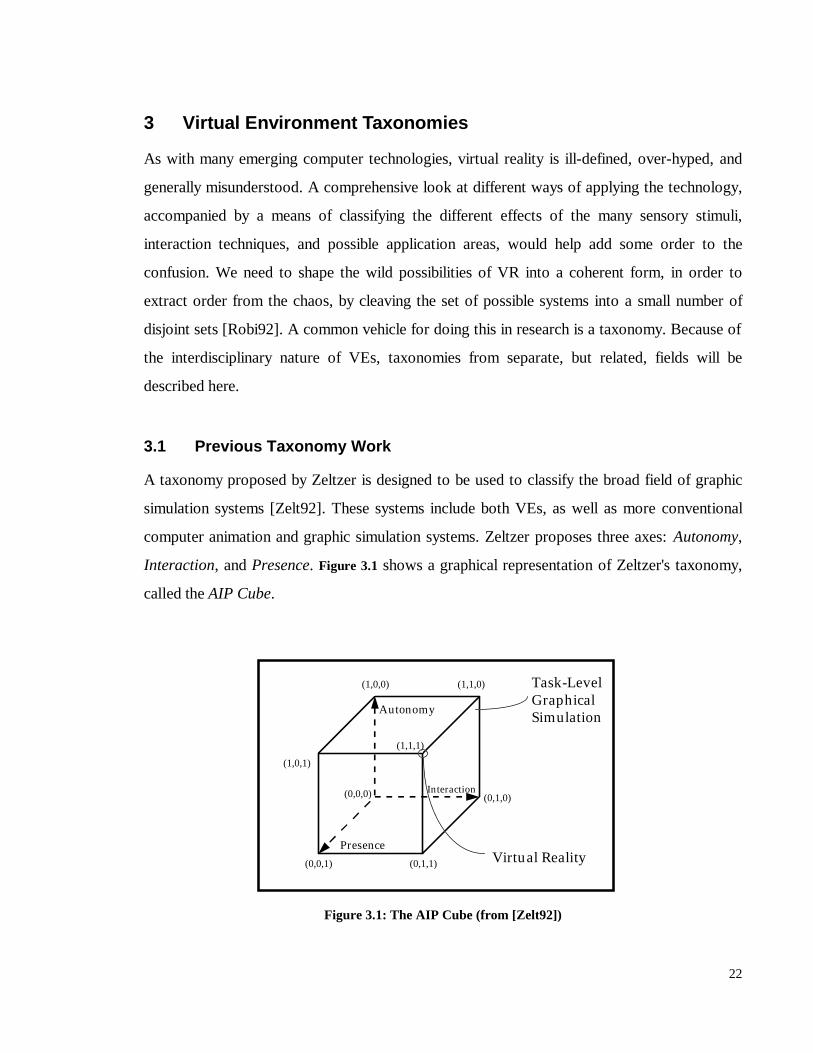
3.1 Previous Taxonomy Work
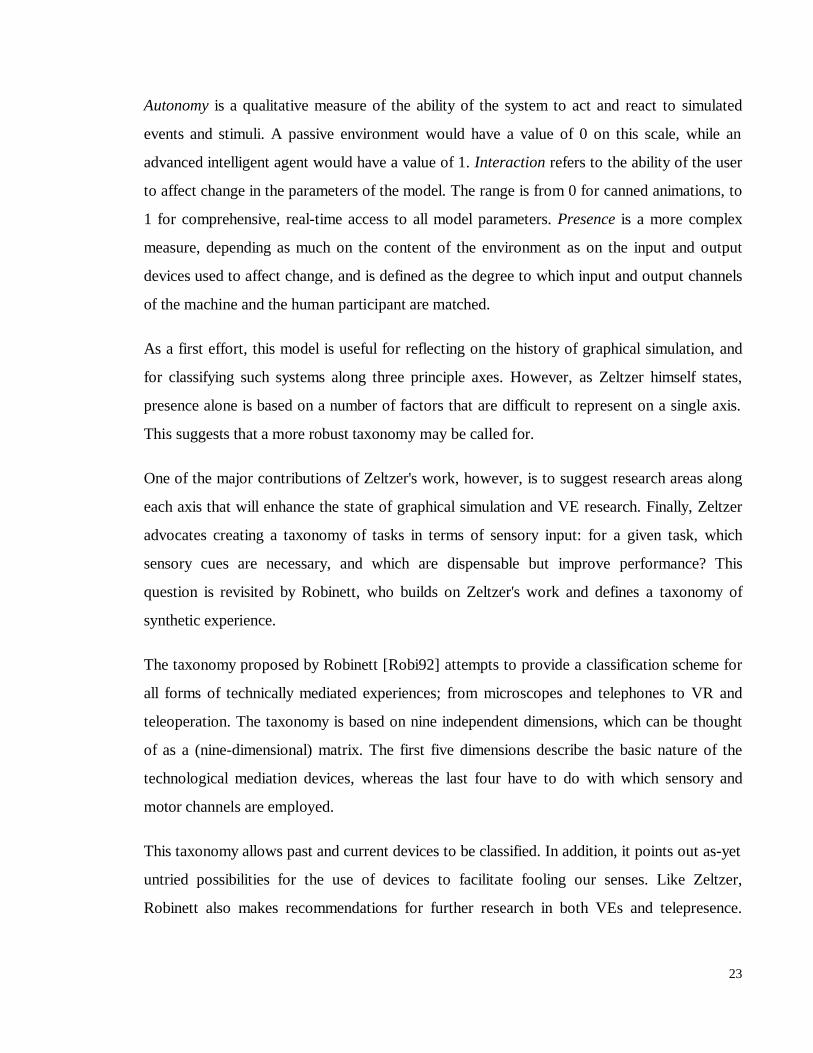
A taxonomy proposed by Zeltzer is designed to be used to classify the broad field of graphic
simulation systems [Zelt92]. These systems include both VEs, as well as more conventional
computer animation and graphic simulation systems. Zeltzer proposes three axes: Autonomy,
Interaction, and Presence. Figure 3.1 shows a graphical representation of Zeltzer's taxonomy,
called the AIP Cube.
(0,0,0)
(1,0,0) (1,1,0)
(0,1,0)
(0,1,1)(0,0,1)
(1,0,1)
(1,1,1)
Autonomy
Interaction
PresenceVirtual Reality
Task-LevelGraphicalSimulation
Figure 3.1: The AIP Cube (from [Zelt92])
23
Autonomy is a qualitative measure of the ability of the system to act and react to simulated
events and stimuli. A passive environment would have a value of 0 on this scale, while an
advanced intelligent agent would have a value of 1. Interaction refers to the ability of the user
to affect change in the parameters of the model. The range is from 0 for canned animations, to
1 for comprehensive, real-time access to all model parameters. Presence is a more complex
measure, depending as much on the content of the environment as on the input and output
devices used to affect change, and is defined as the degree to which input and output channels
of the machine and the human participant are matched.
As a first effort, this model is useful for reflecting on the history of graphical simulation, and
for classifying such systems along three principle axes. However, as Zeltzer himself states,
presence alone is based on a number of factors that are difficult to represent on a single axis.
This suggests that a more robust taxonomy may be called for.
One of the major contributions of Zeltzer's work, however, is to suggest research areas along
each axis that will enhance the state of graphical simulation and VE research. Finally, Zeltzer
advocates creating a taxonomy of tasks in terms of sensory input: for a given task, which
sensory cues are necessary, and which are dispensable but improve performance? This
question is revisited by Robinett, who builds on Zeltzer's work and defines a taxonomy of
synthetic experience.
The taxonomy proposed by Robinett [Robi92] attempts to provide a classification scheme for
all forms of technically mediated experiences; from microscopes and telephones to VR and
teleoperation. The taxonomy is based on nine independent dimensions, which can be thought
of as a (nine-dimensional) matrix. The first five dimensions describe the basic nature of the
technological mediation devices, whereas the last four have to do with which sensory and
motor channels are employed.
This taxonomy allows past and current devices to be classified. In addition, it points out as-yet
untried possibilities for the use of devices to facilitate fooling our senses. Like Zeltzer,
Robinett also makes recommendations for further research in both VEs and telepresence.
24
Maximum fidelity limitations will present the greatest restrictions to making a virtual
experience behave exactly like a real one [Robi92]. Visuals and sound will probably reach
extremely high fidelity, but the other, more active senses will be more difficult to fool.
Because VEs present multisensory stimuli to users, it would be helpful to find a method of
classifying the different media that can be used to present information.
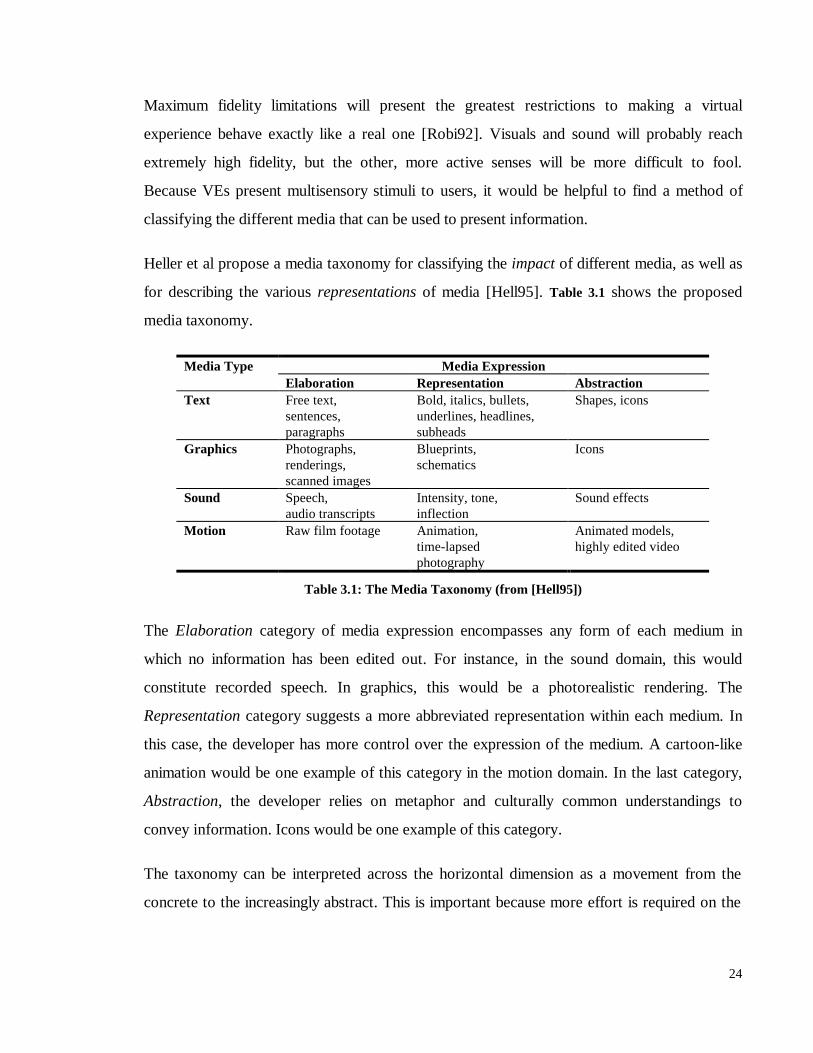
Heller et al propose a media taxonomy for classifying the impact of different media, as well as
for describing the various representations of media [Hell95]. Table 3.1 shows the proposed
media taxonomy.
Media Type Media ExpressionElaboration Representation Abstraction
Text Free text,sentences,paragraphs
Bold, italics, bullets,underlines, headlines,subheads
Shapes, icons
Graphics Photographs,renderings,scanned images
Blueprints,schematics
Icons
Sound Speech,audio transcripts
Intensity, tone,inflection
Sound effects
Motion Raw film footage Animation,time-lapsedphotography
Animated models,highly edited video
Table 3.1: The Media Taxonomy (from [Hell95])
The Elaboration category of media expression encompasses any form of each medium in
which no information has been edited out. For instance, in the sound domain, this would
constitute recorded speech. In graphics, this would be a photorealistic rendering. The
Representation category suggests a more abbreviated representation within each medium. In
this case, the developer has more control over the expression of the medium. A cartoon-like
animation would be one example of this category in the motion domain. In the last category,
Abstraction, the developer relies on metaphor and culturally common understandings to
convey information. Icons would be one example of this category.
The taxonomy can be interpreted across the horizontal dimension as a movement from the
concrete to the increasingly abstract. This is important because more effort is required on the

25
part of the learner to interpret representations towards the right of the taxonomy as it is for
representations on the left. Also, since culture is not universal, care must be taken when using
more abstract media expression.
Though this taxonomy is important for media representation, and certainly provides assistance
to designers of VEs in creating virtual experiences, it is incomplete for use in VE design in
that it does not address all of the senses. This is probably due to its origins in the field of
multimedia software design and evaluation [Hell95]. It would be interesting to know if
analogues exist for elaboration, representation, and abstraction in the haptic, olfactory,
gustatory, and proprioception domains, and how we could apply these to VEs.
Sturman et al present a more specialized taxonomy for hand motions [Stur89]. This taxonomy
is presented in Table 3.2.
Hand Position&
Finger Flex Angles
Orientation Don't Care Motionless Fingers Moving FingersDon't Care × Finger Posture
(button) e.g. fistFinger Gesture
(valuator)Motionless
HandHand Posture(3D Gesture)
Oriented Posturee.g. thumbs-down
Oriented Gesturee.g. bye-bye vs. come
here!MovingHand
Hand Gesture(Continuous 3D
Locator)
Moving Posturee.g. banging fist or a
salute
Moving Gesturee.g. strong come here!
Table 3.2: Hand Motion Taxonomy (from [Stur89])
This taxonomy presents some structure to the hand-based input schemes used in IVEs.
Specifically, almost all direct manipulation techniques used by VE systems can be neatly
placed within this taxonomy. Sturman et al propose the use of hand/finger gesture
combinations mainly for gross movements, such as positioning and orienting objects or the
camera. They also describe the use of finger flex for controlling a valuator (slider). They
observed that finger flex gives more precision than whole hand movement when precision is
required.
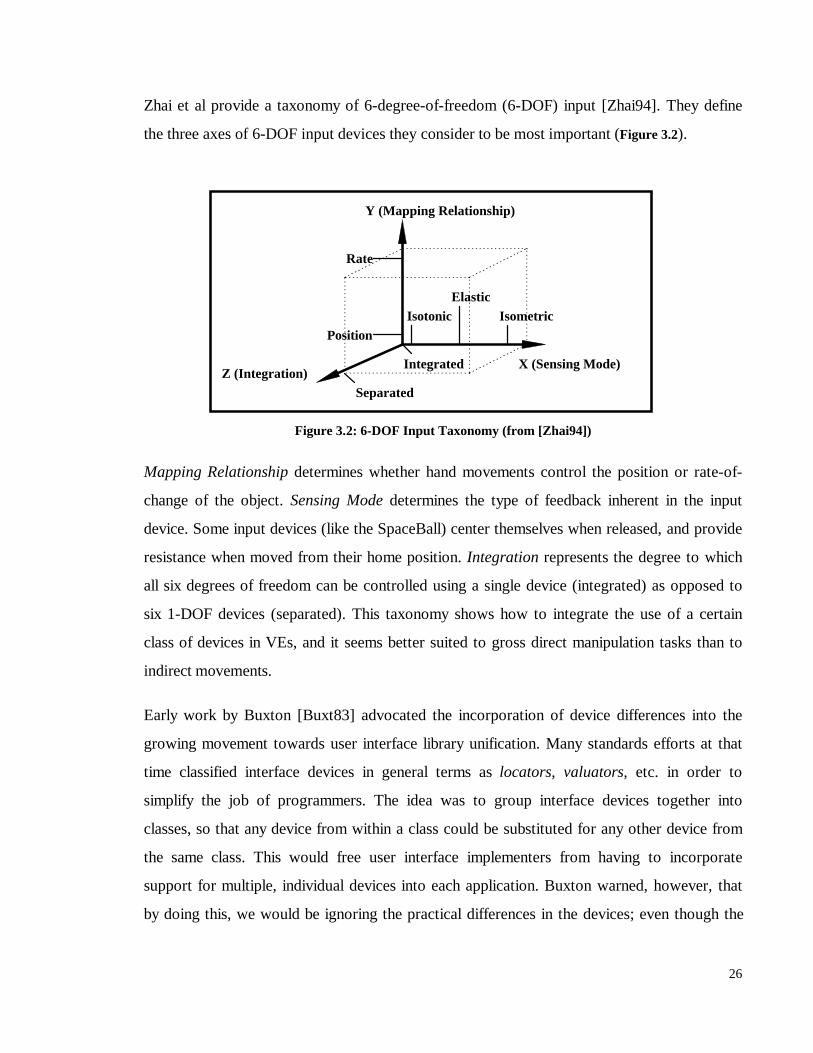
26
Zhai et al provide a taxonomy of 6-degree-of-freedom (6-DOF) input [Zhai94]. They define
the three axes of 6-DOF input devices they consider to be most important (Figure 3.2).
Figure 3.2: 6-DOF Input Taxonomy (from [Zhai94])
Mapping Relationship determines whether hand movements control the position or rate-of-
change of the object. Sensing Mode determines the type of feedback inherent in the input
device. Some input devices (like the SpaceBall) center themselves when released, and provide
resistance when moved from their home position. Integration represents the degree to which
all six degrees of freedom can be controlled using a single device (integrated) as opposed to
six 1-DOF devices (separated). This taxonomy shows how to integrate the use of a certain
class of devices in VEs, and it seems better suited to gross direct manipulation tasks than to
indirect movements.
Early work by Buxton [Buxt83] advocated the incorporation of device differences into the
growing movement towards user interface library unification. Many standards efforts at that
time classified interface devices in general terms as locators, valuators, etc. in order to
simplify the job of programmers. The idea was to group interface devices together into
classes, so that any device from within a class could be substituted for any other device from
the same class. This would free user interface implementers from having to incorporate
support for multiple, individual devices into each application. Buxton warned, however, that
by doing this, we would be ignoring the practical differences in the devices; even though the
Rate
Position
Separated
Integrated
IsometricElastic
Isotonic
Y (Mapping Relationship)
X (Sensing Mode)Z (Integration)
27
software would still work, the user could not perform interface tasks with the same
proficiency. Instead, Buxton introduced a taxonomy of interface devices based on the number
of dimensions the device could specify and the property sensed (i.e. position, motion, or
pressure).
Based in part on Buxton's work, Card et al [Card90] present a classification scheme for input
devices by taking into account UI toolkit specifications, previous input device taxonomies,
and performance studies. They describe the two key ideas in modeling a language of input
device interaction as the description of a primitive movement vocabulary, and a set of
composition operators. They structure this idea into a taxonomy which allows existing devices
to be plotted, as well as defining currently unexplored device configurations. This taxonomy is
attractive because of its theoretical and practical nature. Semantic theories provide the means
by which the design space is generated, while human performance studies provide the means
by which design points in the space can be tested [Card90].
In a survey paper, Hinckley et al formulate design issues for spatial input [Hinc94b]. They
divide the design space into two major groups of issues: those dealing with human perception,
and those dealing with ergonomic concerns. One of their main observations is that users are
good at experiencing 3D spaces, but not so good at understanding them. Providing spatial
cues, multisensory feedback, and physical constraints are some of the approaches they suggest
to aid in understanding. Of the ergonomic issues, they point out the need for combining
techniques for rapid, gross movements with techniques supporting slower, precise
movements. They advocate hybrid interfaces, combining the strengths of each.
Bleser et al [Bles90] describe a relatively complete taxonomy of input devices. Using their
approach, input devices, both physical and virtual, can be defined by four compound
attributes. The Input Domain describes characteristics of the values that can be returned from
the device, such as the degrees of freedom, resolution, and range of values. Data Output is
similar to Input Domain, but reflects any DOF mappings that are performed on the input data
before it is passed to the application. Physical Actions can be thought of as the alphabet that
describes what actions the user can perform with the device. Physical Package describes the
28
physical attributes of the device pertinent to human manipulation of the device, such as grasp,
resistance, and frame of reference. This taxonomy focuses more on devices than techniques,
but does address to some extent different interaction techniques, such as direct versus
symbolic (indirect) manipulation.
3.2 Taxonomy of Direct and Indirect Manipulation Techniques
The manipulation of objects in immersive virtual environments is typically accomplished using
direct manipulation techniques. Indirect techniques (also called symbolic techniques),
however, provide greater control, and for some tasks, may be better suited for IVEs. The term
Direct Manipulation is used in a different sense here than it is most popularly used.
Shneiderman is one of the main proponents of direct manipulation, but his use of the word has
a more historical definition [Shne98]. The move from text-based to windows-based
interaction is what Shneiderman refers to as direct manipulation. In this dissertation, the
directness of an action is determined by how closely movements by the user are mapped to
object movements. Indirect manipulation uses intermediate tools or symbology for
manipulating objects, whereas direct manipulation usually does not.
3.2.1 Direct Manipulation
In terms of direct manipulation, Zhai and his colleagues have done a great deal of work
comparing isotonic (constant resistance, variable position) and isometric (constant position,
variable resistance) devices for the mapping of hand movements to object movements
[Zhai93a] [Zhai93b]. They found that isotonic devices are more effective when position (or
orientation) is being controlled directly (i.e. a one-to-one mapping of hand movements to
object movements is being used), but that isometric devices worked better when hand motions
were used to control velocity, as opposed to position. This tells us that for direct object
manipulation, a lack of haptic feedback should not impede users in performing actions
adequately, as long as the mapping of hand motions to object motions is one-to-one. The
effectiveness of this one-to-one mapping can also be viewed as the effectiveness of mimicking
real-world motions (e.g. object orientation) in the virtual world.
29
Poston et al [Post96] describe virtual tools they have developed for visualizing medical data.
They divide the tools into two classes: manipulators and selectors. Manipulators are tools
used for direct manipulation, such as a scalpel or calipers. The user interacts directly with the
virtual objects through these manipulators. Selectors, which are indirect manipulation tools,
allow the user to select from among a number of alternatives (attributes) of objects, provide
status information, or change modes of interaction. Their system uses a "tool rack" from
which different selectors and manipulators can be accessed. The tool rack is fixed in space,
and is always accessible to the user.
Gestural interfaces, where the user employs hand gestures to trigger a desired manipulation
action, are the most widely used type of direct manipulation interface, and provide an intuitive
mapping of gestures to actions [Brys91] [Fish86] [Fels95] [Stur89] [Pier97]. For instance,
forming a fist while intersecting the hand with a virtual object might execute a grab action.
Gestural interfaces have also been used as a means of navigating through IVEs, using a gun-
like gesture with the index finger extended forward and the thumb extended upward, by
orienting the hand so that the index finger is pointing in the desired direction of travel.
Other direct manipulation interfaces provide manipulators (or handles) around objects which
the user selects and manipulates using some sort of selection device, such as pinch gloves or a
mouse [Conn92] [Hern94] [Mape95b]. Depending on which manipulator is in use, these
handles provide a well-defined set of allowable manipulations that the user may make with the
given object. A scale-manipulator, for instance, allows the user to translate the handles
outward (or inward) from the object, and therefore change the scale-factor of the object, while
a twist manipulator allows the user to perform a twist operation around a specified axis.
The Go-Go interaction technique [Poup96] [Bowm97a] allows users to extend the normal
range of motion of their arm by applying a non-linear scaling factor to reaching movements.
The further the user moves their hand from their body, the longer the reach is. This allows the
user to manipulate objects at a distance. Mine et al [Mine97a] use a related approach, by
altering both the user’s viewpoint and reaching ability.
30
The Worlds in Miniature (WIM) interface provides the user with a miniature representation of
the objects in the world, and movement of these miniatures affects change in the larger objects
they represent [Stoa95]. This interface is powerful in that it allows the user to work within the
immediate region of their body, without the need to relocate in order to reach objects which
are out of reach.
Direct manipulation, however, is only one way to affect change in IVEs. Direct manipulation
is well suited to gross movements involving whole objects in the IVE. Some approaches use
indirect techniques for object manipulation. These approaches trade a one-to-one mapping of
hand movements to object movements for more flexibility and precision in manipulation.
3.2.2 Indirect Manipulation
Though direct manipulation is well suited for some types of manipulation, in many situations
there is a need to manipulate more abstract characteristics, such as the color or velocity of
objects. Since these attributes lack any sort of physical analogues, providing direct
manipulation of them requires an arbitrary mapping of hand movements to attribute changes.
As a result, these object attributes or parameters may be better manipulated using indirect
techniques.
Indirect manipulation involves providing the user with an abstract control mechanism for
manipulating a specific attribute of an object. Voice control, textual input, and graphical
widget manipulation are examples of indirect approaches. Here we are only concerned with
graphical widget manipulation. Indirect manipulation is often used in desktop Computer-
Aided Design packages to allow the user to exactly control the position or orientation of
objects they are designing. These systems frequently offer a combination of sliders,
thumbwheels, and numerical input for precise parameter specification.
More generally, desktop windowing systems, such as MacOS or MS-Windows, can be seen as
the ultimate indirect manipulation systems. The multitude of symbols used to manipulate
objects and their attributes on the desktop makes these systems extremely powerful, if not
31
overwhelming. Windowing systems provide a combination of direct and indirect manipulation,
depending on what is to be accomplished. Within a word processor, for instance, selecting a
block of text with the mouse (direct) allows the user to efficiently select which part of the text
to apply attributes to, while the actual application of the attribute might involve clicking a
button, or accessing a pull-down menu (both indirect). Scrollbars (indirect) on the side of
windows allow the user to control which part of a document is being viewed. Drag-and-drop
(direct) interaction allows the user to delete files from the system by dropping them onto the
waste basket icon (indirect).
Intuitively, it makes sense that different tasks require differing levels of abstraction in order to
provide optimal user efficiency. Tasks which have analogues in the real world, such as moving
an object from one place to another, lend themselves well to direct manipulation. Tasks which
require a high degree of precision, or which have no analogue in the real world, might be
better accomplished using indirect techniques.
On the desktop, the user interface widgets are designed to allow the user to perform the tasks
required for carrying out necessary work. IVE interfaces have not had the time nor usability
testing necessary to develop interfaces that provide a general framework for user interaction.
This dissertation attempts to provide some order to IVE interface research by developing a
classification taxonomy of possible techniques, by classifying existing techniques within this
taxonomy, and by presenting some empirical results from studies comparing different aspects
of these techniques.
Many researchers have advocated the need to combine both direct and indirect approaches
within a single, unified framework [Conn92] [Post96] [Mine97a] [Kurt91]. What is missing is
a method of determining when to use direct and when to use indirect approaches. Because
some actions are better suited to direct and some to indirect manipulation, the classification
scheme presented here can assist interface designers in combining these techniques effectively.
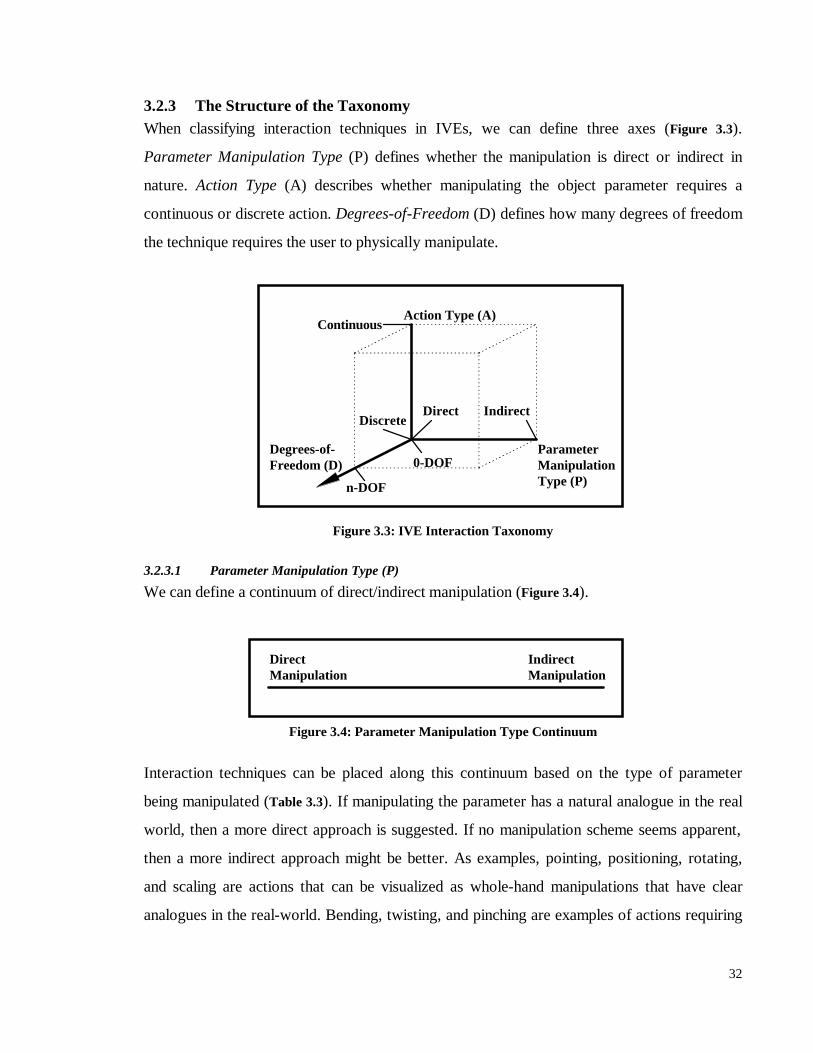
32
Discrete
Continuous
n-DOF
0-DOF
IndirectDirect
ParameterManipulationType (P)
Action Type (A)
Degrees-of-Freedom (D)
3.2.3 The Structure of the TaxonomyWhen classifying interaction techniques in IVEs, we can define three axes (Figure 3.3).
Parameter Manipulation Type (P) defines whether the manipulation is direct or indirect in
nature. Action Type (A) describes whether manipulating the object parameter requires a
continuous or discrete action. Degrees-of-Freedom (D) defines how many degrees of freedom
the technique requires the user to physically manipulate.
Figure 3.3: IVE Interaction Taxonomy
3.2.3.1 Parameter Manipulation Type (P)
We can define a continuum of direct/indirect manipulation (Figure 3.4).
Figure 3.4: Parameter Manipulation Type Continuum
Interaction techniques can be placed along this continuum based on the type of parameter
being manipulated (Table 3.3). If manipulating the parameter has a natural analogue in the real
world, then a more direct approach is suggested. If no manipulation scheme seems apparent,
then a more indirect approach might be better. As examples, pointing, positioning, rotating,
and scaling are actions that can be visualized as whole-hand manipulations that have clear
analogues in the real-world. Bending, twisting, and pinching are examples of actions requiring
DirectManipulation
IndirectManipulation
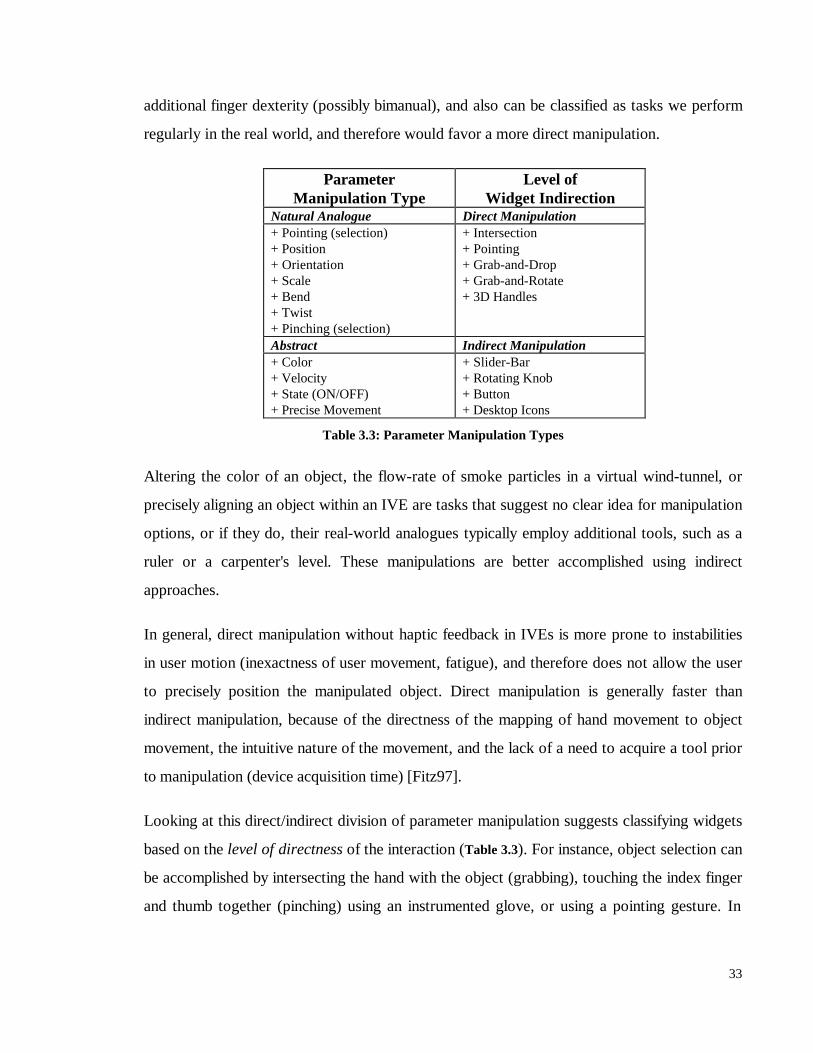
33
additional finger dexterity (possibly bimanual), and also can be classified as tasks we perform
regularly in the real world, and therefore would favor a more direct manipulation.
ParameterManipulation Type
Level ofWidget Indirection
Natural Analogue Direct Manipulation+ Pointing (selection)+ Position+ Orientation+ Scale+ Bend+ Twist+ Pinching (selection)
+ Intersection+ Pointing+ Grab-and-Drop+ Grab-and-Rotate+ 3D Handles
Abstract Indirect Manipulation+ Color+ Velocity+ State (ON/OFF)+ Precise Movement
+ Slider-Bar+ Rotating Knob+ Button+ Desktop Icons
Table 3.3: Parameter Manipulation Types
Altering the color of an object, the flow-rate of smoke particles in a virtual wind-tunnel, or
precisely aligning an object within an IVE are tasks that suggest no clear idea for manipulation
options, or if they do, their real-world analogues typically employ additional tools, such as a
ruler or a carpenter's level. These manipulations are better accomplished using indirect
approaches.
In general, direct manipulation without haptic feedback in IVEs is more prone to instabilities
in user motion (inexactness of user movement, fatigue), and therefore does not allow the user
to precisely position the manipulated object. Direct manipulation is generally faster than
indirect manipulation, because of the directness of the mapping of hand movement to object
movement, the intuitive nature of the movement, and the lack of a need to acquire a tool prior
to manipulation (device acquisition time) [Fitz97].
Looking at this direct/indirect division of parameter manipulation suggests classifying widgets
based on the level of directness of the interaction (Table 3.3). For instance, object selection can
be accomplished by intersecting the hand with the object (grabbing), touching the index finger
and thumb together (pinching) using an instrumented glove, or using a pointing gesture. In
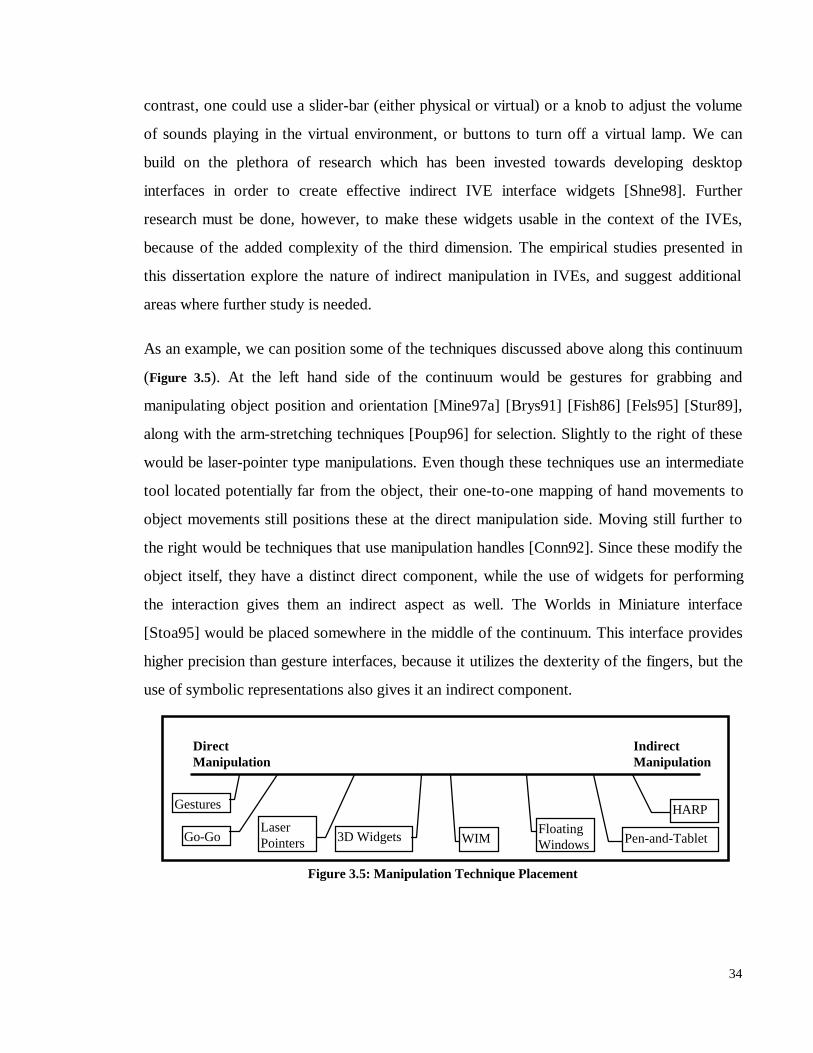
34
contrast, one could use a slider-bar (either physical or virtual) or a knob to adjust the volume
of sounds playing in the virtual environment, or buttons to turn off a virtual lamp. We can
build on the plethora of research which has been invested towards developing desktop
interfaces in order to create effective indirect IVE interface widgets [Shne98]. Further
research must be done, however, to make these widgets usable in the context of the IVEs,
because of the added complexity of the third dimension. The empirical studies presented in
this dissertation explore the nature of indirect manipulation in IVEs, and suggest additional
areas where further study is needed.
As an example, we can position some of the techniques discussed above along this continuum
(Figure 3.5). At the left hand side of the continuum would be gestures for grabbing and
manipulating object position and orientation [Mine97a] [Brys91] [Fish86] [Fels95] [Stur89],
along with the arm-stretching techniques [Poup96] for selection. Slightly to the right of these
would be laser-pointer type manipulations. Even though these techniques use an intermediate
tool located potentially far from the object, their one-to-one mapping of hand movements to
object movements still positions these at the direct manipulation side. Moving still further to
the right would be techniques that use manipulation handles [Conn92]. Since these modify the
object itself, they have a distinct direct component, while the use of widgets for performing
the interaction gives them an indirect aspect as well. The Worlds in Miniature interface
[Stoa95] would be placed somewhere in the middle of the continuum. This interface provides
higher precision than gesture interfaces, because it utilizes the dexterity of the fingers, but the
use of symbolic representations also gives it an indirect component.
Figure 3.5: Manipulation Technique Placement
DirectManipulation
IndirectManipulation
Gestures
LaserPointers 3D Widgets WIM
FloatingWindows
HARP
Pen-and-TabletGo-Go
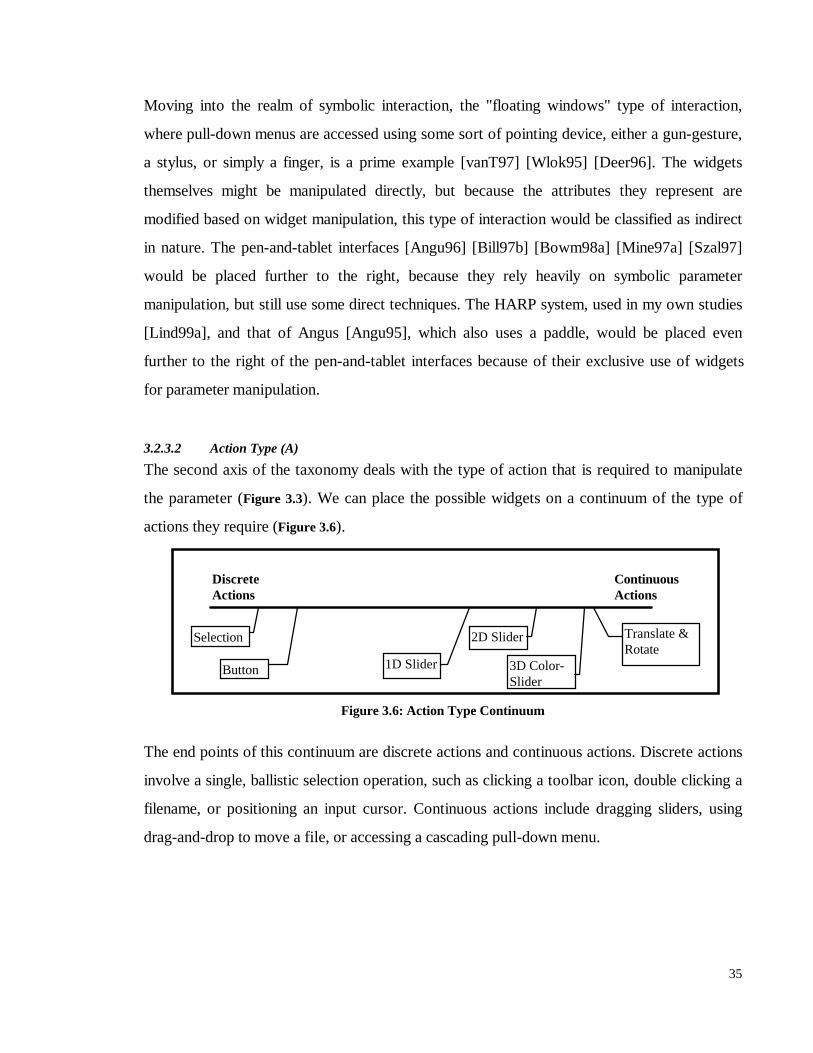
35
Moving into the realm of symbolic interaction, the "floating windows" type of interaction,
where pull-down menus are accessed using some sort of pointing device, either a gun-gesture,
a stylus, or simply a finger, is a prime example [vanT97] [Wlok95] [Deer96]. The widgets
themselves might be manipulated directly, but because the attributes they represent are
modified based on widget manipulation, this type of interaction would be classified as indirect
in nature. The pen-and-tablet interfaces [Angu96] [Bill97b] [Bowm98a] [Mine97a] [Szal97]
would be placed further to the right, because they rely heavily on symbolic parameter
manipulation, but still use some direct techniques. The HARP system, used in my own studies
[Lind99a], and that of Angus [Angu95], which also uses a paddle, would be placed even
further to the right of the pen-and-tablet interfaces because of their exclusive use of widgets
for parameter manipulation.
3.2.3.2 Action Type (A)
The second axis of the taxonomy deals with the type of action that is required to manipulate
the parameter (Figure 3.3). We can place the possible widgets on a continuum of the type of
actions they require (Figure 3.6).
Figure 3.6: Action Type Continuum
The end points of this continuum are discrete actions and continuous actions. Discrete actions
involve a single, ballistic selection operation, such as clicking a toolbar icon, double clicking a
filename, or positioning an input cursor. Continuous actions include dragging sliders, using
drag-and-drop to move a file, or accessing a cascading pull-down menu.
DiscreteActions
ContinuousActions
Selection
1D Slider
2D Slider
3D Color-Slider
Translate &Rotate
Button
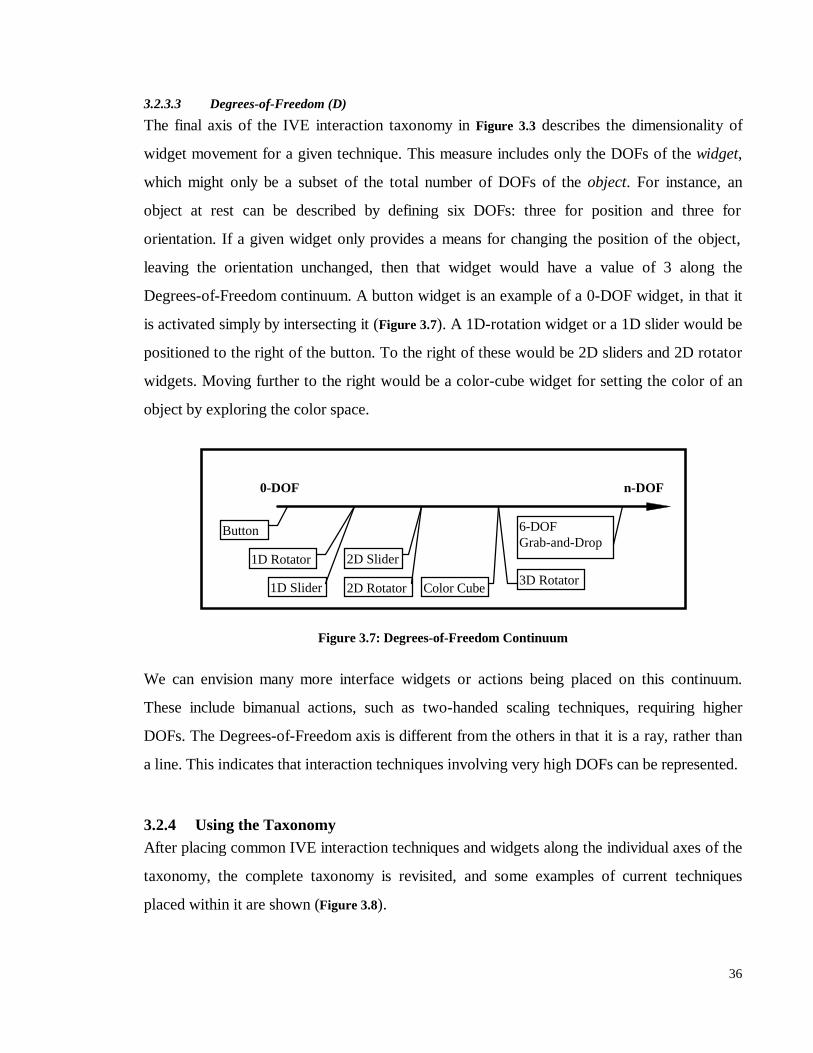
36
3.2.3.3 Degrees-of-Freedom (D)
The final axis of the IVE interaction taxonomy in Figure 3.3 describes the dimensionality of
widget movement for a given technique. This measure includes only the DOFs of the widget,
which might only be a subset of the total number of DOFs of the object. For instance, an
object at rest can be described by defining six DOFs: three for position and three for
orientation. If a given widget only provides a means for changing the position of the object,
leaving the orientation unchanged, then that widget would have a value of 3 along the
Degrees-of-Freedom continuum. A button widget is an example of a 0-DOF widget, in that it
is activated simply by intersecting it (Figure 3.7). A 1D-rotation widget or a 1D slider would be
positioned to the right of the button. To the right of these would be 2D sliders and 2D rotator
widgets. Moving further to the right would be a color-cube widget for setting the color of an
object by exploring the color space.
Figure 3.7: Degrees-of-Freedom Continuum
We can envision many more interface widgets or actions being placed on this continuum.
These include bimanual actions, such as two-handed scaling techniques, requiring higher
DOFs. The Degrees-of-Freedom axis is different from the others in that it is a ray, rather than
a line. This indicates that interaction techniques involving very high DOFs can be represented.
3.2.4 Using the TaxonomyAfter placing common IVE interaction techniques and widgets along the individual axes of the
taxonomy, the complete taxonomy is revisited, and some examples of current techniques
placed within it are shown (Figure 3.8).
0-DOF n-DOF
Button 6-DOFGrab-and-Drop
1D Slider
1D Rotator 2D Slider
2D Rotator3D Rotator
Color Cube
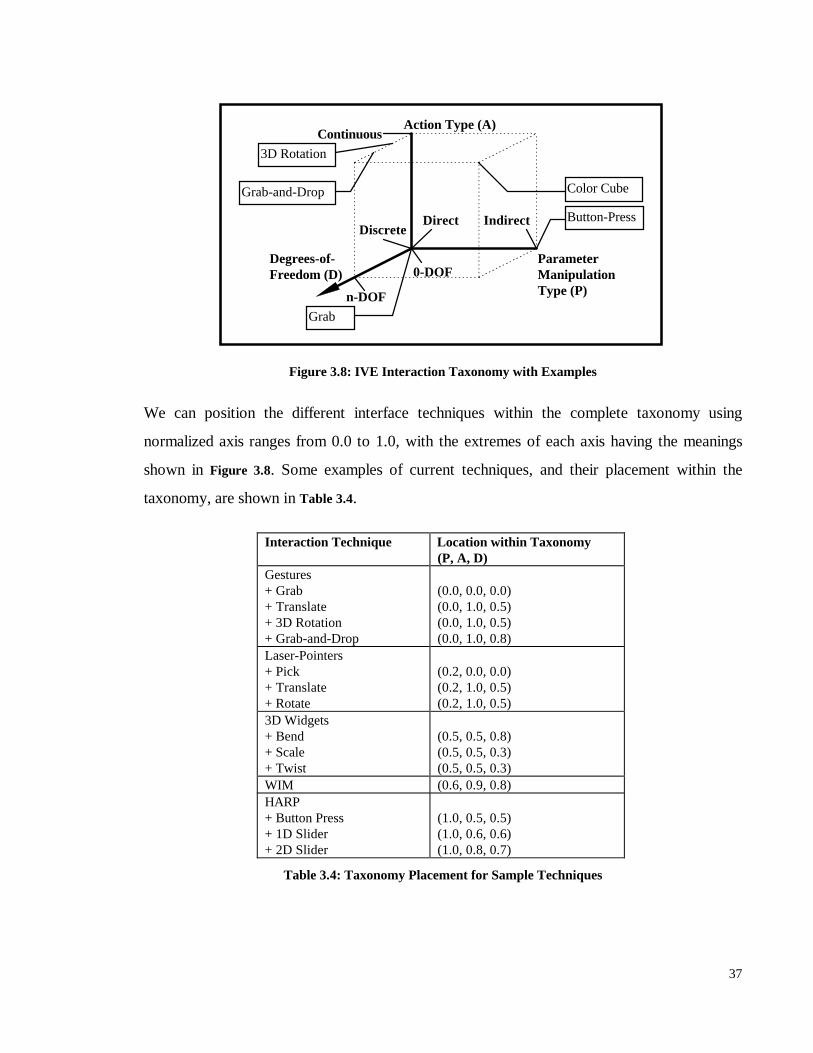
37
Figure 3.8: IVE Interaction Taxonomy with Examples
We can position the different interface techniques within the complete taxonomy using
normalized axis ranges from 0.0 to 1.0, with the extremes of each axis having the meanings
shown in Figure 3.8. Some examples of current techniques, and their placement within the
taxonomy, are shown in Table 3.4.
Interaction Technique Location within Taxonomy(P, A, D)
Gestures+ Grab+ Translate+ 3D Rotation+ Grab-and-Drop
(0.0, 0.0, 0.0)(0.0, 1.0, 0.5)(0.0, 1.0, 0.5)(0.0, 1.0, 0.8)
Laser-Pointers+ Pick+ Translate+ Rotate
(0.2, 0.0, 0.0)(0.2, 1.0, 0.5)(0.2, 1.0, 0.5)
3D Widgets+ Bend+ Scale+ Twist
(0.5, 0.5, 0.8)(0.5, 0.5, 0.3)(0.5, 0.5, 0.3)
WIM (0.6, 0.9, 0.8)HARP+ Button Press+ 1D Slider+ 2D Slider
(1.0, 0.5, 0.5)(1.0, 0.6, 0.6)(1.0, 0.8, 0.7)
Table 3.4: Taxonomy Placement for Sample Techniques
Discrete
Continuous
n-DOF
0-DOF
IndirectDirect
ParameterManipulationType (P)
Action Type (A)
Degrees-of-Freedom (D)
Color Cube
3D Rotation
Button-Press
Grab-and-Drop
Grab

38
These examples are representative, and the slight differentiation between neighboring
techniques along the axes is based on the judgement of the author according to the reasoning
explained above. It is the relative location of the techniques that is descriptive. The sparseness
of certain areas of the taxonomy suggests as yet untried combinations. For instance, it would
be interesting to create an indirect, continuous, 3-DOF (1.0, 1.0, 0.5) technique, such as
manipulating a physical trackball, and to test how well people can adjust object orientation
compared to the more-direct 3D grab-and-rotate method more commonly used in IVEs.
The importance of combining different techniques, occupying different locations within the
taxonomy, into a single system should be underscored. One system that incorporates this
notion is that described by Mine et al [Mine97a]. They use direct manipulation for things like
rotation and translation, use gestures to carry out actions that resemble real-world actions,
such as the "over-the-shoulder delete", where an object can be deleted simply by "throwing" it
over your shoulder, and indirect manipulation through the use of menus.
Bowman et al describe a similar system called the Conceptual Design Space [Bowm97b]. This
system uses a virtual laser-pointer type technique to combine both direct manipulation of
objects, and indirect accessing of menus and other 2D interface widgets.
The research reported in this dissertation rests more in the indirect manipulation space,
because of the relative dearth of reported work there. In order to contribute to the IVE
interaction literature, this work revolves around empirical study of the use of techniques for
enhancing indirect manipulation in IVEs. The remainder of this dissertation addresses the
methods by which these possibilities have been explored.
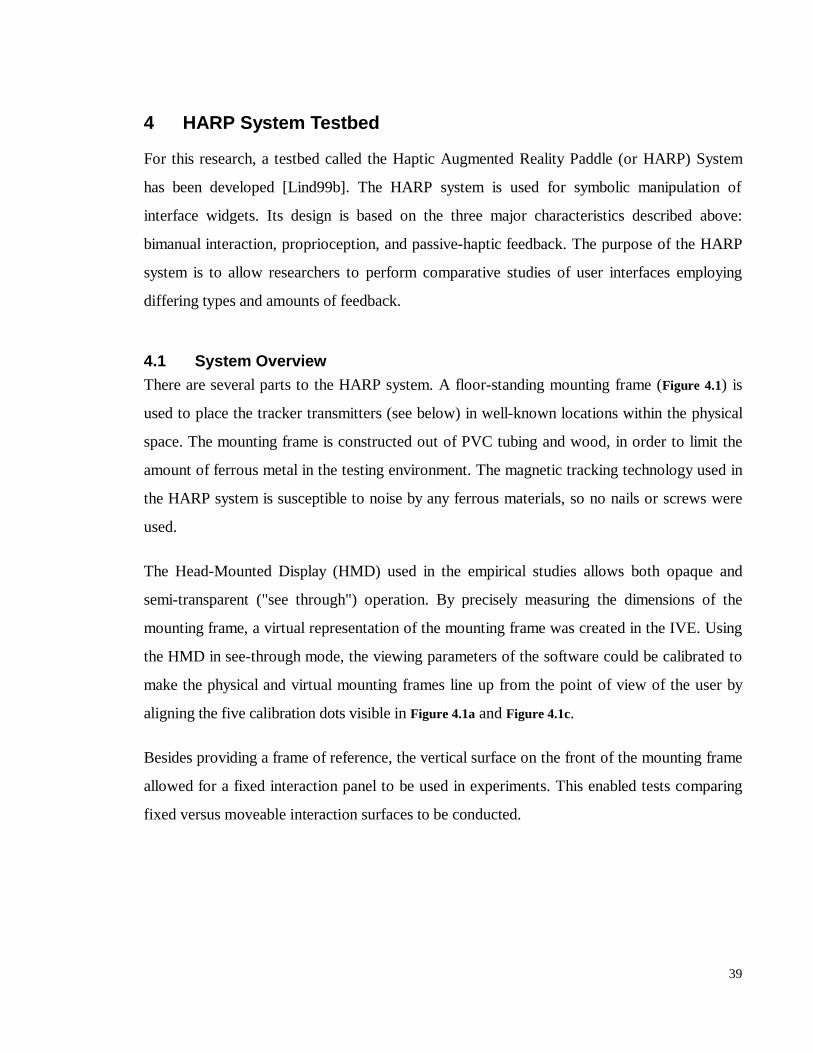
39
4 HARP System Testbed
For this research, a testbed called the Haptic Augmented Reality Paddle (or HARP) System
has been developed [Lind99b]. The HARP system is used for symbolic manipulation of
interface widgets. Its design is based on the three major characteristics described above:
bimanual interaction, proprioception, and passive-haptic feedback. The purpose of the HARP
system is to allow researchers to perform comparative studies of user interfaces employing
differing types and amounts of feedback.
4.1 System OverviewThere are several parts to the HARP system. A floor-standing mounting frame (Figure 4.1) is
used to place the tracker transmitters (see below) in well-known locations within the physical
space. The mounting frame is constructed out of PVC tubing and wood, in order to limit the
amount of ferrous metal in the testing environment. The magnetic tracking technology used in
the HARP system is susceptible to noise by any ferrous materials, so no nails or screws were
used.
The Head-Mounted Display (HMD) used in the empirical studies allows both opaque and
semi-transparent ("see through") operation. By precisely measuring the dimensions of the
mounting frame, a virtual representation of the mounting frame was created in the IVE. Using
the HMD in see-through mode, the viewing parameters of the software could be calibrated to
make the physical and virtual mounting frames line up from the point of view of the user by
aligning the five calibration dots visible in Figure 4.1a and Figure 4.1c.
Besides providing a frame of reference, the vertical surface on the front of the mounting frame
allowed for a fixed interaction panel to be used in experiments. This enabled tests comparing
fixed versus moveable interaction surfaces to be conducted.
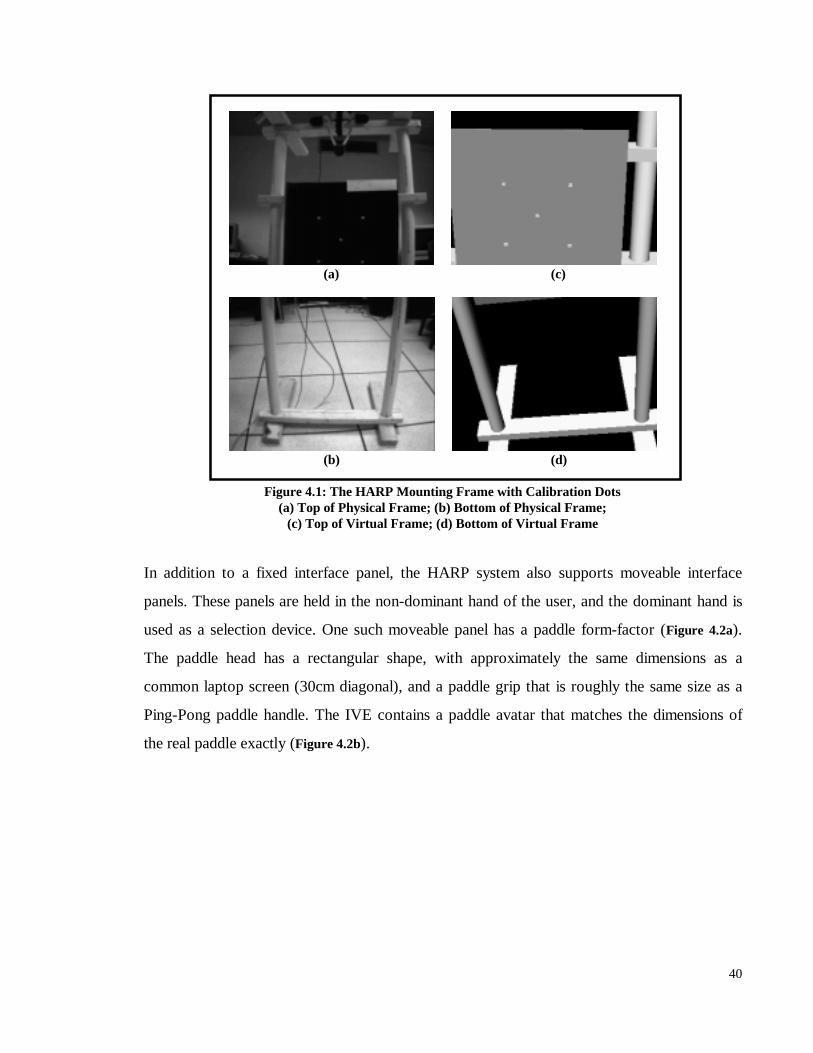
40
(a) (c)
(b) (d)
Figure 4.1: The HARP Mounting Frame with Calibration Dots(a) Top of Physical Frame; (b) Bottom of Physical Frame;
(c) Top of Virtual Frame; (d) Bottom of Virtual Frame
In addition to a fixed interface panel, the HARP system also supports moveable interface
panels. These panels are held in the non-dominant hand of the user, and the dominant hand is
used as a selection device. One such moveable panel has a paddle form-factor (Figure 4.2a).
The paddle head has a rectangular shape, with approximately the same dimensions as a
common laptop screen (30cm diagonal), and a paddle grip that is roughly the same size as a
Ping-Pong paddle handle. The IVE contains a paddle avatar that matches the dimensions of
the real paddle exactly (Figure 4.2b).
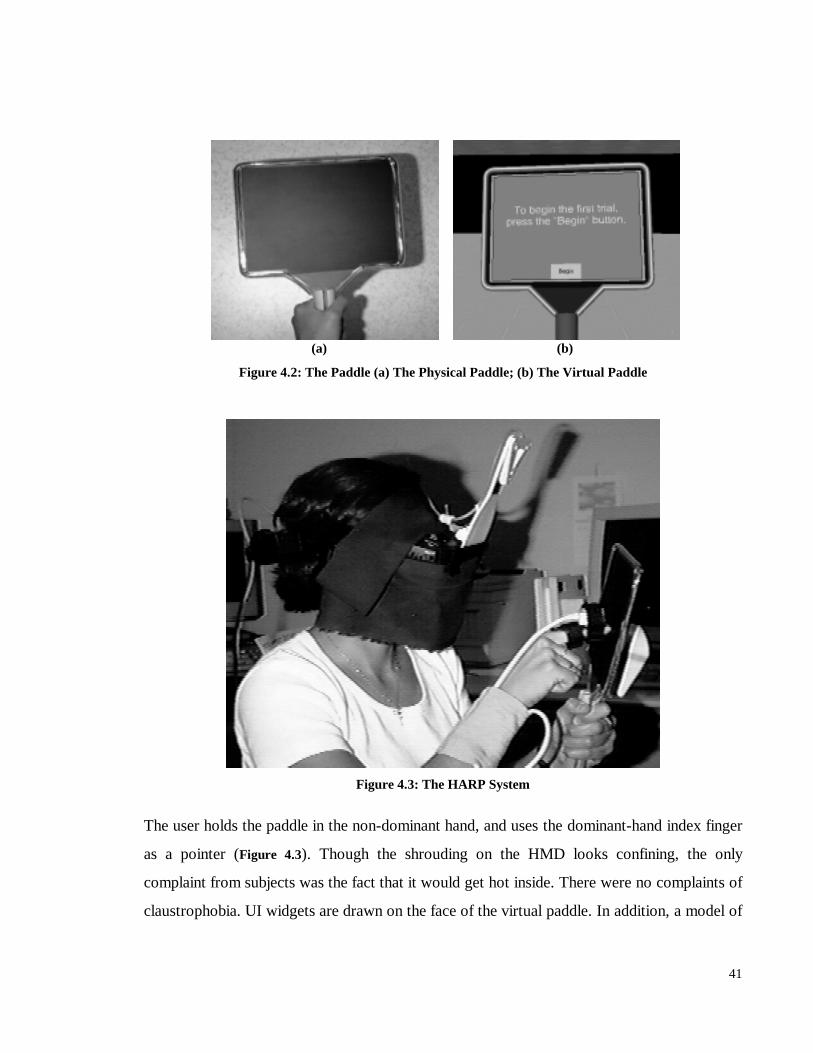
41
(a) (b)
Figure 4.2: The Paddle (a) The Physical Paddle; (b) The Virtual Paddle
Figure 4.3: The HARP System
The user holds the paddle in the non-dominant hand, and uses the dominant-hand index finger
as a pointer (Figure 4.3). Though the shrouding on the HMD looks confining, the only
complaint from subjects was the fact that it would get hot inside. There were no complaints of
claustrophobia. UI widgets are drawn on the face of the virtual paddle. In addition, a model of
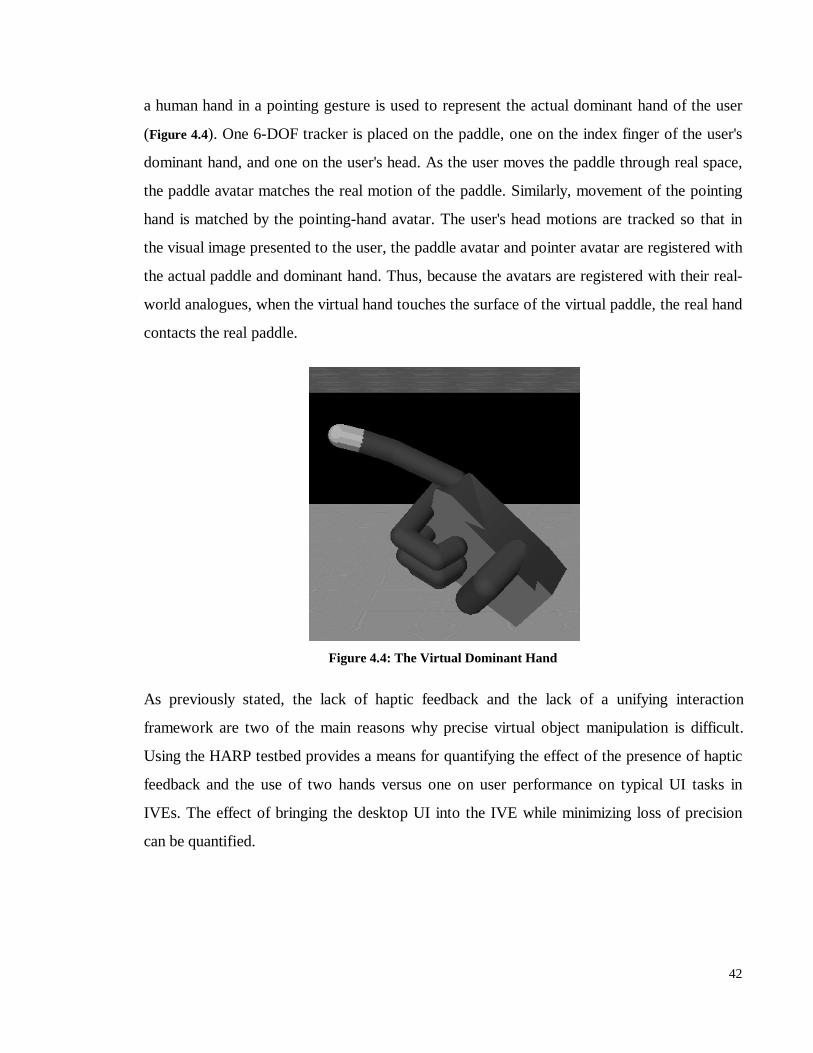
42
a human hand in a pointing gesture is used to represent the actual dominant hand of the user
(Figure 4.4). One 6-DOF tracker is placed on the paddle, one on the index finger of the user's
dominant hand, and one on the user's head. As the user moves the paddle through real space,
the paddle avatar matches the real motion of the paddle. Similarly, movement of the pointing
hand is matched by the pointing-hand avatar. The user's head motions are tracked so that in
the visual image presented to the user, the paddle avatar and pointer avatar are registered with
the actual paddle and dominant hand. Thus, because the avatars are registered with their real-
world analogues, when the virtual hand touches the surface of the virtual paddle, the real hand
contacts the real paddle.
Figure 4.4: The Virtual Dominant Hand
As previously stated, the lack of haptic feedback and the lack of a unifying interaction
framework are two of the main reasons why precise virtual object manipulation is difficult.
Using the HARP testbed provides a means for quantifying the effect of the presence of haptic
feedback and the use of two hands versus one on user performance on typical UI tasks in
IVEs. The effect of bringing the desktop UI into the IVE while minimizing loss of precision
can be quantified.
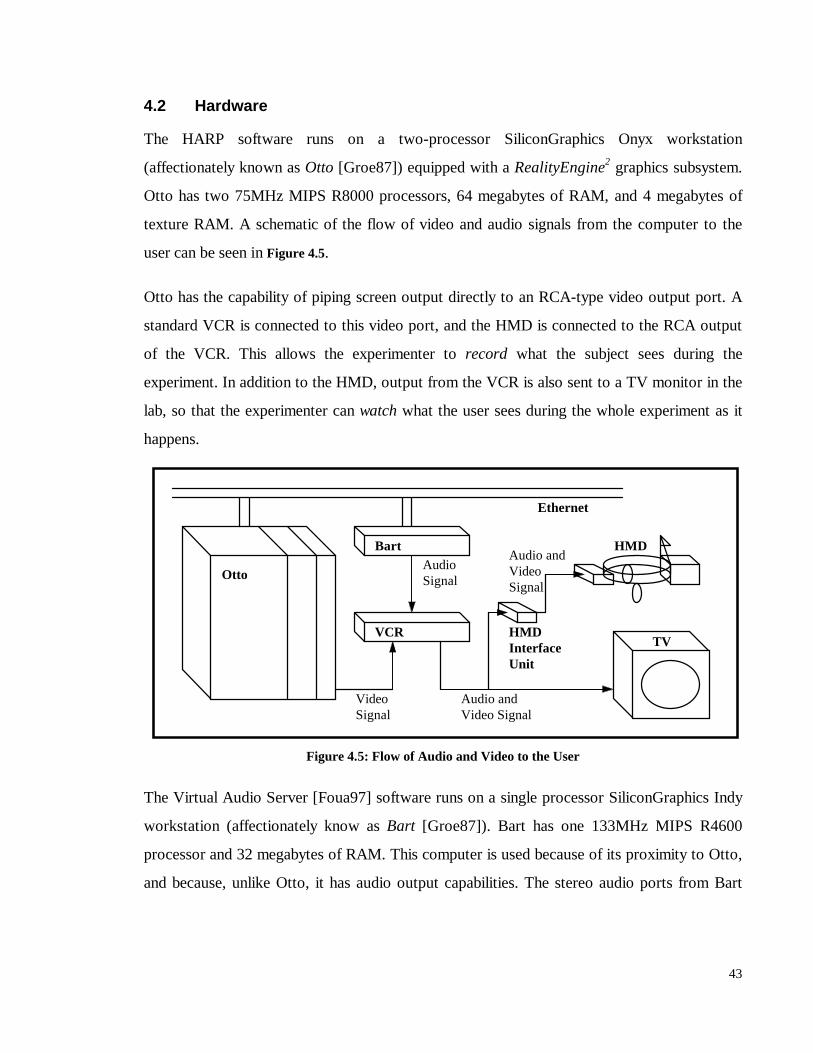
43
4.2 Hardware
The HARP software runs on a two-processor SiliconGraphics Onyx workstation
(affectionately known as Otto [Groe87]) equipped with a RealityEngine2 graphics subsystem.
Otto has two 75MHz MIPS R8000 processors, 64 megabytes of RAM, and 4 megabytes of
texture RAM. A schematic of the flow of video and audio signals from the computer to the
user can be seen in Figure 4.5.
Otto has the capability of piping screen output directly to an RCA-type video output port. A
standard VCR is connected to this video port, and the HMD is connected to the RCA output
of the VCR. This allows the experimenter to record what the subject sees during the
experiment. In addition to the HMD, output from the VCR is also sent to a TV monitor in the
lab, so that the experimenter can watch what the user sees during the whole experiment as it
happens.
Figure 4.5: Flow of Audio and Video to the User
The Virtual Audio Server [Foua97] software runs on a single processor SiliconGraphics Indy
workstation (affectionately know as Bart [Groe87]). Bart has one 133MHz MIPS R4600
processor and 32 megabytes of RAM. This computer is used because of its proximity to Otto,
and because, unlike Otto, it has audio output capabilities. The stereo audio ports from Bart
Bart
VCR
Ethernet
HMDInterfaceUnit
TV
VideoSignal
AudioSignal
Audio andVideo Signal
Audio andVideoSignal
Otto
HMD
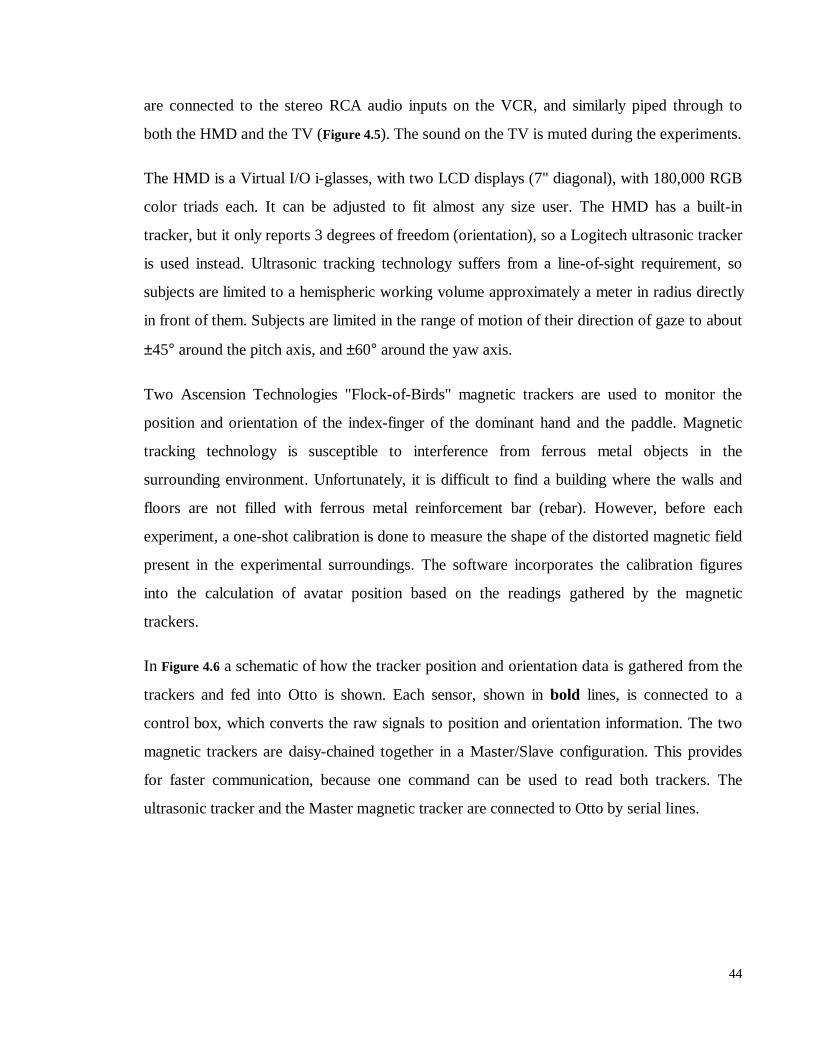
44
are connected to the stereo RCA audio inputs on the VCR, and similarly piped through to
both the HMD and the TV (Figure 4.5). The sound on the TV is muted during the experiments.
The HMD is a Virtual I/O i-glasses, with two LCD displays (7" diagonal), with 180,000 RGB
color triads each. It can be adjusted to fit almost any size user. The HMD has a built-in
tracker, but it only reports 3 degrees of freedom (orientation), so a Logitech ultrasonic tracker
is used instead. Ultrasonic tracking technology suffers from a line-of-sight requirement, so
subjects are limited to a hemispheric working volume approximately a meter in radius directly
in front of them. Subjects are limited in the range of motion of their direction of gaze to about
±45° around the pitch axis, and ±60° around the yaw axis.
Two Ascension Technologies "Flock-of-Birds" magnetic trackers are used to monitor the
position and orientation of the index-finger of the dominant hand and the paddle. Magnetic
tracking technology is susceptible to interference from ferrous metal objects in the
surrounding environment. Unfortunately, it is difficult to find a building where the walls and
floors are not filled with ferrous metal reinforcement bar (rebar). However, before each
experiment, a one-shot calibration is done to measure the shape of the distorted magnetic field
present in the experimental surroundings. The software incorporates the calibration figures
into the calculation of avatar position based on the readings gathered by the magnetic
trackers.
In Figure 4.6 a schematic of how the tracker position and orientation data is gathered from the
trackers and fed into Otto is shown. Each sensor, shown in bold lines, is connected to a
control box, which converts the raw signals to position and orientation information. The two
magnetic trackers are daisy-chained together in a Master/Slave configuration. This provides
for faster communication, because one command can be used to read both trackers. The
ultrasonic tracker and the Master magnetic tracker are connected to Otto by serial lines.
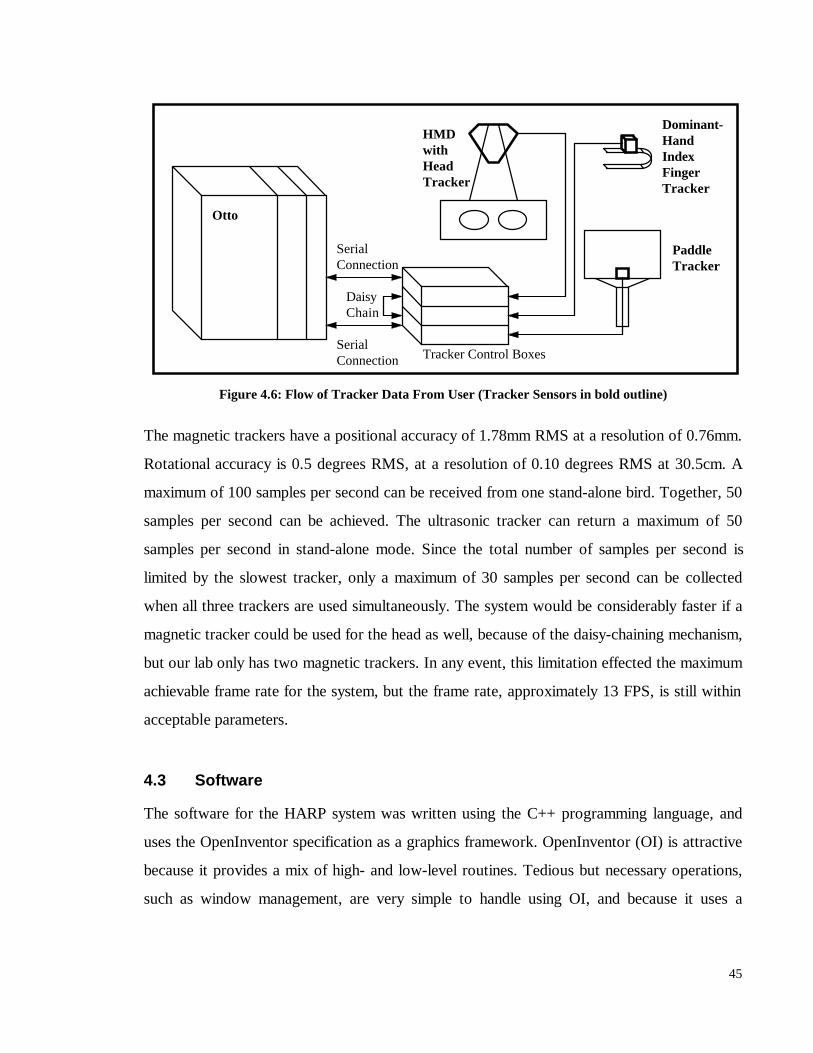
45
Figure 4.6: Flow of Tracker Data From User (Tracker Sensors in bold outline)
The magnetic trackers have a positional accuracy of 1.78mm RMS at a resolution of 0.76mm.
Rotational accuracy is 0.5 degrees RMS, at a resolution of 0.10 degrees RMS at 30.5cm. A
maximum of 100 samples per second can be received from one stand-alone bird. Together, 50
samples per second can be achieved. The ultrasonic tracker can return a maximum of 50
samples per second in stand-alone mode. Since the total number of samples per second is
limited by the slowest tracker, only a maximum of 30 samples per second can be collected
when all three trackers are used simultaneously. The system would be considerably faster if a
magnetic tracker could be used for the head as well, because of the daisy-chaining mechanism,
but our lab only has two magnetic trackers. In any event, this limitation effected the maximum
achievable frame rate for the system, but the frame rate, approximately 13 FPS, is still within
acceptable parameters.
4.3 Software
The software for the HARP system was written using the C++ programming language, and
uses the OpenInventor specification as a graphics framework. OpenInventor (OI) is attractive
because it provides a mix of high- and low-level routines. Tedious but necessary operations,
such as window management, are very simple to handle using OI, and because it uses a
Otto
HMDwithHeadTracker
Dominant-HandIndexFingerTracker
PaddleTracker
SerialConnection
SerialConnection
DaisyChain
Tracker Control Boxes
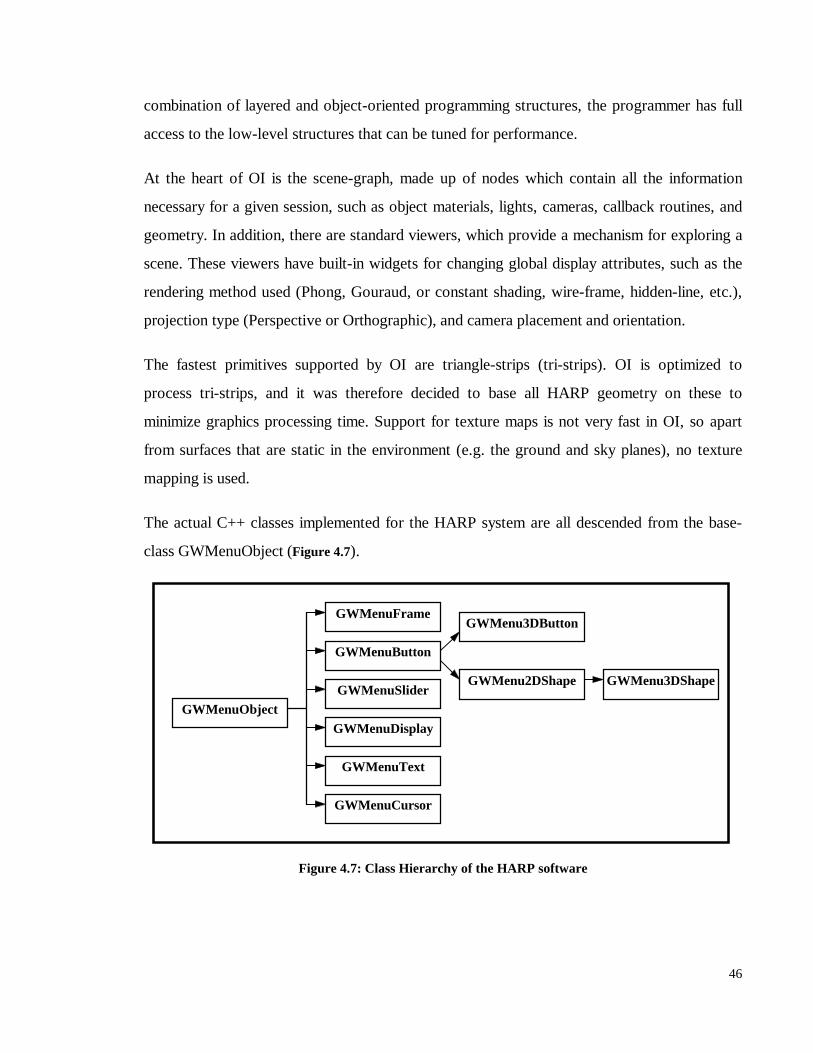
46
combination of layered and object-oriented programming structures, the programmer has full
access to the low-level structures that can be tuned for performance.
At the heart of OI is the scene-graph, made up of nodes which contain all the information
necessary for a given session, such as object materials, lights, cameras, callback routines, and
geometry. In addition, there are standard viewers, which provide a mechanism for exploring a
scene. These viewers have built-in widgets for changing global display attributes, such as the
rendering method used (Phong, Gouraud, or constant shading, wire-frame, hidden-line, etc.),
projection type (Perspective or Orthographic), and camera placement and orientation.
The fastest primitives supported by OI are triangle-strips (tri-strips). OI is optimized to
process tri-strips, and it was therefore decided to base all HARP geometry on these to
minimize graphics processing time. Support for texture maps is not very fast in OI, so apart
from surfaces that are static in the environment (e.g. the ground and sky planes), no texture
mapping is used.
The actual C++ classes implemented for the HARP system are all descended from the base-
class GWMenuObject (Figure 4.7).
Figure 4.7: Class Hierarchy of the HARP software
GWMenuObject
GWMenuButton
GWMenuSlider
GWMenuFrame
GWMenuDisplay
GWMenuCursor
GWMenu2DShape
GWMenuText
GWMenu3DShape
GWMenu3DButton
47
The base-class contains fields common to all derived-classes, such as their position, their
extent (dimensions), a list of any sub-parts they might contain, etc. In addition, the base-class
contains methods that are common to all the derived-classes, such as intersection testing, and
virtual methods, such as those for creating the actual geometry based on the definition.
Each derived class knows how to create geometry for itself, and therefore provides a function
to do so. This allows tree-walking operations to be used, which greatly simplifies the code
necessary for creating objects in the HARP IVE. As an example, the structure for one
application of the paddle avatar will now be described.
The following code snippet (Figure 4.8) shows the code necessary to create a slider-bar.
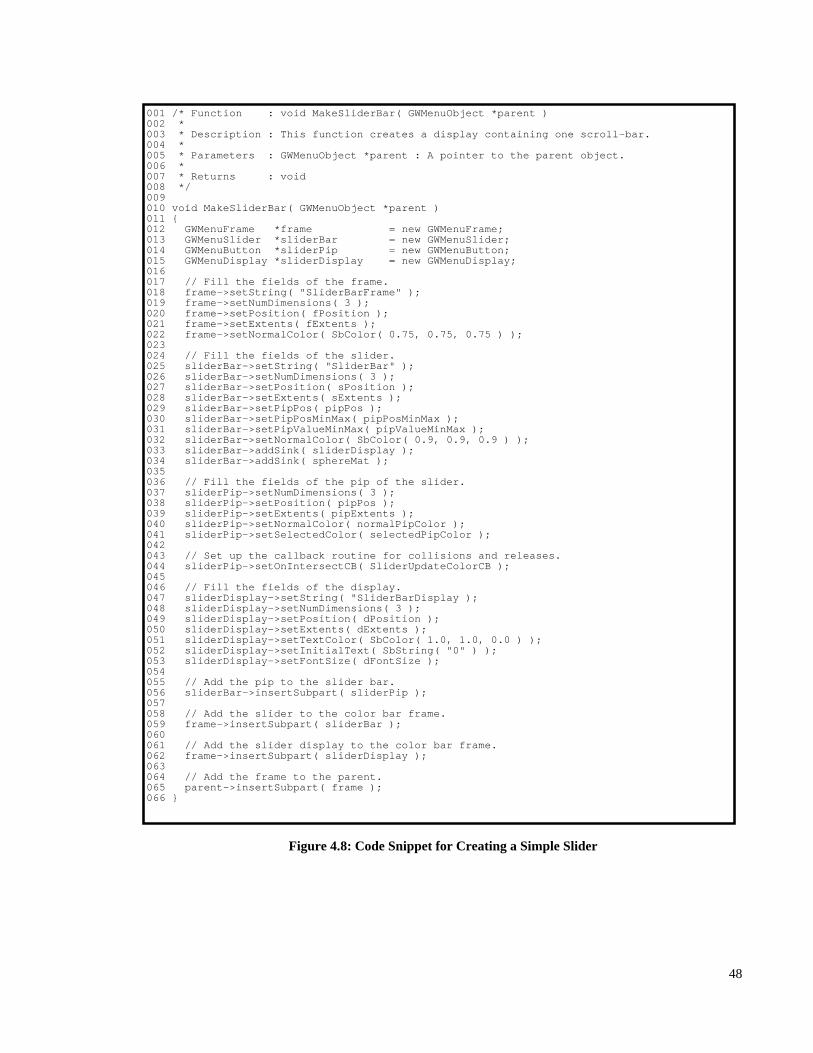
48
Figure 4.8: Code Snippet for Creating a Simple Slider
001 /* Function : void MakeSliderBar( GWMenuObject *parent )002 *003 * Description : This function creates a display containing one scroll-bar.004 *005 * Parameters : GWMenuObject *parent : A pointer to the parent object.006 *007 * Returns : void008 */009010 void MakeSliderBar( GWMenuObject *parent )011 {012 GWMenuFrame *frame = new GWMenuFrame;013 GWMenuSlider *sliderBar = new GWMenuSlider;014 GWMenuButton *sliderPip = new GWMenuButton;015 GWMenuDisplay *sliderDisplay = new GWMenuDisplay;016017 // Fill the fields of the frame.018 frame->setString( "SliderBarFrame" );019 frame->setNumDimensions( 3 );020 frame->setPosition( fPosition );021 frame->setExtents( fExtents );022 frame->setNormalColor( SbColor( 0.75, 0.75, 0.75 ) );023024 // Fill the fields of the slider.025 sliderBar->setString( "SliderBar" );026 sliderBar->setNumDimensions( 3 );027 sliderBar->setPosition( sPosition );028 sliderBar->setExtents( sExtents );029 sliderBar->setPipPos( pipPos );030 sliderBar->setPipPosMinMax( pipPosMinMax );031 sliderBar->setPipValueMinMax( pipValueMinMax );032 sliderBar->setNormalColor( SbColor( 0.9, 0.9, 0.9 ) );033 sliderBar->addSink( sliderDisplay );034 sliderBar->addSink( sphereMat );035036 // Fill the fields of the pip of the slider.037 sliderPip->setNumDimensions( 3 );038 sliderPip->setPosition( pipPos );039 sliderPip->setExtents( pipExtents );040 sliderPip->setNormalColor( normalPipColor );041 sliderPip->setSelectedColor( selectedPipColor );042043 // Set up the callback routine for collisions and releases.044 sliderPip->setOnIntersectCB( SliderUpdateColorCB );045046 // Fill the fields of the display.047 sliderDisplay->setString( "SliderBarDisplay );048 sliderDisplay->setNumDimensions( 3 );049 sliderDisplay->setPosition( dPosition );050 sliderDisplay->setExtents( dExtents );051 sliderDisplay->setTextColor( SbColor( 1.0, 1.0, 0.0 ) );052 sliderDisplay->setInitialText( SbString( "0" ) );053 sliderDisplay->setFontSize( dFontSize );054055 // Add the pip to the slider bar.056 sliderBar->insertSubpart( sliderPip );057058 // Add the slider to the color bar frame.059 frame->insertSubpart( sliderBar );060061 // Add the slider display to the color bar frame.062 frame->insertSubpart( sliderDisplay );063064 // Add the frame to the parent.065 parent->insertSubpart( frame );066 }
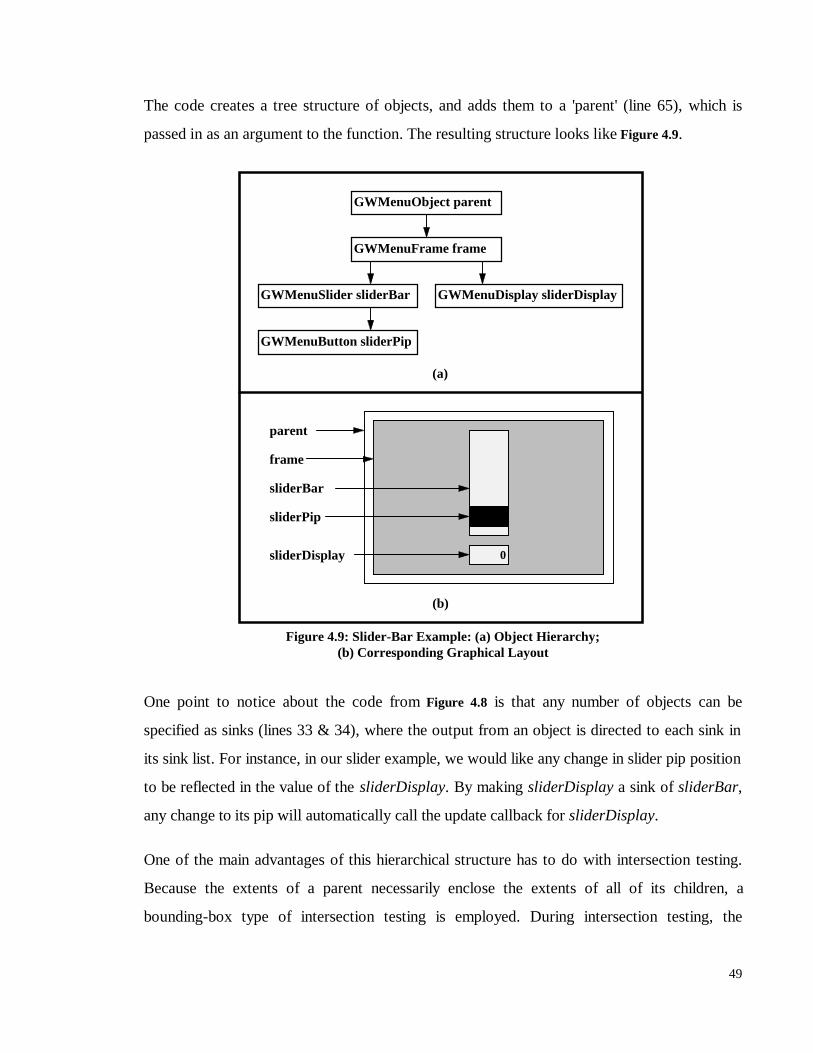
49
The code creates a tree structure of objects, and adds them to a 'parent' (line 65), which is
passed in as an argument to the function. The resulting structure looks like Figure 4.9.
Figure 4.9: Slider-Bar Example: (a) Object Hierarchy;(b) Corresponding Graphical Layout
One point to notice about the code from Figure 4.8 is that any number of objects can be
specified as sinks (lines 33 & 34), where the output from an object is directed to each sink in
its sink list. For instance, in our slider example, we would like any change in slider pip position
to be reflected in the value of the sliderDisplay. By making sliderDisplay a sink of sliderBar,
any change to its pip will automatically call the update callback for sliderDisplay.
One of the main advantages of this hierarchical structure has to do with intersection testing.
Because the extents of a parent necessarily enclose the extents of all of its children, a
bounding-box type of intersection testing is employed. During intersection testing, the
GWMenuObject parent
GWMenuFrame frame
GWMenuSlider sliderBar
GWMenuButton sliderPip
GWMenuDisplay sliderDisplay
0
parent
frame
sliderDisplay
sliderPip
sliderBar
(a)
(b)
50
position of the fingertip of the user is compared against the root of the HARP object
hierarchy. If the test passes (i.e. the object is intersected), then the algorithm recursively
checks all of the children of the root. If a child is not intersected, then none of its children are
checked, and the search moves on to the sibling of that child. If a leaf is found to be
intersected, then the appropriate callback is called for that object. All objects are constrained
to have a box-shaped bounding volume, in order to speed intersection testing with the
fingertip bounding sphere.
Audio feedback is provided by the Virtual Audio Server (VAS) [Foua97] running on Bart,
and communicating with Otto using Ethernet sockets. VAS provides C++ classes for
instantiating and triggering sounds in VEs. The HARP software does not take advantage of
the full capabilities of the VAS, because of latency problems. Testing of the HARP system
with different configurations of the VAS showed a dramatic increase in speed when audio was
turned off. Since audio is considered so important to IVEs, a compromise was reached
between VAS capabilities and the need for high frame rates.
The VAS is capable of tracking the position and orientation of the user's head (the listener), as
well as the position of multiple sound sources. Based on these movements, the VAS modifies
the sounds it outputs, taking into account the relative location of the listener and the sound
sources. In this way, sounds connected to objects can be made to follow the objects,
registering the visual and auditory channels of feedback displayed to the user. This calculation
is expensive, however, and because only simple audio feedback is being used in the HARP
system, it was decided to make both the listener and the sound sources fixed in space for the
duration of the session. Thus, after the initial setup, the only commands being sent to the VAS
were to trigger sounds, which is computationally cheap.
4.4 The Virtual Environment
The virtual environment used for testing contained certain objects designed to aid the subjects
in orienting themselves within the environment. A blue cube (Figure 4.10a), with a height of 2
meters, was stationed on the ground plane of the VE at approximately 45° to the left of, and 3

51
meters away from, the subject. A 2 meter high green cone (Figure 4.10b) was placed at 45° to
the right of, and 3 meters away from, the subject. Upon entering the VE, the subjects were
asked to perform a fixed set of head movements. Each subject was told that if they turned
their head to the left, they should see a blue cube, and that if they looked to the right, they
should see a green cone.
(a) (b)
Figure 4.10: Orientation Aids: (a) Blue Cube to the Left; (b) Green Cone to the Right
The subject location within the VE was such that they were in the center of a horizontal plane,
texture-mapped with a beige, repeating pattern (Figure 4.11a). Above the subject was a sky
plane, which was texture-mapped with a blue sky (Figure 4.11b) and clouds resembling the sky
in the opening sequence of a popular animated television series [Groe87]. The subject was
told to look up to see the blue sky, and to look down to see the patterned ground. This
sequence of having the subject look left, right, up, and down was done before each task
during all experiments, in order to orient the user each time.
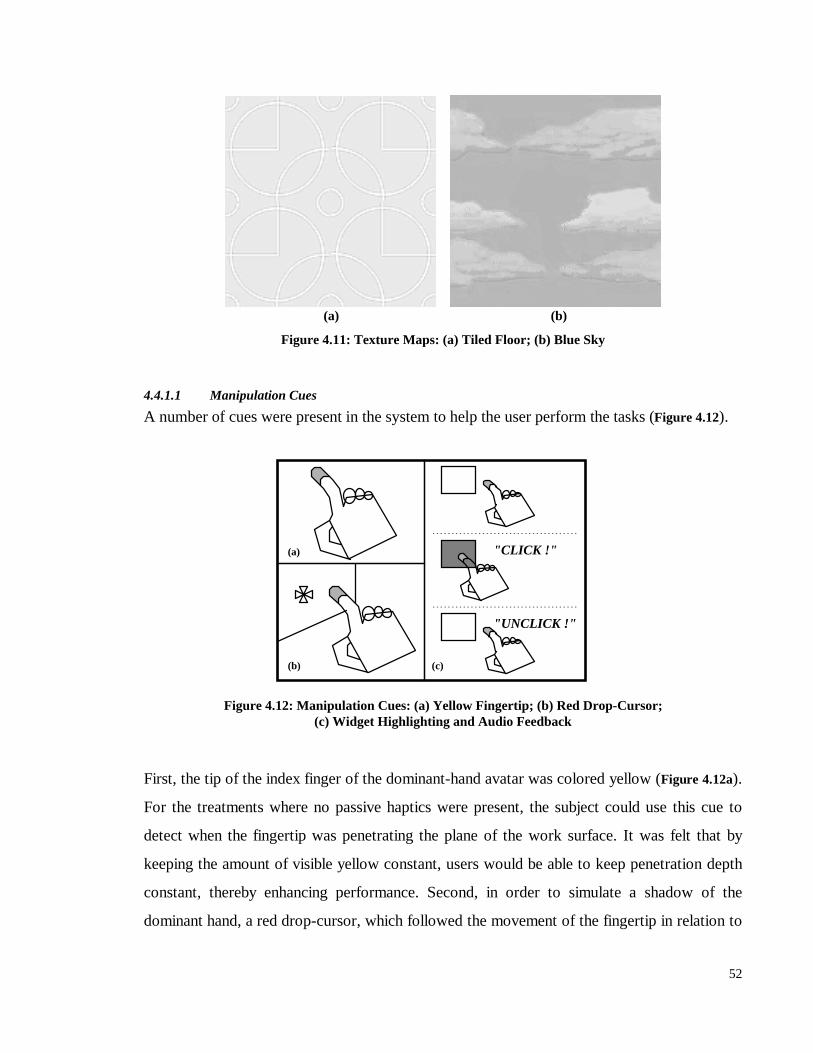
52
(a) (b)
Figure 4.11: Texture Maps: (a) Tiled Floor; (b) Blue Sky
4.4.1.1 Manipulation Cues
A number of cues were present in the system to help the user perform the tasks (Figure 4.12).
Figure 4.12: Manipulation Cues: (a) Yellow Fingertip; (b) Red Drop-Cursor;(c) Widget Highlighting and Audio Feedback
First, the tip of the index finger of the dominant-hand avatar was colored yellow (Figure 4.12a).
For the treatments where no passive haptics were present, the subject could use this cue to
detect when the fingertip was penetrating the plane of the work surface. It was felt that by
keeping the amount of visible yellow constant, users would be able to keep penetration depth
constant, thereby enhancing performance. Second, in order to simulate a shadow of the
dominant hand, a red drop-cursor, which followed the movement of the fingertip in relation to
"UNCLICK !"
"CLICK !"(a)
(b) (c)
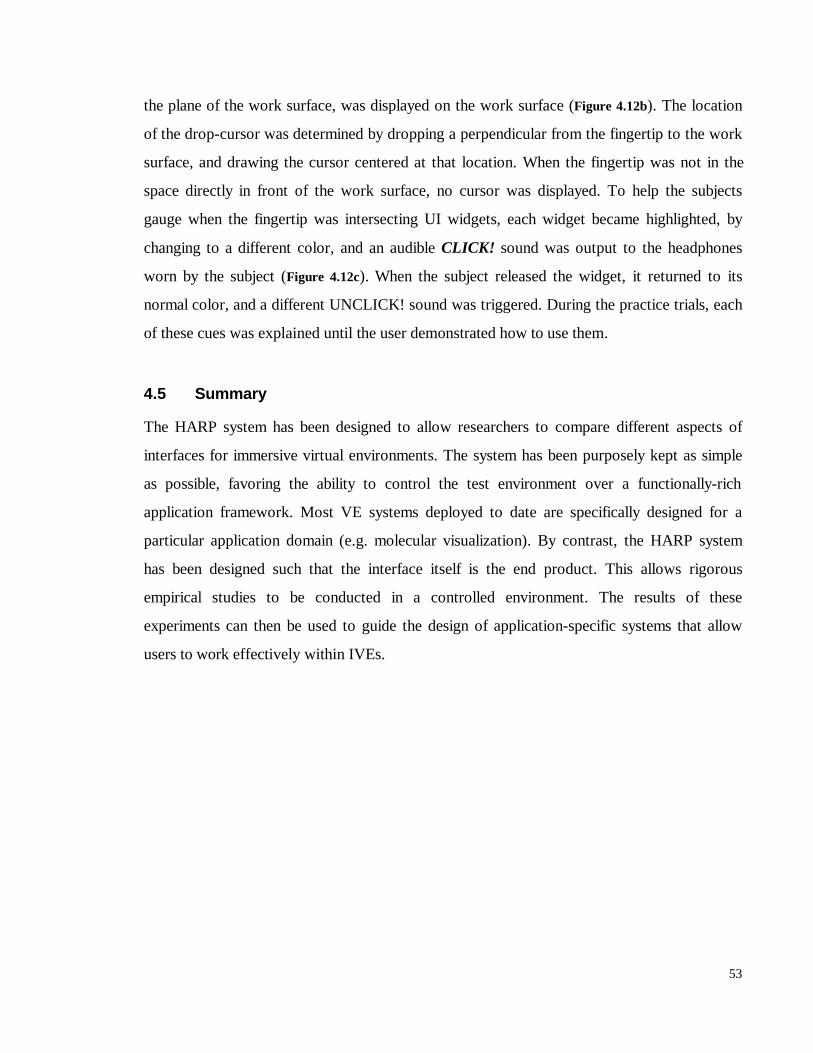
53
the plane of the work surface, was displayed on the work surface (Figure 4.12b). The location
of the drop-cursor was determined by dropping a perpendicular from the fingertip to the work
surface, and drawing the cursor centered at that location. When the fingertip was not in the
space directly in front of the work surface, no cursor was displayed. To help the subjects
gauge when the fingertip was intersecting UI widgets, each widget became highlighted, by
changing to a different color, and an audible CLICK! sound was output to the headphones
worn by the subject (Figure 4.12c). When the subject released the widget, it returned to its
normal color, and a different UNCLICK! sound was triggered. During the practice trials, each
of these cues was explained until the user demonstrated how to use them.
4.5 Summary
The HARP system has been designed to allow researchers to compare different aspects of
interfaces for immersive virtual environments. The system has been purposely kept as simple
as possible, favoring the ability to control the test environment over a functionally-rich
application framework. Most VE systems deployed to date are specifically designed for a
particular application domain (e.g. molecular visualization). By contrast, the HARP system
has been designed such that the interface itself is the end product. This allows rigorous
empirical studies to be conducted in a controlled environment. The results of these
experiments can then be used to guide the design of application-specific systems that allow
users to work effectively within IVEs.
54
5 Empirical Studies
5.1 Introduction
Manipulating UI widgets within IVEs using current methods can be difficult for those tasks
requiring a high degree of precision. The compound actions typically used when interacting
with UI widgets can be broken down into component (lower-level) actions, such as pressing a
button, positioning a slider, and using drag-and-drop to move an object from one place to
another. These experiments seek to compare user performance and preference when these
component tasks are performed within an IVE.
5.2 MotivationPerforming precise movements within IVEs using current approaches is cumbersome and
suboptimal. Desktop interfaces typically use symbolic manipulation, rather than direct
manipulation, for performing tasks requiring high precision. Current VE interface techniques,
however, lack the necessary characteristics for allowing users to perform precise
manipulations. These experiments hope to define characteristics that may be used to improve
user performance in IVEs.
5.3 UI Interaction DecompositionIn order to study UI interaction techniques using different interfaces, we can decompose user
interaction into basic motions. The work of Stuart Card and of Ben Shneiderman have
provided two convenient ways of looking at decomposing user interaction. Along with his
colleagues, Card introduced the GOMS model, consisting of Goals, Operators, Methods for
achieving the goals, and Selection rules for choosing among competing methods [Card83]. On
top of this, they describe "The Keystroke-Level Model," which allows a task to be broken
down into component parts, and defined using a concise notation. Furthermore, this model
can be used as a method for predicting the time it will take to accomplish certain higher-level
tasks which have been defined using the low-level notation.
55
This method of decomposition, however, is too low level for this research. An alternate
method is what Shneiderman calls Widget-Level Decomposition [Shne98]. Instead of dealing
with atomic actions, this approach looks at the widgets that are defined in the system, and
bases decomposition on the possible manipulations of these widgets. The HARP system has
buttons and sliders that can be configured to represent some typical UI widgets, such as drag-
and-drop icons, button presses, and slider-bars. As described above, we can think of the types
of UI actions based on these widgets as lying somewhere on a continuum. The end points of
this continuum are discrete actions and continuous actions. Discrete actions involve a single,
ballistic selection operation, such as clicking a toolbar icon. An example of a continuous
action is dragging a slider.
Empirical studies of user performance and preference on tasks which focus on these basic
action types have been designed. Results of these studies will be used to comment on the
different areas of the IVE interaction taxonomy in order suggest how we can develop general
IVE interfaces that allow users to work efficiently.
5.4 Experiments I and IIRecent work in designing interfaces for immersive virtual environments attempts to apply 2D
techniques to 3D worlds. However, there is a dearth of empirical studies into how best to
implement these interfaces; indeed, most designs seem to arise from simple intuition. As has
been done for desktop systems, we need to rigorously explore the different characteristics that
make up these interfaces, in order to elicit optimal user performance. These experiments hope
to define and compare the characteristics that may be used to improve IVE interfaces. In
Experiments I & II, interfaces combining two separate independent variables were explored:
bimanual interaction and passive-haptic feedback.
Guiard proposed a "Kinematic Chain Model" of human motor control [Guia88], which is a
generalization of the dominant/non-dominant hand interaction described above. His work also
showed that deciding which hand was "dominant" depended on the task being performed. In
56
these experiments, Guiard's findings are further studied, applying the use of bimanual
interaction to IVEs.
5.4.1 IVE UI ApproachesFeiner et al introduce the notion of using 2D windows in 3D worlds. The system they describe
is implemented for an augmented reality system, however we can apply the idea to immersive
environments as well. They identify three different types of windows, differentiated by what
the window is fixed to. World-fixed windows (called surround-fixed windows in [Fein93])
have an absolute, fixed position in the VE. As the user changes viewpoint, the world-fixed
windows go out of, or come into, view, as if they were fixed in space. These windows are
suited to displays or controls that are stationary in the IVE, such as command-and-control
panels. The second type of window is a view-fixed window (display-fixed in [Fein93]). These
windows move along with the user as they look around within the VE. They remain at a fixed
location, relative to the user's viewpoint, and may be suitable for displaying system-wide
attributes, such as the rendering method being used (Phong, Gouraud, wireframe, etc.). The
third type of window is an object-fixed window (world-fixed in [Fein93]). Each object-fixed
window is fixed, relative to a specific object in the VE. If the object moves, the window
moves along with it. These may be used to display and manipulate object attributes, such as to
display the current velocity of an airplane, or to turn on a virtual lamp. The terms world-fixed,
view-fixed, and object-fixed will be used for the remainder of this thesis in the manner just
defined.
As discussed above, there has been much work lately in the area of bimanual interaction
techniques. Two-handed interaction approaches suggest a class of special-purpose, object-
fixed windows: hand-held windows. These windows are fixed relative to an object held in the
non-dominant hand of the user, and provide many advantages. First, like view-fixed windows,
hand-held windows move along with the user, so they are always within reach. Second, unlike
view-fixed windows, they do not clutter the user's view, unless explicitly moved there by the
user. Hand-held windows also take advantage of the proprioceptive sense, because they reside
close to the non-dominant hand. Finally, some systems using hand-held windows have
57
incorporated a lightweight surface that the user carries around, and upon which UI widgets
are drawn and manipulated [Bill97a] [Bowm98a] [Stoa95] [Lind99b]. This should provide the
passive-haptic feedback necessary to carry out precise movements in IVEs.
5.4.2 Haptic Augmented RealityThe term Augmented Reality is typically used to describe a system where computer generated
images are combined with real world images, in order to add information to the real world
view [Milg95] [Alia97]. The use of real world objects in the haptic domain parallels the use of
real world images in the visual domain, enhancing the user’s perception of the real world. By
holding a physical object in their hand, the user is presented with more stimuli, providing
higher fidelity. Also, because the virtual objects and real objects are registered, the stimuli are
multimodal and complementary, providing enhanced feedback.
The use of the paddle also helps to steady the user’s hands when performing interactions.
Using interfaces like the floating windows interface, it can be difficult to precisely move a
slider along its long axis. This is because the slider widget, originally designed for desktop
environments, requires precise positioning capabilities beyond those of freehand techniques.
With the HARP System, the user’s finger slides along the surface of the paddle, providing
more support.
Feedback for collisions of the user’s index finger with button widgets is also enhanced. In
more traditional interfaces, when a cursor intersects a button widget, visual feedback is given
to the user. In our system, in addition to visual cues, intersection with virtual UI widgets gives
the user the added passive-haptic feedback of the real paddle, because the virtual and real
paddles are registered. This, it is felt, will allow the user to more effectively interact with the
user interface.
5.4.3 Experimental MethodThis section describes the experimental design used in the first two empirical studies
conducted with the HARP system interface. These experiments are designed to compare
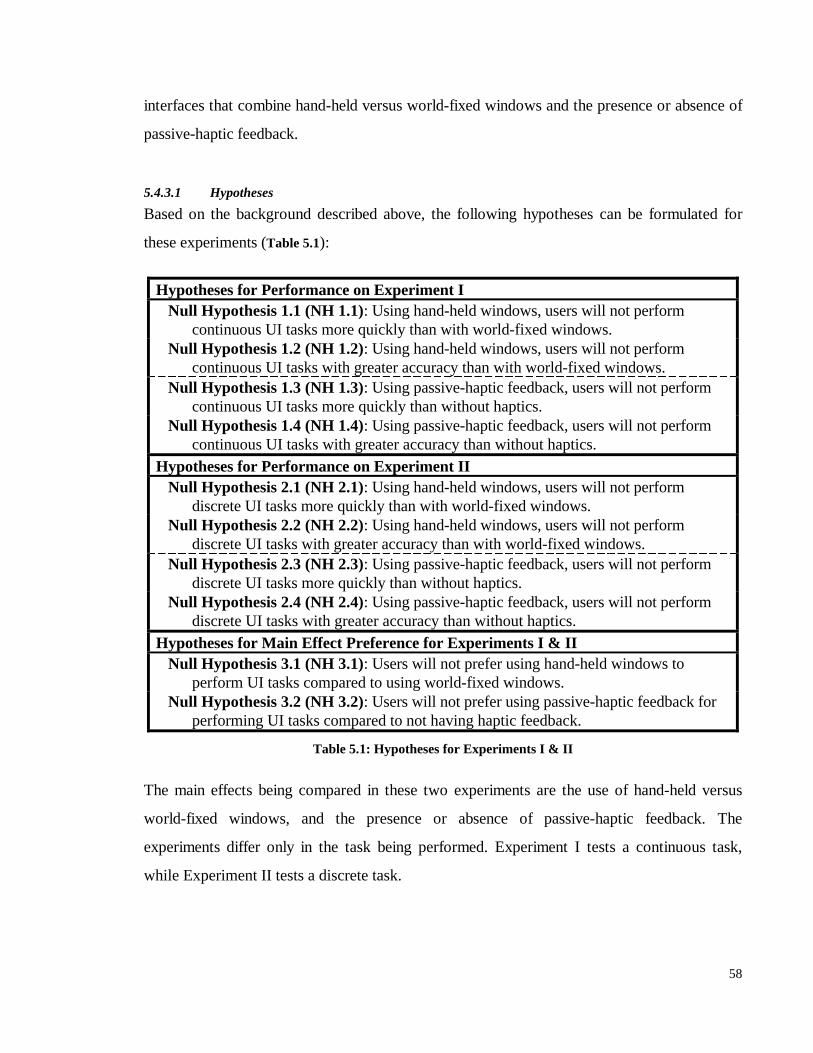
58
interfaces that combine hand-held versus world-fixed windows and the presence or absence of
passive-haptic feedback.
5.4.3.1 Hypotheses
Based on the background described above, the following hypotheses can be formulated for
these experiments (Table 5.1):
Hypotheses for Performance on Experiment INull Hypothesis 1.1 (NH 1.1): Using hand-held windows, users will not perform
continuous UI tasks more quickly than with world-fixed windows.Null Hypothesis 1.2 (NH 1.2): Using hand-held windows, users will not perform
continuous UI tasks with greater accuracy than with world-fixed windows.Null Hypothesis 1.3 (NH 1.3): Using passive-haptic feedback, users will not perform
continuous UI tasks more quickly than without haptics.Null Hypothesis 1.4 (NH 1.4): Using passive-haptic feedback, users will not perform
continuous UI tasks with greater accuracy than without haptics.Hypotheses for Performance on Experiment II
Null Hypothesis 2.1 (NH 2.1): Using hand-held windows, users will not performdiscrete UI tasks more quickly than with world-fixed windows.
Null Hypothesis 2.2 (NH 2.2): Using hand-held windows, users will not performdiscrete UI tasks with greater accuracy than with world-fixed windows.
Null Hypothesis 2.3 (NH 2.3): Using passive-haptic feedback, users will not performdiscrete UI tasks more quickly than without haptics.
Null Hypothesis 2.4 (NH 2.4): Using passive-haptic feedback, users will not performdiscrete UI tasks with greater accuracy than without haptics.
Hypotheses for Main Effect Preference for Experiments I & IINull Hypothesis 3.1 (NH 3.1): Users will not prefer using hand-held windows to
perform UI tasks compared to using world-fixed windows.Null Hypothesis 3.2 (NH 3.2): Users will not prefer using passive-haptic feedback for
performing UI tasks compared to not having haptic feedback.
Table 5.1: Hypotheses for Experiments I & II
The main effects being compared in these two experiments are the use of hand-held versus
world-fixed windows, and the presence or absence of passive-haptic feedback. The
experiments differ only in the task being performed. Experiment I tests a continuous task,
while Experiment II tests a discrete task.
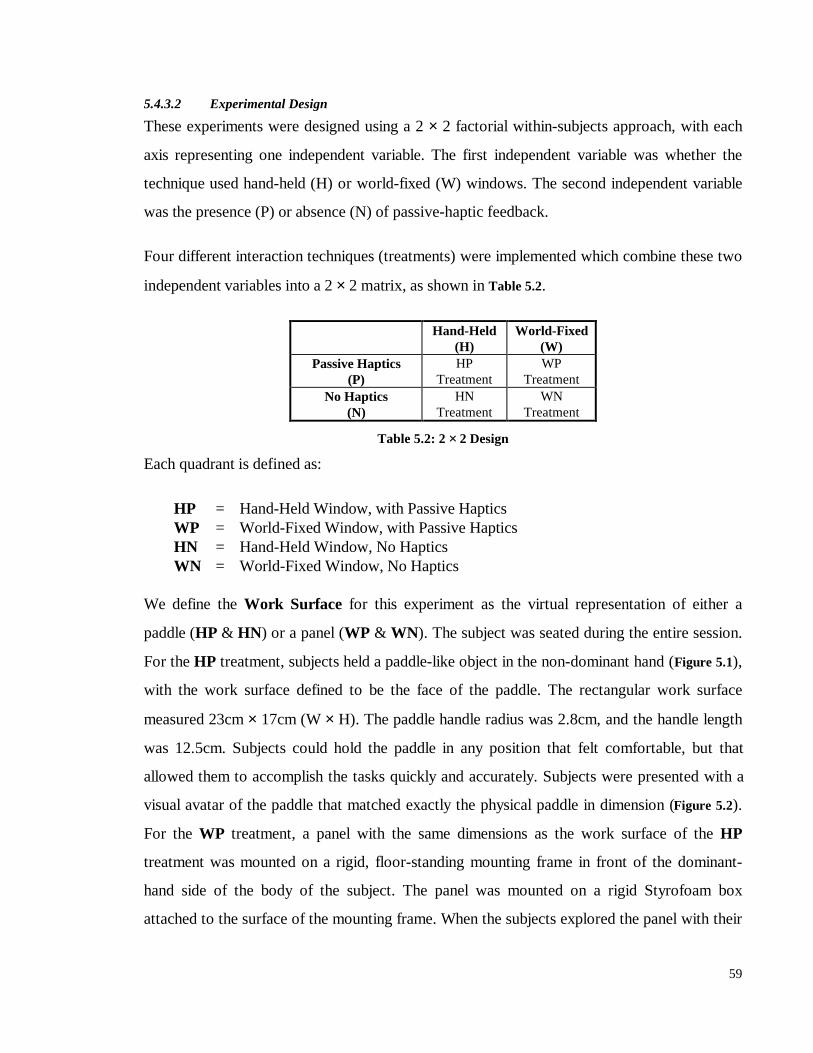
59
5.4.3.2 Experimental Design
These experiments were designed using a 2 × 2 factorial within-subjects approach, with each
axis representing one independent variable. The first independent variable was whether the
technique used hand-held (H) or world-fixed (W) windows. The second independent variable
was the presence (P) or absence (N) of passive-haptic feedback.
Four different interaction techniques (treatments) were implemented which combine these two
independent variables into a 2 × 2 matrix, as shown in Table 5.2.
Hand-Held(H)
World-Fixed(W)
Passive Haptics(P)
HPTreatment
WPTreatment
No Haptics(N)
HNTreatment
WNTreatment
Table 5.2: 2 × 2 Design
Each quadrant is defined as:
HP = Hand-Held Window, with Passive HapticsWP = World-Fixed Window, with Passive HapticsHN = Hand-Held Window, No HapticsWN = World-Fixed Window, No Haptics
We define the Work Surface for this experiment as the virtual representation of either a
paddle (HP & HN) or a panel (WP & WN). The subject was seated during the entire session.
For the HP treatment, subjects held a paddle-like object in the non-dominant hand (Figure 5.1),
with the work surface defined to be the face of the paddle. The rectangular work surface
measured 23cm × 17cm (W × H). The paddle handle radius was 2.8cm, and the handle length
was 12.5cm. Subjects could hold the paddle in any position that felt comfortable, but that
allowed them to accomplish the tasks quickly and accurately. Subjects were presented with a
visual avatar of the paddle that matched exactly the physical paddle in dimension (Figure 5.2).
For the WP treatment, a panel with the same dimensions as the work surface of the HP
treatment was mounted on a rigid, floor-standing mounting frame in front of the dominant-
hand side of the body of the subject. The panel was mounted on a rigid Styrofoam box
attached to the surface of the mounting frame. When the subjects explored the panel with their
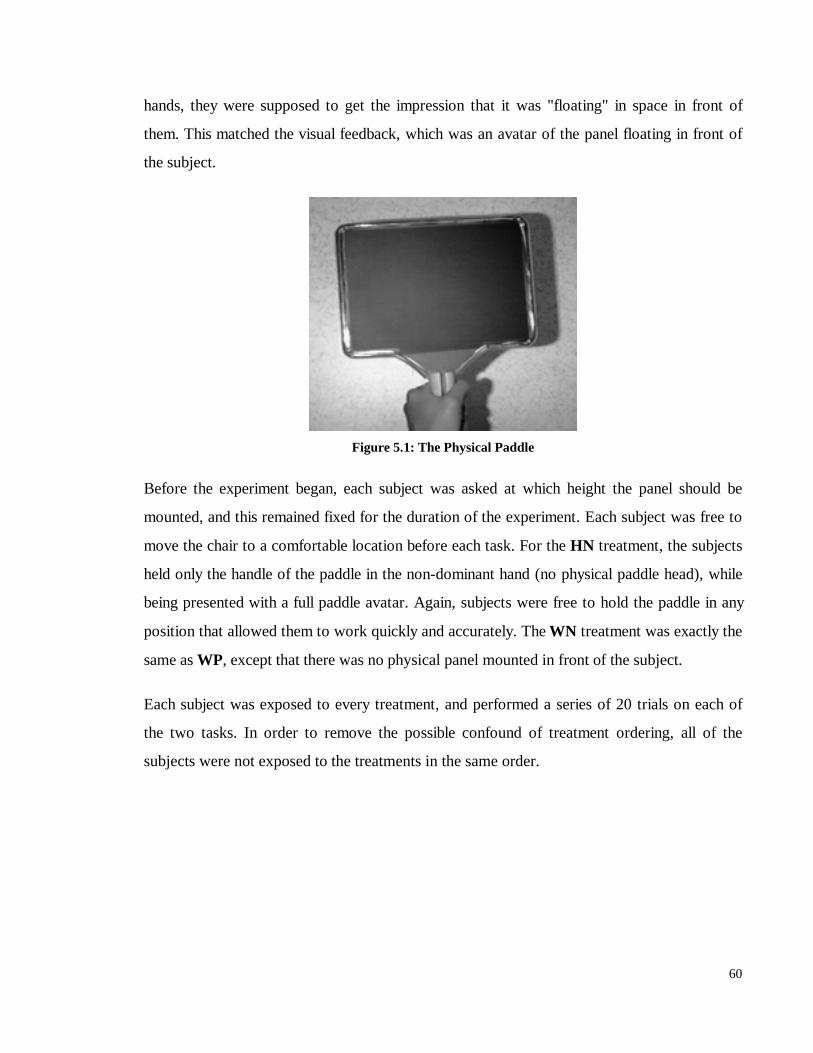
60
hands, they were supposed to get the impression that it was "floating" in space in front of
them. This matched the visual feedback, which was an avatar of the panel floating in front of
the subject.
Figure 5.1: The Physical Paddle
Before the experiment began, each subject was asked at which height the panel should be
mounted, and this remained fixed for the duration of the experiment. Each subject was free to
move the chair to a comfortable location before each task. For the HN treatment, the subjects
held only the handle of the paddle in the non-dominant hand (no physical paddle head), while
being presented with a full paddle avatar. Again, subjects were free to hold the paddle in any
position that allowed them to work quickly and accurately. The WN treatment was exactly the
same as WP, except that there was no physical panel mounted in front of the subject.
Each subject was exposed to every treatment, and performed a series of 20 trials on each of
the two tasks. In order to remove the possible confound of treatment ordering, all of the
subjects were not exposed to the treatments in the same order.
61
There are 4-factorial (or 24) different orderings for four treatments:
HP WP HN WN HP WP WN HN HP HN WN WPHP HN WP WN HP WN WP HN HP WN HN WP
WP HP HN WN WP HP WN HN WP HN HP WNWP HN WN HP WP WN HP HN WP WN HN HP
HN HP WP WN HN HP WN WP HN WP HP WNHN WP WN HP HN WN HP WP HN WN WP HP
WN HP WP HN WN HP HN WP WN WP HP HNWN WP HN HP WN HN HP WP WN HN WP HP
Using a version of a Latin squares design, called diagram-balanced counterbalance ordering, a
set of orderings was constructed where each of the four treatments appeared in each position
exactly once, and followed and preceded the other three treatments exactly once. Such
orderings looked like this:
1 HP WP HN WN2 WP WN HP HN3 HN HP WN WP4 WN HN WP HP
Each subject was randomly assigned one of these four treatment orderings.
Another possible confound that had to be accounted for was trial ordering. Each subject
performed the same 20 trials for each treatment, but with a different trial order. Four different
random orderings for the 20 trials were defined. If we number these orderings 1 through 4,
each subject performed the trials with ordering 1 for the first treatment they were exposed to,
2 for the second treatment they were exposed to, and so forth. This way, though subjects
were exposed to the trial orderings in the same order, they had different treatment orderings,
and therefore did not have the same trial ordering for the corresponding treatments.
In order to clarify this, Table 5.3 shows which trial and treatment order each subject was
exposed to:
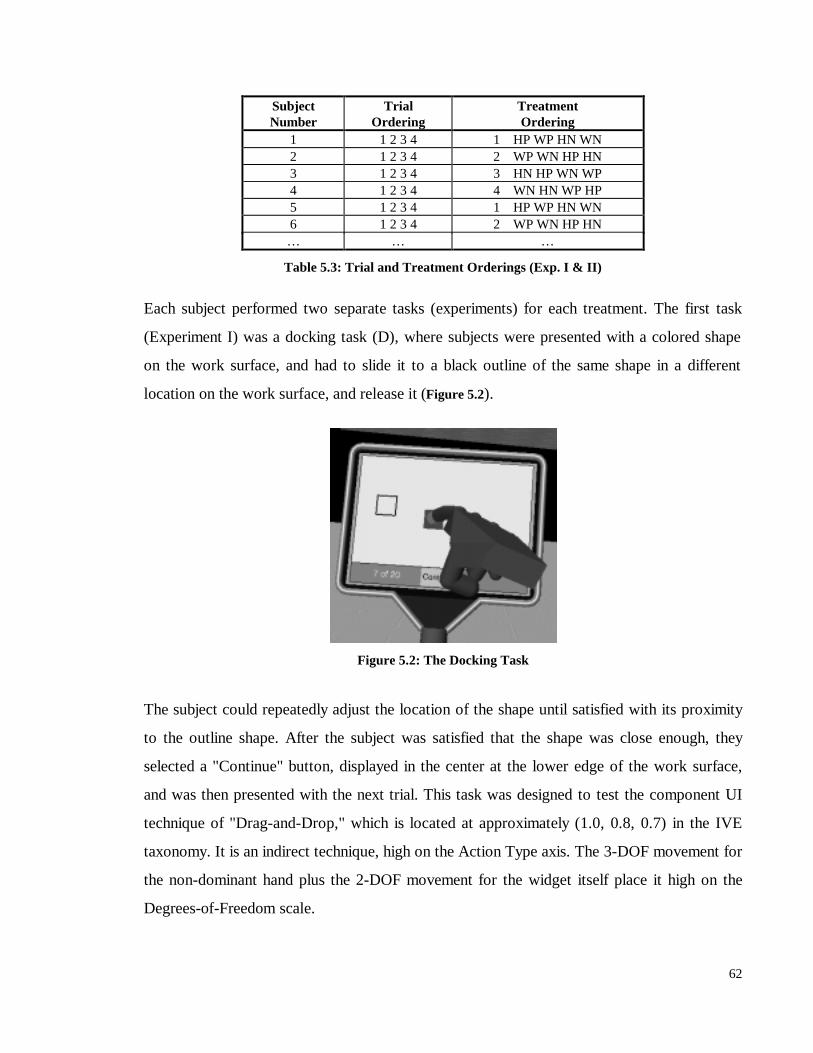
62
SubjectNumber
TrialOrdering
TreatmentOrdering
1 1 2 3 4 1 HP WP HN WN2 1 2 3 4 2 WP WN HP HN3 1 2 3 4 3 HN HP WN WP4 1 2 3 4 4 WN HN WP HP5 1 2 3 4 1 HP WP HN WN6 1 2 3 4 2 WP WN HP HN… … …
Table 5.3: Trial and Treatment Orderings (Exp. I & II)
Each subject performed two separate tasks (experiments) for each treatment. The first task
(Experiment I) was a docking task (D), where subjects were presented with a colored shape
on the work surface, and had to slide it to a black outline of the same shape in a different
location on the work surface, and release it (Figure 5.2).
Figure 5.2: The Docking Task
The subject could repeatedly adjust the location of the shape until satisfied with its proximity
to the outline shape. After the subject was satisfied that the shape was close enough, they
selected a "Continue" button, displayed in the center at the lower edge of the work surface,
and was then presented with the next trial. This task was designed to test the component UI
technique of "Drag-and-Drop," which is located at approximately (1.0, 0.8, 0.7) in the IVE
taxonomy. It is an indirect technique, high on the Action Type axis. The 3-DOF movement for
the non-dominant hand plus the 2-DOF movement for the widget itself place it high on the
Degrees-of-Freedom scale.
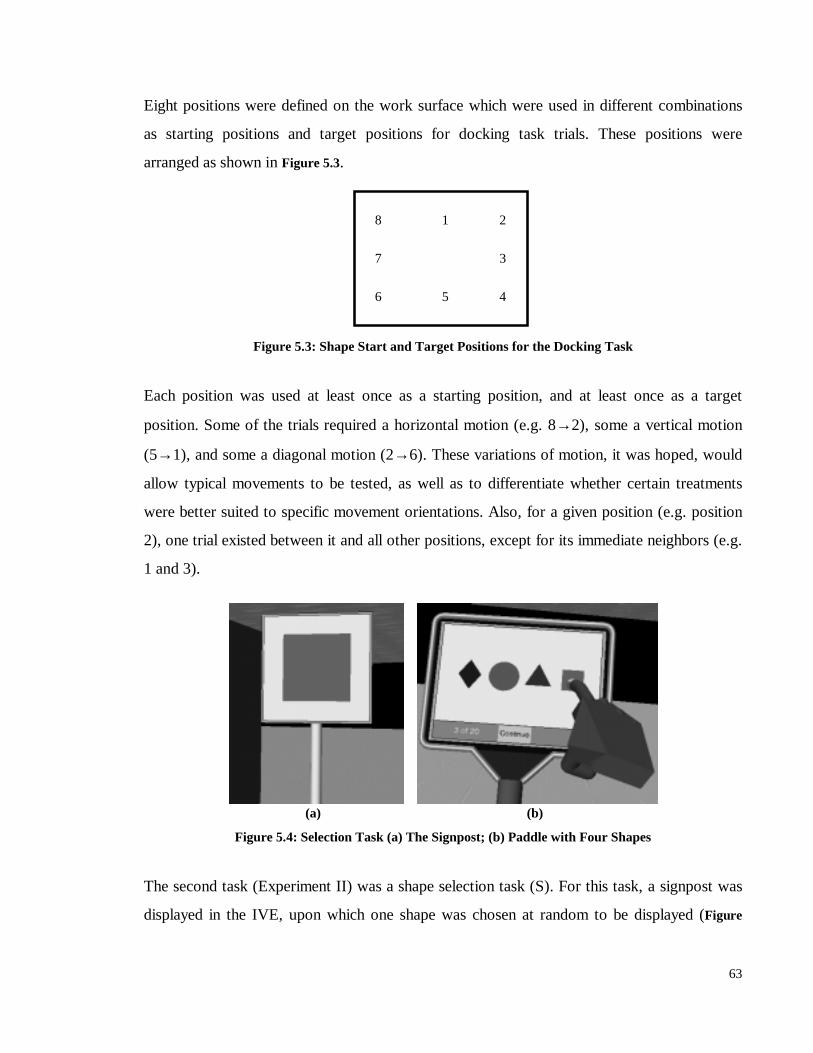
63
Eight positions were defined on the work surface which were used in different combinations
as starting positions and target positions for docking task trials. These positions were
arranged as shown in Figure 5.3.
Figure 5.3: Shape Start and Target Positions for the Docking Task
Each position was used at least once as a starting position, and at least once as a target
position. Some of the trials required a horizontal motion (e.g. 8→2), some a vertical motion
(5→1), and some a diagonal motion (2→6). These variations of motion, it was hoped, would
allow typical movements to be tested, as well as to differentiate whether certain treatments
were better suited to specific movement orientations. Also, for a given position (e.g. position
2), one trial existed between it and all other positions, except for its immediate neighbors (e.g.
1 and 3).
(a) (b)
Figure 5.4: Selection Task (a) The Signpost; (b) Paddle with Four Shapes
The second task (Experiment II) was a shape selection task (S). For this task, a signpost was
displayed in the IVE, upon which one shape was chosen at random to be displayed (Figure
8 1 2
3
45
7
6
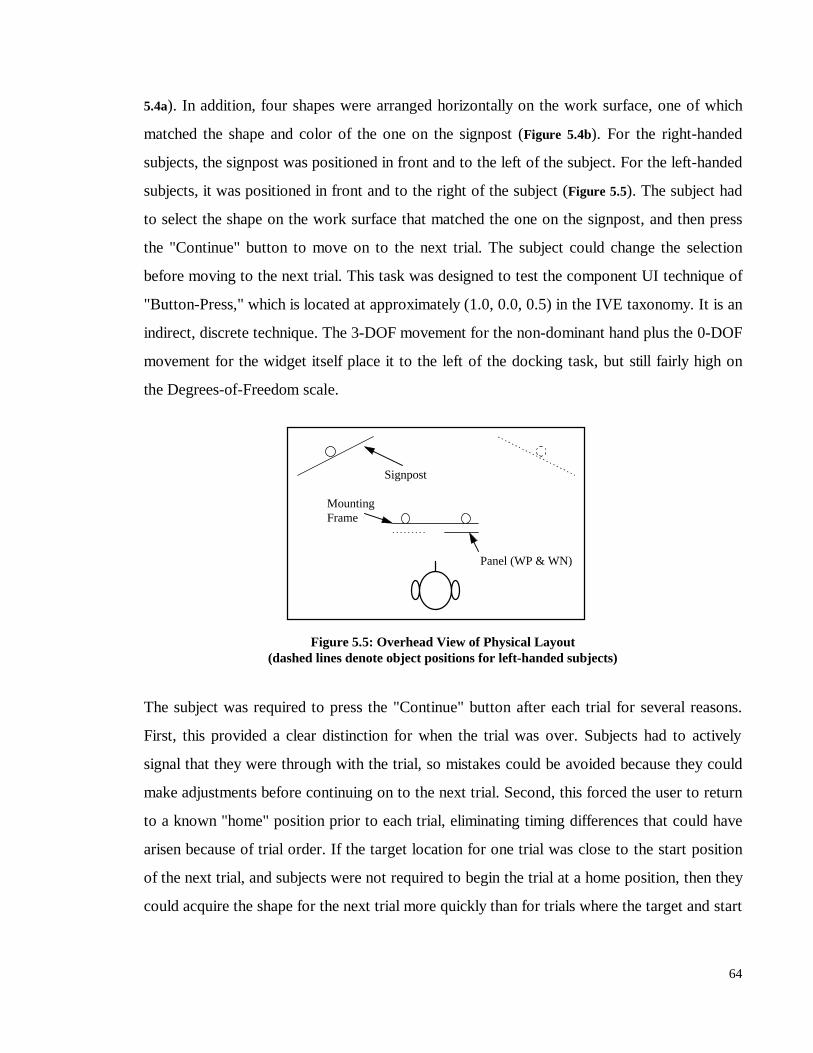
64
5.4a). In addition, four shapes were arranged horizontally on the work surface, one of which
matched the shape and color of the one on the signpost (Figure 5.4b). For the right-handed
subjects, the signpost was positioned in front and to the left of the subject. For the left-handed
subjects, it was positioned in front and to the right of the subject (Figure 5.5). The subject had
to select the shape on the work surface that matched the one on the signpost, and then press
the "Continue" button to move on to the next trial. The subject could change the selection
before moving to the next trial. This task was designed to test the component UI technique of
"Button-Press," which is located at approximately (1.0, 0.0, 0.5) in the IVE taxonomy. It is an
indirect, discrete technique. The 3-DOF movement for the non-dominant hand plus the 0-DOF
movement for the widget itself place it to the left of the docking task, but still fairly high on
the Degrees-of-Freedom scale.
Figure 5.5: Overhead View of Physical Layout(dashed lines denote object positions for left-handed subjects)
The subject was required to press the "Continue" button after each trial for several reasons.
First, this provided a clear distinction for when the trial was over. Subjects had to actively
signal that they were through with the trial, so mistakes could be avoided because they could
make adjustments before continuing on to the next trial. Second, this forced the user to return
to a known "home" position prior to each trial, eliminating timing differences that could have
arisen because of trial order. If the target location for one trial was close to the start position
of the next trial, and subjects were not required to begin the trial at a home position, then they
could acquire the shape for the next trial more quickly than for trials where the target and start
Signpost
Panel (WP & WN)
MountingFrame
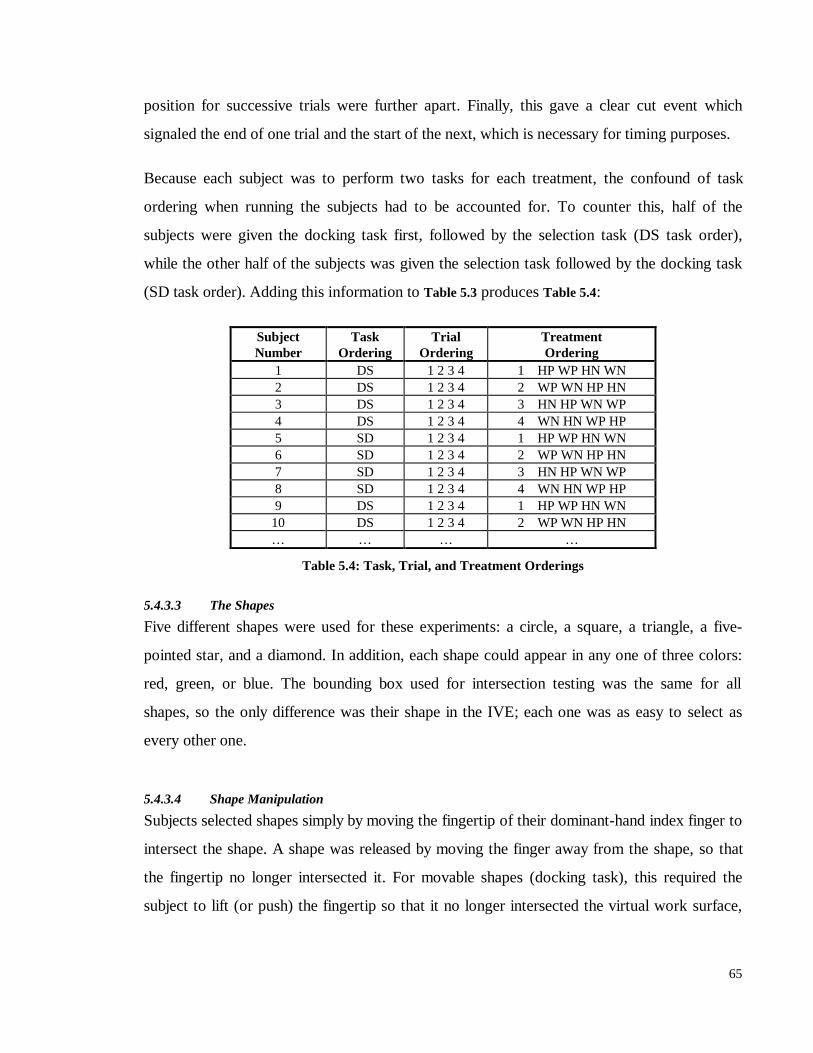
65
position for successive trials were further apart. Finally, this gave a clear cut event which
signaled the end of one trial and the start of the next, which is necessary for timing purposes.
Because each subject was to perform two tasks for each treatment, the confound of task
ordering when running the subjects had to be accounted for. To counter this, half of the
subjects were given the docking task first, followed by the selection task (DS task order),
while the other half of the subjects was given the selection task followed by the docking task
(SD task order). Adding this information to Table 5.3 produces Table 5.4:
SubjectNumber
TaskOrdering
TrialOrdering
TreatmentOrdering
1 DS 1 2 3 4 1 HP WP HN WN2 DS 1 2 3 4 2 WP WN HP HN3 DS 1 2 3 4 3 HN HP WN WP4 DS 1 2 3 4 4 WN HN WP HP5 SD 1 2 3 4 1 HP WP HN WN6 SD 1 2 3 4 2 WP WN HP HN7 SD 1 2 3 4 3 HN HP WN WP8 SD 1 2 3 4 4 WN HN WP HP9 DS 1 2 3 4 1 HP WP HN WN10 DS 1 2 3 4 2 WP WN HP HN… … … …
Table 5.4: Task, Trial, and Treatment Orderings
5.4.3.3 The Shapes
Five different shapes were used for these experiments: a circle, a square, a triangle, a five-
pointed star, and a diamond. In addition, each shape could appear in any one of three colors:
red, green, or blue. The bounding box used for intersection testing was the same for all
shapes, so the only difference was their shape in the IVE; each one was as easy to select as
every other one.
5.4.3.4 Shape Manipulation
Subjects selected shapes simply by moving the fingertip of their dominant-hand index finger to
intersect the shape. A shape was released by moving the finger away from the shape, so that
the fingertip no longer intersected it. For movable shapes (docking task), this required the
subject to lift (or push) the fingertip so that it no longer intersected the virtual work surface,
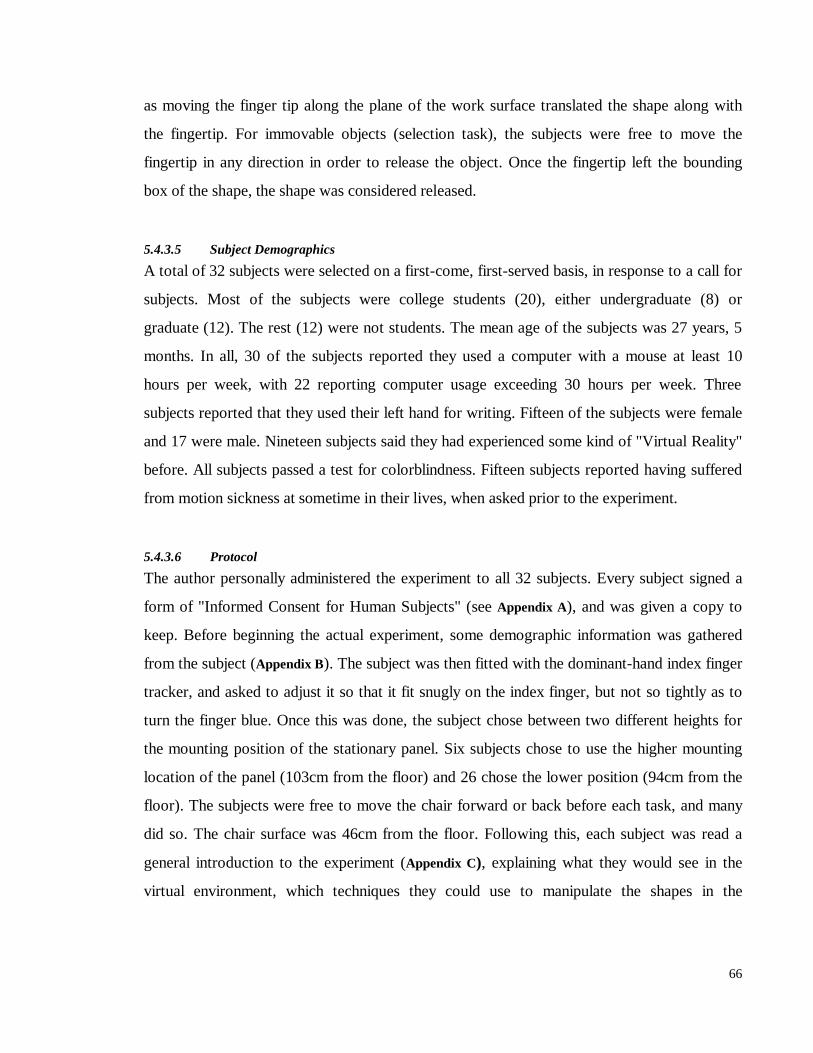
66
as moving the finger tip along the plane of the work surface translated the shape along with
the fingertip. For immovable objects (selection task), the subjects were free to move the
fingertip in any direction in order to release the object. Once the fingertip left the bounding
box of the shape, the shape was considered released.
5.4.3.5 Subject Demographics
A total of 32 subjects were selected on a first-come, first-served basis, in response to a call for
subjects. Most of the subjects were college students (20), either undergraduate (8) or
graduate (12). The rest (12) were not students. The mean age of the subjects was 27 years, 5
months. In all, 30 of the subjects reported they used a computer with a mouse at least 10
hours per week, with 22 reporting computer usage exceeding 30 hours per week. Three
subjects reported that they used their left hand for writing. Fifteen of the subjects were female
and 17 were male. Nineteen subjects said they had experienced some kind of "Virtual Reality"
before. All subjects passed a test for colorblindness. Fifteen subjects reported having suffered
from motion sickness at sometime in their lives, when asked prior to the experiment.
5.4.3.6 Protocol
The author personally administered the experiment to all 32 subjects. Every subject signed a
form of "Informed Consent for Human Subjects" (see Appendix A), and was given a copy to
keep. Before beginning the actual experiment, some demographic information was gathered
from the subject (Appendix B). The subject was then fitted with the dominant-hand index finger
tracker, and asked to adjust it so that it fit snugly on the index finger, but not so tightly as to
turn the finger blue. Once this was done, the subject chose between two different heights for
the mounting position of the stationary panel. Six subjects chose to use the higher mounting
location of the panel (103cm from the floor) and 26 chose the lower position (94cm from the
floor). The subjects were free to move the chair forward or back before each task, and many
did so. The chair surface was 46cm from the floor. Following this, each subject was read a
general introduction to the experiment (Appendix C), explaining what they would see in the
virtual environment, which techniques they could use to manipulate the shapes in the
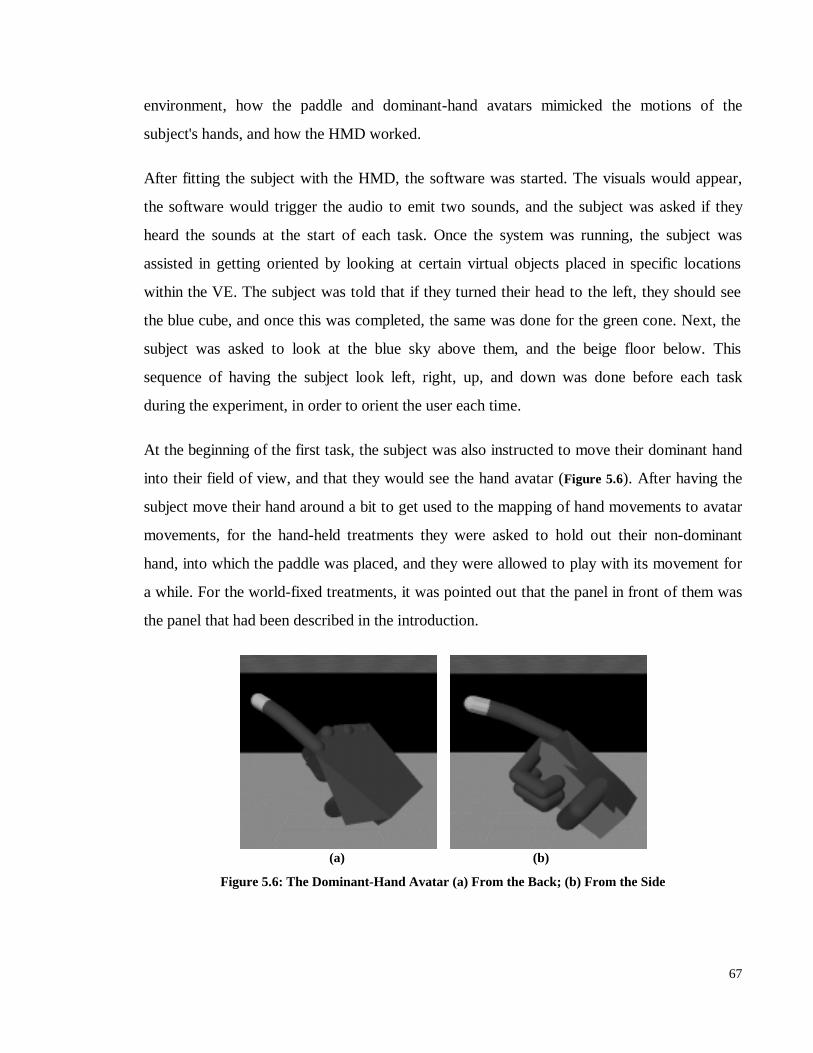
67
environment, how the paddle and dominant-hand avatars mimicked the motions of the
subject's hands, and how the HMD worked.
After fitting the subject with the HMD, the software was started. The visuals would appear,
the software would trigger the audio to emit two sounds, and the subject was asked if they
heard the sounds at the start of each task. Once the system was running, the subject was
assisted in getting oriented by looking at certain virtual objects placed in specific locations
within the VE. The subject was told that if they turned their head to the left, they should see
the blue cube, and once this was completed, the same was done for the green cone. Next, the
subject was asked to look at the blue sky above them, and the beige floor below. This
sequence of having the subject look left, right, up, and down was done before each task
during the experiment, in order to orient the user each time.
At the beginning of the first task, the subject was also instructed to move their dominant hand
into their field of view, and that they would see the hand avatar (Figure 5.6). After having the
subject move their hand around a bit to get used to the mapping of hand movements to avatar
movements, for the hand-held treatments they were asked to hold out their non-dominant
hand, into which the paddle was placed, and they were allowed to play with its movement for
a while. For the world-fixed treatments, it was pointed out that the panel in front of them was
the panel that had been described in the introduction.
(a) (b)
Figure 5.6: The Dominant-Hand Avatar (a) From the Back; (b) From the Side
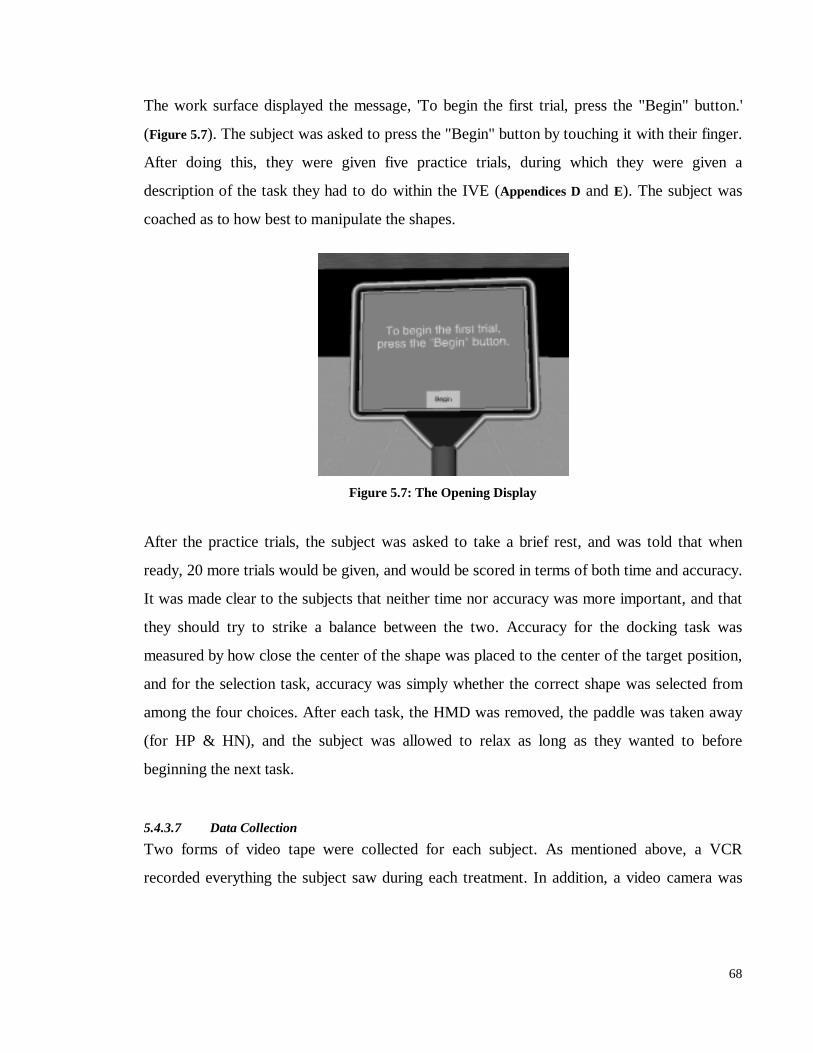
68
The work surface displayed the message, 'To begin the first trial, press the "Begin" button.'
(Figure 5.7). The subject was asked to press the "Begin" button by touching it with their finger.
After doing this, they were given five practice trials, during which they were given a
description of the task they had to do within the IVE (Appendices D and E). The subject was
coached as to how best to manipulate the shapes.
Figure 5.7: The Opening Display
After the practice trials, the subject was asked to take a brief rest, and was told that when
ready, 20 more trials would be given, and would be scored in terms of both time and accuracy.
It was made clear to the subjects that neither time nor accuracy was more important, and that
they should try to strike a balance between the two. Accuracy for the docking task was
measured by how close the center of the shape was placed to the center of the target position,
and for the selection task, accuracy was simply whether the correct shape was selected from
among the four choices. After each task, the HMD was removed, the paddle was taken away
(for HP & HN), and the subject was allowed to relax as long as they wanted to before
beginning the next task.
5.4.3.7 Data Collection
Two forms of video tape were collected for each subject. As mentioned above, a VCR
recorded everything the subject saw during each treatment. In addition, a video camera was
69
set up to capture the motions of the user during the experiment, as well as to capture the
questionnaire sessions. The video tape was not analyzed for this dissertation.
The tracker software was also extended to log all the tracker data during each session to a
disk file. This would allow for a review of the session of any subject. This data could also be
analyzed later to evaluate such things as the exact range of motion of the head during the
session, though no such analysis has as yet been done.
A substantial amount of qualitative data was collected for each treatment using a
questionnaire (Appendix F). There were six questions; four arranged on Likert scales; one
yes/no question; and a freeform request-for-comments question. The questionnaire was
administered after each treatment. At the end of all the treatments, a questionnaire with
comparative questions was also administered (Appendix G). In order to produce an overall
measure of subject preference for the four treatments, we can compute a composite value
from the qualitative data. This measure is computed by averaging each of the Likert values
from the four questions posed after each treatment. Because "positive" responses for the four
characteristics were given higher numbers, on a scale between one and five, the average of the
ease-of-use, arm fatigue, eye fatigue, and motion sickness questions gives us an overall
measure of preference. A score of 1 would signify a lower preference than a score of 5.
Quantitative data was collected by the software for each trial of each task. All the measures
for the two experiments are shown in Table 5.5.
Some of the measures will be used as primary measures, and some as secondary measures.
The primary measures, 1, 5, 6, and 11, are boxed in bold lines in the table, and will be used to
test the null hypotheses. The remaining measures are secondary measures, and will be used to
make further comments on the results. Because there is such a large number of possible ways
to analyze the data, this dissertation focuses only on those data that help answer the questions
being addressed.
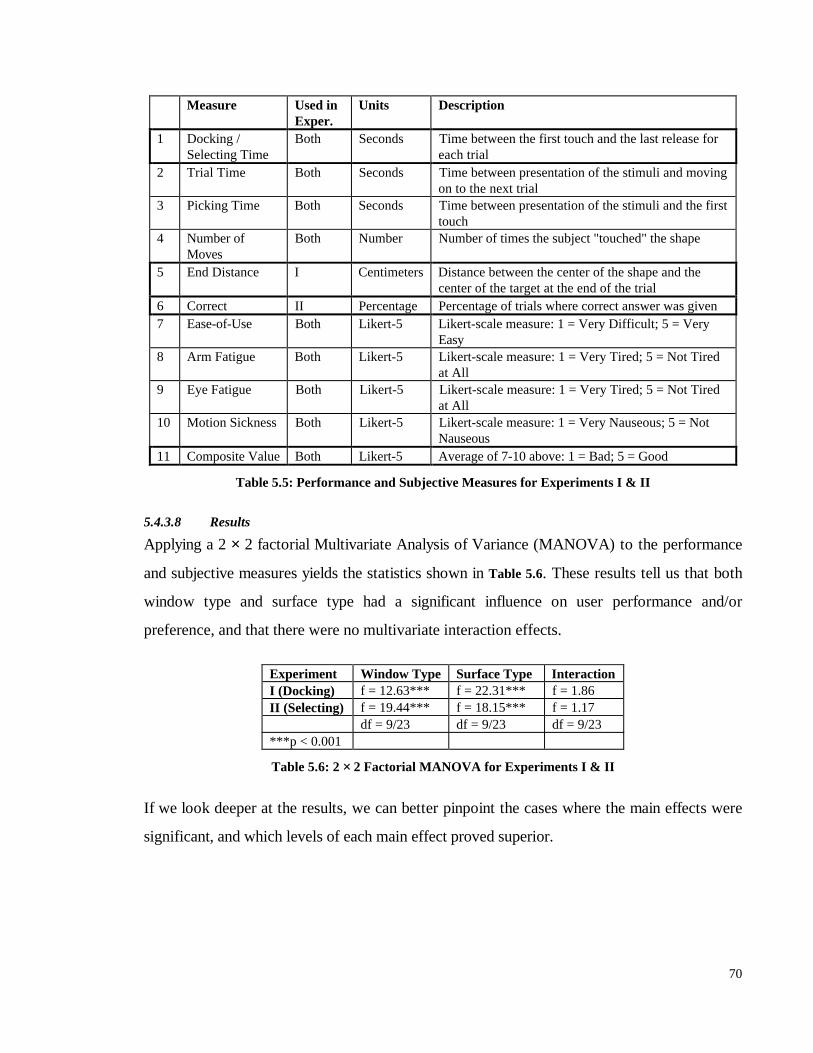
70
Measure Used inExper.
Units Description
1 Docking /Selecting Time
Both Seconds Time between the first touch and the last release foreach trial
2 Trial Time Both Seconds Time between presentation of the stimuli and movingon to the next trial
3 Picking Time Both Seconds Time between presentation of the stimuli and the firsttouch
4 Number ofMoves
Both Number Number of times the subject "touched" the shape
5 End Distance I Centimeters Distance between the center of the shape and thecenter of the target at the end of the trial
6 Correct II Percentage Percentage of trials where correct answer was given7 Ease-of-Use Both Likert-5 Likert-scale measure: 1 = Very Difficult; 5 = Very
Easy8 Arm Fatigue Both Likert-5 Likert-scale measure: 1 = Very Tired; 5 = Not Tired
at All9 Eye Fatigue Both Likert-5 Likert-scale measure: 1 = Very Tired; 5 = Not Tired
at All10 Motion Sickness Both Likert-5 Likert-scale measure: 1 = Very Nauseous; 5 = Not
Nauseous11 Composite Value Both Likert-5 Average of 7-10 above: 1 = Bad; 5 = Good
Table 5.5: Performance and Subjective Measures for Experiments I & II
5.4.3.8 Results
Applying a 2 × 2 factorial Multivariate Analysis of Variance (MANOVA) to the performance
and subjective measures yields the statistics shown in Table 5.6. These results tell us that both
window type and surface type had a significant influence on user performance and/or
preference, and that there were no multivariate interaction effects.
Experiment Window Type Surface Type InteractionI (Docking) f = 12.63*** f = 22.31*** f = 1.86II (Selecting) f = 19.44*** f = 18.15*** f = 1.17
df = 9/23 df = 9/23 df = 9/23***p < 0.001
Table 5.6: 2 × 2 Factorial MANOVA for Experiments I & II
If we look deeper at the results, we can better pinpoint the cases where the main effects were
significant, and which levels of each main effect proved superior.
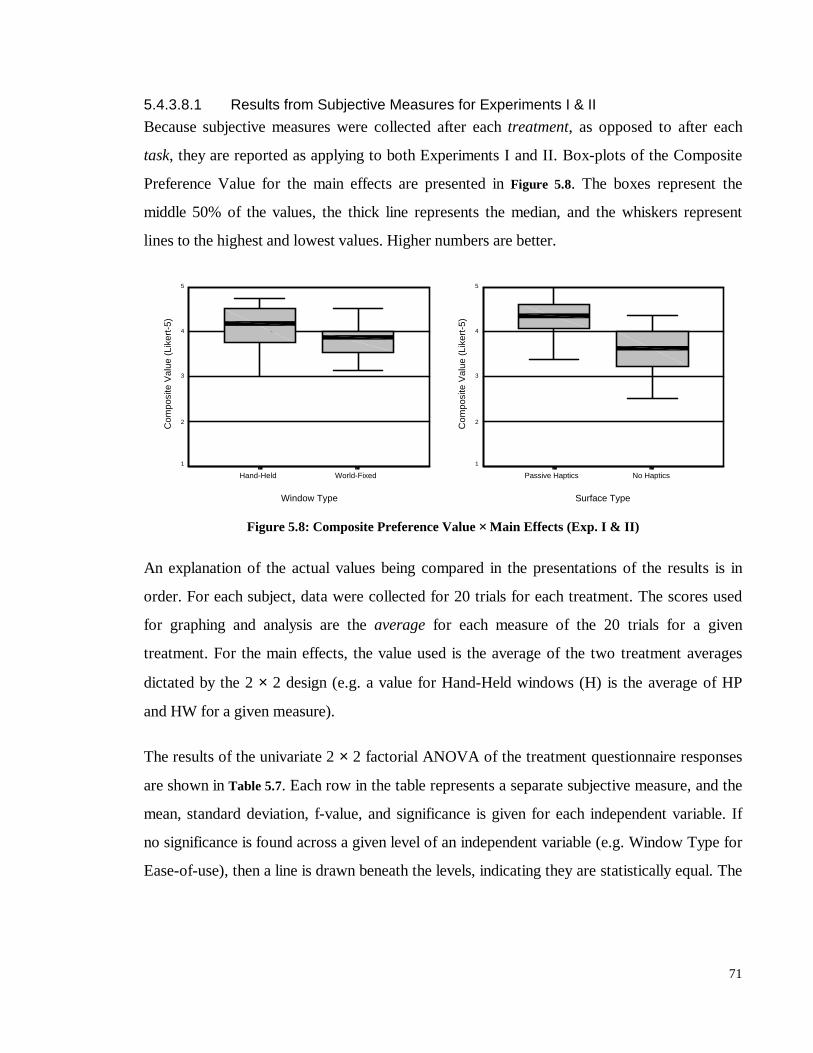
71
5.4.3.8.1 Results from Subjective Measures for Experiments I & II
Because subjective measures were collected after each treatment, as opposed to after each
task, they are reported as applying to both Experiments I and II. Box-plots of the Composite
Preference Value for the main effects are presented in Figure 5.8. The boxes represent the
middle 50% of the values, the thick line represents the median, and the whiskers represent
lines to the highest and lowest values. Higher numbers are better.
Window Type
World-FixedHand-Held
Com
posi
te V
alue
(Li
kert
-5)
5
4
3
2
1
Surface Type
No HapticsPassive Haptics
Com
posi
te V
alue
(Li
kert
-5)
5
4
3
2
1
Figure 5.8: Composite Preference Value × Main Effects (Exp. I & II)
An explanation of the actual values being compared in the presentations of the results is in
order. For each subject, data were collected for 20 trials for each treatment. The scores used
for graphing and analysis are the average for each measure of the 20 trials for a given
treatment. For the main effects, the value used is the average of the two treatment averages
dictated by the 2 × 2 design (e.g. a value for Hand-Held windows (H) is the average of HP
and HW for a given measure).
The results of the univariate 2 × 2 factorial ANOVA of the treatment questionnaire responses
are shown in Table 5.7. Each row in the table represents a separate subjective measure, and the
mean, standard deviation, f-value, and significance is given for each independent variable. If
no significance is found across a given level of an independent variable (e.g. Window Type for
Ease-of-use), then a line is drawn beneath the levels, indicating they are statistically equal. The
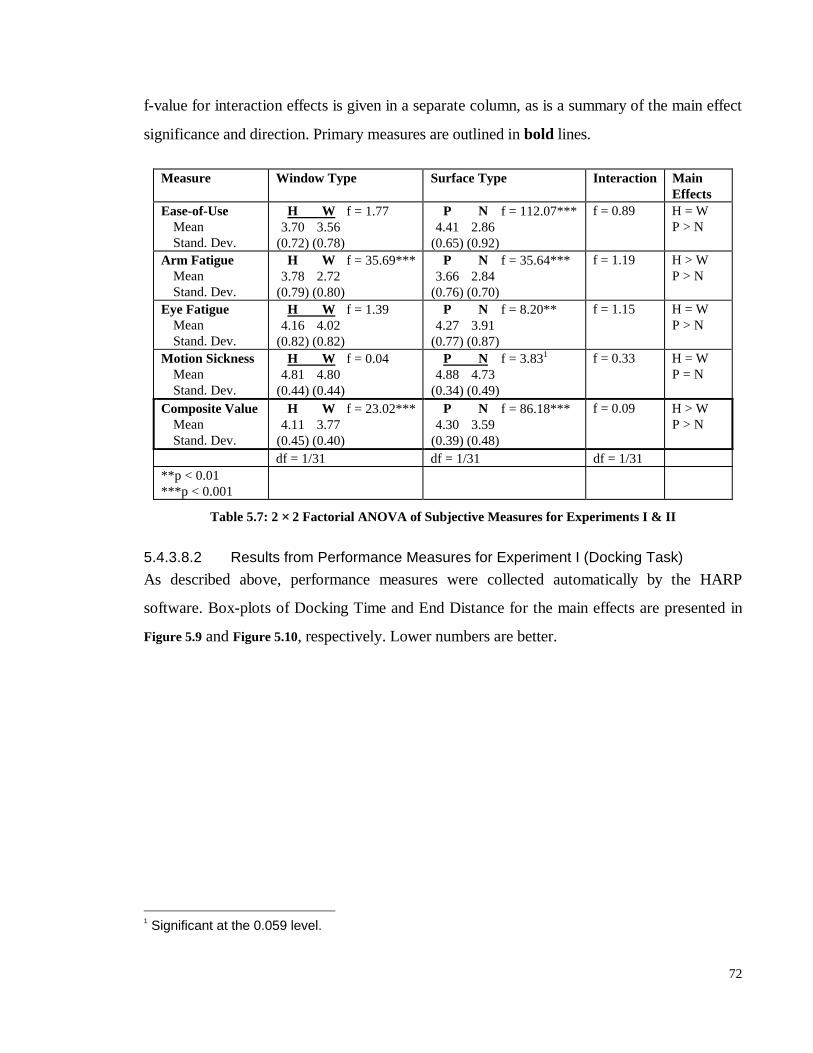
72
f-value for interaction effects is given in a separate column, as is a summary of the main effect
significance and direction. Primary measures are outlined in bold lines.
Measure Window Type Surface Type Interaction MainEffects
Ease-of-UseMeanStand. Dev.
H W f = 1.773.70 3.56
(0.72) (0.78)
P N f = 112.07***4.41 2.86
(0.65) (0.92)
f = 0.89 H = WP > N
Arm FatigueMeanStand. Dev.
H W f = 35.69***3.78 2.72
(0.79) (0.80)
P N f = 35.64***3.66 2.84
(0.76) (0.70)
f = 1.19 H > WP > N
Eye FatigueMeanStand. Dev.
H W f = 1.394.16 4.02
(0.82) (0.82)
P N f = 8.20**4.27 3.91
(0.77) (0.87)
f = 1.15 H = WP > N
Motion SicknessMeanStand. Dev.
H W f = 0.044.81 4.80
(0.44) (0.44)
P N f = 3.831
4.88 4.73(0.34) (0.49)
f = 0.33 H = WP = N
Composite ValueMeanStand. Dev.
H W f = 23.02***4.11 3.77
(0.45) (0.40)
P N f = 86.18***4.30 3.59
(0.39) (0.48)
f = 0.09 H > WP > N
df = 1/31 df = 1/31 df = 1/31**p < 0.01***p < 0.001
Table 5.7: 2 × 2 Factorial ANOVA of Subjective Measures for Experiments I & II
5.4.3.8.2 Results from Performance Measures for Experiment I (Docking Task)
As described above, performance measures were collected automatically by the HARP
software. Box-plots of Docking Time and End Distance for the main effects are presented in
Figure 5.9 and Figure 5.10, respectively. Lower numbers are better.
1 Significant at the 0.059 level.
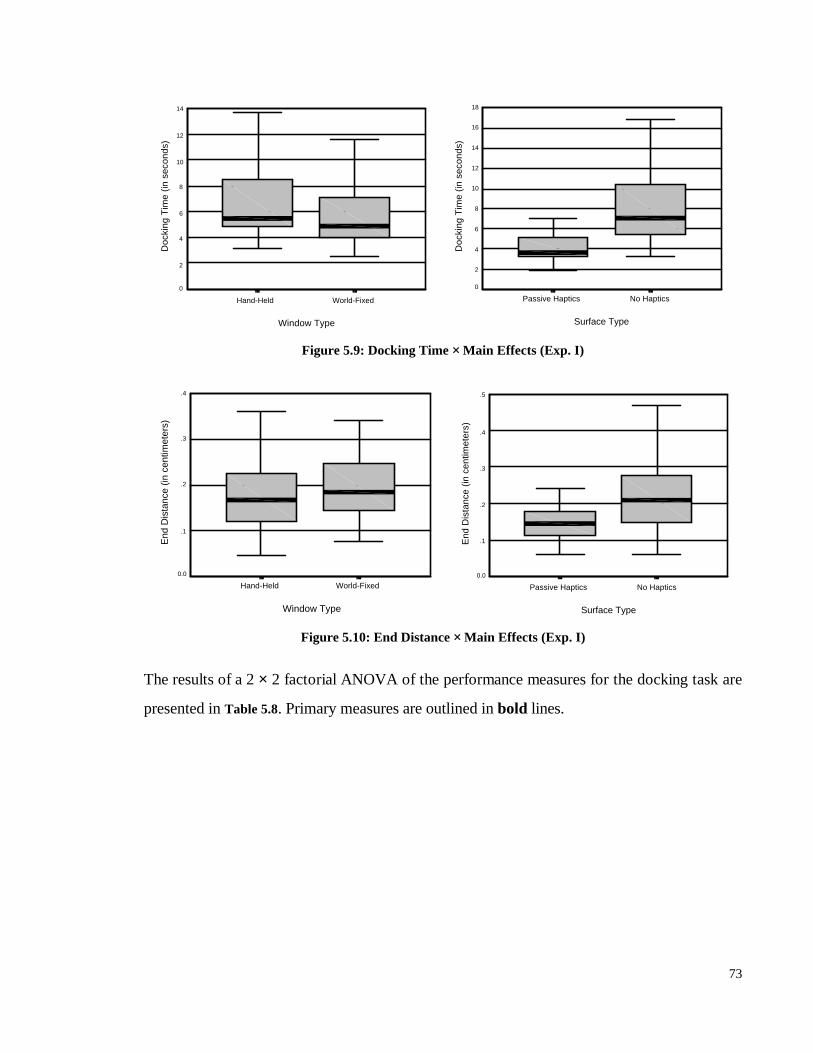
73
Window Type
World-FixedHand-Held
Doc
king
Tim
e (in
sec
onds
)
14
12
10
8
6
4
2
0
Surface Type
No HapticsPassive Haptics
Doc
king
Tim
e (in
sec
onds
)
18
16
14
12
10
8
6
4
2
0
Figure 5.9: Docking Time × Main Effects (Exp. I)
Window Type
World-FixedHand-Held
End
Dis
tanc
e (in
cen
timet
ers)
.4
.3
.2
.1
0.0
Surface Type
No HapticsPassive Haptics
End
Dis
tanc
e (in
cen
timet
ers)
.5
.4
.3
.2
.1
0.0
Figure 5.10: End Distance × Main Effects (Exp. I)
The results of a 2 × 2 factorial ANOVA of the performance measures for the docking task are
presented in Table 5.8. Primary measures are outlined in bold lines.
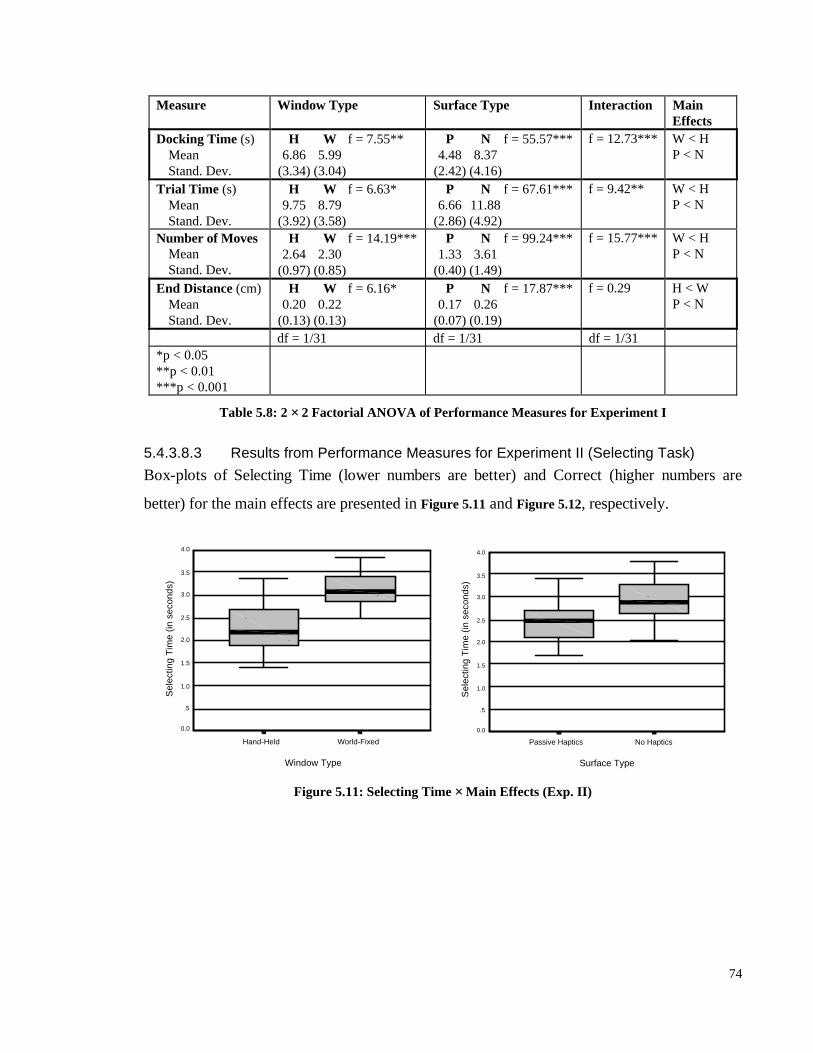
74
Measure Window Type Surface Type Interaction MainEffects
Docking Time (s)MeanStand. Dev.
H W f = 7.55**6.86 5.99
(3.34) (3.04)
P N f = 55.57***4.48 8.37
(2.42) (4.16)
f = 12.73*** W < HP < N
Trial Time (s)MeanStand. Dev.
H W f = 6.63*9.75 8.79
(3.92) (3.58)
P N f = 67.61***6.66 11.88
(2.86) (4.92)
f = 9.42** W < HP < N
Number of MovesMeanStand. Dev.
H W f = 14.19***2.64 2.30
(0.97) (0.85)
P N f = 99.24***1.33 3.61
(0.40) (1.49)
f = 15.77*** W < HP < N
End Distance (cm)MeanStand. Dev.
H W f = 6.16*0.20 0.22
(0.13) (0.13)
P N f = 17.87***0.17 0.26
(0.07) (0.19)
f = 0.29 H < WP < N
df = 1/31 df = 1/31 df = 1/31*p < 0.05**p < 0.01***p < 0.001
Table 5.8: 2 × 2 Factorial ANOVA of Performance Measures for Experiment I
5.4.3.8.3 Results from Performance Measures for Experiment II (Selecting Task)
Box-plots of Selecting Time (lower numbers are better) and Correct (higher numbers are
better) for the main effects are presented in Figure 5.11 and Figure 5.12, respectively.
Window Type
World-FixedHand-Held
Sel
ectin
g T
ime
(in s
econ
ds)
4.0
3.5
3.0
2.5
2.0
1.5
1.0
.5
0.0
Surface Type
No HapticsPassive Haptics
Sel
ectin
g T
ime
(in s
econ
ds)
4.0
3.5
3.0
2.5
2.0
1.5
1.0
.5
0.0
Figure 5.11: Selecting Time × Main Effects (Exp. II)
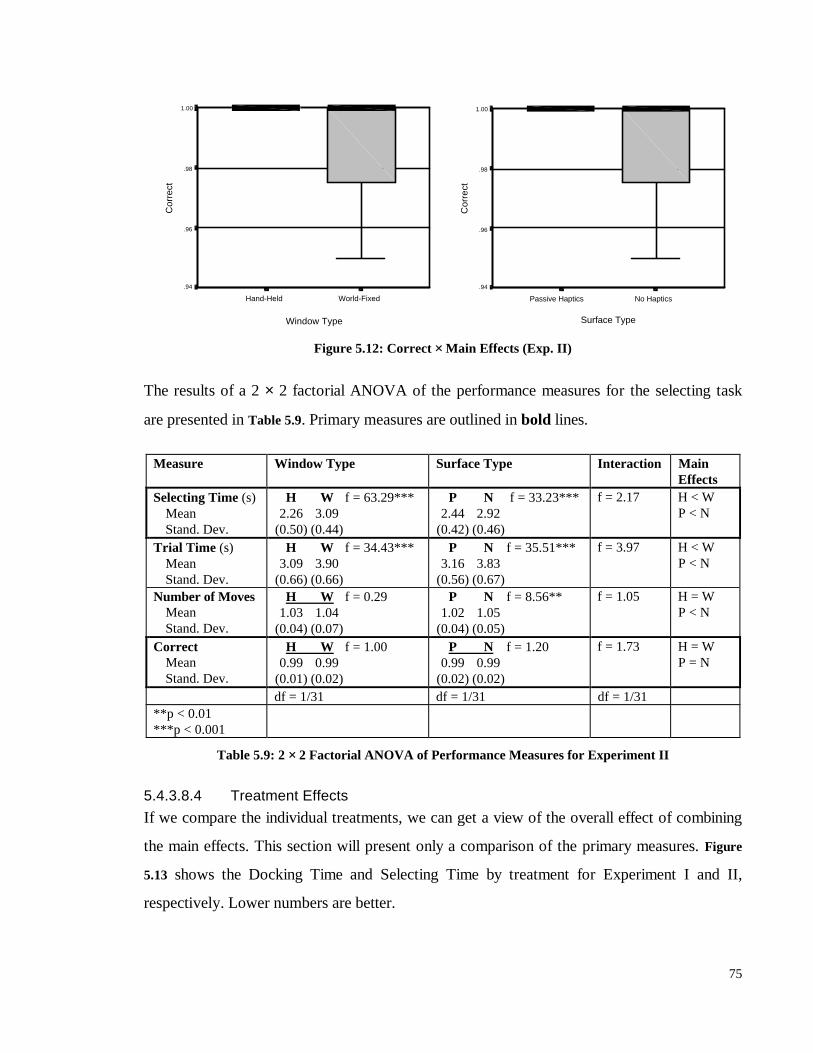
75
Window Type
World-FixedHand-Held
Cor
rect
1.00
.98
.96
.94
Surface Type
No HapticsPassive Haptics
Cor
rect
1.00
.98
.96
.94
Figure 5.12: Correct × Main Effects (Exp. II)
The results of a 2 × 2 factorial ANOVA of the performance measures for the selecting task
are presented in Table 5.9. Primary measures are outlined in bold lines.
Measure Window Type Surface Type Interaction MainEffects
Selecting Time (s)MeanStand. Dev.
H W f = 63.29***2.26 3.09
(0.50) (0.44)
P N f = 33.23***2.44 2.92
(0.42) (0.46)
f = 2.17 H < WP < N
Trial Time (s)MeanStand. Dev.
H W f = 34.43***3.09 3.90
(0.66) (0.66)
P N f = 35.51***3.16 3.83
(0.56) (0.67)
f = 3.97 H < WP < N
Number of MovesMeanStand. Dev.
H W f = 0.291.03 1.04
(0.04) (0.07)
P N f = 8.56**1.02 1.05
(0.04) (0.05)
f = 1.05 H = WP < N
CorrectMeanStand. Dev.
H W f = 1.000.99 0.99
(0.01) (0.02)
P N f = 1.200.99 0.99
(0.02) (0.02)
f = 1.73 H = WP = N
df = 1/31 df = 1/31 df = 1/31**p < 0.01***p < 0.001
Table 5.9: 2 × 2 Factorial ANOVA of Performance Measures for Experiment II
5.4.3.8.4 Treatment Effects
If we compare the individual treatments, we can get a view of the overall effect of combining
the main effects. This section will present only a comparison of the primary measures. Figure
5.13 shows the Docking Time and Selecting Time by treatment for Experiment I and II,
respectively. Lower numbers are better.
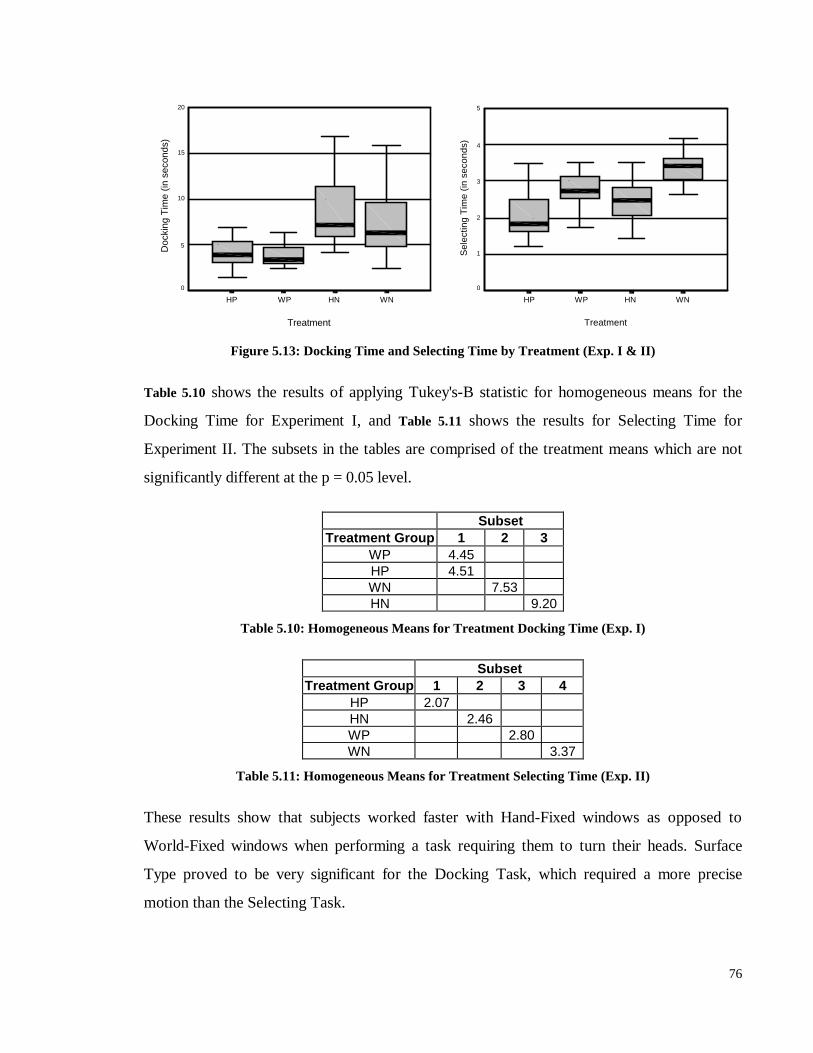
76
Treatment
WNHNWPHP
Doc
king
Tim
e (in
sec
onds
)
20
15
10
5
0
Treatment
WNHNWPHP
Sel
ectin
g T
ime
(in s
econ
ds)
5
4
3
2
1
0
Figure 5.13: Docking Time and Selecting Time by Treatment (Exp. I & II)
Table 5.10 shows the results of applying Tukey's-B statistic for homogeneous means for the
Docking Time for Experiment I, and Table 5.11 shows the results for Selecting Time for
Experiment II. The subsets in the tables are comprised of the treatment means which are not
significantly different at the p = 0.05 level.
SubsetTreatment Group 1 2 3
WP 4.45HP 4.51WN 7.53HN 9.20
Table 5.10: Homogeneous Means for Treatment Docking Time (Exp. I)
SubsetTreatment Group 1 2 3 4
HP 2.07HN 2.46WP 2.80WN 3.37
Table 5.11: Homogeneous Means for Treatment Selecting Time (Exp. II)
These results show that subjects worked faster with Hand-Fixed windows as opposed to
World-Fixed windows when performing a task requiring them to turn their heads. Surface
Type proved to be very significant for the Docking Task, which required a more precise
motion than the Selecting Task.
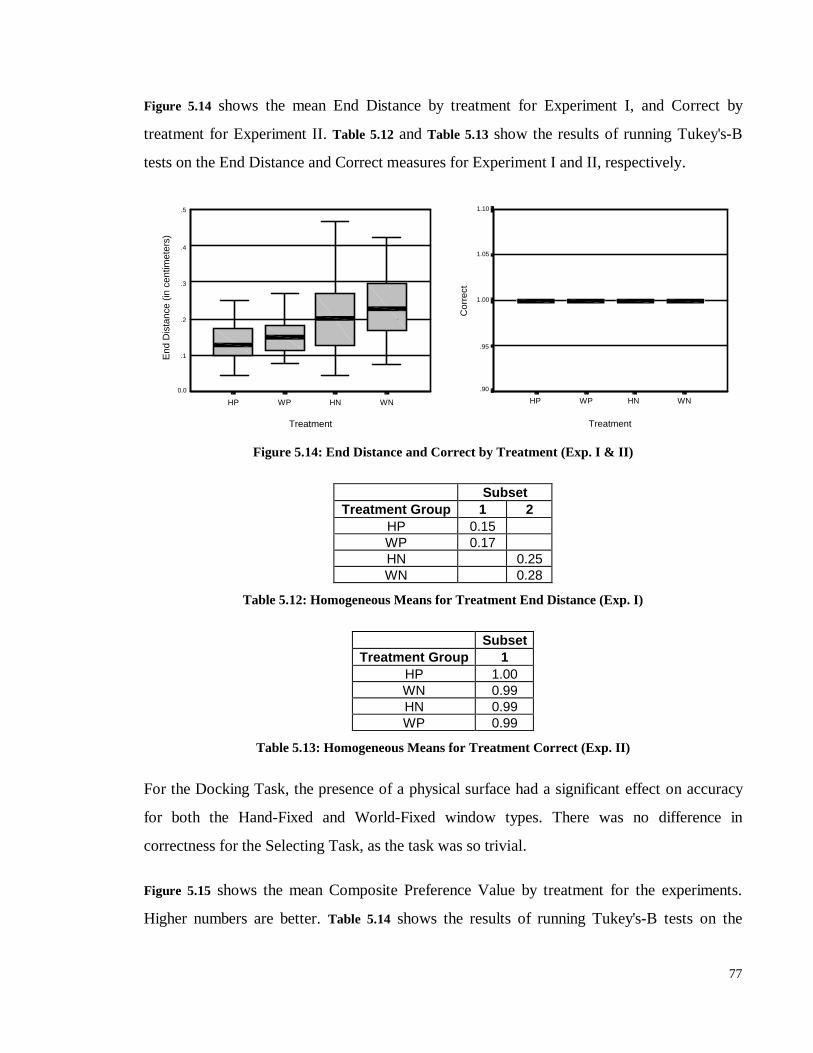
77
Figure 5.14 shows the mean End Distance by treatment for Experiment I, and Correct by
treatment for Experiment II. Table 5.12 and Table 5.13 show the results of running Tukey's-B
tests on the End Distance and Correct measures for Experiment I and II, respectively.
Treatment
WNHNWPHP
End
Dis
tanc
e (in
cen
timet
ers)
.5
.4
.3
.2
.1
0.0
Treatment
WNHNWPHP
Cor
rect
1.10
1.05
1.00
.95
.90
Figure 5.14: End Distance and Correct by Treatment (Exp. I & II)
SubsetTreatment Group 1 2
HP 0.15WP 0.17HN 0.25WN 0.28
Table 5.12: Homogeneous Means for Treatment End Distance (Exp. I)
SubsetTreatment Group 1
HP 1.00WN 0.99HN 0.99WP 0.99
Table 5.13: Homogeneous Means for Treatment Correct (Exp. II)
For the Docking Task, the presence of a physical surface had a significant effect on accuracy
for both the Hand-Fixed and World-Fixed window types. There was no difference in
correctness for the Selecting Task, as the task was so trivial.
Figure 5.15 shows the mean Composite Preference Value by treatment for the experiments.
Higher numbers are better. Table 5.14 shows the results of running Tukey's-B tests on the
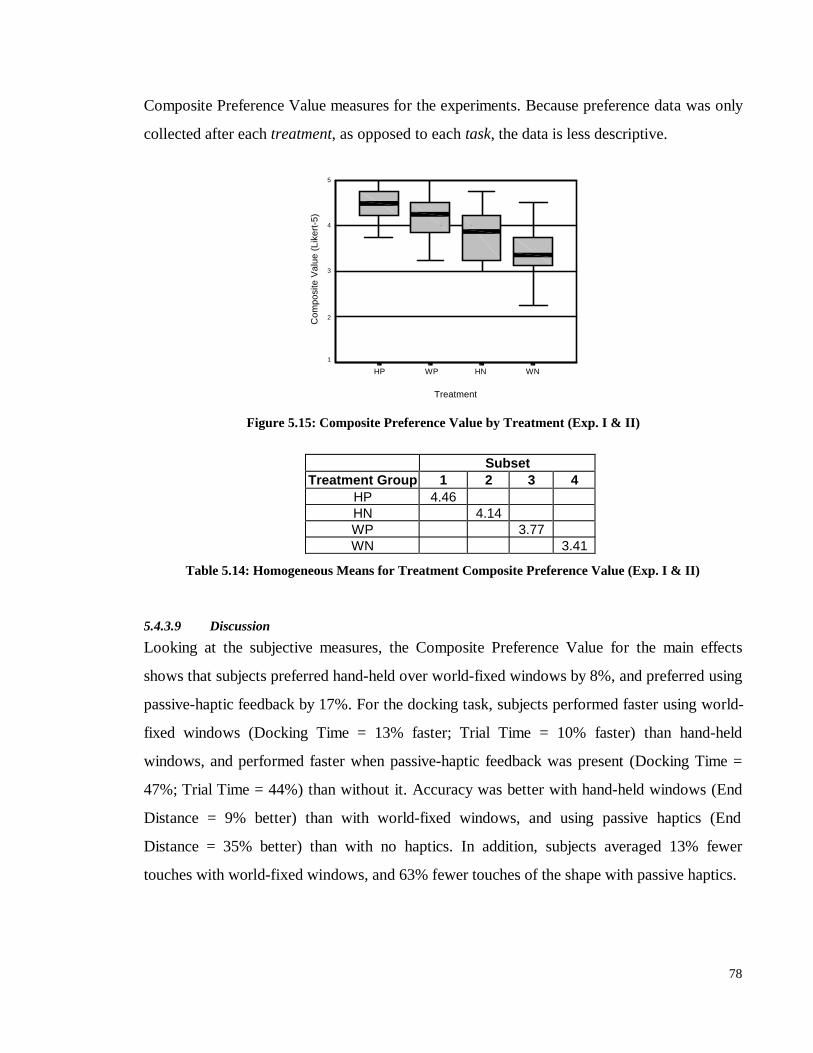
78
Composite Preference Value measures for the experiments. Because preference data was only
collected after each treatment, as opposed to each task, the data is less descriptive.
Treatment
WNHNWPHP
Com
posi
te V
alue
(Li
kert
-5)
5
4
3
2
1
Figure 5.15: Composite Preference Value by Treatment (Exp. I & II)
SubsetTreatment Group 1 2 3 4
HP 4.46HN 4.14WP 3.77WN 3.41
Table 5.14: Homogeneous Means for Treatment Composite Preference Value (Exp. I & II)
5.4.3.9 Discussion
Looking at the subjective measures, the Composite Preference Value for the main effects
shows that subjects preferred hand-held over world-fixed windows by 8%, and preferred using
passive-haptic feedback by 17%. For the docking task, subjects performed faster using world-
fixed windows (Docking Time = 13% faster; Trial Time = 10% faster) than hand-held
windows, and performed faster when passive-haptic feedback was present (Docking Time =
47%; Trial Time = 44%) than without it. Accuracy was better with hand-held windows (End
Distance = 9% better) than with world-fixed windows, and using passive haptics (End
Distance = 35% better) than with no haptics. In addition, subjects averaged 13% fewer
touches with world-fixed windows, and 63% fewer touches of the shape with passive haptics.
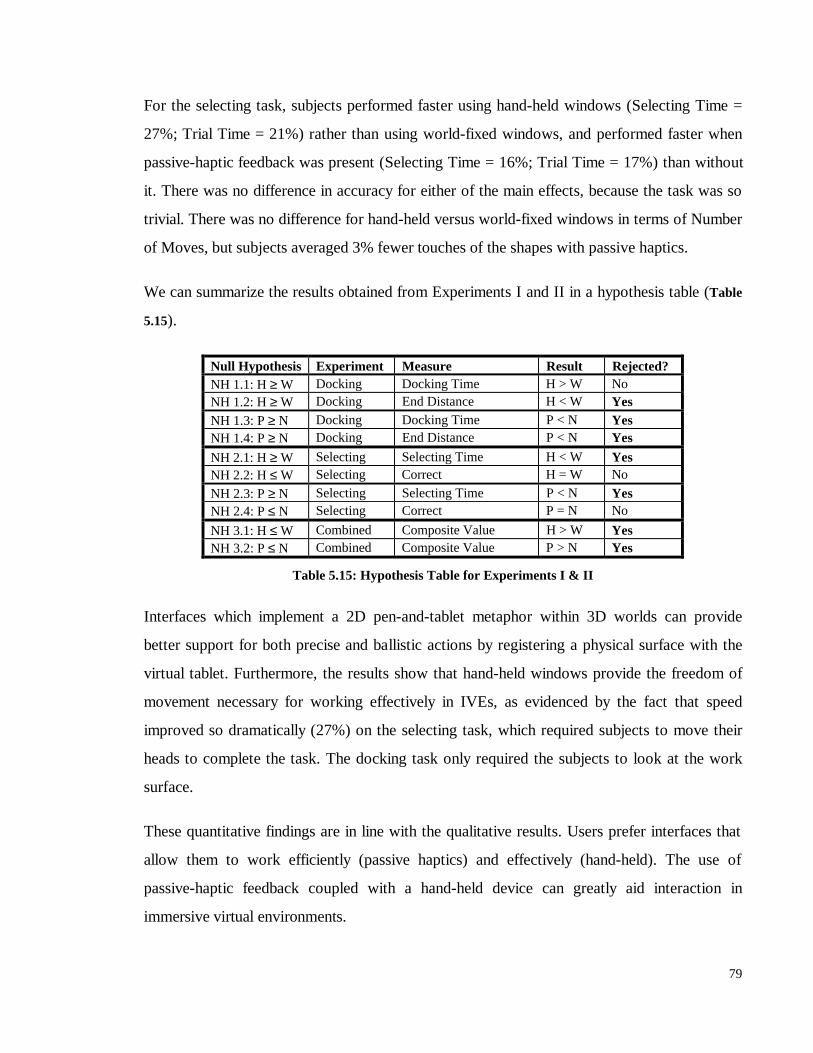
79
For the selecting task, subjects performed faster using hand-held windows (Selecting Time =
27%; Trial Time = 21%) rather than using world-fixed windows, and performed faster when
passive-haptic feedback was present (Selecting Time = 16%; Trial Time = 17%) than without
it. There was no difference in accuracy for either of the main effects, because the task was so
trivial. There was no difference for hand-held versus world-fixed windows in terms of Number
of Moves, but subjects averaged 3% fewer touches of the shapes with passive haptics.
We can summarize the results obtained from Experiments I and II in a hypothesis table (Table
5.15).
Null Hypothesis Experiment Measure Result Rejected?NH 1.1: H ≥ W Docking Docking Time H > W NoNH 1.2: H ≥ W Docking End Distance H < W YesNH 1.3: P ≥ N Docking Docking Time P < N YesNH 1.4: P ≥ N Docking End Distance P < N Yes
NH 2.1: H ≥ W Selecting Selecting Time H < W YesNH 2.2: H ≤ W Selecting Correct H = W No
NH 2.3: P ≥ N Selecting Selecting Time P < N YesNH 2.4: P ≤ N Selecting Correct P = N No
NH 3.1: H ≤ W Combined Composite Value H > W YesNH 3.2: P ≤ N Combined Composite Value P > N Yes
Table 5.15: Hypothesis Table for Experiments I & II
Interfaces which implement a 2D pen-and-tablet metaphor within 3D worlds can provide
better support for both precise and ballistic actions by registering a physical surface with the
virtual tablet. Furthermore, the results show that hand-held windows provide the freedom of
movement necessary for working effectively in IVEs, as evidenced by the fact that speed
improved so dramatically (27%) on the selecting task, which required subjects to move their
heads to complete the task. The docking task only required the subjects to look at the work
surface.
These quantitative findings are in line with the qualitative results. Users prefer interfaces that
allow them to work efficiently (passive haptics) and effectively (hand-held). The use of
passive-haptic feedback coupled with a hand-held device can greatly aid interaction in
immersive virtual environments.
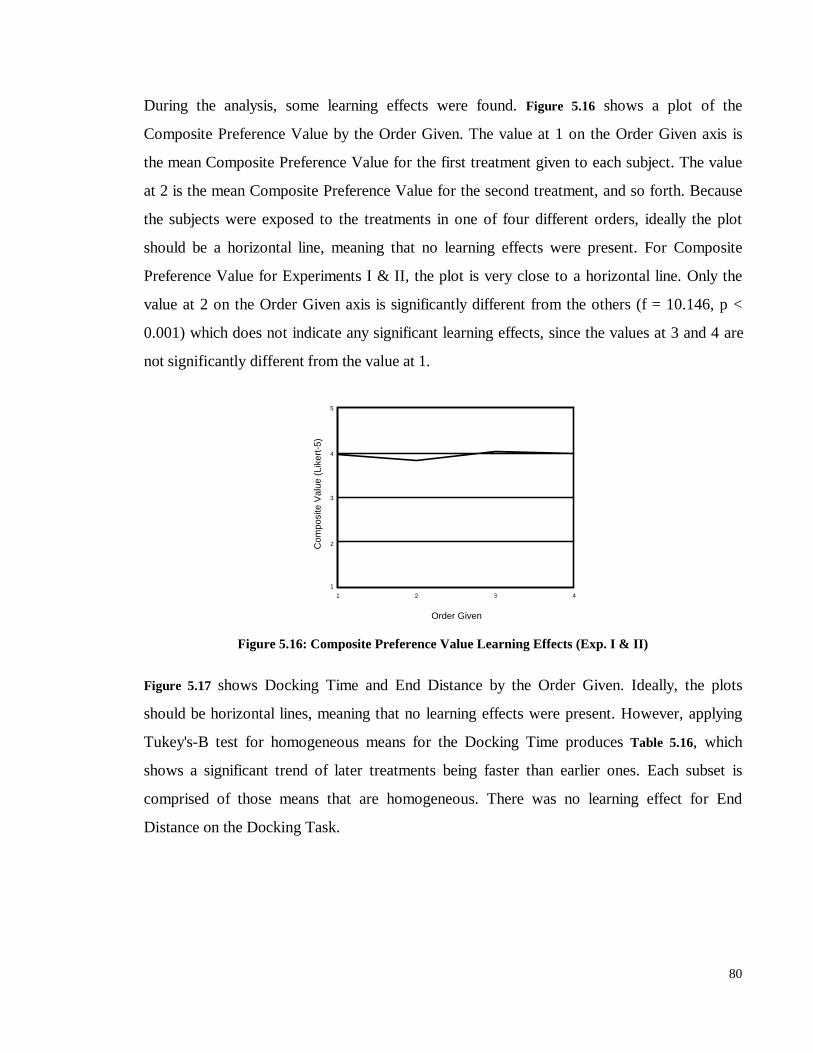
80
During the analysis, some learning effects were found. Figure 5.16 shows a plot of the
Composite Preference Value by the Order Given. The value at 1 on the Order Given axis is
the mean Composite Preference Value for the first treatment given to each subject. The value
at 2 is the mean Composite Preference Value for the second treatment, and so forth. Because
the subjects were exposed to the treatments in one of four different orders, ideally the plot
should be a horizontal line, meaning that no learning effects were present. For Composite
Preference Value for Experiments I & II, the plot is very close to a horizontal line. Only the
value at 2 on the Order Given axis is significantly different from the others (f = 10.146, p <
0.001) which does not indicate any significant learning effects, since the values at 3 and 4 are
not significantly different from the value at 1.
Order Given
4321
Com
posi
te V
alue
(Li
kert
-5)
5
4
3
2
1
Figure 5.16: Composite Preference Value Learning Effects (Exp. I & II)
Figure 5.17 shows Docking Time and End Distance by the Order Given. Ideally, the plots
should be horizontal lines, meaning that no learning effects were present. However, applying
Tukey's-B test for homogeneous means for the Docking Time produces Table 5.16, which
shows a significant trend of later treatments being faster than earlier ones. Each subset is
comprised of those means that are homogeneous. There was no learning effect for End
Distance on the Docking Task.
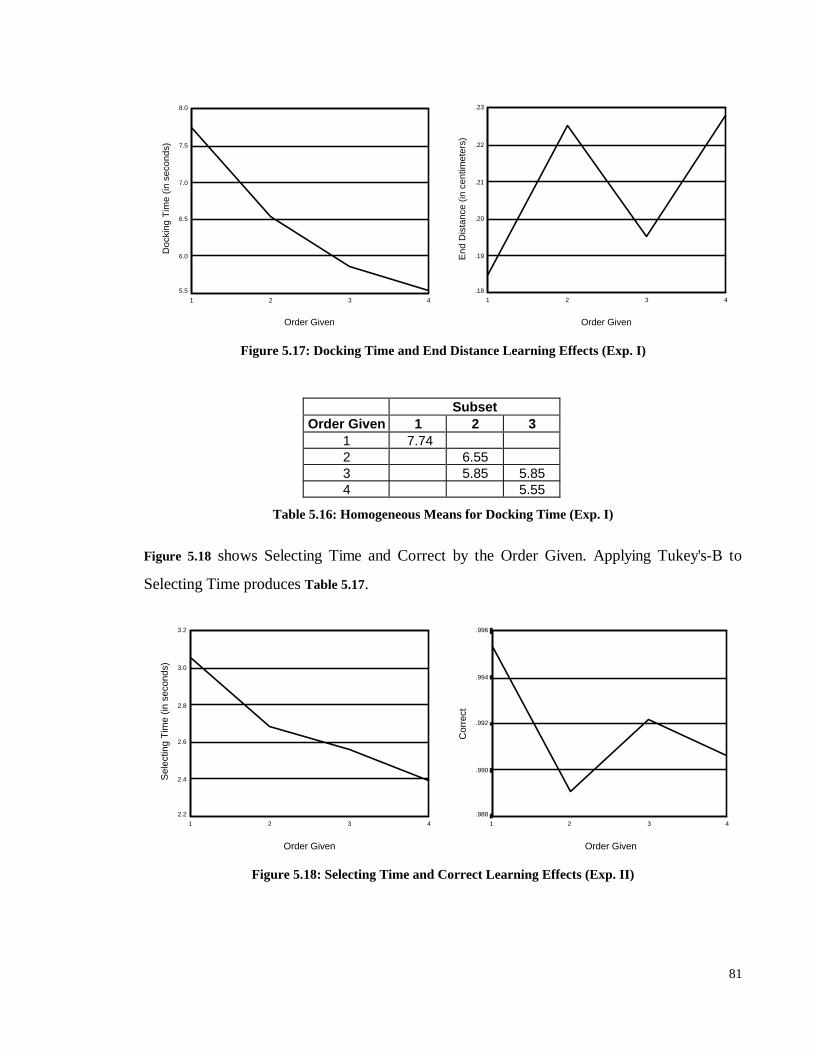
81
Order Given
4321
Doc
king
Tim
e (in
sec
onds
)
8.0
7.5
7.0
6.5
6.0
5.5
Order Given
4321
End
Dis
tanc
e (in
cen
timet
ers)
.23
.22
.21
.20
.19
.18
Figure 5.17: Docking Time and End Distance Learning Effects (Exp. I)
SubsetOrder Given 1 2 3
1 7.742 6.553 5.85 5.854 5.55
Table 5.16: Homogeneous Means for Docking Time (Exp. I)
Figure 5.18 shows Selecting Time and Correct by the Order Given. Applying Tukey's-B to
Selecting Time produces Table 5.17.
Order Given
4321
Sel
ectin
g T
ime
(in s
econ
ds)
3.2
3.0
2.8
2.6
2.4
2.2
Order Given
4321
Cor
rect
.996
.994
.992
.990
.988
Figure 5.18: Selecting Time and Correct Learning Effects (Exp. II)
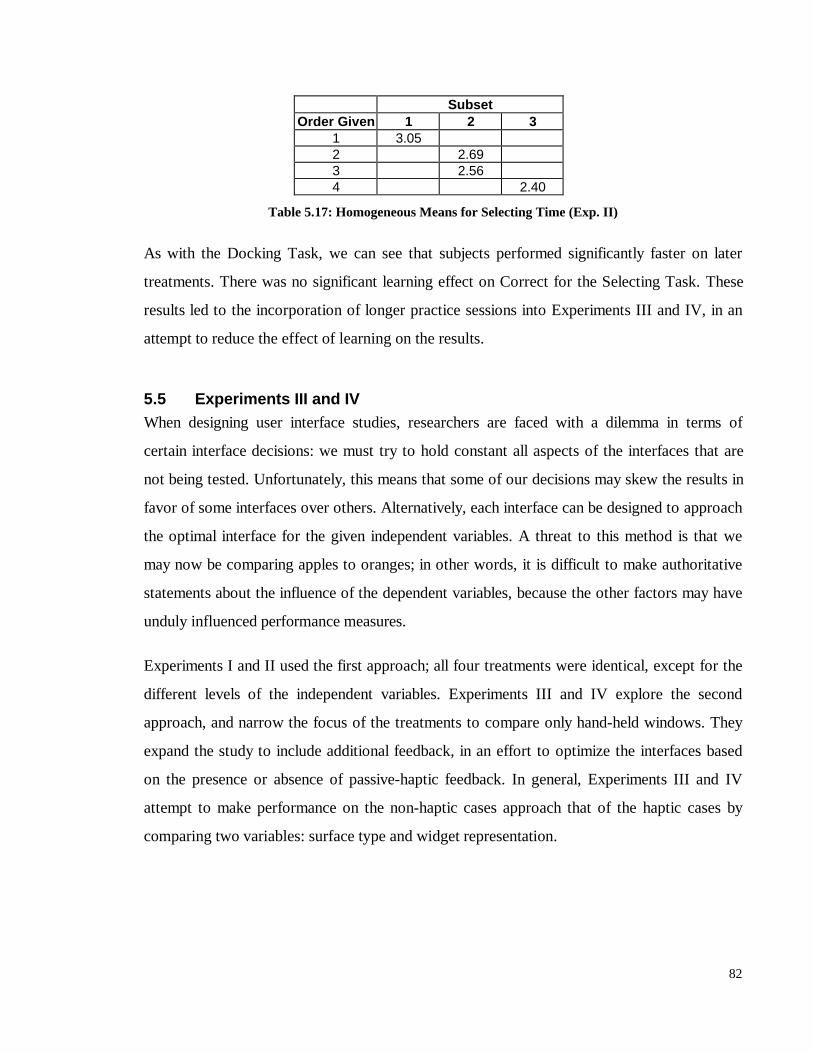
82
SubsetOrder Given 1 2 3
1 3.052 2.693 2.564 2.40
Table 5.17: Homogeneous Means for Selecting Time (Exp. II)
As with the Docking Task, we can see that subjects performed significantly faster on later
treatments. There was no significant learning effect on Correct for the Selecting Task. These
results led to the incorporation of longer practice sessions into Experiments III and IV, in an
attempt to reduce the effect of learning on the results.
5.5 Experiments III and IVWhen designing user interface studies, researchers are faced with a dilemma in terms of
certain interface decisions: we must try to hold constant all aspects of the interfaces that are
not being tested. Unfortunately, this means that some of our decisions may skew the results in
favor of some interfaces over others. Alternatively, each interface can be designed to approach
the optimal interface for the given independent variables. A threat to this method is that we
may now be comparing apples to oranges; in other words, it is difficult to make authoritative
statements about the influence of the dependent variables, because the other factors may have
unduly influenced performance measures.
Experiments I and II used the first approach; all four treatments were identical, except for the
different levels of the independent variables. Experiments III and IV explore the second
approach, and narrow the focus of the treatments to compare only hand-held windows. They
expand the study to include additional feedback, in an effort to optimize the interfaces based
on the presence or absence of passive-haptic feedback. In general, Experiments III and IV
attempt to make performance on the non-haptic cases approach that of the haptic cases by
comparing two variables: surface type and widget representation.
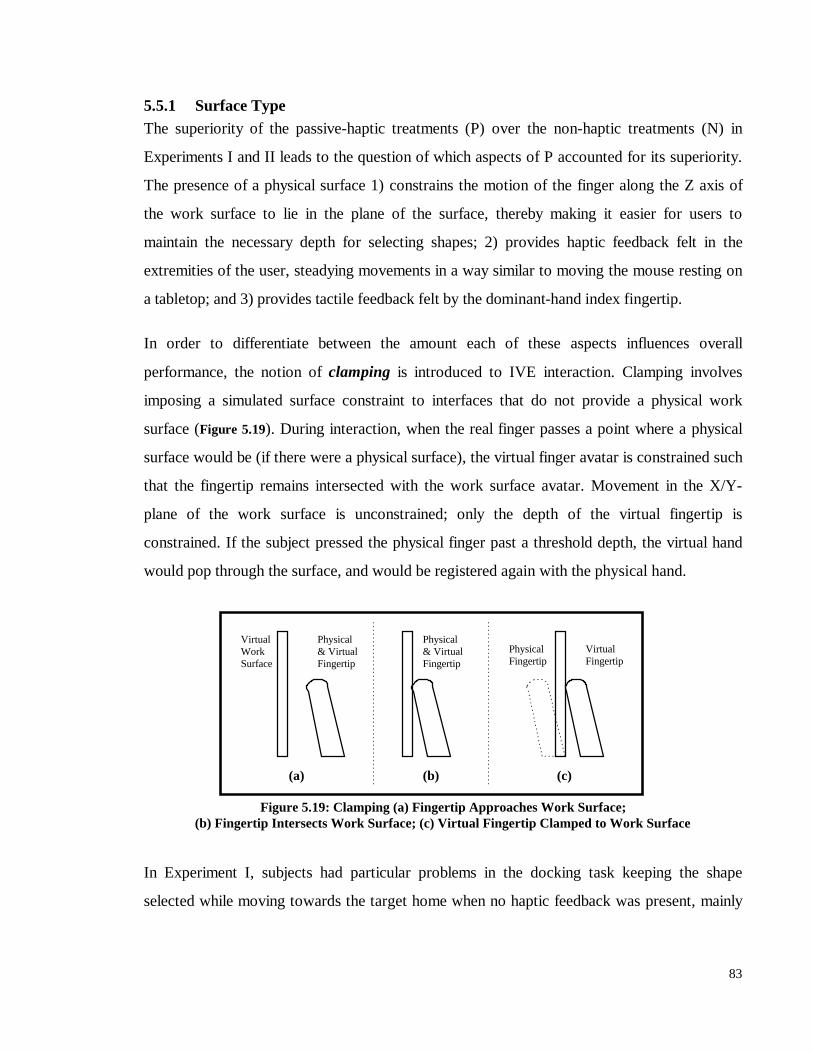
83
5.5.1 Surface TypeThe superiority of the passive-haptic treatments (P) over the non-haptic treatments (N) in
Experiments I and II leads to the question of which aspects of P accounted for its superiority.
The presence of a physical surface 1) constrains the motion of the finger along the Z axis of
the work surface to lie in the plane of the surface, thereby making it easier for users to
maintain the necessary depth for selecting shapes; 2) provides haptic feedback felt in the
extremities of the user, steadying movements in a way similar to moving the mouse resting on
a tabletop; and 3) provides tactile feedback felt by the dominant-hand index fingertip.
In order to differentiate between the amount each of these aspects influences overall
performance, the notion of clamping is introduced to IVE interaction. Clamping involves
imposing a simulated surface constraint to interfaces that do not provide a physical work
surface (Figure 5.19). During interaction, when the real finger passes a point where a physical
surface would be (if there were a physical surface), the virtual finger avatar is constrained such
that the fingertip remains intersected with the work surface avatar. Movement in the X/Y-
plane of the work surface is unconstrained; only the depth of the virtual fingertip is
constrained. If the subject pressed the physical finger past a threshold depth, the virtual hand
would pop through the surface, and would be registered again with the physical hand.
Figure 5.19: Clamping (a) Fingertip Approaches Work Surface;(b) Fingertip Intersects Work Surface; (c) Virtual Fingertip Clamped to Work Surface
In Experiment I, subjects had particular problems in the docking task keeping the shape
selected while moving towards the target home when no haptic feedback was present, mainly
VirtualWorkSurface
Physical& VirtualFingertip
Physical& VirtualFingertip
VirtualFingertip
PhysicalFingertip
(a) (b) (c)
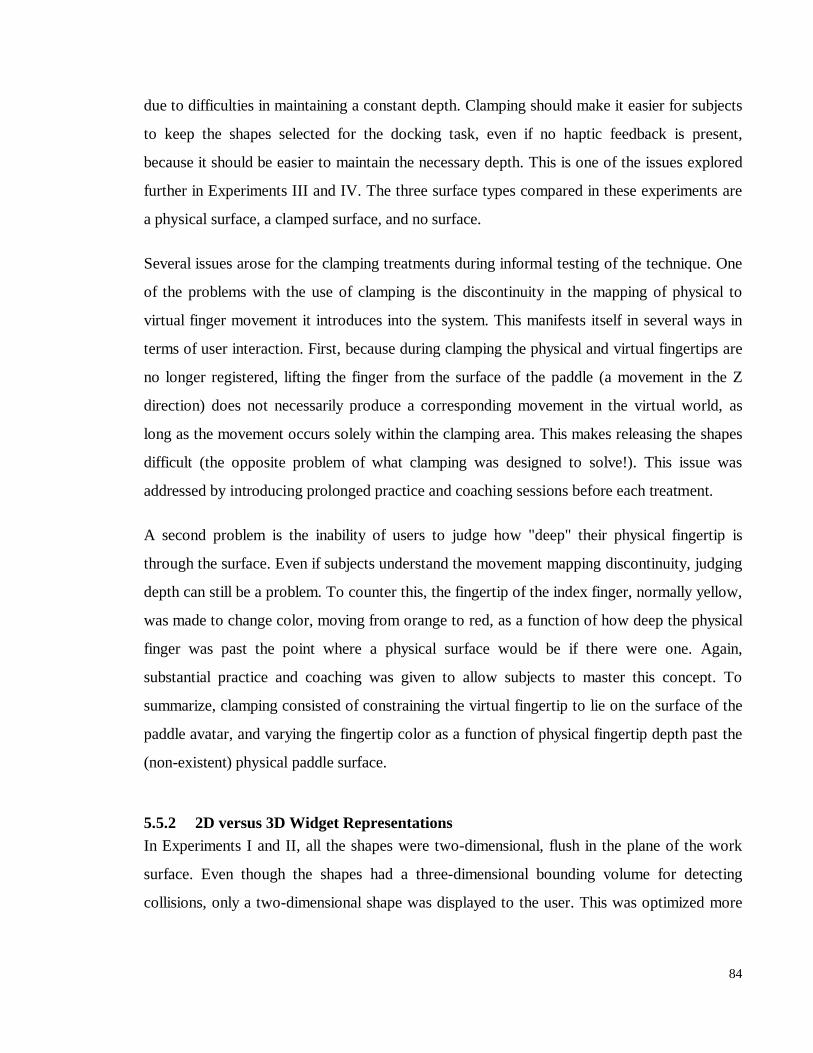
84
due to difficulties in maintaining a constant depth. Clamping should make it easier for subjects
to keep the shapes selected for the docking task, even if no haptic feedback is present,
because it should be easier to maintain the necessary depth. This is one of the issues explored
further in Experiments III and IV. The three surface types compared in these experiments are
a physical surface, a clamped surface, and no surface.
Several issues arose for the clamping treatments during informal testing of the technique. One
of the problems with the use of clamping is the discontinuity in the mapping of physical to
virtual finger movement it introduces into the system. This manifests itself in several ways in
terms of user interaction. First, because during clamping the physical and virtual fingertips are
no longer registered, lifting the finger from the surface of the paddle (a movement in the Z
direction) does not necessarily produce a corresponding movement in the virtual world, as
long as the movement occurs solely within the clamping area. This makes releasing the shapes
difficult (the opposite problem of what clamping was designed to solve!). This issue was
addressed by introducing prolonged practice and coaching sessions before each treatment.
A second problem is the inability of users to judge how "deep" their physical fingertip is
through the surface. Even if subjects understand the movement mapping discontinuity, judging
depth can still be a problem. To counter this, the fingertip of the index finger, normally yellow,
was made to change color, moving from orange to red, as a function of how deep the physical
finger was past the point where a physical surface would be if there were one. Again,
substantial practice and coaching was given to allow subjects to master this concept. To
summarize, clamping consisted of constraining the virtual fingertip to lie on the surface of the
paddle avatar, and varying the fingertip color as a function of physical fingertip depth past the
(non-existent) physical paddle surface.
5.5.2 2D versus 3D Widget RepresentationsIn Experiments I and II, all the shapes were two-dimensional, flush in the plane of the work
surface. Even though the shapes had a three-dimensional bounding volume for detecting
collisions, only a two-dimensional shape was displayed to the user. This was optimized more
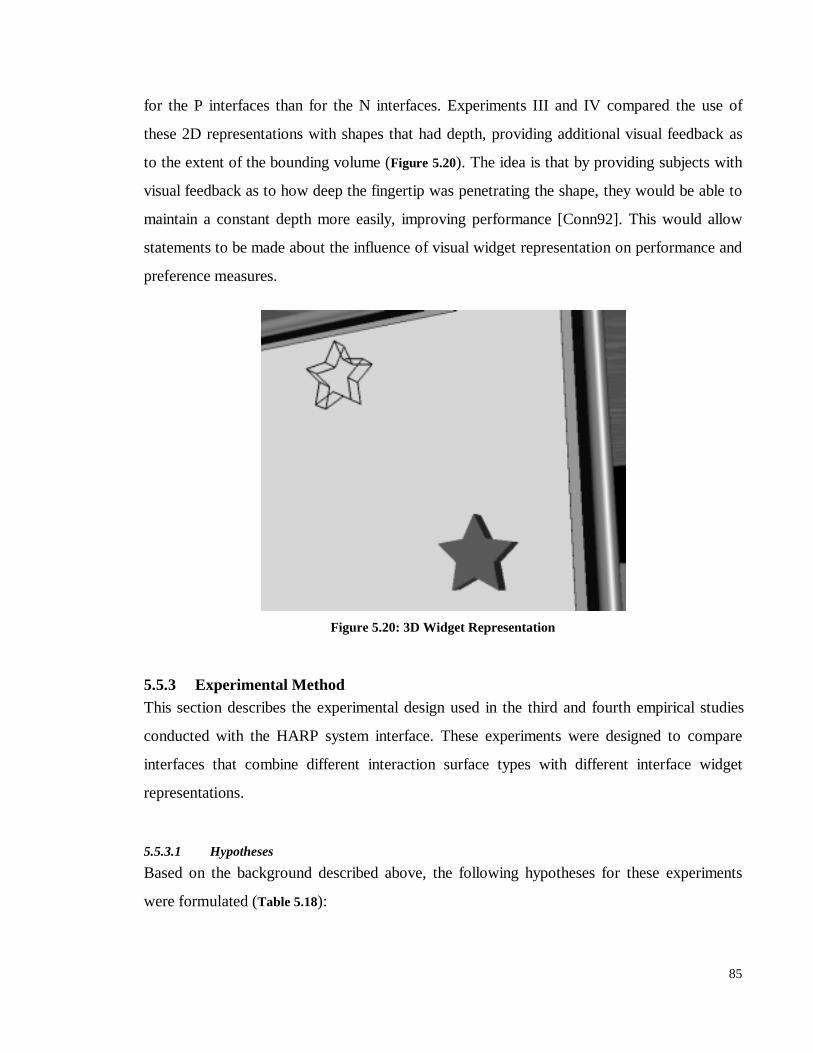
85
for the P interfaces than for the N interfaces. Experiments III and IV compared the use of
these 2D representations with shapes that had depth, providing additional visual feedback as
to the extent of the bounding volume (Figure 5.20). The idea is that by providing subjects with
visual feedback as to how deep the fingertip was penetrating the shape, they would be able to
maintain a constant depth more easily, improving performance [Conn92]. This would allow
statements to be made about the influence of visual widget representation on performance and
preference measures.
Figure 5.20: 3D Widget Representation
5.5.3 Experimental MethodThis section describes the experimental design used in the third and fourth empirical studies
conducted with the HARP system interface. These experiments were designed to compare
interfaces that combine different interaction surface types with different interface widget
representations.
5.5.3.1 Hypotheses
Based on the background described above, the following hypotheses for these experiments
were formulated (Table 5.18):
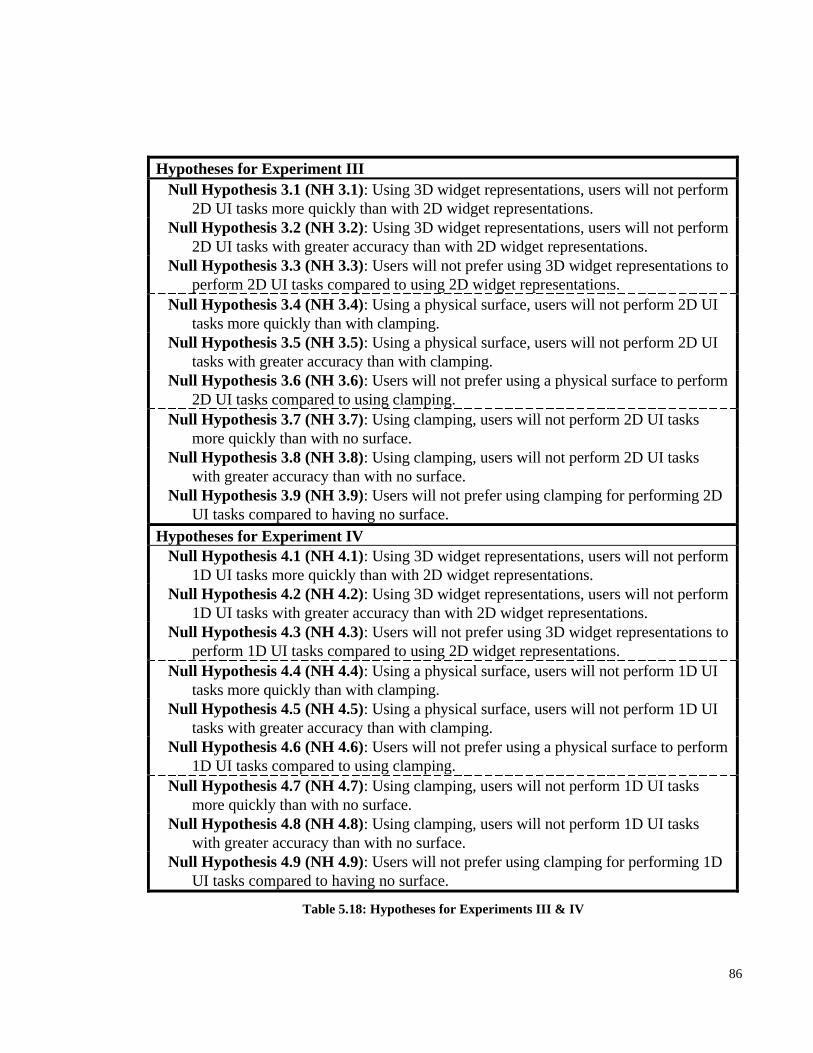
86
Hypotheses for Experiment IIINull Hypothesis 3.1 (NH 3.1): Using 3D widget representations, users will not perform
2D UI tasks more quickly than with 2D widget representations.Null Hypothesis 3.2 (NH 3.2): Using 3D widget representations, users will not perform
2D UI tasks with greater accuracy than with 2D widget representations.Null Hypothesis 3.3 (NH 3.3): Users will not prefer using 3D widget representations to
perform 2D UI tasks compared to using 2D widget representations.Null Hypothesis 3.4 (NH 3.4): Using a physical surface, users will not perform 2D UI
tasks more quickly than with clamping.Null Hypothesis 3.5 (NH 3.5): Using a physical surface, users will not perform 2D UI
tasks with greater accuracy than with clamping.Null Hypothesis 3.6 (NH 3.6): Users will not prefer using a physical surface to perform
2D UI tasks compared to using clamping.Null Hypothesis 3.7 (NH 3.7): Using clamping, users will not perform 2D UI tasks
more quickly than with no surface.Null Hypothesis 3.8 (NH 3.8): Using clamping, users will not perform 2D UI tasks
with greater accuracy than with no surface.Null Hypothesis 3.9 (NH 3.9): Users will not prefer using clamping for performing 2D
UI tasks compared to having no surface.Hypotheses for Experiment IV
Null Hypothesis 4.1 (NH 4.1): Using 3D widget representations, users will not perform1D UI tasks more quickly than with 2D widget representations.
Null Hypothesis 4.2 (NH 4.2): Using 3D widget representations, users will not perform1D UI tasks with greater accuracy than with 2D widget representations.
Null Hypothesis 4.3 (NH 4.3): Users will not prefer using 3D widget representations toperform 1D UI tasks compared to using 2D widget representations.
Null Hypothesis 4.4 (NH 4.4): Using a physical surface, users will not perform 1D UItasks more quickly than with clamping.
Null Hypothesis 4.5 (NH 4.5): Using a physical surface, users will not perform 1D UItasks with greater accuracy than with clamping.
Null Hypothesis 4.6 (NH 4.6): Users will not prefer using a physical surface to perform1D UI tasks compared to using clamping.
Null Hypothesis 4.7 (NH 4.7): Using clamping, users will not perform 1D UI tasksmore quickly than with no surface.
Null Hypothesis 4.8 (NH 4.8): Using clamping, users will not perform 1D UI taskswith greater accuracy than with no surface.
Null Hypothesis 4.9 (NH 4.9): Users will not prefer using clamping for performing 1DUI tasks compared to having no surface.
Table 5.18: Hypotheses for Experiments III & IV
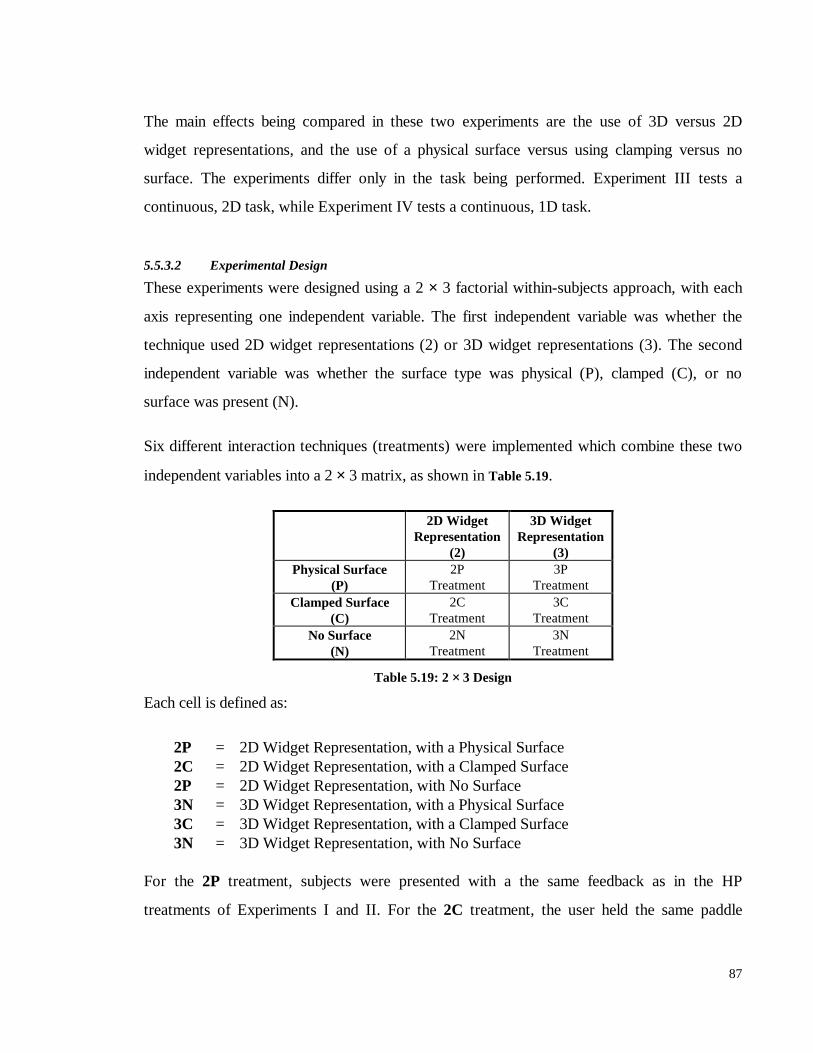
87
The main effects being compared in these two experiments are the use of 3D versus 2D
widget representations, and the use of a physical surface versus using clamping versus no
surface. The experiments differ only in the task being performed. Experiment III tests a
continuous, 2D task, while Experiment IV tests a continuous, 1D task.
5.5.3.2 Experimental Design
These experiments were designed using a 2 × 3 factorial within-subjects approach, with each
axis representing one independent variable. The first independent variable was whether the
technique used 2D widget representations (2) or 3D widget representations (3). The second
independent variable was whether the surface type was physical (P), clamped (C), or no
surface was present (N).
Six different interaction techniques (treatments) were implemented which combine these two
independent variables into a 2 × 3 matrix, as shown in Table 5.19.
2D WidgetRepresentation
(2)
3D WidgetRepresentation
(3)Physical Surface
(P)2P
Treatment3P
TreatmentClamped Surface
(C)2C
Treatment3C
TreatmentNo Surface
(N)2N
Treatment3N
Treatment
Table 5.19: 2 × 3 Design
Each cell is defined as:
2P = 2D Widget Representation, with a Physical Surface2C = 2D Widget Representation, with a Clamped Surface2P = 2D Widget Representation, with No Surface3N = 3D Widget Representation, with a Physical Surface3C = 3D Widget Representation, with a Clamped Surface3N = 3D Widget Representation, with No Surface
For the 2P treatment, subjects were presented with a the same feedback as in the HP
treatments of Experiments I and II. For the 2C treatment, the user held the same paddle
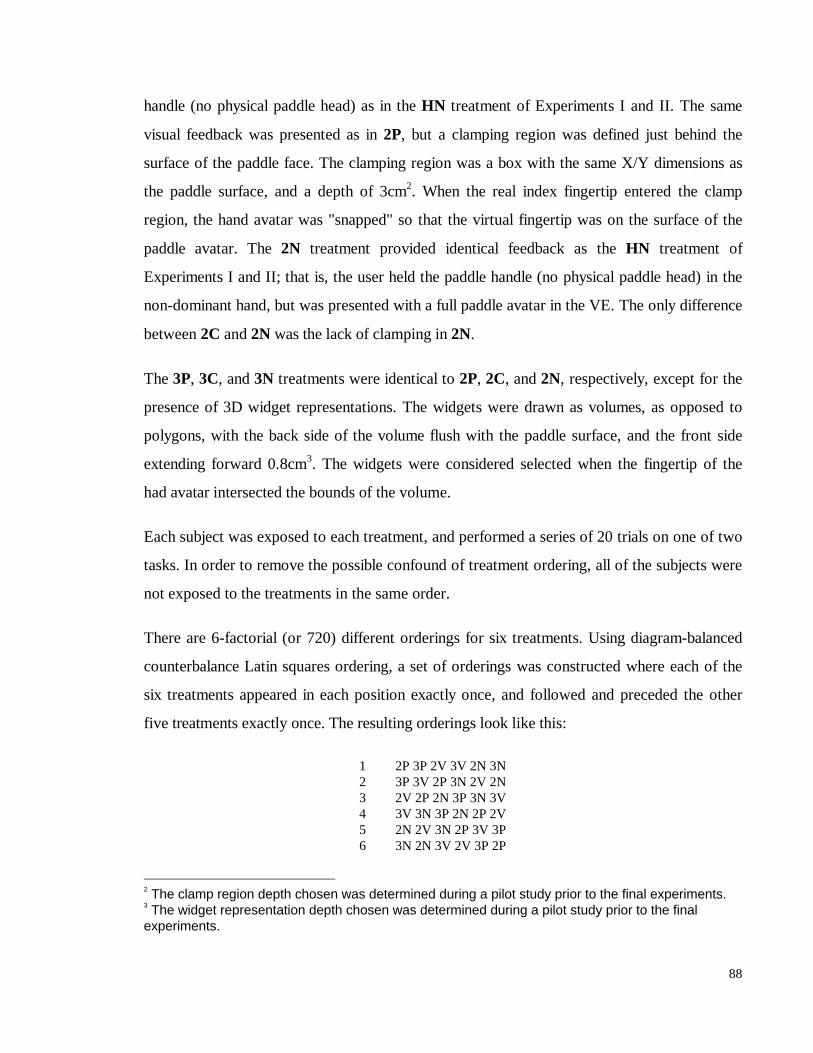
88
handle (no physical paddle head) as in the HN treatment of Experiments I and II. The same
visual feedback was presented as in 2P, but a clamping region was defined just behind the
surface of the paddle face. The clamping region was a box with the same X/Y dimensions as
the paddle surface, and a depth of 3cm2. When the real index fingertip entered the clamp
region, the hand avatar was "snapped" so that the virtual fingertip was on the surface of the
paddle avatar. The 2N treatment provided identical feedback as the HN treatment of
Experiments I and II; that is, the user held the paddle handle (no physical paddle head) in the
non-dominant hand, but was presented with a full paddle avatar in the VE. The only difference
between 2C and 2N was the lack of clamping in 2N.
The 3P, 3C, and 3N treatments were identical to 2P, 2C, and 2N, respectively, except for the
presence of 3D widget representations. The widgets were drawn as volumes, as opposed to
polygons, with the back side of the volume flush with the paddle surface, and the front side
extending forward 0.8cm3. The widgets were considered selected when the fingertip of the
had avatar intersected the bounds of the volume.
Each subject was exposed to each treatment, and performed a series of 20 trials on one of two
tasks. In order to remove the possible confound of treatment ordering, all of the subjects were
not exposed to the treatments in the same order.
There are 6-factorial (or 720) different orderings for six treatments. Using diagram-balanced
counterbalance Latin squares ordering, a set of orderings was constructed where each of the
six treatments appeared in each position exactly once, and followed and preceded the other
five treatments exactly once. The resulting orderings look like this:
1 2P 3P 2V 3V 2N 3N2 3P 3V 2P 3N 2V 2N3 2V 2P 2N 3P 3N 3V4 3V 3N 3P 2N 2P 2V5 2N 2V 3N 2P 3V 3P6 3N 2N 3V 2V 3P 2P
2 The clamp region depth chosen was determined during a pilot study prior to the final experiments.3 The widget representation depth chosen was determined during a pilot study prior to the finalexperiments.
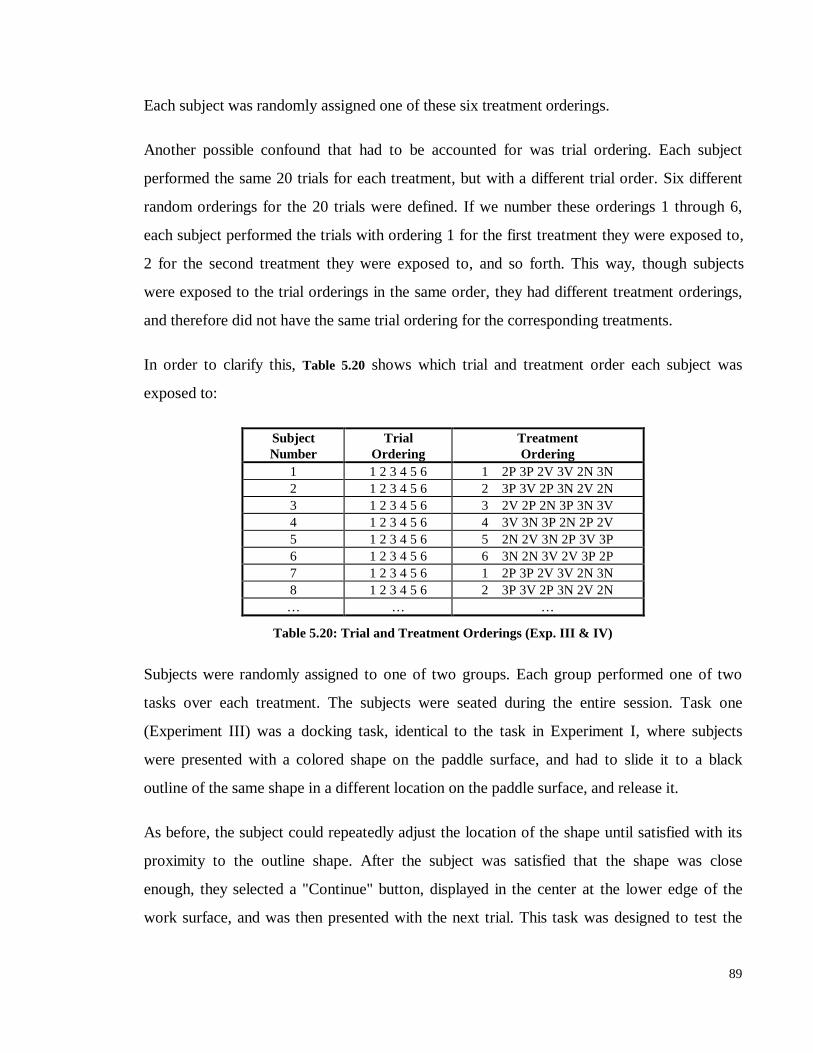
89
Each subject was randomly assigned one of these six treatment orderings.
Another possible confound that had to be accounted for was trial ordering. Each subject
performed the same 20 trials for each treatment, but with a different trial order. Six different
random orderings for the 20 trials were defined. If we number these orderings 1 through 6,
each subject performed the trials with ordering 1 for the first treatment they were exposed to,
2 for the second treatment they were exposed to, and so forth. This way, though subjects
were exposed to the trial orderings in the same order, they had different treatment orderings,
and therefore did not have the same trial ordering for the corresponding treatments.
In order to clarify this, Table 5.20 shows which trial and treatment order each subject was
exposed to:
SubjectNumber
TrialOrdering
TreatmentOrdering
1 1 2 3 4 5 6 1 2P 3P 2V 3V 2N 3N2 1 2 3 4 5 6 2 3P 3V 2P 3N 2V 2N3 1 2 3 4 5 6 3 2V 2P 2N 3P 3N 3V4 1 2 3 4 5 6 4 3V 3N 3P 2N 2P 2V5 1 2 3 4 5 6 5 2N 2V 3N 2P 3V 3P6 1 2 3 4 5 6 6 3N 2N 3V 2V 3P 2P7 1 2 3 4 5 6 1 2P 3P 2V 3V 2N 3N8 1 2 3 4 5 6 2 3P 3V 2P 3N 2V 2N… … …
Table 5.20: Trial and Treatment Orderings (Exp. III & IV)
Subjects were randomly assigned to one of two groups. Each group performed one of two
tasks over each treatment. The subjects were seated during the entire session. Task one
(Experiment III) was a docking task, identical to the task in Experiment I, where subjects
were presented with a colored shape on the paddle surface, and had to slide it to a black
outline of the same shape in a different location on the paddle surface, and release it.
As before, the subject could repeatedly adjust the location of the shape until satisfied with its
proximity to the outline shape. After the subject was satisfied that the shape was close
enough, they selected a "Continue" button, displayed in the center at the lower edge of the
work surface, and was then presented with the next trial. This task was designed to test the
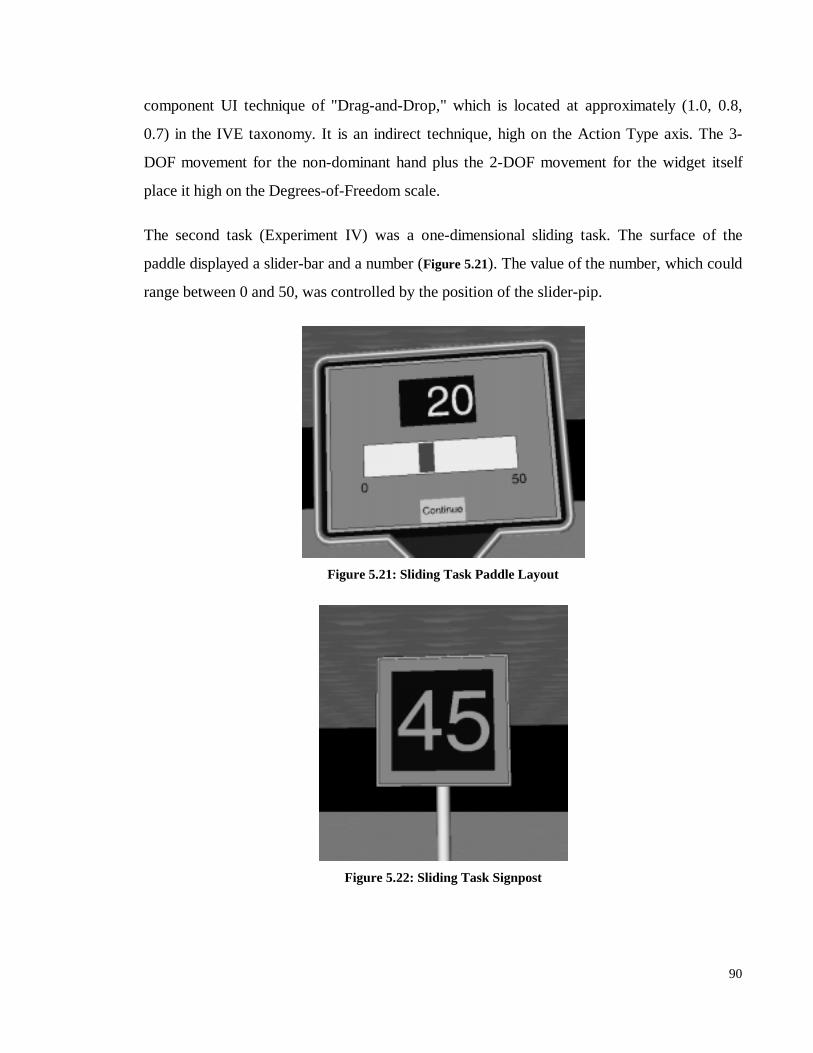
90
component UI technique of "Drag-and-Drop," which is located at approximately (1.0, 0.8,
0.7) in the IVE taxonomy. It is an indirect technique, high on the Action Type axis. The 3-
DOF movement for the non-dominant hand plus the 2-DOF movement for the widget itself
place it high on the Degrees-of-Freedom scale.
The second task (Experiment IV) was a one-dimensional sliding task. The surface of the
paddle displayed a slider-bar and a number (Figure 5.21). The value of the number, which could
range between 0 and 50, was controlled by the position of the slider-pip.
Figure 5.21: Sliding Task Paddle Layout
Figure 5.22: Sliding Task Signpost
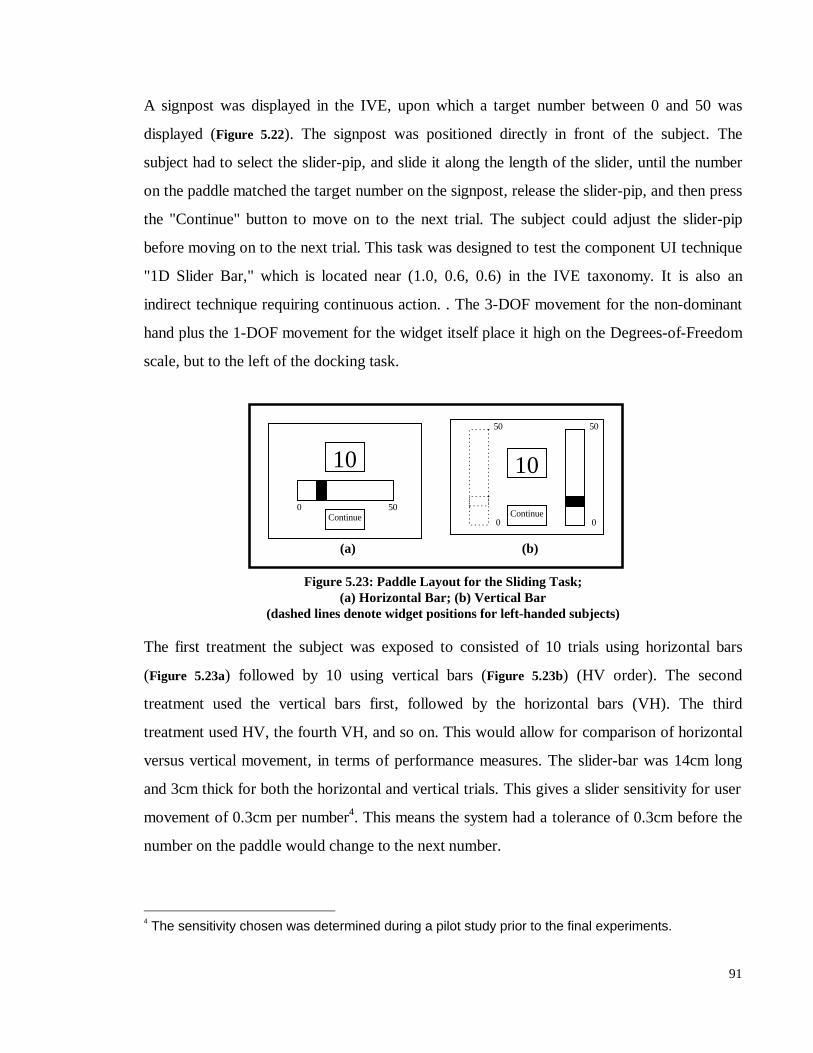
91
A signpost was displayed in the IVE, upon which a target number between 0 and 50 was
displayed (Figure 5.22). The signpost was positioned directly in front of the subject. The
subject had to select the slider-pip, and slide it along the length of the slider, until the number
on the paddle matched the target number on the signpost, release the slider-pip, and then press
the "Continue" button to move on to the next trial. The subject could adjust the slider-pip
before moving on to the next trial. This task was designed to test the component UI technique
"1D Slider Bar," which is located near (1.0, 0.6, 0.6) in the IVE taxonomy. It is also an
indirect technique requiring continuous action. . The 3-DOF movement for the non-dominant
hand plus the 1-DOF movement for the widget itself place it high on the Degrees-of-Freedom
scale, but to the left of the docking task.
Figure 5.23: Paddle Layout for the Sliding Task;(a) Horizontal Bar; (b) Vertical Bar
(dashed lines denote widget positions for left-handed subjects)
The first treatment the subject was exposed to consisted of 10 trials using horizontal bars
(Figure 5.23a) followed by 10 using vertical bars (Figure 5.23b) (HV order). The second
treatment used the vertical bars first, followed by the horizontal bars (VH). The third
treatment used HV, the fourth VH, and so on. This would allow for comparison of horizontal
versus vertical movement, in terms of performance measures. The slider-bar was 14cm long
and 3cm thick for both the horizontal and vertical trials. This gives a slider sensitivity for user
movement of 0.3cm per number4. This means the system had a tolerance of 0.3cm before the
number on the paddle would change to the next number.
4 The sensitivity chosen was determined during a pilot study prior to the final experiments.
10
Continue 0 50
10
Continue
50
0
(a) (b)
50
0
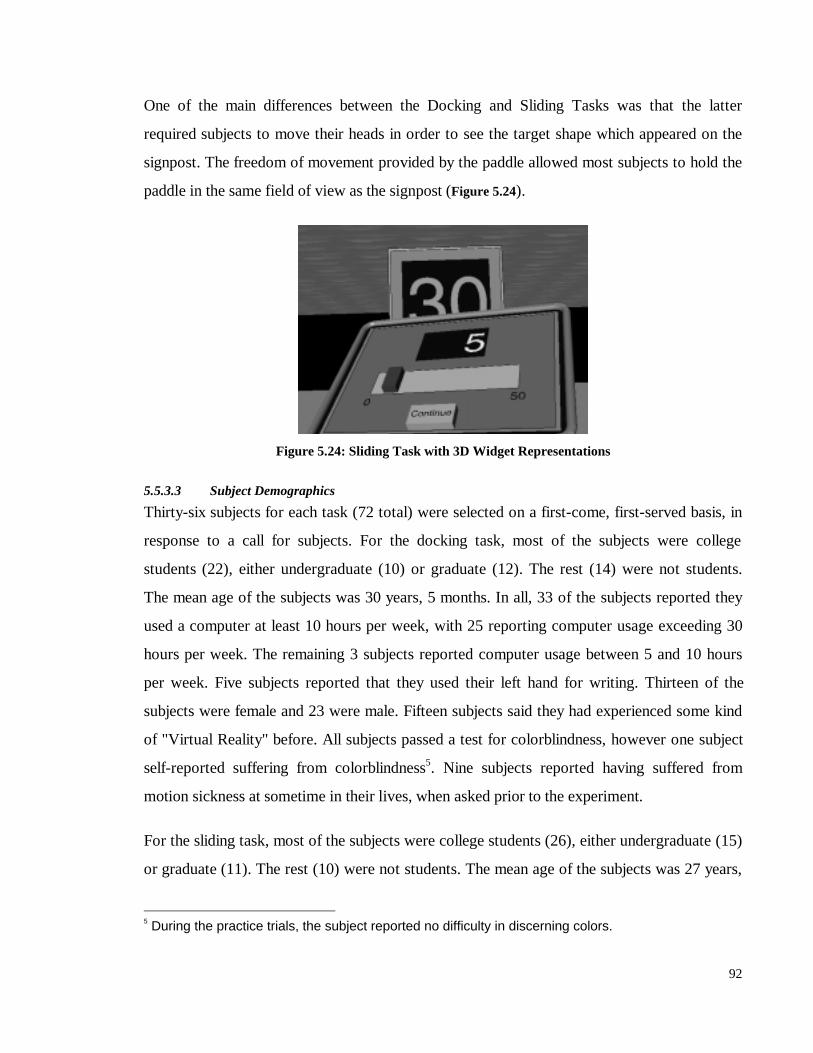
92
One of the main differences between the Docking and Sliding Tasks was that the latter
required subjects to move their heads in order to see the target shape which appeared on the
signpost. The freedom of movement provided by the paddle allowed most subjects to hold the
paddle in the same field of view as the signpost (Figure 5.24).
Figure 5.24: Sliding Task with 3D Widget Representations
5.5.3.3 Subject Demographics
Thirty-six subjects for each task (72 total) were selected on a first-come, first-served basis, in
response to a call for subjects. For the docking task, most of the subjects were college
students (22), either undergraduate (10) or graduate (12). The rest (14) were not students.
The mean age of the subjects was 30 years, 5 months. In all, 33 of the subjects reported they
used a computer at least 10 hours per week, with 25 reporting computer usage exceeding 30
hours per week. The remaining 3 subjects reported computer usage between 5 and 10 hours
per week. Five subjects reported that they used their left hand for writing. Thirteen of the
subjects were female and 23 were male. Fifteen subjects said they had experienced some kind
of "Virtual Reality" before. All subjects passed a test for colorblindness, however one subject
self-reported suffering from colorblindness5. Nine subjects reported having suffered from
motion sickness at sometime in their lives, when asked prior to the experiment.
For the sliding task, most of the subjects were college students (26), either undergraduate (15)
or graduate (11). The rest (10) were not students. The mean age of the subjects was 27 years,
5 During the practice trials, the subject reported no difficulty in discerning colors.
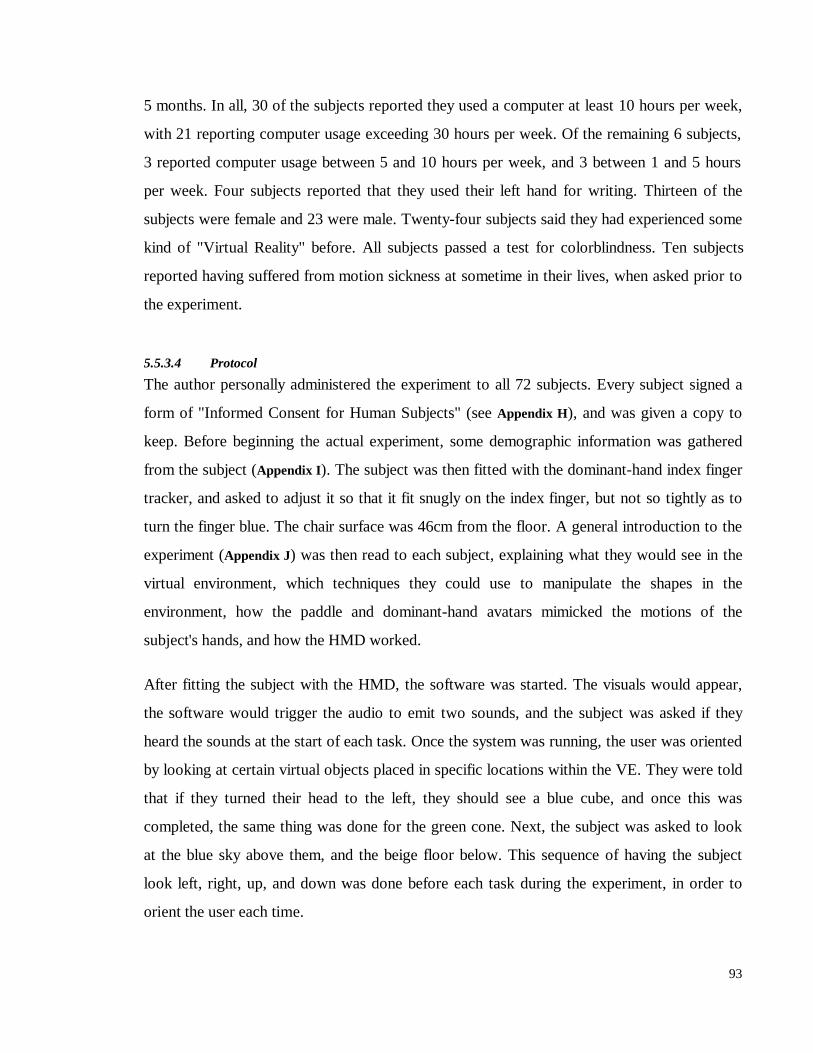
93
5 months. In all, 30 of the subjects reported they used a computer at least 10 hours per week,
with 21 reporting computer usage exceeding 30 hours per week. Of the remaining 6 subjects,
3 reported computer usage between 5 and 10 hours per week, and 3 between 1 and 5 hours
per week. Four subjects reported that they used their left hand for writing. Thirteen of the
subjects were female and 23 were male. Twenty-four subjects said they had experienced some
kind of "Virtual Reality" before. All subjects passed a test for colorblindness. Ten subjects
reported having suffered from motion sickness at sometime in their lives, when asked prior to
the experiment.
5.5.3.4 Protocol
The author personally administered the experiment to all 72 subjects. Every subject signed a
form of "Informed Consent for Human Subjects" (see Appendix H), and was given a copy to
keep. Before beginning the actual experiment, some demographic information was gathered
from the subject (Appendix I). The subject was then fitted with the dominant-hand index finger
tracker, and asked to adjust it so that it fit snugly on the index finger, but not so tightly as to
turn the finger blue. The chair surface was 46cm from the floor. A general introduction to the
experiment (Appendix J) was then read to each subject, explaining what they would see in the
virtual environment, which techniques they could use to manipulate the shapes in the
environment, how the paddle and dominant-hand avatars mimicked the motions of the
subject's hands, and how the HMD worked.
After fitting the subject with the HMD, the software was started. The visuals would appear,
the software would trigger the audio to emit two sounds, and the subject was asked if they
heard the sounds at the start of each task. Once the system was running, the user was oriented
by looking at certain virtual objects placed in specific locations within the VE. They were told
that if they turned their head to the left, they should see a blue cube, and once this was
completed, the same thing was done for the green cone. Next, the subject was asked to look
at the blue sky above them, and the beige floor below. This sequence of having the subject
look left, right, up, and down was done before each task during the experiment, in order to
orient the user each time.

94
At the beginning of each task, the subject was instructed to move their dominant hand into the
field of view, and that they would see the hand avatar. After having the subject move their
hand around a bit to get used to the mapping of hand movements to avatar movements, they
were asked to hold out their non-dominant hand, into which was placed the paddle, and they
were allowed to play with its movement for a while.
The paddle surface displayed the message, 'To begin the first trial, press the "Begin" button.'
The subject was asked to press the "Begin" button by touching it with their finger. After doing
this, they were given practice trials, during which a description of the task they had to perform
within the IVE was given (Appendices K and L). The user was given as many practice trials as
they wanted, and instructed that after practicing, they would be given 20 more trials which
would be scored in terms of both time and accuracy. They were instructed to indicate when
they felt they could perform the task quickly and accurately given the interface they had to
use. The subject was coached as to how best to manipulate the shapes, and about the different
types of feedback they were being given. For instance, for the clamping treatments (2C & 3C),
a detailed description of what clamping is was given.
After the practice trials, the subject was asked to take a brief rest, and was again told that
when ready, 20 more trials would be given, and would be scored in terms of both time and
accuracy. It was again made clear to the subjects that neither time nor accuracy was more
important, and that they should try to strike a balance between the two. Accuracy for the
docking task was measured by how close the center of the shape was placed to the center of
the target position, and for the sliding task, accuracy was measured as how closely the number
on the paddle matched the target number on the signpost. After each treatment, the HMD was
removed, the paddle was taken away, and the subject was allowed to relax as long as they
wanted to before beginning the next treatment.
5.5.3.5 Data Collection
As in the previous experiments, the tracker software logged all the tracker data during the
sessions to a disk file for later playback and analysis. A substantial amount of qualitative data
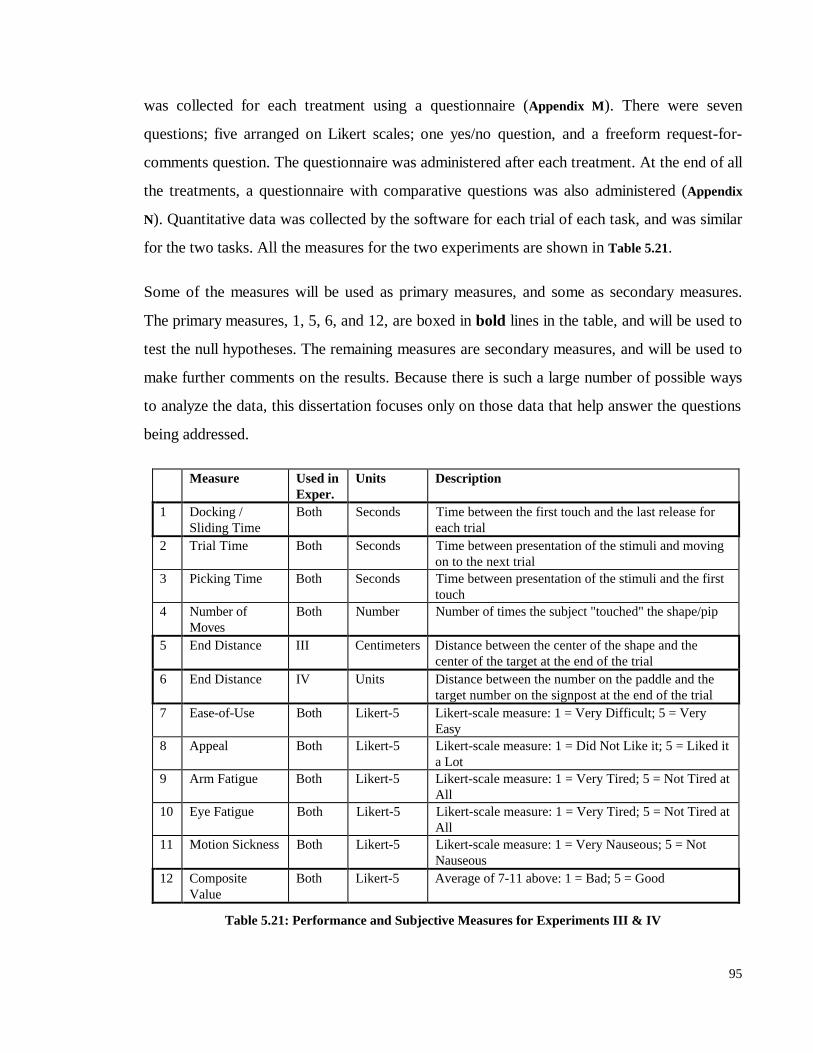
95
was collected for each treatment using a questionnaire (Appendix M). There were seven
questions; five arranged on Likert scales; one yes/no question, and a freeform request-for-
comments question. The questionnaire was administered after each treatment. At the end of all
the treatments, a questionnaire with comparative questions was also administered (Appendix
N). Quantitative data was collected by the software for each trial of each task, and was similar
for the two tasks. All the measures for the two experiments are shown in Table 5.21.
Some of the measures will be used as primary measures, and some as secondary measures.
The primary measures, 1, 5, 6, and 12, are boxed in bold lines in the table, and will be used to
test the null hypotheses. The remaining measures are secondary measures, and will be used to
make further comments on the results. Because there is such a large number of possible ways
to analyze the data, this dissertation focuses only on those data that help answer the questions
being addressed.
Measure Used inExper.
Units Description
1 Docking /Sliding Time
Both Seconds Time between the first touch and the last release foreach trial
2 Trial Time Both Seconds Time between presentation of the stimuli and movingon to the next trial
3 Picking Time Both Seconds Time between presentation of the stimuli and the firsttouch
4 Number ofMoves
Both Number Number of times the subject "touched" the shape/pip
5 End Distance III Centimeters Distance between the center of the shape and thecenter of the target at the end of the trial
6 End Distance IV Units Distance between the number on the paddle and thetarget number on the signpost at the end of the trial
7 Ease-of-Use Both Likert-5 Likert-scale measure: 1 = Very Difficult; 5 = VeryEasy
8 Appeal Both Likert-5 Likert-scale measure: 1 = Did Not Like it; 5 = Liked ita Lot
9 Arm Fatigue Both Likert-5 Likert-scale measure: 1 = Very Tired; 5 = Not Tired atAll
10 Eye Fatigue Both Likert-5 Likert-scale measure: 1 = Very Tired; 5 = Not Tired atAll
11 Motion Sickness Both Likert-5 Likert-scale measure: 1 = Very Nauseous; 5 = NotNauseous
12 CompositeValue
Both Likert-5 Average of 7-11 above: 1 = Bad; 5 = Good
Table 5.21: Performance and Subjective Measures for Experiments III & IV
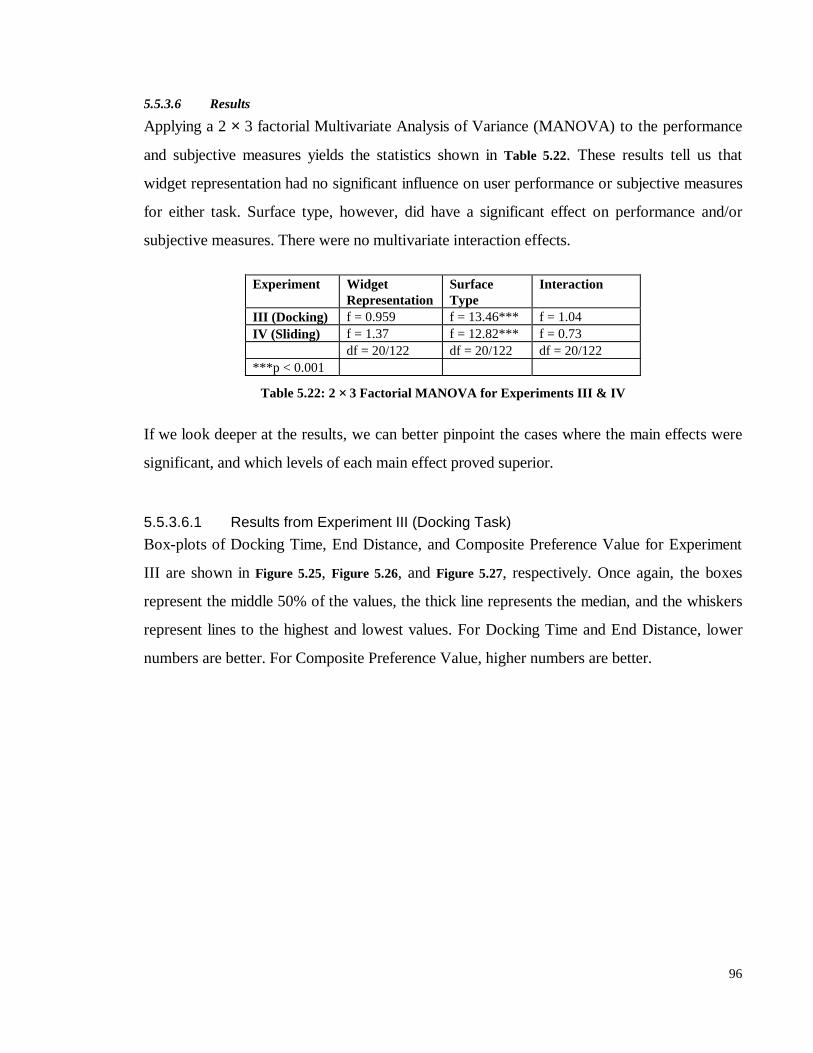
96
5.5.3.6 Results
Applying a 2 × 3 factorial Multivariate Analysis of Variance (MANOVA) to the performance
and subjective measures yields the statistics shown in Table 5.22. These results tell us that
widget representation had no significant influence on user performance or subjective measures
for either task. Surface type, however, did have a significant effect on performance and/or
subjective measures. There were no multivariate interaction effects.
Experiment WidgetRepresentation
SurfaceType
Interaction
III (Docking) f = 0.959 f = 13.46*** f = 1.04IV (Sliding) f = 1.37 f = 12.82*** f = 0.73
df = 20/122 df = 20/122 df = 20/122***p < 0.001
Table 5.22: 2 × 3 Factorial MANOVA for Experiments III & IV
If we look deeper at the results, we can better pinpoint the cases where the main effects were
significant, and which levels of each main effect proved superior.
5.5.3.6.1 Results from Experiment III (Docking Task)
Box-plots of Docking Time, End Distance, and Composite Preference Value for Experiment
III are shown in Figure 5.25, Figure 5.26, and Figure 5.27, respectively. Once again, the boxes
represent the middle 50% of the values, the thick line represents the median, and the whiskers
represent lines to the highest and lowest values. For Docking Time and End Distance, lower
numbers are better. For Composite Preference Value, higher numbers are better.
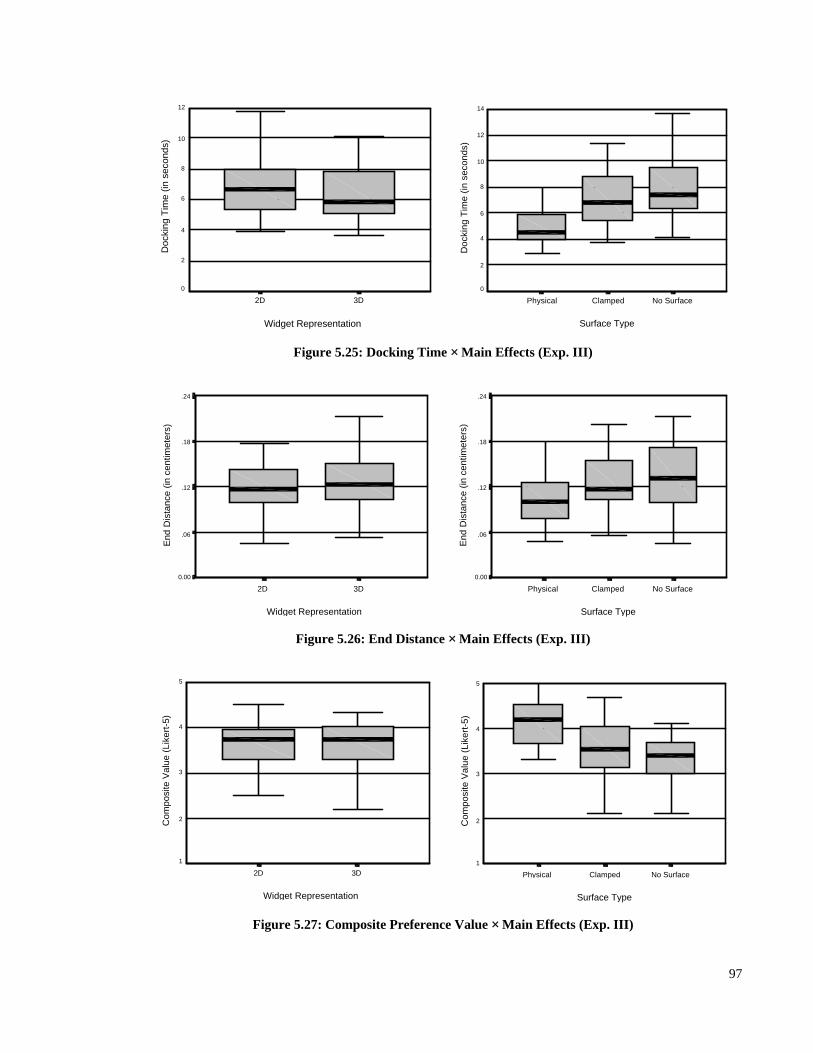
97
Widget Representation
3D2D
Doc
king
Tim
e (in
sec
onds
)
12
10
8
6
4
2
0
Surface Type
No SurfaceClampedPhysical
Doc
king
Tim
e (in
sec
onds
)
14
12
10
8
6
4
2
0
Figure 5.25: Docking Time × Main Effects (Exp. III)
Widget Representation
3D2D
End
Dis
tanc
e (in
cen
timet
ers)
.24
.18
.12
.06
0.00
Surface Type
No SurfaceClampedPhysical
End
Dis
tanc
e (in
cen
timet
ers)
.24
.18
.12
.06
0.00
Figure 5.26: End Distance × Main Effects (Exp. III)
Widget Representation
3D2D
Com
posi
te V
alue
(Li
kert
-5)
5
4
3
2
1
Surface Type
No SurfaceClampedPhysical
Com
posi
te V
alue
(Li
kert
-5)
5
4
3
2
1
Figure 5.27: Composite Preference Value × Main Effects (Exp. III)
98
An explanation of the actual values being compared in the presentations of the results is in
order. For each subject, data were collected for 20 trials for each treatment. The scores used
for graphing and analysis are the average for each measure of the 20 trials for a given
treatment. For the main effects, the value used is the average of the two or three treatment
averages dictated by the 2 × 3 design (e.g. a value for 2D Widget Representation (2) is the
average of 2P, 2C, and 2N for a given measure).
The results of the univariate 2 × 3 factorial ANOVA of the performance measures and
treatment questionnaire responses are shown in Table 5.23. Each row in the table represents a
separate measure, and the mean, standard deviation, f-value, and significance is given for each
independent variable. If no significance is found across a given level of an independent
variable (e.g. Widget Representation for Trial Time), then a line is drawn beneath the levels
that are statistically equal. The f-value for interaction effects is given in a separate column, as
is a summary of the main effect significance and direction. Primary measures are outlined in
bold lines.
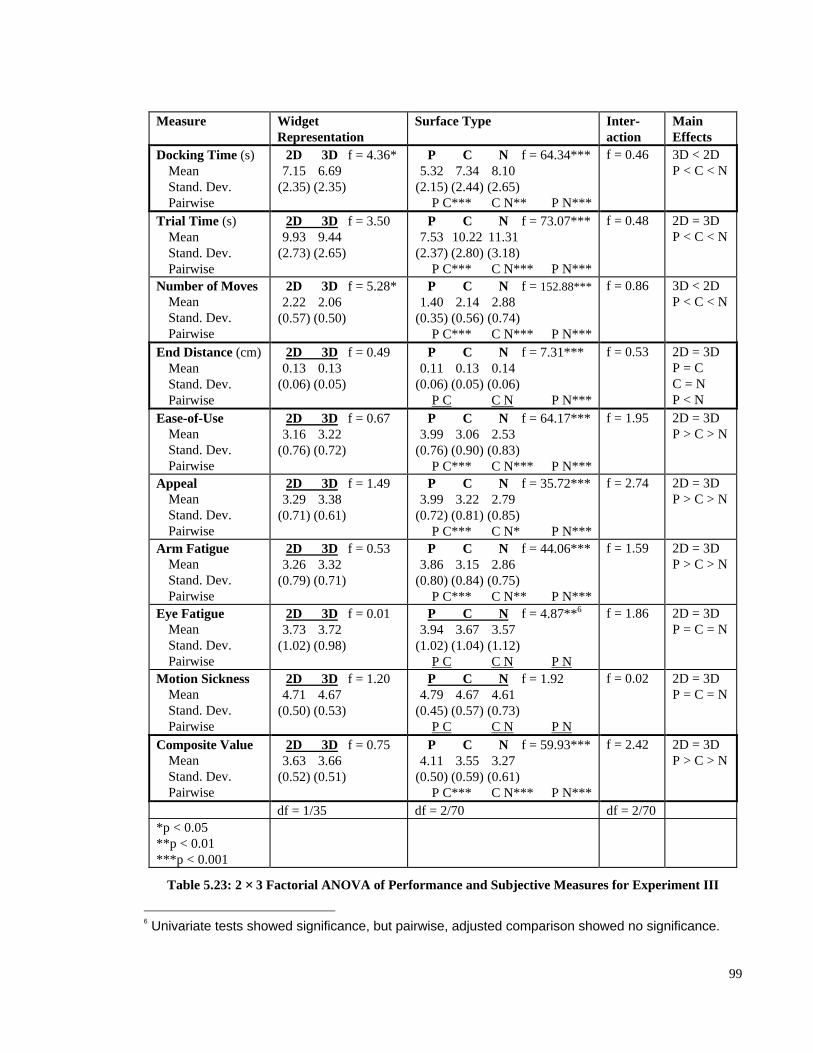
99
Measure WidgetRepresentation
Surface Type Inter-action
MainEffects
Docking Time (s)MeanStand. Dev.Pairwise
2D 3D f = 4.36*7.15 6.69
(2.35) (2.35)
P C N f = 64.34***5.32 7.34 8.10
(2.15) (2.44) (2.65)P C*** C N** P N***
f = 0.46 3D < 2DP < C < N
Trial Time (s)MeanStand. Dev.Pairwise
2D 3D f = 3.509.93 9.44
(2.73) (2.65)
P C N f = 73.07***7.53 10.22 11.31
(2.37) (2.80) (3.18)P C*** C N*** P N***
f = 0.48 2D = 3DP < C < N
Number of MovesMeanStand. Dev.Pairwise
2D 3D f = 5.28*2.22 2.06
(0.57) (0.50)
P C N f = 152.88***1.40 2.14 2.88
(0.35) (0.56) (0.74)P C*** C N*** P N***
f = 0.86 3D < 2DP < C < N
End Distance (cm)MeanStand. Dev.Pairwise
2D 3D f = 0.490.13 0.13
(0.06) (0.05)
P C N f = 7.31***0.11 0.13 0.14
(0.06) (0.05) (0.06)P C C N P N***
f = 0.53 2D = 3DP = CC = NP < N
Ease-of-UseMeanStand. Dev.Pairwise
2D 3D f = 0.673.16 3.22
(0.76) (0.72)
P C N f = 64.17***3.99 3.06 2.53
(0.76) (0.90) (0.83)P C*** C N*** P N***
f = 1.95 2D = 3DP > C > N
AppealMeanStand. Dev.Pairwise
2D 3D f = 1.493.29 3.38
(0.71) (0.61)
P C N f = 35.72***3.99 3.22 2.79
(0.72) (0.81) (0.85)P C*** C N* P N***
f = 2.74 2D = 3DP > C > N
Arm FatigueMeanStand. Dev.Pairwise
2D 3D f = 0.533.26 3.32
(0.79) (0.71)
P C N f = 44.06***3.86 3.15 2.86
(0.80) (0.84) (0.75)P C*** C N** P N***
f = 1.59 2D = 3DP > C > N
Eye FatigueMeanStand. Dev.Pairwise
2D 3D f = 0.013.73 3.72
(1.02) (0.98)
P C N f = 4.87**6
3.94 3.67 3.57(1.02) (1.04) (1.12)
P C C N P N
f = 1.86 2D = 3DP = C = N
Motion SicknessMeanStand. Dev.Pairwise
2D 3D f = 1.204.71 4.67
(0.50) (0.53)
P C N f = 1.924.79 4.67 4.61
(0.45) (0.57) (0.73)P C C N P N
f = 0.02 2D = 3DP = C = N
Composite ValueMeanStand. Dev.Pairwise
2D 3D f = 0.753.63 3.66
(0.52) (0.51)
P C N f = 59.93***4.11 3.55 3.27
(0.50) (0.59) (0.61)P C*** C N*** P N***
f = 2.42 2D = 3DP > C > N
df = 1/35 df = 2/70 df = 2/70*p < 0.05**p < 0.01***p < 0.001
Table 5.23: 2 × 3 Factorial ANOVA of Performance and Subjective Measures for Experiment III
6 Univariate tests showed significance, but pairwise, adjusted comparison showed no significance.
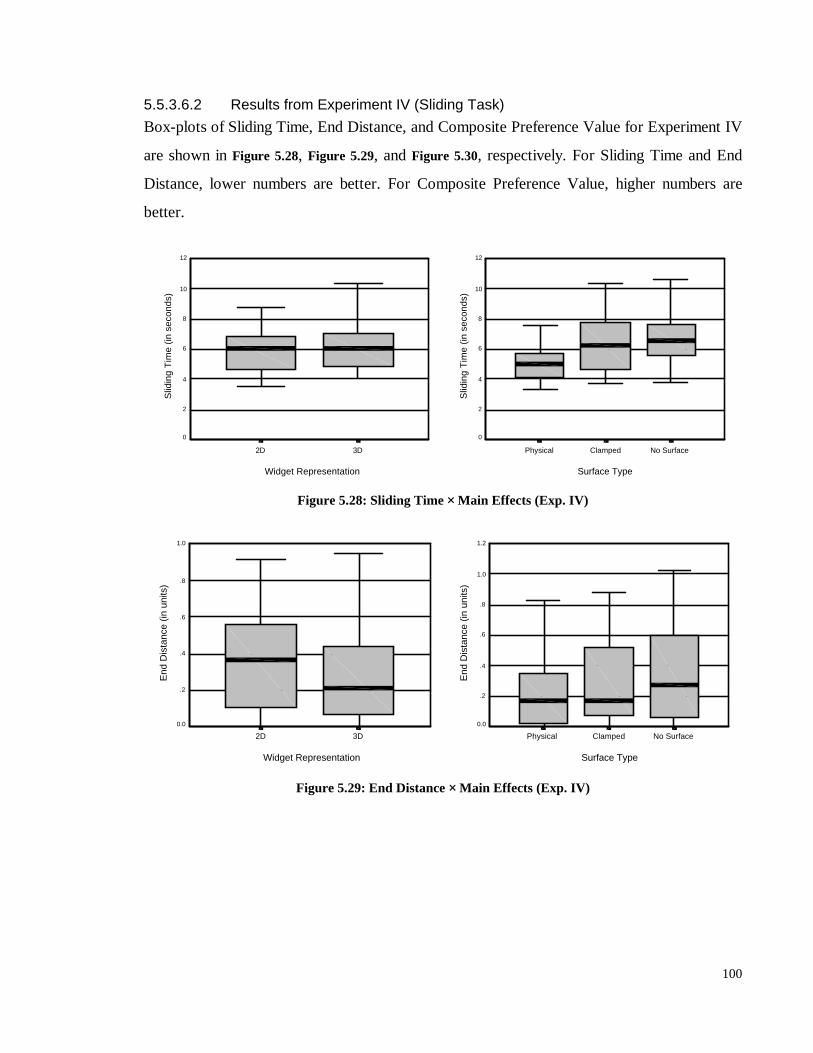
100
5.5.3.6.2 Results from Experiment IV (Sliding Task)
Box-plots of Sliding Time, End Distance, and Composite Preference Value for Experiment IV
are shown in Figure 5.28, Figure 5.29, and Figure 5.30, respectively. For Sliding Time and End
Distance, lower numbers are better. For Composite Preference Value, higher numbers are
better.
Widget Representation
3D2D
Slid
ing
Tim
e (in
sec
onds
)
12
10
8
6
4
2
0
Surface Type
No SurfaceClampedPhysical
Slid
ing
Tim
e (in
sec
onds
)
12
10
8
6
4
2
0
Figure 5.28: Sliding Time × Main Effects (Exp. IV)
Widget Representation
3D2D
End
Dis
tanc
e (in
uni
ts)
1.0
.8
.6
.4
.2
0.0
Surface Type
No SurfaceClampedPhysical
End
Dis
tanc
e (in
uni
ts)
1.2
1.0
.8
.6
.4
.2
0.0
Figure 5.29: End Distance × Main Effects (Exp. IV)
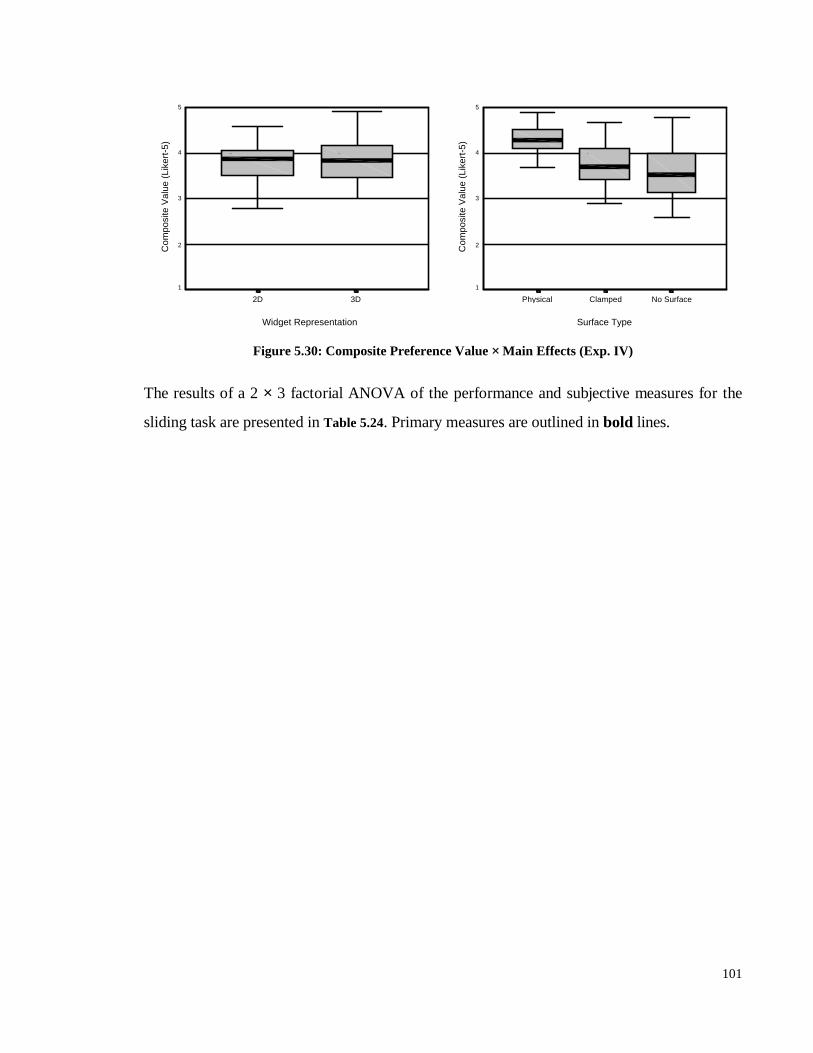
101
Widget Representation
3D2D
Com
posi
te V
alue
(Li
kert
-5)
5
4
3
2
1
Surface Type
No SurfaceClampedPhysical
Com
posi
te V
alue
(Li
kert
-5)
5
4
3
2
1
Figure 5.30: Composite Preference Value × Main Effects (Exp. IV)
The results of a 2 × 3 factorial ANOVA of the performance and subjective measures for the
sliding task are presented in Table 5.24. Primary measures are outlined in bold lines.
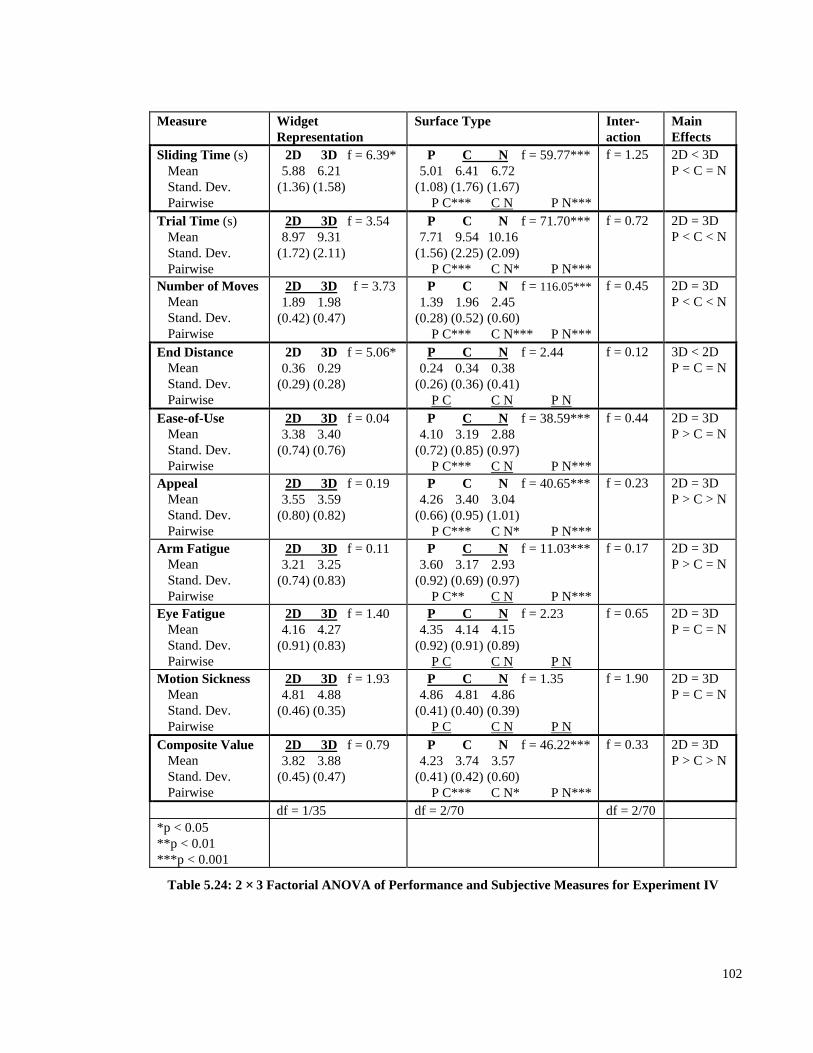
102
Measure WidgetRepresentation
Surface Type Inter-action
MainEffects
Sliding Time (s)MeanStand. Dev.Pairwise
2D 3D f = 6.39*5.88 6.21
(1.36) (1.58)
P C N f = 59.77***5.01 6.41 6.72
(1.08) (1.76) (1.67)P C*** C N P N***
f = 1.25 2D < 3DP < C = N
Trial Time (s)MeanStand. Dev.Pairwise
2D 3D f = 3.548.97 9.31
(1.72) (2.11)
P C N f = 71.70***7.71 9.54 10.16
(1.56) (2.25) (2.09)P C*** C N* P N***
f = 0.72 2D = 3DP < C < N
Number of MovesMeanStand. Dev.Pairwise
2D 3D f = 3.731.89 1.98
(0.42) (0.47)
P C N f = 116.05***1.39 1.96 2.45
(0.28) (0.52) (0.60)P C*** C N*** P N***
f = 0.45 2D = 3DP < C < N
End DistanceMeanStand. Dev.Pairwise
2D 3D f = 5.06*0.36 0.29
(0.29) (0.28)
P C N f = 2.440.24 0.34 0.38
(0.26) (0.36) (0.41)P C C N P N
f = 0.12 3D < 2DP = C = N
Ease-of-UseMeanStand. Dev.Pairwise
2D 3D f = 0.043.38 3.40
(0.74) (0.76)
P C N f = 38.59***4.10 3.19 2.88
(0.72) (0.85) (0.97)P C*** C N P N***
f = 0.44 2D = 3DP > C = N
AppealMeanStand. Dev.Pairwise
2D 3D f = 0.193.55 3.59
(0.80) (0.82)
P C N f = 40.65***4.26 3.40 3.04
(0.66) (0.95) (1.01)P C*** C N* P N***
f = 0.23 2D = 3DP > C > N
Arm FatigueMeanStand. Dev.Pairwise
2D 3D f = 0.113.21 3.25
(0.74) (0.83)
P C N f = 11.03***3.60 3.17 2.93
(0.92) (0.69) (0.97)P C** C N P N***
f = 0.17 2D = 3DP > C = N
Eye FatigueMeanStand. Dev.Pairwise
2D 3D f = 1.404.16 4.27
(0.91) (0.83)
P C N f = 2.234.35 4.14 4.15
(0.92) (0.91) (0.89)P C C N P N
f = 0.65 2D = 3DP = C = N
Motion SicknessMeanStand. Dev.Pairwise
2D 3D f = 1.934.81 4.88
(0.46) (0.35)
P C N f = 1.354.86 4.81 4.86
(0.41) (0.40) (0.39)P C C N P N
f = 1.90 2D = 3DP = C = N
Composite ValueMeanStand. Dev.Pairwise
2D 3D f = 0.793.82 3.88
(0.45) (0.47)
P C N f = 46.22***4.23 3.74 3.57
(0.41) (0.42) (0.60)P C*** C N* P N***
f = 0.33 2D = 3DP > C > N
df = 1/35 df = 2/70 df = 2/70*p < 0.05**p < 0.01***p < 0.001
Table 5.24: 2 × 3 Factorial ANOVA of Performance and Subjective Measures for Experiment IV
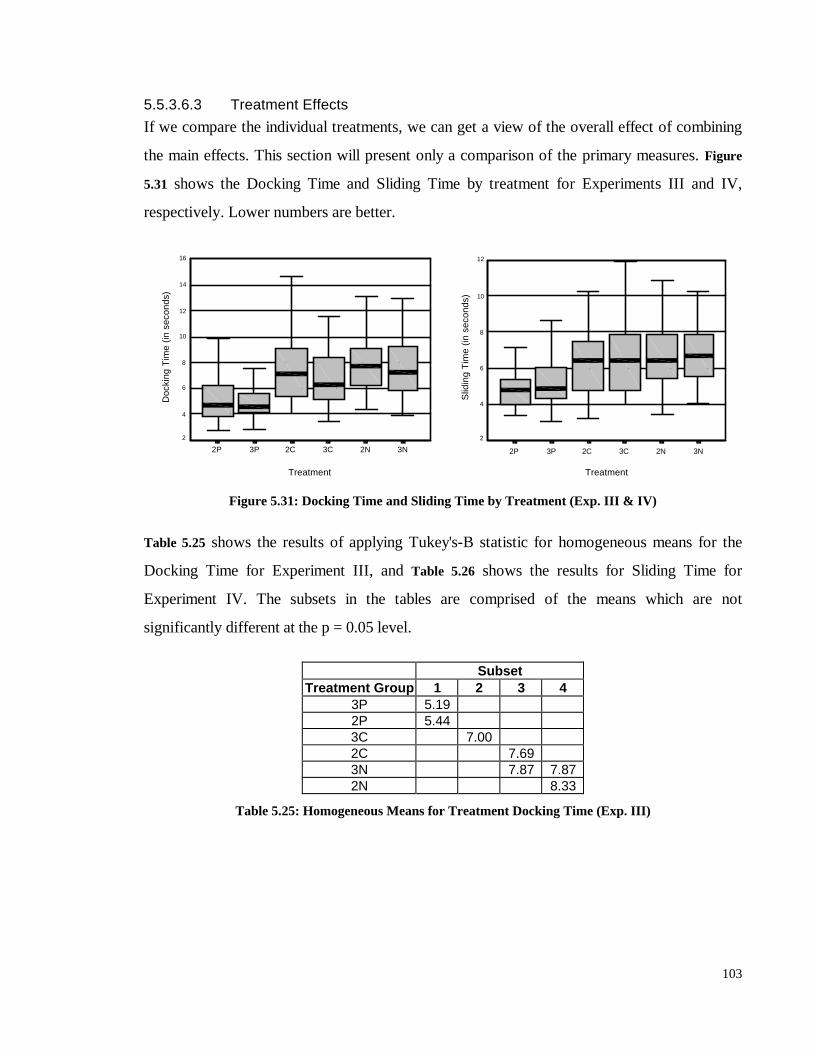
103
5.5.3.6.3 Treatment Effects
If we compare the individual treatments, we can get a view of the overall effect of combining
the main effects. This section will present only a comparison of the primary measures. Figure
5.31 shows the Docking Time and Sliding Time by treatment for Experiments III and IV,
respectively. Lower numbers are better.
Treatment
3N2N3C2C3P2P
Doc
king
Tim
e (in
sec
onds
)
16
14
12
10
8
6
4
2
Treatment
3N2N3C2C3P2P
Slid
ing
Tim
e (in
sec
onds
)
12
10
8
6
4
2
Figure 5.31: Docking Time and Sliding Time by Treatment (Exp. III & IV)
Table 5.25 shows the results of applying Tukey's-B statistic for homogeneous means for the
Docking Time for Experiment III, and Table 5.26 shows the results for Sliding Time for
Experiment IV. The subsets in the tables are comprised of the means which are not
significantly different at the p = 0.05 level.
SubsetTreatment Group 1 2 3 4
3P 5.192P 5.443C 7.002C 7.693N 7.87 7.872N 8.33
Table 5.25: Homogeneous Means for Treatment Docking Time (Exp. III)
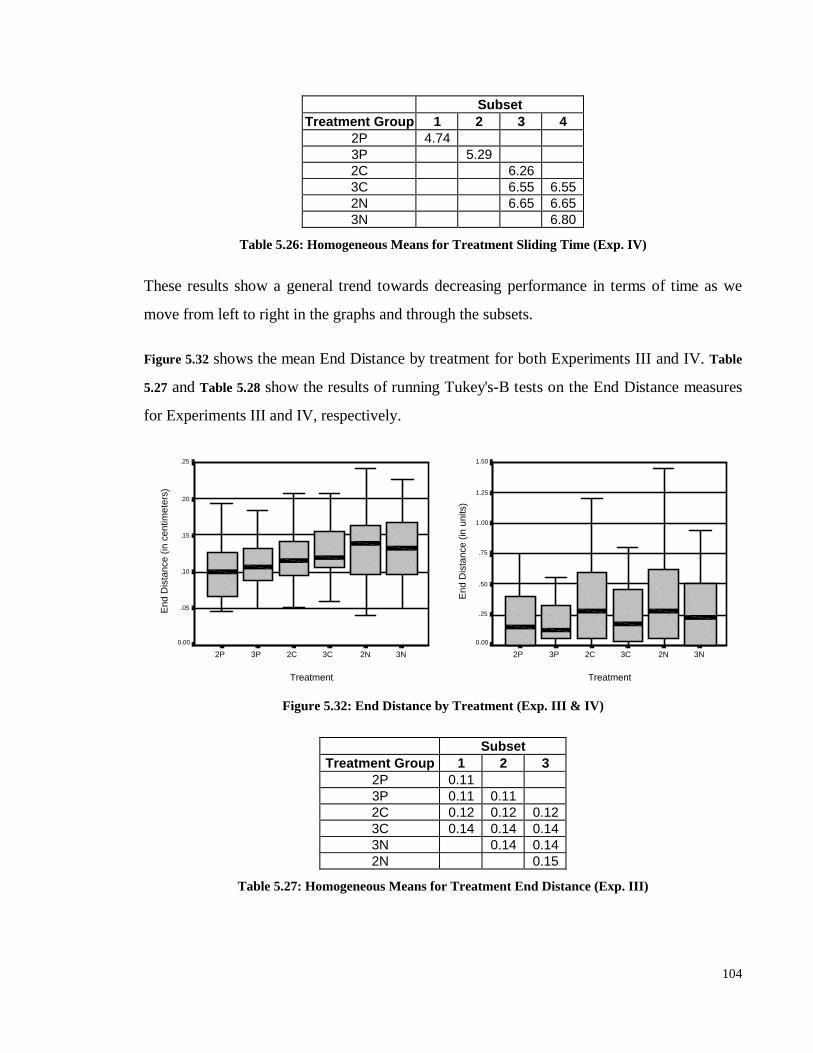
104
SubsetTreatment Group 1 2 3 4
2P 4.743P 5.292C 6.263C 6.55 6.552N 6.65 6.653N 6.80
Table 5.26: Homogeneous Means for Treatment Sliding Time (Exp. IV)
These results show a general trend towards decreasing performance in terms of time as we
move from left to right in the graphs and through the subsets.
Figure 5.32 shows the mean End Distance by treatment for both Experiments III and IV. Table
5.27 and Table 5.28 show the results of running Tukey's-B tests on the End Distance measures
for Experiments III and IV, respectively.
Treatment
3N2N3C2C3P2P
End
Dis
tanc
e (in
cen
timet
ers)
.25
.20
.15
.10
.05
0.00
Treatment
3N2N3C2C3P2P
End
Dis
tanc
e (in
uni
ts)
1.50
1.25
1.00
.75
.50
.25
0.00
Figure 5.32: End Distance by Treatment (Exp. III & IV)
SubsetTreatment Group 1 2 3
2P 0.113P 0.11 0.112C 0.12 0.12 0.123C 0.14 0.14 0.143N 0.14 0.142N 0.15
Table 5.27: Homogeneous Means for Treatment End Distance (Exp. III)
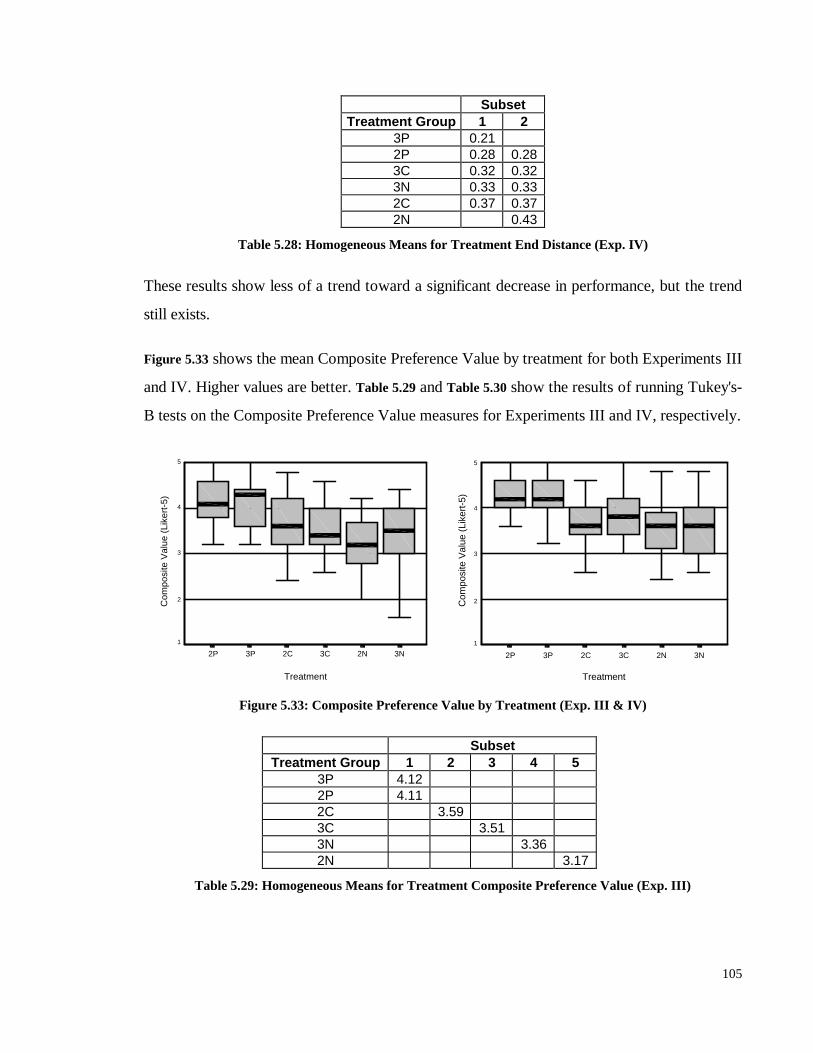
105
SubsetTreatment Group 1 2
3P 0.212P 0.28 0.283C 0.32 0.323N 0.33 0.332C 0.37 0.372N 0.43
Table 5.28: Homogeneous Means for Treatment End Distance (Exp. IV)
These results show less of a trend toward a significant decrease in performance, but the trend
still exists.
Figure 5.33 shows the mean Composite Preference Value by treatment for both Experiments III
and IV. Higher values are better. Table 5.29 and Table 5.30 show the results of running Tukey's-
B tests on the Composite Preference Value measures for Experiments III and IV, respectively.
Treatment
3N2N3C2C3P2P
Com
posi
te V
alue
(Li
kert
-5)
5
4
3
2
1
Treatment
3N2N3C2C3P2P
Com
posi
te V
alue
(Li
kert
-5)
5
4
3
2
1
Figure 5.33: Composite Preference Value by Treatment (Exp. III & IV)
SubsetTreatment Group 1 2 3 4 5
3P 4.122P 4.112C 3.593C 3.513N 3.362N 3.17
Table 5.29: Homogeneous Means for Treatment Composite Preference Value (Exp. III)
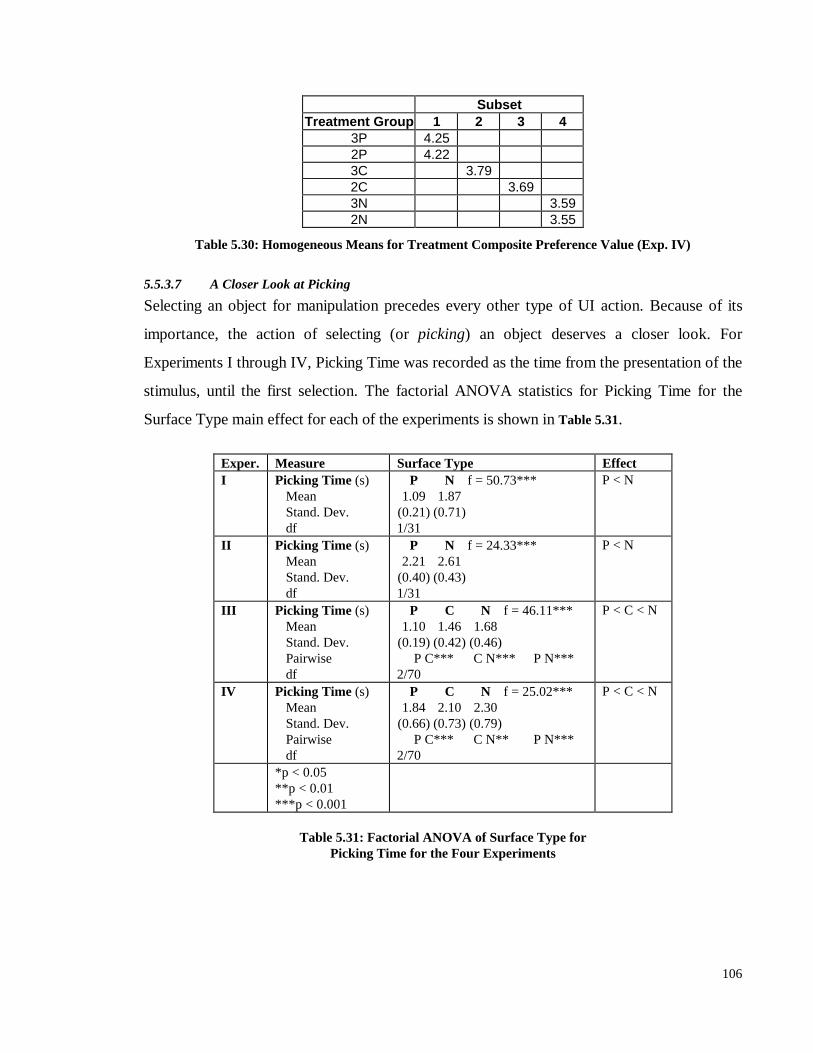
106
SubsetTreatment Group 1 2 3 4
3P 4.252P 4.223C 3.792C 3.693N 3.592N 3.55
Table 5.30: Homogeneous Means for Treatment Composite Preference Value (Exp. IV)
5.5.3.7 A Closer Look at Picking
Selecting an object for manipulation precedes every other type of UI action. Because of its
importance, the action of selecting (or picking) an object deserves a closer look. For
Experiments I through IV, Picking Time was recorded as the time from the presentation of the
stimulus, until the first selection. The factorial ANOVA statistics for Picking Time for the
Surface Type main effect for each of the experiments is shown in Table 5.31.
Exper. Measure Surface Type EffectI Picking Time (s)
MeanStand. Dev.df
P N f = 50.73***1.09 1.87
(0.21) (0.71)1/31
P < N
II Picking Time (s)MeanStand. Dev.df
P N f = 24.33***2.21 2.61
(0.40) (0.43)1/31
P < N
III Picking Time (s)MeanStand. Dev.Pairwisedf
P C N f = 46.11***1.10 1.46 1.68
(0.19) (0.42) (0.46)P C*** C N*** P N***
2/70
P < C < N
IV Picking Time (s)MeanStand. Dev.Pairwisedf
P C N f = 25.02***1.84 2.10 2.30
(0.66) (0.73) (0.79)P C*** C N** P N***
2/70
P < C < N
*p < 0.05**p < 0.01***p < 0.001
Table 5.31: Factorial ANOVA of Surface Type forPicking Time for the Four Experiments
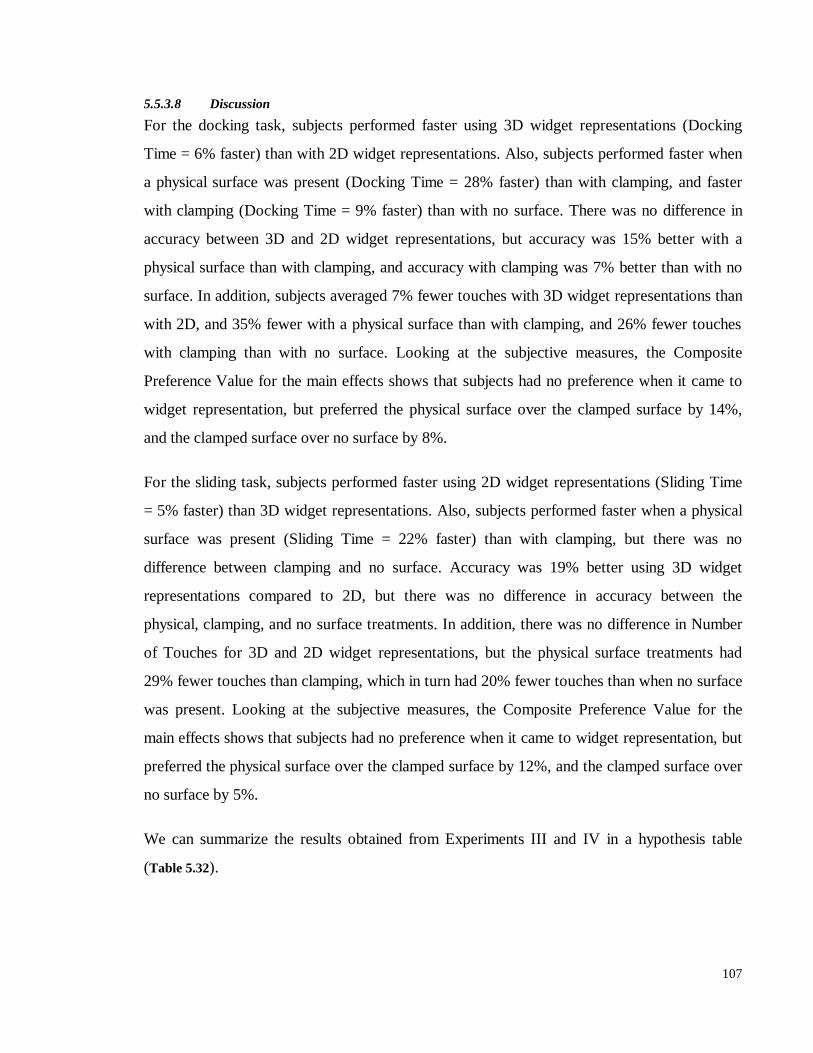
107
5.5.3.8 Discussion
For the docking task, subjects performed faster using 3D widget representations (Docking
Time = 6% faster) than with 2D widget representations. Also, subjects performed faster when
a physical surface was present (Docking Time = 28% faster) than with clamping, and faster
with clamping (Docking Time = 9% faster) than with no surface. There was no difference in
accuracy between 3D and 2D widget representations, but accuracy was 15% better with a
physical surface than with clamping, and accuracy with clamping was 7% better than with no
surface. In addition, subjects averaged 7% fewer touches with 3D widget representations than
with 2D, and 35% fewer with a physical surface than with clamping, and 26% fewer touches
with clamping than with no surface. Looking at the subjective measures, the Composite
Preference Value for the main effects shows that subjects had no preference when it came to
widget representation, but preferred the physical surface over the clamped surface by 14%,
and the clamped surface over no surface by 8%.
For the sliding task, subjects performed faster using 2D widget representations (Sliding Time
= 5% faster) than 3D widget representations. Also, subjects performed faster when a physical
surface was present (Sliding Time = 22% faster) than with clamping, but there was no
difference between clamping and no surface. Accuracy was 19% better using 3D widget
representations compared to 2D, but there was no difference in accuracy between the
physical, clamping, and no surface treatments. In addition, there was no difference in Number
of Touches for 3D and 2D widget representations, but the physical surface treatments had
29% fewer touches than clamping, which in turn had 20% fewer touches than when no surface
was present. Looking at the subjective measures, the Composite Preference Value for the
main effects shows that subjects had no preference when it came to widget representation, but
preferred the physical surface over the clamped surface by 12%, and the clamped surface over
no surface by 5%.
We can summarize the results obtained from Experiments III and IV in a hypothesis table
(Table 5.32).
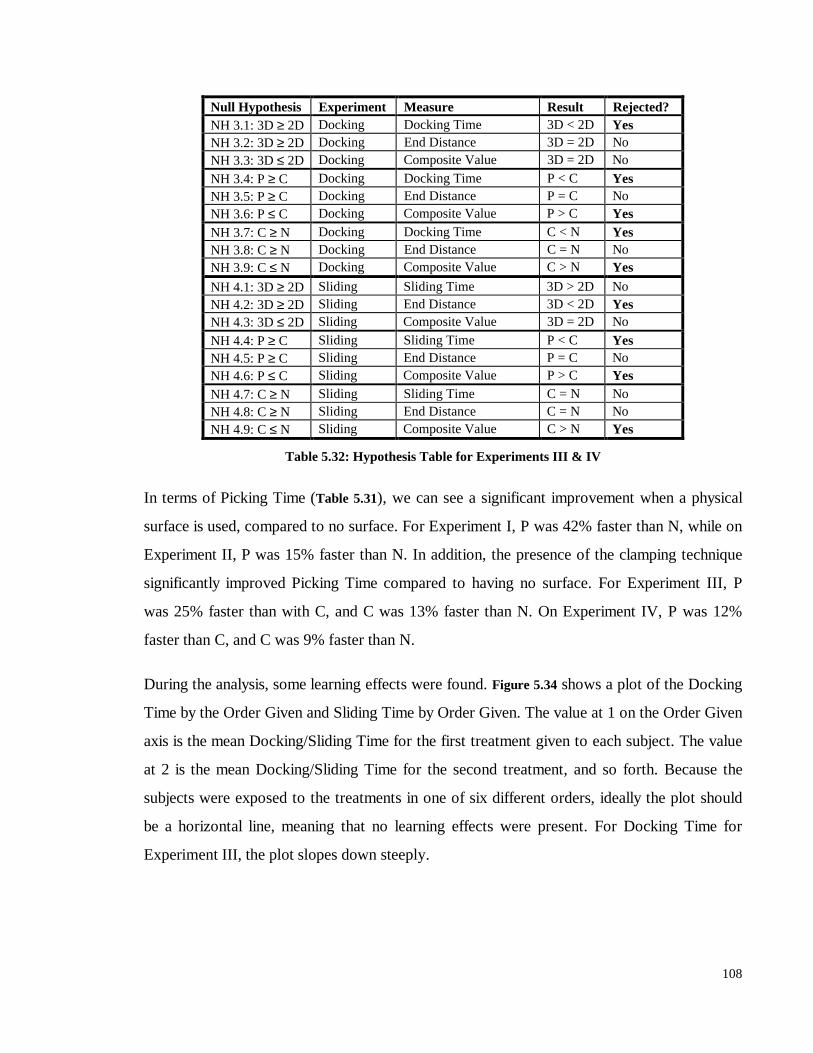
108
Null Hypothesis Experiment Measure Result Rejected?NH 3.1: 3D ≥ 2D Docking Docking Time 3D < 2D YesNH 3.2: 3D ≥ 2D Docking End Distance 3D = 2D NoNH 3.3: 3D ≤ 2D Docking Composite Value 3D = 2D No
NH 3.4: P ≥ C Docking Docking Time P < C YesNH 3.5: P ≥ C Docking End Distance P = C NoNH 3.6: P ≤ C Docking Composite Value P > C YesNH 3.7: C ≥ N Docking Docking Time C < N YesNH 3.8: C ≥ N Docking End Distance C = N NoNH 3.9: C ≤ N Docking Composite Value C > N Yes
NH 4.1: 3D ≥ 2D Sliding Sliding Time 3D > 2D NoNH 4.2: 3D ≥ 2D Sliding End Distance 3D < 2D YesNH 4.3: 3D ≤ 2D Sliding Composite Value 3D = 2D No
NH 4.4: P ≥ C Sliding Sliding Time P < C YesNH 4.5: P ≥ C Sliding End Distance P = C NoNH 4.6: P ≤ C Sliding Composite Value P > C YesNH 4.7: C ≥ N Sliding Sliding Time C = N NoNH 4.8: C ≥ N Sliding End Distance C = N NoNH 4.9: C ≤ N Sliding Composite Value C > N Yes
Table 5.32: Hypothesis Table for Experiments III & IV
In terms of Picking Time (Table 5.31), we can see a significant improvement when a physical
surface is used, compared to no surface. For Experiment I, P was 42% faster than N, while on
Experiment II, P was 15% faster than N. In addition, the presence of the clamping technique
significantly improved Picking Time compared to having no surface. For Experiment III, P
was 25% faster than with C, and C was 13% faster than N. On Experiment IV, P was 12%
faster than C, and C was 9% faster than N.
During the analysis, some learning effects were found. Figure 5.34 shows a plot of the Docking
Time by the Order Given and Sliding Time by Order Given. The value at 1 on the Order Given
axis is the mean Docking/Sliding Time for the first treatment given to each subject. The value
at 2 is the mean Docking/Sliding Time for the second treatment, and so forth. Because the
subjects were exposed to the treatments in one of six different orders, ideally the plot should
be a horizontal line, meaning that no learning effects were present. For Docking Time for
Experiment III, the plot slopes down steeply.
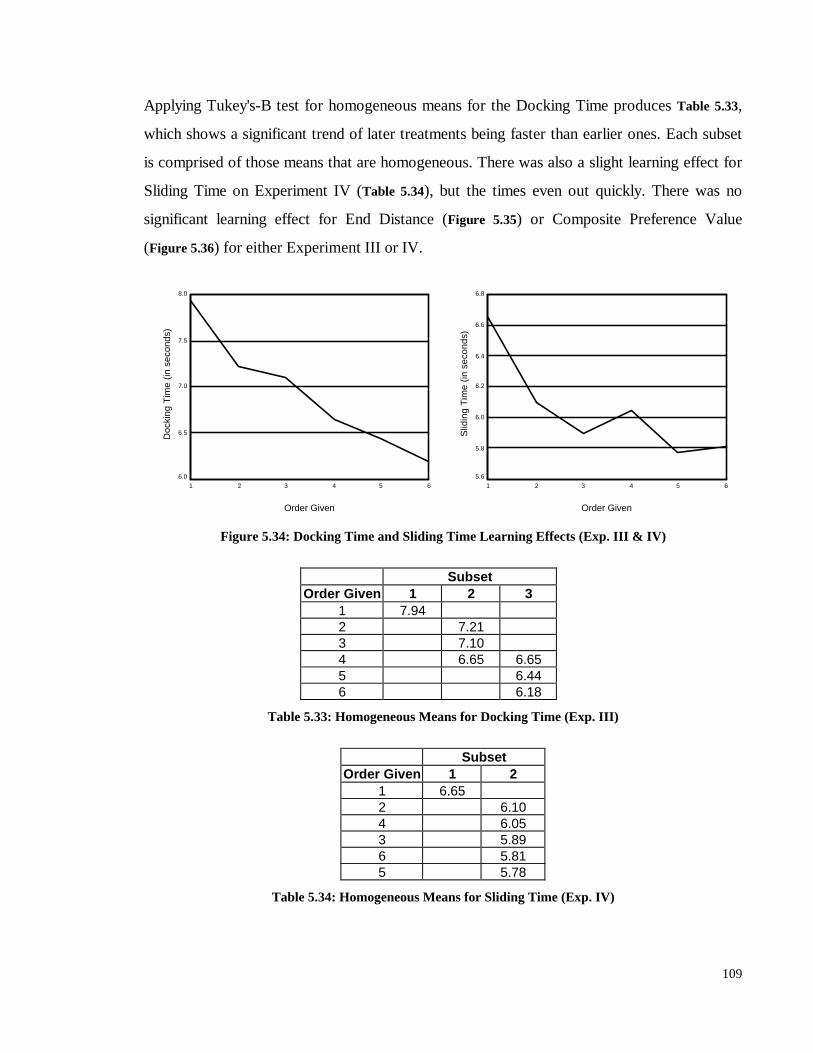
109
Applying Tukey's-B test for homogeneous means for the Docking Time produces Table 5.33,
which shows a significant trend of later treatments being faster than earlier ones. Each subset
is comprised of those means that are homogeneous. There was also a slight learning effect for
Sliding Time on Experiment IV (Table 5.34), but the times even out quickly. There was no
significant learning effect for End Distance (Figure 5.35) or Composite Preference Value
(Figure 5.36) for either Experiment III or IV.
Order Given
654321
Doc
king
Tim
e (in
sec
onds
)
8.0
7.5
7.0
6.5
6.0
Order Given
654321
Slid
ing
Tim
e (in
sec
onds
)
6.8
6.6
6.4
6.2
6.0
5.8
5.6
Figure 5.34: Docking Time and Sliding Time Learning Effects (Exp. III & IV)
SubsetOrder Given 1 2 3
1 7.942 7.213 7.104 6.65 6.655 6.446 6.18
Table 5.33: Homogeneous Means for Docking Time (Exp. III)
SubsetOrder Given 1 2
1 6.652 6.104 6.053 5.896 5.815 5.78
Table 5.34: Homogeneous Means for Sliding Time (Exp. IV)
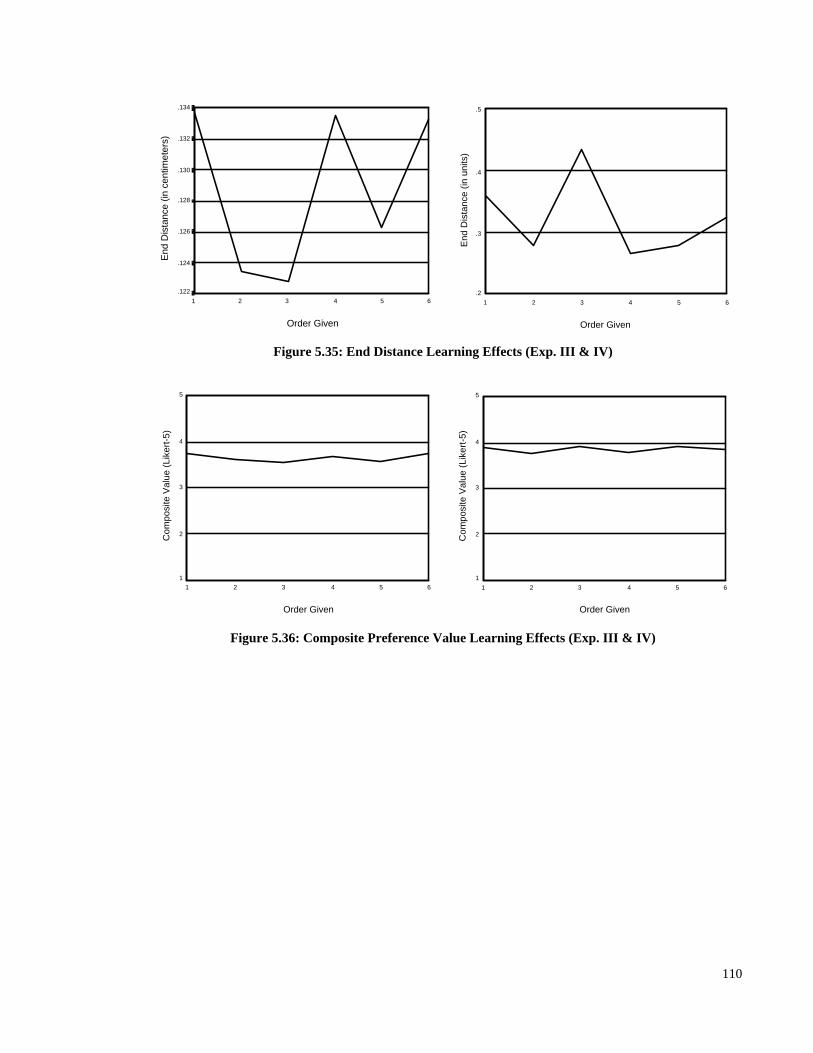
110
Order Given
654321
End
Dis
tanc
e (in
cen
timet
ers)
.134
.132
.130
.128
.126
.124
.122
Order Given
654321
End
Dis
tanc
e (in
uni
ts)
.5
.4
.3
.2
Figure 5.35: End Distance Learning Effects (Exp. III & IV)
Order Given
654321
Com
posi
te V
alue
(Li
kert
-5)
5
4
3
2
1
Order Given
654321
Com
posi
te V
alue
(Li
kert
-5)
5
4
3
2
1
Figure 5.36: Composite Preference Value Learning Effects (Exp. III & IV)
111
6 ConclusionsThis dissertation has addressed the nature of user interaction in virtual environments. In an
attempt to create usable systems, some researchers have devised new, direct manipulation
techniques that mimic real-world actions, while others propose the application of indirect
techniques to the domain of 3D worlds. This produces tension between direct approaches,
that provide the necessary freedom of movement, and indirect techniques, which provide
higher precision. A combination of direct and indirect approaches has been advocated by some
researchers, and this dissertation has created a taxonomic framework for classifying existing
techniques, and for aiding designers in choosing how model parameters should be mapped to
interaction techniques.
Empirical studies have helped to refine this taxonomy by exploring ways of enhancing
accuracy for indirect manipulation. The first two studies compared the use of hand-held versus
world-fixed windows, and measured the effect of adding a physical prop as an interaction
surface for 2D interaction tasks. The results were mixed, with hand-held windows providing
more accuracy on continuous tasks than world-fixed windows, but world-fixed windows
promoting faster performance. On discrete tasks requiring head movement, performance with
hand-held windows was faster than using world-fixed windows. Providing a physical surface
allowed subjects to perform significantly faster on both continuous and discrete tasks, and
more accurately on continuous tasks, than when no physical surface was present. In terms of
preference, users prefer using hand-held windows over world-fixed windows, and prefer
having a physical interaction surface over not having one.
The third and fourth experiments concentrated on improving the performance of hand-held
windows lacking the presence of a physical surface. A new interaction technique, called
clamping, was introduced, and showed that constraining user movement could significantly
increase performance over the cases where no clamping was used. This is significant in light of
the fact that most IVE interfaces that use 2D interaction widgets do not provide a physical
interaction surface. Both time and preference measures on 2D docking tasks significantly
improved when clamping was present, and preference measures were significantly better for
112
1D slider manipulation tasks. These experiments also tested the technique of using 3D
representations of interface widgets versus 2D representations. Users showed no preference
for 3D versus 2D representations, and performance measures were mixed. 3D representations
allowed subjects to perform 2D docking tasks more quickly, but not more accurately, than
when using 2D widget representations, and performance with 2D widget representations was
faster, but less accurate, than with 3D representations on the slider task.
6.1 ContributionsThese empirical studies represent some of the first rigorous studies conducted specifically to
measure user performance and preference on indirect manipulation tasks in immersive virtual
environments. Many studies have been conducted to assess the usability of indirect approaches
for desktop interfaces, but there is a dearth of such studies which consider the issues unique to
immersive virtual environments. General conclusions drawn from this dissertation include:
1. When bringing 2D interface widgets into 3D worlds, placing the interaction surface near
the non-dominant hand of the user can provide the correct balance of accuracy and
freedom of movement necessary for effective interaction.
2. Registering a physical surface with the visual work surface presented to the user in the
virtual environment can significantly improve performance, because the user can easily
maintain the necessary depth for interaction.
3. Imposing constraints on the motion of interaction tools can significantly improve user
performance and preference, even when a physical surface is not present.
4. Providing 3D representations of interface widgets has little effect on improving user
performance on manipulating 2D widgets.
5. A taxonomy can be used to classify interaction techniques for immersive virtual
environments based on the directness of the interaction, the discrete/continuous nature of
the interaction, and the positional degrees of freedom the technique requires.
113
6. A successful user interface for virtual environments will combine both direct and indirect
manipulation techniques, depending on the type of parameter being manipulated.
These conclusions help to define some of the issues that are important to interface design for
virtual environments. They also suggest areas that require further study.
6.2 Future WorkIn conducting this research, many questions were answered, but a great many more questions
arose as a result of exploring the problem space. The following ideas are those that surfaced
as a direct result of the work performed here, and constitute areas that might further
contribute to the field.
6.2.1 Constrained InteractionOnly one constraint was enforced in the studies conducted for this dissertation; that of the
interaction surface. It would be interesting to apply further constraints, such as lateral
constraints to clamp user hand movement to reside within the confines of the work surface. In
addition, it would be interesting to enforce constraints on all objects and interface widgets, so
that a more "realistic" environment is presented, where objects do not simply pass through one
another. This might improve performance even further.
6.2.2 Mismatched FeedbackIt would be interesting to research the effects of a mismatch in the cues delivered through the
visual and haptic channels. Some work has been done in this area, but further study might help
define how the different senses are related.
6.2.3 Additional Interface TasksThis research only compared a few of the many low-level interactions that are present in
typical desktop interfaces. Because menuing is so prevalent on the desktop, the next logical
task to explore is a pull-down menu task. Such a task would involve constructing multi-level,
cascading menus, and comparing user performance with different interface techniques.
114
6.2.4 Compound ApplicationsNow that some interesting data has been collected, it is tempting to incorporate this
knowledge into the construction of an actual application. One idea that comes to mind is the
development of an immersive Web browser. This type of application requires a combination of
both direct and indirect manipulation techniques, and would also be a novel application.
6.2.5 Combined Direct and Indirect TechniquesBecause both direct and indirect techniques are important for effective manipulation IVEs, it
is necessary to study the effect of using these techniques in concert. Indirect techniques
typically require the user to acquire a tool prior to manipulation. To perform direct
techniques, the tool must be stowed, and a cognitive "mode-switch" probably occurs.
Transitioning between direct and indirect techniques would be a fruitful area of further study.
6.2.6 Non-Immersive EnvironmentsOther researchers have attempted to apply passive-haptic feedback to non-immersive
environments, such as the ImmersaDesk, using a Plexiglas paddle. These techniques might
also work in Cave-like environments. Desktop VR systems might also benefit from a two-
handed approach. Some cognitive problems might arise as a result of the representation of the
paddle and hand, and their physical avatars being offset in space. It would be interesting to see
if the results presented here are applicable to these other environments.
6.2.7 Further Data AnalysisFollowing the philosophy to "always collect more data than you think you will actually need,"
more data was collected during the experiments than was analyzed for this dissertation. The
direction of docking movements (horizontal/vertical/diagonal) and slider orientation
(horizontal/vertical) are two related pieces of information that would be interesting to look at.
In addition, gender, previous computer usage, and age comparisons might produce interesting
results. Finally, analysis of the video tape recordings might also reveal some interesting
observations.
115
6.2.8 Further Taxonomic WorkAdditional analysis of the taxonomy presented in this dissertation could also help to refine our
knowledge of interface techniques. A more-controlled study of direct manipulation techniques
would inform the direct manipulation octants of the taxonomy. Combining direct and indirect
techniques in a compound task would also be interesting, and might suggest how time might
be incorporated into the taxonomy.
6.3 SummaryThe nature of human-computer interaction has greatly intrigued researchers over the past few
decades. The advent of immersive environments has challenged us to develop techniques that
allow users to accomplish real work in these environments. Some of the issues are similar to
those we have addressed for desktop systems, but some require us to design new approaches.
It is this combination of trusted and novel approaches that this dissertation has attempted to
organize and inform.
116
7 References
[Acco97] Accot, J., Zhai, S., "Beyond Fitts' Law: Models for Trajectory-Based HCI Tasks,"Proceedings of ACM CHI '97 Conference on Human Factors in Computing Systems, (1997), pp. 295-302.
[Akam94a] Akamatsu, M., Sato, S., MacKenzie, I., "Multimodal Mouse: A Mouse-Type Device withTactile and Force Display," Presence, 3, 1, (1994), pp. 73-80.
[Akam94b] Akamatsu, M., MacKenzie, I., "A Multi-Modal Mouse with Tactile and Force Feedback,"International Journal of Human-Computer Studies, 40, (1994), pp. 443-453.
[Akel93] Akeley, K., "RealityEngine Graphics," Proceedings of the ACM SIGGRAPH '93 Conferenceon Computer Graphics, (1993), pp. 109-116.
[Alia97] Aliaga, D., "Virtual Objects in the Real World," Communications of the ACM, 40, 3, (1997),pp. 49-54.
[Angu95] Angus, I., Sowizral, H., "Embedding the 2D Interaction Metaphor in a Real 3D VirtualEnvironment," Stereoscopic Displays and Virtual Reality Systems II, Fisher, S., Merrit, J., Bolas, M., Eds.Proc. SPIE 2409, (1995), pp.409-416.
[Angu96] Angus, I., Sowizral, H., "VRMosaic: Web Access from within a Virtual Environment," IEEEComputer Graphics and Applications, 16, 3, (1996), pp. 6-10.
[Ayer96] Ayers, M., Zelenik, R., "The Lego Interface Toolkit," Proceedings of UIST '96 ACMSymposium on User Interface Software and Technology, (1996), pp. 97-98.
[Bala97] Balakrishnan, R., MacKenzie, I., "Performance Differences in the Fingers, Wrist, andForearm in Computer Input Control," Proceedings of ACM CHI '97 Conference on Human Factors inComputing Systems, (1997), pp. 303-310.
[Bass97] Bass, L., Kasabach, C., Martin, R., Siewiorek, D., Smailagic, A., Stivoric, J., "The Design ofa Wearable Computer," Proceedings of ACM CHI '97 Conference on Human Factors in ComputingSystems, (1997), pp. 139-146.
[Bier94] Bier, E., Stone, M., Fisjkin, K., Buxton, W., Baudel, T., "A Taxonomy of See-ThroughTools," Proceedings of ACM CHI '94 Conference on Human Factors in Computing Systems, (1994), pp.358-364.
[Bill97a] Billinghurst, M., Baldis, S., Matheson, L., Philips, M., "3D Palette: A Virtual RealityContent Creation Tool," University of Washington, Seattle, HIT Lab Technical Report R-97-23, (1997).
[Bill97b] Billinghurst, M., Baldis, S., Matheson, L., Philips, M., "3D Palette: A Virtual RealityContent Creation Tool," Proceedings of VRST '97, (1997), pp. 155-156.
[Bles90] Bleser, T., Sibert, J., "Toto: A Tool for Selecting Interaction Techniques," Proceedings ofUIST '90 ACM Symposium on User Interface Software and Technology, (1990), pp. 135-142
[Bolt92] Bolt, R., Herranz, E., "Two-Handed Gesture in Multi-Modal Natural Dialog," Proceedingsof UIST '92 ACM Symposium on User Interface Software and Technology, (1992), pp. 7-14.
117
[Bowm97a] Bowman, D., Hodges, L., "An Evaluation of Techniques for Grabbing and ManipulatingRemote Objects in Immersive Virtual Environments," 1997 Symposium on Interactive 3D Graphics,Providence, RI, (1997), pp. 35-38.
[Bowm97b] Bowman, D., "Conceptual Design Space - Beyond Walk-Through to Immersive Design,"Designing Digital Space: An Architects Guide to Virtual Reality, Bertol, D., Wiley & Sons, New York,NY, (1997), pp. 225-236.
[Bowm98a] Bowman, D., Wineman, J., Hodges, L., "Exploratory Design of Animal Habitats within anImmersive Virtual Environment," Georgia Institute of Technology GVU Technical Report GIT-GVU-98-06, (1998).
[Bowm98b] Bowman, D., Hodges, L., "Toolsets for the Development of Highly Interactive andInformation-Rich Virtual Environments," The International Journal of Virtual Reality, (1998).
[Bric93] Bricken, M., Byrne, C., "Summer Students in Virtual Reality: A Pilot Study on EducationalApplications of Virtual Reality Technology," in A. Wexelblat (Ed), Virtual Reality: Applications andExplorations, Boston: Academic Press Professional, (1993), pp. 199-217.
[Broo88] Brooks, F., "Grasping Reality Through Illusion - Interactive Graphics Serving Science,"Proceedings of ACM CHI '88 Conference on Human Factors in Computing Systems, (1988), pp. 1-11.
[Broo90] Brooks, F., Ouh-Young, M., Batter, J., Kilpatrick, P., "Project GROPE - Haptic Displays forScientific Visualization," Proceedings of the ACM SIGGRAPH '90 Conference on Computer Graphics,(1990), pp. 177-185.
[Brys91] Bryson, S. and Levit, C., "The Virtual Windtunnel: An Environment for the Exploration ofThree-Dimensional Unsteady Flows," Proceedings of Visualization ‘91, (1991), pp. 17-24.
[Burd94] Burdea, G., Coiffet, P., Virtual Reality Technology, New York: John Wiley & Sons, (1994).
[Butt92] Butterworth, J., Davidson, A., Hench, S., Olano, T., "3DM: A Three Dimensional ModelerUsing a Head-Mounted Display," Computer Graphics, Proceedings of the 1992 Symposium on Interactive3D Graphics, 25, 2, (1992), pp. 135-138.
[Buxt83] Buxton, W., "Lexical and Pragmatic Considerations of Input Structures," ComputerGraphics, 17, 1, (1983), pp. 31-37.
[Card83] Card, S., Moran, T., Newell, A., The Psychology of Human-Computer Interaction, LawrenceErlbaum Associates: Hillsdale, New Jersey, (1983).
[Card90] Card, S., Mackinlay, J., Robertson, G., "The Design Space of Input Devices," Proceedings ofACM CHI '90 Conference on Human Factors in Computing Systems, (1990), pp. 117-124.
[Chat94] Chatty, S., "Extending a Graphical Toolkit for Two-Handed Interaction," Proceedings ofUIST '94 ACM Symposium on User Interface Software and Technology, (1994), pp. 195-204.
[Conn92] Conner, B., Snibbe, S., Herndon, K., Robbins, D., Zelesnik, R., van Dam, A., "Three-Dimensional Widgets," Computer Graphics, Proceedings of the 1992 Symposium on Interactive 3DGraphics, 25, 2, (1992), pp. 183-188.
118
[Cutl97] Cutler, L., Fröhlich, B., Hanrahan, P., "Two-Handed Direct Manipulation on the ResponsiveWorkbench," 1997 Symposium on Interactive 3D Graphics, Providence, RI, (1997), pp. 107-114.
[Dede95] Dede, C., "The Evolution of Constructivist Learning Environments: Immersion inDistributed, Virtual Worlds," Educational Technology, 35, 9, pp. 46-52.
[Dede96] Dede, C., Salzman, M., Loftin, R., "The Development of a Virtual World for LearningNewtonian Mechanics," in P. Brusilovsky, P. Kommers, & N. Streitz (Eds), Multimedia, Hypermedia, andVirtual Reality, Berlin: Springer, (1996), pp. 87-106.
[Deer96] Deering, M., "The HoloSketch VR Sketching System," Communications of the ACM, 39, 5,(1996), pp. 55-61.
[Edwa97] Edwards, J., Hand, C., "MaPS: Movement and Planning Support for Navigation in anImmersive VRML Browser," Proceedings of VRML '97, (1997), pp. 67-75.
[Elli91] Ellis, S., "Nature and Origins of Virtual Environments: A Bibliographic Essay," ComputingSystems and Engineering, 2, 4, (1991), pp. 321-347.
[Fein93] Feiner, S., MacIntyre, B., Haupt, M., Solomon, E., "Windows on the World: 2D Windowsfor 3D Augmented Reality," Proceedings of UIST '93 ACM Symposium on User Interface Software andTechnology, (1993), pp. 145-155.
[Fels95] Fels, S., Hinton, G., "Glove-TalkII: An Adaptive Gesture-to-Format Interface," Proceedingsof ACM CHI '95 Conference on Human Factors in Computing Systems, (1995), pp. 456-463.
[Fish86] Fisher, S., McGreevy, M., Humphries, J., Robinett, W., "Virtual Environment DisplaySystem," 1986 Workshop on Interactive 3D Graphics, Chapel Hill, NC, (1986), pp. 77-87.
[Fitt54] Fitts, P., "The Information Capacity of the Human Motor System in Controlling theAmplitude of Movement," Journal of Experimental Psychology, 47, 6, (1954), pp. 381-391.
[Fitz95] Fitzmaurice, G., Ishii, H., Buxton, W., "Bricks: Laying the Foundations for Graspable UserInterfaces," Proceedings of ACM CHI '95 Conference on Human Factors in Computing Systems, (1995),pp. 442-449.
[Fitz97] Fitzmaurice, G., Buxton, W., "An Empirical Evaluation of Graspable User Interfaces:Towards Specialized, Space-Multiplexed Input," Proceedings of ACM CHI '97 Conference on HumanFactors in Computing Systems, (1997), pp. 43-50.
[Foua97] Fouad, H., Hahn, J., Ballas, J., "Perceptually Based Scheduling Algorithms for Real-timeSynthesis of Complex Sonic Environments," ICAD'97 International Conference on Auditory Display,(1997), pp. 77-82.
[Froh88] Frohlich, D., "The acquisition of Bimanual Coordination in an Interactive Graphics Task,"Cognition and Action in Skilled Behaviour, Colley, A., and Beech, J., Eds., Elsevier Science PublishersB.V., North-Holland, (1988), pp. 103-126.
[Fuhr98] Fuhrmann, A., Löffelmann, H., Schmalstieg, D., Gervautz, M., "Collaborative Visualizationin Augmented Reality," IEEE Computer Graphics and Applications, 18, 4, (1998), pp. 54-59.
119
[Fuku97] Fukumoto, M., Tonomura, Y., "Body Coupled FingeRing: Wireless Wearable Keyboard,"Proceedings of ACM CHI '97 Conference on Human Factors in Computing Systems, (1997), pp. 147-154.
[Funk93] Funkhouser, T., Séquin, C., "Adaptive Display Algorithm for Interactive Frame RatesDuring Visualization of Complex Virtual Environments," Proceedings of the ACM SIGGRAPH '93Conference on Computer Graphics, (1993), pp. 247-254.
[Gobb93] Gobbetti, E., Balaguer, J.-F., "VB2: An Architecture for Interaction in Synthetic Worlds,"Proceedings of UIST '93 ACM Symposium on User Interface Software and Technology, (1993), pp. 167-178.
[Gobl95] Goble, J., Hinckley, K., Pausch, R., Snell, J., Kassell, N., "Two-Handed Spatial InterfaceTools for Neurosurgical Planning," IEEE Computer, 28, 7, (1995), pp. 20-26.
[Gome95] Gomez, D., Burdea, G., Langrana, N., "Integration of the Rutgers Master II in a VirtualReality Simulation," (1995), pp. 198-202.
[Groe87] Groening, M., "The Simpsons," Fox TV show, (1987).
[Guia87] Guiard, Y., "Asymmetric Division of Labor in Human Skilled Bimanual Action: TheKinematic Chain as a Model," Journal of Motor Behavior, 19, 4, (1987), pp. 486-517.
[Guia88] Guiard, Y., "The Kinematic Chain as a Model for Human Asymmetrical BimanualCooperation," Cognition and Action in Skilled Behavious, Colley, A., and Beech, J., Eds., ElsevierScience Publishers B.V., North-Holland, (1988), pp. 205-228.
[Hahn98a] Hahn, J., Kaufman, R., Winick, A., Park, Y., Lindeman, R., Oh, K.-M., Walsh, R., Al-Ghreimil, N., Carleton, T., Loew, M., Sankar, S., "Training Environment for Inferior Vena Caval FilterPlacement," Proceedings of Medicine Meets Virtual Reality '98, (1998).
[Hahn98b] Hahn, J., Fouad, H., Gritz, L., Lee, J., "Integrating Sounds in Virtual Environments," (inpress).
[Hell95] Heller, R., Martin, C., "A Media Taxonomy," IEEE Multimedia, 2, 4, (1995), pp. 36-45.
[Henr91] Henry, T., Hudson, S., Yeatts, A., Myers, B., Feiner, S., "A Nose Gesture Interface Device:Extending Virtual Realities," Proceedings of UIST '91 ACM Symposium on User Interface Software andTechnology, (1991), pp. 65-68.
[Hern94] Herndon, K., Meyer, T., "3D Widgets for Exploratory Scientific Visualization," Proceedingsof UIST '94 ACM Symposium on User Interface Software and Technology, (1994), pp. 69-70.
[Hinc94a] Hinckley, K., Pausch, R., Goble, J., Kassell, N., "Passive Real-World Interface Props forNeurosurgical Visualization," Proceedings of the ACM CHI '94 Conference on Human Factors inComputing Systems, (1994), pp. 452-458.
[Hinc94b] Hinckley, K., Pausch, R., Goble, J., Kassell, N., "A Survey of Design Issues in SpatialInput," Proceedings of UIST '94 ACM Symposium on User Interface Software and Technology, (1994),pp. 213-222.
[Hinc97a] Hinckley, K., Pausch, R., Proffitt, D., "Attention and Visual Feedback: The Bimanual Frameof Reference," 1997 Symposium on Interactive 3D Graphics, Providence, RI, (1997), pp. 121-126.
120
[Hinc97b] Hinckley, K., Pausch, R., Proffitt, D., Patten, J., Kassell, N., "Cooperative BimanualAction," Proceedings of ACM CHI '97 Conference on Human Factors in Computing Systems, (1997).
[Iwat90] Iwata, H., "Artificial Reality with Force-Fedback: Development of Desktop Virtual Spacewith Compact Master Manipulator," Proceedings of the ACM SIGGRAPH '90 Conference on ComputerGraphics, (1990), pp. 165-170.
[Jaco92] Jacoby, R., Ellis, S., "Using Virtual Menus in a Virtual Environment, "Visual DataInterpretation, Alexander, J., Ed., Proc. SPIE 1668, 39-48.
[Kabb94] Kabbash, P., Buxton, W., Sellen, A., "Two-Handed Input in a Compound Task,"Proceedings of the ACM CHI '94 Conference on Human Factors in Computing Systems, (1994), pp. 417-423.
[Kjel95] Kjelldahl, L., Prime, M., "A Study on How Depth Perception is Affected by DifferentPresentation Methods of 3D Objects on a 2D Display," Computers & Graphics, 19, 2, (1995), pp. 199-202.
[Kurt91] Kurtenback, G., Buxton, W., "Issues in Combining Marking and Direct ManipulationTechniques," Proceedings of UIST '91 ACM Symposium on User Interface Software and Technology,(1991), pp. 137-144.
[Kurt97] Kurtenback, G., Fitzmaurice, G., Baudel, T., Buxton, B., "The Design of a GUI Paradigmbased on Tablets, Two-hands, and Transparency," Proceedings of ACM CHI '97 Conference on HumanFactors in Computing Systems, (1997), pp. 35-42.
[Laub78] Laubach, L., "Range of Joint Motion, "NASA Reference Publication 1024, AnthropometricSource Book, Vol. I: Anthropometry for Designers, (1978), pp. 1-20.
[Lind99a] Lindeman, R., Sibert, J., Hahn, J., "Towards Usable VR: An Empirical Study of UserInterfaces for Immersive Virtual Environments," to appear in Proceedings of the ACM CHI '99Conference on Human Factors in Computing Systems, (1999).
[Lind99b] Lindeman, R., Sibert, J., Hahn, J., "Hand-Held Windows: Towards Effective 2D Interactionin Immersive Virtual Environments," to appear in Proceedings of IEEE Virtual Reality '99, (1999).
[Liu93] Liu, A., Tharp, G., French, L., Lai, S., Stark, L., "Some of What One Needs to Know AboutUsing Head-Mounted Displays to Improve Teleoperator Performance," IEEE Transactions on Roboticsand Automation, 9, 5, (1993), pp. 638-648.
[Mape95a] Mapes, D., Moshell, J., "A Two-Handed Interface for Object Manipulation in VirtualEnvironments," Presence, 4, 4, (1995), pp. 403-416.
[Mape95b] Mapes, D., Mlyniec, P., "3D Object Manipulation Techniques: Immersive vs. Non-Immersive Interfaces," Stereoscopic Displays and Virtual Reality Systems II, Fisher, S., Merrit, J., Bolas,M., Eds. Proc. SPIE 2409, (1995), pp.275-281.
[Milg95] Milgram, P., Drascic, D., Grodski, J., Restogi, A., Zhai, S., Zhou, C., "Merging Real andVirtual Worlds," Proceedings of IMAGINA '95, (1995).
121
[Mine97a] Mine, M., Brooks, F., Séquin, C., "Moving Objects in Space: Exploiting Proprioception inVirtual-Environment Interaction," Proceedings of the ACM SIGGRAPH '97 Conference on ComputerGraphics, (1997), pp. 19-26.
[Mine97b] Mine, M, "ISAAC: A Meta-CAD System for Virtual Environments," Computer-Aided Design, 29, 8,(1997), pp. 547-553.
[Nemi94] Nemire, K., Jacoby, R., Ellis, S., "Simulation Fidelity of a Virtual Environment Display,"Human Factors, 36, 1, pp. 79-93.
[Paus97] Pausch, R., Proffitt, D., Williams, G., "Quantifying Immersion in Virtual Reality,"Proceedings of the ACM SIGGRAPH '97 Conference on Computer Graphics, (1997), pp. 13-18.
[Pier97] Pierce, J., Forsberg, A., Conway, M., Hong, S., Zelesnik, R., Mine, M., "Image PlaneInteraction Techniques in 3D Immersive Environments," Proceedings of the 1997 Symposium onInteractive 3D Graphics, (1997).
[Pope93] Pope, S., Fahlén, L., "The Use of 3-D Audio in a Synthetic Environment: An Aural Rendererfor a Distributed Virtual Reality System," Proceedings of IEEE VRAIS '93 Virtual Reality AnnualInternational Symposium, (1993), pp. 176-182.
[Post96] Poston, T., Serra, L., "Dextrous Virtual Work," Communications of the ACM, 39, 5, (1996),pp. 37-45.
[Poup96] Poupyrev, I., Billinghurst, M., Weghorst, S., Ichikawa, T., "The Go-Go InteractionTechnique: Non-linear Mapping for Direct Manipulation in VR," Proceedings of UIST '96 ACMSymposium on User Interface Software and Technology, (1996), pp. 79-80.
[Poup97] Poupyrev, I., Weghorst, S., Billinghurst, M., Ichikawa, T., "A Framework and Testbed forStudying Manipulation Techniques for Immersive VR," Proceedings of VRST '97, (1997), pp. 21-28.
[Robi92] Robinett, W., "Synthetic Experience: A Proposed Taxonomy," Presence, 1, 2, (1992), pp.229-247.
[Rodd66] Roddenbury, G., "Star Trek," Paramount TV Series, (1966).
[Sach91] Sachs, E., Roberts, A., Stoops, D., "3-Draw: A Tool for Designing 3D Shapes," IEEEComputer Graphics and Applications, Nov., (1991), pp. 18-26.
[Sens93] SensAble Technologies, The PHANToM Force Feedback Device, SensAble Technologies,Inc., 215 First Street, Cambridge, MA, 02142.
[Shal98] Shalev, A., "A Passive-Haptic Feedback, Force Measuring Glove System for Virtual RealityInterfaces," Unpublished Masters Thesis, The George Washington University, (1998).
[Shne98] Shneiderman, B., Designing the User Interface, (Third Edition), Addison-Wesley: Reading,Massachusetts, (1998).
[Sowi94] Sowizral, H., "Interacting with Virtual Environments Using Augmented Virtual Tools,"Stereoscopic Displays and Virtual Reality Systems, Fisher, S., Merrit, J., Bolas, M., Eds. Proc. SPIE2177, (1994), pp.409-416.
122
[Stan95] Stanney, K., "Realizing the Full Potential of Virtual Reality: Human Factors Issues thatCould Stand in the Way," Proceedings of IEEE VRAIS '95 Virtual Reality Annual InternationalSymposium, (1995), pp. 28-34.
[Stoa95] Stoakley, R., Conway, M., Pausch, R., "Virtual Reality on a WIM: Interactive Worlds inMiniature," Proceedings of the ACM CHI '95 Conference on Human Factors in Computing Systems,(1995), pp. 265-272.
[Stur89] Sturman, D., Zeltzer, D., Pieper, S., "Hands-on Interaction With Virtual Environments,"Proceedings of UIST '89 ACM Symposium on User Interface Software and Technology, (1989), pp. 19-24.
[Szal97] Szalavári, Z., Gervautz, M., "The Personal Interaction Panel - A Two-Handed Interface forAugmented Reality," Proceedings of Eurographics '97, (1997), pp. C335-C346.
[Tell91] Teller, S., Séquin, C., "Visibility Preprocessing for Interactive Walkthroughs," Proceedingsof the ACM SIGGRAPH '91 Conference on Computer Graphics, (1991), pp. 61-69.
[Thom97] Thompson, T., Johnson, D., Cohen, E., "Direct Haptic Rendering of Sculpted Models," 1997Symposium on Interactive 3D Graphics, Providence, RI, (1997), pp. 167-176.
[Trau94] Traub, D., "The Promise of Virtual Reality for Learning," in C. E. Loeffler. T. Anderson(Eds), The Virtual Reality Casebook, New York: Van Nostrand Reinhold, (1994), pp. 107-117.
[vanT97] van Teylingen, R., Ribarsky, W., and van der Mast, C., "Virtual Data Visualizer," IEEETransactions on Visualization and Computer Graphics, 3, 1, (1997), pp. 65-74.
[Wenz92] Wenzel, E., "Localization in Virtual Acoustic Displays," Presence, 1, 1, (1992), pp. 80-107.
[Wlok95] Wloka, M., Greenfield, E., "The Virtual Tricorder: A Uniform Interface for Virtual Reality,"Proceedings of UIST '95 ACM Symposium on User Interface Software and Technology, (1995), pp. 39-40.
[Yama93] Yamashita, J., Fukui, Y., "A Direct Deformation Method," Proceedings of IEEE VRAIS '93Virtual Reality Annual International Symposium, (1993), pp. 499-504.
[Yama94] Yamashita, J., Yokoi, H., Fukui, Y., Shimojo, M., "A Virtual Surface Modeler for Direct andRegional Free Form Manipulation," Proceedings of ICAT '94 The 4th International Conference onArtificial Reality and Tele-Existence, (1994), pp. 35-42.
[Zele97] Zeleznik, R., Forsberg, A., Strauss, P., "Two Pointer Input for 3D Interaction," 1997Symposium on Interactive 3D Graphics, Providence, RI, (1997), pp. 115-120.
[Zelt92] Zeltzer, D., "Autonomy, Interaction, and Presence," Presence, 1, 1, (1992), pp. 127-132.
[Zhai93a] Zhai, S., Milgram, P., "Human Performance Evaluation of Manipulation Schemes in VirtualEnvironments," Proceedings of IEEE VRAIS '93 Virtual Reality Annual International Symposium, (1993),pp. 155-161.
[Zhai93b] Zhai, S., "Investigation of Feel for 6DOF Inputs: Isometric and Elastic Rate Control forManipulation in 3D Environments," Proceedings of the Human Factors and Ergonomics Society 37thAnnual Meeting, (1993).

123
[Zhai94] Zhai, S., Milgram, P., "Input Techniques for HCI in 3D Environments," Proceedings of theACM CHI '94 Conference on Human Factors in Computing Systems, (1994).
[Zhai96] Zhai, S., Milgram, P., Buxton, W., "The Influence of Muscle Groups on Performance ofMultiple Degree-of-Freedom Input," Proceedings of the ACM CHI '96 Conference on Human Factors inComputing Systems, (1996), pp. 308-315.
124
8 Appendices
Appendix A: Informed Consent Form (Experiments I & II)
Informed Consent for Human Subjects
The purpose of this form is to educate you about the procedures that you will besubject to during this experiment, and to gain consent from you to take part inthis study. Please read the following carefully, and ask any questions you mayhave.
EXPERIMENT: You will be asked to perform some simple shape-matching andshape-identification tasks on a computer using your hands.
DURATION OF PARTICIPATION: The total experiment time will not exceed 60 minutes.
POTENTIAL RISKS: During the experiment, you will be wearing a Head-MountedDisplay (HMD) device on your head for viewing computer generated images. Thesedevices have been known to cause nausea in some people. If you begin to feelnauseous during the experiment, you may discontinue the experiment at any time.
Furthermore, it is not yet known to what extent prolonged exposure to thesedevices may impair your senses. To the best of our knowledge, researchers havenot reported any effects lasting longer than a few minutes. The experiment willtake a maximum of 60 minutes, which should not cause any ill effects.
BENEFITS: The results of this experiment will help to evaluate new computer humaninteraction techniques.
CONFIDENTIALITY: The data collected from your participation shall be keptconfidential, and will not be released to anyone except to the researchersdirectly involved in this project. Your data will be assigned a "Subject Number."When reporting on the data collected from this experiment, only this subjectnumber will be used when referring directly to your data.
CONTACT INFORMATION: The principal investigator may be reached at: Robert W. Lindeman Dept. of EE & CS, School of Engineering and Computer Science The George Washington University 801 22nd Street NW Washington, DC 20052 202-994-5373 [email protected]
VOLUNTARY PARTICIPATION: Participation in this experiment is voluntary. You arefree to withdraw your consent and discontinue your participation in theexperiment at any time, without prejudice to you.
You will be given a copy of this form for your records. If you have any questionsor concerns about this experiment, or its implementation, we will be happy todiscuss them with you.
As a voluntary participant, I have read the above information. Anything I did notunderstand was explained to my satisfaction. I agree to participate in thisresearch.___________________________ ___________________________Name of Subject Name of Investigator___________________________ ___________________________Signature of Subject Signature of Investigator___________________________ ___________________________Date of Signature Date of Signature
125
Appendix B: General Information (Experiments I & II)
General Information
0. Subject Number:_______
1. Name:
2. Age:
3. Sex: Female Male
4. Year in School: Undergrad. Graduate Finished
5. Which hand do you use to write with? Left Right
6. How many hours per week do you use a computer?
less than 1 1-5 5-10 10-30 more than 30
7. Does the computer you use most have a mouse? yes no
8. Have you ever experienced Virtual Reality before? yes no
9. Do you ever get motion sick? yes no
10. Are you color-blind? yes no
126
Appendix C: General Instructions (Experiments I & II)
General Instructions(Before putting on the VR equipment)
I have created an environment for testing new computer interaction techniques. Anumber of tasks have been developed to compare different aspects of thisenvironment. These instructions are designed to help familiarize you with theenvironment.
There are two main objects that you will see in the environment. The first one isyour dominant hand. If you are right-handed, you will see your right hand. If youare left-handed, you will see your left-hand. The image of your dominant handwill be in a pointing gesture to allow you to make selections by touching theobjects you wish to select. The position and orientation of your hand will bemonitored during the experiment, so you will see any movements you make with yourreal hand.
The second object you will see is a panel. This panel will provide you with asurface to interact with the environment. You will be asked to perform tasks byselecting and manipulating shapes which appear on the surface of the panel.
The helmet also monitors the position and orientation of your head. You are freeto move your head during the experiment.
It might become necessary for you to move your head, hands, or both in order tosee some of the objects in the environment.
Some people suffer from a form of motion sickness while using these helmets. Ifyou feel sick anytime during the experiment, close your eyes and let me know, andI'll stop the experiment.
(Put on the HMD)
The helmet that you are wearing contains two computer displays; one for each eye.The helmet can be adjusted to fit most people. It is important that the displaysare positioned directly in front of your eyes. If this is not the case, ask me tohelp you adjust it.
You can see representations of the ground, which is yellow in color, and the sky,which is a blue sky with clouds.
In addition, if you turn your head to the left, you should see a blue cube. Ifyou turn your head to the right, you should see a green cone.
Move your right (left) hand in front of your face. You should see your virtualhand in a pointing gesture. Notice how the movements of your virtual hand mimicthe movements of your real hand. Look for the panel. It will either be in frontof you, or it will be in your left (right) hand.
In addition to providing your eyes with something to look at, the helmet also hasstereo headphones for your ears. These should also be placed over your ears.
You will be given some practice trials before each experiment.
If you don't have any questions, we will proceed with the first experiment.
127
Appendix D: Docking Task Instructions (Experiments I & II)
Instructions for the Docking Task
(After starting the task)
When the experiment starts, you will be shown a colored shape in a randomlocation on the surface of the panel, and an outline of the same shape ina different location on the surface of the panel. This outline is calledthe "home" of the shape.
Your job is to move the shape to its home. In order to move the shape,touch it with your finger, and slide it along the surface of the paneluntil it is aligned with its home.
Once you think the shape is home, lift your finger from the shape. If youthink the shape is close enough to its home, then select the "Continue"button with your finger, and move on to the next trial. If you think theshape is still too far from its home, you can move it again in the samemanner.
You will be given 5 practice trials before the experiment starts. Thiswill allow you to become familiar with the testing environment.
When you have completed the 5 practice trials, you will be given 20 moretrials which will be scored. Your score will depend on both time andaccuracy. Shorter times are better than longer times, and the closer theshape is to its home the better your score will be.
(Omit this, unless this is the first task being administered.)
There are a number of things that will help you while you are performingthe experiment.1) As soon as your finger touches a shape, the color of the shape will change. If you release the shape, the color will return to normal. You can use this to determine when your finger is touching a shape.2) You will hear a "click" whenever your finger touches a shape or the "Continue" button, and another "click" when you release. You can also use this to determine when your finger is touching a shape.3) You will see a red cursor on the surface of the panel, which follows the movement of your finger. You can use this to determine where your finger is in relation to the panel.4) The tip of your index finger will be yellow in color. In some cases, your finger tip will go through the surface of the panel. You can judge how far your finger has penetrated the panel surface by how much yellow has disappeared.
If you don't have any questions, we will proceed with the experiment.
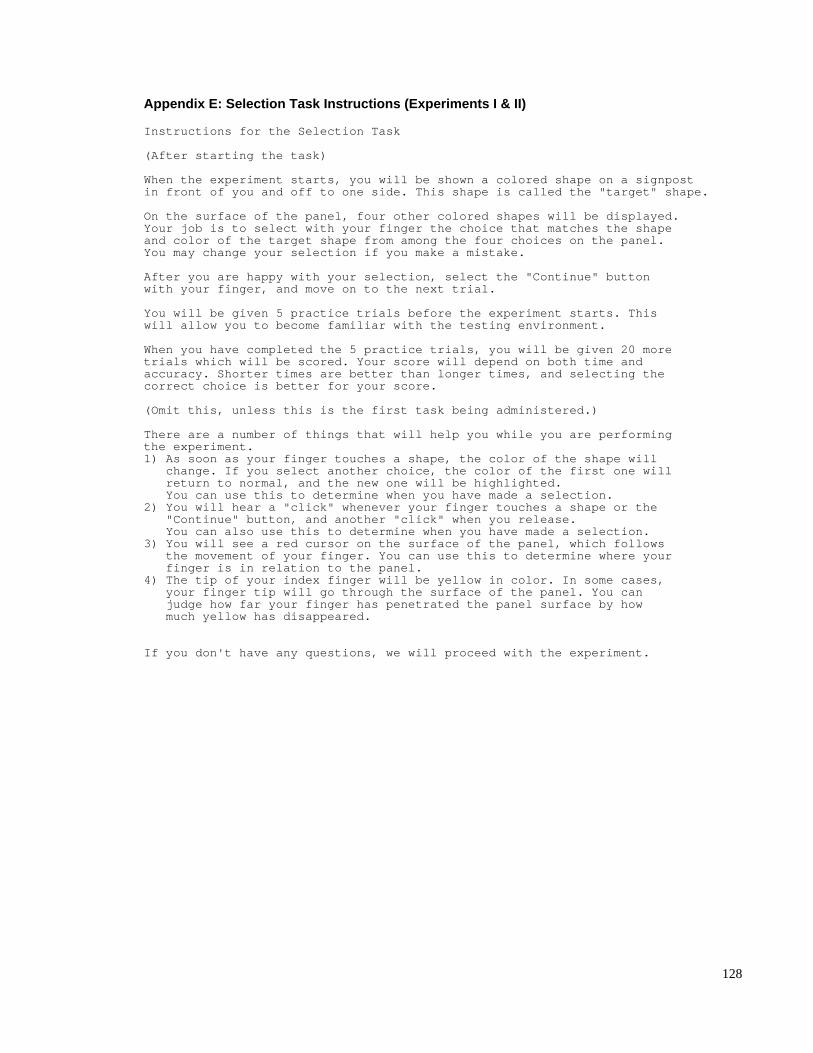
128
Appendix E: Selection Task Instructions (Experiments I & II)
Instructions for the Selection Task
(After starting the task)
When the experiment starts, you will be shown a colored shape on a signpostin front of you and off to one side. This shape is called the "target" shape.
On the surface of the panel, four other colored shapes will be displayed.Your job is to select with your finger the choice that matches the shapeand color of the target shape from among the four choices on the panel.You may change your selection if you make a mistake.
After you are happy with your selection, select the "Continue" buttonwith your finger, and move on to the next trial.
You will be given 5 practice trials before the experiment starts. Thiswill allow you to become familiar with the testing environment.
When you have completed the 5 practice trials, you will be given 20 moretrials which will be scored. Your score will depend on both time andaccuracy. Shorter times are better than longer times, and selecting thecorrect choice is better for your score.
(Omit this, unless this is the first task being administered.)
There are a number of things that will help you while you are performingthe experiment.1) As soon as your finger touches a shape, the color of the shape will change. If you select another choice, the color of the first one will return to normal, and the new one will be highlighted. You can use this to determine when you have made a selection.2) You will hear a "click" whenever your finger touches a shape or the "Continue" button, and another "click" when you release. You can also use this to determine when you have made a selection.3) You will see a red cursor on the surface of the panel, which follows the movement of your finger. You can use this to determine where your finger is in relation to the panel.4) The tip of your index finger will be yellow in color. In some cases, your finger tip will go through the surface of the panel. You can judge how far your finger has penetrated the panel surface by how much yellow has disappeared.
If you don't have any questions, we will proceed with the experiment.
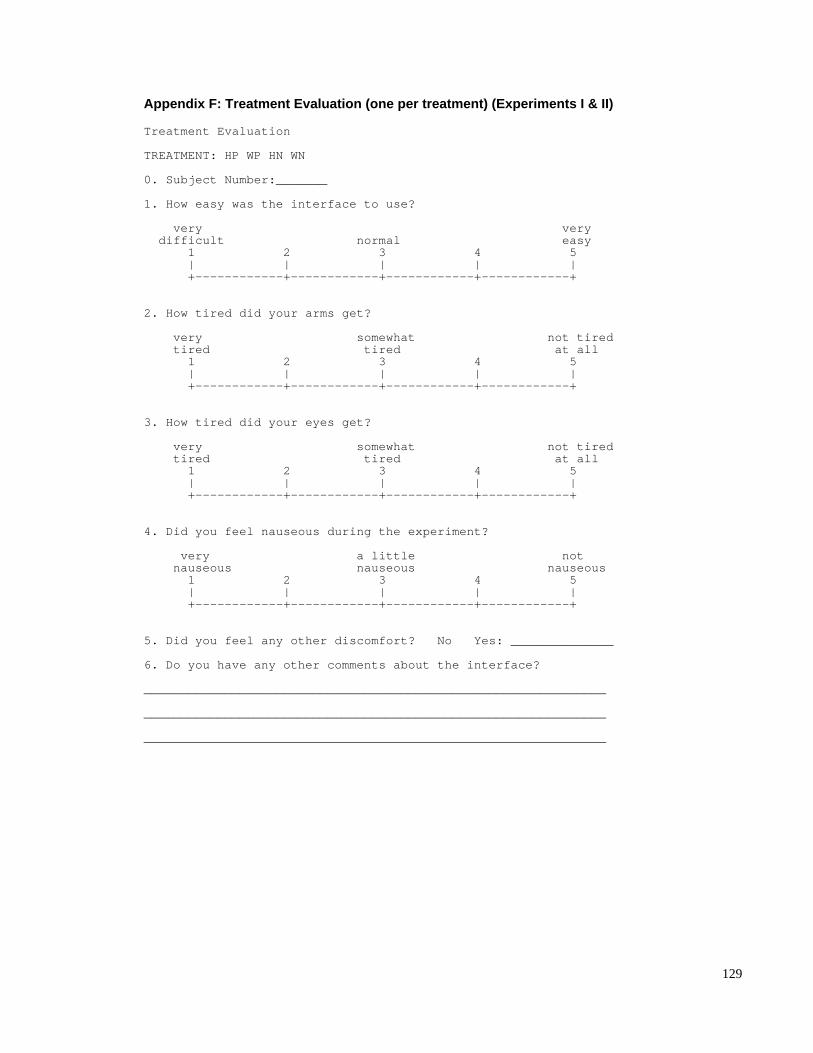
129
Appendix F: Treatment Evaluation (one per treatment) (Experiments I & II)
Treatment Evaluation
TREATMENT: HP WP HN WN
0. Subject Number:_______
1. How easy was the interface to use?
very very difficult normal easy 1 2 3 4 5 | | | | | +------------+------------+------------+------------+
2. How tired did your arms get?
very somewhat not tired tired tired at all 1 2 3 4 5 | | | | | +------------+------------+------------+------------+
3. How tired did your eyes get?
very somewhat not tired tired tired at all 1 2 3 4 5 | | | | | +------------+------------+------------+------------+
4. Did you feel nauseous during the experiment?
very a little not nauseous nauseous nauseous 1 2 3 4 5 | | | | | +------------+------------+------------+------------+
5. Did you feel any other discomfort? No Yes: ______________
6. Do you have any other comments about the interface?
_______________________________________________________________
_______________________________________________________________
_______________________________________________________________
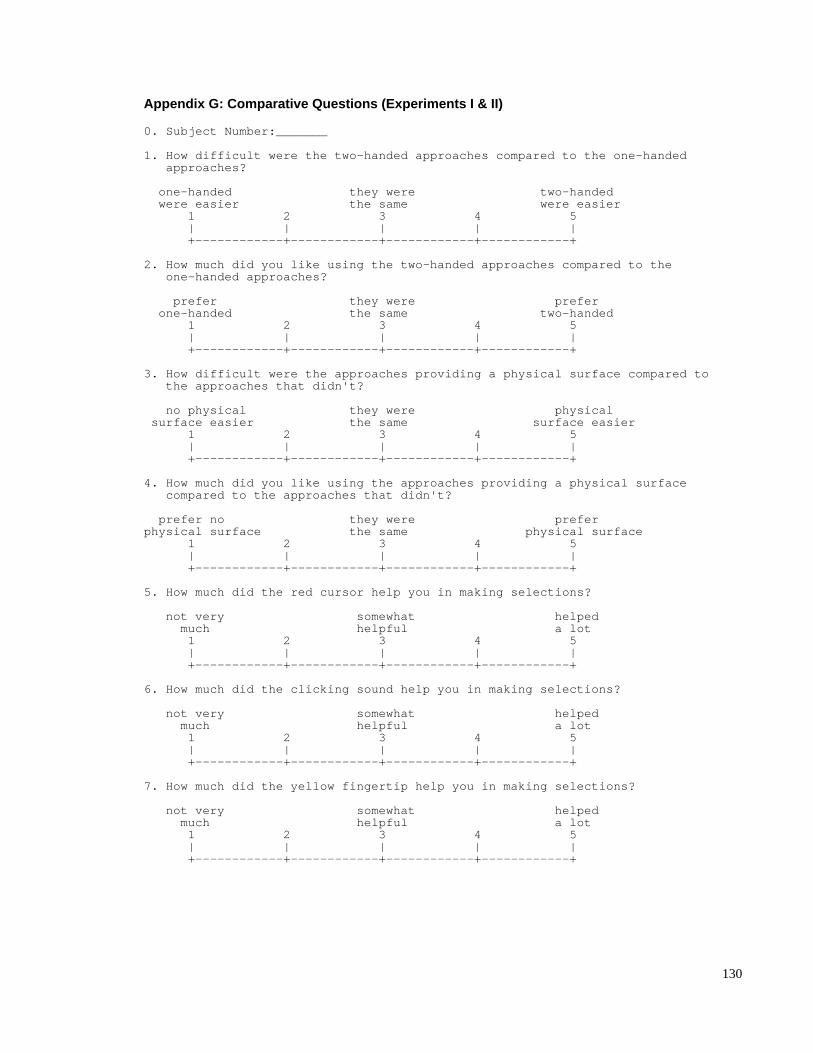
130
Appendix G: Comparative Questions (Experiments I & II)
0. Subject Number:_______
1. How difficult were the two-handed approaches compared to the one-handed approaches?
one-handed they were two-handed were easier the same were easier 1 2 3 4 5 | | | | | +------------+------------+------------+------------+
2. How much did you like using the two-handed approaches compared to the one-handed approaches?
prefer they were prefer one-handed the same two-handed 1 2 3 4 5 | | | | | +------------+------------+------------+------------+
3. How difficult were the approaches providing a physical surface compared to the approaches that didn't?
no physical they were physical surface easier the same surface easier 1 2 3 4 5 | | | | | +------------+------------+------------+------------+
4. How much did you like using the approaches providing a physical surface compared to the approaches that didn't?
prefer no they were preferphysical surface the same physical surface 1 2 3 4 5 | | | | | +------------+------------+------------+------------+
5. How much did the red cursor help you in making selections?
not very somewhat helped much helpful a lot 1 2 3 4 5 | | | | | +------------+------------+------------+------------+
6. How much did the clicking sound help you in making selections?
not very somewhat helped much helpful a lot 1 2 3 4 5 | | | | | +------------+------------+------------+------------+
7. How much did the yellow fingertip help you in making selections?
not very somewhat helped much helpful a lot 1 2 3 4 5 | | | | | +------------+------------+------------+------------+
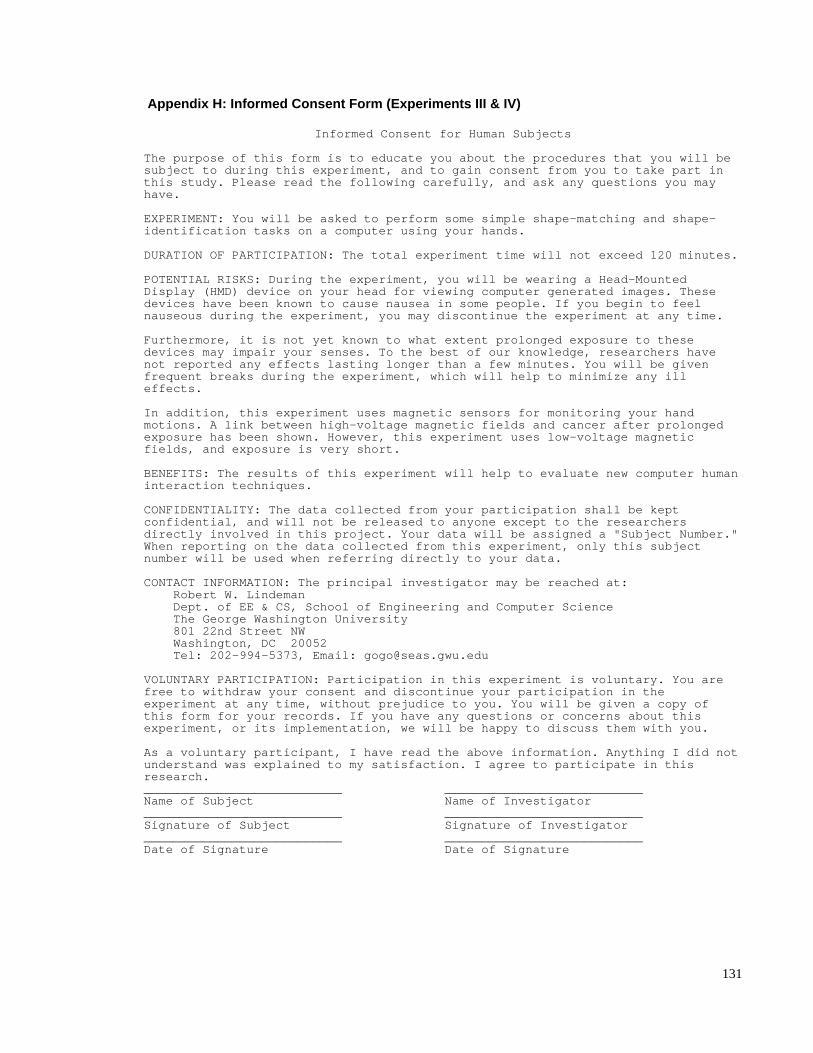
131
Appendix H: Informed Consent Form (Experiments III & IV)
Informed Consent for Human Subjects
The purpose of this form is to educate you about the procedures that you will besubject to during this experiment, and to gain consent from you to take part inthis study. Please read the following carefully, and ask any questions you mayhave.
EXPERIMENT: You will be asked to perform some simple shape-matching and shape-identification tasks on a computer using your hands.
DURATION OF PARTICIPATION: The total experiment time will not exceed 120 minutes.
POTENTIAL RISKS: During the experiment, you will be wearing a Head-MountedDisplay (HMD) device on your head for viewing computer generated images. Thesedevices have been known to cause nausea in some people. If you begin to feelnauseous during the experiment, you may discontinue the experiment at any time.
Furthermore, it is not yet known to what extent prolonged exposure to thesedevices may impair your senses. To the best of our knowledge, researchers havenot reported any effects lasting longer than a few minutes. You will be givenfrequent breaks during the experiment, which will help to minimize any illeffects.
In addition, this experiment uses magnetic sensors for monitoring your handmotions. A link between high-voltage magnetic fields and cancer after prolongedexposure has been shown. However, this experiment uses low-voltage magneticfields, and exposure is very short.
BENEFITS: The results of this experiment will help to evaluate new computer humaninteraction techniques.
CONFIDENTIALITY: The data collected from your participation shall be keptconfidential, and will not be released to anyone except to the researchersdirectly involved in this project. Your data will be assigned a "Subject Number."When reporting on the data collected from this experiment, only this subjectnumber will be used when referring directly to your data.
CONTACT INFORMATION: The principal investigator may be reached at: Robert W. Lindeman Dept. of EE & CS, School of Engineering and Computer Science The George Washington University 801 22nd Street NW Washington, DC 20052 Tel: 202-994-5373, Email: [email protected]
VOLUNTARY PARTICIPATION: Participation in this experiment is voluntary. You arefree to withdraw your consent and discontinue your participation in theexperiment at any time, without prejudice to you. You will be given a copy ofthis form for your records. If you have any questions or concerns about thisexperiment, or its implementation, we will be happy to discuss them with you.
As a voluntary participant, I have read the above information. Anything I did notunderstand was explained to my satisfaction. I agree to participate in thisresearch.___________________________ ___________________________Name of Subject Name of Investigator___________________________ ___________________________Signature of Subject Signature of Investigator___________________________ ___________________________Date of Signature Date of Signature
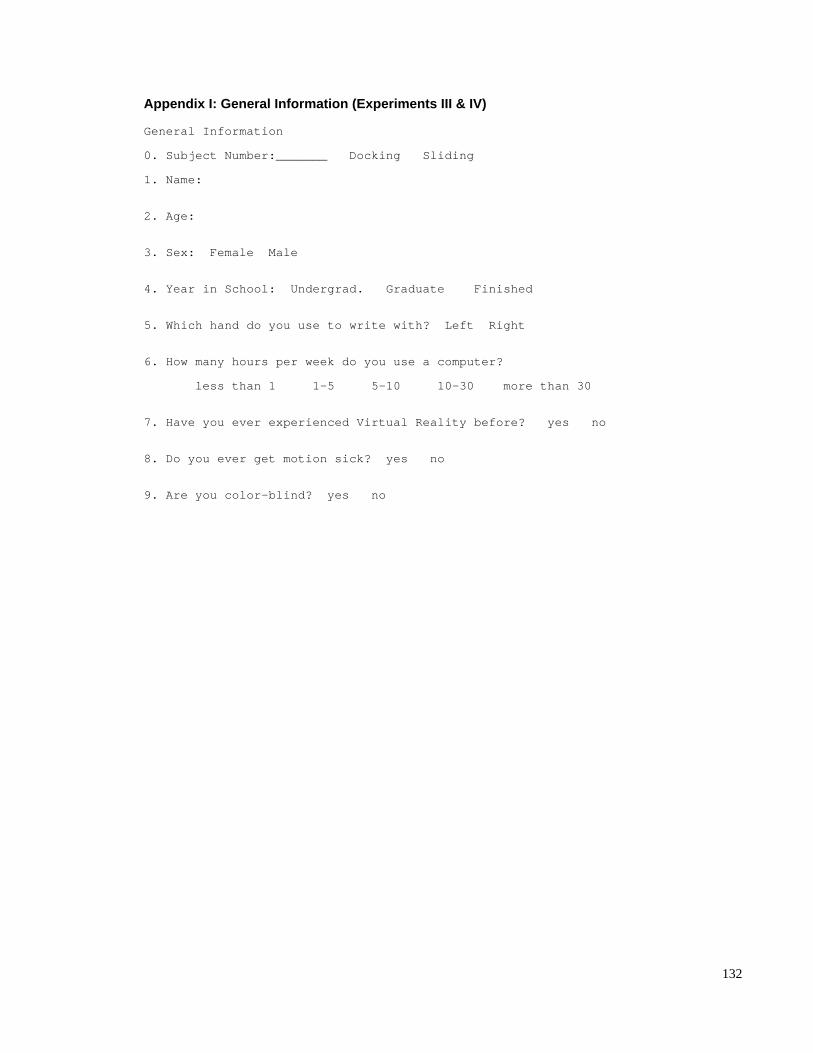
132
Appendix I: General Information (Experiments III & IV)
General Information
0. Subject Number:_______ Docking Sliding
1. Name:
2. Age:
3. Sex: Female Male
4. Year in School: Undergrad. Graduate Finished
5. Which hand do you use to write with? Left Right
6. How many hours per week do you use a computer?
less than 1 1-5 5-10 10-30 more than 30
7. Have you ever experienced Virtual Reality before? yes no
8. Do you ever get motion sick? yes no
9. Are you color-blind? yes no
133
Appendix J: General Instructions (Experiments III & IV)
General Instructions(Before putting on the VR equipment)
I have created an environment for testing new computer interaction techniques. Anumber of tasks have been developed to compare different aspects of thisenvironment. These instructions are designed to help familiarize you with theenvironment.
There are two main objects that you will see in the environment. The first one isyour dominant hand. If you are right-handed, you will see your right hand. If youare left-handed, you will see your left-hand. The image of your dominant handwill be in a pointing gesture to allow you to make selections by touching theobjects you wish to select. The position and orientation of your hand will bemonitored during the experiment, so you will see any movements you make with yourreal hand.
The second object you will see is a paddle. This paddle will provide you with asurface to interact with the environment. You will be asked to perform tasks byselecting and manipulating shapes which appear on the surface of the paddle.
The helmet also monitors the position and orientation of your head. You are freeto move your head during the experiment. It might become necessary for you tomove your head, hands, or both in order to see some of the objects in theenvironment.
Some people suffer from a form of motion sickness while using these helmets. Ifyou feel sick anytime during the experiment, close your eyes and let me know, andI'll stop the experiment.
(Put on the HMD)
The helmet that you are wearing contains two computer displays; one for each eye.The helmet can be adjusted to fit most people. It is important that the displaysare positioned directly in front of your eyes. If this is not the case, ask me tohelp you adjust it.
You can see representations of the ground, which is yellow in color, and the sky,which is a blue sky with clouds.
In addition, if you turn your head to the left, you should see a blue cube. Ifyou turn your head to the right, you should see a green cone.
Move your right (left) hand in front of your face. You should see your virtualhand in a pointing gesture. Notice how the movements of your virtual hand mimicthe movements of your real hand.
Look for the paddle, which will be in your other hand. Like the pointing finger,movements of the paddle produce similar movements of its virtual representation.
In addition to providing your eyes with something to look at, the helmet also hasstereo headphones for your ears. These should also be placed over your ears.
You will be given some practice trials before each experiment.
If you don't have any questions, we will proceed with the first experiment.
134
Appendix K: Docking Task Instructions (Experiments III & IV)
Instructions for the Docking Task
(After starting the task)
When the experiment starts, you will be shown a colored shape in a randomlocation on the surface of the paddle, and an outline of the same shape in adifferent location on the surface of the paddle. This outline is called the"home" of the shape.
Your job is to move the shape to its home. In order to move the shape, touch itwith your finger, and slide it along the surface of the paddle until it isaligned with its home.
Once you think the shape is home, lift your finger from the shape. If you thinkthe shape is close enough to its home, then select the "Continue" button withyour finger, and move on to the next trial. If you think the shape is still toofar from its home, you can move it again in the samemanner.
You will be given practice trials before the experiment starts. This will allowyou to become familiar with the testing environment. You may practice as much asyou like.
When you have had enough practice, you will be given 20 more trials which will bescored. Your score will depend on both time and accuracy. Shorter times arebetter than longer times, and the closer the shape is to its home the better yourscore will be.
(For the clamping treatments) This interface uses a technique known as "clamping." This technique simulates the presence of a physical surface by keeping the virtual finger tip on the surface of the paddle when your real finger passes through the point where a physical paddle surface would be. Once your hand gets to a certain depth through the paddle surface, the virtual and physical hands will "snap" into the same position.
The color of the finger tip will get darker the deeper your finger goes into the surface. This will allow you to better judge how deep your physical finger tip is from the paddle surface.
(Omit this, unless this is the first task being administered.)
There are a number of things that will help you while you are performing theexperiment.1) As soon as your finger touches a shape, the color of the shape will change. If you release the shape, the color will return to normal. You can use this to determine when your finger is touching a shape.2) You will hear a "click" whenever your finger touches a shape or the "Continue" button, and another "click" when you release. You can also use this to determine when your finger is touching a shape.3) You will see a red cursor on the surface of the paddle, which follows the movement of your finger. You can use this to determine where your finger is in relation to the paddle.4) The tip of your index finger will be yellow in color. In some cases, your finger tip will go through the surface of the paddle. You can judge how far your finger has penetrated the paddle surface by how much yellow has disappeared.
If you don't have any questions, we will proceed with the experiment.
135
Appendix L: Sliding Task Instructions (Experiments III & IV)
Instructions for the Sliding Task
(After starting the task)
When the experiment starts, you will be shown a number on a signpost in front ofyou. This number is called the "target" number.
On the surface of the paddle, a slider-bar and another number will be displayed.The number on the paddle is controlled by the position of the slider. Your job isto adjust the position of the slider with your finger so that the number on thepaddle matches the target number on the signpost.
In order to move the slider, touch it with your finger, and slide it along theslider-bar. Once the numbers match, lift your finger from the slider. You mayadjust the slider position as many times as you like. Once the numbers match,select the "Continue" button with your finger, and move on to the next trial.
Some of the slider-bars will be horizontal, and some will be vertical. You willbe given practice trials before the experiment starts. This will allow you tobecome familiar with the testing environment. You may practice as much as youlike.
When you have had enough practice, you will be given 20 more trials which will bescored. Your score will depend on both time and accuracy. Shorter times arebetter than longer times, and the closer the numbers are to each other the betteryour score will be.
(For the clamping treatments) This interface uses a technique known as "clamping." This technique simulates the presence of a physical surface by keeping the virtual finger tip on the surface of the paddle when your real finger passes through the point where a physical paddle surface would be. Once your hand gets to a certain depth through the paddle surface, the virtual and physical hands will "snap" into the same position.
The color of the finger tip will get darker the deeper your finger goes into the surface. This will allow you to better judge how deep your physical finger tip is from the paddle surface.
(Omit this, unless this is the first task being administered.)
There are a number of things that will help you while you are performing theexperiment.1) As soon as your finger touches a shape, the color of the shape will change. If you release the shape, the color will return to normal. You can use this to determine when your finger is touching a shape.2) You will hear a "click" whenever your finger touches a shape or the "Continue" button, and another "click" when you release. You can also use this to determine when your finger is touching a shape.3) You will see a red cursor on the surface of the paddle, which follows the movement of your finger. You can use this to determine where your finger is in relation to the paddle.4) The tip of your index finger will be yellow in color. In some cases, your finger tip will go through the surface of the paddle. You can judge how far your finger has penetrated the paddle surface by how much yellow has disappeared.
If you don't have any questions, we will proceed with the experiment.
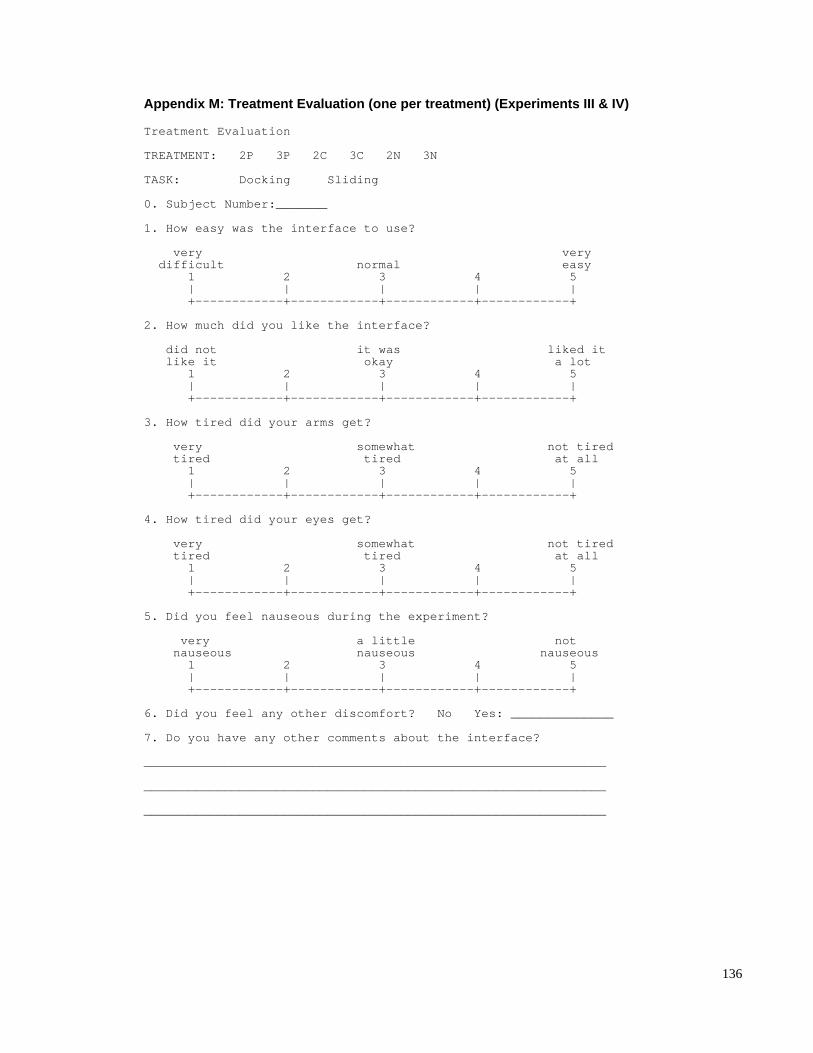
136
Appendix M: Treatment Evaluation (one per treatment) (Experiments III & IV)
Treatment Evaluation
TREATMENT: 2P 3P 2C 3C 2N 3N
TASK: Docking Sliding
0. Subject Number:_______
1. How easy was the interface to use?
very very difficult normal easy 1 2 3 4 5 | | | | | +------------+------------+------------+------------+
2. How much did you like the interface?
did not it was liked it like it okay a lot 1 2 3 4 5 | | | | | +------------+------------+------------+------------+
3. How tired did your arms get?
very somewhat not tired tired tired at all 1 2 3 4 5 | | | | | +------------+------------+------------+------------+
4. How tired did your eyes get?
very somewhat not tired tired tired at all 1 2 3 4 5 | | | | | +------------+------------+------------+------------+
5. Did you feel nauseous during the experiment?
very a little not nauseous nauseous nauseous 1 2 3 4 5 | | | | | +------------+------------+------------+------------+
6. Did you feel any other discomfort? No Yes: ______________
7. Do you have any other comments about the interface?
_______________________________________________________________
_______________________________________________________________
_______________________________________________________________
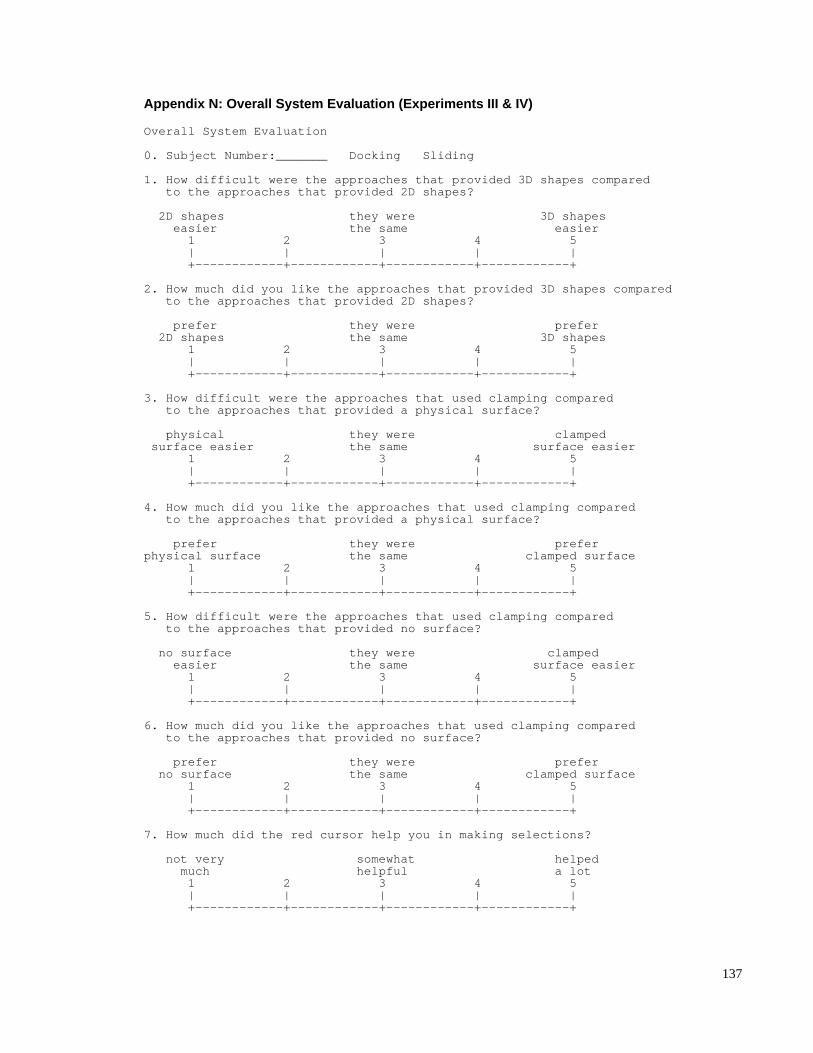
137
Appendix N: Overall System Evaluation (Experiments III & IV)
Overall System Evaluation
0. Subject Number:_______ Docking Sliding
1. How difficult were the approaches that provided 3D shapes compared to the approaches that provided 2D shapes?
2D shapes they were 3D shapes easier the same easier 1 2 3 4 5 | | | | | +------------+------------+------------+------------+
2. How much did you like the approaches that provided 3D shapes compared to the approaches that provided 2D shapes?
prefer they were prefer 2D shapes the same 3D shapes 1 2 3 4 5 | | | | | +------------+------------+------------+------------+
3. How difficult were the approaches that used clamping compared to the approaches that provided a physical surface?
physical they were clamped surface easier the same surface easier 1 2 3 4 5 | | | | | +------------+------------+------------+------------+
4. How much did you like the approaches that used clamping compared to the approaches that provided a physical surface?
prefer they were preferphysical surface the same clamped surface 1 2 3 4 5 | | | | | +------------+------------+------------+------------+
5. How difficult were the approaches that used clamping compared to the approaches that provided no surface?
no surface they were clamped easier the same surface easier 1 2 3 4 5 | | | | | +------------+------------+------------+------------+
6. How much did you like the approaches that used clamping compared to the approaches that provided no surface?
prefer they were prefer no surface the same clamped surface 1 2 3 4 5 | | | | | +------------+------------+------------+------------+
7. How much did the red cursor help you in making selections?
not very somewhat helped much helpful a lot 1 2 3 4 5 | | | | | +------------+------------+------------+------------+

138
8. How much did the clicking sound help you in making selections?
not very somewhat helped much helpful a lot 1 2 3 4 5 | | | | | +------------+------------+------------+------------+
9. How much did the yellow fingertip help you in making selections?
not very somewhat helped much helpful a lot 1 2 3 4 5 | | | | | +------------+------------+------------+------------+
10. Please rank the interfaces from best (1) to worst (6):
____ 2D Shapes with physical surface
____ 3D Shapes with physical surface
____ 2D Shapes with clamping
____ 3D Shapes with clamping
____ 2D Shapes without clamping
____ 3D Shapes without clamping
11. Which aspect of the interfaces was most important?
(a) 3D Shapes
(b) Clamping