binding of ligands to a macromolecule ligand binding.pdf · binding of ligands to a macromolecule...
TRANSCRIPT

1
Binding of ligands to a macromolecule
“The secret of life is molecular recognition; the
ability of one molecule to "recognize" another through
weak bonding interactions.”
Linus Pauling
Binding of dioxygen to hemoglobin
Complex of the HIV protease the inhibitor SD146(drugs)
Binding of ligands to a macromolecule
• General description of ligand binding
– the esssentials
– thermodynamics
– Adair equation
• Simple equilibrium binding
– stoichiometric titration
– equilibrium binding/dissociation constant
• Complex equilibrium binding
– cooperativity
– Scatchard plot and Hill Plot
– MWC and KNF model for cooperative binding
Binding Basics
Imagine a simple binding reaction between a protein P and a ligand A:
The association constant KA is
PAAP AP
PAKA
and the dissociation constant KD is
.
Rearranging equation (1), we see that APKPA A
A
D KPA
APK
1
2
Let ν represent the moles of bound ligand per mole of protein:
[P] and [A] represent unbound protein and ligand respectively
[P]total and [A]total represent the total protein and ligand in the system
PAP
PA
P
PA
total
AKAPKPA AA
AK
AK
APKP
APK
PAP
PA
A
A
A
A
1
AK
A
D
In many experimental procedures you measure ν and [A] at a range of ligand concentrations, which allows you to estimate KD (and from it, ΔG0
binding)
[A] is the concentration of unbound ligand, which is not the same as [A]total.
Certain binding experiments involve measuring the concentration of boundligand ([PA]) instead.
In this case, you can easily calculate [A]:
AK
A
D
[A] = [A]total – [PA]
It may also be that [A] ≈ [A]total. This is true when [A] >> [P].
• Biological systems can be usually described as having constant pressure P and constant temperature T
– the system is free to exchange heat with the surrounding to remain at a constant temperature
– it can expand or contract in volume to remain at atmospheric pressure
0
0.2
0.4
0.6
0.8
1
1.2
0 2 4 6 8 10
[A] (uM)
AK
A
D
A
D KPA
APK
1
1. KD is a concentration and has units of mol per liter
2. KD gives the concentration of ligand that saturates 50% of the
sites (when the total site concentration is much lower than KD)
3. Almost all binding sites are saturated if the ligand concentration is
10 x KD
4. The dissociation constant KD is related to Gibbs free energy ∆G
by the relation ∆G = - R T ln KD
KD values in biological systems
Monovalent ions binding to proteins or DNA have KD 0.1 mM to 10 mM
Allosteric activators of enzymes e. g. NAD have KD 0.1 µM to 0.1 mM
Site specific binding to DNA KD 1 nM to 1 pM
T i i hibit t ti t i t K 0 01 MTrypsin inhibitor to pancreatic trypsin protease KD 0.01 pM
Antibody-antigen interaction have KD 0.1 mM to 0.0001 pM
By using a logarithmic scale for the x-axis, as shown below for the same binding data, the data get more spread out at low [A] and form a characteristic S-shaped curve. The best results are obtained if binding data over several orders of magnitude in [A] can be collected.
1
1.2
0
0.2
0.4
0.6
0.8
0.01 0.1 1 10 100
[A] (uM)
Scatchard Plots
One can “linearize” binding data using the so-called Scatchard plot. Starting with equation
and multiplying both sides by 1 + Ka[A] yields:
AK
AK
A
A
1
ν + ν KA [A] = KA [A]
Dividing through by [A] gives
which rearranges into the following form:
aa KKA
AA KK
A
3
Multiple binding sites
N identical and independent
1.2
If instead we have multiple identical binding sites
then it is possible to show that the appropriate form of the Scatchard equation is
nPAnAP
aa KnK
A
y = -x + 1
R2 = 1
0
0.2
0.4
0.6
0.8
1
0 0.2 0.4 0.6 0.8 1 1.2
v
v/[A
] (x
10E
6
A plot of ν / [A] versus ν should give a straight line for a binding reaction with identical sites. The slope of this plot is –Ka and the y-intercept is nKa.
n
iiPAi
PAPAPA
1][
...]3[3]2[2][
For n sites on the macromolecule:
Concentration of bound ligand
Concentration of macromolecule [ [ ] [ ] [ ]]PA PA PA PA Concentration of macromolecule 0
[ [ ] [ ] [ ] ...2 3
[ ]0
]PA PA PA PA
nPAi
i
n
iiPA
iPAn
ii
v
0
1
SINGLE SITE
P + A PA APPA
BindingK
PAAP
onDissociatiK
PAP
PAv
A
BK
AB
K
APB
KP
APB
Kv
1
KB
MULTIPLE SITESMULTIPLE SITES
P + A PAPA + A PA2
PA2 + A PA3
ADAIR equation
n
i
iAiK
n
i
iAiiK
n
i
iAPiK
n
i
iAPiiK
v
0
1
0
1
Increasing complexity of binding
all binding sites areequivalent and independent
cooperativity heterogeneity
simple
all binding sites areequivalent and not independent
cooperativityheterogeneity
all binding sites arenot equivalent and not independent
all binding sites areindependent but not equivalent
difficult
verydifficult
Experimental Measurements of Binding
Equilibrium dialysis:
AT = total amount of substrateAB = total amount of BOUND substrateA = total amount of UNBOUND substrate
TE
BAvoccupiedsitesaverage ..#.
Detect physical change on bindingABi = change in measured quantity ABT = total change in measured quantity
fraction of occupied sites =
BTABiA
nv
BAATA

4
Example: binding of a protein P to a DNA-fragment D with one or two binding sites
Dfree Pfree
DP K1Dfree Pfree
DPbinding of the first protein withthe dissociation constant K1
Dfree, concentration free DNA; Pfree, concentration free protein;
DP, complex with one protein; DP2, complex with two proteins;
binding constant KB1
dissociation constant KD
DPPfree
DP2 K2
DPPfree
DP2
binding of the second protein withthe dissociation constant K2
D2Pfree
DP2 K 2* DfreePfree
2
DP2
K 2* K1K2 alternative expression
Stoichiometric titration to determinethe number of binding sites
or
0.6
0.8
1
equivalence point1 protein per DNA
Dtot = 10-10 (M)
KD = 10-14 (M)
K = 10-13 (M)
n
for n =1
To a solution of DNA strands with a single binding site small amounts of protein P are added. Since the binding affinity of the protein is high (low KD value as compared to the total DNA concentration) practically every protein binds as long as there are free binding sites on the DNA. This is termed “stoichiometric binding” or a “stoichiometric titration”.
0
0.2
0.4
0 1·10 -10
Ptot (M)
2·10 -10
KD = 10 13 (M)
KD = 10-12 (M)
for n 1
Myoglobin (Mb) & Hemoglobin (Hb)Myoglobin (Mb) & Hemoglobin (Hb)
Proteins involved in STORAGE (Mb) and TRANSPORT (Hb) of oxygen (O2)
pO2 : partial pressure of oxygen
100
0
20
40
60
80
Lungs Capillaries Active Muscle
pO
2
• Function: to transport O2 from lungs to tissue via blood.
• O2 in tissue required to drive oxidation of metabolic fuels to get energy from food.
Myoglobin & Hemoglobin
• Mb has higher affinity for O2 than Hb, so increases transport – gives O2 higher solubility in tissues so diffuses faster.
Heme: a prosthetic group made of a hydrophobic porphyrin ring. Fe2+ is complexed in the porphyrin ring by two main chain His residues.
The organic portion of the heme molecule is Protoporphyrin IX, a circular system of covalently connected pyrrole groups (which contribute the
Myoglobin & Hemoglobin
nitrogens coordinating the iron)
The framework has as appendages four methyl, two vinyl and two propionate groups
· Heme differs from Protoporphyrin IX only in the addition of the iron
· The heme complex is inserted into the protein with the propionate groups
Myoglobin & Hemoglobin
the propionate groups protruding into the solvent
· The functioning portion of the heme is a tetracoordinated, divalent (Fe+2) iron

5
Myoglobin
Single polypeptide chainBinds oxygen in a hyperbolic fashion.Each oxygen binds independently.
• 153 aa, (first protein structure to be solved by Xray crystallography by John Kendrew 1959)
• 8 helices (A-H), 44x44x25 Å
• Role: O2 transport into muscle – needed because muscle uses O2 faster than other tissues.
• O2 has low solubility in blood (10-4 M).
• 4 polypeptide chains (2 alpha and 2 beta) in a quaternary structure.
• Each polypeptide has a heme and can bind O
Hemoglobin
heme and can bind O2
(4 molecules total).
• Binds oxygen in a sigmoid fashion. Each oxygen binds in a cooperative fashion.
Protein Ligand Binding
represents the fraction or percent of the protein that has the ligand “L” bound to it.
Extrapolation to the x axis from the point on the curve that represents 50% occupancy gives the dissociation constant.
The curve is hyperbolic: equation Y = x / (x + z)
Y fraction of ligand bound; x ligand concentration
z represents the dissociation constant (Kd) or the inverse of the association constant (Ka).
Concentration of oxygen in peripheral tissues is a small fraction of that in the lungs
When oxygen-laden h l bi h th
Protein Ligand Binding
hemoglobin reaches the peripheral tissues, the partial pressure of oxygen falls sufficiently that the equilibrium for oxygen binding is shifted toward release p50: the pO2 where 50%
of the heme sites are filled (have bound O2)
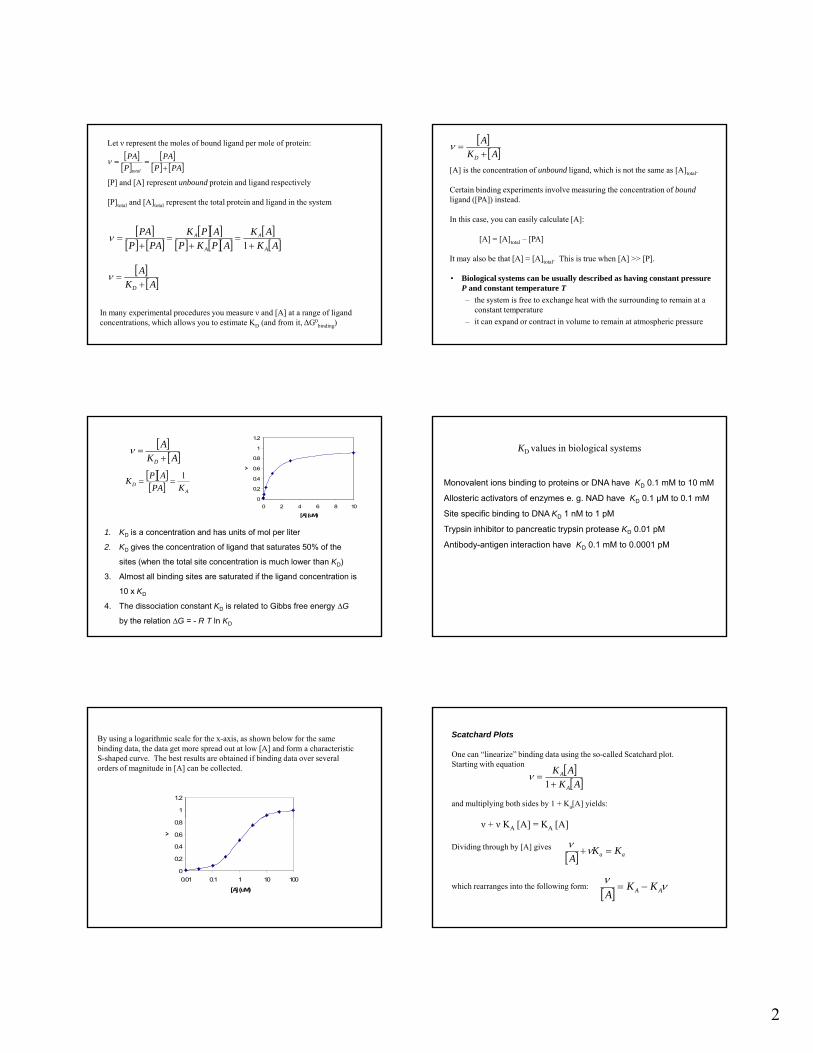
Required Binding curve for an O2 transport protein
efficient in binding – inefficient in unloading
6
Required Binding curve for an O2 transport protein
inefficient in binding – efficient in unloading
Required Binding curve for an O2 transport protein
efficient in binding – efficient in unloading
Required Binding curve for an O2 transport protein
High Affinity at High O2
effective loading
Low Affinity at Low O2
effective unloading
O2 binding
The functions of myoglobin and hemoglobin are to bind oxygen when its concentration or partial pressure is relatively high, and then release it where it is needed, meaning where its concentration or partial pressure is relatively low.
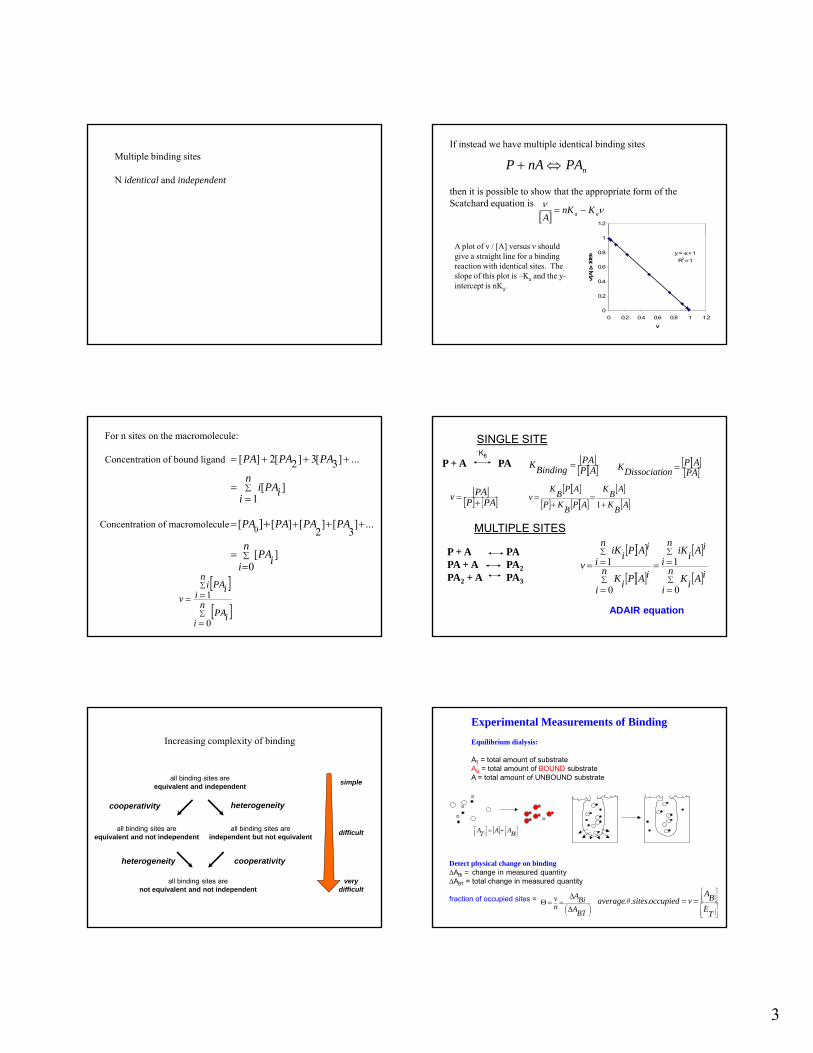
Oxygen Binding Curve for MyoglobinOxygen Binding Curve for Myoglobin
Th t f t th
AHyperbolic
Curve
Theta refers to the fraction of available sites occupied by O2
Free oxygen is expressed as the partial pressure, PO2
Low P50 means high affinity
Hemoglobin - Transport Protein
Heme binds O2 REVERSIBLY
CO binds to heme more strongly than O2 highly toxic
Hemoglobin has two states:
Oxy-Hemoglobin (4 O2 Bound)
Deoxy-hemoglobin (No O2 Bound)
-Either Fully Loaded or Fully Unloaded
- exhibits cooperative binding (allosteric affect) - the uptake of one ligand influences the affinities of the remaining unfilled binding sites
7
myoglobin
NT
SA
TU
RA
TIO
N
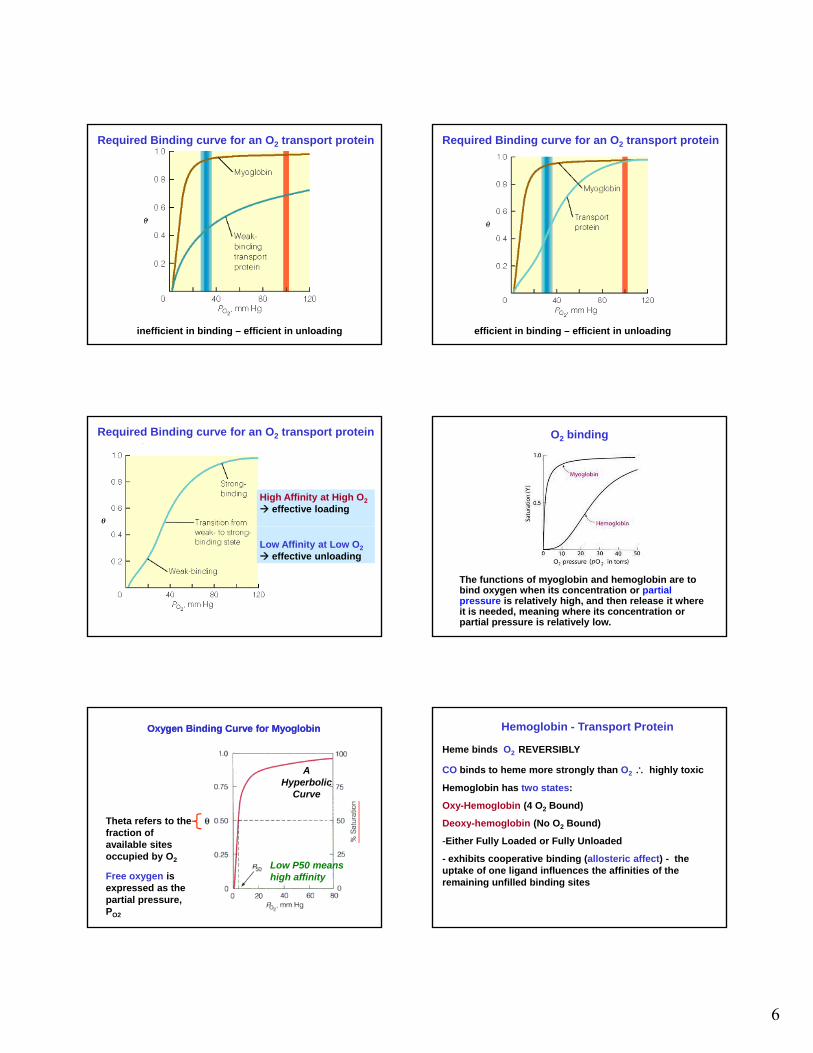
Hemoglobin Binds O2 CooperativelyHemoglobin Binds O2 Cooperatively
hemoglobin
OXYGEN PRESSURE
PE
RC
EN
Weak binding- zero O2
molecules bound Strong binding- 4 O2
molecules bound
O2 binding to Myoglobin
• Reversible binding Mb + O2 MbO2
• Kd = [Mb][O2]/[MbO2] (Dissociation constant).
• Fraction Saturation ( or Y, or YO2) % occupied sites Y = [MbO ]/([Mb]+[MbO ])Y = [MbO2]/([Mb]+[MbO2])
= [O2]/(K+[O2])• Partial pressure: express [O2] as
concentration of gas, so Y = pO2/(K+pO2)
• K = pO2 at Y = 0.5. Define as p50 or [O2]1/2
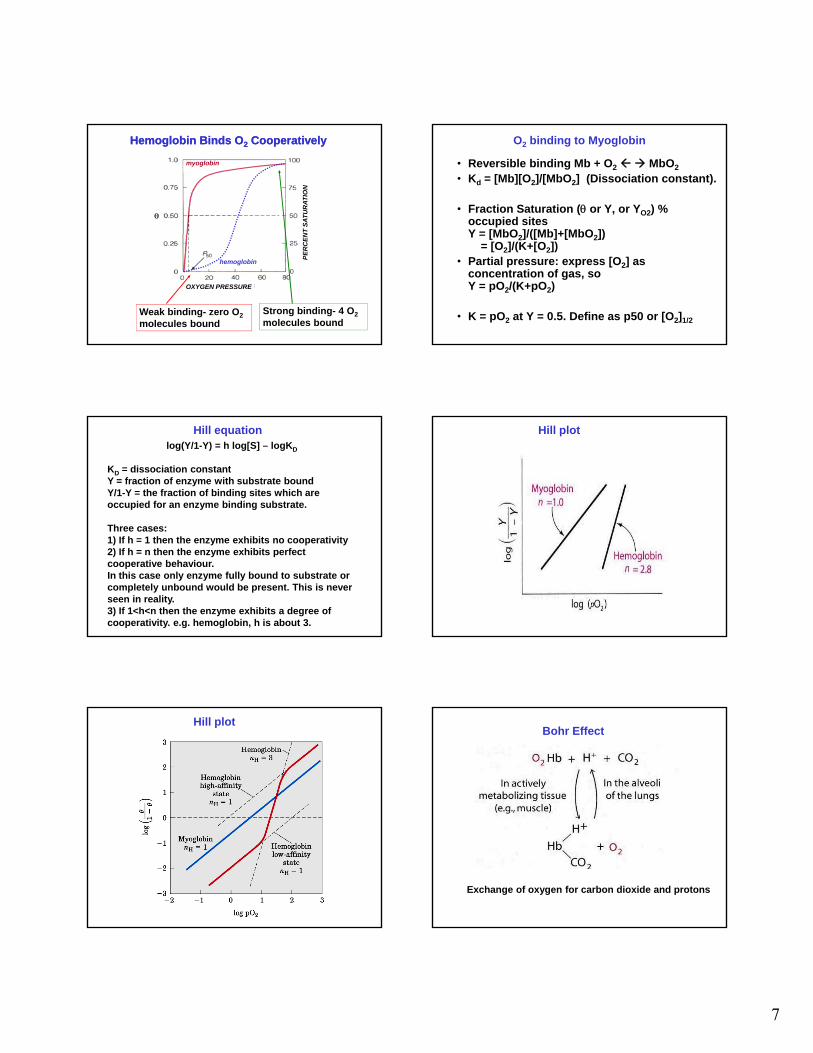
log(Y/1-Y) = h log[S] – logKD
KD = dissociation constant Y = fraction of enzyme with substrate bound Y/1-Y = the fraction of binding sites which are occupied for an enzyme binding substrate.
Th
Hill equation
Three cases:1) If h = 1 then the enzyme exhibits no cooperativity2) If h = n then the enzyme exhibits perfect cooperative behaviour. In this case only enzyme fully bound to substrate or completely unbound would be present. This is never seen in reality. 3) If 1<h<n then the enzyme exhibits a degree of cooperativity. e.g. hemoglobin, h is about 3.
Hill plot
Hill plotBohr Effect
Exchange of oxygen for carbon dioxide and protons
8
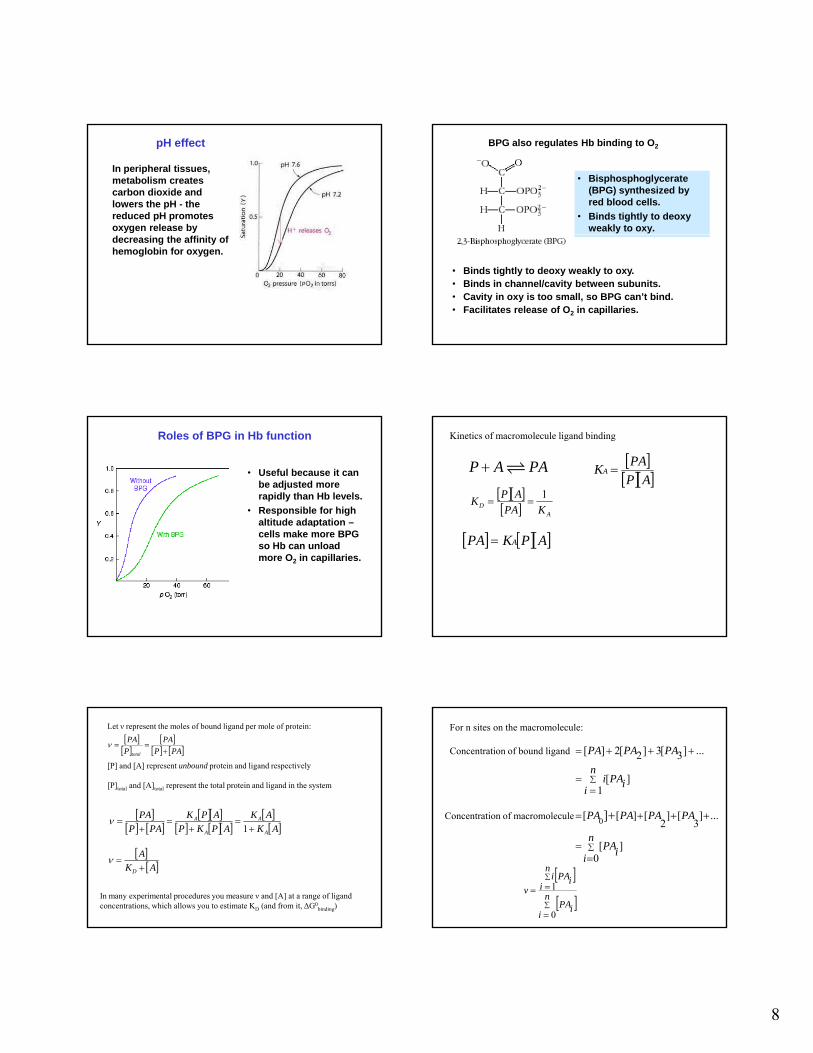
In peripheral tissues, metabolism creates carbon dioxide and lowers the pH - the reduced pH promotes oxygen release by
pH effect
decreasing the affinity of hemoglobin for oxygen.
BPG also regulates Hb binding to O2
• Bisphosphoglycerate (BPG) synthesized by red blood cells.
• Binds tightly to deoxy weakly to oxy.
• Binds tightly to deoxy weakly to oxy. • Binds in channel/cavity between subunits. • Cavity in oxy is too small, so BPG can’t bind. • Facilitates release of O2 in capillaries.
Roles of BPG in Hb function
• Useful because it can be adjusted more rapidly than Hb levels.
• Responsible for high altitude adaptation –pcells make more BPG so Hb can unload more O2 in capillaries.
P A PA AP
PAKA
A
D KPA
APK
1
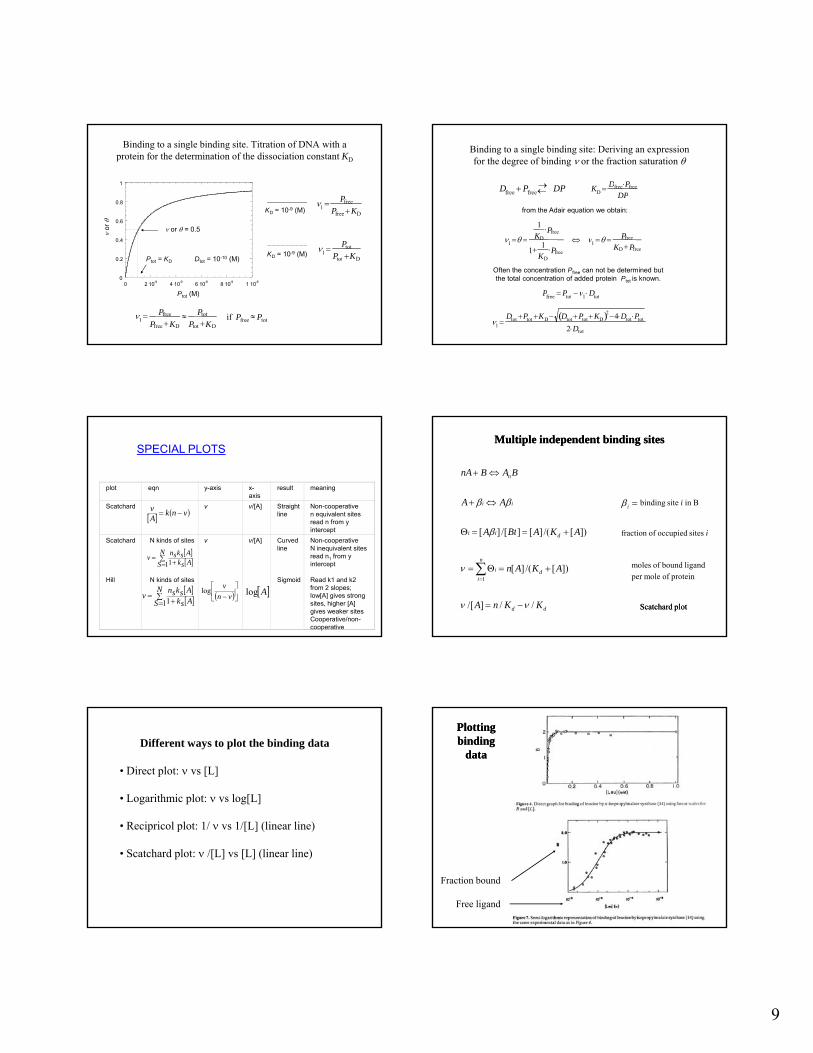
Kinetics of macromolecule ligand binding
APKPA A
Let ν represent the moles of bound ligand per mole of protein:
[P] and [A] represent unbound protein and ligand respectively
[P]total and [A]total represent the total protein and ligand in the system
PAP
PA
P
PA
total
AKAPKPA AA
AK
AK
APKP
APK
PAP
PA
A
A
A
A
1
AK
A
D
In many experimental procedures you measure ν and [A] at a range of ligand concentrations, which allows you to estimate KD (and from it, ΔG0
binding)
n
iiPAi
PAPAPA
1][
...]3[3]2[2][
For n sites on the macromolecule:
Concentration of bound ligand
Concentration of macromolecule [ [ ] [ ] [ ]]PA PA PA PA Concentration of macromolecule 0
[ [ ] [ ] [ ] ...2 3
[ ]0
]PA PA PA PA
nPAi
i
n
iiPA
iPAn
ii
v
0
1
9
Binding to a single binding site. Titration of DNA with aprotein for the determination of the dissociation constant KD
or
0.6
0.8
1
or = 0.5
KD = 10-9 (M)1
Pfree
PfreeKD
1 Pfree
PfreeKD
Ptot
Ptot KD
if Pfree Ptot
Ptot (M)
0
0.2
0.4
0 2 10-9
4 10-9
6 10-9
8 10-9
1 10-8
Ptot = KD Dtot = 10-10 (M)KD = 10-9 (M)
1 Ptot
Ptot KD
Binding to a single binding site: Deriving an expressionfor the degree of binding or the fraction saturation
KD Dfree Pfree
DPDfree Pfree
DP
1K
PfreeP
from the Adair equation we obtain:
1 KD
11
KD
Pfree
1 Pfree
KDPfree
1Dtot Ptot KD DtotPtotKD 24DtotPtot
2Dtot
Pfree Ptot 1Dtot
Often the concentration Pfree can not be determined but the total concentration of added protein Ptot is known.
SPECIAL PLOTS
vnkAv
plot eqn y-axis x-axis
result meaning
Scatchard v v/[A] Straight line
Non-cooperativen equivalent sites read n from y
N
S AskAsksn
v11
N
S AskAsksn
v11
vn
vlog Alog
intercept
Scatchard N kinds of sites v v/[A] Curved line
Non-cooperativeN inequivalent sites read n1 from y intercept
Hill N kinds of sites Sigmoid Read k1 and k2 from 2 slopes; low[A] gives strong sites, higher [A] gives weaker sitesCooperative/non-cooperative
Multiple independent binding sitesMultiple independent binding sites
ii
n
AA
BABnA
binding site i in Bi
dd
d
n
i
i
dii
KKnA
AKAn
AKABtA
//]/[
])[/(][
])[/(][]/[][
1
fraction of occupied sites i
moles of bound ligand
per mole of protein
Scatchard plotScatchard plot
Different ways to plot the binding data
• Direct plot: vs [L]
• Logarithmic plot: vs log[L]
• Recipricol plot: 1/ vs 1/[L] (linear line)
• Scatchard plot: /[L] vs [L] (linear line)
PlottingPlottingbindingbinding
datadata
Fraction bound
Free ligand

10
The Scatchard plotThe Scatchard plot
KdAKdA
AKdA
)/][1/()/]([
])[/(][
KdKdA
KdKdA
KdAKdA
KdAKdA
//1]/[
/1/]/[
/][/][
)/][1/()/]([
Cooperativity: the binding of multiple ligandsto a macromolecule is not independent
2
1
1.5
2 independent bindingmicroscopic binding constantkD = 10-9 (M)
macroscopic binding constantsK1 = 5·10-10 (M); K2 = 2·10-9 (M)
P free (M)
0
0.5
0 2 10-9 4 10-9 6 10-9 8 10-9 1 10-8
Adair equation: 2 K2Pfree2Pfree
2
K1K2K2 PfreePfree2
cooperative bindingmicroscopic binding constantkD = 10-9 (M)
macroscopic binding constantsK1 = 5·10-10 (M); K2 = 2·10-10 (M)
Logarithmic representation of a binding curve
1
1.5
2
2
independent bindingmicroscopic binding constantkD = 10-9 (M)
macroscopic binding constantsK1 = 5·10-10 (M); K2 = 2·10-9 (M)
P free (M)
0
0.5
10-11 10-10 10-9 10-8 10-7
Determine dissociation constants over a ligand concentration of at least three orders of magnitudes
cooperative bindingmicroscopic binding constantkD = 10-9 (M)
macroscopic binding constantsK1 = 5·10-10 (M); K2 = 2·10-10 (M)
Visualisation of binding data - Scatchard plotP
frei
2 109
3 109
intercept = n/kD
slope 1/k
independent bindingmicroscopic binding constantkD = 10-9 (M)
macroscopic binding constantsK1 = 5·10-10 (M); K2 = 2·10-9 (M)
P
0
1 109
0 0.5 1 1.5 2
slope = - 1/kD
intercept = n
n nPfree
kDPfree
n
Pfree
n
kD
n
kD
cooperative bindingmicroscopic binding constantkD = 10-9 (M)
macroscopic binding constantsK1 = 5·10-10 (M); K2 = 2·10-10 (M)
on
off
P A PA
k
k
Microscopic and macroscopic binding constantsMicroscopic and macroscopic binding constants
ff
Microscopic and macroscopic binding constantsMicroscopic and macroscopic binding constants

11
Microscopic and macroscopic binding constantsMicroscopic and macroscopic binding constants
Procedure – Monitor titration of E with L at a suitable wavelength where the absorbance change is large.
At any given wavelength the total absorbance is the sum of the absorbance contribution from each species.
At any point in the titration, at ligand concentration [Lx]
Assume all species except P and PAn are negligible,i.e. there is strong cooperativity, therefore: Measurements
Techniques?

12
Isothermal Titration Calorimetry
• Pros• Works in solution• Measures natural part
of binding reaction:
• Cons• Requires H > ± 3-5
kcal/mol for precise determinations
• Most often requiresof binding reaction: G = H – TS G = –RT ln(K)
• Determines the thermodynamics the of binding reaction
• Automatic titration –setup and leave
• Most often requires macromolecule concentrations in the range 1 µM – 1 mM
• Consumes “large” amounts of material
• Insensitive to very tight or very weak binding
• Slow – 2-3 hours per run
ITC Alternatives• Surface Plasmon Resonance
• Requires attachment of molecules to chip• Can give on and off rates
• Intrinsic Fluorescencei i i * id ( ) l• Requires sensitive* Trp or Tyr residue(s) close to
binding site• Interfering agents such as BSA must be absent• Titrating in the ligand can give an increased signal by
itself• Works in solution• Potentially much more sensitive
ITC Instrument
• Small instrument –requires less than 3 ft of bench space
• Completely computerized• Completely computerized operation
• Must be located in room with constant temperature
• No user-serviceable parts except syringe
ITC Instrument II
• Two coin-shaped cells in adiabatic chamber kept at exactly the same temperature – T < 0.001º CT d• Temperature measured EXTREMELY precise –0.00001º C
• Sample can be heated fast, but cooling is slow: Sample should be colder than the experimental temperature when loaded
ITC Instrument III
• Reference cell contains water – nothing is added
• Sample cell contains macromolecule in buffer solutionsolution
• Ligand in syringe is added in computer-controlled injections
• Solution is stirred with the paddle-shaped tip of the needle to ensure rapid mixing of components
ITC Measurements
• When an injection is made, heat will be generated or absorbed by the molecules reacting (exothermic or endothermic reactions)
• Heat input in sample cell adjusted to keep T constant• Heat input in sample cell adjusted to keep T constant
• Exothermic reaction will result in negative peaks (less heat is needed while the reaction proceeds)
• Endothermic reactions will result in positive peaks (more heat is needed while the reaction proceeds)
13
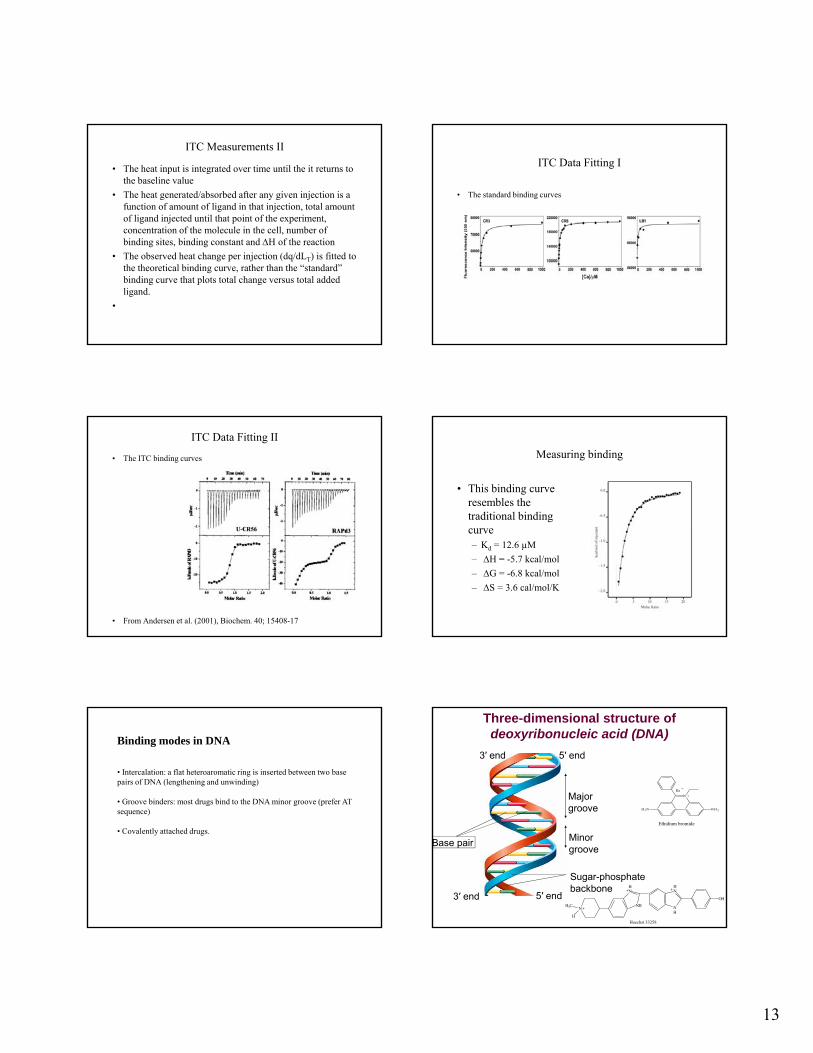
ITC Measurements II
• The heat input is integrated over time until the it returns to the baseline value
• The heat generated/absorbed after any given injection is a function of amount of ligand in that injection, total amount of ligand injected until that point of the experiment, concentration of the molecule in the cell, number of ,binding sites, binding constant and H of the reaction
• The observed heat change per injection (dq/dLT) is fitted to the theoretical binding curve, rather than the “standard” binding curve that plots total change versus total added ligand.
•
ITC Data Fitting I
• The standard binding curves
ITC Data Fitting II
• The ITC binding curves
• From Andersen et al. (2001), Biochem. 40; 15408-17
Measuring binding
• This binding curve resembles the traditional binding curve– Kd = 12.6 µM
– H = -5.7 kcal/mol
– G = -6.8 kcal/mol
– S = 3.6 cal/mol/K
Binding modes in DNA
• Intercalation: a flat heteroaromatic ring is inserted between two base pairs of DNA (lengthening and unwinding)
• Groove binders: most drugs bind to the DNA minor groove (prefer AT sequence)
• Covalently attached drugs.
Major groove
3′ end 5′ end
Three-dimensional structure of deoxyribonucleic acid (DNA)
N H 2H 2N
N
B r
Minor groove
Sugar-phosphate backbone
5′ end3′ end
Base pair
Ethidium bromide
Hoechst 33258
NH3C
H
HN
NH
HN
NH
OH

14
Drug Action Mode of Binding
Hoechst 33258 Antitumor Minor groove
Netropsin Antitumor, Antiviral Minor groove
Pentamidine Active against Pneumocystis Carinii
Minor groove
Berenil Antitrypanosomal Minor groove
Distamycin Antitumor, Antiviral Minor groove
Drug action and mode of binding of some DNA binding drugs.
SN7167 Antitumor, Antiviral Minor groove
Nogalamycin Antitumor Intercalation
Menogaril Antitumor Intercalation
Mithramycin Anticancer antibiotic Minor groove
Plicamycin Anticancer antibiotic Minor groove
Chromomycin A3 Anticancer antibiotic Minor groove
cis -Platin Anticancer antibiotic Covalent cross-linking
Daunomycin Anticancer antibiotic Intercalation
Adriamycin Antitumor antibiotic Intercalation
Measurement
Displacement studies
Noncovalent DNA probes.
Binding of Ethidium-Bromide to Transfer RNA
Ethidium bromide can intercalate into nucleic acid structuresIt binds well to both DNA and RNA
Enzyme cofactors NADH, FAD and pyridoxal/pyridoxamine are fluorescent.

15
Extrinsic probes.Protein labeling reagents.
Covalently attached drugs
87
DNA-binding proteins often fit into the major groove of the double helix
Double-stranded DNA has two phosphate groups every 3.4 Angstroms along itslength. These negatively charged ions aggregate around the DNA.
1) Direct interaction with negatively charged phosphates.2) Screening by mobile ion “atmosphere”
we will let be the effect fraction of each phosphate charge neutralized by Na+
ions in solution.
Nonideality in Protein/DNA interactions
When a protein binds to DNA it displaces some sodium:
P + DNA P•DNA + n [Na+]
We generally define a protein/DNA equilbrium constant as
K= [P•DNA]/[P][DNA]But there is an extra term now:
K= [P•DNA][Na+]n/[P][DNA]
The Monod-Wyman-Changeau (MWC)model for cooperative binding
+P
T0 T1 T2
L0 L1 L2
kT
+P
kT
T conformation (all binding sites
are weak)
P P P P P
P
P P
P P
+P
kT
+P
kT
T3 T4
L3 L4
R0 R1 R2
+P
kR
+P
kR
R conformation (all binding sites
are strong)
• in the absence of ligand P the the T conformation is favored
• the ligand affinity to the R form is higher, i. e. the dissociation constant kR< kT.
• all subunits are present in the same confomation
• binding of each ligand changes the T<->R equilibrium towards the R-Form
P P P P P
P P
P P
P
+P
kR
+P
kRR3 R4
(Monod, Wyman & Changeaux)Allosteric protein an oligomer of protein subunits that are symmetrically related; Protomers can exist in two conformations (designated T[ense]: low affinity for substrate, & R[elaxed]: high affinity for substrate) that are in equilibrium whether or not ligand is bound; Ligand can bind to protomers in either conformation, but conformational change alters affinity for the ligand;conformational change alters affinity for the ligand; The molecular symmetry of the protein is conserved during conformational change: the protomers must therefore change in a concerted manner.
positive effectors bind to R (circles) and shift equilibrium to right, negative effectors bind to T (squares) and shift equilibrium to left.
16
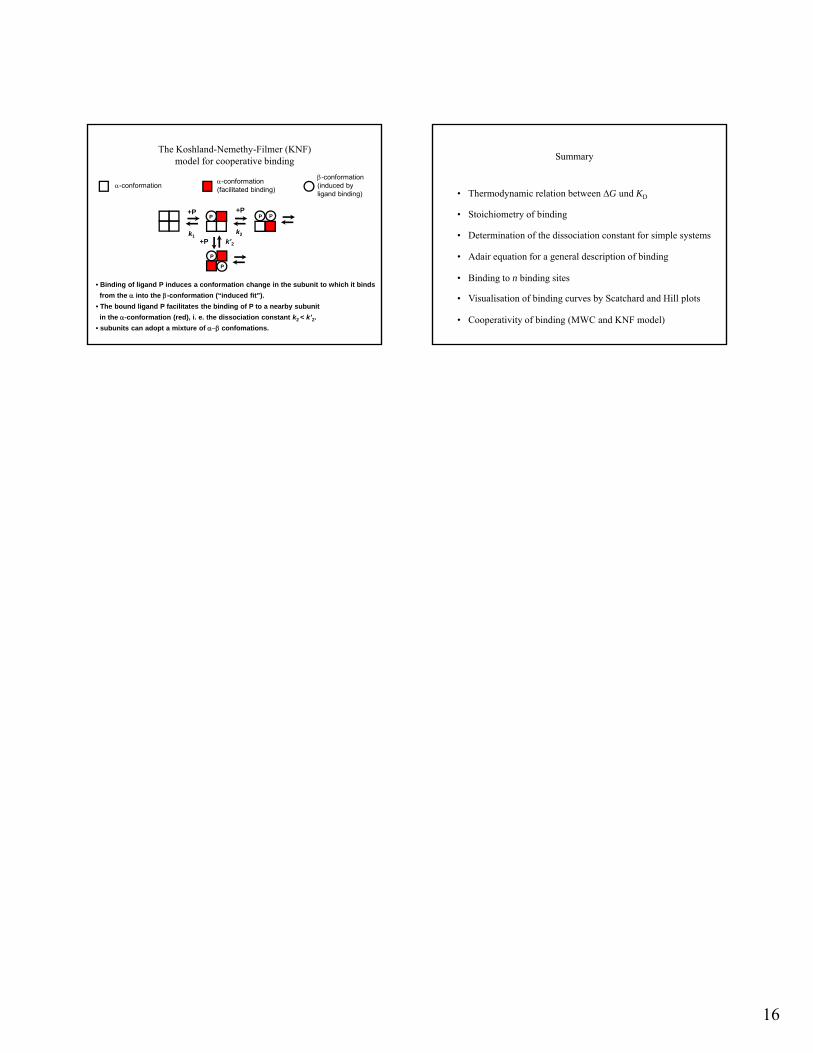
The Koshland-Nemethy-Filmer (KNF)model for cooperative binding
+P
k1
+P
k2
-conformation-conformation(induced by ligand binding)
P PP
-conformation(facilitated binding)
k1 2
• Binding of ligand P induces a conformation change in the subunit to which it binds
from the into the -conformation (“induced fit”).
• The bound ligand P facilitates the binding of P to a nearby subunit
in the -conformation (red), i. e. the dissociation constant k2 < k’2.
• subunits can adopt a mixture of confomations.
+P
P
P
k’2
• Thermodynamic relation between ∆G und KD
• Stoichiometry of binding
• Determination of the dissociation constant for simple systems
Summary
• Determination of the dissociation constant for simple systems
• Adair equation for a general description of binding
• Binding to n binding sites
• Visualisation of binding curves by Scatchard and Hill plots
• Cooperativity of binding (MWC and KNF model)