bingham canyon mine expansion - home | …kuc_technical support document_rev5.docx v acronyms and...
TRANSCRIPT

Final Report
Utah Division of Air Quality
Bingham Canyon Mine Expansion
Technical Support Document
Submitted to:
Kennecott Utah Copper LLCSubmitted by:
Prepared by:
August 2010
Revised January 2011
THIS DOCUMENT MAY NOT BE FINAL. THE FINAL DOCUMENT, UPON WHICH THE PERMIT MAY BE ISSUED, MAY DIFFER FROM THIS VERSION IN RESPONSE TO COMMENTS RECEIVED DURING THE PERMITTING PROCESS.
Revised December 2010


F i n a l R e p o r t
Bingham Canyon Mine Expansion
Technical Support Document
Submitted to
Utah Division of Air Quality
Prepared for
Kennecott Utah Copper LLC
Submitted August 2010 Revised December 2010
Revised January 2011


IS080310013347SLC\KUC_TECHNICAL SUPPORT DOCUMENT_REV5.DOCX iii
Contents
Acronyms and Abbreviations ................................................................................................... v
1.0 Introduction and Purpose .......................................................................................... 1-1 1.1 Notice of Intent ................................................................................................ 1-1
2.0 1994 PM10 State Implementation Plan Demonstration ......................................... 2-1 2.1 1994 Attainment and Maintenance Demonstration .................................... 2-1 2.2 Offset Proposal Consistent with 1994 SIP Demonstration ........................ 2-2
2.2.1 Review of PM10 Emissions ................................................................. 2-3 2.2.2 Review of NOx Emissions ................................................................. 2-3 2.2.3 Summary of Credits Relinquishment .............................................. 2-3
3.0 2005 Maintenance Plan Demonstration ................................................................... 3-1 3.1 Urban Airshed Model Modeling ................................................................... 3-1 3.2 Emissions from Mine Expansion ................................................................... 3-3 3.3 Method of Analysis ......................................................................................... 3-4
3.3.1 CALMET .............................................................................................. 3-4 3.3.2 CALPUFF Analysis ............................................................................ 3-4 3.3.3 Receptor Grid ...................................................................................... 3-5 3.3.4 Source Emissions ................................................................................ 3-5
3.4 Results ............................................................................................................... 3-6 3.5 Summary ........................................................................................................ 3-10
4.0 Emissions Summary .................................................................................................... 4-1 4.1 Emissions from Point Sources ....................................................................... 4-1 4.2 Emissions from Fugitive Sources .................................................................. 4-2
4.2.1 Drilling and Blasting .......................................................................... 4-2 4.2.2 Material Movement ............................................................................ 4-3 4.2.3 Low-grade Ore Stockpile ................................................................... 4-3 4.2.4 Disturbed Areas .................................................................................. 4-4 4.2.5 Haulroads and Haultruck Emissions .............................................. 4-4 4.2.6 Road-base Crushing and Screening Plant ....................................... 4-6
4.3 Sources with VOC Emissions ........................................................................ 4-6 4.3.1 Maintenance Degreasing ................................................................... 4-6 4.3.2 Fueling Stations .................................................................................. 4-7 4.3.3 Solvent Extraction/Electrowinning Plant ....................................... 4-7
4.4 Support Equipment ......................................................................................... 4-8 4.4.1 Track Dozers, Rubber Tire Dozers, Graders, and Loaders ........... 4-8
4.5 Miscellaneous Emissions Sources ................................................................. 4-9 4.5.1 Emergency Generators ...................................................................... 4-9
4.6 Emissions Comparison ................................................................................. 4-10 4.6.1 Total Emissions Using Updated Factors ....................................... 4-10
5.0 Conclusion .................................................................................................................... 5-1
6.0 References ..................................................................................................................... 6-1

CONTENTS (CONTINUED)
iv IS080310013347SLC\KUC_TECHNICAL SUPPORT DOCUMENT_REV5.DOCX
Tables 1-1 Bingham Canyon Mine Proposed Potential to Emit ................................................ 1-2
2-1 Emissions from 1994 State Implementation Plan Compared with 260,000,000 Tons Material Moved Potential to Emit .............................................................................. 2-3
3-1 Relative Response Factors Used in Analysis ............................................................. 3-2
3-2 Expected Emissions ...................................................................................................... 3-3
3-3 Emissions Summary (260 and 197 Mtpy cases) ........................................................ 3-6
3-4 Emissions by Area Source in the CALPUFF Modeling Scenario ........................... 3-6
3-5 Summary of 2011 Projection Year Analysis .............................................................. 3-7
3-6 Summary of 2015 Projection Year Analysis .............................................................. 3-7
4-1 Proposed Emissions from Point Sources Controlled by Baghouses ...................... 4-2
4-2 Emissions from Drilling and Blasting Operations ................................................... 4-3
4-3 Emissions from Ore and Waste Rock Transfers ....................................................... 4-3
4-4 Emissions from Ore Stockpile ..................................................................................... 4-4
4-5 Emissions from Disturbed Areas ................................................................................ 4-4
4-6 Fugitive Emissions from Haulroads ........................................................................... 4-5
4-7 Tailpipe Emissions from Haultrucks.......................................................................... 4-5
4-8 Emissions from Road-base Crushing and Screening Plant ..................................... 4-6
4-9 Emissions from Maintenance Degreasers .................................................................. 4-6
4-10 Emissions from Fueling Stations ................................................................................. 4-7
4-11 Emissions from the Solvent Extraction/Electrowinning Plant .............................. 4-7
4-12 Emissions from the Electrowinning Acid Mist Eliminator ..................................... 4-8
4-13 Fugitive Emissions from Support Equipment .......................................................... 4-8
4-14 Projected Tailpipe Emissions from Support Equipment ......................................... 4-9
4-15 Emissions from Emergency Generators ..................................................................... 4-9
4-16 Emissions Comparison Using The Same Emission Factors .................................. 4-10
Figures 3-1 Difference in 260 and 197 Mtpy CALPUFF scenarios (µg/m3) – Day 38 3-2 24-hour PM10 concentrations for projection year 2011 (µg/m3) – Day 38 3-3 24-hour PM10 concentrations for projection year 2015 (µg/m3) – Day 38
Appendices A Emissions Summary
A-1 Emissions for CMB Modeling A-2 Emissions for UAM-AERO Modeling

IS080310013347SLC\KUC_TECHNICAL SUPPORT DOCUMENT_REV5.DOCX v
Acronyms and Abbreviations
AERMOD American Meteorological Society/EPA Regulatory Model
AO Approval Order
BCM Bingham Canyon Mine
CMB Chemical Mass Balance
CO carbon monoxide
EPA U.S. Environmental Protection Agency
KUC Kennecott Utah Copper LLC
µg/m3 microgram per cubic meter
Mtpy million tons per year
NAAQS National Ambient Air Quality Standards
NEI net emissions increase
NH4 ammonium
NOI Notice of Intent
NOx nitrogen oxides
OC organic carbon
PM particulate matter
PM10 particulate matter less than 10 micrometers in aerodynamic diameter
PTE potential to emit
RRF relative reduction factor
SIP State Implementation Plan
SO2 sulfur dioxide
SOx sulfur oxides
tpy ton per year
TSD Technical Support Document
UAC Utah Administrative Code
UAM-AERO Urban Airshed Model with aerosols
UDAQ Utah Division of Air Quality
VOC volatile organic compound

ACRONYMS AND ABBREVIATIONS (CONTINUED)
vi IS080310013347SLC\KUC_TECHNICAL SUPPORT DOCUMENT_REV5.DOCX
THIS PAGE INTENTIONALLY LEFT BLANK

IS080310013347SLC\KUC_TECHNICAL SUPPORT DOCUMENT_REV5.DOCX 1-1
1.0 Introduction and Purpose
Kennecott Utah Copper LLC (KUC) is submitting a Notice of Intent (NOI) to secure an Approval Order (AO) to increase the annual movement of ore and waste rock material at the Bingham Canyon Mine (BCM) located near Copperton, Utah. The BCM is currently limited to an annual material-moved limitation of 197,000,000 tons per year (tpy) for ore and waste rock, and KUC is requesting authorization to increase this amount to 260,000,000 tpy. As noted in the NOI, the material-moved limitation is also included in the 1994 and 2005 State Implementation Plans (SIPs) for particulate matter (PM) less than 10 micrometers in aerodynamic diameter (PM10), and the NOI requests that appropriate actions also be initiated to likewise increase the limitation in each of them.
The purpose of this Technical Support Document (TSD) is to assess the implications of the proposed increase on the attainment and maintenance demonstrations that were relied upon in supporting the 1994 and 2005 PM10 SIP actions. The Chemical Mass Balance (CMB) receptor model, in conjunction with emissions control and offset requirements, was used in support of the 1994 SIP attainment. The Urban Airshed Model with aerosols (UAM-AERO) was used in support of the 2005 maintenance demonstration. The TSD provides a technical demonstration that the proposed increase in total material-moved limitation will not adversely affect attainment and maintenance of the PM10 National Ambient Air Quality Standards (NAAQS) based on the demonstration methodologies employed in 1994 PM10 SIP and the PM10 2005 Maintenance Plan.
1.1 Notice of Intent The NOI application has been submitted to the Utah Division of Air Quality (UDAQ) as a separate companion document. The NOI will proceed through the permitting process as required by UDAQ per Utah Administrative Code (UAC) R307-401 (UDAQ, 2009) and includes the detailed calculations of the future potential to emit (PTE) of the BCM if the increase in waste and ore material movement is granted. KUC is increasing controls on fugitive dust and heavy-duty diesel emissions to reduce the overall emissions from the mine and to ensure that air quality is not adversely affected. A summary of the potential emissions after the proposed modification is presented in Table 1-1.

KUC BINGHAM CANYON MINE EXPANSION—TECHNICAL SUPPORT DOCUMENT
1-2 IS080310013347SLC\KUC_TECHNICAL SUPPORT DOCUMENT_REV5.DOCX
TABLE 1-1 Bingham Canyon Mine Proposed Potential to Emit
Pollutant Proposed PTE for 260,000,000 tpy
Throughput (tpy)
PM10 1,513
SO2 6.56
NOx 5,830
CO 1,682
VOC 314
NOTES: CO = carbon monoxide NOx = nitrogen oxides SO2 = sulfur dioxide tpy = ton per year VOC = volatile organic compound
The emissions shown in Table 1-1 are calculated using the most recent emission factors and are the most representative of current emission sources at the site.
As part of the NOI, KUC performed air dispersion modeling of the proposed emission rates using the American Meteorological Society/U.S. Environmental Protection Agency (EPA) Regulatory Model (AERMOD) to demonstrate that the air quality near the mine would not be adversely impacted. The highest 24-hour concentration of PM10 predicted by the model, including background, was below 150 micrograms per cubic meter (µg/m3), the NAAQS for PM10. The modeling report with this analysis is provided in the NOI.
This TSD demonstrates that the increase in waste and ore material movement will not adversely impact the attainment of the PM10 NAAQS based on the air quality analyses that were conducted in association with the 1994 SIP and the 2005 Maintenance Plan, respectively. Both demonstrations show that the proposed increase in the total amount of ore and waste rock moved at the BCM, along with increased controls, will not alter the conclusions reached in either of those previous analyses.

IS080310013347SLC\KUC_TECHNICAL SUPPORT DOCUMENT_REV5.DOCX 2-1
2.0 1994 PM10 State Implementation Plan Demonstration
2.1 1994 Attainment and Maintenance Demonstration Attainment of the PM10 NAAQS in 1994 was demonstrated using the CMB receptor model.1 The CMB model uses the chemistry measured from a PM10 sample from a specific monitoring location and the chemistry of direct PM10 from individual sources in the area, and matches the relative chemistry measured on the filter with the relative PM10 chemistry measured for the source emissions. The contribution to the PM10 measured on the filter from an individual source or group of sources is calculated by the model through a series of mathematical statistical equations. The model assumes there are accurate and unique chemical profiles for each of the potential sources or source groupings. For example, in the 1994 SIP, the refineries were grouped together as one source because the chemistry of the emissions from one refinery was not different enough from the other petroleum refineries for the model to distinguish between them.
The CMB approach used in the 1994 SIP did not rely directly on modeling source impacts but instead predicted impacts from stationary sources based on each source or group of sources’ emissions relative to the total emissions from all stationary sources. For example, if the PM10 emissions from a particular source were 50 percent of the total emissions from all grouped together stationary sources, then it was assumed 50 percent of the PM10 impacts measured at the receptors from the large group of stationary sources were from that source. The impacts from individual sources were not modeled directly but were proportioned based on the stationary source emission inventory. Source proximity to the receptors was not considered in the modeling apportionment. The BCM is located several miles from each of the monitors used in the 1994 SIP (North Salt Lake, Salt Lake, and the Air Monitoring Center located near downtown Salt Lake), but the predicted impacts were based on the emissions from the mine and not its location. Wind direction was not considered as well. On days the winds were not blowing from the mine toward the monitors, the assumed contribution from the mine was still assumed to be the same percentage as the mine emissions. Therefore, the SIP conservatively estimated a larger potential impact from the BCM.
Secondary sulfate and nitrate impacts were assumed to be in direct proportion to a source’s relative sulfur dioxide (SO2) and nitrogen oxides (NOx) emissions. None of the individual sources or groups of sources was directly measured in the model. Again, location of the source relative to the monitors was not considered, resulting in the predicted nitrate and sulfate impacts from the BCM being conservatively high.
Based on required emission control strategies, emission reductions, and the resulting emission inventory, the CMB modeling demonstration described above predicted 1 A technically superior modeling tool was developed and used as part of the 2005 attainment demonstration. This is
discussed further in Section 3.0 of this TSD.

KUC BINGHAM CANYON MINE EXPANSION—TECHNICAL SUPPORT DOCUMENT
2-2 IS080310013347SLC\KUC_TECHNICAL SUPPORT DOCUMENT_REV5.DOCX
attainment. An additional component of the 1994 attainment and maintenance strategy was to ensure that the attainment predicted by the CMB model would be maintained going forward notwithstanding future industrial growth.
In particular, the 1994 SIP included a provision for offsetting increases associated with new sources and modifications. The SIP required emissions be reduced 1.2 tons for each 1 ton of emissions increase if the combination of PM10, NOx, and sulfur oxides (SOx) increases were greater than 50 tons per year. Section IX.A.7.h of the 1994 SIP states the following:
Projected industrial growth is unknown. The PM10 standards will be maintained in the PM10 group I areas by implementing the following strategies: . . .
(2) Emissions Offset: . . . As a method of verifying that the emissions inventory stabilizes, any new or modified source located in or impacting the nonattainment areas which emits 25 tons/year or more but less than 50 tons/year of any combination of PM10, SO2, or NOx will be required to obtain a 1:1 emission offset credit as a condition of the approval order from the UACC. New or modified sources located in or impacting the nonattainment area which emits 50 tons/year or more of any combination of these pollutants will be required to obtain a 1.2:1 emission offset credit prior to the issuance of an approval order. The result of the offset requirement is that industrial growth will not increase the cap on industrial emissions and a net reduction occurs when larger industries locate in or near the nonattainment area.
2.2 Offset Proposal Consistent with 1994 SIP Demonstration KUC proposes offsetting the emissions increase associated with increasing the material moved from 150,500,000 tons to 260,000,000 tons in accordance with the 1994 SIP maintenance offsetting requirement. The offsetting would be completed by KUC relinquishing existing emissions credits banked since the 1994 SIP was developed. These emission credits are derived from actual emissions that were included in the 1994 attainment demonstration and were subsequently reduced by emission improvements.
The emissions from the BCM used in the modeling analysis were based on the 150,500,000 tons material-moved limitation. Since the 1994 SIP, many emission factors, mining activities, and emission improvements have changed, such as cleaner fuels, fugitive dust control improvements, and larger trucks.
To maintain consistency with the 1994 SIP demonstration, the net emissions increase (NEI) is assessed with increasing material moved from 150,500,000 tons to 260,000,000 tons. For this analysis, the PTE for 260,000,000 tons of material moved was calculated using the same emission factors used for the emission inventory in the 1994 SIP and includes the additional controls and operational changes to be implemented.2 This allows for a direct comparison with the emissions used in the CMB model. The emissions summary is presented in Table 2-1, and the detailed emission calculations are presented in Appendix A-1.
2 An estimate of PTE based on more current emission factors is provided in Table 1-1.
KUC BINGHAM CANYON MINE EXPANSION—TECHNICAL SUPPORT DOCUMENT
IS080310013347SLC\KUC_TECHNICAL SUPPORT DOCUMENT_REV5.DOCX 2-3
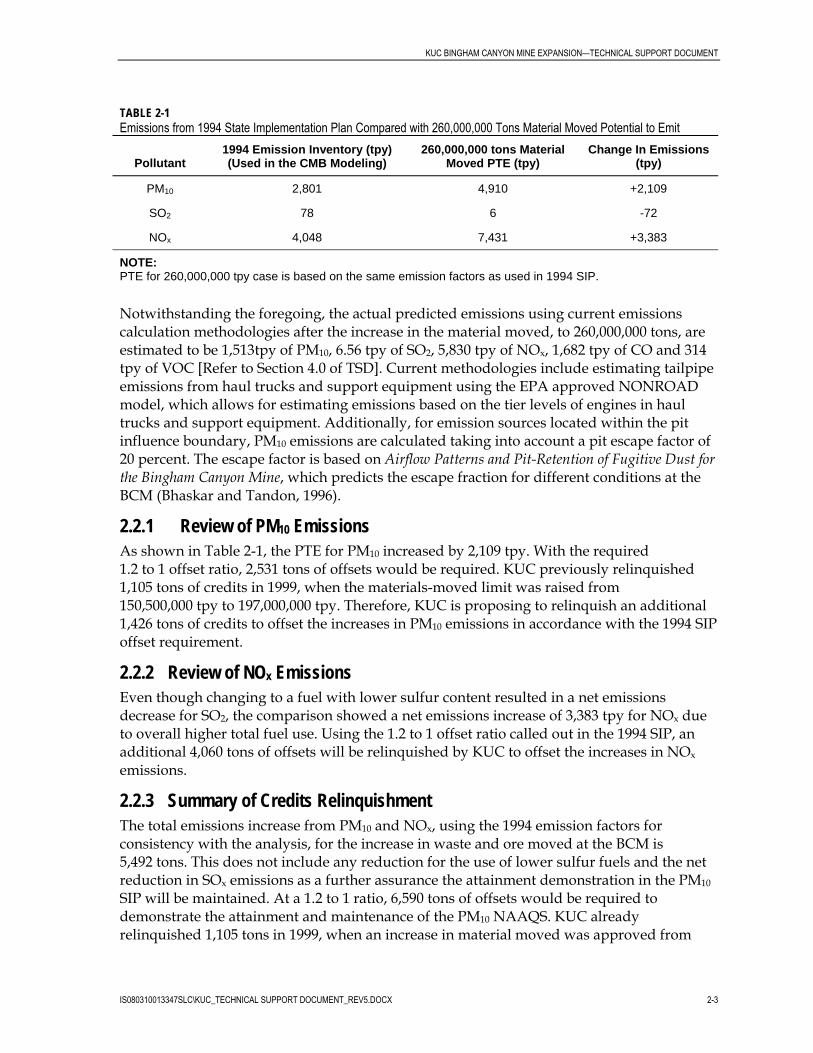
TABLE 2-1 Emissions from 1994 State Implementation Plan Compared with 260,000,000 Tons Material Moved Potential to Emit
Pollutant 1994 Emission Inventory (tpy) (Used in the CMB Modeling)
260,000,000 tons Material Moved PTE (tpy)
Change In Emissions (tpy)
PM10 2,801 4,910 +2,109
SO2 78 6 -72
NOx 4,048 7,431 +3,383
NOTE: PTE for 260,000,000 tpy case is based on the same emission factors as used in 1994 SIP.
Notwithstanding the foregoing, the actual predicted emissions using current emissions calculation methodologies after the increase in the material moved, to 260,000,000 tons, are estimated to be 1,513tpy of PM10, 6.56 tpy of SO2, 5,830 tpy of NOx, 1,682 tpy of CO and 314 tpy of VOC [Refer to Section 4.0 of TSD]. Current methodologies include estimating tailpipe emissions from haul trucks and support equipment using the EPA approved NONROAD model, which allows for estimating emissions based on the tier levels of engines in haul trucks and support equipment. Additionally, for emission sources located within the pit influence boundary, PM10 emissions are calculated taking into account a pit escape factor of 20 percent. The escape factor is based on Airflow Patterns and Pit-Retention of Fugitive Dust for the Bingham Canyon Mine, which predicts the escape fraction for different conditions at the BCM (Bhaskar and Tandon, 1996).
2.2.1 Review of PM10 Emissions As shown in Table 2-1, the PTE for PM10 increased by 2,109 tpy. With the required 1.2 to 1 offset ratio, 2,531 tons of offsets would be required. KUC previously relinquished 1,105 tons of credits in 1999, when the materials-moved limit was raised from 150,500,000 tpy to 197,000,000 tpy. Therefore, KUC is proposing to relinquish an additional 1,426 tons of credits to offset the increases in PM10 emissions in accordance with the 1994 SIP offset requirement.
2.2.2 Review of NOx Emissions Even though changing to a fuel with lower sulfur content resulted in a net emissions decrease for SO2, the comparison showed a net emissions increase of 3,383 tpy for NOx due to overall higher total fuel use. Using the 1.2 to 1 offset ratio called out in the 1994 SIP, an additional 4,060 tons of offsets will be relinquished by KUC to offset the increases in NOx emissions.
2.2.3 Summary of Credits Relinquishment The total emissions increase from PM10 and NOx, using the 1994 emission factors for consistency with the analysis, for the increase in waste and ore moved at the BCM is 5,492 tons. This does not include any reduction for the use of lower sulfur fuels and the net reduction in SOx emissions as a further assurance the attainment demonstration in the PM10 SIP will be maintained. At a 1.2 to 1 ratio, 6,590 tons of offsets would be required to demonstrate the attainment and maintenance of the PM10 NAAQS. KUC already relinquished 1,105 tons in 1999, when an increase in material moved was approved from

KUC BINGHAM CANYON MINE EXPANSION—TECHNICAL SUPPORT DOCUMENT
2-4 IS080310013347SLC\KUC_TECHNICAL SUPPORT DOCUMENT_REV5.DOCX
150,500,000 tpy to 197,000,000 tpy. KUC will relinquish the additional 5,485 tons from SO2 credits banked from the emission reductions at the copper smelter. KUC currently has approximately 12,000 tons of stack-level SO2 credits banked with UDAQ. These credits were generated as a result of reductions in SO2 emissions at the smelter when the smelter modernization project was implemented in 1998.

IS080310013347SLC\KUC_TECHNICAL SUPPORT DOCUMENT_REV5.DOCX 3-1
3.0 2005 Maintenance Plan Demonstration
In 2005, the State of Utah performed an attainment demonstration as part of the PM10 2005 Maintenance Plan. This plan was approved by the Utah Air Quality Board. Section IX.H.h of the maintenance plan lists the requirements for the BCM, one of which states:
Total material moved (ore and waste) shall not exceed 197,000,000 tons per 12 month period.
KUC is requesting that UDAQ initiate rulemaking through the Utah Air Quality Board to amend the 2005 Maintenance Plan to include a material movement limitation of 260,000,000 tpy (260 Mtpy).
3.1 Urban Airshed Model Modeling The EPA guidance on demonstrating attainment of air quality standards for PM (EPA, 2007) requires evaluation of time periods of elevated PM10 levels. For the 2005 demonstration, UDAQ applied the UAM-AERO photochemical model for a high PM10 period in the winter of 2002. The 2002 baseline simulation was developed to be representative of meteorological and emission conditions during a high ambient PM10 episode. The modeling was conducted for a period from February 1 to February 8, 2002. Subsequent to the 2002 analysis, UDAQ developed future year modeling scenarios that were used to demonstrate attainment of the PM10 NAAQS. The maintenance plan states that the area will continue to attain the PM10 NAAQS throughout the period of 10 years from the date of the anticipated EPA approval. Hence, UDAQ prepared projection inventories for the years 2005, 2008, 2011, 2015, and 2017.
In the UDAQ application of the UAM-AERO model, the PM10 concentrations were calculated by summing individual components. In the UDAQ analysis, and the present analysis, PM10 is computed as the sum of chlorine, elemental carbon, sodium, ammonium (NH4), nitrate, organic carbon (OC), direct particulate, and sulfate.
Guidance on the application of photochemical models (EPA, 2007) calls for the use of models in a relative rather than absolute sense, which means the model results from base and future year simulations are used to develop a scaling factor that is applied to observational data to determine attainment status. The model is applied in this way by calculating a relative response factor (RRF) for grid cells that are collocated with a PM10 monitor. A discussion of the development and application of RRFs can be found in UDAQ’s PM10 Maintenance Plan Modeling Protocol, Salt Lake County, Utah County & Ogden City (UDAQ, 2004), Section 7.2.
The UAM-AERO model represents the nonattainment area by dividing the entire area into individual grid cells. The individual grid cells represent an area of 4 kilometers by 4 kilometers. Some grid cells contain ambient monitors that were used, in the 2005 Maintenance Plan, to compare with the baseline model runs and provide evidence that the UAM-AERO model was giving satisfactory results. Relative response factors were derived for these monitoring locations and were applied for all future year scenarios including the

KUC BINGHAM CANYON MINE EXPANSION—TECHNICAL SUPPORT DOCUMENT
3-2 IS080310013347SLC\KUC_TECHNICAL SUPPORT DOCUMENT_REV5.DOCX
2011 and 2015 scenarios analyzed in this study. The RRFs were derived based on total PM10 concentrations only, but not for any of the individual components of PM10.
The RRFs used for the maintenance plan were obtained from UDAQ for the 2005 projection year and baseline year simulations for each of the grid cells containing a PM10 monitor (seven RRFs in total). Since the RRFs are only strictly defined for cells containing a monitor, estimates were necessary in order to properly assess the model bias that is included in the 2011 and 2015 UAM model results. In order to do this, it was assumed that all grid cells within two grid cells of a monitor would use the same RRF as that monitor as assumed in the 2005 SIP demonstration.
For example, the Cottonwood monitor cell is located at indices 21,28 and has an RRF of 0.94. All grid cells x index 19 to 23 and y index 26 to 30 were assigned an RRF of 0.94. If a grid cell was within the defined area of two monitors, the higher of the two RRFs was conservatively applied. If the cells were within Salt Lake County but not within two grid cells of either Magna, Cottonwood, Hawthorne, or North Salt Lake monitors, the cell was assigned an average of the RRFs within Salt Lake County (0.9125). If the cells were within Utah County, but not within two grid cells of either Lindon or North Provo, it was assigned an average of those two monitors (0.975). Finally, if a cell was not yet assigned based on any of the above criteria, it was assigned an overall model “bias” of 0.9628; the average of all 7 monitor RRFs.
A summary of the RRFs used in this study are presented below in Table 3-1.
TABLE 3-1 Relative Response Factors Used in Analysis
Monitor X index Y index RRF
Cottonwood a 21 28 0.94
Hawthorne a 20 31 0.85
Lindon a 23 20 0.94
Magna a 15 30 0.99
North Salt Lake a 19 33 0.87
North Provo a 24 17 1.01
Ogden a 18 44 1.14
Remainder of Salt Lake County b - - 0.9125
Remainder of Utah County c - - 0.975
Remaining Cells d - - 0.9628
NOTES: a Applied to all cells within 2 grid cells in all directions b Applied to all grid cells with Salt Lake County but not within two grid cells of the monitors residing in Salt Lake County (Magna, Cottonwood, Hawthorne, and North Salt Lake)
c Applied to all grid cells with Utah County but not within two grid cells of the monitors residing in Utah County (Lindon and North Provo)
d Applied to all remaining grid cells within the CALPUFF domain

KUC BINGHAM CANYON MINE EXPANSION—TECHNICAL SUPPORT DOCUMENT
IS080310013347SLC\KUC_TECHNICAL SUPPORT DOCUMENT_REV5.DOCX 3-3
Because many of the computer files necessary to perform the UAM-AERO modeling are not available, the use of the CALPUFF modeling system (CALPUFF) coupled with previous UAM-AERO simulations (2002 baseline case and the 2011 and 2015 projection year simulations) from the 2005 Maintenance Plan provides a sound basis for evaluating the effect of the material-moved increase at the BCM on the attainment demonstration. CALPUFF is well suited for this application as it handles light wind speed conditions found during inversion episodes, is well suited for use in complex terrain situations, and models multiple types of sources.
The 2011 and 2015 projection years were used for the analysis since it contained estimates of future emissions as a result of changes to traffic, industrial growth, population growth, and other factors that would influence future PM10 attainment. Additionally the 2011 and 2015 projection years correspond in time with KUC’s proposed production increase.
3.2 Emissions from Mine Expansion Table 3-2 lists the emissions expected from the increased material movement to 260 Mtpy from the BCM compared with what was modeled in the 2005 projection year analysis based on 197 Mtpy of material-moved limitation. The emission factors used for both inventories are consistent with each other. As previously noted, emission factors have changed over time, so the numbers in Table 3-2 are not directly comparable with the emissions used for the 1994 SIP demonstration or the Mine Notice of Intent (NOI), submitted August 17, 2010.
TABLE 3-2 Expected Emissions
Pollutant
BCM and Copperton 2005 Emission Inventory (tpy) (Used in the UAM-AERO
Modeling)
BCM and Copperton 260,000,000 tons
Material Moved PTE (tpy)
Difference (tpy)
PM10 2,817 3,185 +368
SO2 69 6 -63
NOx 5,078 7,442 +2,364
There is an overall increase in primary PM10 emissions of 368 tpy and a reduction in SO2 emissions of 63 tpy. Emissions of NOx will increase by 2,364 tpy due to increased tail pipe emissions from truck traffic along haul roads. Although the above methodology is consistent in estimating proposed emissions based on emissions factors from 2005, emissions estimates contained in the NOI represent current operations and best practice emissions estimation methodologies.
The NOI does not indicate the above increases. Using current emissions calculation methodologies, peak year annual emissions for the BCM, after the increase in the material moved, to 260,000,000 tons, are estimated to be 1,513 tpy of PM10, 6.56 tpy of SO2, 5,830 tpy

KUC BINGHAM CANYON MINE EXPANSION—TECHNICAL SUPPORT DOCUMENT
3-4 IS080310013347SLC\KUC_TECHNICAL SUPPORT DOCUMENT_REV5.DOCX
of NOx, 1,682 tpy of CO and 314 tpy of VOC [Refer to Section 4.0 of TSD]3. Current methodologies include estimating tailpipe emissions from haul trucks and support equipment using the EPA approved NONROAD model, which allows for estimating emissions based on the tier levels of engines in haul trucks and support equipment. Additionally, for emission sources located within the pit influence boundary, PM10 emissions are calculated taking into account a pit escape factor of 20 percent. The escape factor is based on Airflow Patterns and Pit-Retention of Fugitive Dust for the Bingham Canyon Mine, which predicts the escape fraction for different conditions at the BCM (Bhaskar and Tandon, 1996).
3.3 Method of Analysis 3.3.1 CALMET CALPUFF ready winds were supplied by UDAQ. The winds were derived from MM5 prognostic meteorological data, the Salt Lake City Airport upper air station, 12 surface stations throughout the domain, and 54 precipitation stations. Winds were created for January and February of 2002. The extent of the winds encompassed all but the northern-most part of the UAM grid. However, the winds do cover the non-attainment counties of Salt Lake and Utah, and were therefore sufficient for this analysis.
3.3.2 CALPUFF Analysis The most recent US EPA-approved version of CALPUFF was used for the modeling in this study (Version 5.8). CALPUFF is a multi-layer, multi-species, non-steady-state Gaussian puff dispersion model that can simulate the effects of time- and space-varying meteorological conditions on pollutant transport, transformation, and removal. CALPUFF can use the 3-dimensional meteorological fields developed by the CALMET model or simple, single station winds.
CALPUFF contains algorithms for near-source effects such as building downwash, transitional plume rise, partial plume penetration, and sub-grid scale terrain interactions, as well as longer range effects such as pollutant removal (wet scavenging and dry deposition), chemical transformation, vertical wind shear, over water transport, and coastal interaction effects. It can accommodate arbitrarily varying point sources and gridded area source emissions. Most of the algorithms contain options to treat the physical processes at different levels of detail depending on the model application. CALPUFF is well suited for this particular analysis due to the very low wind speeds that resulted due to the strong inversion episode of early February 2002. The model also accounts for plume meander, an algorithm that accounts for dispersion due to horizontal turbulence. CALPUFF is well suited to areas of complex terrain, such as that found in the Salt Lake City area. Finally, although not used in this study, CALPUFF is able to estimate the transformation rates of precursor gases to secondary particulates.
CALPUFF was used to estimate the expected increase in particulate matter concentrations as a result of the increased throughput rate from the BCM. The CALPUFF runs commenced for January 1, 2002 and ended February 10, 2002. The concentration data were extracted for the 3 The revision in the peak year emissions reflect changes requested from the NSR review. This change does not affect the current proposal before the Utah Air Quality Board to modify the 2005 SIP.

KUC BINGHAM CANYON MINE EXPANSION—TECHNICAL SUPPORT DOCUMENT
IS080310013347SLC\KUC_TECHNICAL SUPPORT DOCUMENT_REV5.DOCX 3-5
period February 2 through February 8 inclusive. The nitrate concentrations for the analysis assumed a very conservative 100% conversion from NOx. Therefore chemistry was not activated during the Calpuff model runs and nitrate concentrations for the receptors were assumed to be equal to the NOx concentrations. The conversion factor due to the difference in molecular weights between nitrogen oxides and ammonium nitrate is 2.53 assuming a 90 percent:10 percent NO to NO2 ratio for NOx emissions. Dry and wet deposition were included in the modeling since they are defaults in the model. All other model defaults were used except for MCHEM=0 (no chemistry included).
3.3.3 Receptor Grid A single receptor was placed in the center of all 33 by 56 UAM grid cells for a total of 1,848 receptors. The NAD83 UTM coordinate of receptor (1,1) is 350, 4390 km, zone 12 in the southwest and extends to receptor (33,56) or UTM coordinates 478, 4610 km zone 12 in the northeast. The Lambert Conformal coordinates (LCC) of the (1,1) cell center were at -163.852, 86.654 consistent with the LCC system as defined within the CALMET input file supplied by UDAQ. The receptors are spaced 4 km apart consistent with the dimensions of the UAM grid cells. Terrain data used to determine the elevation of the receptors were 3 arc-second data (~90 m resolution).
3.3.4 Source Emissions There were four area sources that encompass the entire modeled emissions. It should be noted that the UAM-AERO model also used larger area sources to represent all small point sources and mobile sources, similar to the level of detail and approach taken here. The AREA1 source dimensions and parameters were taken from the KUC AERMOD modeling and correspond to emissions from the mine cavity. In order to simplify hundreds of volume sources used to represent the haul roads in the AERMOD modeling, three area sources were developed to cover those emissions, MOBN, MOBE, and MOBS. Initial release height and vertical spread were taken from the AERMOD volume sources. Area source base elevation was estimated as an approximate average base elevation for each set of haul roads.
NOx is emitted primarily as tailpipe emissions (5078 tpy for the 197 Mtpy case and 7,450 tpy for the 260 Mtpy case) and therefore these were apportioned to the three area sources MOBN, MOBE, and MOBS in a proportion similar to the AERMOD modeling. Similar to the AERMOD modeling presented in the NOI, it was assumed that 78.2 percent of the mobile source emissions occurred within the mine cavity and 21.8 percent occurred outside the main pit. Of the 21.8 percent of the mobile emissions occurring outside the pit, 51 percent were apportioned to the north haul road area (MOBN), 34 percent to the east haul road area (MOBE) and 15 percent to the southeast haul road area (MOBS).
Primary PM10 is apportioned in a manner similar to the AERMOD modeling. It was assumed that 78 percent of the fugitive and mobile emissions occur within the mine cavity and the remaining 22 percent occur from the haul road areas. Of the 22 percent occurring outside the mine cavity, 51 percent is apportioned to the north haul road area, 34 percent to the east haul road area, and 15 percent to the southeast haul road area.
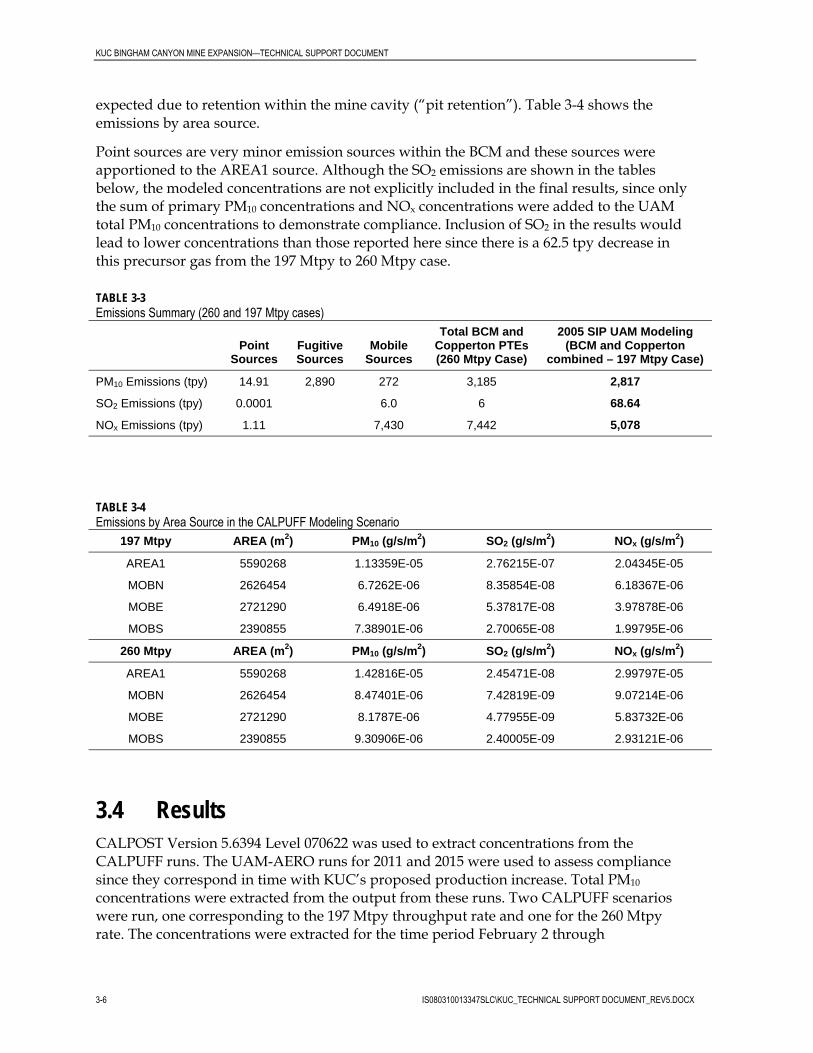
Table 3-3 shows the emissions associated with the 197 and 260 Mtpy throughput scenarios and the breakdown of point sources, fugitive sources, and mobile sources for the 260 Mtpy case. It should be noted that the emissions listed below do not include any reductions
KUC BINGHAM CANYON MINE EXPANSION—TECHNICAL SUPPORT DOCUMENT
3-6 IS080310013347SLC\KUC_TECHNICAL SUPPORT DOCUMENT_REV5.DOCX
expected due to retention within the mine cavity (“pit retention”). Table 3-4 shows the emissions by area source.
Point sources are very minor emission sources within the BCM and these sources were apportioned to the AREA1 source. Although the SO2 emissions are shown in the tables below, the modeled concentrations are not explicitly included in the final results, since only the sum of primary PM10 concentrations and NOx concentrations were added to the UAM total PM10 concentrations to demonstrate compliance. Inclusion of SO2 in the results would lead to lower concentrations than those reported here since there is a 62.5 tpy decrease in this precursor gas from the 197 Mtpy to 260 Mtpy case.
TABLE 3-3 Emissions Summary (260 and 197 Mtpy cases)
Point
Sources Fugitive Sources
Mobile Sources
Total BCM and Copperton PTEs (260 Mtpy Case)
2005 SIP UAM Modeling (BCM and Copperton
combined – 197 Mtpy Case)
PM10 Emissions (tpy) 14.91 2,890 272 3,185 2,817
SO2 Emissions (tpy) 0.0001 6.0 6 68.64
NOx Emissions (tpy) 1.11 7,430 7,442 5,078
TABLE 3-4 Emissions by Area Source in the CALPUFF Modeling Scenario
197 Mtpy AREA (m2) PM10 (g/s/m2) SO2 (g/s/m2) NOx (g/s/m2)
AREA1 5590268 1.13359E-05 2.76215E-07 2.04345E-05
MOBN 2626454 6.7262E-06 8.35854E-08 6.18367E-06
MOBE 2721290 6.4918E-06 5.37817E-08 3.97878E-06
MOBS 2390855 7.38901E-06 2.70065E-08 1.99795E-06
260 Mtpy AREA (m2) PM10 (g/s/m2) SO2 (g/s/m2) NOx (g/s/m2)
AREA1 5590268 1.42816E-05 2.45471E-08 2.99797E-05
MOBN 2626454 8.47401E-06 7.42819E-09 9.07214E-06
MOBE 2721290 8.1787E-06 4.77955E-09 5.83732E-06
MOBS 2390855 9.30906E-06 2.40005E-09 2.93121E-06
3.4 Results CALPOST Version 5.6394 Level 070622 was used to extract concentrations from the CALPUFF runs. The UAM-AERO runs for 2011 and 2015 were used to assess compliance since they correspond in time with KUC’s proposed production increase. Total PM10 concentrations were extracted from the output from these runs. Two CALPUFF scenarios were run, one corresponding to the 197 Mtpy throughput rate and one for the 260 Mtpy rate. The concentrations were extracted for the time period February 2 through

KUC BINGHAM CANYON MINE EXPANSION—TECHNICAL SUPPORT DOCUMENT
IS080310013347SLC\KUC_TECHNICAL SUPPORT DOCUMENT_REV5.DOCX 3-7
February 8, 2002 inclusive. For all receptors points, the sum of the NOx+PM10 concentrations was extracted for the 260 Mtpy and 197 Mtpy cases. NOx concentrations were converted to nitrates by multiplying by a factor of 2.53. The difference in concentration of these two scenarios at each receptor point is a conservative estimate of impacts from the increased throughput rate. This difference was added to the 2011 and 2015 UAM-predicted total PM10
concentrations at that grid cell to assess compliance.
The PM10 concentrations conservatively assumed a 100% conversion of nitrogen oxides (NOx) to the nitrates (a secondary particulate component). Therefore the chemistry and secondary particulate transformation rate options within CALPUFF were not used for this study. The following results do not include the non-ambient grid cells (14,25) and (14,26), which were defined within the 2005 Maintenance Plan as being predominately located on Kennecott property and where no public access was generally available.
Table 3-5 and 3-6 below summarize the maximum predicted PM10 concentration for all grid cells in the domain, the indices of the cell, and the predicted increase at that cell as a result of the increased throughput rate for the years 2011 and 2015. The maximum concentrations shown below include the effect from the increased BCM throughput. The concentrations are 24-hour averages.
TABLE 3-5 Summary of 2011 Projection Year Analysis
Simulation Day Grid X Grid Y Maximum Total PM10
(µg/m3)
Difference (260 vs 197 MMTPY Cases) (µg/m3)
Day 33 13 30 110.15 0.81
Day 34 13 30 119.17 0.63
Day 35 13 30 126.73 0.28
Day 36 13 30 132.75 0.23
Day 37 23 19 138.59 1.87
Day 38 13 30 147.20 8.18
Day 39 19 42 96.08 0.46
TABLE 3-6 Summary of 2015 Projection Year Analysis
Simulation Day Grid X Grid Y Maximum Total PM10
(µg/m3)
Difference (260 vs 197 MMTPY Cases) (µg/m3)
Day 33 13 30 110.86 0.81
Day 34 13 30 119.98 0.63
Day 35 13 30 127.78 0.28
Day 36 13 30 133.98 0.23
Day 37 23 19 142.31 1.87
Day 38 13 30 148.68 8.18
Day 39 19 43 99.50 0.44

KUC BINGHAM CANYON MINE EXPANSION—TECHNICAL SUPPORT DOCUMENT
3-8 IS080310013347SLC\KUC_TECHNICAL SUPPORT DOCUMENT_REV5.DOCX
TABLE 3-6 Summary of 2015 Projection Year Analysis
Simulation Day Grid X Grid Y Maximum Total PM10
(µg/m3)
Difference (260 vs 197 MMTPY Cases) (µg/m3)
Figure 3-1 shows the difference in the 260 Mtpy and 197 Mtpy scenarios (Day 38) for the region near the BCM and Salt Lake City; the area and day that the UAM model predicts the highest PM10 concentrations. Both the UTM coordinates and indices for the grid cells are shown on the Figure. As expected, the largest differences between the two scenarios are found in close proximity to the mine. The difference between the two scenarios decreases rapidly with distance and there is a difference of approximately 3-10 µg/m3 in the area of Salt Lake City.
FIGURE 3-1 Difference in 260 and 197 Mtpy CALPUFF scenarios (μg/m3) – Day 38

KUC BINGHAM CANYON MINE EXPANSION—TECHNICAL SUPPORT DOCUMENT
IS080310013347SLC\KUC_TECHNICAL SUPPORT DOCUMENT_REV5.DOCX 3-9
To determine the cumulative effect of the increase in production at BCM, the incremental increase predicted using the CALPUFF model was added to the ambient concentration predicted by UDAQ using the UAM model. The 24-hour average total isopleths were developed for the maximum impact day. Figure 3-2 shows the 24-hour average PM10 concentration for day 38 for the projection year 2011 and Figure 3-3 shows the 24-hour PM10 concentrations for day 38 for the year 2015. All cumulative values are below the 150 µg/m3 PM10 NAAQS.
FIGURE 3-2 24-hour PM10 concentrations for projection year 2011 (μg/m3) – Day 38

KUC BINGHAM CANYON MINE EXPANSION—TECHNICAL SUPPORT DOCUMENT
3-10 IS080310013347SLC\KUC_TECHNICAL SUPPORT DOCUMENT_REV5.DOCX
FIGURE 3-3 24-hour PM10 concentrations for projection year 2015 (μg/m3) – Day 38
3.5 Summary CALPUFF was used to estimate the effects of increased PM10 and NOx emissions from the Bingham Canyon Mine as a result of increased throughput from the currently permitted 197 Mtpy to the proposed 260 Mtpy. It was conservatively assumed that 100 percent of NOx emissions were converted to nitrates at all grid cells. In order to demonstrate continued compliance with the State of Utah’s 2005 PM10 Maintenance Plan, the difference in the CALPUFF-modeled concentrations for PM10 and nitrates (260 Mtpy versus 197 Mtpy) was added to the UAM predicted results for the 2011 and 2015 runs. The maximum predicted total PM10 concentration was 148.68µg/m3, which occurred at a grid cell west-northwest of the Bingham Canyon Mine on day 38 for projection year 2015. The effect on concentrations due to the increased throughput rate over the Salt Lake City area is expected to be no more than approximately 8 µg/m3, based on a conservative 100% NOx to nitrate conversion.

IS080310013347SLC\KUC_TECHNICAL SUPPORT DOCUMENT_REV5.DOCX 4-1
4.0 Emissions Summary
This section provides a summary of emissions resulting from the increase in the annual movement of ore and waste rock material at the BCM. Please refer to Section 3.0 of the NOI submitted on August 17, 2010 for details on the emission calculation methodology and assumptions for individual emission sources.
To estimate emissions after the proposed increase in annual material movement, for emission sources located within the pit influence boundary, PM10 emissions are calculated taking into account a pit escape factor of 20 percent. The escape factor is based on Airflow Patterns and Pit-Retention of Fugitive Dust for the Bingham Canyon Mine, which predicts the escape fraction for various conditions at the BCM (Bhaskar and Tandon, 1996).
Tailpipe emissions from the haultrucks and support equipment are estimated using the NONROAD program as recommended by UDAQ. Emissions are estimated based on the EPA tier level of haultruck and support equipment engines and their annual hours of operation.
Emissions from the existing mobile and stationary equipment have been recalculated to maintain consistent methodology using the most current emission factors to provide an accurate estimate of emissions.
4.1 Emissions from Point Sources The existing in-pit ore crusher ventilation system is designed to handle 12,898 dscfm and operate 8,760 hours per year and is equipped with a baghouse for particulate control. The permitted grain loading for this baghouse is 0.016 gr/dscf. The existing in-pit crusher is located within the pit influence boundary; therefore, emissions are calculated with the pit escape factor. The pit escape factor represents the portion of the particulates not settling in the pit.
As part of this proposed modification, KUC will install a second in-pit ore crusher. The new in-pit ore crusher ventilation system will be designed to handle approximately 12,898 dscfm and operate 8,760 hours per year and will be equipped with a baghouse for particulate control. KUC is proposing a grain loading of 0.007 gr/dscf for the new baghouse. The second in-pit crusher will be located within the pit influence boundary; therefore, emissions are calculated with the pit escape factor. The pit escape factor represents the portion of the particulates not settling in the pit.
The ventilation system for transfer drop point C6/C7 is designed to handle 5,120 dscfm. The ventilation system for transfer drop point C7/C8 is designed to handle 3,168 dscfm. Both drop points operate 8,760 hours per year and are equipped with baghouses for particulate control. KUC is proposing to reduce the grain loading from 0.016 to 0.007 gr/dscf. Operations of the baghouses will not otherwise be affected by this proposed change in grain loading factor.

KUC BINGHAM CANYON MINE EXPANSION—TECHNICAL SUPPORT DOCUMENT
4-2 IS080310013347SLC\KUC_TECHNICAL SUPPORT DOCUMENT_REV5.DOCX
Both lime silos are designed to handle 616 dscfm and operate 8,760 hours per year and are equipped with fabric bin vent control units. The permitted grain loading for the fabric bin vent control units is 0.016 gr/dscf.
The sample preparation building is designed to handle 4,269 dscfm and operate 8 hours per day for a total of 2,920 hours per year and is equipped with a baghouse for particulate control. The permitted grain loading for the baghouse is 0.016 gr/dscf. The sample preparation building is located within the pit influence boundary; therefore, emissions are calculated with the pit escape factor. The pit escape factor represents the portion of the particulates not settling in the pit.
Table 4-1 summarizes the emissions after the proposed material-moved increase (future emissions) for point sources. This Table also summarizes emissions for point sources as modeled in the 2005 SIP.
TABLE 4-1 Proposed Emissions from Point Sources Controlled by Baghouses
BCM Point Sources PM10 Emissions
(tpy)
Peak Year Emissions for 260,000,000 tpy annual material movement* 6.28
Emissions used in 2005 SIP Modeling 14.32
1994 SIP Modeled Emissions using 1999 emission factors 10.42
*Emissions include 0.96 tons of sulfuric acid mist as PM10 from electrowinning process (see Table 4-12 for details).
4.2 Emissions from Fugitive Sources 4.2.1 Drilling and Blasting With the proposed modification, the BCM will drill approximately 90,000 holes each year. The drilling is performed with water injection to control PM10 emissions with an efficiency of 90 percent historically. The BCM will conduct approximately 1,100 blasts each year, with an area of 57,500 square feet per average blast. For drilling operations, PM10 emissions were derived from the total PM emission factors estimated using methodology from the EPA’s AP-42, Fifth Edition, Table 11.9-4 (EPA, 1998) and ratio of transfer particle size multipliers in AP-42, Fifth Edition, Table 13.2.4 (EPA, 2006). For blasting operations, PM10 emissions were estimated using emission factors from EPA’s AP-42, Fifth Edition, Table 11.9-1 (EPA, 1998). Both drilling and blasting operations occur within the pit influence boundary; therefore, emissions are calculated with the pit escape factor. The pit escape factor represents the portion of the particulates not settling in the pit. Emissions from drilling and blasting are summarized in Table 4-2. The Table also summarizes emissions as modeled in the 2005 SIP.

KUC BINGHAM CANYON MINE EXPANSION—TECHNICAL SUPPORT DOCUMENT
IS080310013347SLC\KUC_TECHNICAL SUPPORT DOCUMENT_REV5.DOCX 4-3
TABLE 4-2 Emissions from Drilling and Blasting Operations
PM10 Emissions
(tpy)
Peak Year Emissions for 260,000,000 tpy annual material movement 11.59
Emissions used in 2005 SIP Modeling 57.31
1994 SIP Modeled Emissions using 1999 emission factors 37.54
4.2.2 Material Movement With the increase in material movement, 260,000,000 tpy of ore and waste rock combined will be loaded onto haultrucks and later transferred to different locations within the mine. Water is applied to loading and haulage surfaces year-round in accordance with the Fugitive Dust Control Plan. Additionally, characteristics of the material, such as large diameter material, inherent material moisture content, and enclosures, where appropriate, minimize fugitive dust emissions. Emissions of PM10 resulting from the transfer of material are estimated using methodology from EPA’s AP-42, Fifth Edition, Section 13.2.4 (EPA, 2006). For emission sources located within the pit influence boundary, emissions are calculated with the pit escape factor. The pit escape factor represents the portion of the particulates not settling in the pit. Emissions for the transfer sources at the BCM as discussed in the NOI are summarized in Table 4-3. This Table also summarizes emissions as modeled in the 2005 SIP.
TABLE 4-3 Emissions from Ore and Waste Rock Transfers
PM10 Emissions
(tpy)
Peak Year Emissions for 260,000,000 tpy annual material movement 73.7
Emissions used in 2005 SIP Modeling 63.94
1994 SIP Modeled Emissions using 1999 emission factors 48.77
4.2.3 Low-grade Ore Stockpile A low-grade ore stockpile is used at the BCM. Emissions of PM10 are estimated using methodology from the EPA’s AP-42, Fifth Edition, Section 11.9.1 (EPA, 1998). Based on ratio of transfer particle size multipliers in AP-42, Fifth Edition, Table 13.2.4 (EPA, 2006), emissions of PM10 are assumed to be 47 percent of PM emissions. Characteristics of the ore material, such as large diameter material, and inherent material moisture content of 4 percent, limit dust being generated during the transfer operations. Water application from passing water trucks is used to further reduce emissions. The stockpile is located within the pit influence boundary; therefore, emissions are calculated with the pit escape factor. The pit escape factor represents the portion of the particulates not settling in the pit. Emissions from the stockpile are summarized in Table 4-4. Table 4-4 also summarizes emissions as modeled in

KUC BINGHAM CANYON MINE EXPANSION—TECHNICAL SUPPORT DOCUMENT
4-4 IS080310013347SLC\KUC_TECHNICAL SUPPORT DOCUMENT_REV5.DOCX
the 2005 SIP. Inherent material characteristics and mechanical compaction of the pile minimizes fugitive emissions.
TABLE 4-4 Emissions from Ore Stockpile
PM10 Emissions
(tpy)
Peak Year Emissions for 260,000,000 tpy annual material movement 2.09
Emissions used in 2005 SIP Modeling 0.08
1994 SIP Modeled Emissions using 1999 emission factors 0.08
4.2.4 Disturbed Areas As a result of increased annual material movement to 260,000,000 tons of ore and waste rock, approximately 567 acres are anticipated to be disturbed within a year. Emissions of PM10 were derived from the total PM emission factors estimated using methodology from the EPA’s AP-42, Fifth Edition, Table 11.9-4 (EPA, 1998) and ratio of transfer particle size multipliers in AP-42, Fifth Edition, Table 13.2.4 (EPA, 2006). Acres of disturbed area are located within and outside the pit influence boundary. The pit escape factor is applied to those emissions from acres located within the pit influence boundary. The pit escape factor represents the portion of the particulates not settling in the pit. Emissions are summarized in Table 4-5. This table also summarizes emissions as modeled in the 2005 SIP.
TABLE 4-5 Emissions from Disturbed Areas
PM10 Emissions
(tpy)
Peak Year Emissions for 260,000,000 tpy annual material movement 40.6
Emissions used in 2005 SIP Modeling 170
1994 SIP Modeled Emissions using 1999 emission factors 170
4.2.5 Haulroads and Haultruck Emissions Unpaved haulroads are used by haultrucks to transport the waste rock and ore from the mining areas to waste rock disposal areas, low-grade ore stockpile, or the in-pit crusher. The haulroads on which the haultrucks travel will be sprayed with water or commercial dust suppressants to control fugitive dust emissions throughout the year. Emissions of PM10 were estimated using methodology from EPA’s AP-42, Fifth Edition, Section 13.2.2 (EPA, 2006). For the portion of haulroads located within the pit influence boundary, emissions are calculated with the pit escape factor. The pit escape factor represents the portion of the particulates not settling in the pit.

KUC BINGHAM CANYON MINE EXPANSION—TECHNICAL SUPPORT DOCUMENT
IS080310013347SLC\KUC_TECHNICAL SUPPORT DOCUMENT_REV5.DOCX 4-5
Projected peak year emissions for the haulroads both within and outside the pit influence boundary are summarized in Table 4-6. Per UDAQ policy, for haulroads within the pit influence boundary, a control efficiency of 75 percent is used for watering and road base application. For haulroads outside the pit influence boundary, a control efficiency of 85 percent is used for application of chemical dust suppressants. KUC believes that control efficiency on the haulroads with frequent watering per AP-42, Fifth Edition, Section 13.2.2 (EPA, 2006) approaches 95 percent, but emissions summarized herein are based on UDAQ’s default control factors, which are conservative.
It should be noted that open pit mine planning occurs in phases where relatively large tonnages of waste rock must be stripped early in a phase so that ore can be accessed in later years. The projections indicated in this NOI represent a high level of activity early in the mine plan phase. As activity reduces with time, the stripping ratio is reduced.
The Table 4-6 also summarizes emissions for haulroads as modeled in the 2005 SIP.
TABLE 4-6 Fugitive Emissions from Haulroads
Future PM10 Emissions
(tpy)
Peak Year Emissions for 260,000,000 tpy annual material movement 1,054
Emissions used in 2005 SIP Modeling 1,576
1994 SIP Modeled Emissions using 1999 emission factors 584
Tailpipe emissions from the haultrucks are estimated using the NONROAD program as recommended by UDAQ. Emissions are estimated based on the EPA tier level of haultruck engines and the annual hours of operation for the haultrucks. Maximum PTE tailpipe emissions from the trucks hauling ore and waste rocks are summarized in Table 4-7. Table 4-7 also summarizes emissions as modeled in the 2005 SIP.
Also, KUC periodically upgrades its haultruck fleet to take advantage of available higher-tier-level, lower-emitting engines. As noted in Appendix A of the NOI application, tailpipe emissions from haultrucks are expected to decrease as new higher-tier-level trucks are phased into the BCM fleet.
TABLE 4-7 Tailpipe Emissions from Haultrucks
Pollutant
NOx Emissions
(tpy)
CO Emissions
(tpy)
PM10 Emissions
(tpy)
SO2 Emissions
(tpy)
VOC Emissions
(tpy)
Peak Year Emissions for 260,000,000 tpy annual material movement
5,134 1,400 191 5.78 259
Emissions used in 2005 SIP Modeling 5,060 2,111 331 97 463
1994 SIP Modeled Emissions using 1999 emission factors
5,060 2,111 331 97 463

KUC BINGHAM CANYON MINE EXPANSION—TECHNICAL SUPPORT DOCUMENT
4-6 IS080310013347SLC\KUC_TECHNICAL SUPPORT DOCUMENT_REV5.DOCX
4.2.6 Road-base Crushing and Screening Plant The BCM has a semiportable plant that crushes and screens waste rock for use as base material on the unpaved haulroads. Application of specification road base on haulroads improves and enhances effectiveness of the fugitive control measures at the BCM. Fugitive emissions from the crushing, screening, and transfer (10 transfer points) operations are effectively controlled with water sprays and belt enclosures. The crushing/screening plant has a capacity of 700 tons per hour and operates no more than 4,500 hours per year, resulting in a maximum annual material throughput of 3,150,000 tpy. For each of these sources of fugitive dust, PM10 emissions were estimated using emission factors from EPA’s AP-42, Fifth Edition, Table 11.19.2-2 (EPA, 2004). Emissions from each of these sources are summarized in Table 4-8. Since the emission source is located within the pit influence boundary, emissions are calculated with the pit escape factor. The pit escape factor represents the portion of the particulates not settling in the pit. The road base crushing and screening plant was installed at the BCM after 2005, therefore emissions from this source were not included in the inventories modeled in the 1994 and 2005 SIP.
TABLE 4-8 Emissions from Road-base Crushing and Screening Plant
Source PM10 Emissions
(tpy)
Peak Year Emissions for 260,000,000 tpy annual material movement 0.55
Emissions used in 2005 SIP Modeling N/A
1994 SIP Modeled Emissions using 1999 emission factors N/A
4.3 Sources with VOC Emissions 4.3.1 Maintenance Degreasing Based on KUC records, approximately 500 gallons of cold solvent are used annually for maintenance degreasing. As a conservative estimate, it is assumed that the cold solvent has a VOC content of 100 percent. The VOC emissions resulting from maintenance degreasing were estimated based on the solvent properties and a material balance. No escape factor was applied to these emission sources. Emissions from degreasers are summarized in Table 4-9. This table also summarizes emissions as modeled in the 2005 SIP.
TABLE 4-9 Emissions from Maintenance Degreasers
Emission Source VOC Emissions
(tpy)
Peak Year Emissions for 260,000,000 tpy annual material movement 1.69
Emissions used in 2005 SIP Modeling 1.50
1994 SIP Modeled Emissions using 1999 emission factors 1.50

KUC BINGHAM CANYON MINE EXPANSION—TECHNICAL SUPPORT DOCUMENT
IS080310013347SLC\KUC_TECHNICAL SUPPORT DOCUMENT_REV5.DOCX 4-7
4.3.2 Fueling Stations Gasoline and diesel use at the fueling stations after the proposed modification will be approximately 530,000 gallons of gasoline and approximately 55,000,000 gallons of diesel fuel during a peak year. The VOC emissions for the gasoline fueling stations are estimated using emission factors from EPA’s AP-42, Fifth Edition, Table 5.2-7 (EPA, 2008). Volatile organic compound emissions from diesel fueling stations are estimated using emission factors from Colorado Department of Public Health and Environment’s guidance on Gasoline and Diesel Fuel Dispensing Stations in the absence of an applicable AP-42 emission factor. No escape factor was applied to these emission sources. Volatile organic compound emissions from the fueling stations are summarized in Table 4-10. Table 4-10 also summarizes emissions as modeled in the 2005 SIPs.
TABLE 4-10 Emissions from Fueling Stations
Emission Source VOC Emissions
(tpy)
Peak Year Emissions for 260,000,000 tpy annual material movement 4.24
Emissions used in 2005 SIP Modeling 2.60
1994 SIP Modeled Emissions using 1999 emission factors 2.60
4.3.3 Solvent Extraction/Electrowinning Plant The mixers and settlers of the SX/EW plant will have a combined total surface area of 1,100 square feet. Both will operate a maximum of 8,760 hours per year, have a pan rate of 0.00142 foot per 24 hours, and have covers to control VOC emissions with an efficiency of 80 percent. The BCM will have four organic surge and holding tanks with a combined total volume of 12,000 gallons. The tanks will be covered to control VOC emissions. Volatile organic compound emissions from the tanks were estimated using a volume ratio of the pilot plant emissions to the expanded plant emissions; pilot plant emissions were taken from a previous emission inventory. The raffinate and electrolyte circuits will have a combined average flow rate of 650 gpm and operate a maximum of 8,760 hours per year. Volatile organic compound emissions from the circuits were estimated with an assumption that up to 33 percent of the residual organic in the circuits is released to the atmosphere by evaporation or biodegradation. Volatile organic compound emissions from the SX/EW plant are summarized in Table 4-11. The PTE from this source will not change as a result of this modification. The solvent extraction/electrowinning plant was installed at the BCM after 2005, therefore emissions from this source were not included in the inventories modeled in the 1994 and 2005 SIP.
TABLE 4-11 Emissions from the Solvent Extraction/Electrowinning Plant
Plant Operation Future VOC Emissions
(tpy)
Mixer/Settlers 2.92
Aqueous Flows 2.38
Tanks 0.07

KUC BINGHAM CANYON MINE EXPANSION—TECHNICAL SUPPORT DOCUMENT
4-8 IS080310013347SLC\KUC_TECHNICAL SUPPORT DOCUMENT_REV5.DOCX
The electrowinning acid mist eliminator at the SX/EW plant is designed to handle 6,547 dscfm and operate 8,760 hours per year. The sulfuric acid (H2SO4) emissions are estimated with the assumption that the exhaust gas has an H2SO4 concentration of 0.004 gr/dscf. Sulfuric acid emissions from the mist eliminator are summarized in Table 4-12. The solvent extraction/electrowinning plant was installed at the BCM after 2005, therefore emissions from this source were not included in the inventories modeled in the 1994 and 2005 SIP.
TABLE 4-12 Emissions from the Electrowinning Acid Mist Eliminator
Emission Source Future H2SO4 Emissions as PM10
(tpy)
Electrowinning Acid Mist Eliminator 0.96
4.4 Support Equipment 4.4.1 Track Dozers, Rubber Tire Dozers, Graders, and Loaders To support the proposed modification, the BCM will operate front-end loaders, graders, track dozers, and rubber-tire dozers. Fugitive emissions of PM10 were estimated using emission factors from EPA’s AP-42, Fifth Edition, Table 11.9-1 (EPA, 1998). Emissions from each of these sources are summarized in Table 4-13. This table also summarizes emissions as modeled in the 2005 SIP.
TABLE 4-13 Fugitive Emissions from Support Equipment
Source Future PM10 Emissions
(tpy)
Peak Year Emissions for 260,000,000 tpy annual material movement 97.1
Emissions used in 2005 SIP Modeling 342
1994 SIP Modeled Emissions using 1999 emission factors 452
Tailpipe emissions from the support equipment are estimated using the NONROAD program. Emissions are estimated based on the EPA tier level of support equipment engines and the annual hours of operation for the equipment. Maximum peak year tailpipe PTE emissions from the support equipment are summarized in Table 4-14. The 1994 and 2005 SIPs did not distinguish tailpipe emissions between support equipment and haultrucks as emissions were calculated based on fuel consumption and tier levels of engines.

KUC BINGHAM CANYON MINE EXPANSION—TECHNICAL SUPPORT DOCUMENT
IS080310013347SLC\KUC_TECHNICAL SUPPORT DOCUMENT_REV5.DOCX 4-9
TABLE 4-14 Projected Tailpipe Emissions from Support Equipment
Pollutant Future Emissions
(tpy)
PM10 36
PM2.5 35
SO2 0.78
NOX 695
CO 272
VOC 43
NOTE: Emissions shown are for a peak year annual material movement of 260,000,000 tpy.
4.5 Miscellaneous Emissions Sources 4.5.1 Emergency Generators Four emergency generators, located at the mine, are fueled with Liquefied Petroleum Gas and have varying horsepower ratings. Each of the emergency generators is permitted to operate no more than 500 hours per year. Actual hours of operation are expected to be limited to maintenance and testing activities (UDAQ, 2008). Carbon monoxide (CO), NOx, and total hydrocarbon (HC) emissions are based on manufacturer data. Volatile organic compound emissions are considered a subset of the total HC emissions. Sulfur dioxide and PM10 emissions were estimated using emission factors from the EPA’s AP-42, Fifth Edition, Table 3.2-3 (EPA, 2000), assuming a four-stroke, rich-burn, natural-gas–fueled engine. Emissions from the emergency generators are summarized in Table 4-15. The emergency generators were installed at the BCM after 2005, therefore emissions from these sources were not included in the inventories modeled in the 1994 and 2005 SIP.
TABLE 4-15 Emissions from Emergency Generators
Generator Location
Emissions (tpy)
PM10 SO2 NOx CO Total HC
Production Control Building 0.0006 0.00004 0.347 1.557 0.058
Mine Office 0.0005 0.00003 0.285 1.115 0.042
Lark Gate 0.0010 0.00003 0.214 6.476 0.058
Galena Gulch 0.0004 0.00003 0.266 1.246 0.040
Dinkeyville Hill 0.0004 0.0001 0.054 0.212 0.010

KUC BINGHAM CANYON MINE EXPANSION—TECHNICAL SUPPORT DOCUMENT
4-10 IS080310013347SLC\KUC_TECHNICAL SUPPORT DOCUMENT_REV5.DOCX
4.6 Emissions Comparison 4.6.1 Total Emissions Using Updated Factors For comparison purposes, the emissions using updated factors are presented below for the 1994 SIP material moved limit, the 2005 Maintenance Plan 197,000,000 tpy material moved limit and for the proposed peak year material moved throughput of 260,000,000 tpy. The summarized emissions below for the proposed peak year throughput are included in the NOI application submitted on August 17, 2010 and subsequent updates. The emissions for the previous planning years will not necessarily match the emissions used in the previous modeling demonstrations because the emission factors used in the modeling demonstrations were the same emission factors used for the original modeling. The emissions calculated for previous years for this summary were calculated using the most current emission factors.
TABLE 4-16 Emissions Comparison Using The Same Emission Factors
Generator Location
Emissions (tpy)
PM10 SO2 NOx CO VOC
Peak Year Emissions for 260,000,000 tpy annual material movement
1,513 6.6 5,830 1,682 314
Emissions used in 2005 SIP Modeling 2,554 97 5,060 2,111 467
1994 SIP Modeled Emissions using 1999 emission factors
1,634 97 5,060 2,111 467

IS080310013347SLC\KUC_TECHNICAL SUPPORT DOCUMENT_REV5.DOCX 5-1
5.0 Conclusion
In support of KUC’s proposal to increase the ore and waste rock movement limitation at the BCM from the currently authorized level of 197,000,000 tpy of material moved to 260,000,000 tpy, KUC has analyzed the attainment demonstrations that formed the bases for the 1994 SIP and 2005 Maintenance Plan, respectively. The following analyses were performed:
An analysis based on the 1994 SIP demonstration methodology was used to support the modification of the 1994 SIP from the 150,500,000 tpy originally modeled to a material movement limitation of 260,000,000 tpy. This demonstration has been made using emission factors from the 1994 SIP analysis. To offset the emissions increase associated with the mine expansion, 5,485 tons of banked stack level SO2 emission credits will be relinquished in addition to the 1,105 tons of banked PM10 and SO2 credits already relinquished in 1999. The analysis shows that the increase in the material-moved limitation is consistent with and satisfies the 1994 attainment and maintenance demonstration.
An analysis based on the UAM-AERO model was used to support the modification of the PM10 2005 Maintenance Plan. This demonstration has been made using emission factors from the PM10 2005 Maintenance Plan. The analysis shows that increases to the UAM-AERO–modeled NOx and primary PM10 will not cause a grid cell to exceed the total PM10 NAAQS of 150 µg/m3.

KUC BINGHAM CANYON MINE EXPANSION—TECHNICAL SUPPORT DOCUMENT
5-2 IS080310013347SLC\KUC_TECHNICAL SUPPORT DOCUMENT_REV5.DOCX
THIS PAGE INTENTIONALLY LEFT BLANK

IS080310013347SLC\KUC_TECHNICAL SUPPORT DOCUMENT_REV5.DOCX 6-1
6.0 References
U.S. Environmental Protection Agency (EPA). 2007. Guidance on the Use of Models and Other Analyses for Demonstrating Attainment of the Air Quality Goals for Ozone, PM2.5, and Regional Haze. EPA-454/B-07-002. April.
U.S. Environmental Protection Agency (EPA). 2010. Technology Transfer Network Support Center for Regulatory Atmospheric Modeling, Preferred/Recommended Model, CALPUFF Modeling System. Accessed November 26, 2010. http://www.epa.gov/scram001/dispersion_prefrec.htm#calpuff. Last updated Wednesday, November 24, 2010.
Utah Division of Air Quality (UDAQ). 1994. Utah PM10 State Implementation Plan for Salt Lake County. Section IX.A.10 and Technical Support Document. Adopted by the Utah State Air Quality Board.
Utah Division of Air Quality (UDAQ). 2004. PM10 Maintenance Plan Modeling Protocol, Salt Lake County, Utah County & Ogden City. July 21.
Utah Division of Air Quality (UDAQ). 2005. Utah PM10 Maintenance Provisions for Salt Lake County. Section IX.A.10 and Technical Support Document. Adopted by the Utah State Air Quality Board. July 6.
Utah Division of Air Quality (UDAQ). 2009. “R307” Utah Administrative Code. http://www.airquality.utah.gov/Planning/Rules/index.htm.
Kumar, N. and F.W. Lurmann. 1995. Users Guide to the UAM-AERO Model. STI-93110-1600-UG. Prepared for the California Air Resources Board by Sonoma Technology Inc. Santa Rosa, CA.

KUC BINGHAM CANYON MINE EXPANSION—TECHNICAL SUPPORT DOCUMENT
6-2 IS080310013347SLC\KUC_TECHNICAL SUPPORT DOCUMENT_REV5.DOCX
THIS PAGE INTENTIONALLY LEFT BLANK

APPENDIX A
Emissions Summary


APPENDIX A-1
Emissions for CMB Modeling


Tables TitlesA1-1 Emissions Summary (260 MM case)A1-2 In-pit CrusherA1-3 New In-pit CrusherA1-4 C6/C7 Conveyor Transfer PointA1-5 C7/C8 Conveyor Transfer PointA1-6 Lime BinA1-7 Lime BinA1-8 Sample PreparationA1-9 Gasoline and Diesel Fueling
A1-10 Truck Offloading Ore at In-pit CrusherA1-36 (New Sheet Added) Truck Offloading Ore at In-pit Crusher (Additional drop point at the new crusher)A1-37 (New Sheet Added) Truck Offloading Ore at Stockpile
A1-11 In-pit Enclosed Transfer Points 1, 2, and 3A1-12 New In-pit Enclosed Transfer Points 1, 2, and 3
A1-38 (New Sheet Added)In-pit Enclosed Transfer Point 4 and 5 (proposed new transfer point with the relocation of the existing in-pit crusher)
A1-13 Conveyor-stacker Transfer PointA1-14 Coarse Ore StackerA1-15 Reclaim TunnelsA1-16 Disturbed AreasA1-17 Cold Solvent Degreasing PartsA1-18 Haul RoadsA1-19 Low-grade Coarse Ore Storage PilesA1-20 Front-end LoadersA1-21 Truck LoadingA1-22 Truck Offloading of Waste RockA1-23 GradersA1-24 Bulldozers (Track Dozers)A1-25 Wheeled DozersA1-26 Drilling with Water InjectionA1-27 Blasting with Minimized AreaA1-28 Tertiary CrushingA1-29 ScreeningA1-30 Transfer PointsA1-31 SX/EW Copper ExtractionA1-32 ElectrowinningA1-33 LP GeneratorsA1-34 Mobile SourcesA1-35 Emissions Summary
APPENDIX A-1 INDEX
IS080310013347SLC\App_A-1_Emissions_Workbook_CMB_Model_Final_edited_CDK_MBP_20110119.xls PAGE 1 OF 42

APPENDIX A-1 INDEX
Units Definitions°C degree Celsius
acfm actual cubic feet per minutebhp brake horsepowerdcf dry cubic feetdscf dry standard cubic feet
dscfm dry standard cubic feet per minute
ft2 square feetgal Gallon
gpm gallon per minutegr grainhr hour
kW kilowattlb pound
mg milligrammg/L milligram per litermin minute
mmBtu million British thermal unitsmph mile per hourppm part per milliontpy ton per yearyr year
Acronyms DefinitionsAEI Air Emissions InventoryAO Approval Order
BCM Bingham Canyon MineCDPHE Colorado Department of Public Health and Environment
CMB Chemical Mass BalanceCO carbon monoxideEPA U.S. Environmental Protection Agency
H2SO4 sulfuric acid
HC hydrocarbonID Identification
KUC Kennecott Utah Copper LLCLP liquefied petroleum
MSDS material safety data sheetMSL mean sea levelNOI Notice of IntentNOx nitrogen oxides
PM particulate matterPM10 particulate matter less than 10 micrometers in aerodynamic diameter
PM2.5 particulate matter less than 2.5 micrometers in aerodynamic diameter
PTE potential to emitSIP State Implementation PlanSO2 sulfur dioxide
SOx sulfur oxides
SX/EW solvent extraction/electrowinningUDAQ Utah Division of Air QualityVMT vehicle miles traveledVOC volatile organic compound
IS080310013347SLC\App_A-1_Emissions_Workbook_CMB_Model_Final_edited_CDK_MBP_20110119.xls PAGE 2 OF 42
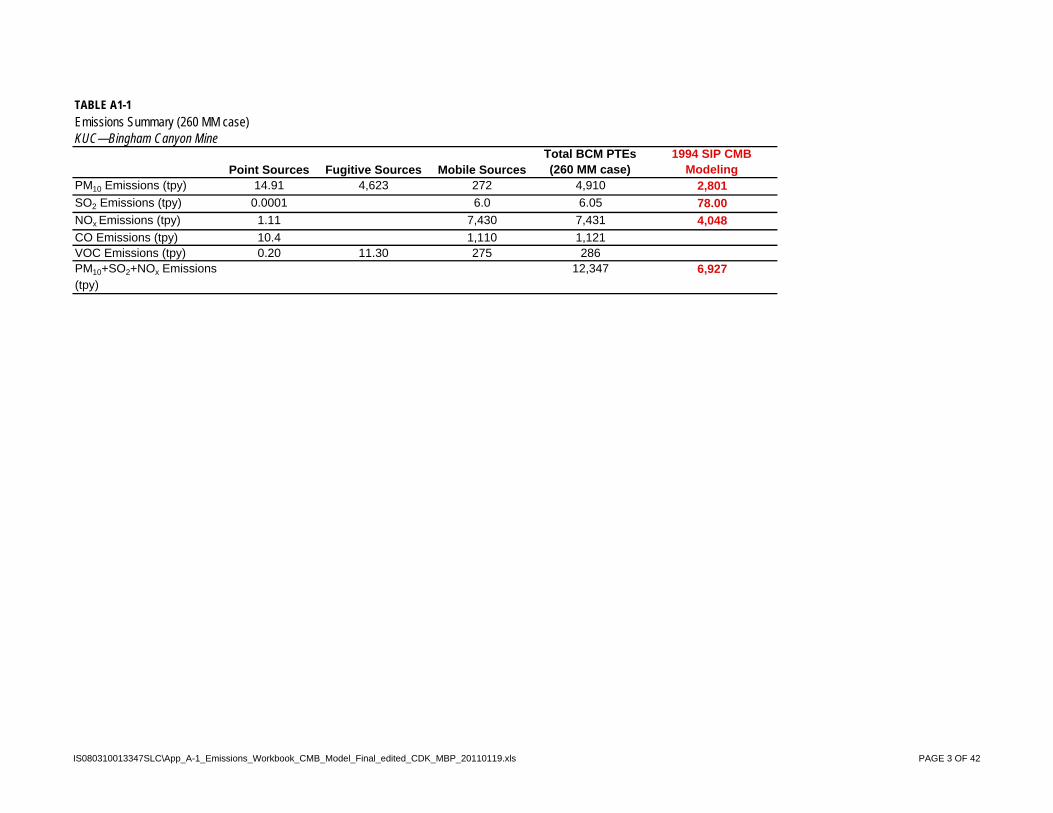
TABLE A1-1
Emissions Summary (260 MM case)KUC—Bingham Canyon Mine
Point Sources Fugitive Sources Mobile SourcesTotal BCM PTEs (260 MM case)
1994 SIP CMB Modeling
PM10 Emissions (tpy) 14.91 4,623 272 4,910 2,801
SO2 Emissions (tpy) 0.0001 6.0 6.05 78.00
NOx Emissions (tpy) 1.11 7,430 7,431 4,048
CO Emissions (tpy) 10.4 1,110 1,121VOC Emissions (tpy) 0.20 11.30 275 286PM10+SO2+NOx Emissions (tpy)
12,347 6,927
IS080310013347SLC\App_A-1_Emissions_Workbook_CMB_Model_Final_edited_CDK_MBP_20110119.xls PAGE 3 OF 42

TABLE A1-2
In-pit CrusherKUC—Bingham Canyon Mine
Source Name
PM10 Emission
Factor(gr/dscf)
Hours of Operation
(hrs/yr)
Design Flow Rate
(dcf/min)
Controlled PM10
Emissions(lb/hr)
Controlled PM10
Emissions(tpy) Control System and Comments
In-pit Crusher 0.016 8,760 12,898 1.77 7.75 Emissions controlled with a baghouseNOTE:Emissions calculations are consistent with the emission factors used in the 1994 SIP.
IS080310013347SLC\App_A-1_Emissions_Workbook_CMB_Model_Final_edited_CDK_MBP_20110119.xls PAGE 4 OF 42

TABLE A1-3
New In-pit CrusherKUC—Bingham Canyon Mine
Source Name
PM10 Emission
Factor(gr/dscf)
Hours of Operation
(hrs/yr)
Design Flow Rate
(dcf/min)
Controlled PM10
Emissions(lb/hr)
Controlled PM10
Emissions(tpy) Control System and Comments
New In-pit Crusher 0.007 8,760 12,898 0.77 3.39 Emissions controlled with a baghouseNOTE:The new crusher is expected to be similar to the existing crusher.
IS080310013347SLC\App_A-1_Emissions_Workbook_CMB_Model_Final_edited_CDK_MBP_20110119.xls PAGE 5 OF 42

TABLE A1-4
C6/C7 Conveyor Transfer PointKUC—Bingham Canyon Mine
Source Name
PM10 Emission
Factor(gr/dscf)
Hours of Operation
(hrs/yr)
Design Flow Rate
(dcf/min)
Controlled PM10
Emissions(lb/hr)
Controlled PM10
Emissions(tpy) Control System and Comments
C6/C7 Conveyor Transfer Point 0.007 8,760 5,120 0.31 1.35 Emissions controlled with a baghouseNOTES:Emissions calculations are consistent with the emission factors used in the 1994 SIP.KUC is proposing a lower grain loading for the baghouse.
IS080310013347SLC\App_A-1_Emissions_Workbook_CMB_Model_Final_edited_CDK_MBP_20110119.xls PAGE 6 OF 42

TABLE A1-5
C7/C8 Conveyor Transfer PointKUC—Bingham Canyon Mine
Source Name
PM10 Emission
Factor(gr/dscf)
Hours of Operation
(hrs/yr)
Design Flow Rate
(dcf/min)
Controlled PM10
Emissions(lb/hr)
Controlled PM10
Emissions(tpy) Control System and Comments
C7/C8 Conveyor Transfer Point 0.007 8,760 3,168 0.19 0.83 Emissions controlled with a baghouseNOTES:Emissions calculations are consistent with the emission factors used in the 1994 SIP.KUC is proposing a lower grain loading for the baghouse.
IS080310013347SLC\App_A-1_Emissions_Workbook_CMB_Model_Final_edited_CDK_MBP_20110119.xls PAGE 7 OF 42

TABLE A1-6
Lime BinKUC—Bingham Canyon Mine
Source Name
PM10 Emission
Factor(gr/dscf)
Hours of Operation
(hrs/yr)
Design Flow Rate
(dcf/min)
Controlled PM10
Emissions(lb/hr)
Controlled PM10
Emissions(tpy) Control System and Comments
Lime Bin 0.016 8,760 616 0.08 0.37 Emissions controlled with a baghouseNOTE:Emissions calculations are consistent with the emission factors used in the 1994 SIP.
IS080310013347SLC\App_A-1_Emissions_Workbook_CMB_Model_Final_edited_CDK_MBP_20110119.xls PAGE 8 OF 42

TABLE A1-7
Lime BinKUC—Bingham Canyon Mine
Source Name
PM10 Emission
Factor(gr/dscf)
Hours of Operation(hrs/yr)
Design Flow Rate(dcf/min)
Controlled PM10
Emissions(lb/hr)
Controlled PM10
Emissions(tpy) Control System and Comments
Lime Bin 0.016 8,760 616 0.08 0.37 Emissions controlled with a baghouseNOTE:Emissions calculations are consistent with the emission factors used in the 1994 SIP.
IS080310013347SLC\App_A-1_Emissions_Workbook_CMB_Model_Final_edited_CDK_MBP_20110119.xls PAGE 9 OF 42

TABLE A1-8
Sample PreparationKUC—Bingham Canyon Mine
Source Name
PM10 Emission
Factor(gr/dscf)
Hours of Operation
(hrs/yr)
Design Flow Rate
(dcf/min)
Controlled PM10
Emissions(lb/hr)
Controlled PM10
Emissions(tpy) Control System and Comments
Sample Preparation 0.016 2,920 4,269 0.59 0.85 Emissions controlled with a baghouseNOTE:Emissions calculations are consistent with the emission factors used in the 1994 SIP.
IS080310013347SLC\App_A-1_Emissions_Workbook_CMB_Model_Final_edited_CDK_MBP_20110119.xls PAGE 10 OF 42
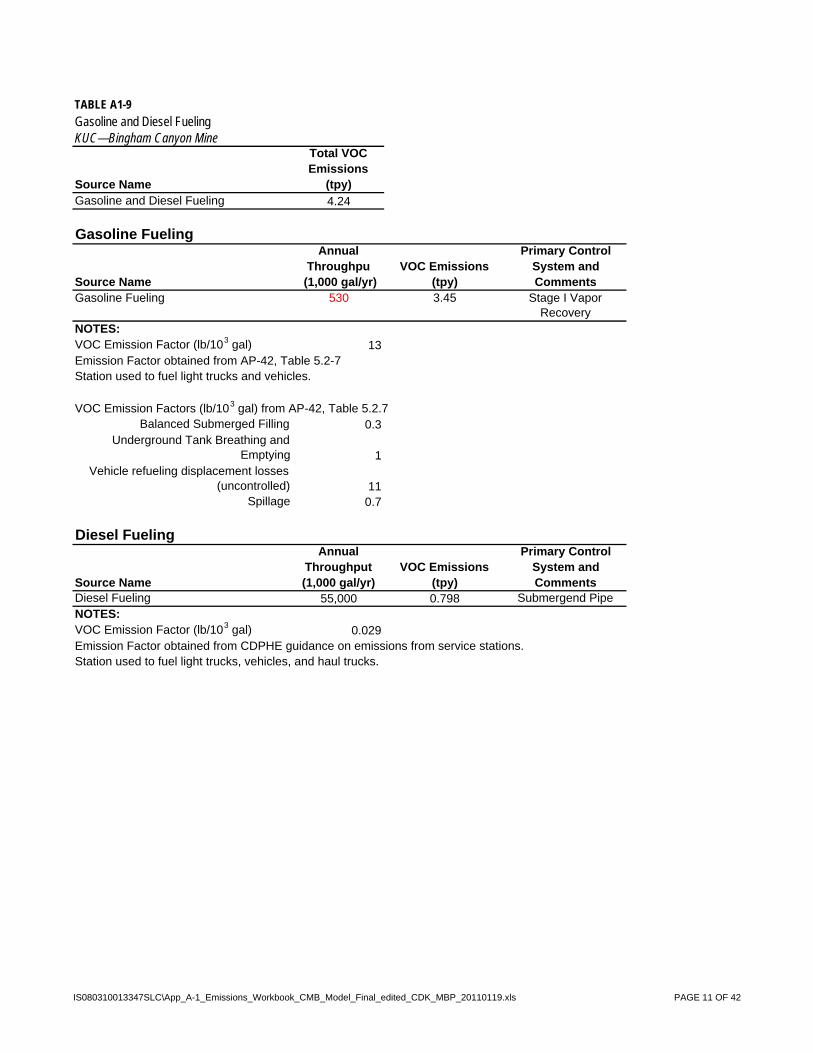
TABLE A1-9
Gasoline and Diesel FuelingKUC—Bingham Canyon Mine
Source Name
Total VOC Emissions
(tpy)Gasoline and Diesel Fueling 4.24
Gasoline Fueling
Source Name
Annual Throughpu
(1,000 gal/yr)VOC Emissions
(tpy)
Primary Control System and Comments
Gasoline Fueling 530 3.45 Stage I Vapor Recovery
NOTES:VOC Emission Factor (lb/103 gal) 13Emission Factor obtained from AP-42, Table 5.2-7Station used to fuel light trucks and vehicles.
VOC Emission Factors (lb/103 gal) from AP-42, Table 5.2.7Balanced Submerged Filling 0.3
Underground Tank Breathing and Emptying 1
Vehicle refueling displacement losses (uncontrolled) 11
Spillage 0.7
Diesel Fueling
Source Name
Annual Throughput(1,000 gal/yr)
VOC Emissions(tpy)
Primary Control System and Comments
Diesel Fueling 55,000 0.798 Submergend PipeNOTES:VOC Emission Factor (lb/103 gal) 0.029Emission Factor obtained from CDPHE guidance on emissions from service stations.Station used to fuel light trucks, vehicles, and haul trucks.
IS080310013347SLC\App_A-1_Emissions_Workbook_CMB_Model_Final_edited_CDK_MBP_20110119.xls PAGE 11 OF 42

TABLE A1-10
Truck Offloading Ore at In-pit CrusherKUC—Bingham Canyon Mine
Source Name
PM10 Aerodynamic
Particle Size Multiplier(k)
Moisture Content
(%)
Wind Speed(mph)
PM10
Emission Factor(lb/ton)
Annual Process
Rate(tpy)
Uncontrolled PM10 Emissions
(tpy)
Control Efficiency
(%)
Controlled PM10
Emissions(tpy)
Control System and Comments
Truck Offloading Ore 0.36 4 7 0.00068 85,000,000 28.7 90 2.87 Inherent material characteristics and physical enclosures
NOTES:Emission factors estimated using methodology in AP-42, Section 11.2.3-3, Fourth Edition.Wind speed and moisture content data obtained from KUC Mine AEI.Emissions calculations are consistent with the emission factors used in the 1994 SIP.
IS080310013347SLC\App_A-1_Emissions_Workbook_CMB_Model_Final_edited_CDK_MBP_20110119.xls PAGE 12 OF 42

TABLE A1-36
Truck Offloading Ore at In-pit Crusher (Additional drop point at the new crusher)KUC—Bingham Canyon Mine
Source Name
PM10 Aerodynamic
Particle Size Multiplier(k)
Moisture Content
(%)
Wind Speed(mph)
PM10
Emission Factor(lb/ton)
Annual Process
Rate(tpy)
Uncontrolled PM10 Emissions
(tpy)
Control Efficiency
(%)
Controlled PM10
Emissions(tpy)
Control System and Comments
Truck Offloading Ore 0.36 4 7 0.00068 85,000,000 28.7 90 2.87 Inherent material characteristics and physical enclosures
NOTES:Emission factors estimated using methodology in AP-42, Section 11.2.3-3, Fourth Edition.Wind speed and moisture content data obtained from KUC Mine AEI.Emissions calculations are consistent with the emission factors used in the 1994 SIP.
IS080310013347SLC\App_A-1_Emissions_Workbook_CMB_Model_Final_edited_CDK_MBP_20110119.xls PAGE 13 OF 42

TABLE A1-37
Truck Offloading Ore at StockpileKUC—Bingham Canyon Mine
Source Name
PM10 Aerodynamic
Particle Size Multiplier(k)
Moisture Content
(%)
Wind Speed(mph)
PM10
Emission Factor(lb/ton)
Annual Process
Rate(tpy)
Uncontrolled PM10 Emissions
(tpy)
Control Efficiency
(%)
Controlled PM10
Emissions(tpy)
Control System and Comments
Truck Offloading Ore 0.36 4 7 0.00068 85,000,000 28.7 90 2.87 Inherent material characteristics and physical enclosures
NOTES:Emission factors estimated using methodology in AP-42, Section 11.2.3-3, Fourth Edition.Wind speed and moisture content data obtained from KUC Mine AEI.Emissions calculations are consistent with the emission factors used in the 1994 SIP.
IS080310013347SLC\App_A-1_Emissions_Workbook_CMB_Model_Final_edited_CDK_MBP_20110119.xls PAGE 14 OF 42

TABLE A1-11
In-pit Enclosed Transfer Points 1, 2, and 3KUC—Bingham Canyon Mine
Source Name
Number of Transfer Points
PM10 Aerodynamic
Particle Size Multiplier
(k)
Moisture Content
(%)Wind Speed
(mph)
PM10 Emission
Factor(lb/ton)
Annual Process Rate
(tpy)
Uncontrolled PM10
Emissions per Transfer Point
(tpy)
Control Efficiency
(%)
Controlled PM10
Emissions per Transfer Point
(tpy)
Controlled PM10
Emissions(tpy) Control System and Comments
In-pit Enclosed Transfer Points 1, 2, and 3 3 0.36 4 7 0.00068 85,000,000 28.7 90 2.87 8.62 Emissions controlled by enclosuresNOTES:Emission factors estimated using methodology in AP-42, Section 11.2.3-3, Fourth Edition.Wind speed and moisture content data obtained from KUC Mine AEI.Emissions calculations are consistent with the emission factors used in the 1994 SIP.
IS080310013347SLC\App_A-1_Emissions_Workbook_CMB_Model_Final_edited_CDK_MBP_20110119.xls PAGE 15 OF 42

TABLE A1-12
New In-pit Enclosed Transfer Points 1, 2, and 3KUC—Bingham Canyon Mine
Source Name
Number of
Transfer Points
PM10
Aerodynamic Particle Size
Multiplier(k)
Moisture Content
(%)
Wind Speed(mph)
PM10
Emission Factor(lb/ton)
Annual Process
Rate(tpy)
Uncontrolled PM10 Emissions
per Transfer Point(tpy)
Control Efficiency
(%)
Controlled PM10
Emissions per Transfer Point
(tpy)
Controlled PM10
Emissions(tpy)
Control System and Comments
New In-pit Enclosed Transfer Points 1, 2, and 3
3 0.36 4 7 0.00068 85,000,000 28.7 90 2.87 8.62 Emissions controlled by enclosures
NOTES:Emission factors estimated using methodology in AP-42, Section 11.2.3-3, Fourth Edition.Wind Speed and Moisture Content Data obtained from KUC Mine AEI.
IS080310013347SLC\App_A-1_Emissions_Workbook_CMB_Model_Final_edited_CDK_MBP_20110119.xls PAGE 16 OF 42

TABLE A1-38
In-pit Enclosed Transfer Point 4 and 5 (proposed new transfer point with the relocation of the existing in-pit crusher)KUC—Bingham Canyon Mine
Source Name
Number of
Transfer Points
PM10
Aerodynamic Particle Size
Multiplier(k)
Moisture Content
(%)
Wind Speed(mph)
PM10
Emission Factor(lb/ton)
Annual Process
Rate(tpy)
Uncontrolled PM10 Emissions
per Transfer Point(tpy)
Control Efficiency
(%)
Controlled PM10
Emissions per Transfer Point
(tpy)
Controlled PM10
Emissions(tpy)
Control System and Comments
New In-pit Enclosed Transfer Points 1, 2, and 3
2 0.36 4 7 0.00068 85,000,000 28.7 90 2.87 5.75 Emissions controlled by enclosures
NOTES:Emission factors estimated using methodology in AP-42, Section 11.2.3-3, Fourth Edition.Wind Speed and Moisture Content Data obtained from KUC Mine AEI.
IS080310013347SLC\App_A-1_Emissions_Workbook_CMB_Model_Final_edited_CDK_MBP_20110119.xls PAGE 17 OF 42

TABLE A1-13
Conveyor-stacker Transfer PointKUC—Bingham Canyon Mine
Source Name
PM10
Aerodynamic Particle Size
Multiplier(k)
Moisture Content
(%)
Wind Speed(mph)
PM10
Emission Factor(lb/ton)
Annual Process
Rate(tpy)
Uncontrolled PM10
Emissions(tpy)
Control Efficiency
(%)
Controlled PM10
Emissions(tpy) Control System and Comments
Conveyor-stacker Transfer Point
0.36 4 7 0.00068 85,000,000 28.7 90 2.87 Inherent material characteristics and physical enclosures
NOTES:Emission factors estimated using methodology in AP-42, Section 11.2.3-3, Fourth Edition.Wind Speed and Moisture Content Data obtained from KUC Mine AEI.Emissions calculations are consistent with the emission factors used in the 1994 SIP.
IS080310013347SLC\App_A-1_Emissions_Workbook_CMB_Model_Final_edited_CDK_MBP_20110119.xls PAGE 18 OF 42

TABLE A1-14
Coarse Ore StackerKUC—Bingham Canyon Mine
Source Name
PM10 Aerodynamic
Particle Size Multiplier
(k)
Moisture Content
(%)
Wind Speed(mph)
PM10
Emission Factor(lb/ton)
Annual Process
Rate(tpy)
Uncontrolled PM10
Emissions(tpy)
Control Efficiency
(%)
Controlled PM10
Emissions(tpy)
Control System and Comments
Coarse Ore Stacker (Drop to Coarse Ore Storage Pile)
0.36 4 7 0.00068 85,000,000 28.7 90 2.87 Inherent material characteristics and physical enclosures
NOTES:Emission factors estimated using methodology in AP-42, Section 11.2.3-3, Fourth Edition.Wind speed and moisture content data obtained from KUC Mine AEI.Emissions calculations are consistent with the emission factors used in the 1994 SIP.
IS080310013347SLC\App_A-1_Emissions_Workbook_CMB_Model_Final_edited_CDK_MBP_20110119.xls PAGE 19 OF 42

TABLE A1-15
Reclaim TunnelsKUC—Bingham Canyon Mine
Source Name
PM10
Aerodynamic Particle Size
Multiplier(k)
Moisture Content
(%)
Wind Speed(mph)
Hourly Design
Rate(tons/hour)
PM10
Emission Factor(lb/ton)
Annual Process
Rate(tpy)
Uncontrolled PM10
Emissions(tpy)
Control Efficiency
(%)
Controlled PM10
Emissions(tpy)
Control System and Comments
Reclaim Tunnels (Coarse Ore Reclaim Tunnel Vent)
0.36 4 7 6,000 0.00068 85,000,000 28.7 90 2.87 Inherent material characteristics and physical enclosures
NOTES:Emission factors estimated using methodology in AP-42, Section 11.2.3-3, Fourth Edition.Wind speed and moisture content data obtained from KUC Mine AEI.Emissions calculations are consistent with the emission factors used in the 1994 SIP.
IS080310013347SLC\App_A-1_Emissions_Workbook_CMB_Model_Final_edited_CDK_MBP_20110119.xls PAGE 20 OF 42

TABLE A1-16
Disturbed AreasKUC—Bingham Canyon Mine
Source Name
Number of Days per
Year
PM Emission Factor
(tons/acre-yr)
PM10 Emission
Factor(tons/acre-yr)
Total Disturbed Area
(acres)
Uncontrolled PM10 Emissions
(tpy)
Control Efficiency
(%)
Controlled PM10
Emissions(tpy)
Control System and Comments
Disturbed Areas (Unstabilized Areas)—Nonwinter Months
275 0.38 0.14 425 45.0 0 45.0 No controls
Disturbed Areas (Unstabilized Areas)—Winter Months
90 0.38 0.14 142 4.9 0 4.9 No controls
NOTES:Emission factors estimated using methodology in AP-42, Table 8.24-4, Fourth Edition. PM10 emission factor derived from PM factor and engineering estimates.Emissions calculations are consistent with the emission factors used in the 1994 SIP.
IS080310013347SLC\App_A-1_Emissions_Workbook_CMB_Model_Final_edited_CDK_MBP_20110119.xls PAGE 21 OF 42

TABLE A1-17
Cold Solvent Degreasing PartsKUC—Bingham Canyon Mine
Source NameThroughput
(gal/yr)Specific Gravity
Density(lb/gal)
Percent VOCs
Uncontrolled VOC Emissions
(tpy)
Control Efficiency
(%)
Controlled VOC Emissions
(tpy)Control System and Comments
Cold Solvent Degreasing Parts
500 0.81 6.76 100 1.69 0 1.69 Degreasers are enclosed
NOTE:Emissions estimated based on material balance.
IS080310013347SLC\App_A-1_Emissions_Workbook_CMB_Model_Final_edited_CDK_MBP_20110119.xls PAGE 22 OF 42

TABLE A1-18
Haul RoadsKUC—Bingham Canyon Mine
Activity and Road Description
Number of Days of
Precipitation
PM10
Emission Factor
(lb/VMT)
Amount of Material Hauled(tons)
Number of Round-trips VMT
Uncontrolled PM10
Emissions(tpy)
Control Efficiency
(%)
Controlled PM10
Emissions(tpy)
Control System and Comments
Haul Roads (SSF) - Full 65 8.25 195,890,411 816,210 3,387,272 13,976 85 2,096 Water SpraysHaul Roads (SSF) - Empty 65 6.11 195,890,411 816,210 3,387,272 10,347 85 1,552 Water SpraysHaul Roads (W) - Full 41 5.88 64,109,589 267,123 1,108,562 3,261 95 163 Water SpraysHaul Roads (W) - Empty 41 4.36 64,109,589 267,123 1,108,562 2,414 95 121 Water Sprays
8,991,667 3,932SSF = Summer/Spring/Fall (days) 275
W = Winter (days) 90Number of Wheels 6
Truck Speed Full (mph) 11.9Truck Speed Empty (mph) 16.2
Average Vehicle Weight - Full (tons) 413
Average Vehicle Weight - Empty (tons) 173PM10 Particle Size Factor 0.36
Average Trip Haul Distance (miles) 4.15 [Worst Case]S = Silt Content (%) 4
Vehicle Capacity (tons) 240W = Average Vehicle Weight (tons) 293
NOTES:Emission factors estimated using methodology in AP-42, Table 11.2.1-1, Fourth Edition. Number of days for each season based on 1994 AEI.Control efficiencies and days of precipitation data obtained from 2007 AEI.Emissions calculations are consistent with the emission factors used in the 1994 SIP.In 2005 KUC installed a crushing and screening unit to process aggregate material for use as road base on unpaved haulroads. During the winter months, the rock is screened to approximately 2-inch diameter and is screened to approximately 1.5-inch diameter during the remainder of the year. This application along with an improved road maintenance program significantly reduces the amount of fine material available on the haul road surface. Road-base material is applied as necessary and regulated through the current Fugitive Dust Control Plan.Per EPA, “In the absence of locally derived surface material silt content, users may choose to use the values in this table as default values.” The default silt content for the State of Utah, 4%, was applied. http://www.epa.gov/ttnchie1/ap42/ch13/related/c13s02-2.html
Max. Material Hauled (tons) 260,000,000 [Estimated]
IS080310013347SLC\App_A-1_Emissions_Workbook_CMB_Model_Final_edited_CDK_MBP_20110119.xls PAGE 23 OF 42
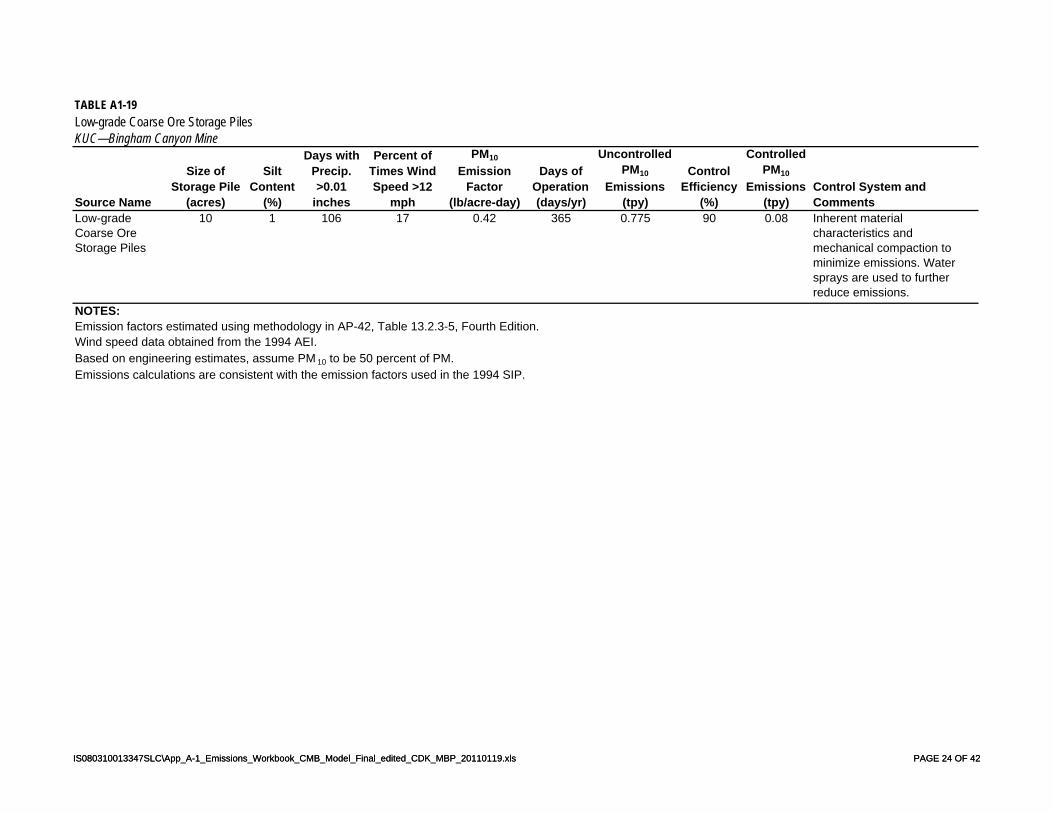
TABLE A1-19
Low-grade Coarse Ore Storage PilesKUC—Bingham Canyon Mine
Source Name
Size of Storage Pile
(acres)
Silt Content
(%)
Days with Precip. >0.01
inches
Percent of Times Wind Speed >12
mph
PM10
Emission Factor
(lb/acre-day)
Days of Operation(days/yr)
Uncontrolled PM10
Emissions(tpy)
Control Efficiency
(%)
Controlled PM10
Emissions(tpy)
Control System and Comments
Low-grade Coarse Ore Storage Piles
10 1 106 17 0.42 365 0.775 90 0.08 Inherent material characteristics and mechanical compaction to minimize emissions. Water sprays are used to further reduce emissions.
NOTES:Emission factors estimated using methodology in AP-42, Table 13.2.3-5, Fourth Edition. Wind speed data obtained from the 1994 AEI.Based on engineering estimates, assume PM 10 to be 50 percent of PM.Emissions calculations are consistent with the emission factors used in the 1994 SIP.
IS080310013347SLC\App_A-1_Emissions_Workbook_CMB_Model_Final_edited_CDK_MBP_20110119.xls PAGE 24 OF 42IS080310013347SLC\App_A-1_Emissions_Workbook_CMB_Model_Final_edited_CDK_MBP_20110119.xls PAGE 24 OF 42

TABLE A1-20
Front-end LoadersKUC—Bingham Canyon Mine
Source Name
Moisture Content
(%)
PM10 Emission
Factor(lb/ton)
Annual Process Rate
(tpy)
Uncontrolled PM10 Emissions
(tpy)
Control Efficiency
(%)
Controlled PM10
Emissions(tpy)
Control System and Comments
Front-end Loaders 4 0.0256 11,500,000 147.4 70 44.2 No controlsNOTES:Emission factors estimated using methodology outlined in AP-42, Table 8.24-4, Fourth Edition.Emissions calculations are consistent with the emission factors used in the 1994 SIP.Front end loaders operate primarily in vehicular traveled areas. These areas are subject to an improved and aggressive road watering program per the current Fugitive Dust Control Plan. Water application practices have been refined by years of experience. Detailed dust suppression truck movement data are tracked by GPS and maintained for inspection. KUC has dedicated five 50,000 gallon trucks, two 4,000 gallon trucks and one 1,800 gallon truck solely to dust suppression activitiesper the proposed Fugitive Dust Control Plan.
IS080310013347SLC\App_A-1_Emissions_Workbook_CMB_Model_Final_edited_CDK_MBP_20110119.xls PAGE 25 OF 42

TABLE A1-21
Truck LoadingKUC—Bingham Canyon Mine
Source Name
PM10 Aerodynamic
Particle Size Multiplier
(k)
Moisture Content
(%)
Wind Speed(mph)
PM10
Emission Factor(lb/ton)
Annual Process Rate
(tpy)
Uncontrolled PM10
Emissions(tpy)
Control Efficiency
(%)
Controlled PM10
Emissions(tpy)
Control System and Comments
Truck Loading 0.36 4 7 0.00068 260,000,000 87.9 90 8.8 Inherent material characteristics and minimal drop distance
NOTES:Emission factors estimated using methodology in AP-42, Section 11.2.3-3, Fourth Edition.Wind Speed and Moisture Content Data obtained from 1994 AEI.Emissions calculations are consistent with the emission factors used in the 1994 SIP.
IS080310013347SLC\App_A-1_Emissions_Workbook_CMB_Model_Final_edited_CDK_MBP_20110119.xls PAGE 26 OF 42
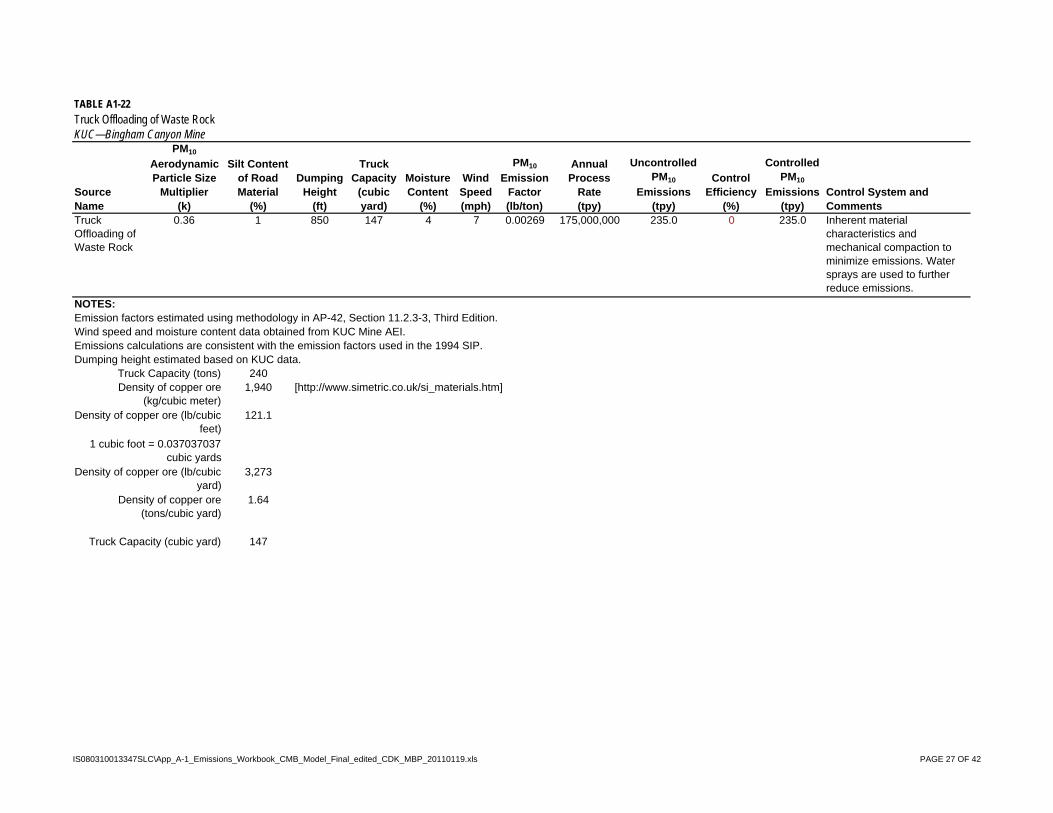
TABLE A1-22
Truck Offloading of Waste RockKUC—Bingham Canyon Mine
Source Name
PM10
Aerodynamic Particle Size
Multiplier(k)
Silt Content of Road Material
(%)
Dumping Height
(ft)
Truck Capacity
(cubic yard)
Moisture Content
(%)
Wind Speed(mph)
PM10
Emission Factor(lb/ton)
Annual Process
Rate(tpy)
Uncontrolled PM10
Emissions (tpy)
Control Efficiency
(%)
Controlled PM10
Emissions(tpy)
Control System and Comments
Truck Offloading of Waste Rock
0.36 1 850 147 4 7 0.00269 175,000,000 235.0 0 235.0 Inherent material characteristics and mechanical compaction to minimize emissions. Water sprays are used to further reduce emissions.
NOTES:Emission factors estimated using methodology in AP-42, Section 11.2.3-3, Third Edition.Wind speed and moisture content data obtained from KUC Mine AEI.Emissions calculations are consistent with the emission factors used in the 1994 SIP.Dumping height estimated based on KUC data.
Truck Capacity (tons) 2401,940 [http://www.simetric.co.uk/si_materials.htm]
121.1
3,273
1.64
147
Density of copper ore (kg/cubic meter)
1 cubic foot = 0.037037037 cubic yards
Density of copper ore (tons/cubic yard)
Truck Capacity (cubic yard)
Density of copper ore (lb/cubic feet)
Density of copper ore (lb/cubic yard)
IS080310013347SLC\App_A-1_Emissions_Workbook_CMB_Model_Final_edited_CDK_MBP_20110119.xls PAGE 27 OF 42

TABLE A1-23
GradersKUC—Bingham Canyon Mine
Source Name
Mean Vehicle Speed(mph)
Number of Graders
Hours of Operation
(hrs/yr)
Uncontrolled PM10 Emissions
(tpy)
Control Efficiency
(%)
Controlled PM10
Emissions(tpy) Control System and Comments
Graders 8 18 3,924 553 61 216 Type of operation and engineering estimates
NOTES:Emission factors estimated using methodology outlined in AP-42, Table 8.24-4, Fourth Edition.Emissions calculations are consistent with the emission factors used in the 1994 SIP.
Hours per year: 8,760Availability (%): 80
Effective use of utilization (%): 56Hours of operation: 3,924
Graders primarily operate on haulroads maintaining surfaces of the roads. These areas are subject to an improved and aggressive road watering program per the current Fugitive Dust Control Plan. Water application practices have been refined by years of experience. Detailed dust suppression truck movement data are tracked by GPS and maintained for inspection. KUC has dedicated five 50,000 gallon trucks, two 4,000 gallon trucks and one 1,800 gallon truck solely to dust suppression activitiesper the proposed Fugitive Dust Control Plan.
IS080310013347SLC\App_A-1_Emissions_Workbook_CMB_Model_Final_edited_CDK_MBP_20110119.xls PAGE 28 OF 42

TABLE A1-24
Bulldozers (Track Dozers)KUC—Bingham Canyon Mine
Source Name
Silt Content
(%)
Moisture Content
(%)
Number of Track
Dozers
Hours of Operation
(hrs/yr)
PM10 Emission
Factor(lb/hr)
Uncontrolled PM10 Emissions
(tpy)
Control Efficiency
(%)
Controlled PM10
Emissions(tpy)
Control System and Comments
Track dozers 8 4 26 3,053 2.44 97 61 37.72 Type of operation and engineering estimates
NOTES:Emission factors estimated using methodology outlined in AP-42, Table 8.24-4, Fourth Edition.Emissions calculations are consistent with the emission factors used in the 1994 SIP.
Hours per year: 8,760Availability (%): 85
Effective use of utilization (%): 41Hours of operation: 3,053
Track dozers primarily operate on haulroads and in material disposal areas performing cleanup operations. These areas are subject to an improved and aggressive road watering program per the current Fugitive Dust Control Plan. Water application practices have been refined by years of experience. Detailed dust suppression truck movement data are tracked by GPS and maintained for inspection. KUC has dedicated five 50,000 gallon trucks, two 4,000 gallon trucks and one 1,800 gallon truck solely to dust suppression activitiesper the proposed Fugitive Dust Control Plan.
IS080310013347SLC\App_A-1_Emissions_Workbook_CMB_Model_Final_edited_CDK_MBP_20110119.xls PAGE 29 OF 42

TABLE A1-25
Wheeled DozersKUC—Bingham Canyon Mine
Source Name
Silt Content
(%)
Moisture Content
(%)
Number of Wheeled Dozers
Hours of Operation
(hrs/yr)
PM10 Emission
Factor(lb/hr)
Uncontrolled PM10 Emissions
(tpy)
Control Efficiency
(%)
Controlled PM10
Emissions(tpy)
Control System and Comments
Rubber-tire Dozers 8 4 11 3,193 2.44 42.8 61 16.7 Type of operation and engineering estimates
NOTES:Emission factors estimated using methodology outlined in AP-42, Table 8.24-4, Fourth Edition.Emissions calculations are consistent with the emission factors used in the 1994 SIP.
Hours per year: 8,760Availability (%): 81
Effective use of utilization (%): 45Hours of operation: 3,193
Wheeled dozers primarily operate on haulroads and in material disposal areas performing cleanup operations. These areas are subject to an improved and aggressive road watering program per the current Fugitive Dust Control Plan. Water application practices have been refined by years of experience. Detailed dust suppression truck movement data are tracked by GPS and maintained for inspection. KUC has dedicated five 50,000 gallon trucks, two 4,000 gallon trucks and one 1,800 gallon truck solely to dust suppression activitiesper the proposed Fugitive Dust Control Plan.
IS080310013347SLC\App_A-1_Emissions_Workbook_CMB_Model_Final_edited_CDK_MBP_20110119.xls PAGE 30 OF 42

TABLE A1-26
Drilling with Water InjectionKUC—Bingham Canyon Mine
Source Name
PM Emission Factor
(lb/hole)
PM10 Emission
Factor(lb/hole)
Number of Holes
(holes/yr)
Uncontrolled PM10 Emissions
(tpy)
Control Efficiency
(%)
Controlled PM10
Emissions(tpy)
Control System and Comments
Drilling with Water Injection 1.3 0.65 90,000 29.3 90 2.93 Water injection at 90% efficiency
NOTES:Emission factor obtained from AP-42, Section 8.24-4 - Fourth Edition. Engineering estimates used to estimate PM 10 emission factors.Emissions calculations are consistent with the emission factors used in the 1994 SIP.
IS080310013347SLC\App_A-1_Emissions_Workbook_CMB_Model_Final_edited_CDK_MBP_20110119.xls PAGE 31 OF 42

TABLE A1-27
Blasting with Minimized AreaKUC—Bingham Canyon Mine
Source Name
Blasting Area
(ft2)
PM10 Emission
Factor(lb/blast)
Blasts per Year
Uncontrolled PM10 Emissions
(tpy)
Control Efficiency
(%)
Controlled PM10
Emissions(tpy)
Control System and Comments
Blasting with Minimized Area 57,500 65.8 1,100 36.2 0 36.2NOTES:
Emissions calculations are consistent with the emission factors used in the 1994 SIP.
Emission factor obtained from AP-42, Section 8.24-4 - Fourth Edition and 1994 emissions inventory for BCM. Engineering estimates used to estimate PM 10
emission factors.
IS080310013347SLC\App_A-1_Emissions_Workbook_CMB_Model_Final_edited_CDK_MBP_20110119.xls PAGE 32 OF 42

TABLE A1-28
Tertiary CrushingKUC—Bingham Canyon Mine
Source Name
Transient Process Rate
(tpy)
Uncontrolled PM10
Emissions(tpy)
Controlled PM10
Emissions(tpy)
Tertiary Crushing 3,150,000 3.78 0.85
Emission Factors:Emission Factor (lb/ton) 0.0024 For tertiary crushing - uncontrolled (lb of PM10 per ton of material handled)
Emission Factor (lb/ton) 0.00054 For tertiary crushing - controlled (lb of PM10 per ton of material handled)NOTES:Emission factors for PM10 obtained from AP-42, Table 11.19-2-2.Transient Process Rate information obtained from the 2005 NOI submitted to UDAQ.
IS080310013347SLC\App_A-1_Emissions_Workbook_CMB_Model_Final_edited_CDK_MBP_20110119.xls PAGE 33 OF 42

TABLE A1-29
ScreeningKUC—Bingham Canyon Mine
Source Name
Transient Process Rate
(tpy)
Uncontrolled PM10
Emissions(tpy)
Controlled PM10
Emissions(tpy)
Screening 3,150,000 13.70 1.17
Emission Factors:Emission Factor (lb/ton) 0.0087 For screening - uncontrolled (lb of PM10 per ton of material handled)
Emission Factor (lb/ton) 0.00074 For screening - controlled (lb of PM10 per ton of material handled)NOTES:Emission factors for PM10 obtained from AP-42, Table 11.19-2-2.Transient Process Rate information obtained from the 2005 NOI submitted to UDAQ.
IS080310013347SLC\App_A-1_Emissions_Workbook_CMB_Model_Final_edited_CDK_MBP_20110119.xls PAGE 34 OF 42

TABLE A1-30
Transfer PointsKUC—Bingham Canyon Mine
Source Name
Transient Process Rate
(tpy)Number of
Transfer Points
Controlled PM10
Emissions(tpy)
Transfer Points 3,150,000 10 0.72
Emission Factors:Emission Factor (lb/ton) 0.000046 For controlled transfer points (lb of PM10 per ton of material handled)NOTES:Emission factors for PM10 obtained from AP-42, Table 11.19-2-2 for controlled transfer points.Transient Process Rate information obtained from the 2005 NOI submitted to UDAQ.
IS080310013347SLC\App_A-1_Emissions_Workbook_CMB_Model_Final_edited_CDK_MBP_20110119.xls PAGE 35 OF 42

TABLE A1-31
SX/EW Copper ExtractionKUC—Bingham Canyon Mine
Source NameVOC Emissions
(tpy)SX/EW Copper Extraction 5.37NOTE:Emissions obtained from the 2008 NOI - provided by L. Salmon.
Summary of Allowable VOC Emissions (tpy)Mixer/Settlers Aqueous Flows Tanks Total
Proposed 2.92 2.38 0.07 5.37
Organic Solution Used
Constituent Concentration Spec. Gravity Boiling Range Constituent Concentration Spec. Gravity
Proposed SX-12 Diluent 96% 0.81 - 0.83 187 - 274oC LIX 984N 4% 0.915
Mixers/Settlers
Surface Area Pan Rate Density Time Control VOC
(ft2) (ft/24-hr day) (lb/gal) (hrs) (%) (tpy)
Proposed PlantExtraction 550 0.00142 (a) 6.84 8,760 80% (b) 1.46
Strip 550 0.00142 (a) 6.84 8,760 80% 1.46Total 1100 2.92
VOC (tpy) = ([Surface area(ft2)]*[evap rate(ft/day)]*[7.48 gal/ft3]*[density(lb/gal)]*[operating hrs/yr])(1 - control eff)/([24 hrs]*[2,000 lb/ton])
(a) From Emission Inventory(b) Control eff of 80% for proposed plant to be achieved by covers in place except during inspection, sampling, and adjustment.(c) Existing Pilot Plant mixer/settlers were not covered.
Volatilization from Aqueous FlowsAvg Flow TPH Conc Operating Throughput Est VOC
(gpm) (mg/L) (hrs) (gal/yr) Evap (tpy)
Proposed Plant (a)Raffinate 650.00 5.00 (b) 8,760 341,640,000 < 33% (c) 2.38
Electrolyte Circuit 0.00 (d)Total 2.38
VOC (tpy) = (flow [gpm])*(TPH Conc [mg/L])*(3.79 L/gal)*(60 min/hr)*(operating hrs/yr)/([453,597 mg/lb]*[2,000 lb/ton])
(a) The proposed plant will take Cu-bearing meteoric drainage from waste rock once through. Tailwater (raffinate) from the extraction settler in SX will go to the Large Bingham Reservoir, then to Copperton Concentrator as makeup water, and then to the tailings impoundment.(b) Because the solutions are mixed in agitation tanks for 3 minutes, organic concentration averaged 5 ppm in raffinate, leaving the extractor settler in the pilot plant, although the solubility is less ("negligible" according to the MSDS).5 ppm is the detection limit using centrifugal methods that are standard in the industry.(c) It is estimated that less than a third of the residual organic in the raffinate from the proposed plant will evaporate, some will biodegrade, and some will stay in the tailings impoundment. Note the high boiling range of the diluent.(d) No emission from the electrolyte circuit because it is contained in tanks and pipes.
Diluent Extractant
IS080310013347SLC\App_A-1_Emissions_Workbook_CMB_Model_Final_edited_CDK_MBP_20110119.xls PAGE 36 OF 42

TABLE A1-31
SX/EW Copper ExtractionKUC—Bingham Canyon Mine(e) The existing pilot plant took PLS from heap leaching, and recirculated the raffinate back to the heaps for further leaching.(f) A small percentage of the residual organic in the raffinate from the Pilot Plant evaporated when it was sprayed on the heaps, some biodegraded, but the large majority returned to the process in PLS. Note the high boiling range of the diluent.(g) Emission from volatilization in aqueous flows was apparently not included when the Pilot Plant was permitted, so current allowable for this source is 0.
Organic Surge Tanks and Organic Holding TanksTank Volume Total Volume VOC Emission
(gal) (gal) (tpy)Pilot (calc) 2 3300 6,600 0.04 from Emission InventoryProposed 4 3000 12,000 0.07 Estimated by volume ratio
No. Tanks
IS080310013347SLC\App_A-1_Emissions_Workbook_CMB_Model_Final_edited_CDK_MBP_20110119.xls PAGE 37 OF 42

TABLE A1-32
ElectrowinningKUC—Bingham Canyon Mine(From 2008 Mine AO Modification NOI)
Exhaust GasH2SO4 Concentration Operating
(gr/dscf) (acfm) (dscfm) Control Hours (tpy) (lb/hr)Proposed 0.004 8,000 6,547 Surfactant, covers, and 8,760 0.98 0.22
5,446 ft MSL Mist Eliminator829 millibars
Existing Pilot Plant Acid Mist emissions were not included in the AO at the time of permitting. 0
Net change in permitted emissions 0.98
There were two Pilot Plant electrowinning cells, each the same size as one of the four in the proposed plant, but their acid mist emissions were controlled only by use of chemical mist suppression (surfactant). Therefore, acid mist emissions are estimated to have been greater than those of the proposed plant.
Unquantified, but < 0
H2SO4 Emission (tpy)
= (H2SO4 concentration(grains/dscf) x (volume flow(dscfm)) x 60 min/hr x annual operating time (hours)/(7000 grains/lb x 2000 lb/ton)
Note that acid mist counts as PM10 as well.
Volume Flow Rate H2SO4 Emission
Net change in actual emissions:
IS080310013347SLC\App_A-1_Emissions_Workbook_CMB_Model_Final_edited_CDK_MBP_20110119.xls PAGE 38 OF 42

TABLE A1-33
LP GeneratorsKUC—Bingham Canyon Mine(From 2008 Mine AO Modification NOI)
Usage Emission(bhp) (kW) (mmBtu/hr) (hr/yr) (tpy)
Truck Dispatch OfficeTruck Dispatch Office Kohler 60RZG 105 78 0.27 500
PM10 = PM2.5 0.0006
SO2 0.00004
NOx 0.347CO 1.557
Total HC 0.058Communication 6190 Kohler 45RZG 75 56 0.19 500
PM10 = PM2.5 0.0005
SO2 0.00003
NOx 0.285CO 1.115
Total HC 0.042Lark Gate Olympian G100 160 119 0.41 500 PM10 = PM2.5 0.0010
SO2 0.00003
NOx 0.214CO 6.476
Total HC 0.058Galena Gulch Kohler 35RZG 72 54 0.18 500
PM10 = PM2.5 0.0004
SO2 0.00003
NOx 0.266CO 1.246
Total HC 0.040Total PM10 = PM2.5 0.0025
SO2 0.0001
NOx 1.1117CO 10.3935
Total HC 0.1966NOTE:Emissions data obtained from previously submitted NOIs.
Max Power RatingLocation Model
IS080310013347SLC\App_A-1_Emissions_Workbook_CMB_Model_Final_edited_CDK_MBP_20110119.xls PAGE 39 OF 42

TABLE A1-34
Mobile SourcesKUC—Bingham Canyon Mine
Emission FactorFuel
Consumptionpre-Tier 0 Emissions
Emission Ratio(pre-Tier 0 to Tier1)
Emissions Equivalent
(lb/1,000 gal) (gal/yr) (tpy) (%) (tpy)
PM10 24.1 55,000,000 663 41.08% 272
SO2 55,000,000 6
NOX 368.01 55,000,000 10,120 73.42% 7430
CO 153.51 55,000,000 4,222 26.30% 1110VOC 33.7 55,000,000 927 29.65% 275
Emission factors from AP-42, Off-Highway Heavy Construction Equipment, Section 11-7.1, Fourth Edition
Fuel consumption based on estimates provided by KUC Mine group
Emissions for SO2 estimated per methodology outlined in the SIP.
Sulfur Content of Fuel(%S) Specific Gravity
SO2 Emissions
(tpy)0.0015 0.88 6.0
Table 1Emission Factors by Tier (g/hp-hr) Tier 0 Tier 1 Tier 2 Tier 4t Tier 4fHC 1.05 0.31 0.18 0.29 0.14CO 4.90 1.29 1.29 0.09 0.09NOX 8.15 5.99 3.93 2.41 2.41
SO2 0.0049 0.0049 0.0049 0.0049 0.0049PM10 0.64 0.26 0.15 0.02 0.02
All Age Factors assumed to be equal to 1.
Hydrocarbon emission factors for tier 4f represent the EPA proposed emission limits, and were not calculated using NONROAD guidance.
All emission factors represent the lesser of EPA emission limits and factors calculated using EPA NONROAD methodology.
Haul trucks operating in 1994 were pre-Tier 0 trucks. Since KUC has transitioned to Tier 1 trucks at a minimum. Emissions above are therefore ratio with EPA tier standard for each pollutant.

Table 2 Zero-Hour, Steady-State Emission Factors for Nonroad CI Engines (>750 hp) (g/hp-hr)BSFC HC CO NOX PM10
T0 0.367 0.68 2.7 8.38 0.402T1 0.367 0.2861 0.7642 6.1525 0.1934T2 0.367 0.1669 0.7642 4.1 0.1316T4t 0.367 0.2815 0.076 2.392 0.069T4 0.367 0.2815 0.076 2.392 0.069
Table 3 Transient Adjustment Factors by Equipment Type for Nonroad CI EquipmentSCC Cycle TAF Assign. HC CO NOx PM10 BSFC
2270002051 Crawler Hi LF 1.05 1.53 0.95 1.23 1.01
TAFs are not applied to the emission factors for Tier 4 engines
Table 4 Deterioration Factors for Nonroad Diesel Engines (A)Pollutant T0 T1 T2 T3+HC 0.47 0.036 0.034 0.027CO 0.185 0.101 0.101 0.151NOX 0.024 0.024 0.009 0.008PM10 0.473 0.473 0.473 0.473
Sulfur Content of Diesel Fuelsulfur conversion 7.0 grams PM sulfate/gram Sulfursoxcnv 0.02247 grams PM sulfur/gram fuel consumeddefault (soxbas) 3300 ppm 0.33 wt %Diesel Sulfur Conc. (soxdsl) 15 ppm 0.0015 wt %

TABLE A1-35
Emissions SummaryKUC—Bingham Canyon Mine
Source ID Source Description
PM10 Emissions
(tpy)BCM01 In-pit Crusher 7.75
BCM201 New In-pit Crusher 3.39BCM02 C6/C7 Conveyor Transfer Point 1.35BCM03 C7/C8 Conveyor Transfer Point 0.83BCM04 Lime Bin 0.37BCM05 Lime Bin 0.37BCM07 Sample Preparation 0.85
Total Point Sources: 14.91
BCM1.1 Truck Dump Ore 2.87BCM204 Truck Offloading Ore at In-pit Crusher
(Additional drop point at the new crusher)2.87
BCM205 Truck Offloading Ore at Stockpile 2.87BCM1.2 In-pit enclosed transfer points 1, 2, and 3 8.62BCM202 New In-pit enclosed transfer points 1, 2, and
38.62
BCM203 In-pit Enclosed Transfer Point 4 and 5 (proposed new transfer point with the relocation of the existing in-pit crusher)
5.75
BCM1.3 Conveyor Stacker Transfer Point 2.87BCM1.4 Coarse Ore Stacker (drop to coarse ore
storage pile)2.87
BCM1.5 Reclaim Tunnels (Coarse ore reclaim tunnel vent)
2.87
BCM1.9 Disturbed Areas 50BCM1.12 Haul Roads 3,932BCM1.13 Coarse Ore Storage Pile 0.08BCM1.16 Front-end Loaders 44BCM1.17 Truck Loading 8.79BCM1.19 End Dump Trucks (truck dumping of waste) 235.0
BCM1.20 Graders 216BCM1.21 Track Dozers 37.7BCM1.22 Wheeled Dozers 16.7BCM1.23 Drilling with Water Injection 2.93BCM1.24 Blasting with Minimized Area 36.2BCM100 Tertiary Crushing 0.85BCM101 Screening 1.17BCM102 Transfer Points 0.72
Total Fugitive Sources: 4,622.60
Total 4,638
IS080310013347SLC\App_A-1_Emissions_Workbook_CMB_Model_Final_edited_CDK_MBP_20110119.xls PAGE 42 OF 42

APPENDIX A-2
Emissions for UAM-AERO Modeling


Tables TitlesA2-1 Emissions Summary (260 MM case)A2-2 In-pit CrusherA2-3 New In-pit CrusherA2-4 C6/C7 Conveyor Transfer PointA2-5 C7/C8 Conveyor Transfer PointA2-6 Lime BinA2-7 Lime BinA2-8 Sample PreparationA2-9 Gasoline and Diesel Fueling
A2-10 Truck Offloading Ore at In-pit CrusherA2-36 (New Sheet Added) Truck Offloading Ore at In-pit Crusher (Additional drop point at the new crusher)A2-37 (New Sheet Added) Truck Offloading Ore at Stockpile
A2-11 In-pit Enclosed Transfer Points 1, 2, and 3A2-12 New In-pit Enclosed Transfer Points 1, 2, and 3
A2-38 (New Sheet Added)In-pit Enclosed Transfer Point 4 and 5 (proposed new transfer point with the relocation of the existing in-pit crusher)
A2-13 Conveyor-stacker Transfer PointA2-14 Coarse Ore StackerA2-15 Reclaim TunnelsA2-16 Disturbed AreasA2-17 Cold Solvent Degreasing PartsA2-18 Haul RoadsA2-19 Low-grade Coarse Ore Storage PilesA2-20 Front-end LoadersA2-21 Truck LoadingA2-22 Truck Offloading of Waste RockA2-23 GradersA2-24 Bulldozers (Track Dozers)A2-25 Wheeled DozersA2-26 Drilling with Water InjectionA2-27 Blasting with Minimized AreaA2-28 Tertiary CrushingA2-29 ScreeningA2-30 Transfer PointsA2-31 SX/EW Copper ExtractionA2-32 ElectrowinningA2-33 LP GeneratorsA2-34 Mobile SourcesA2-35 Emissions SummaryFigure TitleA2-1 Wind Rose for the Period of February 1 through 8, 2002Units Definitions
°C degree Celsiusacfm actual cubic feet per minutebhp brake horsepowerdcf dry cubic feetdscf dry standard cubic feet
dscfm dry standard cubic feet per minute
ft2 square feetgal Gallon
gpm gallon per minutegr grain
APPENDIX A-2 INDEX
IS080310013347SLC\App_A-2_Emissions_Workbook_UAM_Model_Final.xls PAGE 1 OF 42

APPENDIX A-2 INDEX
hr hourkW kilowattlb pound
mg milligrammg/L milligram per litermin minute
mmBtu million British thermal unitsmph miles per hourppm part per milliontpy ton per yearyr year
Acronyms DefinitionsAEI Air Emissions InventoryAO Approval Order
BCM Bingham Canyon MineCDPHE Colorado Department of Public Health and Environment
CO carbon monoxideEPA U.S. Environmental Protection Agency
H2SO4 sulfuric acid
HC hydrocarbonID Identification
KUC Kennecott Utah Copper LLCLP liquefied petroleum
MSDS material safety data sheetMSL mean sea levelNOI Notice of IntentNOx nitrogen oxides
PM particulate matterPM10 particulate matter less than 10 micrometers in aerodynamic diameter
PM2.5 particulate matter less than 2.5 micrometers in aerodynamic diameter
PTE potential to emitSIP State Implementation PlanSO2 sulfur dioxide
SOx sulfur oxides
SX/EW solvent extraction/electrowinningUAM Urban Airshed Model
UDAQ Utah Division of Air QualityVMT vehicle miles traveledVOC volatile organic compound
IS080310013347SLC\App_A-2_Emissions_Workbook_UAM_Model_Final.xls PAGE 2 OF 42

TABLE A2-1
Emissions Summary (260 MM case)KUC—Bingham Canyon Mine
Point Sources Fugitive Sources Mobile SourcesTotal BCM PTEs (260 MM case)
Current Copperton
Concentrator PTEs (DAQE-
AN0571019-06)Total BCM and
Copperton PTEs
2005 SIP UAM Modeling (BCM and
Copperton combined)
PM10 Emissions (tpy) 14.91 2,890 272 3,177 7.35 3,185 2,817
SO2 Emissions (tpy) 0.0001 6.0 6.05 0.10 6.1 68.64
NOx Emissions (tpy) 1.11 7,430 7,431 11.03 7,442 5,078
CO Emissions (tpy) 10.4 1,110 1,121 10.18 1,131 2,126VOC Emissions (tpy) 0.20 11.30 275 286 2.56 289 502PM10+SO2+NOX
Emissions (tpy)10,615
NOTE:For the 2005 Maintenance plan, emissions of Bingham Canyon Mine and Copperton Concentrator were modeled together.
IS080310013347SLC\App_A-2_Emissions_Workbook_UAM_Model_Final.xls PAGE 3 OF 42
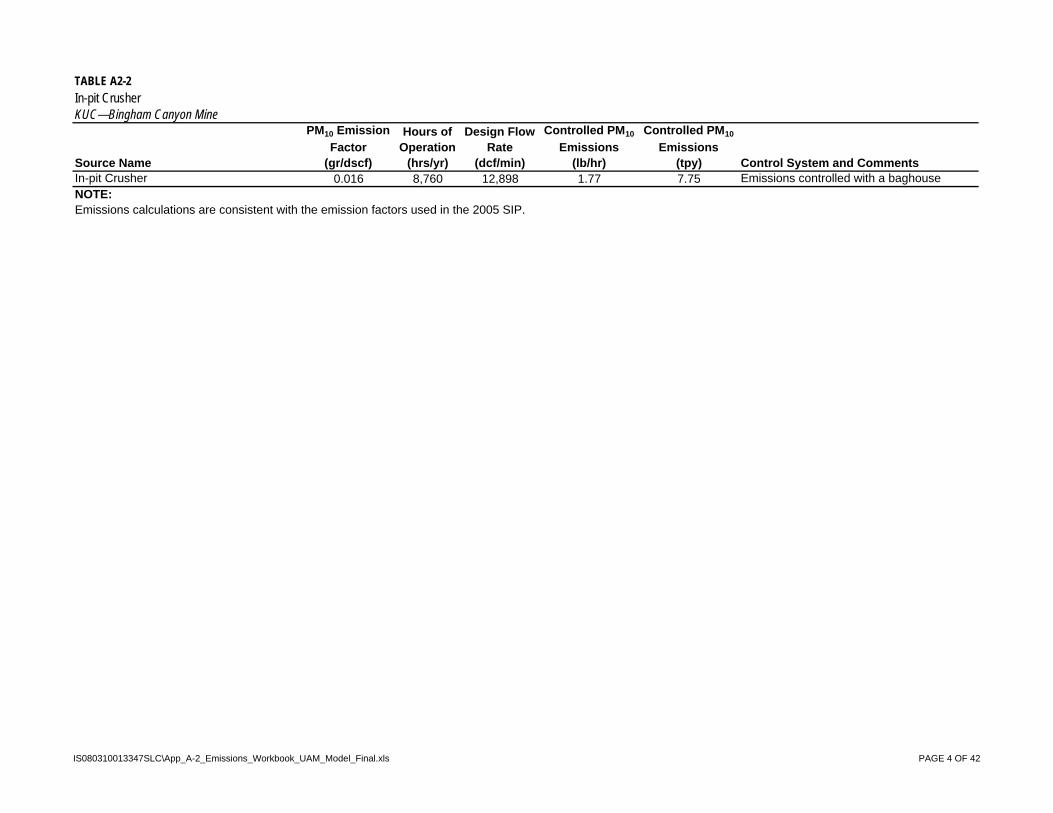
TABLE A2-2
In-pit CrusherKUC—Bingham Canyon Mine
Source Name
PM10 Emission
Factor(gr/dscf)
Hours of Operation
(hrs/yr)
Design Flow Rate
(dcf/min)
Controlled PM10
Emissions(lb/hr)
Controlled PM10
Emissions(tpy) Control System and Comments
In-pit Crusher 0.016 8,760 12,898 1.77 7.75 Emissions controlled with a baghouseNOTE:Emissions calculations are consistent with the emission factors used in the 2005 SIP.
IS080310013347SLC\App_A-2_Emissions_Workbook_UAM_Model_Final.xls PAGE 4 OF 42

TABLE A2-3
New In-pit CrusherKUC—Bingham Canyon Mine
Source Name
PM10 Emission
Factor(gr/dscf)
Hours of Operation
(hrs/yr)
Design Flow Rate
(dcf/min)
Controlled PM10
Emissions(lb/hr)
Controlled PM10
Emissions(tpy) Control System and Comments
New In-pit Crusher 0.007 8,760 12,898 0.77 3.39 Emissions controlled with a baghouseNOTE:The new crusher is expected to be similar to the existing crusher.
IS080310013347SLC\App_A-2_Emissions_Workbook_UAM_Model_Final.xls PAGE 5 OF 42

TABLE A2-4
C6/C7 Conveyor Transfer PointKUC—Bingham Canyon Mine
Source Name
PM10 Emission
Factor(gr/dscf)
Hours of Operation
(hrs/yr)
Design Flow Rate
(dcf/min)
Controlled PM10
Emissions(lb/hr)
Controlled PM10
Emissions(tpy) Control System and Comments
C6/C7 Conveyor Transfer Point 0.007 8,760 5,120 0.31 1.35 Emissions controlled with a baghouseNOTES:Emissions calculations are consistent with the emission factors used in the 2005 SIP.KUC is proposing a lower grain loading for the baghouse.
IS080310013347SLC\App_A-2_Emissions_Workbook_UAM_Model_Final.xls PAGE 6 OF 42

TABLE A2-5
C7/C8 Conveyor Transfer PointKUC—Bingham Canyon Mine
Source Name
PM10 Emission
Factor(gr/dscf)
Hours of Operation
(hrs/yr)
Design Flow Rate
(dcf/min)
Controlled PM10
Emissions(lb/hr)
Controlled PM10
Emissions(tpy) Control System and Comments
C7/C8 Conveyor Transfer Point 0.007 8,760 3,168 0.19 0.83 Emissions controlled with a baghouseNOTES:Emissions calculations are consistent with the emission factors used in the 2005 SIP.KUC is proposing a lower grain loading for the baghouse.
IS080310013347SLC\App_A-2_Emissions_Workbook_UAM_Model_Final.xls PAGE 7 OF 42

TABLE A2-6
Lime BinKUC—Bingham Canyon Mine
Source Name
PM10 Emission
Factor(gr/dscf)
Hours of Operation
(hrs/yr)
Design Flow Rate
(dcf/min)
Controlled PM10
Emissions(lb/hr)
Controlled PM10
Emissions(tpy) Control System and Comments
Lime Bin 0.016 8,760 616 0.08 0.37 Emissions controlled with a baghouseNOTE:Emissions calculations are consistent with the emission factors used in the 2005 SIP.
IS080310013347SLC\App_A-2_Emissions_Workbook_UAM_Model_Final.xls PAGE 8 OF 42

TABLE A2-7
Lime BinKUC—Bingham Canyon Mine
Source Name
PM10 Emission
Factor(gr/dscf)
Hours of Operation
(hrs/yr)
Design Flow Rate
(dcf/min)
Controlled PM10
Emissions(lb/hr)
Controlled PM10
Emissions(tpy) Control System and Comments
Lime Bin 0.016 8,760 616 0.08 0.37 Emissions controlled with a baghouseNOTE:Emissions calculations are consistent with the emission factors used in the 2005 SIP.
IS080310013347SLC\App_A-2_Emissions_Workbook_UAM_Model_Final.xls PAGE 9 OF 42

TABLE A2-8
Sample PreparationKUC—Bingham Canyon Mine
Source Name
PM10 Emission
Factor(gr/dscf)
Hours of Operation
(hrs/yr)
Design Flow Rate
(dcf/min)
Controlled PM10
Emissions(lb/hr)
Controlled PM10
Emissions(tpy) Control System and Comments
Sample Preparation 0.016 2,920 4,269 0.59 0.85 Emissions controlled with a baghouseNOTES:Emissions calculations are consistent with the emission factors used in the 2005 SIP.Hours of operation will continue to be 8 hours per day. No change in hours of operation due to the proposed project.
IS080310013347SLC\App_A-2_Emissions_Workbook_UAM_Model_Final.xls PAGE 10 OF 42
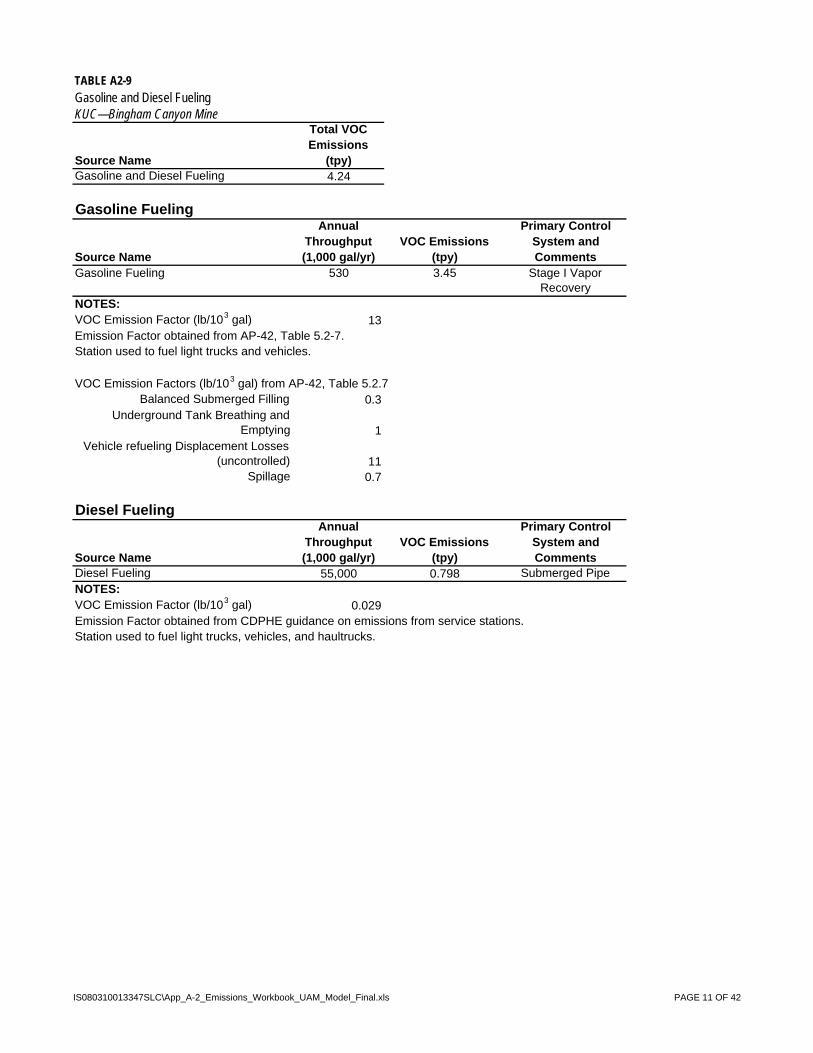
TABLE A2-9
Gasoline and Diesel FuelingKUC—Bingham Canyon Mine
Source Name
Total VOC Emissions
(tpy)Gasoline and Diesel Fueling 4.24
Gasoline Fueling
Source Name
Annual Throughput(1,000 gal/yr)
VOC Emissions(tpy)
Primary Control System and Comments
Gasoline Fueling 530 3.45 Stage I Vapor Recovery
NOTES:VOC Emission Factor (lb/103 gal) 13Emission Factor obtained from AP-42, Table 5.2-7.Station used to fuel light trucks and vehicles.
VOC Emission Factors (lb/103 gal) from AP-42, Table 5.2.7Balanced Submerged Filling 0.3
Underground Tank Breathing and Emptying 1
Vehicle refueling Displacement Losses (uncontrolled) 11
Spillage 0.7
Diesel Fueling
Source Name
Annual Throughput(1,000 gal/yr)
VOC Emissions(tpy)
Primary Control System and Comments
Diesel Fueling 55,000 0.798 Submerged PipeNOTES:VOC Emission Factor (lb/103 gal) 0.029Emission Factor obtained from CDPHE guidance on emissions from service stations.Station used to fuel light trucks, vehicles, and haultrucks.
IS080310013347SLC\App_A-2_Emissions_Workbook_UAM_Model_Final.xls PAGE 11 OF 42

TABLE A2-10
Truck Offloading Ore at In-pit CrusherKUC—Bingham Canyon Mine
Source Name
PM10 Aerodynamic
Particle Size Multiplier
(k)
Moisture Content
(%)
Wind Speed(mph)
PM10
Emission Factor(lb/ton)
Annual Process
Rate(tpy)
Uncontrolled PM10
Emissions(tpy)
Control Efficiency
(%)
Controlled PM10
Emissions(tpy)
Control System and Comments
Truck Offloading Ore 0.35 4 7 0.00066 85,000,000 27.9 90 2.79 Inherent material characteristics and physical enclosures
NOTES:Emission factors estimated using methodology in AP-42, Section 13.2.4, Fifth Edition (1/95).Wind speed and moisture content data obtained from KUC Mine AEI.Emissions calculations are consistent with the emission factors used in the 2005 SIP.
IS080310013347SLC\App_A-2_Emissions_Workbook_UAM_Model_Final.xls PAGE 12 OF 42

TABLE A2-36
Truck Offloading Ore at In-pit Crusher (Additional drop point at the new crusher)KUC—Bingham Canyon Mine
Source Name
PM10 Aerodynamic
Particle Size Multiplier
(k)
Moisture Content
(%)
Wind Speed(mph)
PM10
Emission Factor(lb/ton)
Annual Process
Rate(tpy)
Uncontrolled PM10
Emissions(tpy)
Control Efficiency
(%)
Controlled PM10
Emissions(tpy)
Control System and Comments
Truck Offloading Ore 0.35 4 7 0.00066 85,000,000 27.9 90 2.79 Inherent material characteristics and physical enclosures
NOTES:Emission factors estimated using methodology in AP-42, Section 13.2.4, Fifth Edition (1/95).Wind speed and moisture content data obtained from KUC Mine AEI.Emissions calculations are consistent with the emission factors used in the 2005 SIP.
IS080310013347SLC\App_A-2_Emissions_Workbook_UAM_Model_Final.xls PAGE 13 OF 42
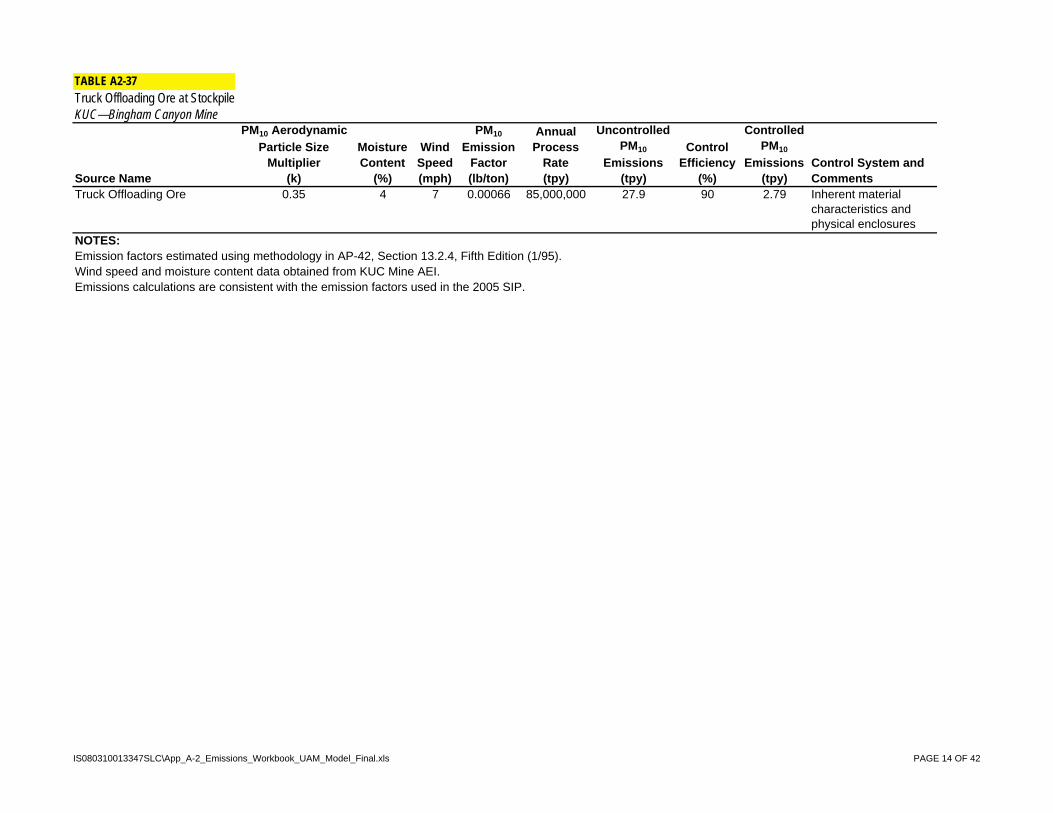
TABLE A2-37
Truck Offloading Ore at StockpileKUC—Bingham Canyon Mine
Source Name
PM10 Aerodynamic
Particle Size Multiplier
(k)
Moisture Content
(%)
Wind Speed(mph)
PM10
Emission Factor(lb/ton)
Annual Process
Rate(tpy)
Uncontrolled PM10
Emissions(tpy)
Control Efficiency
(%)
Controlled PM10
Emissions(tpy)
Control System and Comments
Truck Offloading Ore 0.35 4 7 0.00066 85,000,000 27.9 90 2.79 Inherent material characteristics and physical enclosures
NOTES:Emission factors estimated using methodology in AP-42, Section 13.2.4, Fifth Edition (1/95).Wind speed and moisture content data obtained from KUC Mine AEI.Emissions calculations are consistent with the emission factors used in the 2005 SIP.
IS080310013347SLC\App_A-2_Emissions_Workbook_UAM_Model_Final.xls PAGE 14 OF 42

TABLE A2-11
In-pit Enclosed Transfer Points 1, 2, and 3KUC—Bingham Canyon Mine
Source Name
Number of Transfer Points
PM10 Aerodynamic Particle Size
Multiplier(k)
Moisture Content
(%)Wind Speed
(mph)
PM10 Emission Factor(lb/ton)
Annual Process Rate
(tpy)
Uncontrolled PM10
Emissions per Transfer Point
(tpy)
Control Efficiency
(%)
Controlled PM10
Emissions per Transfer Point
(tpy)
Controlled PM10
Emissions(tpy) Control System and Comments
In-pit Enclosed Transfer Point 1, 2, and 3 3 0.35 4 7 0.00066 85,000,000 27.9 90 2.79 8.38 Emissions controlled by enclosuresNOTES:Emission factors estimated using methodology in AP-42, Section 13.2.4, Fifth Edition (1/95).Wind speed and moisture content data obtained from KUC Mine AEI.Emissions calculations are consistent with the emission factors used in the 2005 SIP.
IS080310013347SLC\App_A-2_Emissions_Workbook_UAM_Model_Final.xls PAGE 15 OF 42

TABLE A2-12
New In-pit Enclosed Transfer Points 1, 2, and 3KUC—Bingham Canyon Mine
Source NameNumber of
Transfer Points
PM10 Aerodynamic
Particle Size Multiplier
(k)
Moisture Content
(%)Wind Speed
(mph)
PM10 Emission
Factor(lb/ton)
Annual Process Rate
(tpy)
Uncontrolled PM10
Emissions per Transfer Point
(tpy)
Control Efficiency
(%)
Controlled PM10
Emissions per Transfer Point
(tpy)
Controlled PM10
Emissions(tpy) Control System and Comments
In-pit Enclosed Transfer Points 1, 2, and 3 3 0.35 4 7 0.00066 85,000,000 27.9 90 2.79 8.38 Emissions controlled by enclosures
NOTES:Emission factors estimated using methodology in AP-42, Section 13.2.4, Fifth Edition (1/95).Wind speed and moisture content data obtained from KUC Mine AEI.Emissions calculations are consistent with the emission factors used in the 2005 SIP.
IS080310013347SLC\App_A-2_Emissions_Workbook_UAM_Model_Final.xls PAGE 16 OF 42

TABLE A2-38
In-pit Enclosed Transfer Point 4 and 5 (proposed new transfer point with the relocation of the existing in-pit crusher)KUC—Bingham Canyon Mine
Source NameNumber of
Transfer Points
PM10 Aerodynamic
Particle Size Multiplier
(k)
Moisture Content
(%)Wind Speed
(mph)
PM10 Emission
Factor(lb/ton)
Annual Process Rate
(tpy)
Uncontrolled PM10
Emissions per Transfer Point
(tpy)
Control Efficiency
(%)
Controlled PM10
Emissions per Transfer Point
(tpy)
Controlled PM10
Emissions(tpy) Control System and Comments
In-pit Enclosed Transfer Points 1, 2, and 3 3 0.35 4 7 0.00066 85,000,000 27.9 90 2.79 8.38 Emissions controlled by enclosures
NOTES:Emission factors estimated using methodology in AP-42, Section 13.2.4, Fifth Edition (1/95).Wind speed and moisture content data obtained from KUC Mine AEI.Emissions calculations are consistent with the emission factors used in the 2005 SIP.
IS080310013347SLC\App_A-2_Emissions_Workbook_UAM_Model_Final.xls PAGE 17 OF 42

TABLE A2-13
Conveyor-stacker Transfer PointKUC—Bingham Canyon Mine
Source Name
PM10
Aerodynamic Particle Size
Multiplier(k)
Moisture Content
(%)
Wind Speed(mph)
PM10
Emission Factor(lb/ton)
Annual Process
Rate(tpy)
Uncontrolled PM10
Emissions(tpy)
Control Efficiency
(%)
Controlled PM10
Emissions(tpy)
Control System and Comments
Conveyor-stacker Transfer Point 0.35 4 7 0.00066 85,000,000 27.9 90 2.79 Inherent material characteristics and physical enclosures
NOTES:Emission factors estimated using methodology in AP-42, Section 13.2.4, Fifth Edition (1/95).Wind speed and moisture content data obtained from KUC Mine AEI.Emissions calculations are consistent with the emission factors used in the 2005 SIP.
IS080310013347SLC\App_A-2_Emissions_Workbook_UAM_Model_Final.xls PAGE 18 OF 42
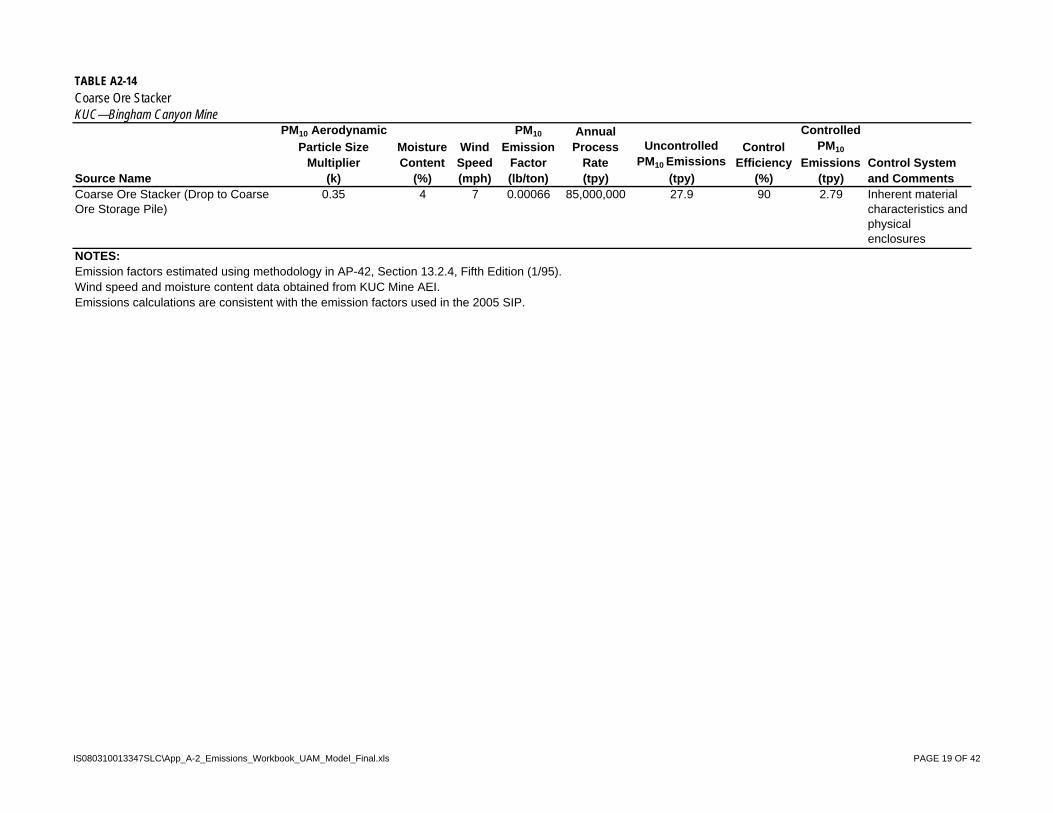
TABLE A2-14
Coarse Ore StackerKUC—Bingham Canyon Mine
Source Name
PM10 Aerodynamic
Particle Size Multiplier
(k)
Moisture Content
(%)
Wind Speed(mph)
PM10
Emission Factor(lb/ton)
Annual Process
Rate(tpy)
Uncontrolled PM10 Emissions
(tpy)
Control Efficiency
(%)
Controlled PM10
Emissions(tpy)
Control System and Comments
Coarse Ore Stacker (Drop to Coarse Ore Storage Pile)
0.35 4 7 0.00066 85,000,000 27.9 90 2.79 Inherent material characteristics and physical enclosures
NOTES:Emission factors estimated using methodology in AP-42, Section 13.2.4, Fifth Edition (1/95).Wind speed and moisture content data obtained from KUC Mine AEI.Emissions calculations are consistent with the emission factors used in the 2005 SIP.
IS080310013347SLC\App_A-2_Emissions_Workbook_UAM_Model_Final.xls PAGE 19 OF 42

TABLE A2-15
Reclaim TunnelsKUC—Bingham Canyon Mine
Source Name
PM10
Aerodynamic Particle Size
Multiplier(k)
Moisture Content
(%)
Wind Speed(mph)
Hourly Design
Rate(tons/hour)
PM10
Emission Factor(lb/ton)
Annual Process
Rate(tpy)
Uncontrolled PM10
Emissions(tpy)
Control Efficiency
(%)
Controlled PM10
Emissions(tpy)
Control System and Comments
Reclaim Tunnels (Coarse Ore Reclaim Tunnel Vent)
0.35 4 7 6,000 0.00066 85,000,000 27.9 90 2.79 Inherent material characteristics and physical enclosures
NOTES:Emission factors estimated using methodology in AP-42, Section 13.2.4, Fifth Edition (1/95).Wind speed and moisture content data obtained from KUC Mine AEI.Emissions calculations are consistent with the emission factors used in the 2005 SIP.
IS080310013347SLC\App_A-2_Emissions_Workbook_UAM_Model_Final.xls PAGE 20 OF 42

TABLE A2-16
Disturbed AreasKUC—Bingham Canyon Mine
Source Name
Number of Days per
Year
PM Emission Factor
(tons/acre-yr)
PM10 Emission
Factor(tons/acre-yr)
Total Disturbed Area
(acres)
Uncontrolled PM10 Emissions
(tpy)
Control Efficiency
(%)
Controlled PM10
Emissions(tpy)
Control System and Comments
Disturbed Areas (Unstabilized Areas) - Non-winter Months
275 0.38 0.14 425 45.0 0 45.0 No controls
Disturbed Areas (Unstabilized Areas) - Winter Months
90 0.38 0.14 142 4.9 0 4.9 No controls
NOTES:Emission factors estimated using methodology in AP-42, Table 11.9-4, Fifth Edition (7/98). PM10 emission factor derived from PM factor and engineering estimates.Emissions calculations are consistent with the emission factors used in the 2005 SIP.
IS080310013347SLC\App_A-2_Emissions_Workbook_UAM_Model_Final.xls PAGE 21 OF 42

TABLE A2-17
Cold Solvent Degreasing PartsKUC—Bingham Canyon Mine
Source NameThroughput
(gal/yr)Specific Gravity
Density(lb/gal)
Percent VOCs
Uncontrolled VOC Emissions
(tpy)
Control Efficiency
(%)
Controlled VOC Emissions
(tpy) Control System and CommentsCold Solvent Degreasing Parts 500 0.81 6.76 100 1.69 0 1.69 Degreasers are enclosedNOTE:Emissions estimated based on material balance.
IS080310013347SLC\App_A-2_Emissions_Workbook_UAM_Model_Final.xls PAGE 22 OF 42

TABLE A2-18
Haul RoadsKUC—Bingham Canyon Mine
Activity and Road Description
Number of Days of
Precipitation
MoistureContent
(%)
PM10 Emission
Factor(lb/VMT)
Amount of Material Hauled(tons)
Number of Round-trips VMT
Uncontrolled PM10
Emissions(tpy)
Control Efficiency
(%)
Controlled PM10
Emissions(tpy)
Control System and Comments
Haul Roads (S) - Full 48 1 3.58 65,534,247 273,059 1,133,196 2,029 85 304 Water SpraysHaul Roads (S) - Empty 48 1 3.19 65,534,247 273,059 1,133,196 1,806 85 271 Water SpraysHaul Roads (W) - Full 41 4 2.69 64,109,589 267,123 1,108,562 1,491 95 75 Water SpraysHaul Roads (W) - Empty 41 4 2.39 64,109,589 267,123 1,108,562 1,327 95 66 Water SpraysHaul Roads (F) - Full 17 2 5.52 130,356,164 543,151 2,254,075 6,218 85 933 Water SpraysHaul Roads (F) - Empty 17 2 4.91 130,356,164 543,151 2,254,075 5,534 85 830 Water Sprays
8,991,667 2,479
S = Summer (days) 92W = Winter (days) 90
F = Fall/Spring (days) 183Number of Wheels 6
Truck Speed Full (mph) 11.9Truck Speed Empty (mph) 16.2
Average Vehicle Weight - Full (tons) 413
Average Vehicle Weight - Empty (tons) 173
PM10 Particle Size Factor 2.6Average Trip Haul Distance
(miles) 4.15 One-way [Worst Case]S = Silt Content (%) 4
Vehicle Capacity (tons) 240W = Average Vehicle Weight
(tons) 293NOTES:Control efficiencies and days of precipitation data obtained from 2007 AEI.Emission factors estimated using methodology in AP-42, Section 13.2.2, Fifth Edition (7/98).Number of days for each season based on 1999 NOI.Emissions calculations are consistent with the emission factors used in the 2005 SIP.During 2005 KUC installed a crushing and screening unit to process aggregate material for use as road base on unpaved haulroads. During the winter months, the rock is screened to approximately 2-inch diameter and is screened to approximately 1.5-inch diameter during the remainder of the year. This application along with an improved road maintenance program significantly reduces the amount of fine material available on the haul road surface. Road-base material is applied as necessary and regulated through the current Fugitive Dust Control Plan.Per EPA, “In the absence of locally derived surface material silt content, users may choose to use the values in this table as default values.” The default silt content for the State of Utah, 4%, was applied. http://www.epa.gov/ttnchie1/ap42/ch13/related/c13s02-2.html
Max. Material Hauled (tons) 260,000,000 [Estimated]
IS080310013347SLC\App_A-2_Emissions_Workbook_UAM_Model_Final.xls PAGE 23 OF 42

TABLE A2-19
Low-grade Coarse Ore Storage PilesKUC—Bingham Canyon Mine
Source Name
Size of Storage
Pile(acres)
Silt Content
(%)
Days with Precip. >0.01
Inch
Percent of Times Wind
Speed >12 mph
PM10
Emission Factor
(lb/acre-day)
Days of Operation(days/yr)
Uncontrolled PM10
Emissions(tpy)
Control Efficiency
(%)
Controlled PM10
Emissions(tpy)
Control System and Comments
Low-grade Coarse Ore Storage Piles
10 1 106 17 0.42 365 0.775 80 0.16 Inherent material characteristics and mechanical compaction to minimize emissions. Water sprays are used to further reduce emissions.
NOTES:Emission factors estimated using methodology in AP-42, Table 11.2.3-5, Fourth Edition. Wind speed data obtained from the 1999 NOI.Based on engineering estimates, assume PM 10 to be 50% of PM.Emissions calculations are consistent with the emission factors used in the 2005 SIP.
IS080310013347SLC\App_A-2_Emissions_Workbook_UAM_Model_Final.xls PAGE 24 OF 42

TABLE A2-20
Front-end LoadersKUC—Bingham Canyon Mine
Source Name
Moisture Content
(%)
PM10 Emission
Factor(lb/ton)
Annual Process Rate
(tpy)
Uncontrolled PM10 Emissions
(tpy)
Control Efficiency
(%)
Controlled PM10
Emissions(tpy)
Control System and Comments
Front-end Loaders 4 0.0256 11,500,000 147.4 70 44.2 No controlsNOTES:Emission factors estimated using methodology outlined in AP-42, Table 11.9-4, Fifth Edition (7/98).Emissions calculations are consistent with the emission factors used in the 2005 SIP.Front end loaders operate primarily in vehicular traveled areas. These areas are subject to an improved and aggressive road watering program per the current Fugitive Dust Control Plan. Water application practices have been refined by years of experience. Detailed dust suppression truck movement data are tracked by GPS and maintained for inspection. KUC has dedicated five 50,000 gallon trucks, two 4,000 gallon trucks and one 1,800 gallon truck solely to dust suppression activitiesper the proposed Fugitive Dust Control Plan.
IS080310013347SLC\App_A-2_Emissions_Workbook_UAM_Model_Final.xls PAGE 25 OF 42

TABLE A2-21
Truck LoadingKUC—Bingham Canyon Mine
Source Name
PM10 Aerodynamic
Particle Size Multiplier
(k)
Moisture Content
(%)
Wind Speed(mph)
PM10
Emission Factor(lb/ton)
Annual Process Rate
(tpy)
Uncontrolled PM10 Emissions
(tpy)
Control Efficiency
(%)
Controlled PM10
Emissions(tpy)
Control System and Comments
Truck Loading 0.35 4 7 0.00066 260,000,000 85.4 90 8.5 Inherent material characteristics and minimal drop distance
NOTES:Emission factors estimated using methodology in AP-42, Section 13.2.4, Fifth Edition (1/95).Wind speed and moisture content data obtained from KUC Mine AEI.Emissions calculations are consistent with the emission factors used in the 2005 SIP.
IS080310013347SLC\App_A-2_Emissions_Workbook_UAM_Model_Final.xls PAGE 26 OF 42

TABLE A2-22
Truck Offloading of Waste RockKUC—Bingham Canyon Mine
Source Name
PM10
Aerodynamic Particle Size
Multiplier(k)
Moisture Content
(%)
Wind Speed(mph)
PM10
Emission Factor(lb/ton)
Annual Process Rate
(tpy)
Uncontrolled PM10
Emissions(tpy)
Control Efficiency
(%)
Controlled PM10
Emissions(tpy) Control System and Comments
Truck Offloading 0.35 4 7 0.00066 175,000,000 57.5 80 11.5 Inherent material characteristics and mechanical compaction to minimize emissions. Water sprays are used to further reduce emissions.
NOTES:Emission factors estimated using methodology in AP-42, Section 13.2.4, Fifth Edition (1/95).Wind Speed and Moisture Content Data obtained from KUC Mine AEI.Emissions calculations are consistent with the emission factors used in the 2005 SIP.
IS080310013347SLC\App_A-2_Emissions_Workbook_UAM_Model_Final.xls PAGE 27 OF 42

TABLE A2-23
GradersKUC—Bingham Canyon Mine
Source Name
Mean Vehicle Speed(mph)
Number of Graders
Hours of Operation
(hrs/yr)
Uncontrolled PM10 Emissions
(tpy)
Control Efficiency
(%)
Controlled PM10
Emissions(tpy)
Control System and Comments
Graders 8 18 3,924 553 70 166 Type of operation and engineering estimates
NOTES:Emission factors estimated using methodology outlined in AP-42, Table 11.9-4, Fifth Edition (7/98).Hours of operation based on data provided by KUC Mine Group.50 percent control efficiency based on engineering estimates.Emissions calculations are consistent with the emission factors used in the 2005 SIP.
Hours per year: 8,760Availability (%): 80
Effective use of utilization (%): 56Hours of operation: 3,924
Graders primarily operate on haulroads maintaining surfaces of the roads. These areas are subject to an improved and aggressive road watering program per the current Fugitive Dust Control Plan. Water application practices have been refined by years of experience. Detailed dust suppression truck movement data are tracked by GPS and maintained for inspection. KUC has dedicated five 50,000 gallon trucks, two 4,000 gallon trucks and one 1,800 gallon truck solely to dust suppression activitiesper the proposed Fugitive Dust Control Plan.
IS080310013347SLC\App_A-2_Emissions_Workbook_UAM_Model_Final.xls PAGE 28 OF 42

TABLE A2-24
Bulldozers (Track Dozers)KUC—Bingham Canyon Mine
Source Name
Silt Content
(%)
Moisture Content
(%)
Number of Track
Dozers
Hours of Operation
(hrs/yr)
PM10 Emission
Factor(lb/hr)
Uncontrolled PM10 Emissions
(tpy)
Control Efficiency
(%)
Controlled PM10
Emissions(tpy)
Control System and Comments
Track dozers 8 4 26 3,053 2.44 97 70 29.01 Type of operation and engineering estimates
NOTES:Emission factors estimated using methodology outlined in AP-42, Table 11.9-4, Fifth Edition (7/98).50 percent control efficiency based on engineering estimates.Emissions calculations are consistent with the emission factors used in the 2005 SIP.
Hours per year: 8,760Availability (%): 85
Effective use of utilization (%): 41Hours of operation: 3,053
Track dozers primarily operate on haulroads and in material disposal areas performing cleanup operations. These areas are subject to an improved and aggressive road watering program per the current Fugitive Dust Control Plan. Water application practices have been refined by years of experience. Detailed dust suppression truck movement data are tracked by GPS and maintained for inspection. KUC has dedicated five 50,000 gallon trucks, two 4,000 gallon trucks and one 1,800 gallon truck solely to dust suppression activitiesper the proposed Fugitive Dust Control Plan.
IS080310013347SLC\App_A-2_Emissions_Workbook_UAM_Model_Final.xls PAGE 29 OF 42

TABLE A2-25
Wheeled DozersKUC—Bingham Canyon Mine
Source Name
Silt Content
(%)
Moisture Content
(%)
Number of Wheeled Dozers
Hours of Operation
(hrs/yr)
PM10 Emission
Factor(lb/hr)
Uncontrolled PM10 Emissions
(tpy)
Control Efficiency
(%)
Controlled PM10
Emissions(tpy)
Control System and Comments
Rubber-tire Dozers 8 4 11 3,193 2.44 42.8 70 12.8 Type of operation and engineering estimates
NOTES:Emission factors estimated using methodology outlined in AP-42, Table 11.9-4, Fifth Edition (7/98).50 percent control efficiency based on engineering estimates.Emissions calculations are consistent with the emission factors used in the 2005 SIP.
Hours per year: 8,760Availability (%): 81
Effective use of utilization (%): 45Hours of operation: 3,193
Wheeled dozers primarily operate on haulroads and in material disposal areas performing cleanup operations. These areas are subject to an improved and aggressive road watering program per the current Fugitive Dust Control Plan. Water application practices have been refined by years of experience. Detailed dust suppression truck movement data are tracked by GPS and maintained for inspection. KUC has dedicated five 50,000 gallon trucks, two 4,000 gallon trucks and one 1,800 gallon truck solely to dust suppression activitiesper the proposed Fugitive Dust Control Plan.
IS080310013347SLC\App_A-2_Emissions_Workbook_UAM_Model_Final.xls PAGE 30 OF 42

TABLE A2-26
Drilling with Water InjectionKUC—Bingham Canyon Mine
Source Name
PM Emission Factor
(lb/hole)
PM10 Emission
Factor(lb/hole)
Number of Holes
(holes/yr)
Uncontrolled PM10 Emissions
(tpy)
Control Efficiency
(%)
Controlled PM10
Emissions(tpy)
Control System and Comments
Drilling with Water Injection 1.3 0.65 90,000 29.3 90 2.93 Water injection at 90% efficiency
NOTES:Emission factor obtained from AP-42, Table 11.9-4 - Fifth Edition (7/98). Engineering estimates used to estimate PM 10 emission factors.Emissions calculations are consistent with the emission factors used in the 2005 SIP.
IS080310013347SLC\App_A-2_Emissions_Workbook_UAM_Model_Final.xls PAGE 31 OF 42

TABLE A2-27
Blasting with Minimized AreaKUC—Bingham Canyon Mine
Source Name
Blasting Area
(ft2)
PM10 Emission
Factor(lb/blast)
Blasts per Year
Uncontrolled PM10 Emissions
(tpy)
Control Efficiency
(%)
Controlled PM10
Emissions(tpy)
Control System and Comments
Blasting with Minimized Area 57,500 7.3E-06 1,100 55.2 0 55.2 No controlsNOTES:Emission factor obtained from AP-42, Table 11.9-1 - Fifth Edition (7/98). Engineering estimates used to estimate PM 10 emission factors.Emissions calculations are consistent with the emission factors used in the 2005 SIP.
IS080310013347SLC\App_A-2_Emissions_Workbook_UAM_Model_Final.xls PAGE 32 OF 42

TABLE A2-28
Tertiary CrushingKUC—Bingham Canyon Mine
Source Name
Transient Process Rate
(tpy)
Uncontrolled PM10
Emissions(tpy)
Controlled PM10
Emissions(tpy)
Tertiary Crushing 3,150,000 3.78 0.85
Emission Factors:Emission Factor (lb/ton) 0.0024 For tertiary crushing - uncontrolled (lb of PM10 per ton of material handled)
Emission Factor (lb/ton) 0.00054 For tertiary crushing - controlled (lb of PM10 per ton of material handled)NOTES:Emission factors for PM10 obtained from AP-42, Table 11.19-2-2.Transient process rate information obtained from the 2005 NOI submitted to UDAQ.
IS080310013347SLC\App_A-2_Emissions_Workbook_UAM_Model_Final.xls PAGE 33 OF 42

TABLE A2-29
ScreeningKUC—Bingham Canyon Mine
Source Name
Transient Process Rate
(tpy)
Uncontrolled PM10
Emissions(tpy)
Controlled PM10
Emissions(tpy)
Screening 3,150,000 13.70 1.17
Emission Factors:Emission Factor (lb/ton) 0.0087 For screening - uncontrolled (lb of PM10 per ton of material handled)
Emission Factor (lb/ton) 0.00074 For screening - controlled (lb of PM10 per ton of material handled)NOTES:Emission factors for PM10 obtained from AP-42, Table 11.19-2-2.Transient process rate information obtained from the 2005 NOI submitted to UDAQ.
IS080310013347SLC\App_A-2_Emissions_Workbook_UAM_Model_Final.xls PAGE 34 OF 42

TABLE A2-30
Transfer PointsKUC—Bingham Canyon Mine
Source Name
Transient Process Rate
(tpy)Number of
Transfer Points
Controlled PM10
Emissions(tpy)
Transfer Points 3,150,000 10 0.72
Emission Factors:Emission Factor (lb/ton) 0.000046 For controlled transfer points (lbs of PM10 per ton of material handled)NOTES:Emission factors for PM10 obtained from AP-42, Table 11.19-2-2 for controlled transfer points.Transient process rate information obtained from the 2005 NOI submitted to UDAQ.
IS080310013347SLC\App_A-2_Emissions_Workbook_UAM_Model_Final.xls PAGE 35 OF 42

TABLE A2-31
SX/EW Copper ExtractionKUC—Bingham Canyon Mine
Source NameVOC Emissions
(tpy)SX/EW Copper Extraction 5.37NOTE:Emissions obtained from the 2008 NOI - provided by L. Salmon.
Summary of Allowable VOC Emissions (tpy)Mixer/Settlers Aqueous Flows Tanks Total
Proposed 2.92 2.38 0.07 5.37
Organic Solution Used
Constituent Concentration Spec. Gravity Boiling Range Constituent Concentration Spec. GravityProposed SX-12 Diluent 96% 0.81–0.83 187– 274 LIX 984N 4% 0.915
Mixers/Settlerssurface area pan rate density time Control VOC
(ft2) (ft/24-hr day) (lb/gal) (hrs) (%) (tpy)
Proposed PlantExtraction 550 0.00142 (a) 6.84 8,760 80% (b) 1.46
Strip 550 0.00142 (a) 6.84 8,760 80% 1.46Total 1100 2.92
VOC (tpy) = ((surface area(ft2))*(evap rate(ft/day))*(7.48 gal/ft3)*(density(lb/gal))*(operating hrs/yr))(1 - control eff)/((24 hrs)*(2000 lb/ton))
(a) From Emission Inventory(b) Control eff of 80% for proposed plant, to be achieved by covers in place except during inspection, sampling, and adjustment.(c) Existing Pilot Plant mixer/settlers were not covered.
Volatilization from Aqueous FlowsAvg Flow TPH Conc. Operating Throughput Est. VOC
(gpm) (mg/L) (hrs) (gal/yr) Evap (tpy)Proposed Plant (a)
Raffinate 650.00 5.00 (b) 8,760 341,640,000 33% (c) 2.38Electrolyte Circuit 0.00 (d)
Total 2.38
VOC (tpy) = (flow (gpm))*(TPH Conc (mg/L))*(3.79 L/gal)*(60 min/hr)*(operating hrs/yr))/((453597 mg/lb)*(2000 lb/ton))
Diluent Extractant
IS080310013347SLC\App_A-2_Emissions_Workbook_UAM_Model_Final.xls PAGE 36 OF 42

TABLE A2-31
SX/EW Copper ExtractionKUC—Bingham Canyon Mine(a) The proposed plant will take Cu-bearing meteoric drainage from waste rock once through. Tailwater (raffinate) from the extraction settler in SX will go to the Large Bingham Reservoir, then to Copperton Concentrator as makeup water, and then to the tailings impoundment.(b) Because the solutions are mixed in agitation tanks for 3 minutes, organic concentration averaged 5 ppm in raffinate leaving the extractor settler in the pilot plant, although the solubility is less ("negligible" according to the MSDS).5 ppm is the detection limit using centrifugal methods that are standard in the industry.(c) It is estimated that less than a third of the residual organic in the raffinate from the proposed plant will evaporate, some will biodegrade, and some will stay in the tailings impoundment. Note the high boiling range of the diluent.(d) No emission from the electrolyte circuit because it is contained in tanks and pipes.(e) The existing pilot plant took PLS from heap leaching and recirculated the raffinate back to the heaps for further leaching.(f) A small percentage of the residual organic in the raffinate from the Pilot Plant evaporated when it was sprayed on the heaps, some biodegraded, but the large majority returned to the process in PLS. Note the high boiling range of the diluent.(g) Emission from volatilization in aqueous flows was apparently not included when the Pilot Plant was permitted, so current allowable for this source is 0.
Organic Surge Tanks and Organic Holding TanksNo. Tanks Tank Volume Total Volume VOC Emission
(gal) (gal) (tpy)Pilot (calc) 2 3300 6,600 0.04 from Emission InventoryProposed 4 3000 12,000 0.07 Estimated by volume ratio
IS080310013347SLC\App_A-2_Emissions_Workbook_UAM_Model_Final.xls PAGE 37 OF 42

TABLE A2-32
ElectrowinningKUC—Bingham Canyon Mine(From 2008 Mine AO Modification NOI)
Exhaust GasH2SO4 Concentration Operating
(gr/dscf) (acfm) (dscfm) Hours (tpy) (lb/hr)Proposed 0.004 8,000 6,547 Surfactant, covers, and 8,760 0.98 0.22
5,446 ft MSL Mist Eliminator829 millibars
Existing Pilot Plant Acid Mist emissions were not included in the AO at the time of permitting. 0
Net change in permitted emissions 0.98
There were two Pilot Plant electrowinning cells, each the same size as one of the four in the proposed plant, but their acid mist emissions were controlled only by use of chemical mist suppression (surfactant). Therefore, acid mist emissions are estimated to have been greater than those of the proposed plant.
Unquantified, but < 0
H2SO4 Emission (tpy)
= (H2SO4 concentration(gr/dscf) x (volume flow(dscfm)) x 60 min/hr x annual operating time (hours)/(7,000 gr/lb x 2,000 lb/ton)
Note that acid mist counts as PM10 as well.
Net change in actual emissions:
ControlVolume Flow Rate H2SO4 Emission
IS080310013347SLC\App_A-2_Emissions_Workbook_UAM_Model_Final.xls PAGE 38 OF 42
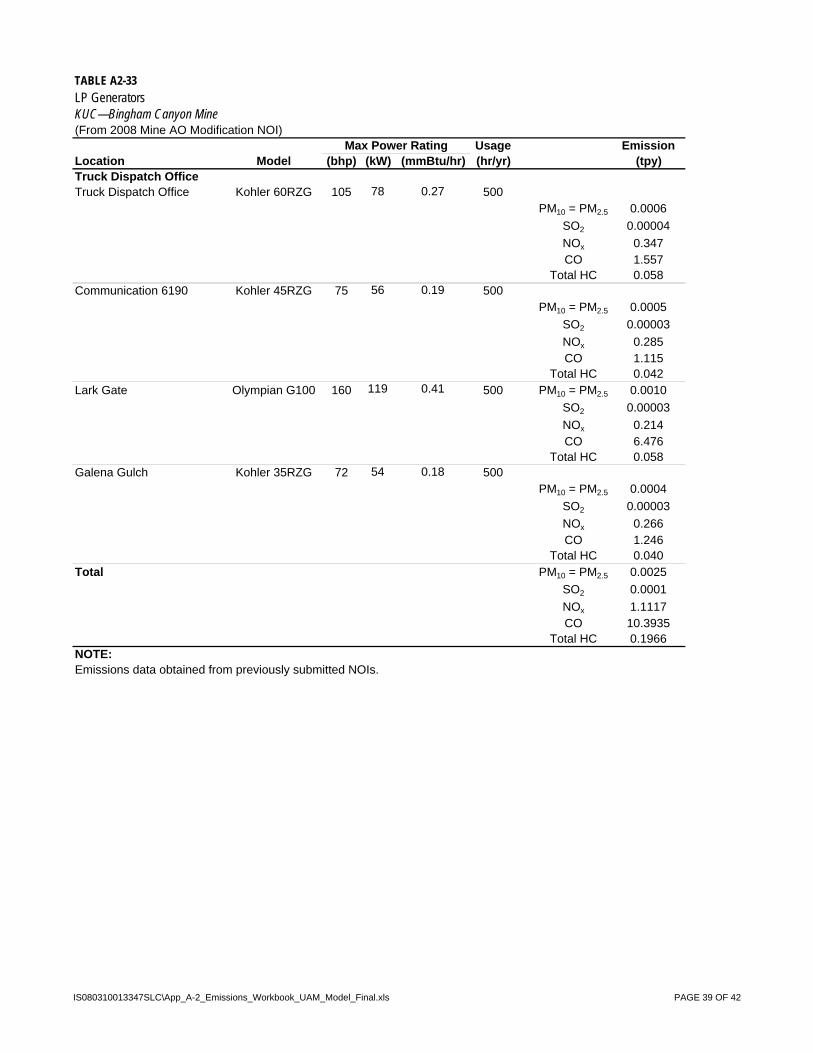
TABLE A2-33
LP GeneratorsKUC—Bingham Canyon Mine(From 2008 Mine AO Modification NOI)
Usage EmissionLocation Model (bhp) (kW) (mmBtu/hr) (hr/yr) (tpy)Truck Dispatch OfficeTruck Dispatch Office Kohler 60RZG 105 78 0.27 500
PM10 = PM2.5 0.0006
SO2 0.00004
NOx 0.347CO 1.557
Total HC 0.058Communication 6190 Kohler 45RZG 75 56 0.19 500
PM10 = PM2.5 0.0005
SO2 0.00003
NOx 0.285CO 1.115
Total HC 0.042Lark Gate Olympian G100 160 119 0.41 500 PM10 = PM2.5 0.0010
SO2 0.00003
NOx 0.214CO 6.476
Total HC 0.058Galena Gulch Kohler 35RZG 72 54 0.18 500
PM10 = PM2.5 0.0004
SO2 0.00003
NOx 0.266CO 1.246
Total HC 0.040Total PM10 = PM2.5 0.0025
SO2 0.0001
NOx 1.1117CO 10.3935
Total HC 0.1966NOTE:Emissions data obtained from previously submitted NOIs.
Max Power Rating
IS080310013347SLC\App_A-2_Emissions_Workbook_UAM_Model_Final.xls PAGE 39 OF 42

TABLE A1-34
Mobile SourcesKUC—Bingham Canyon Mine
Emission FactorFuel
Consumptionpre-Tier 0 Emissions
Emission Ratio(pre-Tier 0 to Tier1)
Emissions Equivalent
(lb/1,000 gal) (gal/yr) (tpy) (%) (tpy)
PM10 24.1 55,000,000 663 41.08% 272
SO2 55,000,000 6
NOX 368.01 55,000,000 10,120 73.42% 7430
CO 153.51 55,000,000 4,222 26.30% 1110VOC 33.7 55,000,000 927 29.65% 275
Emission factors from AP-42, Off-Highway Heavy Construction Equipment, Section 11-7.1, Fourth Edition
Fuel consumption based on estimates provided by KUC Mine group
Emissions for SO2 estimated per methodology outlined in the SIP.
Sulfur Content of Fuel(%S) Specific Gravity
SO2 Emissions
(tpy)0.0015 0.88 6.0
Table 1Emission Factors by Tier (g/hp-hr) Tier 0 Tier 1 Tier 2 Tier 4t Tier 4fHC 1.05 0.31 0.18 0.29 0.14CO 4.90 1.29 1.29 0.09 0.09NOX 8.15 5.99 3.93 2.41 2.41
SO2 0.0049 0.0049 0.0049 0.0049 0.0049PM10 0.64 0.26 0.15 0.02 0.02
All Age Factors assumed to be equal to 1.
Hydrocarbon emission factors for tier 4f represent the EPA proposed emission limits, and were not calculated using NONROAD guidance.
All emission factors represent the lesser of EPA emission limits and factors calculated using EPA NONROAD methodology.
Haul trucks operating in 2005 were pre-Tier 0 trucks. Since KUC has transitioned to Tier 1 trucks at a minimum. Emissions above are therefore ratio with EPA tier standard for each pollutant.

Table 2 Zero-Hour, Steady-State Emission Factors for Nonroad CI Engines (>750 hp) (g/hp-hr)BSFC HC CO NOX PM10
T0 0.367 0.68 2.7 8.38 0.402T1 0.367 0.2861 0.7642 6.1525 0.1934T2 0.367 0.1669 0.7642 4.1 0.1316T4t 0.367 0.2815 0.076 2.392 0.069T4 0.367 0.2815 0.076 2.392 0.069
Table 3 Transient Adjustment Factors by Equipment Type for Nonroad CI EquipmentSCC Cycle TAF Assign. HC CO NOx PM10 BSFC
2270002051 Crawler Hi LF 1.05 1.53 0.95 1.23 1.01
TAFs are not applied to the emission factors for Tier 4 engines
Table 4 Deterioration Factors for Nonroad Diesel Engines (A)Pollutant T0 T1 T2 T3+HC 0.47 0.036 0.034 0.027CO 0.185 0.101 0.101 0.151NOX 0.024 0.024 0.009 0.008PM10 0.473 0.473 0.473 0.473
Sulfur Content of Diesel Fuelsulfur conversion 7.0 grams PM sulfate/gram Sulfursoxcnv 0.02247 grams PM sulfur/gram fuel consumeddefault (soxbas) 3300 ppm 0.33 wt %Diesel Sulfur Conc. (soxdsl) 15 ppm 0.0015 wt %

TABLE A2-35
Emissions SummaryKUC—Bingham Canyon Mine
Source ID Source Description
PM10 Emissions
(tpy)
BCM01 In-pit Crusher 7.75BCM201 New In-pit Crusher 3.39BCM02 C6/C7 Conveyor Transfer Point 1.35BCM03 C7/C8 Conveyor Transfer Point 0.83BCM04 Lime Bin 0.37BCM05 Lime Bin 0.37BCM07 Sample Preparation 0.85
Total Point Sources: 14.91
BCM1.1 Truck Dump Ore 2.79
BCM1.2In-pit enclosed transfer point 1, 2, and 3 8.38
BCM202New In-pit enclosed transfer point 1, 2, and 3 8.38
BCM1.3 Conveyor Stacker Transfer Point 2.79
BCM1.4Coarse Ore Stacker (drop to coarse ore storage pile) 2.79
BCM1.5Reclaim Tunnels (Coarse ore reclaim tunnel vent) 2.79
BCM1.9 Disturbed Areas 50BCM1.12 Haul Roads 2,479BCM1.13 Coarse Ore Storage Pile 0.16BCM1.16 Front-end Loaders 44BCM1.17 Truck Loading 8.54
BCM1.19End Dump Trucks (truck dumping of waste) 11.5
BCM1.20 Graders 166BCM1.21 Track Dozers 29.0BCM1.22 Wheeled Dozers 12.8BCM1.23 Drilling with Water Injection 2.93BCM1.24 Blasting with Minimized Area 55.2BCM100 Tertiary Crushing 0.85BCM101 Screening 1.17BCM102 Transfer Points 0.72
Total Fugitive Sources: 2,890.08
Total 2,905
IS080310013347SLC\App_A-2_Emissions_Workbook_UAM_Model_Final.xls PAGE 42 OF 42