bio-inspired virus-mimicking nanoparticles for efficient ...375409/s4256501_phd... · conference...
TRANSCRIPT

Bio-inspired Virus-mimicking Nanoparticles for Efficient
Cellular Delivery
Yuting Niu
A thesis submitted for the degree of Doctor of Philosophy at
The University of Queensland in 2015
Australian Institute for Bioengineering and Nanotechnology

I
Abstract
Delivery of various drugs and biomolecules into cells is crucial in modern medicine, providing
promising potential in the treatment of incurable diseases. Most naked therapeutic biomolecules, for
example, proteins, siRNAs and some free drugs can hardly penetrate into cells, thus various natural
particulates and synthetic vectors have been used as cellular delivery vehicles. The understanding of
structure–function relationships of natural particulates provides a useful guide for the design of new
nanocarriers with better safety and higher delivery efficiency. Currently, many research attempts
have focused on the synthesis of new drug delivery systems by mimicking the advantages of
enveloped viruses, which have evolved sophisticated mechanisms that make use of or shield off
cellular signalling and transport pathways to traffic within host cells and deliver cargos into
appropriate subcellular compartments. However, there are still some parameters of enveloped
viruses requiring intensive study, for example, the contribution of viral surface topography (rough
surface) to intracellular delivery of cargo molecules.
This thesis focuses on the development of a novel drug delivery system with high performance
based on the preparation of silica nanoparticles with virus-mimicking rough morphology and gains
insight into the roles of surface roughness variation and surface functionality (e.g. polyethylenimine
and octadecyl-group) in biomolecule (e.g. siRNAs and therapeutic proteins) delivery performance.
The main achievements obtained in this thesis are listed below.
In the first part, a new and facile approach has been developed to prepare the virus-mimicking silica
nanoparticle (VMSN) with a rough surface. We show that increases in nanoscale surface roughness
promote both binding of biomolecules (e.g., genetic molecules) and cellular uptake; thus, the cargo
delivery efficiency is significantly increased, regardless of surface functionality and cell types.
Finally, gene delivery efficiency was tested, where the biomimetic nanoparticles shows a better cell
growth inhibition performance than the smooth silica nanoparticle and a commercial delivery
reagent.
In the second part, the novel and facile approach for systematically controlling surface roughness of
silica nanoparticles has been developed. Based on our "neck-enhancing" approach, rough silica
nanoparticles (RSNs) with a fixed core particle (211 nm in diameter) and varied shell particles are
obtained. The increase of shell particle s z s rom 13 to 98 nm enlarges interspacing distance
tw n n our n s ll p rt l s rom 7 to 38 nm, where protein molecules will favourably
absorb onto one of RSNs without impacting protein binding ability. Moreover, hydrophobically
modified RSN having the optimized interspacing distance of 38 nm successfully complexes with

II
therapeutic anti-pAkt antibody, and it shows enhanced intracellular delivery efficiency in human
breast cancer (MCF-7) cells, leading to significant cell growth inhibition by blocking pAkt and the
downstream anti-apoptotic protein of Bcl-2.
In the third part, we quantitatively demonstrate both the individual and combined contributions of
surface roughness and hydrophobic modification for the improvement of protein therapeutics. Both
surface roughening and hydrophobic modification enhance the protein adsorption capacity, while
the contribution from surface roughness is more effective. For sustained protein release,
hydrophobic modification has a stronger effect compared to rough surface. Both structural
parameters improve cellular uptake performance; however the contribution difference is cell type-
dependent. It is clear that surface roughness has little contribution to endo/lysosomal escape. Only
surface chemistry, i.e., hydrophobic modification, facilitates the release of nanoparticle/cargo
molecules from endosome/ lysosome entrapment. Collectively, octadecyl-functionalized rough
silica nanoparticle (C18-RSN) shows the best performance in therapeutic protein (RNase A)
delivery, causing significant cell viability inhibition in MCF-7 and SCC-25 cell lines compared to
RSN and smooth silica nanoparticle with (C18-SSN) and without (SSN) C18-modification.
III
Declaration by author
This thesis is composed of my original work, and contains no material previously published or
written by another person except where due reference has been made in the text. I have clearly
stated the contribution by others to jointly-authored works that I have included in my thesis.
I have clearly stated the contribution of others to my thesis as a whole, including statistical
assistance, survey design, data analysis, significant technical procedures, professional editorial
advice, and any other original research work used or reported in my thesis. The content of my thesis
is the result of work I have carried out since the commencement of my research higher degree
candidature and does not include a substantial part of work that has been submitted to qualify for
the award of any other degree or diploma in any university or other tertiary institution. I have
clearly stated which parts of my thesis, if any, have been submitted to qualify for another award.
I acknowledge that an electronic copy of my thesis must be lodged with the University Library and,
subject to the policy and procedures of The University of Queensland, the thesis be made available
for research and study in accordance with the Copyright Act 1968 unless a period of embargo has
been approved by the Dean of the Graduate School.
I acknowledge that copyright of all material contained in my thesis resides with the copyright
holder(s) of that material. Where appropriate I have obtained copyright permission from the
copyright holder to reproduce material in this thesis.

IV
Publications during candidature
1. Yuting Niu, Amirali Popat, Meihua Yu, Surajit Karmakar, Wenyi Gu and Chengzhong Yu.
Recent advances in the rational design of silica-based nanoparticles for gene therapy. Therapeutic
Delivery, 2012, 3(10), 1217–1237 (Review paper, Yuting and Amirali contribute equally to this
paper)
2. Yuting Niu, Meihua Yu, Sandy B. Hartono, Jie Yang, Hongyi Xu, Hongwei Zhang, Jun Zhang,
Jin Zou, Annette Dexter, Wenyi Gu and Chengzhong Yu. Nanoparticles Mimicking Viral Surface
Topography for Enhanced Cellular Delivery. Adv. Mater. 2013, 25, 6233. (This work has been
highlighted as the Frontispiece)
3. Yuting Niu, Meihua Yu, Jun Zhang, Yannan Yang, Chun Xu, Michael Yeh, Elena Taran, Jeff Jia
Cheng Hou, Peter P. Gray and Chengzhong Yu. Synthesis of Silica Nanoparticles with Controllable
Surface Roughness for Therapeutic Protein Delivery. Journal of Materials Chemistry B, 2015,
2015,3, 8477-8485.
4. Yuting Niu, Meihua Yu, Anand Meka, Yang Liu, Jun Zhang, Yannan Yang, and Chengzhong
Yu. Understanding the Contribution of Surface Roughness and Hydrophobic Modification on Silica
Nanoparticles for Enhanced Therapeutic Protein Delivery. Journal of Materials Chemistry B, 2015,
DOI: 10.1039/C5TB01911G.
5. Yannan Yang, Yuting Niu, Jun Zhang, Anand Kumar Meka, Hongwei Zhang, Chun Xu, Chun
Xiang Cynthia Lin, Meihua Yu and Chengzhong Yu. Biphasic Synthesis of Large-Pore and Well-
Dispersed Benzene Bridged Mesoporous Organosilica Nanoparticles for Intracellular Protein
Delivery. Small, 2015, 11, 2743-2749 (Yannan and Yuting contribute equally to this paper)
6. Meihua Yu, Yuting Niu, Jun Zhang, Siddharth Jambhrunkar, Hongwei Zhang, Wenyi Gu, Peter
Thorn, and Chengzhong Yu. Size-dependent gene delivery efficiency of amine modified
monodisperse Stöber spheres. Nano Research, 2015, DOI: 10.1007/s12274-015-0909-5. (Meihua
and Yuting contribute equally to this paper)
7. Chun Xu, Yuting Niu, Amirali Popat, Siddharth Jambhrunkar, Surajit Karmakar and
Chengzhong Yu. Rod-like mesoporous silica nanoparticles with rough surfaces for enhanced
cellular delivery. Journal of Materials Chemistry B, 2014, 2, 253-256
8. Meihua Yu, Yuting Niu, Yannan Yang, Sandy Budi Hartono, Jie Yang, Xiaodan Huang, Peter
Thorn, and Chengzhong Yu. An approach to prepare polyethyleneimine functionalized silica-based
spheres with small size for siRNA delivery, ACS Applied Materials & Interfaces, 2014, 6, 15626-
15631.
9. Chun Xu, Meihua Yu, Owen Noonan, Jun Zhang, Hao Song, Hongwei Zhang, Chang Lei,
Yuting Niu, Xiaodan Huang, Yannan Yang, Chengzhong Yu. Core-cone Structured Monodispersed

V
Mesoporous Silica Nanoparticles with Ultra-large Cavity for Protein Delivery. Small, 2015, 11(44):
5949–5955.
10. Yusilawati Ahmad Nor, Yuting Niu, Surajit Karmakar, Liang Zhou, Jun Zhang, Meihua Yu,
Donna Mahony, Neena Mitter, Matthew Cooper, Chengzhong Yu. Shaping Nanoparticles with
Hydrophilic Compositions and Hydrophobic Properties as Nano-carriers for Antibiotic Delivery.
ACS Central Science, 2015, 1 (6), 328–334.
Conference proceedings
1. Yuting Niu, Meihua Yu, Sandy B. Hartono, Jie Yang , Hongyi Xu, Hongwei Zhang, Jun Zhang,
Jin Zou, Annette Dexter, Wenyi Gu and Chengzhong Yu. Nanoparticles Mimicking Viral Surface
Topography for Enhanced Cellular Delivery. 2013 International Conference on BioNano Innovation
(ICBNI), 8th
September 2013, Shanghai, FuDan University, China (Oral presentation).
Publications included in this thesis
1. Yuting Niu, Amirali Popat, Meihua Yu, Surajit Karmakar, Wenyi Gu and Chengzhong Yu.
Recent advances in the rational design of silica-based nanoparticles for gene therapy. Therapeutic
Delivery, 2012, 3(10), 1217–1237 – partially incorporated in Chapter 2.
Contributors Statement of contribution
Author Y. Niu (Candidate)
Draft design (60 %)
Drafting and writing (65 %)
Author A. Popat
Draft design (25 %)
Drafting and writing (15 %)
Author M. Yu Drafting and writing (3 %)
Author S. Karmakar Drafting and writing (3 %)
Author W. Gu Drafting and writing (4 %)
Author C. Yu
Draft design (15 %)
Drafting and writing (10 %)

VI
2. Yuting Niu, Meihua Yu, Sandy B. Hartono, Jie Yang, Hongyi Xu, Hongwei Zhang, Jun Zhang,
Jin Zou, Annette Dexter, Wenyi Gu and Chengzhong Yu. Nanoparticles Mimicking Viral Surface
Topography for Enhanced Cellular Delivery. Adv. Mater. 2013, 25,6233.–incorporated as Chapter 4
Contributors Statement of contribution
Author Y. Niu (Candidate)
Experimental design and performance (75 %)
Analysis and interpretation of data (70 %)
Drafting and writing (50 %)
Author M. Yu Experimental design and performance (5 %)
Analysis and interpretation of data (4 %)
Author S. Hartono
Experimental design and performance (1 %)
Analysis and interpretation of data (1 %)
Drafting and writing (1 %)
Author J. Yang
Experimental design and performance (2 %)
Analysis and interpretation of data (1 %)
Drafting and writing (1 %)
Author H. Xu
Experimental design and performance (1 %)
Analysis and interpretation of data (1 %)
Drafting and writing (1 %)
Author H. Zhang Analysis and interpretation of data (1 %)
Author J. Zhang Experimental design and performance (1 %)
Author J. Zou Analysis and interpretation of data (1 %)
Author A. Dexter Analysis and interpretation of data (1 %)
Author W. Gu
Experimental design and performance (5 %)
Analysis and interpretation of data (10 %)
Drafting and writing (7 %)
Author C. Yu
Experimental design and performance (10 %)
Analysis and interpretation of data (10 %)
Drafting and writing (40 %)
VII
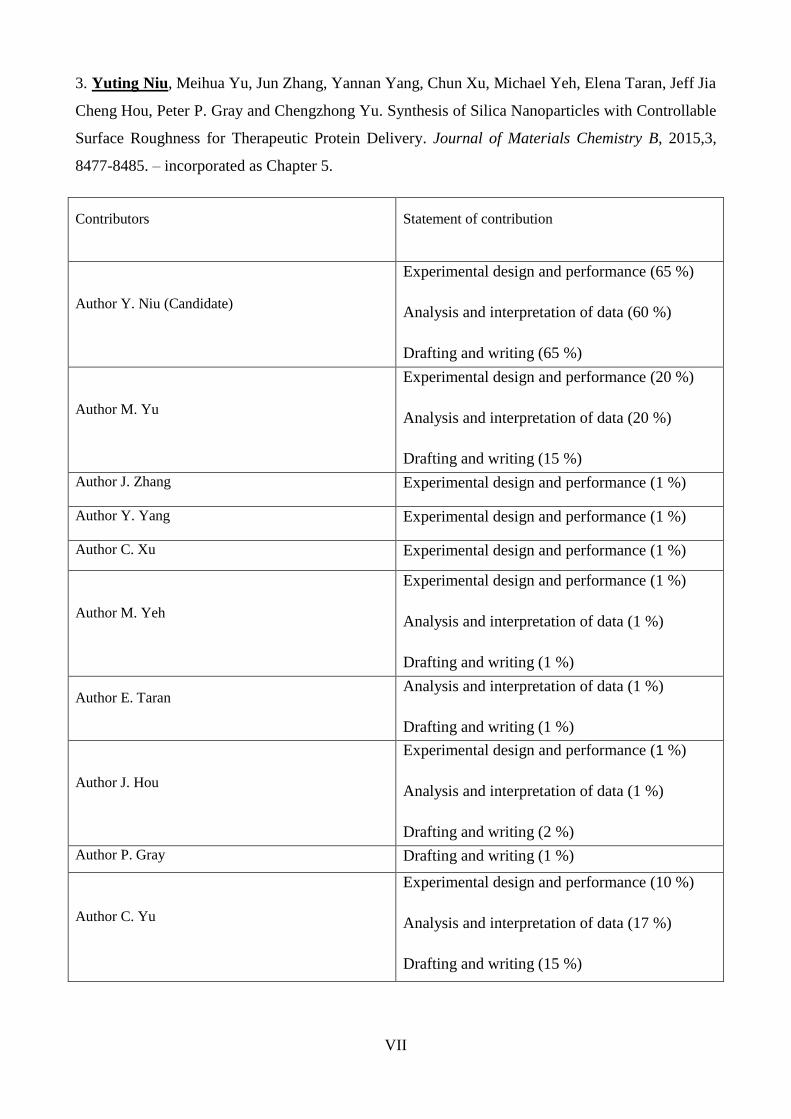
3. Yuting Niu, Meihua Yu, Jun Zhang, Yannan Yang, Chun Xu, Michael Yeh, Elena Taran, Jeff Jia
Cheng Hou, Peter P. Gray and Chengzhong Yu. Synthesis of Silica Nanoparticles with Controllable
Surface Roughness for Therapeutic Protein Delivery. Journal of Materials Chemistry B, 2015,3,
8477-8485. – incorporated as Chapter 5.
Contributors Statement of contribution
Author Y. Niu (Candidate)
Experimental design and performance (65 %)
Analysis and interpretation of data (60 %)
Drafting and writing (65 %)
Author M. Yu
Experimental design and performance (20 %)
Analysis and interpretation of data (20 %)
Drafting and writing (15 %)
Author J. Zhang Experimental design and performance (1 %)
Author Y. Yang Experimental design and performance (1 %)
Author C. Xu Experimental design and performance (1 %)
Author M. Yeh
Experimental design and performance (1 %)
Analysis and interpretation of data (1 %)
Drafting and writing (1 %)
Author E. Taran Analysis and interpretation of data (1 %)
Drafting and writing (1 %)
Author J. Hou
Experimental design and performance (1 %)
Analysis and interpretation of data (1 %)
Drafting and writing (2 %)
Author P. Gray Drafting and writing (1 %)
Author C. Yu
Experimental design and performance (10 %)
Analysis and interpretation of data (17 %)
Drafting and writing (15 %)

VIII
4. Yuting Niu, Meihua Yu, Anand Meka, Yang Liu, Jun Zhang, Yannan Yang and Chengzhong Yu.
Understanding the Contribution of Surface Roughness and Hydrophobic Modification on Silica
Nanoparticles for Enhanced Therapeutic Protein Delivery. Journal of Materials Chemistry B, 2015,
DOI: 10.1039/C5TB01911G--incorporated as Chapter 6.
Contributors Statement of contribution
Author Y. Niu (Candidate)
Experimental design and performance (65 %)
Analysis and interpretation of data (65 %)
Drafting and writing (65 %)
Author M. Yu
Experimental design and performance (15 %)
Analysis and interpretation of data (20 %)
Drafting and writing (20 %)
Author A. Meka Experimental design and performance (3 %)
Author Y. Liu Experimental design and performance (3 %)
Author J. Zhang Experimental design and performance (2 %)
Author Y. Yang Experimental design and performance (2 %)
Author C. Yu Experimental design and performance (10 %)
Analysis and interpretation of data (15 %)
Drafting and writing (15 %)
Contributions by others to the thesis
ICPOES analysis was performed by Dr. David Appleton (Chapter 4, 5 & 6).
Statement of parts of the thesis submitted to qualify for the award of another degree
None

IX
Acknowledgements
Most importantly, I would like to show my gratitude and great appreciation to my supervisor Prof.
Chengzhong (Michael) Yu for his supervision, excellent guidance, support and friendship during
my PhD period. Also, I would like to thank my co-supervisors Dr. Wenyi Gu and Dr. Annette
Dexter, for their advice, guidance, kind help and continuous encouragement in my PhD research
work. In addition, I would thank Dr. Meihua Yu for her enormous help during my PhD life, and
appreciate the help from Dr. Jeff Jia cheng Hou, Dr. Michael Yeh, Anand Meka and Yang Liu when
I am in urgent situation.
I would also thank the help and support from kind group members, including Dr. Jie Yang, Dr. Jun
Zhang, Dr. Sandy Budi Hartono, Dr. Surajit Karmakar, Dr. Amirali Popat, Dr. Siddharth
Jambhrunkar, Dr. Liang Zhou, Dr. Kun Qian, Yannan Yang, Hongwei Zhang, Chang Lei, Chun Xu,
Owen Noonan, Yusilawati Ahmad Nor, Prasanna Lakshmi Abbaraju, Xiaoran Sun, Hao Song,
Swasmi Purwajanti, Mohammad Kalantari, Min Zhang and Yue Wang for their direct or indirect
help in my research, and appreciate the help from the staff in the office, including Ms. Celestien
Warnaar-Notschaele, Ms. Cheryl Berquist and Mr. Chaoqing Lu.
Many thanks to the staff in the Australian National Fabrication Facility and the Australian
Microscopy and Microanalysis Research Facility at the Center for Microscopy and Microanalysis,
The University of Queensland, for providing the training and technical analysis help. I would like to
thank Mr. David Appleton for his help in ICPOES analysis from the School of Agriculture and
Food Sciences, the University of Queensland.
The financial support in terms of UQI from the University of Queensland, PhD Scholarship Top Up
from Australian Institute for Bioengineering and Nanotechnology and PhD scholarship from China
Scholarship Council are greatly appreciated.
Last but not least, I would like to express my deepest acknowledgement to my parents and Dr.
Xianyuan Shao for their endless love, support, and encouragement during my PhD study.

X
Keywords
bio-inspired, virus-mimicking, silica nanoparticle, surface roughness, intracellular delivery, gene
therapy, protein therapeutics, surface functionalization
Australian and New Zealand Standard Research Classifications (ANZSRC)
ANZSRC code: 100708, Nanomaterials, 40%
ANZSRC code: 090302, Biomedical Engineering, 40%
ANZSRC code: 100712, Nanoscale Characterisation, 20%
Fields of Research (FoR) Classification
FoR code: 0304, Medical & biomolecular chemistry, 70%
FoR code: 0601, Biochemistry & cell biology, 30%

XI
Table of Contents
Abstract ................................................................................................................................................. I
Declaration by author ......................................................................................................................... III
Publications during candidature ......................................................................................................... IV
Conference proceedings ...................................................................................................................... V
Publications included in this thesis ..................................................................................................... V
Contributions by others to the thesis ............................................................................................... VIII
Statement of parts of the thesis submitted to qualify for the award of another degree ................... VIII
Acknowledgements ............................................................................................................................ IX
Keywords ............................................................................................................................................ X
Australian and New Zealand Standard Research Classifications (ANZSRC) .................................... X
Fields of Research (FoR) Classification ............................................................................................. X
Table of Contents ............................................................................................................................... XI
List of Figures & Tables .................................................................................................................. XV
List of abbreviations used in the thesis ......................................................................................... XXII
Chapter 1 Introduction....................................................................................................................... 1
1.1 Significance of the project .......................................................................................................... 1
1.2 Research objectives and scope ................................................................................................... 2
1.3 Thesis outline ............................................................................................................................. 2
1.4 References .................................................................................................................................. 4
Chapter 2 Literature Review ............................................................................................................. 5
2.1 Modern medications for bio-application .................................................................................... 5
2.1.1 Therapeutic nucleic acids for gene therapy ......................................................................... 5
2.1.1.1 DNA-based therapeutics ............................................................................................... 7
2.1.1.2 RNA-based therapeutics ............................................................................................... 8
2.1.2 Therapeutic proteins for cancer therapy ............................................................................ 10
2.1.2.1 Enzyme........................................................................................................................ 10
2.1.2.2 Targeting protein ......................................................................................................... 11
2.1.2.3 Vaccine........................................................................................................................ 11
2.2 Recent advances in bio-inspired drug delivery carriers ........................................................... 12
2.2.1 Brief introduction of natural particulates as drug delivery vehicles .................................. 12
2.2.2 The advances of bio-inspired nanoparticles in bio-application ......................................... 14
2.2.2.1 Pathogen-mimicking strategies ................................................................................... 14

XII
2.2.2.2 Cell-mimicking strategies ........................................................................................... 15
2.2.2.3 Other strategies ........................................................................................................... 17
2.3 Strategies to engineer silica-based nanoparticles as effective gene and protein carriers ......... 17
2.3.1.1 Surface charge ............................................................................................................. 18
2.3.1.2 Surface hydrophobicity ............................................................................................... 20
2.3.1.3 Influence of serum protein .......................................................................................... 20
2.3.2 Modification with other materials ..................................................................................... 21
2.3.2.1 Organic materials ........................................................................................................ 21
2.3.2.2 Inorganic materials ...................................................................................................... 24
2.3.3 Particle nanotechnology ..................................................................................................... 25
2.3.3.1 Particle size ................................................................................................................. 25
2.3.3.2 Pore size and pore structure ........................................................................................ 26
2.3.3.3 Particle shape and surface morphology ...................................................................... 27
2.4 Conclusions and future perspective .......................................................................................... 28
2.5 References ................................................................................................................................ 29
Chapter 3 Methodology .................................................................................................................... 45
3.1 Materials synthesis ................................................................................................................... 45
3.1.1 Synthesis of monodispersed solid silica nanoparticles as core particle ............................. 45
3.1.2 Synthesis of monodispersed solid silica nanoparticles as shell particles .......................... 45
3.1.3 Synthesis of virus-mimicking silica nanoparticles (VMSNs) ........................................... 46
3.1.4 Functionalization of silica nanoparticles ........................................................................... 46
3.1.4.1 Amine-group modification .......................................................................................... 46
3.1.4.2 Hydrophobic modification .......................................................................................... 46
3.1.4.3 PEI attachment ............................................................................................................ 46
3.2 Characterizations ...................................................................................................................... 47
3.2.1 Transmission electron microscopy .................................................................................... 47
3.2.2 High resolution scanning electron microscopy .................................................................. 47
3.2.3 Dynamic light scattering .................................................................................................... 48
3.2.4 Z t (ζ) pot nt l n lys s .................................................................................................. 48
3.2.5 Nitrogen sorption ............................................................................................................... 48
3.2.6 Attenuated total reflectance-Fourier transform infrared spectroscopy .............................. 49
3.2.7 Elemental analysis ............................................................................................................. 49
3.2.8 Atomic force microscopy measurements ........................................................................... 49
3.2.9 Inductively coupled plasma optical emission spectroscopy .............................................. 50
3.2.10 Surface plasmon resonance measurements ...................................................................... 51

XIII
3.2.11 Thermogravimetric analysis ............................................................................................ 52
3.2.12 X-ray photoelectron spectroscopy ................................................................................... 52
3.3 Biological techniques ............................................................................................................... 52
3.3.1 Agarose gel electrophoresis ............................................................................................... 52
3.3.2 Confocal laser scanning microscopy ................................................................................. 53
3.3.3 MTT assay ......................................................................................................................... 53
3.3.4 Flow cytometry .................................................................................................................. 54
3.3.5 Western-blot analysis......................................................................................................... 54
3.3.6 TEM study on nanoparticle-cell interaction ...................................................................... 55
3.4 References ................................................................................................................................ 55
Chapter 4 Nanoparticles Mimicking Viral Surface Topography for Enhanced Cellular
Delivery ............................................................................................................................................. 57
4.1 Introduction .............................................................................................................................. 58
4.2 Results and discussion .............................................................................................................. 59
4.3 Conclusion ................................................................................................................................ 65
4.4 References ................................................................................................................................ 66
Supplementary Information ............................................................................................................ 68
Material and Methods ................................................................................................................. 68
4.S1. Synthesis of Samples ..................................................................................................... 68
4.S2. Characterizations ........................................................................................................... 69
4.S3. Estimation of shell / core ratio from ET data ................................................................. 70
4.S4. Biological experiments .................................................................................................. 70
Supplementary Figures and Tables ............................................................................................. 74
References ................................................................................................................................... 83
Chapter 5 Synthesis of Silica Nanoparticles with Controllable Surface Roughness for
Therapeutic Protein Delivery .......................................................................................................... 86
5.1 Introduction .............................................................................................................................. 87
5.2 Experimental section ................................................................................................................ 89
5.2.1 Materials ............................................................................................................................ 89
5.2.2 Synthesis of different nanoparticles ................................................................................... 89
5.2.3 Characterizations ............................................................................................................... 91
5.2.4 Biological experiments ...................................................................................................... 92
5.3 Results and Discussion ............................................................................................................. 94
5.4 Conclusion .............................................................................................................................. 103
5.5 References .............................................................................................................................. 103

XIV
Supplementary Figures and Tables .............................................................................................. 106
References .................................................................................................................................... 113
Chapter 6 Understanding the Contribution of Surface Roughness and Hydrophobic
Modification on Silica Nanoparticles for Enhanced Therapeutic Protein Delivery ................ 114
6.1 Introduction ............................................................................................................................ 115
6.2 Experimental .......................................................................................................................... 116
6.2.1 Materials and reagents ..................................................................................................... 116
6.2.2 Synthesis of nanoparticles ............................................................................................... 117
6.2.3 Characterizations ............................................................................................................. 117
6.2.4 Biological experiments .................................................................................................... 119
6.3 Results and discussion ............................................................................................................ 120
6.4 Conclusion .............................................................................................................................. 128
6.5 References .............................................................................................................................. 129
Supplementary Figures and Tables .............................................................................................. 131
References .................................................................................................................................... 138
Chapter 7 Conclusions and outlook .............................................................................................. 139
7.1 Conclusions ............................................................................................................................ 139
7.2 Recommendations for future work ......................................................................................... 141
7.3 References .............................................................................................................................. 141

XV
List of Figures & Tables
Figure 2.1 Various engineering strategies for virus-based vectors, virus-like particles and
virosomes.
Figure 2.2 Preparation and structure of the virus-mimicking nanogel.
Figure 2.3 Mechanism for the assembly of influenza virus-inspired polymer, binding with siRNA
and release of siRNA through a self-catalyzed degradation of PDMAEA.
Figure 2.4 Schematics of the preparation process of the RBC-membrane-coated PLGA
nanoparticles.
Figure 2.5 Endocytic pathways traversed by nonviral carriers. (A) Macropinocytosis of cationic
particles. (B) Nonviral vectors can also be internalized by other pathways such as clathrin-mediated
endocytosis, which is a receptor-mediated pathway. (C) Caveolae-mediated endocytosis proceeds
by oligomerization of caveolin, actin-dependent internalization of caveolae to form cavicles and
merger with the degradative lysosomal compartment, or nondegradative trafficking to the nucleus
via caveosomes. Each pathway relies on microtubules for rapid transport of endocytic vesicles.
HSPG: Heparan sulfate proteoglycans.
Figure 2.6 Steps of multivalent binding and internalization of targeted protocells, followed by
endosomal escape and nuclear localization of protocell encapsulated cargo. (1) DOPC protocells
particles binds to cell surface with high affinity due to attachment of targeting peptides; (2) then
goes through cell memberane via receptor-mediated endocytosis; (3) release drugs into cytosol on
endosome acidification and protonation of H5WYG fusogenic peptide. (4) Finally, NLS-attached
cargo is transported in the nucleus. DOPC: 1,2-Dioleoyl-sn-glycero-3-phosphocholine; NLS:
nuclear localization signal.
Figure 2.7 Nuclear-targeted drug delivery of Tat peptide-conjugated mesoporous silica
nanoparticles. (A) Preparing amino group- and Tat-FITC peptide-conjugated MSNs. (B) Transport
of DOX@MSNs-Tat across the nuclear membrane. (C) Confocal laser scanning microscopy images
of MSNs-Tat with diameters of (1) 25, (2) 50, (3) 67 and (4) 105 nm after incubation with HeLa
cells for (i) 4, ( ) 8 nd ( ) 24 . S l rs: 5 μm. APTES: Am nopropyl tr t oxy s l n ; CTAC:
Hexadecyltrimethylammonium chloride; MSN: Mesoporous silica nanoparticle; TEA: Tetraethyl
amine; TEOS: Tetraethyl orthosilicate.

XVI
Figure 3.1 Schematic illustration of VMSN, followed by amine-group and PEI modification.
Figure 3.2 Illustration of two-stage tomography process with (left) acquisition of an ensemble of
images (projections) about a single tilt axis and (right) the back-projection of these images into 3D
object space.
Figure 3.3 An atomic force microscope probes a molecule adsorption onto a surface, using a carbon
monoxide molecule at the tip for sensitivity.
Figure 3.4 Schematic illustration of a Surface Plasmon Resonance (SPR) system.
Figure 4.1 Illustration of: a) the synthesis procedure, and, b) the comparison of cellular delivery
performance between two nanocarriers. a) Sample 1 represents silica nanoparticles, which can be
further modified with positively charged amine groups or polyethylenimine (PEI). Sample 2
comprises the negatively charged silica nanoparticles with small diameters. Sample 3 was prepared
by using amino-modified 1 as the core and 2 as the shell particles after calcination, which is
modified with amine groups or PEI. b) Compared to smooth nanocarriers, rough ones exhibit both
higher binding ability towards biomolecules (e.g., proteins and genetic molecules) and increased
cellular uptake efficiency, independent of surface functionality.
Figure 4.2 Surface characteristics of 3. a,b) SEM images show the virus-mimicking rough surface.
c) A zero-tilt TEM projection from a tilt series. d) Reconstructed surface rendering of a single
particle. The core particle is shown in blue and the shell spikes in yellow. Scale bar: 100 nm.
Figure 4.3 Virus-mimicking nanoparticles enhance cellular delivery performance in HeLa cells. a,b)
Confocal microscopy images of Cy3-oligoDNA (red color) delivered by (left) 1 -NH2 and (right) 3 -
NH2 . The nuclei are stained in blue (DAPI) and the cell membranes in green (FITC). Scale bar: 20
μ m. ) FACS n lys s o Cy3-oligoDNA delivery, showing stronger Cy3- signals in MFI using 3 -
NH 2 than 1 -NH2. d) Identification of Cy3-oligoDNA binding for 1 -NH2 and 3-NH2. e)
Investigation of biomolecule holding ability calculated from gel retardation assay. f) Comparison of
cellular uptake efficiency of the complexes (1-NH2 / 3-NH2 +Cy3-oligoDNA) measured by
ICPOES. For bar charts, data represent mean ± s.e.m. **indicates p < 0.01,*** p < 0.001, **** p <
0.0001 based on a t -test.
Figure 4.4 Gene delivery performances of virus-mimicking nanoparticles in KHOS cells. a) The
inhibition of cell viability by PLK1-siRNA transfection. S10-siRNA was used as a negative control.
Both 1-PEI and 3-PEI were used as vectors, and a commercial reagent, OligofectamineTM
, was also
applied as a positive control. b) PLK1-siRNA adsorption ability of 1-PEI and 3-PEI. c) Comparison

XVII
of cellular uptake efficiency of the complexes (1-PEI/ 3-PEI+PLK1-siRNA) measured by ICPOES.
Data represent mean ± s.e.m. * indicates p < 0.05, *** p < 0.001 based on a t -test.
Figure 4.S1 TEM images of all samples and size distribution. a, e) sample 1 & 3. b, f) 1-NH2 & 3-
NH2. c, g) 1-PEI & 3-PEI. d) Sample 2 (shell particle). h) Size distribution curves obtained by the
dynamic light scattering (DLS) method.
Figure 4.S2 Surface area tested by Nitrogen adsorption. The surface area of 1 (with a smooth) and
3 (with a rough surface) was measured to be 19 and 24 m2/g, respectively.
Figure 4.S3 Confocal microscopy image shows no Cy3 signals is observed when the same amount
of Cy3-oligoDNA alone is incubated with cells, indicating the inability of genetic molecules
t ms lv s to p n tr t nto lls. S l r: 20 μm.
Figure 4.S4 FACS analysis showing the peak shifts in the MFI from HeLa cells incubated with the
complexes of 1-NH2 (blue colour)/ 3-NH2 (yellow colour) +Cy3- oligoDNA. The Cy3-oligoDNA
in the absence of nano-carriers (red colour) is used as a control.
Figure 4.S5 Comparison of cellular delivery of cargos among different nanoparticles. a, b, c) Very
weak signals were observed in the groups of naked Cy3-oligoDNA, Cy3- oligoDNA coupled with d,
e, f) 2-NH2 (0.9 μ /mL, dosage calculated from ET results) and g, h & i) 1-NH2. j, k & l) Only 3-
NH2 induced evident Cy3 signals across all groups.
Figure 4.S6 Agarose gel analysis. a) The complex of amino-modified nanocarriers with Cy3-
oligoDNA. Lane 0: 25 pmol Cy3-oligoDNA only. Lane 1: 25 pmol Cy3- oligoDNA coupled with
50 μ o 1-NH2. Lane 2: 25 pmol Cy3-ol oDNA oupl d w t 50 μ o 3-NH2. In the case of 1-
NH2, a small amount of released Cy3-oligoDNA was observed. For 3-NH2, nearly no release could
be seen by naked eyes. b, c) the complexes of PEI-modified nano-carriers with PLK1-siRNA. Lane
0: 25 pmol PLK1- siRNA only. Lane 1, 2, 3: 100, 50 and 25 pmol PLK1-siRNA are coupled with
50 μ o 1-PEI and 3-PEI, respectively. In each lane from 1 to 3, the PLK1-siRNA release was
evident in the case of 1-NH2, compared to that of 3-NH2.
Figure 4.S7 Investigation of pure silica nano-carriers in adsorption and cellular uptake. a)
Cytochrome C adsorption. The adsorption amount is 2.71 nmol/mg on 3, and 0.88 nmol/mg on 1. b)
cellular uptake into KHOS cells. 128 pg/cell was internalized for 3, while 62 pg/cell for 1. c)
cellular uptake into HeLa cells. 242 pg/cell was internalized for 3, while 187 pg/cell for 1. Data
represent mean ± s.e.m of three independent experiments. *p<0.05, ***p<0.001,****p<0.0001 (t-
test).

XVIII
Figure 4.S8 Cytotoxicity of nanoparticles. a, b) sample 1 & 3 in HeLa (left) and KHOS (right) cells.
c, d) 1-NH2 & 3-NH2 in HeLa (left) and KHOS (right) cells. e) 1-PEI & 3- PEI in KHOS cells.
Pure and amino-modified silica nanoparticles have relatively mild cytotoxicity to both HeLa and
KHOS cells, and the ones with rough surface are more toxic due to the improved cellular uptake.
However, the attachment of PEI caused a high toxicity to cells, so that the concentrations of 1-PEI
& 3-PEI w ll d r s d to 20 μ /mL in gene silencing experiment. Data represent mean ± s.e.m
of three independent experiments.
Figure 4.S9 Gene delivery performance of virus-mimicking nanoparticles in KHOS cells using
amino-modified nanoparticles. Neither PLK1-siRNA nor S10-siRNA delivered by 1-NH2 and 3-
NH2 induced the decrease of cell viability by gene silencing effect. In the bar chart, data represent
mean ± s.e.m of three independent experiments, and were analyzed using t-test.
Figure 4.S10 TGA of PEI-conjugation. In both a) 1–PEI and b) 3-PEI, the TGA curves of (i)
represent pure silica nanoparticles, (ii) show epoxy-group modified nanoparticles, (iii) are the PEI-
conjugated separately.
Figure 4.S11 Morphology adjustment of virus-mimicking nanoparticles. After fabricating the virus-
mimicking nanoparticles by mixing shell particles with core particles, morphology changes were
traced by TEM images. On adjusting the feed volumes of shell particle solutions from a) 0.68 mL to
b) 1.35 mL, to 2.70 mL (Figure. S1e), to c) 5.40 mL and finally to d) 6.75 mL, the surface
morphologies changed significantly, with the best sample being obtained when the feed volume was
2.70 mL. It is noted that a failure to obtain optimized virus-mimicking morphologies can be
attributed to either insufficient or excessive feed amount of shell particles, where only a proper feed
amount will lead to successful synthesis. Scale bar: 100 nm.
Figure 4.S12 The influence of calcination treatment. TEM image a) shows that without calcination,
shell particles peeled off on ultrasonication. In contrast, b) shows that the calcined sample 3
maintained its morphology after ultrasonication. Scale bar: 100 nm.
Figure 5.1 Schematic illustrations of the synthesis of RSNs using a "neck-enhancing" approach (a)
and a conventional interaction approach (b). Scheme c shows the cellular delivery of therapeutic
anti-pAkt antibody using C18-RSNs and the cell growth inhibition mechanism.
Figure 5.2 TEM (a-d) and HRSEM (e-h) images of RSNs with varied shell particle sizes: a&e)
RSN-211@13, b&f) RSN-211@28, c&g) RSN-211@54, d&h) RSN-211@98 and the red arrows
indicate the formation of bigger “n ks” onn t n s ll nd or p rt l s. S l r: 100nm.

XIX
Figure 5.3 Protein Adsorption profiles ( IgG-A; IgG-F; ▲ yto rom c). Solid lines represent
different protein adsorption onto unmodified rough silica nanoparticles. The dash line also
represents the IgG-A adsorption onto different rough silica nanoparticles, except they are all
modified with C18-groups. Data represent mean ± SD. Specific surface area variations (×) of
different unmodified rough silica nanoparticles are displayed to compare with protein adsorption
trend.
Figure 5.4 Surface topography studies. AFM images of RSN-211@54 before (a) and after (c) the
adsorption of IgG-F. A cross-sectional line is drawn to characterize the height changes of shell
particles on the top region before (b) and after (d) protein adsorption. Scale bar: 100 nm.
Figure 5.5 SPR sensorgrams showing the binding signals of RSN-IgG-F complexes with receptors.
All RSN-IgG-F complexes showed positive values of the binding with ligand.
Figure 5.6 Cell growth inhibition by the delivery of therapeutic protein. a) Cell viability of MCF-7
cells incubated with increasing concentrations of C18-RSN-211@98+anti-pAkt (), C18-RSN-
211@98+non-specific-IgG-A (♦) nd C18-RSN-211@98. Data represent mean ± SD. b) Western
blotting confirming the degradation of downstream anti-apoptotic protein, Bcl-2 in MCF-7 cells.
Blots presented are representative of typical results. GAPDH served as an internal reference.
Figure 5.S1 TEM images (a-g) and particle size distribution curves (f) of shell and core particles.
Shell particles: a&h-i) 13nm, b&h-ii) 28nm, c&h-ii) 54nm, d&h-iv) 98nm, e&h-v) 135nm and f&h-
vi) 175nm. Core particle: g&h-vii) 211nm. Scale bar: 100 nm
Figure 5.S2 The interspacing distance of RSNs. a) RSN-211@13, b) RSN-211@28, c) RSN-
211@54, d) RSN-211@98. The interspaces are measured from SEM images by recording 50 edge-
to-edge interspacing data in each sample.
Figure 5.S3 TEM images showing the synthesis of RSN-211@28 using previous recipe after
washing and drying process (a) and in reaction solution (b). Scale bar: 100 nm
Figure 5.S4 TEM images of failed synthesis of RSNs with much larger shell sizes. a) Core particles
(dotted arrow) mixed with the shell of 135 nm (solid arrow), b) Core particle (dotted arrow) mixed
with the shell of 175 nm (dotted arrow). Scale bar: 100 nm.
Figure 5.S5 Fourier transform infrared (FTIR) spectra of pure liquid n-ODMS (a) and a series of
RSNs with and without hydrophobic modification (b).

XX
Figure 5.S6 TEM images of hydrophobic modified RSNs. a) C18-RSN-211@13, b) C18-RSN-
211@28, c) C18-RSN-211@54 and d) C18-RSN-211@98 (d). Scale bar: 100 nm.
Figure 5.S7 Cell viability of MCF-7 cells incubated with varying concentrations of non-specific
IgG-A () only and anti-pAkt antibody () only, respectively. Data represent mean ± SD.
Figure 5.S8 The comparison of anti-pAkt antibody delivery efficiency (a) and cellular uptake
performance of C18-RSNs measured by ICPOES. (b) Data represent mean ± SD.
Figure 6.1 TEM (a, b, d, e) and HRSEM (c) images and particle size distribution curves (f) of RSN
(a&f-i), C18-RSN (b, c&f-ii), SSN (d&f-iii), C18-SSN (e&f-iv). Scale bar: 100 nm.
Figure 6.2 (a) RNase A adsorption and (b) release profiles of SSN, RSN, C18-SSN and C18-RSN.
Data represent mean ± SD.
Figure 6.3 Cellular uptake performance of RNase A loaded nanoparticles in (a) MCF-7 and (b)
SCC-25 cells, measured by ICPOES. Cells only were used as a control group. Data represent mean
± SD.
Figure 6.4 Typical TEM images of ultra-thin sections of MCF-7 cells incubated with (a) SSN, (b)
RSN, (c) C18-SSN and (d) C18-RSN for 24 h. White arrow indicates cell membrane (CM), black
arrow indicates nanoparticles entrapped in endosome (E) or lysosome (L), black arrowhead shows
locally disrupted membrane of endosomes, black dash arrow indicates nanoparticles distributed in
cytoplasm (C). "N" refers to nucleus. Scale bar: 100 nm.
Figure 6.5 Cell viability of (a) MCF-7 and (b) SCC-25 cells treated with RNase A at a dosage of 2
μ /mL after 24, 48, and 72 h incubation. Data represent mean ± SD.
Figure 6.S1 TEM images (a) OH-core particle, (b) NH2-core particle and (c) shell particle. Scale
bar: 100 nm. (d) Particle size distribution curves.
Figure 6.S2 Fourier transform infrared (FTIR) spectra of (a) pure liquid OTMS, (b) bare
nanoparticles, (c) RNase A and (d) nanoparticles complexed with RNase A.
Figure 6.S3 (a, c, e) AFM images and (b, d, f) void height profiles of (a & b) RSN, (c & d) C18-
RSN and (e & f) C18-RSN + RNase A, generated by drawing a typical cross-sectional line on the
top region, Scale bar: 100 nm. The average height values are measured and calculated by recording
20 data. Data represent mean ± SD.

XXI
Figure 6.S4 Particle size distribution curves tested in PBS. (a) SSN, (b) C18-SSN, (c) RSN and (d)
C18-RSN.
Figure 6.S5 Silica dissolution of different nanoparticles, tested by (a) ICPOES and TEM images of
(b) SSN, (c) C18-SSN, (d) RSN and (e) C18-RSN, after shaking in PBS for 3 days. Scale bar: 100
nm.
Figure 6.S6 RNase A release profiles of SSN, RSN, C18-SSN and C18-RSN at (a) acidic condition
(pH 4.5) and (b) in DMEM under static condition at 37 °C for 4 h. Data represent mean±SD.
Figure 6.S7 The evaluation of toxicity from pure nanoparticles (a,c,e) in MCF-7 cells and (b,d,f) in
SCC-25 cells, at 24 h, 48 h and 72 h, respectively. Data represent mean ± SD.
Table 2.1 Function and features of nucleic acids as therapeutic agents for gene therapy.
Table 2.2. Function and features of different therapeutic proteins for cancer therapy.
Table 4.S1 Physicochemical Properties of nanoparticles
Table 4.S2 Atomic composition (%) of nanoparticles
Table 4.S3 Characterization of PEI-modification by TGA
Table 5.S1 Size and ζ potential characterizations of shell and core particles.
Table 5.S2 Characterizations of RSNs with varied surface topography.
Table 5.S3 Estimation of protein coverage on RSNs/C18-RSNs
Table 5.S4 SPR signal intensity.
Table 6.1 Summary of the contribution of surface roughness and hydrophobic modification
Table 6.S1 Size and ζ pot nt l r t r z t ons o n nop rt l s.
Table 6.S2 DLS size measurements in PBS
Table 6.S3 RNase A adsorption density and C18-modification characterization of nanoparticles

XXII
List of abbreviations used in the thesis
Pc4: silicon phthalocyanine 4
MDR: multiple drug resistance
PDT: photodynamic therapy
DNA: deoxyribonucleic acid
RNA: ribonucleic acid
pDNA: plasmid DNA
PLL: poly-l-lysine
PS: polystyrene
PEI: polyethyleneimine
miRNA: microRNA
siRNA: small interfering RNA
mRNA: messenger RNA
SELEX: systematic evolution of ligands by
exponential enrichment
MSNs: mesoporous silica nanoparticles
RNAi: RNA interference
RISC: RNA-induced silencing complex
MB: molecular beacon
MF: magnetic fluorescence
FDA: food and drug administration
RNase A: ribonuclease A
mAb: monoclonal antibody
TAA: tumor-associated antigen
HPV: human papillomavirus
RBC: red blood cell
RES: reticuloendothelial system
DOX: doxorubicin
BSA: bovine serum albumin
PEG: polyethylene glycol
Tf: transferrin
PAA: poly(acrylic acid)
PLGA: poly(lactic-co-glycolic acid)
PFT: pore-forming toxin
LLV: leuko-like vector
RGD: Arg-Gly-Asp
CREKA: Cys-Arg-Glu-Lys-Ala
HUVEC: human umbilical vein endothelial
cell
CME: clathrin-mediated endocytosis
CvME: caveolae-mediated endocytosis
IEP: isoelectric point
PBS: phosphate buffered saline
AP: 3-aminopropyl
GP: guanidinopropyl
GEGP: 3-[N-(2-guanidinoethyl)-
guanidino]propyl
XXIII
FAP: N-folate-3-aminopropyl
hMSC: human mesenchymal stem cell
ROS: reactive oxygen species
SCC-25: human squamous carcinoma cells
PAMAM: polyamidoamine
R8: octaarginines
FP: fusogenic peptides
NLS: nuclear localization signal
NPC: nuclear pore complex
ER: endoplasmatic reticulum
CM: chloromethyl
MP: mercaptopropyl
Oc: octyl
FCS: fetal calf serum
EPR: enhanced permeation and retention
CTAB: cetyltrimethylammonium bromide
CTAC: hexadecyltrimethyl ammonium
chloride
TEA: tetraethyl amine
HMSN: hollow mesoporous silica
nanoparticle
MOSF: macroporous ordered siliceous foam
PMO: periodic mesoporous organosilica
AR: aspect ratio
TEOS: tetraethyl orthosilicate
APTES: (3-aminopropyl)triethoxy silane
VMSN: virus-mimicking silica nanoparticle
n-ODMS/OTMS: n-octadecyltrimethoxy
silane
3-GPS: 3-glycidoxypropyl trimethoxysilane
TEM: transmission electron microscopy
SEM: scanning electron microscopy
UED: upper electron detector
ET: electron tomography
3D: three-dimensional
DLS: dynamic light scattering
ZP: zeta potential
BET: Brunauer–Emmett–Teller
ATR-FTIR: attenuated total reflectance -
Fourier transform infrared spectroscopy
EA: elemental analysis
AFM: atomic force microscopy
SPM: scanning probe microscope
ICP-OES: inductively coupled plasma-optical
emission spectroscopy
RU: resonance unit
SPR: surface plasmon resonance
EMSA: electrophoretic mobility shift assay
CLSM: confocal laser scanning microscopy

XXIV
MTT: 3-[4,5-dimethylthiazol-2-yl]-2,5-
diphenyl tetrazolium bromide
FITC: fluorescein-5-isothiocyanate
HSV: herpes simplex virus
HIV: human immunodeficiency virus
Cy3: cyanine 3
FACS: fluorescein-activated cell sorting
MFI: fluorescence intensity
PLK1: polo-like kinase 1
XPS: X-ray photoelectron spectroscopy
TGA: thermogravimetric analysis
DMEM: Dulbecco's Modified Eagle's
Medium
DMEM/F12: Dulbecco's modified Eagle's
medium and Ham's F12 medium
DAPI: 4’-6-diamidino-2-phenylindole
TAE: tris-acetate-EDTA
PFA: paraformaldehyde
RSN: rough silica nanoparticle
ATCC: American Type Culture Collection
SDS-PAGE: sodium dodecyl sulphate-
polyacrylamide gel electrophoresis
IgG-A: IgG antibody
IgG-F: IgG fragment
C18-SSN: octadecyl-functionalized smooth
silica nanoparticles
SR: surface roughness

Chapter 1 Introduction
1
Chapter 1
Introduction
1.1 Significance of the project
Effective cellular delivery of various drugs and/or biomolecules is pivotal to satisfy the
requirements of modern medicine.1, 2
Most naked biomolecules and some free drugs are poorly
delivered to cells owing to poor stability, low solubility and/or unwanted toxicity. For these reasons,
various natural particulates and synthetic vectors have been used as cellular delivery vehicles.
Natural particulates, for example, enveloped viruses, have evolved sophisticated mechanisms that
make use of or shield off cellular signalling and transport pathways to traffic within host cells and
deliver cargos into the appropriate subcellular compartment with maximal efficiency.3 However,
several limitations are associated with viral vectors, such as carcinogenesis,4 immunogenicity,
5
broad tropism,6 limited DNA packaging capacity
7 and difficulty of vector production,
8 and an
alternative solution is required. Inspired by viruses, currently, many research attempts have focused
on the synthesis of non-viral delivery systems by mimicking the advantages of viruses, including
the attachment of viral receptors (e.g., Tat9), the imitation of virus core-shell structure10
and the
incorporation of functional polymer to mimic endosomal escape of viruses.11
However, there are
still some parameters of viruses requiring intensive study, for example, the contribution of viral
surface topography to intracellular delivery.
The understanding of structure–function relationships of enveloped viruses provides a useful guide
for the design of new nanocarriers. Recent developments in state-of-the art electron tomography
(ET) v prov d d “n no- olo y” n orm t on or m ny nv loped viruses, for example,
influenza virus,12
herpes simplex virus (HSV),13
and human immunodeficiency virus (HIV),14
all
showing rough surfaces patched by glycoprotein spikes. However, the influence of nanoscale
surface roughness on cellular delivery efficiency remains unclear because it is always associated
with receptor–ligand specific interactions in viral systems. Therefore, a systematic study to explore
the impacts of surface roughness of nano-vectors on the improvement of cargo delivery is required.
Chapter 1 Introduction
2
1.2 Research objectives and scope
This research aims to develop a novel approach to prepare silica-based non-viral vectors by
mimicking the surface topography of enveloped viruses and gain insight into the roles of surface
roughness variation and surface functionality (e.g. polyethylenimine and octadecyl-group) in
biomolecule (e.g. siRNAs and therapeutic proteins) delivery performance. This thesis does not only
focus on the development of facile synthesis of nanoparticles with novel structures, but also
provides some guidelines for the design of highly efficient delivery systems for various biomedical
applications. The objectives of this project are specified as follows:
1) To fabricate silica nanoparticles with virus-mimicking rough morphology and particle size
smaller than 300 nm, and to confirm the significance of VMRM in intracellular delivery of genetic
molecules.
2) To synthesize silica nanoparticles with varied surface roughness for controlled therapeutic
protein adsorption and optimized protein therapeutics.
3) To understand the effects of the surface morphology and functionality of silica nanoparticles on
therapeutic protein adsorption, cellular uptake, cargo release and endosomal escape.
1.3 Thesis outline
This thesis is written according to the guidelines of the University of Queensland. The outcomes of
this PhD thesis are presented in the form of journal publications. The chapters in this thesis are
presented in the following sequence:
Chapter 1 Introduction
This chapter introduces the background of this project and outlines the research objectives
Chapter 2 Literature review
This chapter presents an overview on recent advances in bio-inspired drug delivery systems and the
current strategies to engineer silica-based nanoparticles as effective genetic molecules and
therapeutic protein carriers.
Chapter 3 Methodology
This chapter summarizes the strategies utilized in the whole PhD project, including material
synthetic methods for virus-mimicking silica nanoparticles, and the techniques for material
characterizations and biology experiments.

Chapter 1 Introduction
3
Chapter 4 Nanoparticles Mimicking Viral Surface Topography for Enhanced Cellular
Delivery
This chapter reports the synthesis of novel non-viral nanoparticles mimicking virus surface
topography by attaching small shell particles (~10nm) onto the core particles with large sizes
(~200nm). The increase in nanoscale surface roughness improved both binding of biomolecules
(e.g., genetic molecules) and cellular uptake, regardless of surface functionality and cell types.
Moreover, the delivery efficiency of siRNA was significantly increased, compared to conventional
silica nanoparticles with a smooth surface and a commercial transfection reagent.
Chapter 5 Synthesis of Silica Nanoparticles with Controllable Surface Roughness for
Therapeutic Protein Delivery
This chapter reports a novel "neck-enhancing" approach to synthesize silica nanoparticles with
controlled surface roughness. By roughening the surface of silica core particles (211 nm in
diameter) with smaller shell particles having various sizes, a series of rough silica nanoparticles
(RSNs) with stable structures were obtained. The interspacing distance between neighbouring shell
particles increased from 7 to 38 nm with increasing shell particle sizes from 13 to 98 nm. Protein
loading capacity was dependent on both protein molecule size and interspacing distance, and
protein binding activity was not influenced. Hydrophobically modified RSNs with the interspacing
distance of 38 nm showed effective intracellular delivery of anti-pAkt antibody in breast cancer
MCF-7 cells, leading to significant cell growth inhibition by blocking pAkt and the downstream
anti-apoptotic protein of Bcl-2.
Chapter 6 Understanding the Contribution of Surface Roughness and Hydrophobic
Modification on Silica Nanoparticles for Enhanced Therapeutic Protein Delivery
This chapter quantitatively demonstrates both the individual and combined contributions of surface
roughness and hydrophobic modification for the improvement of protein therapeutics. Both surface
roughening and hydrophobic modification enhance protein (RNase A) adsorption capacity, while
the effect of surface roughness is more dominant. Hydrophobic modification strongly retards RNase
A release. The contribution difference to enhance cellular uptake is cell type-dependent.
Importantly, only surface chemistry, i.e., hydrophobic modification in this work, facilitates the
release of nanoparticle/cargo molecules from endosome/ lysosome entrapment. Collectively,
octadecyl-functionalized rough silica nanoparticle (C18-RSN) shows the best performance in
RNase A delivery, causing significant cell viability inhibition in both human breast cancer (MCF-7)

Chapter 1 Introduction
4
and SCC-25 cell lines, compared to unmodified rough silica nanoparticle and smooth silica
nanoparticles with or without octadecyl-group modification.
Chapter 7 Conclusion and outlook
This chapter presents a general discussion of the work in this thesis and outlook for the future work.
1.4 References
1 Y. Niu, A. Popat, M. Yu, S. Karmakar, W. Gu and C. Yu, Ther. Deliv., 2012, 3, 1217-1237.
2 R. A. Morgan, M. E. Dudley, J. R. Wunderlich, M. S. Hughes, J. C. Yang, R. M. Sherry, R. E.
Royal, S. L. Topalian, U. S. Kammula, N. P. Restifo, Z. L. Zheng, A. Nahvi, C. R. de Vries, L. J.
Rogers-Freezer, S. A. Mavroukakis and S. A. Rosenberg, Science, 2006, 314, 126-129.
3 D. J. Glover, Infect. Disord. Drug Targets, 2012, 12, 68-80.
4 C. Baum, O. Kustikova, U. Modlich, Z. X. Li and B. Fehse, Hum Gene Ther, 2006, 17, 253-263.
5 N. Bessis, F. J. GarciaCozar and M. C. Boissier, Gene Ther, 2004, 11, S10-S17.
6 R. Waehler, S. J. Russell and D. T. Curiel, Nat Rev Genet, 2007, 8, 573-587.
7 C. E. Thomas, A. Ehrhardt and M. A. Kay, Nat Rev Genet, 2003, 4, 346-358.
8 D. Bouard, N. Alazard-Dany and F. L. Cosset, Brit J Pharmacol, 2009, 157, 153-165.
9 L. Pan, Q. He, J. Liu, Y. Chen, M. Ma, L. Zhang and J. Shi, J. Am. Chem. Soc., 2012, 134, 5722-
5725.
10 E. S. Lee, D. Kim, Y. S. Youn, K. T. Oh and Y. H. Bae, Angew. Chem. Int. Edit., 2008, 47,
2418-2421.
11 N. P. Truong, W. Y. Gu, I. Prasadam, Z. F. Jia, R. Crawford, Y. Xiao and M. J. Monteiro, Nat.
Commun., 2013, 4.
12 A. Harris, G. Cardone, D. C. Winkler, J. B. Heymann, M. Brecher, J. M. White and A. C.
Steven, P. Natl. Acad. Sci. USA., 2006, 103, 19123-19127.
13 K. Grunewald, P. Desai, D. C. Winkler, J. B. Heymann, D. M. Belnap, W. Baumeister and A. C.
Steven, Science, 2003, 302, 1396-1398.
14 P. Zhu, J. Liu, J. Bess, E. Chertova, J. D. Lifson, H. Grise, G. A. Ofek, K. A. Taylor and K. H.
Roux, Nature, 2006, 441, 847-852.
Chapter 2 Literature Review
5
Chapter 2
Literature Review
This chapter reviews the advances in the rational design of bio-inspired nanocarriers for drug
delivery. It begins with an introduction of the development of modern medicines in 2.1. Therapeutic
proteins and genetic molecules as promising medications for cancer therapy will be introduced in
details in this section. The recent achievements of bio-inspired drug delivery systems will be
summarized in 2.2. Afterwards in 2.3, the engineering of silica-based nanoparticles (SiNPs) will be
systematically described for controlled cargo delivery. Finally, a summary of current state-of-the-art
technology and future challenges to fabricate bio-inspired SiNPs are proposed in 2.4. Part of the
contents in this literature review has been published as a review paper. (Y. Niu, A. Popat, M. Yu,
S. Karmakar, W. Gu, C. Yu, Therapeutic Delivery. 2012, 3, 1217 – 1237).
2.1 Modern medications for bio-application
Small molecule drugs are the most commonly used for cancer treatment, such as hydrophilic
anticancer drug of doxorubicin,1 hydrophobic drug of tamoxifen
2 and curcumin,
3 as well as
hydrophobic photosensitiser of silicon phthalocyanine 4 (Pc4) for photodynamic therapy (PDT).4
However, pharmaceutical drugs have evident drawbacks of non-specific toxicity to normal cells and
multi-drug resistance (MDR). Therefore, new drugs with better safety and high specificity are
required. Currently, genetic and protein-based biomolecules have attracted increasing attention as
new therapeutics. In the follow part, the classifications of both genetic and protein-based molecules
with therapeutic potential will be summarized.
2.1.1 Therapeutic nucleic acids for gene therapy
With the developments in gene engineering and the understanding of pathogenesis in molecular
level, the efficiency of gene therapy has been significantly improved, especially in the last decade.
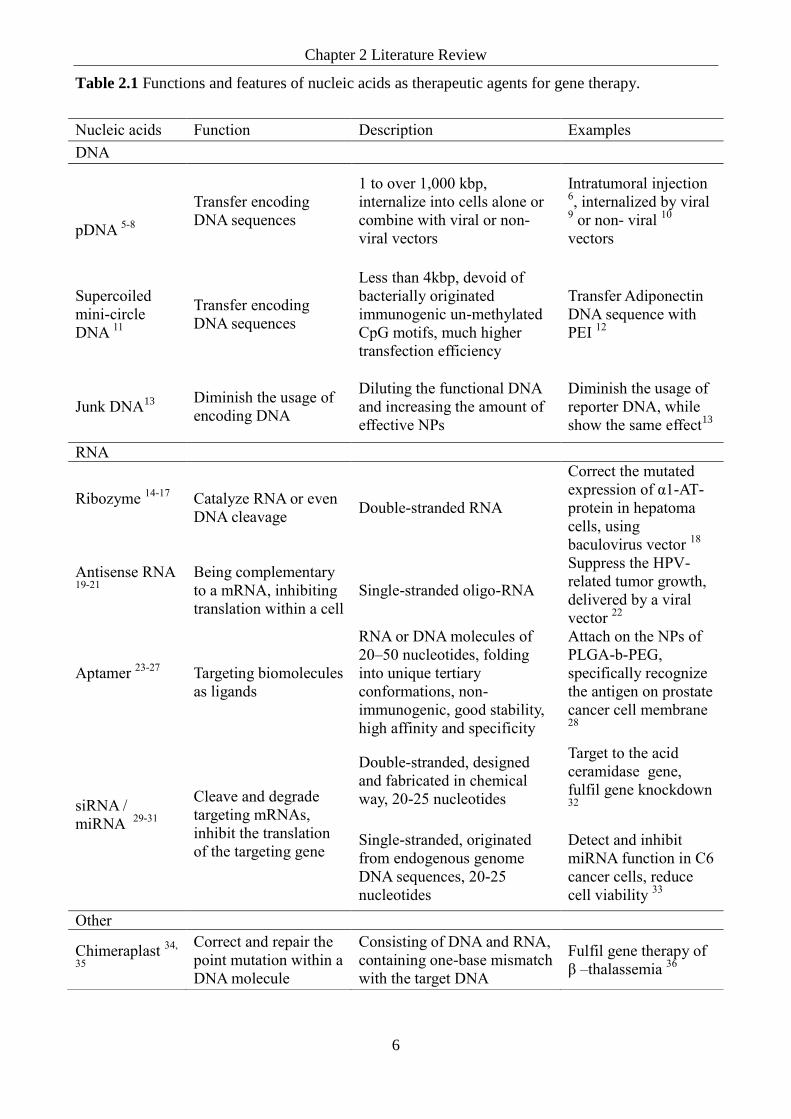
In this part, various therapeutic DNA/RNA molecules will be summarized. Table 2.1 summarizes
the features of functional nucleic acids and their application in gene therapy.
Chapter 2 Literature Review
6
Table 2.1 Functions and features of nucleic acids as therapeutic agents for gene therapy.
Nu l ds Fun t on D s r pt on Ex mpl s
DNA
pDNA 5-8
Tr ns r n od n
DNA s qu n s
1 to ov r 1,000 k p,
nt rn l z nto lls lon or
om n w t v r l or non-
v r l v tors
Intr tumor l nj t on 6, nt rn l z d y v r l 9 or non- v r l
10
v tors
Sup r o l d
m n - r l
DNA 11
Tr ns r n od n
DNA s qu n s
L ss t n 4k p, d vo d o
t r lly or n t d
mmuno n un-m t yl t d
CpG mot s, mu r
tr ns t on n y
Tr ns r Ad pon t n
DNA s qu n w t
PEI 12
Junk DNA13
D m n s t us o
n od n DNA
D lut n t un t on l DNA
nd n r s n t mount o
t v NPs
D m n s t us o
r port r DNA, w l
s ow t s m t13
RNA
R ozym 14-17
C t lyz RNA or v n
DNA l v Dou l -str nd d RNA
Corr t t mut t d
xpr ss on o α1-AT-
prot n n p tom
lls, us n
ulov rus v tor 18
Ant s ns RNA 19-21
B n ompl m nt ry
to mRNA, n t n
tr nsl t on w t n ll
S n l -str nd d ol o-RNA
Suppr ss t HPV-
r l t d tumor rowt ,
d l v r d y v r l
v tor 22
Apt m r 23-27
T r t n omol ul s
s l nds
RNA or DNA mol ul s o
20–50 nu l ot d s, old n
nto un qu t rt ry
on orm t ons, non-
mmuno n , ood st l ty,
n ty nd sp ty
Att on t NPs o
PLGA- -PEG,
sp lly r o n z
t nt n on prost t
n r ll m m r n 28
s RNA /
m RNA 29-31
Cl v nd d r d
t r t n mRNAs,
n t t tr nsl t on
o t t r t n n
Dou l -str nd d, d s n d
nd r t d n m l
w y, 20-25 nu l ot d s
T r t to t d
r m d s n ,
ul l n kno kdown 32
S n l -str nd d, or n t d
rom ndo nous nom
DNA s qu n s, 20-25
nu l ot d s
D t t nd n t
m RNA un t on n C6
n r lls, r du
ll v l ty 33
Ot r
C m r pl st 34,
35
Corr t nd r p r t
po nt mut t on w t n
DNA mol ul
Cons st n o DNA nd RNA,
ont n n on - s m sm t
w t t t r t DNA
Ful l n t r py o
β –t l ss m 36

Chapter 2 Literature Review
7
2.1.1.1 DNA-based therapeutics
Plasmid DNA
A plasmid DNA (pDNA) is a double-stranded and circular DNA molecule, with the size fluctuating
from 1 to over 1,000 kilo base pair (kbp), and it has been widely used in the fields of biology and
medicine, for example, cancer therapy. The pDNAs are usually collected from bacteria, although
some of them are found in eukaryotic organisms (e.g. 2 µm plasmid DNA in Saccharomyces
cerevisiae5). Independent from chromosomal DNA, pDNAs are able to replicate and stably pass to
daughter cells.
The application of pDNA with inserted functional DNA sequences as a framework for gene therapy
has attracted much attention during the last decade. Although some researchers reported similar
transfection and expression efficiency of naked pDNA, compared to equipped ones6, it is reported
only a thousandth of the presented naked pDNAs to cells can successfully arrive at the nucleus and
express,37
because they may be quickly digested by nucleases or cleared from blood circulation.7, 8
Many methods and materials have been selected as pDNA vectors. For instance, by electrostatic
force-driven complexation with pDNA, polymer-based (e.g. poly-l-lysine [PLL]-polystyrene [PS]38
)
DNA vaccine has shown great induction of CD8+ T cell immune response to viruses. In addition,
the expression product of a pDNA, such as GFP39, 40
and luciferase10
, may exhibit fluorescent signal
for diagnosis and simulation of gene therapy.
Minicircle
Minicircle is a newly discovered member of pDNA. This kind of circular DNA molecules with
mini-size (~4 kbp) is able to avoid the disadvantages of conventional pDNA, such as a risk of
uncontrolled dissemination of therapeutic gene or antibiotic resistance gene sequence originating
from bacterial,11
because those genes, together with native regulatory gene sequences, have been
removed, and minicircles will not replicate and be passed to daughter cells. Park et al. performed
the adiponectin gene delivery, using a minicircle-polyethylenimine (PEI) complex to treat diet
induced obese C57BL/6J mice, and it showed higher adiponectin expression than conventional
pDNA in vitro and in vivo.12
Junk DNA
Apart from functional DNA, non-coding DNA molecules, known as junk DNA, have shown some
interesting effects on improving transfection efficiency and, meanwhile, decreasing active DNA
usage. Van Gaal et al. 13
confirmed that by using the same amount of PEI as the vector and the same

Chapter 2 Literature Review
8
vector to cargo (DNA) ratio, similar transfer activity was observed between the loading of pure
reporter pDNA and the mixture of reporter pDNA with junk DNA. The results have demonstrated
the total amount of active DNA-containing vectors is more important rather than total DNA cargos.
2.1.1.2 RNA-based therapeutics
RNA is another big family of therapeutic nucleic acids, mainly including ribozymes, aptamers,
microRNAs (miRNAs) and small interfering RNAs (siRNAs). Numerous RNA-based therapeutics
are currently under clinical investigation for diseases ranging from HIV infection to genetic
disorders to various cancers.41
As a result of their flexibility and versatility in structure and
function,42-45
gene therapy protocols could be designed in various ways. However, due to the
instable feature of RNA molecules, vehicles to target cells are required.
Ribozyme
A ribozyme is a type of double-stranded RNA molecules. Due to the unique tertiary structure,14-16
it
possesses the ability to catalyse RNA or even DNA cleavage (e.g., hairpin ribozyme14
or
hammerhead ribozyme15-17
), which has the potential to regulate gene expression. For example,
Ozaki and coworkers reported a hammerhead ribozyme was used to correct the mutated expression
o α1- ntryps n (α1-AT)-protein in hepatoma cells.18
In addition, using baculovirus as a vector,
HIV-1 replication was significantly suppressed by HIV-1 U5 gene-specific ribozyme.46
Antisense RNA
An antisense RNA is a single-stranded oligo-RNA. Being complementary to a messenger RNA
(mRNA), it is able to inhibit translation processes.19, 20
Antisense RNAs are confirmed to exist
widely in nature, and up to 72% of the transcripts are demonstrated to have antisense partners in
human and mouse transcriptomes,21
which show antisense RNAs have promising exploitation in
gene therapy. For example, Zhu et al. reported that PLL-modified SiNPs could successfully
compact and protect the antisense c-myc.47
After transfection, c-myc mRNA levels were
significantly deregulated. In addition, Barnor et al. showed the replication of HIV-1 vif antisense
RNA fragments in MT-4 and H9-infected cells and reduced HIV-1 vif mRNA transcripts.48
Aptamer
To be different from protein-based ligands (e.g. proteins23
and ATP24
), aptamers are very good
candidates for biomolecular targeting. They are RNA/DNA molecules of 20–50 nucleotides in
length, and selected from in vitro experiments (termed SELEX: systematic evolution of ligands by
exponential enrichment).25, 26
They are able to fold into the unique tertiary conformation to bind

Chapter 2 Literature Review
9
with viral or cellular proteins with high affinity and specificity.27
Better than common protein-based
ligands, aptamers are non-immunogenic and have evident stability in a wide range of pH (4–9),
temperature, and organic solvents without the loss of activity. Their synthesis is an entirely
chemical process that can decrease batch-to-batch variability when production is scaled up.28
Usually, aptamers are used as ligands for cell recognition. For example, sgc8-aptamer was
covalently connected to mesoporous silica nanoparticles (MSNs)-polyelectrolyte multilayer-
complex for specific cell recognition. 49
Interestingly, some aptamers also have the ability to
specifically block protein functions, such as, transcription factors in E2F family, so that cell
proliferation can be controlled.50-52
siRNA and miRNA
RNA interference (RNAi) is a post-transcriptional level process that suppresses the activity of
specific genes and is referred to as "gene silencing", discovered by Fire and Mello in 1998.31
Two
types of non-coding small RNA molecules – miRNA (single-stranded, originated from endogenous
genome DNA sequences) and siRNA (double-stranded, designed and fabricated in chemical way)
are pivots to RNAi, and both of them have the length of 20-25 nucleotides. By the activation of
RNA-induced silencing complex (RISC), both siRNAs and miRNAs are able to cleave and degrade
targeting mRNAs. Nowadays, they have been effective and popular agents for studying and treating
diseases, such as cancer, respiratory disease, neuronal disease, and autoimmune disease.29, 30
Due to their different origins, siRNAs and miRNAs are exploited in different ways. In cancer cells,
some miRNAs are over expressed, and these will wrongly up- or down-regulate cell activity. In that
case, the deregulation of miRNAs is a fundamental treatment to the pathogenesis of many cancers.53
For instance, Kim et al. conjugated the miRNA-221 molecular beacon (miR-221 MB) on a
magnetic fluorescence NP and transferred the complex into C6 (glial cell) cancer cells,33
and a
significant reduction in cell viability of cancers was observed. On the contrary, siRNAs were often
directly delivered into cells to down-regulate the expression of a specific gene. Ashley et al.
reported a successful gene silencing using large pore MSN-lipid bilayers containing siRNAs in
pores, leading to significant regression of protein expression and apoptosis.54
Chimeraplasty
Besides pure DNA/RNA molecules, chimeric RNA–DNA oligonucleotides (termed as
chimeraplasts) have been designed as therapeutics. First, they will pair with related genomic DNA
sequences, and then correct and repair the point mutation within the sequence. The designed one-
base mismatch between a chimeraplast and the mutated chromosomal DNA will activate endog-

Chapter 2 Literature Review
10
enous repair mechanisms, in order to produce a single nucleotide replacement.34, 35
For example, Li
et al. d s n d RNA/DNA ol onu l ot d s or n t r py o β–thalassemia, and nucleotide
mut t on n β-globin gene cluster was successfully corrected.36
However, not every study supports
this mechanism. Tagalakis et al.55
have attempted to create a point mutation in the mouse ApoE
gene by microinjection of chimeraplast, to confirm the potential to design defined mutations.
Despite of successful transfection of chimeraplasts into one-cell mouse eggs, no evidence for
successful conversion was observed.
2.1.2 Therapeutic proteins for cancer therapy
Nowadays, hundreds of proteins and peptides applied as therapeutic agents have been approved for
clinical use by the US Food and Drug Administration (FDA). This indicates that protein-based
therapeutics with variable functions and applications has attracted increasing attention in modern
medicine. In this part, the classification of protein-based therapeutics and their potential for cancer
therapy is summarized (Table 2.2).
2.1.2.1 Enzyme
Enzymatic proteins are superior catalysts that can specifically decompose substrates in
physiological conditions, converting target molecules into products and amplifying following chain
reactions.56
Because of these unique properties, enzymatic proteins have been considered as
therapeutic agents in cancer therapy since the beginning of 20th
century.57
Intracellular delivery of proteins with enzymatic activities can help to terminate protein synthesis in
cancer cells. One of the examples is ribonuclease A (RNase A), which is a predominant form of the
enzyme in the pancreas of Bos Taurus.58
After intracellular delivery of RNase A into cytosols, it
will degrade mRNA and tRNA and inhibit protein synthesis, thus strongly influence cell functions
and cause deleterious effects on cell viability.59
In addition, saporin-S6 (also known as saporin) is
also effective to interfere with cell functions. Saporin belongs to ribosome-inactivating protein
family, classically identified as rRNA N-glycosylase (EC 3.2.2.22). It is widely distributed among
plant genera, and confirmed to specifically remove A4324 adenine residue in 28S rRNA in the 60S
subunit of rat ribosome, so that it can damage ribosomes irreversibly and inhibit protein synthesis.60
Many vectors have been used to deliver enzymatic proteins for cancer therapy. For instance,
enhanced by hydrophobic modification, negatively charged silica nanoparticles were used to
immobilize RNase A on the surface and deliver it into human breast cancer cells (MCF-7) for cell
growth inhibition.61
Saporin was encapsulated in lipid-like nanoparticles, known as lipidoids, and

Chapter 2 Literature Review
11
this complex inhibited cell proliferation in vitro and suppresses tumor growth in a murine breast
cancer model.62
2.1.2.2 Targeting protein
With the help of intermolecular forces of electrostatic forces, hydrogen bonds and disulphide bonds,
proteins or peptides can form 3-dimensional (3-D) rough and flawy structures, which are the bases
of targeted interaction of proteins with other molecules.63
The targeting proteins specifically
interacting with molecules inside or on the surface of cancer cells can block the functions of target
molecules for cell destruction. In addition, cytotoxic drugs to cancer cells can be conjugated with
targeting proteins for enhanced cancer therapy. Monoclonal antibodies (mAbs) with high binding
specificity have been widely used in numerous ways, and grown to be the largest class of human
medicine within the top ten best-selling drugs. The delivery of monoclonal antibody to pAkt (anti-
pAkt) into cytosols of cancer cells has been reported to result in apoptosis.61
In addition, the
delivery of mAbs to CTLA4 to the tumor site successfully caused greater and extended inhibition of
the tumor growth than antibody given systematically.64
Some cell targeting peptides have also been
applied for cancer treatment.64
Cytotoxic drug-conjugated peptides can specifically recognize the
target cells expressing its receptors and direct killing effect. One example is the application of a
target cytotoxic somatostatin analogue AN-238, consisting of doxorubicin derivative linked to SST
octapeptide analogue RC-121. AN-238 shows effective cell growth inhibition in multiple cancer
cell lines.65
2.1.2.3 Vaccine
Cancer vaccines have great potential for anti-tumor immunity based on the activation of immune
system. This strategy depends on the selection of tumor-associated antigens (TAAs), which are
mutated protein molecules on tumor cell surface or peptides (with only 8-10 amino acids long),
derived from the mutated proteins, signalling t pr s n o ll t t s om “ or n”.
TAAs can be recognized by immunocytes (e.g., T-cell), which will then be activated and induce an
effective, tumor-specific immune reaction, leading to tumor regression.66, 67
For example, for the
prevention of cervical cancer and genital warts and vulvar and vaginal precancerous lesions, a
recombinant quadrivalent vaccine (commercially GARDASILs) has been prepared from capsid
proteins of human papillomavirus (HPV). It has been approved for commercial use in women aged
9-26 years, without pathogenicity.68
Moreover, peptide vaccines have attracted increasing attention
because of the diversity and smaller size, compared to large protein vaccines. Recently, three people
with melanoma have received personalized treatment with a dendritic cell vaccine (an amino acid

Chapter 2 Literature Review
12
substitution peptide) to alert their immune system the threats of mutated proteins in tumours,
providing an important proof of concept for the application of vaccines in cancer therapy.69
Table 2.2. Function and features of different therapeutic proteins for cancer therapy.
Types Function Description Examples
Enzymes
specifically decompose
substrates in physiological
conditions
terminate protein synthesis
in cancer cells RNase A,
61 Saporin
62
Targeting
proteins
specifically interact with
molecules inside or on the
surface of cancer cells
block cell functions or
targeted delivery of
cytotoxic drug for cell
destruction
mAb to pAkt,61
mAb
to CTLA4,64
AN-23865
vaccines activation of immune system
selection of TAAs and
recognition by T-cells,
followed by cell regression
GARDASILs,68
a
dendritic cell vaccine69
In summary, various types of nucleic acids and protein-based molecules have been applied in
modern medicine, especially in cancer therapy. However, because of their difficulties to cross cell
membranes and the fragility in severe conditions, for example, the potential of proteolysis and
degradation when they are localized in endosome/lysosome with acidic surroundings, effective
nanocarriers are required for enhanced biomolecule delivery efficiency.
2.2 Recent advances in bio-inspired drug delivery carriers
2.2.1 Brief introduction of natural particulates as drug delivery vehicles
The intracellular delivery of therapeutic drugs is crucial in modern medicine. Most naked
biomolecules (e.g., siRNAs and therapeutic proteins) and some free drugs are poorly delivered into
cells owing to poor stability, low solubility and/or native toxicity. Natural particulates have evolved
to deliver cargo molecules with maximal efficiency; therefore, provide useful examples and raw
materials for the application as nanocarriers. Until now, plenty of natural particulates have been
engineered accordingly and used for drug delivery. Based on the sources of natural particulates used
for drug delivery, they are classified into two groups, pathogens and mammalian cells.

Chapter 2 Literature Review
13
Pathogenic particulates (e.g., bacteria and virus) can effectively invade into target cells, followed by
cargo release and replication of themselves, without rapid clearance by immune system. For
example, engineered lactic acid bacteria can deliver vaccines by the quick recognition and
engulfment by immunocytes (dendritic cells).70
In addition, live or attenuated bacterium can
combine with different nanoparticles for efficient vaccine/drug delivery71
or magneto-optical
applications.72
For virus-based vectors,73
virus-like particles (with74
or without synthetic materials75
)
and virosomes (Figure 2.1),76
they have small sizes of 30-400 nm77
and, more importantly, the
ligands on the spikes of enveloped viruses (e.g., influenza virus78
and herpes simplex virus79
) can
guide specific ligand-receptor interactions with host cells for effective viral entry, followed by viral
genome release in cytosols.80
Apart from pathogen-based drug delivery system, various types of mammalian cells, such as red
blood cells (RBCs),81
dendritic cells82
and macrophages83
have been used as drug delivery carriers.
Although they cannot directly deliver drugs into target cells for disease treatment, they possess
evident advantages of excellent biocompatibility, prolonged circulation time (up to 120 days) and
final clearance from blood by reticuloendothelial system (RES). In that case, free drugs or drug-
loaded nanoparticles can combine with mammalian cells, either inside the cells or attached on the
surface, and can be specifically transported to the disease sites for sustained therapeutic effects.84
Figure 2.1 Engineering strategies for virus-based vectors, virus-like particles and virosomes.85
Although natural particulate-based drug delivery systems have been confirmed effective, the
clinical application is still immature and several issues need to be resolved. One of the top
challenges is the safety concerns of immunogenicity or even pathogenicity of pathogen-based
carriers,73
unless, vaccine delivery is considered as the application. The immunogenicity would be
the key point of pathogen-based carriers to function as adjuvants. In addition, since ex vivo

Chapter 2 Literature Review
14
engineering is always required to modify cell-based vehicles, the membrane integrity is highly
possible to be influenced, which will cause even faster clearance of the drug-loaded carriers from
circulation.
2.2.2 The advances of bio-inspired nanoparticles in bio-application
The understanding of structure–function relationships of natural particulates provides a useful guide
for the design of new nanocarriers. Currently, many research attempts have focused on the synthesis
of new drug delivery systems by mimicking the advantages of natural particulates, such as
structures (e.g., shape and inner structure) and surface chemical properties. In the following part,
the current development of bio-inspired nanocarriers is summarized.
2.2.2.1 Pathogen-mimicking strategies
The pursuit of low toxicity and little immunogenicity, but high delivery efficiency has led to the
development of synthetic vectors-mimicking the structure and/or composition of different
pathogens. Lee et al., described a pH-sensitive nanogel system mimicking the core-shell structure of
non-enveloped viruses (Figure 2.2). 86
The core is made of the doxorubicin (DOX)-encapsulated
hydrophobic polymer, while the shell mimicking capsid structure is composed of bovine serum
albumin (BSA), connected by polyethylene glycol (PEG) with the core. The surface of BSA is
further conjugated with folate ligands for targeted delivery to tumor sites. When the surrounding pH
changes from a physiological value (pH 7.4) to endosomal level (pH 6.4), the nanogel will
reversibly swell from 55 nm to 355 nm, facilitating endosomal escape and DOX release for
significant cancer killing effect. Noticeably, the nanogel will move into and kill the neighbouring
cells in the same way, mimicking the cycles of viruses.
Figure 2.2 Preparation and structure of the virus-mimicking nanogel.86

Chapter 2 Literature Review
15
Researchers also tried to mimic the features of enveloped viruses for improved drug delivery. A
virus-mimicking liposome-pDNA complex, with an onion-like core of pDNA-lipid complex and
spikes of human transferrin (Tf) coating, has been fabricated.87
Tf-polyplex exhibits improved in
vivo pDNA transfection efficiency and long-term efficacy for systemic p53 gene therapy of human
prostate cancer in combination with conventional radiotherapy. In addition, polymer-based
materials are also used to mimic the features of influenza viruses for enhanced siRNA delivery
(Figure 2.3).88
In the system, siRNAs can compact with the cationic polymer at physiological pH.
After endocytosis and entrapment in endosome/lysosome at acidic condition, this cationic polymer
will degrade into negatively charged and non-toxic poly(acrylic acid) (PAA), releasing siRNAs.
After that, another polymer will be in charge of the fusion with endosome membranes, similar to the
function of fusion peptide (HA2) in influenza viruses, and result in endosomal escape of siRNAs for
gene silencing.
Figure 2.3 Mechanism for the assembly of influenza virus-inspired polymer, binding with siRNA
and release of siRNA through a self-catalyzed degradation of PDMAEA.88
2.2.2.2 Cell-mimicking strategies
Cell-mimicking nanoparticles have gained promising attention to drug delivery because they
possess plenty of excellent properties of the source cells. One of the attractive features of cell-
biomimetic nanoparticles is the long-circulating cargo delivery. Zhang and coworkers successfully
separated erythrocyte membranes, acquiring the membrane lipids associated membrane proteins,
and coated them on biodegradable polymeric nanoparticles of poly(lactic-co-glycolic acid) (PLGA)
(Figure 2.4).89
The erythrocyte membrane-camouflaged PLGA nanoparticles can achieve sustained
circulation in the blood of mice for 72 h following the particle injection. After that, the erythrocyte
membrane-coated PLGA nanoparticles were used for effective removal of pore-forming toxins
(PFTs) in mice.90
Following that, they inserted a model PFT of staphylococcal a-haemolysin (Hla)
into erythrocyte membranes, and used it as a toxoid vaccine. Comparing the vaccination effect with
heat-attenuated PFT, the PFT loaded erythrocyte membrane-coated PLGA nanoparticles showed
superior immunogenicity without toxin-mediated adverse effects.91

Chapter 2 Literature Review
16
Figure 2.4 Schematics of the preparation process of RBC-membrane-coated PLGA nanoparticles.89
In addition, the membranes from other cell types have also been applied to coat nanoparticles to
form biomimetic nanocarriers. For example, after isolation of the leukocyte membrane, the
engineered leuko-like vectors (LLV) encapsulating a nanoporous silicon core avoided blood
clearance by mononuclear phagocytic cells, promote active communication with endothelial cells,
and improve the circulation time and accumulation in tumor sites, so that increase drug delivery
efficiency.92
Cancer cell-derived membranes bound with tumor antigens have also been used to
package PLGA nanoparticles for potential application of vaccine and/or drug delivery. The antigens
d r v d rom B16−F10 mous m l nom lls on n no rr r sur lp to v n r
targeted delivery, due to the inherent homotypic binding phenomenon among the tumor cells.
Importantly, the nanocarrier successfully delivers an immunological adjuvant (MPLA), promoting a
tumor-specific immune response for the use in vaccine application.93
Synthetic particles mimicking cell morphology and functions have also been developed. Different
RBC-like particles have been fabricated using hollow polystyrene (PS) microparticle94
or hydrogel-
based microspheres95, 96
as the template, possessing the ability of deformation in capillaries.
Noticeably, PS-based RBC-like particle is able to mimic the functions of natural RBCs to carry
oxygen, and deliver drugs and imaging agents. Platelet-mimicking nanoparticles with the features to
induce additional local clotting have also been developed. This particle possesses a specific binding
affinity for activated platelets, and it is able to adhere and activate platelets at the bleeding site, so
that it can halt bleeding.97
To be different, the iron oxide nanoparticles coated with a homing
peptide, CREKA (Cys-Arg-Glu-Lys-Ala), is applied to simultaneously recognize clotted plasma
proteins at vessel walls and selectively homes to tumors stroma, amplifying tumor imaging, and
potentially enhance drug delivery efficiency.98

Chapter 2 Literature Review
17
2.2.2.3 Other strategies
Besides pathogen- and mammalian cell-mimicking strategies, creatures in nature will also inspire
the development of nanoparticles with unique properties. Learning from the functions of jellyfish
with long tentacles in catching prey from surroundings, affinity DNA polymers (DPs) and DNA
polymers with aptamers (PAs) on iron nanoparticles have been synthesized for drug sequestration
and detoxification.99
It is demonstrated the model drugs of DOX and thrombin were effectively
sequestered from solution. More importantly, the toxic effect of DOX to human umbilical vein
endothelial cells (HUVECs) is largely decreased, and the coagulation time is also shortened,
indicating the ability of different nanoparticles in mitigating biological effect of different drugs.
2.3 Strategies to engineer silica-based nanoparticles as effective gene and protein carriers
The key factors for successful gene and protein therapy are effective intracellular delivery of
cargos, overcoming in a number of barriers before the released genetic molecules and therapeutic
proteins exhibit their functions. First, NP-cargo complexes must penetrate across cell membrane,
usually via endocytic pathways (Figure 2.5), which predominantly include phagocytosis, clathrin-
mediated endocytosis (CME), caveolae-mediated endocytosis (CvME) and macropinocytosis.100-102
These cell-penetration processes can be regulated and improved by surface charge adjustment or
ligand conjugation. In addition, engineered surface modification with polymers, peptides or
coupling with some other materials helps the escape of cargos captured in endosomes or lysosomes,
and may even assist to direct nuclear targeting or entry.
Silica-based nanoparticles (SiNPs) are promising materials for genetic molecule or protein delivery.
Through the sol-gel processing route, surface properties, particle size and shape, which may have
different impacts on cell activity and transfection efficiency, can be easily controlled. In addition,
after the additions of surfactants, the nanoparticles with different pore sizes and pore volumes have
been fabricated, providing access to load cargo molecules inside the pores for multifunctional
applications. In this part, the effects of different surface modifications to SiNPs from simple surface
charge adjustments to conjugation with functional molecules, on particle endocytosis efficiency,
endo/lysosomal escape and nuclear targeting will be introduced at first. Then, particle parameters,
with respect to endocytosis efficiency and the interaction with cells, will be discussed.

Chapter 2 Literature Review
18
Figure 2.5 Endocytic pathways traversed by nonviral carriers. (A) Macropinocytosis of cationic
particles. (B) Nonviral vectors can also be internalized by other pathways such as clathrin-mediated
endocytosis, which is a receptor-mediated pathway. (C) Caveolae-mediated endocytosis proceeds
by oligomerization of caveolin, actin-dependent internalization of caveolae to form cavicles and
merger with the degradable lysosomal compartment, or non-degradable trafficking to the nucleus
via caveosomes. Each pathway relies on microtubules for rapid transport of endocytic vesicles.
HSPG: Heparan sulfate proteoglycans.102
2.3.1 Surface engineering
Surface properties are an important factor to influence the upload and release of genetic molecules
and proteins into cells on cancer therapy. For gene therapy, negatively charged genetic molecules
are able to complex with amine-modified SiNPs with a positive charge,103
either on the surface or
inside the pores. In addition, the conjugation/hybridation of silica materials with polymers39
or other
inorganic materials104, 105
will acquire some new properties. For protein therapeutics, different
strategies are required to achieve protein loading, due to the variable sizes and isoelectric points
(IEPs) of protein molecules. This section focuses on the development in surface modification of
SiNPs and the impact on cargo delivery and cellular response.
2.3.1.1 Surface charge
Electrostatic force is the most widely applied approach to interact with cargo molecules, NPs and
cell membrane. Due to the negatively charged cell membrane and phosphate backbone of genetic
molecules, NPs with positive charges have been considered more effective to immobilize

Chapter 2 Literature Review
19
DNA/RNA and achieve cell uptake than those, which are negatively charged or neutral.30, 39, 106
However, since SiNPs have an intrinsically negative charge on the surface, derived from silanol
groups, surface charge modification is required, for example, by attaching amine-groups on particle
surface. An amino-modified SiNP (45 nm) showed better GFP pDNA adsorption and expression
behavior.103
In addition, cationic polymer-coated SiNPs (e.g., PEI-MSN or PLL-MSN) can also
acquire a positive charge on the surface and provided enhanced cell uptake and transfection
compared to unmodified SiNPs.39, 107, 108
However, the nature of protein molecules with variable
IEPs suggests different surface charge controls. For example, pristine mesoporous silica
nanospheres were first used for delivery of cytochrome c with a IEP of 10.5 into cervical cancer
cells (HeLa),109
where cytochrome c possessed positive charges in physiological buffer of
phosphate buffered saline (PBS, pH 7.4). On the contrary, positively charged surface is required for
the adsorption of therapeutic proteins with low IEP values (e.g., insulin, IEP 5.3).110
Noticeably, by varying the surface charge value, endocytic pathways will change. Slowing et al.
reported that by changing the grafted groups, SiNPs acquired positive charge with zeta potential
(ZP) values.111
In the order from 3-aminopropyl (AP), guanidinopropyl (GP), 3-[N-(2-
guanidinoethyl)-guanidino]propyl (GEGP) to N-folate-3-aminopropyl (FAP) groups, the ZP value
of the original MSNs (-34 mV) increased from -4.68 to +12.81 mV. FAP-MSN and negatively
charged pure MSNs were taken up into cells via a clathrin-pitted mechanism, and AP- and GP-
MSNs were internalized via a caveolae-mediated pathway. However, the pathway for GEAP-MSNs
was unclear, since none of the pathway inhibitors had dramatically slowed down or decreased the
internalization. Strangely, in this research, negatively charged MSNs exhibited better endo-
/lysosomal escape compared with positively charged MSNs. It was explained that the groups of
SiO- on negative charged MSNs can neutralize more H
+, leading to better behavior of the proton
sponge effect. Moreover, surface charge-related endocytosis was reported to be cell type-dependent.
Chung and co-workers claimed that unmodified (negative charged) MSNs were internalized
through a clathrin-mediated and an actin-dependent endocytosis in both murine adipocytes (3T3-
L1) and human mesenchymal stem cells (hMSCs).112
However, when using positive-charged
MSNs, such a pathway was only applied by 3T3-L1 cells, while the pathway for hMSCs have
switched to an unknown one. These results suggested that a threshold of positive surface charge was
responsible for MSN uptake by hMSC, and the surface charge-related MSN uptake was cell type-
specific.
In addition to the effect on endocytosis, surface charge is related to cytotoxicity. Usually, pure
SiNPs show more toxicity than amino-modified ones, and many researchers have given possible
explanations, such as reactive oxygen species (ROS) induced by the hydroxyl groups, denaturation

Chapter 2 Literature Review
20
of membrane proteins through electrostatic interactions with silicate and the high affinity of silicate
for binding with the tetra-alkyl ammonium groups that are abundant in the membranes of RBCs.113
Although the exact mechanism is still under investigation, most researchers agree that cytotoxicity
is related to ROS induced by surface silanol groups, causing membrane damage, for example,
hemolysis of RBC.114
Shi et al. confirmed that when SiNPs were treated with alkaline media
(NH4OH), hemolysis was significantly reduced.115
This reduction was possibly related to the shift to
SiO- from Si-OH where hydroxyl groups were neutralized. Moreover, when SiNPs were incubated
with plasma or whole blood, hemolysis and cytotoxicity were also inhibited because of a protective
protein corona layer over the surface of silica particles. This result showed that the interaction of
SINPs with serum proteins was an important event that should be considered in the first place in
future clinical application.
2.3.1.2 Surface hydrophobicity
Hydrophobic interaction has been considered as an important property for enhanced genetic
molecule or therapeutic protein delivery. Nanocarriers with hydrophobic modification are believed
to either improve cell membrane interactions116
or strengthen the interactions between nanoparticle
and cargo molecules by excluding water molecules around hydrophobic moieties.117
Alshamsan et
al. have tried to modify branched PEI with stearic/oleic acid, which has a fatty acid chain of 18
carbon atoms, and the hydrophobically modified PEI increased siRNA delivery up to 3-folds
compared to the parent PEI.116
Bale and co-workers61
developed an octadecyl (C18)-group
functionalized solid silica nanoparticle. They absorbed therapeutic proteins, such as the antibody to
pAkt, on the surface and delivered them into MCF-7 breast cancer cells. The loaded therapeutic
protein resulted in significant cell growth inhibition without extended entrapment in endosomes.
Moreover, Zhang and co-workers confirmed a significant cell growth inhibition to human squamous
carcinoma cells (SCC-25) by the delivery of RNase A using C18-functionalized silica hollow
spheres.118
Therefore, hydrophobic feature is one of the promising factors to control nanoparticle
behaviors for successful drug delivery.
2.3.1.3 Influence of serum protein
Prolonged blood circulation before being cleared via nonspecific binding to serum protein is of
utmost importance to achieve sustained release of cargos, improved retention with cell membrane,
as well as enhanced penetration into targeted cells.119
Surface properties are one of the key influential factors for serum protein adsorption. For example,
the adsorption behavior of BSA at pH 5 was tested on siliceous mesocellular foams (MCF)

Chapter 2 Literature Review
21
functionalized with chloromethyl (CM), mercaptopropyl (MP), octyl (Oc) or AP groups.120
The
results showed that positively charged MCF-AP exhibited the highest adsorption capacity with
negatively charged BSA, because of electrostatic interaction. However, hydrophobicity and steric
hindrance of functional groups may significantly decrease serum protein loading amount and
adsorption rate, for example, octyl-group or high amounts of CM-groups. Cell culture media with or
without fetal calf serum (FCS) can have different effects. Related investigation showed that less dis-
tinct particle aggregation was observed in serum-free conditions, while the presence of FCS led to
increased aggregation. Meanwhile, the decreased cytotoxicity in 3T3 fibroblast cells was seen after
interacting with FCS. 121
It is possible that large agglomerates significantly consumed NPs, so only
a small quantity of small agglomerates or primary particles could be internalized into cells.
Therefore, attention should be paid to increase cargo loading efficiency and proper decoration of
NPs in order to reduce aggregation, SiNP dosage and cytotoxicity. For example, PEG, with low
cytotoxicity and good hydrophilicity, has been conjugated to enhance biocompatibility and mitigate
nonspecific adsorption of SiNPs to proteins.122, 123
2.3.2 Modification with other materials
With the purpose to fabricate smart drug carriers, NPs have been used to overcome a series of
obstacles for the successful transfection into planned sites. However, simply modified silica-NP
alone cannot complete the entire work. The complexation of SiNPs with other materials has proven
to be extremely necessary.108
A variety of complexation materials have been utilized in order to
improve the specificity and efficiency of cargo delivery.
2.3.2.1 Organic materials
A wide variety of organic polymers have been coupled with SiNPs for effective genetic molecules
and therapeutic protein delivery, such as cationic polymers (e.g., PEI,39, 114, 124
PLL30, 125, 126
and
polyarginine127, 128
), hydrophilic polymer (e.g., PEG107, 126, 129
) dendrimers (e.g., polyamidoamine
[PAMAM] dendrimers130, 131
), carbohydrate-based polymers (e.g., chitosan132, 133
and dextran134-136
)
and polypeptide.137-139
Although most of the organic materials alone are capable of effectively directing cargo molecules
into cytosols or even nucleus, the combination with SiNPs have shown supplementary advantages,
providing an excellent platform for enhanced cargo delivery performance for multifunctional
applications. For example, after the connection of solid silica NPs with Tat138
or MSN with
octaarginines (R8),139
successful cell internalization was observed. Following cell uptake,
endosomal escape is the second process affecting transfection efficiency, and various
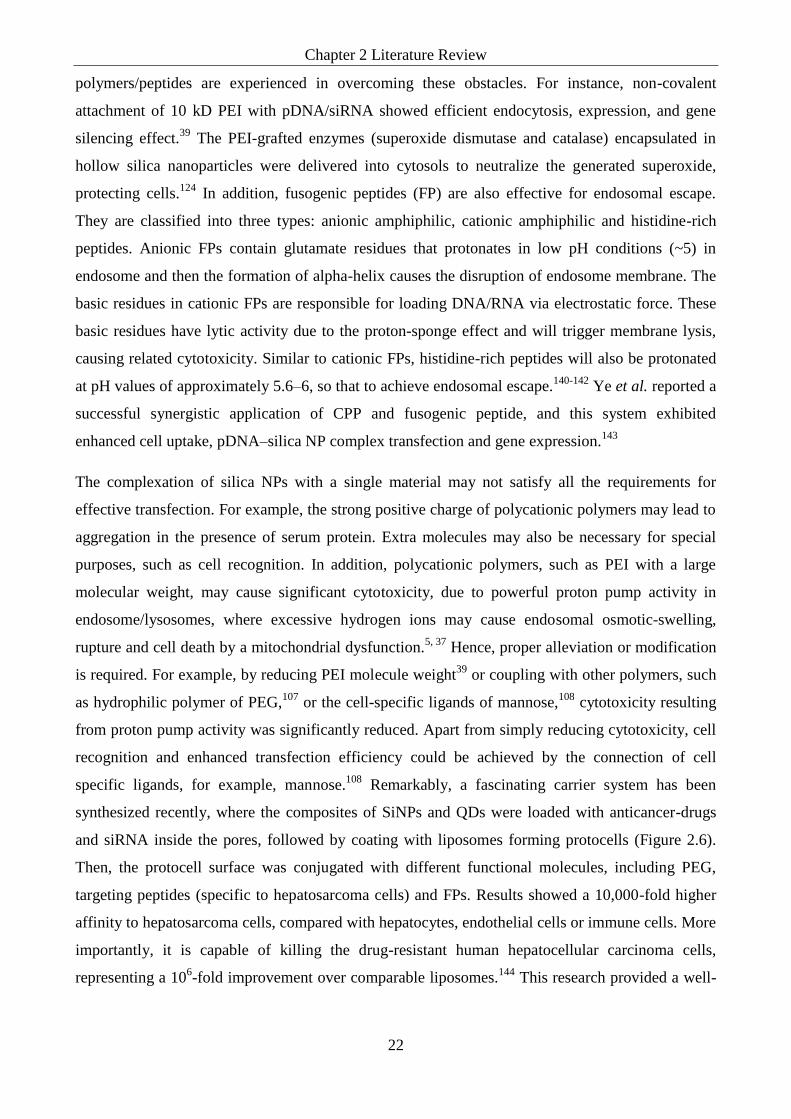
Chapter 2 Literature Review
22
polymers/peptides are experienced in overcoming these obstacles. For instance, non-covalent
attachment of 10 kD PEI with pDNA/siRNA showed efficient endocytosis, expression, and gene
silencing effect.39
The PEI-grafted enzymes (superoxide dismutase and catalase) encapsulated in
hollow silica nanoparticles were delivered into cytosols to neutralize the generated superoxide,
protecting cells.124
In addition, fusogenic peptides (FP) are also effective for endosomal escape.
They are classified into three types: anionic amphiphilic, cationic amphiphilic and histidine-rich
peptides. Anionic FPs contain glutamate residues that protonates in low pH conditions (~5) in
endosome and then the formation of alpha-helix causes the disruption of endosome membrane. The
basic residues in cationic FPs are responsible for loading DNA/RNA via electrostatic force. These
basic residues have lytic activity due to the proton-sponge effect and will trigger membrane lysis,
causing related cytotoxicity. Similar to cationic FPs, histidine-rich peptides will also be protonated
at pH values of approximately 5.6–6, so that to achieve endosomal escape.140-142
Ye et al. reported a
successful synergistic application of CPP and fusogenic peptide, and this system exhibited
enhanced cell uptake, pDNA–silica NP complex transfection and gene expression.143
The complexation of silica NPs with a single material may not satisfy all the requirements for
effective transfection. For example, the strong positive charge of polycationic polymers may lead to
aggregation in the presence of serum protein. Extra molecules may also be necessary for special
purposes, such as cell recognition. In addition, polycationic polymers, such as PEI with a large
molecular weight, may cause significant cytotoxicity, due to powerful proton pump activity in
endosome/lysosomes, where excessive hydrogen ions may cause endosomal osmotic-swelling,
rupture and cell death by a mitochondrial dysfunction.5, 37
Hence, proper alleviation or modification
is required. For example, by reducing PEI molecule weight39
or coupling with other polymers, such
as hydrophilic polymer of PEG,107
or the cell-specific ligands of mannose,108
cytotoxicity resulting
from proton pump activity was significantly reduced. Apart from simply reducing cytotoxicity, cell
recognition and enhanced transfection efficiency could be achieved by the connection of cell
specific ligands, for example, mannose.108
Remarkably, a fascinating carrier system has been
synthesized recently, where the composites of SiNPs and QDs were loaded with anticancer-drugs
and siRNA inside the pores, followed by coating with liposomes forming protocells (Figure 2.6).
Then, the protocell surface was conjugated with different functional molecules, including PEG,
targeting peptides (specific to hepatosarcoma cells) and FPs. Results showed a 10,000-fold higher
affinity to hepatosarcoma cells, compared with hepatocytes, endothelial cells or immune cells. More
importantly, it is capable of killing the drug-resistant human hepatocellular carcinoma cells,
representing a 106-fold improvement over comparable liposomes.
144 This research provided a well-

Chapter 2 Literature Review
23
designed strategy to synthesize multifunctional SiNPs, so that all the requirements for successful
gene therapy can be met, even comparable to viral carriers.
Figure 2.6 Steps of multivalent binding and internalization of targeted protocells, followed by
endosomal escape and nuclear localization of protocell encapsulated cargo. (1) DOPC protocells
particles binds to cell surface with high affinity due to attachment of targeting peptides; (2) then
goes through cell memberane via receptor-mediated endocytosis; (3) release drugs into cytosol on
endosome acidification and protonation of H5WYG fusogenic peptide. (4) Finally, NLS-attached
cargo is transported in the nucleus. DOPC: 1,2-Dioleoyl-sn-glycero-3-phosphocholine; NLS:
Nuclear localization signal.144
The cargo release behavior is also an important factor for nanocarriers, thus stimuli-responsive and
controlled cargo release has attained considerable eminence. Many physicochemical factors are
responsible for triggering cargo release, for example, light-irradiation,145
cleavage of disulfide,145
enzymatic cleavage,146
temperature147
and pH.148
For example, Sauer et al. reported a successful
release of ATTO633-labeled cysteine into cytoplasm of HuH7 cells by the cleavage of disulfide
from inner surface of MSNs, after endosomal escape.145
For enzymatic cleavage, a co-delivery
system was designed, consisting of PLL-modified hollow MSNs loaded fluorescein inside and CpG
ODN on the surface. The enzyme of alpha-chymotrypsin is used as a model. Fluorescein and CpG
ODN can simultaneously release from the particles stimulated by alpha-chymotrypsin that can
induce PLL polymer degradation.146
Compared with others stimuli, pH-response is the most logical
trigger, because of the intrinsic pH value differences in different cells or cell compartments, for
example, approximately 5 in endosome, 6.8 in tumor tissues and 7.4 in normal tissues. Chen et al.
reported a pH-sensitive drug (ibuprofen) delivery system of chitosan-coated MSNs, where the
release of encapsulated drug could be controlled by the narrow difference between pH 6.8 and
7.4,148
avoiding nonspecific drug leakage in normal cells.

Chapter 2 Literature Review
24
After cargo release, genetic molecules (e.g., pDNA) or even some proteins (e.g., saporin60
) should
go into nucleus to show their functions. Usually, free diffusion is a common route for cargo release,
however, the efficiency is not guaranteed. To be different, targeted nuclear delivery will be more
effective for gene/protein therapy, with the help of nuclear localization signal (NLS). Based on
sequence differences, NLS is divided into classical and non-classical groups. After the binding of
NLS w t t mport r ptors o mport n α nd β, nd t ollow n nt r t on w t nu l r por
complex (NPC), cargo translocation will be initiated.149
Shi and co-workers first reported the
connection of NLS with MSNs (MSN–Tat complex) for nuclear targeting and nuclear entry (Figure
2.7).150
Tat showed significant nuclear membrane targeting behavior and the DOX absorbed into
MSNs–Tat complex exhibited cancer cell killing effect. This work opens new avenues of SiNPs for
improved gene therapy.
2.3.2.2 Inorganic materials
Inorganic materials have also coupled with SiNPs, aiming at either improving localization of NPs at
tumor sites, or helping to track NPs in vivo. Magnetic NPs have been extensively studied, because
of their application in efficient magnetic targeting, imaging and bio-separations.105, 151
Using
different protocols, the encapsulation of magnetite (Fe3O4) nanospheres onto or into porous SiNPs
has been reported for the improvement of drug delivery efficiency.105, 151-153
Another type of inorganic material, semi-conductor QDs, has also attracted great research interest in
nanomedicine, because they are effective optical probes for in vivo imaging.154, 155
When silica
materials coat onto QDs, silanol groups on the surface can be accessible to conjugate with other
functional molecules. For example, silica-coated QDs (e.g., CdSe104
) connecting with single-
stranded oligonucleotide hybridizations will work as molecular beacons (MBs), where QDs are
used as fluorophores, and they show fluorescent signals after DNA pairing with a target sequence.
This MB has shown excellent behavior for DNA recognition.156
Although gold and silver NPs themselves have been effective to be used as genetic molecule157
and
protein158
vectors, studies on their combination with silica NPs have been paid increasing attention,
recently. Christen et al. reported that SiO2–Ag-NPs induced an increased endoplasmatic reticulum
(ER)-stress response and reduced cytochrome P4501A activity of human liver cells (Huh7) and
pimephales promelas (fathead minnow) fibroblast cells (FMH).159
SiO2–Au-NPs-oligonucleotide
could also be used as a fast colorimetric DNA.160
In addition, the co-delivery of BSA and pDNA
using gold NP-functionalized MSNs to plant tissues has also been reported.161
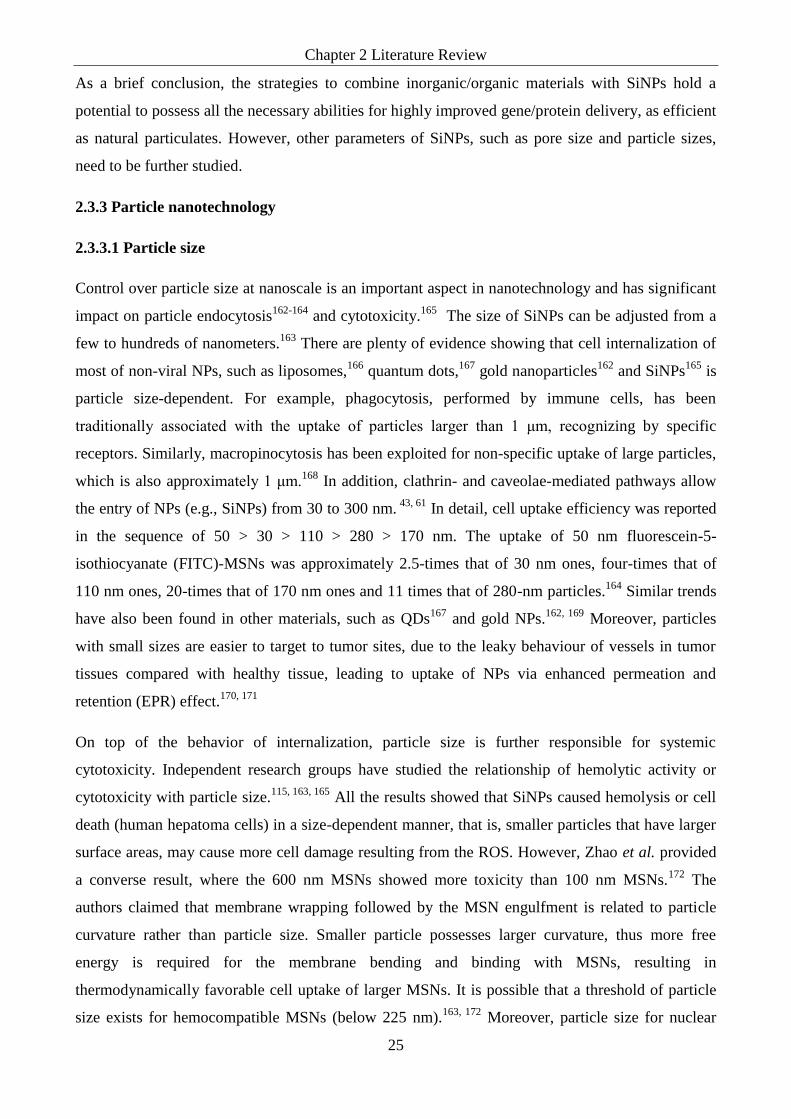
Chapter 2 Literature Review
25
As a brief conclusion, the strategies to combine inorganic/organic materials with SiNPs hold a
potential to possess all the necessary abilities for highly improved gene/protein delivery, as efficient
as natural particulates. However, other parameters of SiNPs, such as pore size and particle sizes,
need to be further studied.
2.3.3 Particle nanotechnology
2.3.3.1 Particle size
Control over particle size at nanoscale is an important aspect in nanotechnology and has significant
impact on particle endocytosis162-164
and cytotoxicity.165
The size of SiNPs can be adjusted from a
few to hundreds of nanometers.163
There are plenty of evidence showing that cell internalization of
most of non-viral NPs, such as liposomes,166
quantum dots,167
gold nanoparticles162
and SiNPs165
is
particle size-dependent. For example, phagocytosis, performed by immune cells, has been
tr d t on lly sso t d w t t upt k o p rt l s l r r t n 1 μm, r o nizing by specific
receptors. Similarly, macropinocytosis has been exploited for non-specific uptake of large particles,
which is also approxim t ly 1 μm.168
In addition, clathrin- and caveolae-mediated pathways allow
the entry of NPs (e.g., SiNPs) from 30 to 300 nm. 43, 61
In detail, cell uptake efficiency was reported
in the sequence of 50 > 30 > 110 > 280 > 170 nm. The uptake of 50 nm fluorescein-5-
isothiocyanate (FITC)-MSNs was approximately 2.5-times that of 30 nm ones, four-times that of
110 nm ones, 20-times that of 170 nm ones and 11 times that of 280-nm particles.164
Similar trends
have also been found in other materials, such as QDs167
and gold NPs.162, 169
Moreover, particles
with small sizes are easier to target to tumor sites, due to the leaky behaviour of vessels in tumor
tissues compared with healthy tissue, leading to uptake of NPs via enhanced permeation and
retention (EPR) effect.170, 171
On top of the behavior of internalization, particle size is further responsible for systemic
cytotoxicity. Independent research groups have studied the relationship of hemolytic activity or
cytotoxicity with particle size.115, 163, 165
All the results showed that SiNPs caused hemolysis or cell
death (human hepatoma cells) in a size-dependent manner, that is, smaller particles that have larger
surface areas, may cause more cell damage resulting from the ROS. However, Zhao et al. provided
a converse result, where the 600 nm MSNs showed more toxicity than 100 nm MSNs.172
The
authors claimed that membrane wrapping followed by the MSN engulfment is related to particle
curvature rather than particle size. Smaller particle possesses larger curvature, thus more free
energy is required for the membrane bending and binding with MSNs, resulting in
thermodynamically favorable cell uptake of larger MSNs. It is possible that a threshold of particle
size exists for hemocompatible MSNs (below 225 nm).163, 172
Moreover, particle size for nuclear
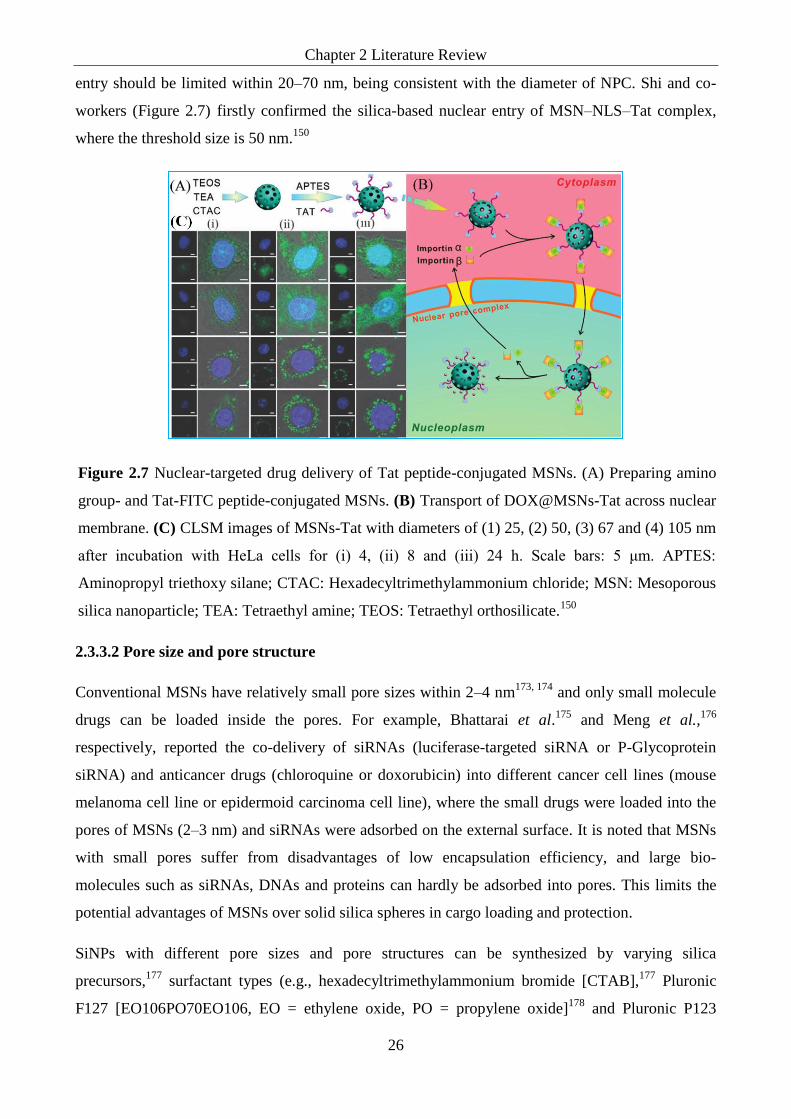
Chapter 2 Literature Review
26
entry should be limited within 20–70 nm, being consistent with the diameter of NPC. Shi and co-
workers (Figure 2.7) firstly confirmed the silica-based nuclear entry of MSN–NLS–Tat complex,
where the threshold size is 50 nm.150
Figure 2.7 Nuclear-targeted drug delivery of Tat peptide-conjugated MSNs. (A) Preparing amino
group- and Tat-FITC peptide-conjugated MSNs. (B) Transport of DOX@MSNs-Tat across nuclear
membrane. (C) CLSM images of MSNs-Tat with diameters of (1) 25, (2) 50, (3) 67 and (4) 105 nm
t r n u t on w t H L lls or ( ) 4, ( ) 8 nd ( ) 24 . S l rs: 5 μm. APTES:
Aminopropyl triethoxy silane; CTAC: Hexadecyltrimethylammonium chloride; MSN: Mesoporous
silica nanoparticle; TEA: Tetraethyl amine; TEOS: Tetraethyl orthosilicate.150
2.3.3.2 Pore size and pore structure
Conventional MSNs have relatively small pore sizes within 2–4 nm173, 174
and only small molecule
drugs can be loaded inside the pores. For example, Bhattarai et al.175
and Meng et al.,176
respectively, reported the co-delivery of siRNAs (luciferase-targeted siRNA or P-Glycoprotein
siRNA) and anticancer drugs (chloroquine or doxorubicin) into different cancer cell lines (mouse
melanoma cell line or epidermoid carcinoma cell line), where the small drugs were loaded into the
pores of MSNs (2–3 nm) and siRNAs were adsorbed on the external surface. It is noted that MSNs
with small pores suffer from disadvantages of low encapsulation efficiency, and large bio-
molecules such as siRNAs, DNAs and proteins can hardly be adsorbed into pores. This limits the
potential advantages of MSNs over solid silica spheres in cargo loading and protection.
SiNPs with different pore sizes and pore structures can be synthesized by varying silica
precursors,177
surfactant types (e.g., hexadecyltrimethylammonium bromide [CTAB],177
Pluronic
F127 [EO106PO70EO106, EO = ethylene oxide, PO = propylene oxide]178
and Pluronic P123

Chapter 2 Literature Review
27
[EO20PO70EO20]179
), as well as adding swelling agents (e.g., 1,3,5-trimethylbenzene180
). Related
products with various pore parameters have been fabricated, such as SBA-15 (large-pore 2d
hexagonal),181
MCM-48 (gyroid cubic Ia3d),182
KIT-6 (large-pore gyroid cubic Ia3d),181
FDU-12
(ultra-large-pore, Fm3m type)178, 183, 184
, macroporous (~110nm in diameter) ordered siliceous foams
(MOSF)179
and periodic mesoporous organosilica (PMO).87, 88
It is notable that some surfactants
show cytotoxicity to cells. He and Shi reported as-synthesized MSNs (without removing surfactant)
could kill cancer cells at a much higher efficiency by the release of surfactant molecules than
common anticancer drugs.185
In other words, surfactants must be totally removed prior to bio-
application.
Large pore SiNPs are another type of attractive candidates for genetic molecule or protein delivery.
Due to their high pore volume and much lower density, large amount of therapeutic agents can be
loaded while reducing native cytotoxicity of silica. For example, HMSNs of ~250 nm size were
combined with a chitosan-antibody decoration, and the material enabled a pH-controlled release of
TNF-a, which significantly suppressed the growth of cancer cells and even killed them with high
therapeutic efficacy.185
Although conventional FDU-12 possesses large pores up to 40 nm,174
the
particle size is in micrometer range, which is not suitable for cell uptake. Hartono et al. successfully
prepared a PLL-conjugated FDU-12-type SiNP with particle size of ~100–200 nm and pore size of
~28 nm.30
After the intracellular delivery of siRNA loaded NPs in inner pores, significant decrease
of osteosarcoma cancer cell viability was observed (Figure 2.8). Apart from the good performance
of SiNPs in cargo delivery, the intrinsic cytotoxicity of both porous and nonporous SiNPs has also
been investigated. The damage to cell membrane of RBCs163, 186
and human promyelocytic
leukemia cells (HL-60)186
have been investigated, where porous SiNPs exhibited lower cytotoxicity
than nonporous counterparts of similar size. It is claimed that the external surface area is important
in determining cytotoxicity. Porous SiNPs have smaller external surface areas, thus less silanol
groups on the cell-contactable surface, compared to nonporous SiNPs, resulting in less ROS and
reduced toxicity.113
2.3.3.3 Particle shape and surface morphology
The shapes and surface morphologies of SiNPs can be adjusted by changing synthesis parameters
such as chemical ratios,188, 189
initial temperature,190
stirring rate,190
micelle packing parameter,165,
191 additives,
105, 192, 193, or post-modification,
194, 195. For instance, anisotropic ellipsoid-like MSNs
were fabricated via the organic–inorganic cooperative assembly in the presence of additive agents
(KCl and ethanol105
). In addition, the delivery of Cy3-oligo-DNA into tumor cells showed its
potential in drug/gene delivery.105
Silica nanotubes were made using anodic aluminum oxide

Chapter 2 Literature Review
28
membrane as a template. By coating the inner surface of amino-groups, such materials efficiently
loaded pDNA of GFP and expressed in COS-7 cell.196
Endocytosis performance of SiNPs is also influenced by particle shapes. For instance, the
relationship between cell uptake and three rod-like MSNs with similar particle diameter, chemical
composition and surface charge, but with different aspect ratios (ARs, 1, 2 and 4) were investigated.
The results indicated that these different-shaped particles were readily internalized in human
melanoma (A375) cells by non-specific cell uptake. Among them, the particles with larger ARs
were taken up in larger amounts and had faster internalization rates, however, showing a greater
impact on cell proliferation, apoptosis, cytoskeleton formation, adhesion and migration.189
A pos-
sible explanation for this behavior could also be attributed to curvature of SiNPs, since larger AR
means larger contact and interaction area with the cell membrane, causing higher cytotoxicity from
ROS. Evidence showed bio-distribution, clearance and biocompatibility of MSNs will also be
affected by different shapes of MSNs. For example, short-rod MSNs (AR = 1.5) were confirmed to
be easily distributed in the liver, while long-rod MSNs (AR = 5) stayed in the spleen. The main
excretion route was observed by urine and feces. Moreover, short-rod MSNs showed a more rapid
clearance rate. Although in this investigation, hematology, serum biochemistry and histopathology
results indicated that MSNs did not cause significant toxicity in vivo, but systemic side effects may
be caused by the accumulation of MSNs in those organs,188
especially in the long-term.
The surface morphology or topology is another interesting factor for effective modification. By
investigating the features of plenty of surface morphologies, from viruses to plants to animals,
researchers have noticed that morphologies of living creatures in microcosmic scale seldom showed
homogeneousness. For example, the lotus leaves have tiny raspberry-like structures on the surface.
The bubble-like structures between the shells show super-hydrophobicity and hence resistance to
water.197
Nel et al.198
depicted the effect of heterogeneous structures, for example, local protrusions
or depressions with radii smaller than that of the particle, may have the potential to strengthen NP–
cell interactions. Although some silica-based bimodal or heterogeneous structures have been
fabricated, for example, the raspberry-like structure,84, 100, 104
that is, the combination of a large core
and plenty of small shells on the surface, only a few studies have focused on the relationship
between topology and gene/protein delivery efficiency.
2.4 Conclusions and future perspective
Various therapeutic agents with good specificity, such as genetic molecules and therapeutic
proteins, have been applied in modern medicine. However, effective carriers are required for
enhanced intracellular delivery of cargos. Although natural particulates have superior properties for

Chapter 2 Literature Review
29
genetic molecules and therapeutic protein delivery, some intrinsic issues prevent their wide
applications, which propels the development of synthetic vectors mimicking the features of natural
particulates. For example, silica-based nanoparticles (SiNPs) have emerged as excellent candidates.
Although several successful delivery systems based on SiNPs have been studied, the investigation
in other parameters, for example, the effect of surface morphology by mimicking enveloped viruses
(objective 1 in this thesis), is required for further improved cargo delivery efficiency. The virus-
mimicking silica nanoparticles (VMSNs) are expected to enhance biomolecule delivery efficiency
in various bio-applications. For instance, the VMSNs are expected to increase siRNA loading
amount and cellular uptake effect, causing significantly enhanced gene silencing efficiency
(objective 1 in this thesis). Following that, the systematic investigation of VMSNs with varied
surface roughness in drug delivery efficiency will be very important, highlighting the roles of
surface topography (objective 2 in this thesis). Furthermore, intensive investigation to one given
VMSN is extremely necessary in understanding the individual contribution of surface roughness
and surface modification to the therapeutic drug delivery processes (objective 3 in this thesis).
The research on bio-inspired nanoparticles for biomedical applications is taking off and has
demonstrated tremendously positive results. The opportunities could be realized by mimicking the
surface topography of enveloped viruses, and combining interdisciplinary knowledge in chemistry,
biology, material science and clinical medicine.
2.5 References
1 Liu, S. Q.; Wiradharma, N.; Gao, S. J.; Tong, Y. W.; Yang, Y. Y. Bio-functional micelles self-
assembled from a folate-conjugated block copolymer for targeted intracellular delivery of
anticancer drugs. Biomaterials, 2007, 28, (7), 1423-1433.
2 Kim, C. K.; Ghosh, P.; Pagliuca, C.; Zhu, Z. J.; Menichetti, S.; Rotello, V. M. Entrapment of
Hydrophobic Drugs in Nanoparticle Monolayers with Efficient Release into Cancer Cells. J. Am.
Chem. Soc., 2009, 131, (4), 1360-1361.
3 Yallapu, M. M.; Othman, S. F.; Curtis, E. T.; Bauer, N. A.; Chauhan, N.; Kumar, D.; Jaggi, M.;
Chauhan, S. C. Curcumin-loaded magnetic nanoparticles for breast cancer therapeutics and imaging
applications. Int. J. Nanomed., 2012, 7, 1761-1779.
4 Zhao, B. Z.; Yin, J. J.; Bilski, P. J.; Chignell, C. F.; Roberts, J. E.; He, Y. Y. Enhanced
photodynamic efficacy towards melanoma cells by encapsulation of Pc4 in silica nanoparticles.
Toxicol. Appl. Pharm, 2009, 241, (2), 163-172.
5 Livingston, D. M. Inheritance of the 2 micrometer m DNA plasmid from Saccharomyces.
Genetics, 1977, 86, (1), 73-84.

Chapter 2 Literature Review
30
6 Shi, F. S.; Rakhmilevich, A. L.; Heise, C. P.; Oshikawa, K.; Sondel, P. M.; Yang, N. S.; Mahvi,
D. M. Intratumoral injection of interleukin-12 plasmid DNA, either naked or in complex with
cationic lipid, results in similar tumor regression in a murine model. Mol Cancer Ther, 2002, 1,
(11), 949-957.
7 Vivero-Escoto, J. L.; Slowing, I. I.; Lin, V. S. Y. Tuning the cellular uptake and cytotoxicity
properties of oligonucleotide intercalator-functionalized mesoporous silica nanoparticles with
human cervical cancer cells HeLa. Biomaterials, 2010, 31, (6), 1325-1333.
8 Jung, M. R.; Shim, I. K.; Kim, E. S.; Park, Y. J.; Yang, Y. I.; Lee, S. K.; Lee, S. J. Controlled
release of cell-permeable gene complex from poly(L-lactide) scaffold for enhanced stem cell tissue
engineering. J. Control Release, 2011, 152, (2), 294-302.
9 Anderson, R. J.; Schneider, J. Plasmid DNA and viral vector-based vaccines for the treatment of
cancer. Vaccine, 2007, 25, Supplement 2, (0), B24-B34.
10 Suwalski, A.; Dabboue, H.; Delalande, A.; Bensamoun, S. F.; Canon, F.; Midoux, P.; Saillant,
G.; Klatzmann, D.; Salvetat, J. P.; Pichon, C. Accelerated Achilles tendon healing by PDGF gene
delivery with mesoporous silica nanoparticles. Biomaterials, 2010, 31, (19), 5237-5245.
11 Darquet, A. M.; Cameron, B.; Wils, P.; Scherman, D.; Crouzet, J. A new DNA vehicle for
nonviral gene delivery: supercoiled minicircle. Gene Ther., 1997, 4, (12), 1341-1349.
12 Park, J. H.; Lee, M.; Kim, S. W. Non-viral adiponectin gene therapy into obese 2 type diabetic
mice ameliorates insulin resistance. J. Control Release, 2006, 114, (1), 118-125.
13 van Gaal, E. V. B.; Oosting, R. S.; Hennink, W. E.; Crommelin, D. J. A.; Mastrobattista, E. Junk
DNA enhances pEI-based non-viral gene delivery. Int. J. Pharmaceut., 2010, 390, (1), 76-83.
14 Fedor, M. J. Structure and function of the hairpin ribozyme. J. Mol. Biol., 2000, 297, (2), 269-
291.
15 Scott, W. G.; Finch, J. T.; Klug, A. The crystal structure of an AII-RNAhammerhead ribozyme:
A proposed mechanism for RNA catalytic cleavage. Cell, 1995, 81, (7), 991-1002.
16 Pley, H. W.; Flaherty, K. M.; McKay, D. B. Three-dimensional structure of a hammerhead
ribozyme. Nature, 1994, 372, (6501), 68-74.
17 Kolniak, T. A.; Sullivan, J. M. Rapid, cell-based toxicity screen of potentially therapeutic post-
transcriptional gene silencing agents. Exp. Eye Res., 2011, 92, (5), 328-337.
18 Ozaki, I.; Zern, M. A.; Liu, S.; Wei, D. L.; Pomerantz, R. J.; Duan, L. Ribozyme-mediated
specific gene r pl m nt o t α1-antitrypsin gene in human hepatoma cells. J. Hepatol., 1999,
31, (1), 53-60.
19 Uhlmann, E.; Peyman, A. Antisense oligonucleotides: a new therapeutic principle. J. Am. Chem.
Soc., 1990, 90, (4), 543-584.

Chapter 2 Literature Review
31
20 Stein, C.; Cheng, Y. Antisense oligonucleotides as therapeutic agents--is the bullet really
magical? Science, 1993, 261, (5124), 1004-1012.
21 Su, W.-Y.; Xiong, H.; Fang, J.-Y. Natural antisense transcripts regulate gene expression in an
epigenetic manner. Biochem. Biophys. Res. Commun., 2010, 396, (2), 177-181.
22 Hamada, K.; Shirakawa, T.; Gotoh, A.; Roth, J. A.; Follen, M. Adenovirus-mediated transfer of
human papillomavirus 16 E6/E7 antisense RNA and induction of apoptosis in cervical cancer.
Gynecol. Oncol., 2006, 103, (3), 820-830.
23 Bock, L. C.; Griffin, L. C.; Latham, J. A.; Vermaas, E. H.; Toole, J. J. Selection of Single-
Stranded-DNA Molecules That Bind and Inhibit Human Thrombin. Nature, 1992, 355, (6360), 564-
566.
24 Huizenga, D. E.; Szostak, J. W. A DNA Aptamer That Binds Adenosine and Atp. Biochemistry-
Us, 1995, 34, (2), 656-665.
25 Guo, P. X.; Coban, O.; Snead, N. M.; Trebley, J.; Hoeprich, S.; Guo, S. C.; Shu, Y. Engineering
RNA for Targeted siRNA Delivery and Medical Application. Adv. Drug Deliver. Rev., 2010, 62,
(6), 650-666.
26 Hermann, T.; Patel, D. J. Biochemistry - Adaptive recognition by nucleic acid aptamers.
Science, 2000, 287, (5454), 820-825.
27 Nimjee, S. M.; Rusconi, C. P.; Sullenger, B. A. Aptamers: An emerging class of therapeutics.
Annu. Rev. Med., 2005, 56, 555-583.
28 Farokhzad, O. C.; Cheng, J. J.; Teply, B. A.; Sherifi, I.; Jon, S.; Kantoff, P. W.; Richie, J. P.;
Langer, R. Targeted nanoparticle-aptamer bioconjugates for cancer chemotherapy in vivo. P. Natl.
Acad. Sci. USA, 2006, 103, (16), 6315-6320.
29 Zhang, S. B.; Zhao, Y. A.; Zhi, D. F.; Zhang, S. F. Non-viral vectors for the mediation of RNAi.
Bioorg. Chem., 2012, 40, 10-18.
30 Hartono, S. B.; Gu, W. Y.; Kleitz, F.; Liu, J.; He, L. Z.; Middelberg, A. P. J.; Yu, C. Z.; Lu, G.
Q.; Qiao, S. Z. Poly-L-lysine Functionalized Large Pore Cubic Mesostructured Silica Nanoparticles
as Biocompatible Carriers for Gene Delivery. ACS Nano, 2012, 6, (3), 2104-2117.
31 Fire, A.; Xu, S. Q.; Montgomery, M. K.; Kostas, S. A.; Driver, S. E.; Mello, C. C. Potent and
specific genetic interference by double-stranded RNA in Caenorhabditis elegans. Nature, 1998, 391,
(6669), 806-811.
32 Mao, C.-Q.; Du, J.-Z.; Sun, T.-M.; Yao, Y.-D.; Zhang, P.-Z.; Song, E.-W.; Wang, J. A
biodegradable amphiphilic and cationic triblock copolymer for the delivery of siRNA targeting the
acid ceramidase gene for cancer therapy. Biomaterials, 2011, 32, (11), 3124-3133.

Chapter 2 Literature Review
32
33 Kim, J. K.; Choi, K. J.; Lee, M.; Jo, M. H.; Kim, S. Molecular imaging of a cancer-targeting
theragnostics probe using a nucleolin aptamer- and microRNA-221 molecular beacon-conjugated
nanoparticle. Biomaterials, 2012, 33, (1), 207-217.
34 Rando, T. A. Oligonucleotide-mediated gene therapy for muscular dystrophies. Neuromuscular
Disord, 2002, 12, S55-S60.
35 Graham, I. R.; Dickson, G. Gene repair and mutagenesis mediated by chimeric RNA-DNA
oligonucleotides: chimeraplasty for gene therapy and conversion of single nucleotide
polymorphisms (SNPs). Bba-Mol Basis Dis., 2002, 1587, (1), 1-6.
36 Li, Z.-H.; Liu, D.-P.; Yin, W.-X.; Guo, Z.-C.; Liang, C.-C. Targeted Correction of the Point
Mut t ons o β-Thalassemia and Targeted Mutagenesis of the Nucleotide Associated with HPFH by
RNA/DNA Ol onu l ot d s: Pot nt l or β-Thalassemia Gene Therapy. Blood Cell Mol. Dis.,
2001, 27, (2), 530-538.
37 Ferreira, G. N. M.; Monteiro, G. A.; Prazeres, D. M. F.; Cabral, J. M. S. Downstream processing
of plasmid DNA for gene therapy and DNA vaccine applications. Trends Biotechnol., 2000, 18, (9),
380-388.
38 Minigo, G.; Scholzen, A.; Tang, C. K.; Hanley, J. C.; Kalkanidis, M.; Pietersz, G. A.;
Apostolopoulos, V.; Plebanski, M. Poly-L-lysine-coated nanoparticles: A potent delivery system to
enhance DNA vaccine efficacy. Vaccine, 2007, 25, (7), 1316-1327.
39 Xia, T. A.; Kovochich, M.; Liong, M.; Meng, H.; Kabehie, S.; George, S.; Zink, J. I.; Nel, A. E.
Polyethyleneimine Coating Enhances the Cellular Uptake of Mesoporous Silica Nanoparticles and
Allows Safe Delivery of siRNA and DNA Constructs. ACS Nano, 2009, 3, (10), 3273-3286.
40 Veiseh, O.; Kievit, F. M.; Mok, H.; Ayesh, J.; Clark, C.; Fang, C.; Leung, M.; Arami, H.; Park,
J. O.; Zhang, M. Q. Cell transcytosing poly-arginine coated magnetic nanovector for safe and
effective siRNA delivery. Biomaterials, 2011, 32, (24), 5717-5725.
41 Burnett, John C.; Rossi, John J. RNA-Based Therapeutics: Current Progress and Future
Prospects. Chem. Biol., 2012, 19, (1), 60-71.
42 Zuker, M. On Finding All Suboptimal Foldings of an Rna Molecule. Science, 1989, 244, (4900),
48-52.
43 Correll, C. C.; Freeborn, B.; Moore, P. B.; Steitz, T. A. Metals, motifs, and recognition in the
crystal structure of a 5S rRNA domain. Cell, 1997, 91, (5), 705-712.
44 Pleij, C. W. A.; Bosch, L. Rna Pseudoknots - Structure, Detection, and Prediction. Method
Enzymol., 1989, 180, 289-303.
45 Jaeger, J. A.; Santalucia, J.; Tinoco, I. Determination of Rna Structure and Thermodynamics.
Annu. Rev. Biochem., 1993, 62, 255-287.

Chapter 2 Literature Review
33
46 Kaneko, H.; Suzuki, H.; Abe, T.; Miyano-Kurosaki, N.; Takaku, H. Inhibition of HIV-1
replication by vesicular stomatitis virus envelope glycoprotein pseudotyped baculovirus vector-
transduced ribozyme in mammalian cells. Biochem. Biophys. Res. Commun., 2006, 349, (4), 1220-
1227.
47 Zhu, S. G.; Xiang, J. J.; Li, X. L.; Shen, S. R.; Lu, H. B.; Zhou, J.; Xiong, W.; Zhang, B. C.; Nie,
X. M.; Zhou, M.; Tang, K.; Li, G. Y. Poly(L-lysine)-modified silica nanoparticles for the delivery
of antisense oligonucleotides. Biotechnol. Appl. Bioc., 2004, 39, 179-187.
48 Barnor, J. S.; Miyano-Kurosaki, N.; Yamaguchi, K.; Sakamoto, A.; Ishikawa, K.; Inagaki, Y.;
Yamamoto, N.; Osei-Kwasi, M.; Ofori-Adjei, D.; Takaku, H. Intracellular expression of antisense
RNA transcripts complementary to the human immunodeficiency virus type-1 vif gene inhibits viral
replication in infected T-lymphoblastoid cells. Biochem. Biophys. Res. Commun., 2004, 320, (2),
544-550.
49 Zhu, C. L.; Song, X. Y.; Zhou, W. H.; Yang, H. H.; Wen, Y. H.; Wang, X. R. An efficient cell-
targeting and intracellular controlled-release drug delivery system based on MSN-PEM-aptamer
conjugates. J. Mater. Chem., 2009, 19, (41), 7765-7770.
50 Que-Gewirth, N. S.; Sullenger, B. A. Gene therapy progress and prospects: RNA aptamers.
Gene. Ther., 2007, 14, (4), 283-291.
51 Martell, R. E.; Nevins, J. R.; Sullenger, B. A. Optimizing aptamer activity for gene therapy
applications using expression cassette SELEX. Mol. Ther., 2002, 6, (1), 30-34.
52 Ishizaki, J.; Nevins, J. R.; Sullenger, B. A. Inhibition of cell proliferation by an RNA ligand that
selectively blocks E2F function. Nat. Med., 1996, 2, (12), 1386-1389.
53 Nana-Sinkam, S. P.; Croce, C. M. MicroRNAs as therapeutic targets in cancer. Transl. Res.,
2011, 157, (4), 216-225.
54 Ashley, C. E.; Carnes, E. C.; Epler, K. E.; Padilla, D. P.; Phillips, G. K.; Castillo, R. E.;
Wilkinson, D. C.; Wilkinson, B. S.; Burgard, C. A.; Kalinich, R. M.; Townson, J. L.; Chackerian,
B.; Willman, C. L.; Peabody, D. S.; Wharton, W.; Brinker, C. J. Delivery of Small Interfering RNA
by Peptide-Targeted Mesoporous Silica Nanoparticle-Supported Lipid Bilayers. Acs Nano, 2012, 6,
(3), 2174-2188.
55 Tagalakis, A. D.; Owen, J. S.; Simons, J. P. Lack of RNA-DNA oligonucleotide (chimeraplast)
mutagenic activity in mouse embryos. Mol. Reprod. Dev., 2005, 71, (2), 140-144.
56 Estrada, L. H.; Chu, S.; Champion, J. A. Protein Nanoparticles for Intracellular Delivery of
Therapeutic Enzymes. J. Pharm. Sci-Us., 2014, 103, (6), 1863-1871.
57 Holcenberg, J. S.; Roberts, J. Enzymes as Drugs. Annu. Rev. Pharmacol., 1977, 17, 97-116.
58 Raines, R. T. Ribonuclease A. Chem. Rev., 1998, 98, (3), 1045-1065.

Chapter 2 Literature Review
34
59 Martins, S.; Sarmento, B.; Ferreira, D. C.; Souto, E. B. Lipid-based colloidal carriers for peptide
and protein delivery - liposomes versus lipid nanoparticles. Int. J. Nanomed., 2007, 2, (4), 595-607.
60 Polito, L.; Bortolotti, M.; Mercatelli, D.; Battelli, M. G.; Bolognesi, A. Saporin-S6:A Useful
Tool in Cancer Therapy. Toxins, 2013, 5, (10), 1698-1722.
61 Bale, S. S.; Kwon, S. J.; Shah, D. A.; Banerjee, A.; Dordick, J. S.; Kane, R. S. Nanoparticle-
Mediated Cytoplasmic Delivery of Proteins To Target Cellular Machinery. ACS Nano, 2010, 4, (3),
1493-1500.
62 Wang, M.; Alberti, K.; Sun, S.; Arellano, C. L.; Xu, Q. B. Combinatorially Designed Lipid-like
Nanoparticles for Intracellular Delivery of Cytotoxic Protein for Cancer Therapy. Angew. Chem.
Int. Edit., 2014, 53, (11), 2893-2898.
63 Nero, T. L.; Morton, C. J.; Holien, J. K.; Wielens, J.; Parker, M. W. Oncogenic protein
interfaces: small molecules, big challenges. Nat. Rev. Cancer, 2014, 14, (4), 248-262.
64 Lei, C. H.; Liu, P.; Chen, B. W.; Mao, Y. M.; Engelmann, H.; Shin, Y.; Jaffa, J.; Hellstrom, I.;
Liu, J.; Hellstrom, K. E. Local Release of Highly Loaded Antibodies from Functionalized
Nanoporous Support for Cancer Immunotherapy (vol 132, pg 6906, 2010). J. Am. Chem. Soc.,
2011, 133, (36), 14467-14467.
65 Szepeshazi, K.; Schally, A. V.; Halmos, G.; Sun, B. D.; Hebert, F.; Csernus, B.; Nagy, A.
Targeting of cytotoxic somatostatin analog AN-238 to somatostatin receptor subtypes 5 and/or 3 in
experimental pancreatic cancers. Clin. Cancer Res., 2001, 7, (9), 2854-2861.
66 Bolhassani, A.; Safaiyan, S.; Rafati, S. Improvement of different vaccine delivery systems for
cancer therapy. Mol. Cancer, 2011, 10.
67 Thundimadathil, J. Cancer Treatment Using Peptides: Current Therapies and Future Prospects. J.
Amino Acids, 2012, 2012, 13.
68 Shi, L.; Sings, H. L.; Bryan, J. T.; Wang, B.; Wang, Y.; Mach, H.; Kosinski, M.; Washabaugh,
M. W.; Sitrin, R.; Barr, E. GARDASIL®: Prophylactic Human Papillomavirus Vaccine
Development – From Bench Top to Bed-side. Clin. Pharmacol. Ther., 2007, 81, (2), 259-264.
69 Carreno, B. M.; Magrini, V.; Becker-Hapak, M.; Kaabinejadian, S.; Hundal, J.; Petti, A. A.; Ly,
A.; Lie, W. R.; Hildebrand, W. H.; Mardis, E. R.; Linette, G. P. A dendritic cell vaccine increases
the breadth and diversity of melanoma neoantigen-specific T cells. Science, 2015, 348, (6236), 803-
808.
70 Wells, J. M.; Mercenier, A. Mucosal delivery of therapeutic and prophylactic molecules using
lactic acid bacteria. Nat. Rev. Microbiol., 2008, 6, (5), 349-362.
71 Akin, D.; Sturgis, J.; Ragheb, K.; Sherman, D.; Burkholder, K.; Robinson, J. P.; Bhunia, A. K.;
Mohammed, S.; Bashir, R. Bacteria-mediated delivery of nanoparticles and cargo into cells. Nat.
Nanotechnol., 2007, 2, (7), 441-449.

Chapter 2 Literature Review
35
72 Carmona, F.; Martin, M.; Galvez, N.; Dominguez-Vera, J. M. Bioinspired Magneto-optical
Bacteria. Inorg. Chem., 2014, 53, (16), 8565-8569.
73 Thomas, C. E.; Ehrhardt, A.; Kay, M. A. Progress and problems with the use of viral vectors for
gene therapy. Nat. Rev. Genet., 2003, 4, (5), 346-358.
74 Zhao, Q. J.; Li, S. W.; Yu, H.; Xia, N. S.; Modis, Y. Virus-like particle-based human vaccines:
quality assessment based on structural and functional properties. Trends. Biotechnol., 2013, 31,
(11), 654-663.
75 Shen, L. H.; Zhou, J.; Wang, Y. X.; Kang, N.; Ke, X. B.; Bi, S. L.; Ren, L. Efficient
Encapsulation of Fe3O4 Nanoparticles into Genetically Engineered Hepatitis B Core Virus-Like
Particles Through a Specific Interaction for Potential Bioapplications. Small, 2015, 11, (9-10),
1190-1196.
76 Kaneda, Y. Virosomes: evolution of the liposome as a targeted drug delivery system. Adv. Drug.
Deliver. Rev., 2000, 43, (2-3), 197-205.
77 Mercer, J.; Schelhaas, M.; Helenius, A. Virus Entry by Endocytosis. Annu. Rev. Biochem.,
2010, 79, 803-833.
78 Harris, A.; Cardone, G.; Winkler, D. C.; Heymann, J. B.; Brecher, M.; White, J. M.; Steven, A.
C. Influenza virus pleiomorphy characterized by cryoelectron tomography. P. Natl. Acad. Sci.
USA., 2006, 103, (50), 19123-19127.
79 Grunewald, K.; Desai, P.; Winkler, D. C.; Heymann, J. B.; Belnap, D. M.; Baumeister, W.;
Steven, A. C. Three-dimensional structure of herpes simplex virus from cryo-electron tomography.
Science, 2003, 302, (5649), 1396-1398.
80 Dimitrov, D. S. Virus entry: Molecular mechanisms and biomedical applications. Nat. Rev.
Microbiol., 2004, 2, (2), 109-122.
81 Fraternale, A.; Casabianca, A.; Orlandi, C.; Cerasi, A.; Chiarantini, L.; Brandi, G.; Magnani, M.
Macrophage protection by addition of glutathione (GSH)-loaded erythrocytes to AZT and DDI in a
murine AIDS model. Antivir. Res., 2002, 56, (3), 263-272.
82 Stephan, M. T.; Moon, J. J.; Um, S. H.; Bershteyn, A.; Irvine, D. J. Therapeutic cell engineering
with surface-conjugated synthetic nanoparticles. Nat. Med., 2010, 16, (9), 1035-U135.
83 Dou, H.; Destache, C. J.; Morehead, J. R.; Mosley, R. L.; Boska, M. D.; Kingsley, J.; Gorantla,
S.; Poluektova, L.; Nelson, J. A.; Chaubal, M.; Werling, J.; Kipp, J.; Rabinow, B. E.; Gendelman,
H. E. Development of a macrophage-based nanoparticle platform for antiretroviral drug delivery.
Blood, 2006, 108, (8), 2827-2835.
84 Gopal, V. S.; Kumar Ranjith, A.; Usha, A. N.; Karthik, A.; Udupa, N. Effective drug targeting
by erythrocytes as carrier. Curr. Trends Biotechnol. Pharm., 2007, 1, (1), 18-33.
Chapter 2 Literature Review
36
85 Yoo, J. W.; Irvine, D. J.; Discher, D. E.; Mitragotri, S. Bio-inspired, bioengineered and
biomimetic drug delivery carriers. Nat. Rev. Drug Discov., 2011, 10, (7), 521-535.
86 Lee, E. S.; Kim, D.; Youn, Y. S.; Oh, K. T.; Bae, Y. H. A virus-mimetic nanogel vehicle.
Angew. Chem. Int. Edit., 2008, 47, (13), 2418-2421.
87 Xu, L.; Frederik, P.; Pirollo, K. F.; Tang, W. H.; Rait, A.; Xiang, L. M.; Huang, W. Q.; Cruz, I.;
Yin, Y. Z.; Chang, E. H. Self-assembly of a virus-mimicking nanostructure system for efficient
tumor-targeted gene delivery. Hum. Gene Ther., 2002, 13, (3), 469-481.
88 Truong, N. P.; Gu, W. Y.; Prasadam, I.; Jia, Z. F.; Crawford, R.; Xiao, Y.; Monteiro, M. J. An
influenza virus-inspired polymer system for the timed release of siRNA. Nat. Commun., 2013, 4.
89 Hu, C. M. J.; Zhang, L.; Aryal, S.; Cheung, C.; Fang, R. H.; Zhang, L. F. Erythrocyte
membrane-camouflaged polymeric nanoparticles as a biomimetic delivery platform. P. Natl. Acad.
Sci. USA., 2011, 108, (27), 10980-10985.
90 Hu, C. M. J.; Fang, R. H.; Copp, J.; Luk, B. T.; Zhang, L. F. A biomimetic nanosponge that
absorbs pore-forming toxins. Nat. Nanotechnol., 2013, 8, (5), 336-340.
91 Hu, C. M. J.; Fang, R. H.; Luk, B. T.; Zhang, L. F. Nanoparticle-detained toxins for safe and
effective vaccination. Nat. Nanotechnol., 2013, 8, (12), 933-938.
92 Parodi, A.; Quattrocchi, N.; van de Ven, A. L.; Chiappini, C.; Evangelopoulos, M.; Martinez, J.
O.; Brown, B. S.; Khaled, S. Z.; Yazdi, I. K.; Enzo, M. V.; Isenhart, L.; Ferrari, M.; Tasciotti, E.
Biomimetic functionalization with leukocyte membranes imparts cell like functions to synthetic
particles. Nat. Nanotechnol., 2013, 8, (1), 61-68.
93 Fang, R. H.; Hu, C. M. J.; Luk, B. T.; Gao, W. W.; Copp, J. A.; Tai, Y. Y.; O'Connor, D. E.;
Zhang, L. F. Cancer Cell Membrane-Coated Nanoparticles for Anticancer Vaccination and Drug
Delivery. Nano Lett., 2014, 14, (4), 2181-2188.
94 Doshi, N.; Zahr, A. S.; Bhaskar, S.; Lahann, J.; Mitragotri, S. Red blood cell-mimicking
synthetic biomaterial particles. P. Natl. Acad. Sci. USA., 2009, 106, (51), 21495-21499.
95 Merkel, T. J.; Jones, S. W.; Herlihy, K. P.; Kersey, F. R.; Shields, A. R.; Napier, M.; Luft, J. C.;
Wu, H. L.; Zamboni, W. C.; Wang, A. Z.; Bear, J. E.; DeSimone, J. M. Using mechanobiological
mimicry of red blood cells to extend circulation times of hydrogel microparticles. P. Natl. Acad.
Sci. USA, 2011, 108, (2), 586-591.
96 Haghgooie, R.; Toner, M.; Doyle, P. S. Squishy Non-Spherical Hydrogel Microparticles.
Macromol. Rapid. Comm., 2010, 31, (2), 128-134.
97 Bertram, J. P.; Williams, C. A.; Robinson, R.; Segal, S. S.; Flynn, N. T.; Lavik, E. B.
Intravenous Hemostat: Nanotechnology to Halt Bleeding. Sci. Transl. Med., 2009, 1, (11).

Chapter 2 Literature Review
37
98 Simberg, D.; Duza, T.; Park, J. H.; Essler, M.; Pilch, J.; Zhang, L. L.; Derfus, A. M.; Yang, M.;
Hoffman, R. M.; Bhatia, S.; Sailor, M. J.; Ruoslahti, E. Biomimetic amplification of nanoparticle
homing to tumors. P. Natl. Acad. Sci. USA., 2007, 104, (3), 932-936.
99 Chen, N. C.; Huang, Y. K.; Wang, Y. Bioinspired affinity DNA polymers on nanoparticles for
drug sequestration and detoxification. Biomaterials, 2014, 35, (36), 9709-9718.
100 Xiang, S.; Tong, H.; Shi, Q.; Fernandes, J. C.; Jin, T.; Dai, K.; Zhang, X. Uptake mechanisms
of non-viral gene delivery. J. Controlled Release, 2012, 158, (3), 371-378.
101 van der Aa, M. A. E. M.; Huth, U. S.; Hafele, S. Y.; Schubert, R.; Oosting, R. S.;
Mastrobattista, E.; Hennink, W. E.; Peschka-Suss, R.; Koning, G. A.; Crommelin, D. J. A. Cellular
uptake of cationic polymer-DNA complexes via caveolae plays a pivotal role in gene transfection in
COS-7 cells. Pharm. Res., 2007, 24, (8), 1590-1598.
102 Adler, A. F.; Leong, K. W. Emerging links between surface nanotechnology and endocytosis:
Impact on nonviral gene delivery. Nano Today, 2010, 5, (6), 553-569.
103 He, X. X.; Wang, K. M.; Tan, W. H.; Liu, B.; Lin, X.; He, C. M.; Li, D.; Huang, S. S.; Li, J.
Bioconjugated nanoparticles for DNA protection from cleavage. J. Am. Chem. Soc., 2003, 125,
(24), 7168-7169.
104 Vibin, M.; Vinayakan, R.; John, A.; Rejiya, C. S.; Raji, V.; Abraham, A. Cellular uptake and
subcellular localization of highly luminescent silica-coated CdSe quantum dots - In vitro and in
vivo. J. Colloid. Interf. Sci., 2011, 357, (2), 366-371.
105 Shen, S. D.; Gu, T.; Mao, D. S.; Xiao, X. Z.; Yuan, P.; Yu, M. H.; Xia, L. Y.; Ji, Q.; Meng, L.;
Song, W.; Yu, C. Z.; Lu, G. Z. Synthesis of Nonspherical Mesoporous Silica Ellipsoids with
Tunable Aspect Ratios for Magnetic Assisted Assembly and Gene Delivery. Chem. Mater., 2012,
24, (1), 230-235.
106 Mintzer, M. A.; Simanek, E. E. Nonviral Vectors for Gene Delivery. Chem. Rev., 2009, 109,
(2), 259-302.
107 Lee, H.; Sung, D.; Veerapandian, M.; Yun, K.; Seo, S. W. PEGylated polyethyleneimine
grafted silica nanoparticles: enhanced cellular uptake and efficient siRNA delivery. Anal. Bioanal.
Chem., 2011, 400, (2), 535-545.
108 Park, I. Y.; Kim, I. Y.; Yoo, M. K.; Choi, Y. J.; Cho, M. H.; Cho, C. S. Mannosylated
polyethylenimine coupled mesoporous silica nanoparticles for receptor-mediated gene delivery. Int.
J. Pharm., 2008, 359, (1-2), 280-287.
109 Slowing, I. I.; Trewyn, B. G.; Lin, V. S. Y. Mesoporous silica nanoparticles for intracellular
delivery of membrane-impermeable proteins. J. Am. Chem. Soc., 2007, 129, (28), 8845-8849.
110 Choi, S. R.; Jang, D. J.; Kim, S.; An, S.; Lee, J.; Oh, E.; Kim, J. Polymer-coated spherical
mesoporous silica for pH-controlled delivery of insulin. J. Mater. Chem. B, 2014, 2, (6), 616-619.

Chapter 2 Literature Review
38
111 Slowing, I.; Trewyn, B. G.; Lin, V. S. Y. Effect of surface functionalization of MCM-41-type
mesoporous silica nanoparticleson the endocytosis by human cancer cells. J. Am. Chem. Soc., 2006,
128, (46), 14792-14793.
112 Chung, T. H.; Wu, S. H.; Yao, M.; Lu, C. W.; Lin, Y. S.; Hung, Y.; Mou, C. Y.; Chen, Y. C.;
Huang, D. M. The effect of surface charge on the uptake and biological function of mesoporous
silica nanoparticles 3T3-L1 cells and human mesenchymal stem cells. Biomaterials, 2007, 28, (19),
2959-2966.
113 Slowing, I. I.; Wu, C. W.; Vivero-Escoto, J. L.; Lin, V. S. Y. Mesoporous Silica Nanoparticles
for Reducing Hemolytic Activity Towards Mammalian Red Blood Cells. Small, 2009, 5, (1), 57-62.
114 Xu, Z.; Wang, S. L.; Gao, H. W. Effects of nano-sized silicon dioxide on the structures and
activities of three functional proteins. J. Hazard. Mater., 2010, 180, (1-3), 375-383.
115 Shi, J.; Hedberg, Y.; Lundin, M.; Wallinder, I. O.; Karlsson, H. L.; Moller, L. Hemolytic
properties of synthetic nano- and porous silica particles: The effect of surface properties and the
protection by the plasma corona. Acta. Biomater., 2012, 8, (9), 3478-3490.
116 Alshamsan, A.; Haddadi, A.; Incani, V.; Samuel, J.; Lavasanifar, A.; Uludag, H. Formulation
and Delivery of siRNA by Oleic Acid and Stearic Acid Modified Polyethylenimine. Mol.
Pharmaceut., 2009, 6, (1), 121-133.
117 Holmberg, M.; Hou, X. L. Competitive Protein Adsorption-Multilayer Adsorption and Surface
Induced Protein Aggregation. Langmuir, 2009, 25, (4), 2081-2089.
118 Zhang, J.; Karmakar, S.; Yu, M. H.; Mitter, N.; Zou, J.; Yu, C. Z. Synthesis of Silica Vesicles
with Controlled Entrance Size for High Loading, Sustained Release, and Cellular Delivery of
Therapeutical Proteins. Small, 2014, 10, (24), 5068-5076.
119 Witasp, E.; Kupferschmidt, N.; Bengtsson, L.; Hultenby, K.; Smedman, C.; Paulie, S.; Garcia-
Bennett, A. E.; Fadeel, B. Efficient internalization of mesoporous silica particles of different sizes
by primary human macrophages without impairment of macrophage clearance of apoptotic or
antibody-opsonized target cells. Toxicol. Appl. Pharm., 2009, 239, (3), 306-319.
120 Russo, P. A.; Carrott, M. M. L. R.; Mourao, P. A. M.; Carrott, P. J. M. Tailoring the surface
chemistry of mesocellular foams for protein adsorption. Colloid Surface A, 2011, 386, (1-3), 25-35.
121 Drescher, D.; Orts-Gil, G.; Laube, G.; Natte, K.; Veh, R. W.; Osterle, W.; Kneipp, J. Toxicity
of amorphous silica nanoparticles on eukaryotic cell model is determined by particle agglomeration
and serum protein adsorption effects. Anal. Bioanal. Chem., 2011, 400, (5), 1367-1373.
122 Kim, J.; Kim, H. S.; Lee, N.; Kim, T.; Kim, H.; Yu, T.; Song, I. C.; Moon, W. K.; Hyeon, T.
Multifunctional Uniform Nanoparticles Composed of a Magnetite Nanocrystal Core and a
Mesoporous Silica Shell for Magnetic Resonance and Fluorescence Imaging and for Drug Delivery.
Angew. Chem. Int. Edit., 2008, 47, (44), 8438-8441.

Chapter 2 Literature Review
39
123 Ogris, M.; Brunner, S.; Schuller, S.; Kircheis, R.; Wagner, E. PEGylated DNA/transferrin-PEI
complexes: reduced interaction with blood components, extended circulation in blood and potential
for systemic gene delivery. Gene. Ther., 1999, 6, (4), 595-605.
124 Chang, F. P.; Chen, Y. P.; Mou, C. Y. Intracellular Implantation of Enzymes in Hollow Silica
Nanospheres for Protein Therapy: Cascade System of Superoxide Dismutase and Catalase. Small,
2014, 10, (22), 4785-4795.
125 Zhang, X.; Ma, G. H.; Su, Z. G.; Benkirane-Jessel, N. Novel poly(L-lysine) particles for gene
delivery. J. Control Release, 2011, 152, E182-E184.
126 Luo, G. F.; Chen, W. H.; Liu, Y.; Lei, Q.; Zhuo, R. X.; Zhang, X. Z. Multifunctional
Enveloped Mesoporous Silica Nanoparticles for Subcellular Co-delivery of Drug and Therapeutic
Peptide. Sci. Rep-Uk, 2014, 4.
127 Miyata, K.; Gouda, N.; Takemoto, H.; Oba, M.; Lee, Y.; Koyama, H.; Yamasaki, Y.; Itake, K.;
Nishiyama, N.; Kataoka, K. Enhanced transfection with silica-coated polyplexes loading plasmid
DNA. Biomaterials, 2010, 31, (17), 4764-4770.
128 Khalil, I. A.; Kogure, K.; Futaki, S.; Hama, S.; Akita, H.; Ueno, M.; Kishida, H.; Kudoh, M.;
Mishina, Y.; Kataoka, K.; Yamada, M.; Harashima, H. Octaarginine-modified multifunctional
envelope-type nanoparticles for gene delivery. Gene. Ther., 2007, 14, (8), 682-689.
129 He, Q. J.; Zhang, J. M.; Shi, J. L.; Zhu, Z. Y.; Zhang, L. X.; Bu, W. B.; Guo, L. M.; Chen, Y.
The effect of PEGylation of mesoporous silica nanoparticles on nonspecific binding of serum
proteins and cellular responses. Biomaterials, 2010, 31, (6), 1085-1092.
130 Radu, D. R.; Lai, C. Y.; Jeftinija, K.; Rowe, E. W.; Jeftinija, S.; Lin, V. S. Y. A
polyamidoamine dendrimer-capped mesoporous silica nanosphere-based gene transfection reagent.
J Am Chem Soc, 2004, 126, (41), 13216-13217.
131 Moore, C. J.; Monton, H.; O'Kennedy, R.; Williams, D. E.; Nogues, C.; Crean, C.; Gubala, V.
Controlling colloidal stability of silica nanoparticles during bioconjugation reactions with proteins
and improving their longer-term stability, handling and storage. J. Mater. Chem. B, 2015, 3, (10),
2043-2055.
132 Zeng, P.; Xu, Y.; Zeng, C. H.; Ren, H.; Peng, M. L. Chitosan-modified poly(D,L-lactide-co-
glycolide) nanospheres for plasmid DNA delivery and HBV gene-silencing. Int. J. Pharmaceut.,
2011, 415, (1-2), 259-266.
133 Gan, Q.; Zhu, J. Y.; Yuan, Y.; Liu, H. L.; Qian, J. C.; Lib, Y. S.; Liu, C. S. A dual-delivery
system of pH-responsive chitosan-functionalized mesoporous silica nanoparticles bearing BMP-2
and dexamethasone for enhanced bone regeneration. J. Mater. Chem. B, 2015, 3, (10), 2056-2066.
134 Angelopoulou, A.; Efthimiadou, E. K.; Kordas, G. Dextran modified pH sensitive silica hydro-
xerogels as promising drug delivery scaffolds. Mater. Lett., 2012, 74, 50-53.

Chapter 2 Literature Review
40
135 Kunzmann, A.; Andersson, B.; Vogt, C.; Feliu, N.; Ye, F.; Gabrielsson, S.; Toprak, M. S.;
Buerki-Thurnherr, T.; Laurent, S.; Vahter, M.; Krug, H.; Muhammed, M.; Scheynius, A.; Fadeel, B.
Efficient internalization of silica-coated iron oxide nanoparticles of different sizes by primary
human macrophages and dendritic cells. Toxicol. Appl. Pharm., 2011, 253, (2), 81-93.
136 Shu, S. J.; Sun, C. Y.; Zhang, X. G.; Wu, Z. M.; Wang, Z.; Li, C. X. Hollow and degradable
polyelectrolyte nanocapsules for protein drug delivery. Acta. Biomater., 2010, 6, (1), 210-217.
137 Ye, S. F.; Tian, M. M.; Wang, T. X.; Ren, L.; Wang, D.; Shen, L. H.; Shang, T. Synergistic
effects of cell-penetrating peptide Tat and fusogenic peptide HA2-enhanced cellular internalization
and gene transduction of organosilica nanoparticles. Nanomed-Nanotechnol., 2012, 8, (6), 833-841.
138 Mao, Z. W.; Wan, L.; Hu, L.; Ma, L.; Gao, C. Y. Tat peptide mediated cellular uptake of SiO2
submicron particles. Colloid Surface B, 2010, 75, (2), 432-440.
139 Gao, C. B.; Izquierdo-Barba, I.; Nakase, I.; Futaki, S.; Ruan, J. F.; Sakamoto, K.; Sakamoto,
Y.; Kuroda, K.; Terasaki, O.; Che, S. Mesostructured silica based delivery system for a drug with a
peptide as a cell-penetrating vector. Micropor. Mesopor. Mat., 2009, 122, (1-3), 201-207.
140 Sadeghian, F.; Hosseinkhani, S.; Alizadeh, A.; Hatefi, A. Design, engineering and preparation
of a multi-domain fusion vector for gene delivery. Int. J. Pharmaceut., 2012, 427, (2), 393-399.
141 Oliveira, S.; van Rooy, I.; Kranenburg, O.; Storm, G.; Schiffelers, R. M. Fusogenic peptides
enhance endosomal escape improving siRNA-induced silencing of oncogenes. Int. J. Pharm., 2007,
331, (2), 211-214.
142 Varkouhi, A. K.; Scholte, M.; Storm, G.; Haisma, H. J. Endosomal escape pathways for
delivery of biologicals. J. Control. Release., 2011, 151, (3), 220-228.
143 Ye, S. F.; Tian, M. M.; Wang, T. X.; Ren, L.; Wang, D.; Shen, L. H.; Shang, T. Synergistic
effects of cell-penetrating peptide Tat and fusogenic peptide HA2-enhanced cellular internalization
and gene transduction of organosilica nanoparticles. Nanomedicine, 2011, (In Press).
144 Ashley, C. E.; Carnes, E. C.; Phillips, G. K.; Padilla, D.; Durfee, P. N.; Brown, P. A.; Hanna, T.
N.; Liu, J. W.; Phillips, B.; Carter, M. B.; Carroll, N. J.; Jiang, X. M.; Dunphy, D. R.; Willman, C.
L.; Petsev, D. N.; Evans, D. G.; Parikh, A. N.; Chackerian, B.; Wharton, W.; Peabody, D. S.;
Brinker, C. J. The targeted delivery of multicomponent cargos to cancer cells by nanoporous
particle-supported lipid bilayers (vol 10, pg 389, 2011). Nat. Mater., 2011, 10, (6), 476-476.
145 Sauer, A. M.; Schlossbauer, A.; Ruthardt, N.; Cauda, V.; Bein, T.; Brauchle, C. Role of
Endosomal Escape for Disulfide-Based Drug Delivery from Colloidal Mesoporous Silica Evaluated
by Live-Cell Imaging. Nano Lett., 2010, 10, (9), 3684-3691.
146 Zhu, Y. F.; Meng, W. J.; Gao, H.; Hanagata, N. Hollow Mesoporous Silica/Poly(L-lysine)
Particles for Codelivery of Drug and Gene with Enzyme-Triggered Release Property. J. Phys.
Chem. C, 2011, 115, (28), 13630-13636.
Chapter 2 Literature Review
41
147 Chang, J. H.; Kim, K. J.; Shin, Y. K. Sustained drug release on temperature-responsive
polymer hybrid nanoporous silica composites. B. Kor. Chem. Soc., 2004, 25, (8), 1257-1260.
148 Chen, F.; Zhu, Y. C. Chitosan enclosed mesoporous silica nanoparticles as drug nano-carriers:
Sensitive response to the narrow pH range. Micropor. Mesopor. Mat., 2012, 150, (1), 83-89.
149 van der Aa, M. A. E. M.; Mastrobattista, E.; Oosting, R. S.; Hennink, W. E.; Koning, G. A.;
Crommelin, D. J. A. The nuclear pore complex: The gateway to successful nonviral gene delivery.
Pharm. Res., 2006, 23, (3), 447-459.
150 Pan, L.; He, Q.; Liu, J.; Chen, Y.; Ma, M.; Zhang, L.; Shi, J. Nuclear-Targeted Drug Delivery
of TAT Peptide-Conjugated Monodisperse Mesoporous Silica Nanoparticles. J. Am. Chem. Soc.,
2012, 134, (13), 5722-5725.
151 Zhang, J. X.; Sun, W.; Bergman, L.; Rosenholm, J. M.; Linden, M.; Wu, G. J.; Xu, H.; Gu, H.
C. Magnetic mesoporous silica nanospheres as DNA/drug carrier. Mater. Lett., 2012, 67, (1), 379-
382.
152 Liu, J.; Wang, B.; Hartono, S. B.; Liu, T. T.; Kantharidis, P.; Middelberg, A. P. J.; Lu, G. Q.;
He, L. Z.; Qiao, S. Z. Magnetic silica spheres with large nanopores for nucleic acid adsorption and
cellular uptake. Biomaterials, 2012, 33, (3), 970-978.
153 Yiu, H. H. P.; McBain, S. C.; Lethbridge, Z. A. D.; Lees, M. R.; Dobson, J. Preparation and
characterization of polyethylenimine-coated Fe3O4-MCM-48 nanocomposite particles as a novel
agent for magnet-assisted transfection. J. Biomed. Mater. Res. A, 2010, 92A, (1), 386-392.
154 Medintz, I. L.; Uyeda, H. T.; Goldman, E. R.; Mattoussi, H. Quantum dot bioconjugates for
imaging, labelling and sensing. Nat. Mater., 2005, 4, (6), 435-446.
155 Michalet, X.; Pinaud, F. F.; Bentolila, L. A.; Tsay, J. M.; Doose, S.; Li, J. J.; Sundaresan, G.;
Wu, A. M.; Gambhir, S. S.; Weiss, S. Quantum dots for live cells, in vivo imaging, and diagnostics.
Science, 2005, 307, (5709), 538-544.
156 Wu, C. S.; Oo, M. K. K.; Cupps, J. M.; Fan, X. D. Robust silica-coated quantum dot-molecular
beacon for highly sensitive DNA detection. Biosens. Bioelectron., 2011, 26, (9), 3870-3875.
157 Ding, Y.; Jiang, Z. W.; Saha, K.; Kim, C. S.; Kim, S. T.; Landis, R. F.; Rotello, V. M. Gold
Nanoparticles for Nucleic Acid Delivery. Mol. Ther., 2014, 22, (6), 1075-1083.
158 Huang, Y. Z.; Yu, F. Q.; Park, Y. S.; Wang, J. X.; Shin, M. C.; Chung, H. S.; Yang, V. C. Co-
administration of protein drugs with gold nanoparticles to enable percutaneous delivery.
Biomaterials, 2010, 31, (34), 9086-9091.
159 Christen, V.; Fent, K. Silica nanoparticles and silver-doped silica nanoparticles induce
endoplasmatic reticulum stress response and alter cytochrome P4501A activity. Chemosphere,
2012, 87, (4), 423-434.

Chapter 2 Literature Review
42
160 Liu, S. H.; Zhang, Z. H.; Wang, Y. B.; Wang, F. K.; Han, M. Y. Surface-functionalized silica-
coated gold nanoparticles and their bioapplications. Talanta, 2005, 67, (3), 456-461.
161 Martin-Ortigosa, S.; Valenstein, J. S.; Lin, V. S. Y.; Trewyn, B. G.; Wang, K. Gold
Functionalized Mesoporous Silica Nanoparticle Mediated Protein and DNA Codelivery to Plant
Cells Via the Biolistic Method. Adv. Funct. Mater., 2012, 22, (17), 3576-3582.
162 Chithrani, B. D.; Ghazani, A. A.; Chan, W. C. W. Determining the size and shape dependence
of gold nanoparticle uptake into mammalian cells. Nano Lett., 2006, 6, (4), 662-668.
163 Lin, Y. S.; Haynes, C. L. Impacts of Mesoporous Silica Nanoparticle Size, Pore Ordering, and
Pore Integrity on Hemolytic Activity. J. Am. Chem. Soc., 2010, 132, (13), 4834-4842.
164 Lu, F.; Wu, S. H.; Hung, Y.; Mou, C. Y. Size Effect on Cell Uptake in Well-Suspended,
Uniform Mesoporous Silica Nanoparticles. Small, 2009, 5, (12), 1408-1413.
165 Li, Y.; Sun, L.; Jin, M. H.; Du, Z. J.; Liu, X. M.; Guo, C. X.; Li, Y. B.; Huang, P. L.; Sun, Z.
W. Size-dependent cytotoxicity of amorphous silica nanoparticles in human hepatoma HepG2 cells.
Toxicol. in Vitro, 2011, 25, (7), 1343-1352.
166 Chono, S.; Tanino, T.; Seki, T.; Morimoto, K. Uptake characteristics of liposomes by rat
alveolar macrophages: influence of particle size and surface mannose modification. J. Pharm.
Pharmacol., 2007, 59, (1), 75-80.
167 Osaki, F.; Kanamori, T.; Sando, S.; Sera, T.; Aoyama, Y. A quantum dot conjugated sugar ball
and its cellular uptake on the size effects of endocytosis in the subviral region. J. Am. Chem. Soc.,
2004, 126, (21), 6520-6521.
168 Canton, I.; Battaglia, G. Endocytosis at the nanoscale. Chem. Soc. Rev., 2012, 41, (7), 2718-
2739.
169 Jiang, W.; Kim, B. Y. S.; Rutka, J. T.; Chan, W. C. W. Nanoparticle-mediated cellular response
is size-dependent. Nat. Nanotechnol., 2008, 3, (3), 145-150.
170 Guo, J. F.; Bourre, L.; Soden, D. M.; O'Sullivan, G. C.; O'Driscoll, C. Can non-viral
technologies knockdown the barriers to siRNA delivery and achieve the next generation of cancer
therapeutics? Biotechnol. Adv., 2011, 29, (4), 402-417.
171 Rai, P.; Mallidi, S.; Zheng, X.; Rahmanzadeh, R.; Mir, Y.; Elrington, S.; Khurshid, A.; Hasan,
T. Development and applications of photo-triggered theranostic agents. Adv. Drug. Deliver. Rev.,
2010, 62, (11), 1094-1124.
172 Zhao, Y. N.; Sun, X. X.; Zhang, G. N.; Trewyn, B. G.; Slowing, I. I.; Lin, V. S. Y. Interaction
of Mesoporous Silica Nanoparticles with Human Red Blood Cell Membranes: Size and Surface
Effects. Acs Nano, 2011, 5, (2), 1366-1375.
173 Park, D. H.; Nishiyama, N.; Egashira, Y.; Ueyama, K. Separation of organic/water mixtures
with silylated MCM-48 silica membranes. Micropor. Mesopor. Mat., 2003, 66, (1), 69-76.
Chapter 2 Literature Review
43
174 Fenelonov, V. B.; Romannikov, V. N.; Derevyankin, A. L. Mesopore size and surface area
calculations for hexagonal mesophases (types MCM41, FSM-16, etc.) using low-angle XRD and
adsorption data. Micropor. Mesopor. Mat., 1999, 28, (1), 57-72.
175 Bhattarai, S. R.; Muthuswamy, E.; Wani, A.; Brichacek, M.; Castaneda, A. L.; Brock, S. L.;
Oupicky, D. Enhanced Gene and siRNA Delivery by Polycation-Modified Mesoporous Silica
Nanoparticles Loaded with Chloroquine. Pharm. Res., 2010, 27, (12), 2556-2568.
176 Meng, H. A.; Liong, M.; Xia, T. A.; Li, Z. X.; Ji, Z. X.; Zink, J. I.; Nel, A. E. Engineered
Design of Mesoporous Silica Nanoparticles to Deliver Doxorubicin and P-Glycoprotein siRNA to
Overcome Drug Resistance in a Cancer Cell Line. ACS Nano, 2010, 4, (8), 4539-4550.
177 Liu, F.; Yua, P.; Wan, J. J.; Qian, K.; Wei, G. F.; Yang, J.; Liu, B. H.; Wang, Y. H.; Yu, C. Z.
Periodic Mesoporous Organosilicas with Controlled Pore Symmetries for Peptides Enrichment. J
Nanosci. Nanotechno., 2011, 11, (6), 5215-5222.
178 Huang, L.; Kruk, M. Synthesis of ultra-large-pore FDU-12 silica using ethylbenzene as micelle
expander. J. Colloid Interf. Sci., 2012, 365, (1), 137-142.
179 Wang, H. N.; Zhou, X. F.; Yu, M. H.; Wang, Y. H.; Han, L.; Zhang, J.; Yuan, P.; Auchterlonie,
G.; Zou, J.; Yu, C. Z. Supra-assembly of siliceous vesicles. J. Am. Chem. Soc., 2006, 128, (50),
15992-15993.
180 Suteewong, T.; Sai, H.; Cohen, R.; Wang, S. T.; Bradbury, M.; Baird, B.; Gruner, S. M.;
Wiesner, U. Highly Aminated Mesoporous Silica Nanoparticles with Cubic Pore Structure. J. Am.
Chem. Soc., 2011, 133, (2), 172-175.
181 Jo, C.; Kim, K.; Ryoo, R. Syntheses of high quality KIT-6 and SBA-15 mesoporous silicas
using low-cost water glass, through rapid quenching of silicate structure in acidic solution.
Micropor. Mesopor. Mat., 2009, 124, (1-3), 45-51.
182 Schumacher, K.; Grun, M.; Unger, K. K. Novel synthesis of spherical MCM-48. Micropor.
Mesopor. Mat., 1999, 27, (2-3), 201-206.
183 Kruk, M.; Hui, C. M. Synthesis and characterization of large-pore FDU-12 silica. Micropor.
Mesopor. Mat., 2008, 114, (1-3), 64-73.
184 Fantini, M. C. A.; Kanagussuko, C. F.; Zilioti, G. J. M.; Martins, T. S. Synthesis and structure
of cage-like mesoporous silica using different precursors. J. Alloy. Compd., 2011, 509, S357-S360.
185 He, Q. J.; Shi, J. L. Mesoporous silica nanoparticle based nano drug delivery systems:
synthesis, controlled drug release and delivery, pharmacokinetics and biocompatibility. J. Mater.
Chem., 2011, 21, (16), 5845-5855.
186 Deng, Z.; Zhen, Z.; Hu, X.; Wu, S.; Xu, Z.; Chu, P. K. Hollow chitosan–silica nanospheres as
pH-sensitive targeted delivery carriers in breast cancer therapy. Biomaterials, 2011, 32, (21), 4976-
4986.

Chapter 2 Literature Review
44
187 Shi, J.; Hedberg, Y.; Lundin, M.; Odnevall Wallinder, I.; Karlsson, H. L.; Möller, L. Hemolytic
properties of synthetic nano- and porous silica particles: The effect of surface properties and the
protection by the plasma corona. Acta. Biomater., (In Press).
188 Huang, X. L.; Li, L. L.; Liu, T. L.; Hao, N. J.; Liu, H. Y.; Chen, D.; Tang, F. Q. The Shape
Effect of Mesoporous Silica Nanoparticles on Biodistribution, Clearance, and Biocompatibility in
Vivo. ACS Nano, 2011, 5, (7), 5390-5399.
189 Huang, X. L.; Teng, X.; Chen, D.; Tang, F. Q.; He, J. Q. The effect of the shape of mesoporous
silica nanoparticles on cellular uptake and cell function. Biomaterials, 2010, 31, (3), 438-448.
190 Lee, H. I.; Kim, J. H.; Stucky, G. D.; Shi, Y. F.; Pak, C.; Kim, J. M. Morphology-selective
synthesis of mesoporous SBA-15 particles over micrometer, submicrometer and nanometer scales.
J. Mater. Chem., 2010, 20, (39), 8483-8487.
191 García-Calzón, J. A.; Díaz-García, M. E. Synthesis and analytical potential of silica nanotubes.
TrAC, Trends Anal. Chem., 2012, 35, (0), 27-38.
192 Sun, J.; Zhang, H.; Tian, R.; Ma, D.; Bao, X.; Su, D. S.; Zou, H. Ultrafast enzyme
immobilization over large-pore nanoscale mesoporous silica particles. Chem. Commun. , 2006,
(12), 1322-1324.
193 Ji, X.; Lee, K. T.; Monjauze, M.; Nazar, L. F. Strategic synthesis of SBA-15 nanorods. Chem.
Commun., 2008, (36), 4288-4290.
194 Jankiewicz, B. J.; Jamiola, D.; Choma, J.; Jaroniec, M. Silica-metal core-shell nanostructures.
Adv. Colloid. Interfac., 2012, 170, (1-2), 28-47.
195 Wagner, C. S.; Shehata, S.; Henzler, K.; Yuan, J. Y.; Wittemann, A. Towards nanoscale
composite particles of dual complexity. J. Colloid. Interf. Sci., 2011, 355, (1), 115-123.
196 Chen, C. C.; Liu, Y. C.; Wu, C. H.; Yeh, C. C.; Su, M. T.; Wu, Y. C. Preparation of fluorescent
silica nanotubes and their application in gene delivery. Adv. Mater., 2005, 17, (4), 404-407.
197 Bhushan, B.; Jung, Y. C. Natural and biomimetic artificial surfaces for superhydrophobicity,
self-cleaning, low adhesion, and drag reduction. P. Natl. Acad. Sci. USA, 2011, 56, (1), 1-108.
198 Nel, A. E.; Madler, L.; Velegol, D.; Xia, T.; Hoek, E. M. V.; Somasundaran, P.; Klaessig, F.;
Castranova, V.; Thompson, M. Understanding biophysicochemical interactions at the nano-bio
interface. Nat. Mater, 2009, 8, (7), 543-557.

Chapter 3 Methodology
45
Chapter 3
Methodology
This chapter summarizes the strategies utilized in the whole PhD project, including synthetic
methods for virus-mimicking silica nanoparticles (VMSNs) and the techniques for material
characterizations and biological evaluations.
3.1 Materials synthesis
Mono-dispersed solid SiNPs with different sizes are synthesized by the hydrolysis and condensation
of silicon alkoxides in either aqueous solutions or in alcohol/water mixtures using amino acid and
ammonia as a catalyst, respectively. The silica particle diameter can be well-tuned from 10 nm to
300 nm, simply by varying catalyst and precursor concentrations or reaction temperatures.
3.1.1 Synthesis of monodispersed solid silica nanoparticles as core particle
Uniform nonporous silica nanoparticles with a size of ~200 nm were synthesized using a well-
known method developed by Stöber.1 Typically, absolute ethanol (50 mL) was mixed with
deionized (DI) water (3.8 mL) and ammonium hydroxide solution (2 mL, 28%) at 25°C. Then,
tetraethyl orthosilicate (TEOS, 2.8 mL, 98%) was added to the solution under vigorous stirring.
After 6 hours, as-synthesized nanoparticles were separated by centrifugation, and washed with
ethanol and DI water. The final product was obtained by drying at 100°C overnight.
3.1.2 Synthesis of monodispersed solid silica nanoparticles as shell particles
Shell nanoparticles with the mean sizes of 28, 54, 98, 135 and 175 nm were also fabricated using
Stöber method with the same recipe as the core particle, except for reacting at 70, 60, 50, 40 and 30
°C, respectively. The reactions were first carried out for 20 minutes for the formation of shell
particles (28, 54, 98 and 135 nm). For the shell particle of 175 nm, the reaction time was 2 h. In
addition, a modified Stöber method was used to fabricate shell particle of ~13 nm diameter.2 First,
L-arginine (87 mg) was dissolved in DI water (69.5 mL) containing octane (5.23 mL). Then, TEOS
(0.5 mL) was added under vigorous stirring to react at 60 °C for 3.5 h for the formation of shell
particles.

Chapter 3 Methodology
46
3.1.3 Synthesis of virus-mimicking silica nanoparticles (VMSNs)
Figure 3.1 Schematic illustration of VMSN, followed by amine-group and PEI modification.
The amine-modified core particle (200 mg, modification method can be found in section 3.1.4.1)
was suspended (2 mL) in DI water (for the synthesis of VMSN with small shell particles) or ethanol
(for the synthesis of VMSNs with larger shell particles). The suspensions were added into different
shell particle solution keeping the original volume and condition, reacting for another 2 h. The as-
synthesized VMSNs were washed three times with ethanol and isolated by centrifugation at 4750
rpm for 10 min (shell particles cannot be recovered by centrifugation under these conditions),
followed by drying in a fume cupboard at 25 °C overnight. Finally, VMSNs were obtained after
calcination treatment at 550 °C for 5 h to remove organic components in silica frameworks (Figure
3.1).
3.1.4 Functionalization of silica nanoparticles
3.1.4.1 Amine-group modification
Amine silane was grafted onto the surface of core particle or VMSN to create positively charged
surface. First, core particles or VMSNs (200 mg) were suspended in toluene (30 mL). Then, 3-
aminopropyltriethoxysilane (APTES, 0.19 mL, 0.8 mmol) was added. The mixture was refluxed for
20 hours at 383 K. Then, amine-group modified core particles or VMSNs were obtained by
centrifugation, washing with ethanol and deionized water and drying in a vacuum oven at 25°C
overnight.
3.1.4.2 Hydrophobic modification
Smooth or VMSNs were functionalized with n-octadecyl-trimethoxy silane (n-ODMS, 90%).
Different nanoparticles (200 mg) were suspended in toluene (25 mL) containing 0.5% (v/v) n-
ODMS. Then, the mixture was refluxed for 20 h at 110 °C, followed by centrifugation at 10000
rpm, washing with ethanol and drying in a fume cupboard at 25 °C overnight.
3.1.4.3 PEI attachment
In order to achieve efficient endosomal escape for successful cargo delivery into cytosols, 10 kDa
polymer of PEI was attached to both smooth and VMSNs, through a linker of 3-glycidoxypropyl

Chapter 3 Methodology
47
trimethoxysilane (3-GPS). First, epoxysilane was connected onto the surfaces of smooth and
VMSNs by suspending the silica solid (100 mg) in toluene (30 mL) and stirring for 15 minutes at
343 K. Then, 3- GPS (1.5 mL) was added into the solution, which was further stirred for 24 hours at
the same temperature. The solid products were centrifuged, washed three times with toluene and
methanol and dried. Solid products (50 mg) were mixed with 10 kDa PEI (250 mg) in carbonate
buffer (100 mL, 50 mM, pH 9.5) for 24 hours at 298 K. In this step, PEI is attached to the
nanoparticles via epoxy-groups. The products were washed with NaCl solution (20 mL, 1.0 M),
followed by three washes with deionized water, and were then recovered by centrifugation. At the
final stage, the solid products were re-suspended in ethanolamine (20 mL, 1.0 g/L, pH 9) and stirred
at 25°C for 6 hours to block free epoxy groups. The solids were then washed again with NaCl
solution (20 mL, 1.0 M) and deionized water (20 mL).
3.2 Characterizations
3.2.1 Transmission electron microscopy
Transmission electron microscopy (TEM) images were taken using a JEOL 1010 microscope
operated at 100 kV. TEM specimens were dispersed in ethanol, and transferred to a copper grid.
3.2.2 High resolution scanning electron microscopy
High resolution scanning electron microscopy (HRSEM) images were obtained on a JEOL JSM
7800 FE-SEM equipped with an in-column upper electron detector (UED) and gentle beam
technology. HRSEM was operated at a low accelerating voltage of 0.8-1.5 kV with 20% specimen
bias. HRSEM samples were prepared by dispersing the powder samples in DI water, after which
they were dropped to aluminium foil pieces and attached to conductive carbon film on SEM
mounts. The SEM mounts were dried in a vacuum oven at 70 °C for 8 hours before observations.
3.2.3 Electron tomography
Figure 3.2 Illustration of two-stage tomography process with (left) acquisition of an ensemble of
images (projections) about a single tilt axis and (right) the back-projection of these images into 3D
object space. 3
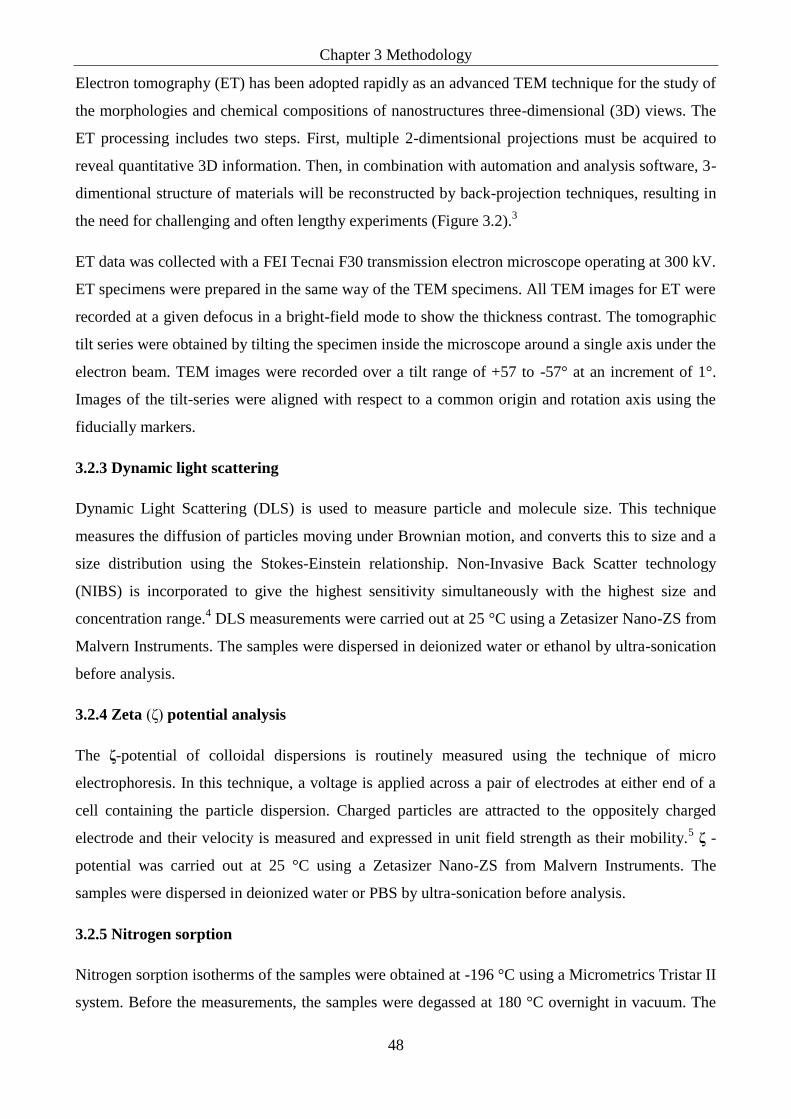
Chapter 3 Methodology
48
Electron tomography (ET) has been adopted rapidly as an advanced TEM technique for the study of
the morphologies and chemical compositions of nanostructures three-dimensional (3D) views. The
ET processing includes two steps. First, multiple 2-dimentsional projections must be acquired to
reveal quantitative 3D information. Then, in combination with automation and analysis software, 3-
dimentional structure of materials will be reconstructed by back-projection techniques, resulting in
the need for challenging and often lengthy experiments (Figure 3.2).3
ET data was collected with a FEI Tecnai F30 transmission electron microscope operating at 300 kV.
ET specimens were prepared in the same way of the TEM specimens. All TEM images for ET were
recorded at a given defocus in a bright-field mode to show the thickness contrast. The tomographic
tilt series were obtained by tilting the specimen inside the microscope around a single axis under the
electron beam. TEM images were recorded over a tilt range of +57 to -57° at an increment of 1°.
Images of the tilt-series were aligned with respect to a common origin and rotation axis using the
fiducially markers.
3.2.3 Dynamic light scattering
Dynamic Light Scattering (DLS) is used to measure particle and molecule size. This technique
measures the diffusion of particles moving under Brownian motion, and converts this to size and a
size distribution using the Stokes-Einstein relationship. Non-Invasive Back Scatter technology
(NIBS) is incorporated to give the highest sensitivity simultaneously with the highest size and
concentration range.4 DLS measurements were carried out at 25 °C using a Zetasizer Nano-ZS from
Malvern Instruments. The samples were dispersed in deionized water or ethanol by ultra-sonication
before analysis.
3.2.4 Zeta (ζ) potential analysis
The ζ-potential of colloidal dispersions is routinely measured using the technique of micro
electrophoresis. In this technique, a voltage is applied across a pair of electrodes at either end of a
cell containing the particle dispersion. Charged particles are attracted to the oppositely charged
electrode and their velocity is measured and expressed in unit field strength as their mobility.5 ζ -
potential was carried out at 25 °C using a Zetasizer Nano-ZS from Malvern Instruments. The
samples were dispersed in deionized water or PBS by ultra-sonication before analysis.
3.2.5 Nitrogen sorption
Nitrogen sorption isotherms of the samples were obtained at -196 °C using a Micrometrics Tristar II
system. Before the measurements, the samples were degassed at 180 °C overnight in vacuum. The

Chapter 3 Methodology
49
Brunauer–Emmett–Teller specific surface area (SBET) was calculated using experimental points at a
relative pressure of P/P0 = 0.05-0.25.
3.2.6 Attenuated total reflectance-Fourier transform infrared spectroscopy
Attenuated total reflectance (ATR)-Fourier transform infrared (FTIR) spectroscopy was utilized to
trace functional group modifications of different SiNPs. The powder of samples was simply added
onto the crystal to obtain optimal contact. The surface functional groups, for example, methyl
groups, were investigated by ATR-FTIR. ATR-FTIR spectra were collected using the Thermo
S nt ™ N ol t™ 6700 FT-IR spectrometers. Each spectrum was obtained using dried powder
against a background measured under the same condition. For each spectrum, 128 scans were
collected at a resolution of 4 cm-1
over the range 400–4000 cm-1
.
3.2.7 Elemental analysis
Elemental analysis (EA) was carried out on a CHNS-O Analyzer (Flash EA1112 Series, Thermo
Electron Corporation) to determine the percentages of carbon (C), according to the dynamic flash
combustion (modified Dumas method). The samples of octadecyl-group modified rough silica
nanoparticles with 10-20 milligrams were tested. Cysteine with 29.99% the element of carbon was
used as the standard control.
When the sample enters the reactor, inserted in the special furnace heated at 950°C, a small volume
of pure Oxygen (250mL/min) is added to the system and helps to burn the material, converting the
sample into elemental (simple) gases. A separation column and TCD detector allows to determine
element concentrations without using a complex splitting system, aliquot dosing device or purge &
trap absorbers.
3.2.8 Atomic force microscopy measurements
Figure 3.3 An atomic force microscope probes a molecule adsorption onto a surface, using a carbon
monoxide molecule at the tip for sensitivity.6

Chapter 3 Methodology
50
Atomic force microscope (AFM) is one kind of scanning probe microscopes (SPM). SPMs are
designed to measure local properties, such as height, friction, magnetism, with a probe. To acquire
an image, the SPM raster-scans the probe over a small area of the sample, measuring the local
property simultaneously (Figure 3.3).6
In the thesis, the surface morphology changes of rough silica nanoparticles before and after
incubating with the protein of IgG-F were investigated. IgG-F was mixed with RSN-211@54 (500
µg) in PBS pH 7.4 for 2 h at 4 °C, at a protein concentration of 1 mg mL-1
. After incubation, the
samples were washed with DI water to remove free and loosely attached proteins and salts in
solution by centrifugation and pipetting. Then, the suspension (10 µL) was placed onto silicon
wafers. The wafer was evaporated at 25 °C before AFM observation. RSN-211@54 without protein
incubation was used as a control. A Cypher S AFM (Asylum Research, an Oxford Instruments
company) was used for all the measurements. The images were obtained by employing the tapping
mode of the AFM in air by using Al-coated silicon probe with tip radius of 2 nm
(NANOSENSORS™, Sw tz rl nd).
3.2.9 Inductively coupled plasma optical emission spectroscopy
Inductively coupled plasma optical emission spectroscopy (ICPOES) is a trace-level, elemental
analysis technique that uses the emission spectra of a sample to identify, and quantify the elements
present. Samples are introduced into the plasma in a process that desolvates, ionises, and excites
them. The constituent elements can be identified by their characteristic emission lines, and
quantified by the intensity of the same lines.7 In this thesis, ICPOES was applied to quantitatively
compare cellular uptake between smooth nanoparticle and VMSNs by testing silicon concentration.
At first, 2×10⁵ cells (including HeLa, KHOS, MCF-7 or SCC-25 cells) were seeded in 6-well plates
on d y or tr ns t on. N nop rt l s (50 μ /mL) alone or nanoparticle-cargo complexes were
incubated with cells under serum free condition for 4 hours. Afterwards, the cells were washed with
PBS three times and harvested with trypsin. After centrifugation, the cell pellets were washed twice
and dried. Cell lysis buffer was added to allow dissolution of the cells with ultrasound. The
supernatants (containing cell components) were removed by centrifugation at 13,000 rpm for 5
minutes, followed by two washes with PBS. Aqueous NaOH solution (1 M) was then added to
allow dissolution of the nanoparticles with ultrasound. The silicon concentrations in the final
solutions were measured by ICPOES using a Vista-PRO instrument (Varian Inc, Australia), which
were then converted to be silica amount.

Chapter 3 Methodology
51
3.2.10 Surface plasmon resonance measurements
Surface plasmon resonance (SPR) is a fast and real-time detection technique used to examine the
interaction between wide ranges of biological targets. Based on detecting small changes in the
refractive index, SPR is able to specifically monitor the interaction between analytes (e.g., antibody
or peptide) and the ligand molecules (e.g., peptide), which have been immobilized onto an inert
surface (e.g., gold surface). "Resonance units" (RU, equal to a critical angle shift of 10−4
deg) is
used to describe binding signals between analytes and ligands (Figure 3.4).8, 9
Figure 3.4 Schematic illustration of a SPR system.9
The interaction between the domain antibody of IgG-F and complementary antigen was monitored
utilizing a SPR-based biosensor (BiacoreTM
T200, GE Healthcare). IgG-F was incubated with one
of VMSNs (500 µg) in PBS pH 7.4 for 2 h at 4 °C, and the final protein concentration was 0.5 mg
mL-1
. Following that, IgG-F-RSNs complexes were washed several times until the supernatant
showed the same UV-vis absorbance at 280 nm as PBS only. Then, IgG-F-RSNs complexes were
suspended in HBS-EP buffer (BiacoreTM
T200, GE Healthcare). Biotinylated peptide was
immobilized via streptavidin capture on a sensor chip CAP (GE Healthcare) pre-immobilized with
ssDNA-streptavidin (Biotin CAPture kit, GE Healthcare) to yield the peptide surface densities in
the range of 2500-5000 R.U. A reference flow cell was generated by omitting only ssDNA-
streptavidin onto the chip surface. Interaction analyses were performed by injecting IgG-F-RSNs
complexes over the reference and peptide surfaces in series for 120 seconds at a flow-r t o 10μl
min-1
. Complex dissociation was monitored for 120 seconds. The binding intensity was determined
at the peak point 128 seconds after sample injection. Surface regeneration was performed at the end
of each analysis cycle by injecting guanidine (8 M) mixed with NaOH (1 M) at the ratio of 3:1,
followed by washing with the mixture of acetonitrile (30%), NaOH (0.25 M) and SDS (0.05%).
Chapter 3 Methodology
52
3.2.11 Thermogravimetric analysis
Thermogravimetric analysis (TGA) is used to monitor the thermal decomposition of epoxy-group
and PEI attachment in air. Around 10-15 mg of epoxy-group/PEI-modifed nanoparticles was loaded
in an aluminum pan and heated from 25 to 900°C at a heating rate of 2 °C min-1
at an air flow of 20
mL min-1
. TGA was conducted using a TGA/DSC 1 Thermogravimetric Analyzer (Mettler-Toledo
Inc).
3.2.12 X-ray photoelectron spectroscopy
X-ray photoelectron spectroscopy (XPS) was used to characterize the amount of Carbon (C),
Nitrogen (N), Oxygen (O) and Silicon (Si) on the external surface of smooth and rough silica
n nop rt l s. XPS w s r ord d on Kr tos Ax s Ultr w t mono rom t Al Kα X-ray
source. Each spectrum was recorded at a survey scan from 0 to 1200 eV with a dwell time of 100
ms, and pass energy of 160 eV at steps of 1 eV with 1 sweep. C1s with a binding energy of 285 eV
was used.10
3.3 Biological techniques
3.3.1 Agarose gel electrophoresis
In the field of nanomedicine, an electrophoretic mobility shift assay (EMSA) is electrophoretic
separation of a nanoparticle–DNA or nanoparticle–RNA mixture on an agarose gel for a short
period. It is also referred as mobility shift electrophoresis, a gel shift assay, gel mobility shift assay,
band shift assay, or gel retardation assay, and is a common affinity electrophoresis technique used
to study nanoparticle–DNA or nanoparticle–RNA interactions. This procedure can determine if a
nanoparticle is capable of binding to a given DNA or RNA sequence. The speed at which different
molecules move through the gel is determined by their size and charge, and to a lesser extent, their
shape (see gel electrophoresis). The control lane (DNA probe without nanoparticle present) will
contain a single band corresponding to the unbound DNA or RNA fragment. Under the correct
experimental conditions, the interaction between the DNA (or RNA) and nanoparticle is stabilized
and the ratio of bound to unbound nucleic acid on the gel reflects the fraction of free and bound
probe molecules as the binding reaction enters the gel. By comparison with a set of standard
dilutions of free probe run on the same gel, the number of moles of protein can be calculated.11
In this thesis, gel electrophoresis analysis was performed to examine the holding ability of VMSNs
to genetic molecules. For Cy3-oligoDNA, t omol ul (25 pmol, 100 μM) w s m x d w t
amino-mod d smoot n nop rt l s or VMSNs (50 μ ). M nw l , PLK1-siRNA (100, 50 and

Chapter 3 Methodology
53
25 pmol) were coupled with PEI-mod d smoot n nop rt l s or VMSNs (50 μ ), r sp t v ly.
For control, Cy3-oligoDNA (25 pmol of) or PLK1-siRNA (25 pmol) was prepared in the absence of
nano-carriers. Four hours later, the complexes were loaded into each well of a 2% agarose gel,
which was then run in Tris-acetate-EDTA buffer containing SYBR® Safe DNA gel Stain at 80 V
for 40 min. Genetic molecule bands were visualized using a GelDoc UV illuminator. For
comparison, software of ImageJ was used to calculate the pixel values of each genetic molecule
band in a fixed area. Genetic molecule amount was estimated after comparing with control group.
3.3.2 Confocal laser scanning microscopy
Confocal laser scanning microscopy (CLSM) is a technique for obtaining high-resolution optical
images with depth selectivity. The key feature of confocal microscopy is its ability to acquire in-
focus images from selected depths, a process known as optical sectioning. Images are acquired
point-by-point and reconstructed with a computer, allowing three-dimensional reconstructions of
topologically complex objects.12
In this thesis, high quality fluorescent images were acquired by CLSM. After seeding 1×10⁵ HeLa
cells onto 24-mm glass coverslips in 6 well-plates, Cy3-oligoDNA-treated (100 nM) and the
complexes of amino-mod d smoot n nop rt l s nd VMSNs (50 μ /mL) +Cy3- oligoDNA
(100 nM)-treated cells were washed with PBS. DNase I solution was added to digest the Cy3-
oligoDNA outside the cells. Cells were washed twice with PBS then incubated at 25°C with
tr tm nt solut on (500 μl), w ont ns 1 mM C Cl2, 0.5 mM MgCl2, 0.1% (w/v) Bovine serum
albumin (BSA, Sigma) and 20 Units of DNase I (Sigma) in PBS. After 30 minutes, the cells were
washed 3 times with PBS and fixed with PFA/PBS (1 mL, 4%) at 4°C for 30 minutes. The liquid
was removed and cells were pre-incubated with PBS containing 1% BSA for 20–30 minutes prior to
dd n t st n n solut on. T n, st n n solut on (200 μl) ont n n 1% (w/v) BSA nd Hum n
CD24 FITC Conju t (5 μl) n PBS w s dd d or 2 ours t 25°C. A t r t t, t ov rsl ps w r
washed three times with PBS and mounted onto glass slides by fluoroshield with DAPI (Sigma).
The slides were viewed using confocal microscopy (LSM ZEISS 710).
3.3.3 MTT assay
The 3-[4,5-dimethylthiazol-2-yl]-2,5-diphenyl tetrazolium bromide (MTT) cell proliferation assay
measures cell proliferation rate and conversely, when metabolic events lead to apoptosis or
necrosis, reduction in cell viability. The yellow tetrazolium MTT is reduced by metabolically active
cells, in part by the action of dehydrogenase enzymes, to generate reducing equivalents such as

Chapter 3 Methodology
54
NADH and NADPH. The resulting intracellular purple formazan can be solubilized and quantified
by spectrophotometric means.13
The cell growth inhibition by delivering therapeutic proteins or siRNAs using VMSNs as
nanocarriers was tested in multiple cell lines, including HeLa, KHOS, MCF-7 and SCC-25 cell
lines. One day before the test, 3000-5000 cells were seeded in each well of 96-well plates. The
complexes of therapeutic drug-nanoparticles were dispersed in culture medium supplemented with
10% FBS and 1% penicillin-streptomycin and added into each well. After the incubation at 37 °C
for 24 to 72 hours, cell viability was measured by adding MTT agent and reading the absorbance at
540 nm using a Synergy HT Microplate Reader. Results were compared to cells not exposed to
nanoparticles.
3.3.4 Flow cytometry
Flow cytometry is a laser-based, biophysical technology employed in cell counting, cell sorting,
biomarker detection and protein engineering, by suspending cells in a stream of fluid and passing
them by an electronic detection apparatus. It allows simultaneous multi-parametric analysis of the
physical and chemical characteristics of up to thousands of particles per second.14
In this thesis, HeLa cells were seeded in 6 well-plates at 2×10⁵ cells per well one day before the
assay. Cy3-oligoDNA was used as a model for siRNA, and it was pre-mixed with amino-modified
smooth nanoparticles and VMSNs for 4 hours, followed by incubation with cells for another 4
hours, and the con ntr t on o n nop rt l s s 50 μ /mL and Cy3-oligoDNA is 100 nM. To
discriminate between cell-association and actual internalization, extracellular Cy3-oligoDNA was
degraded by addition of a high concentration DNase I solution. For this treatment, the cells were
w s d tw w t PBS t n n u t d t 25°C w t tr tm nt solut on (500 μl), w ont ns 1
mM CaCl2, 0.5 mM MgCl2, 0.1% (w/v) Bovine serum albumin (BSA, Sigma) and 20 Units of
DNase I (Sigma) in PBS. After 30 minutes, the cells were washed 3 times with PBS and harvested
by trypsination. After two more washes with PBS, the cells were re-suspended in paraformaldehyde
(M r k) n PBS (PFA/PBS, 600 μl, 2%) or FACS t st us n BD LSR-II Analyzer (USA). The
results were analysed using FlowJo software.
3.3.5 Western-blot analysis
The western blotting (sometimes called the protein immunoblot) is a widely used analytical
technique used to detect specific proteins in a sample of tissue homogenate or extract. It uses gel
electrophoresis to separate native proteins by 3-D structure or denatured proteins by the length of
the polypeptide. The proteins are then transferred to a membrane (typically nitrocellulose or

Chapter 3 Methodology
55
PVDF), where they are stained with antibodies specific to the target protein. The gel electrophoresis
step is included in western blotting analysis to resolve the issue of the cross-reactivity of
antibodies.15
In this thesis, western blotting was used to define the degradation of pro-apoptotic protein of Bcl-2.
MCF-7 cells were seeded in 6-well plates at a seeding density of 3×10⁵ cells per well. The anti-
pAkt antibody and the non-specific IgG antibody were incubated with hydrophobically modified
VMSNs in PBS pH 7.4 at 4 °C for 2 h. Then, protein-nanoparticle complexes, along with
nanoparticle only group were mixed with serum containing culture medium and incubated with
lls or 24 . T n l on ntr t on o n nop rt l s s 50 μ mL-1
and protein is 1 µg mL-1
. At
the end of incubation, cells were washed with PBS and lysed. The solutions containing cell lysates
were heated at 95 °C for 15 min followed by characterization by SDS-PAGE. The protein bands
were transferred to a PVDF membrane. Targeting protein of Bcl-2 was targeted using Bcl-2
monoclonal antibody mAb as the primary antibody, and HRP-linked anti-rabbit IgG antibody as the
secondary antibody. GAPDH mAb was used as an internal reference. Bands were visualized on a
ChemiDoc MP System (Bio-Rad).
3.3.6 TEM study on nanoparticle-cell interaction
MCF-7 cells were seeded in 3-cm petri-dishes at a cell number of 3×10⁵ for 24 h. Cells were then
incubated with a suspension of nanoparticle (SSN, RSN, C18-SSN and C18-RSN) for 24 hours.
Cells were washed with PBS buffer three times and then fixed with 2.5% glutaraldehyde at 25°C for
30min, before they were postfixed in 1% osmium tetraoxide in microwave condition. After that, the
cells were washed with PBS and embedded into 2% agarose gel cube. The cell cubes were
dehydrated in acetone of increasing concentration (50%, 70%, 90%, 100% and 100%) in a
sequential manner in microwave condition. Then, dehydrated cell cubes were embedded in epon
resin, and solidified in 60°C for 2 days. Microtome (Leica, EM UC6) was then used to cut the
embedded cell-resin cube into thin slices (70–90 nm in thickness). The samples were collected on
copper grids and double stained with the aqueous solution of uranyl acetate (2%) and commercially
available aqueous solutions of lead citrate. The ultra-thin slides were transferred to a form-bar
coated copper grid. TEM images were taken using a JEOL 1010 microscope operated at 80 kV.
3.4 References
1 Stöber, W.; Fink, A.; Bohn, E. Controlled Growth of Monodisperse Silica Spheres in Micron Size
Range. J. Colloid Interface Sci, 1968, 26, (1), 62-69.

Chapter 3 Methodology
56
2 Yokoi, T.; Sakamoto, Y.; Terasaki, O.; Kubota, Y.; Okubo, T.; Tatsumi, T. Periodic arrangement
of silica nanospheres assisted by amino acids. J. Am. Chem. Soc, 2006, 128, (42), 13664-13665.
3 Midgley, P. A.; Dunin-Borkowski, R. E. Electron tomography and holography in materials
science. Nat. Mater., 2009, 8, (4), 271-280.
4 Naiim, M.; Boualem, A.; Ferre, C.; Jabloun, M.; Jalocha, A.; Ravier, P. Multiangle dynamic light
scattering for the improvement of multimodal particle size distribution measurements. Soft Matter,
2015, 11, (1), 28-32.
5 Kaszuba, M.; Corbett, J.; Watson, F. M.; Jones, A. High-concentration zeta potential
measurements using light-scattering techniques. Philos. T. R. Soc. A, 2010, 368, (1927), 4439-
4451.
6 Shibata, M.; Uchihashi, T.; Ando, T.; Yasuda, R. Long-tip high-speed atomic force microscopy
for nanometer-scale imaging in live cells. Sci. Rep-Uk, 2015, 5.
7 Fassel, V. A.; Kniseley, R. N. Inductively Coupled Plasma - Optical Emission-Spectroscopy.
Anal. Chem., 1974, 46, (13), 1110-&.
8 Besenicar, M.; Macek, P.; Lakey, J. H.; Anderluh, G. Surface plasmon resonance in protein-
membrane interactions. Chem. Phys. Lipids, 2006, 141, (1-2), 169-178.
9 Richens, J. L.; Urbanowicz, R. A.; Lunt, E. A. M.; Metcalf, R.; Corne, J.; Fairclough, L.; O'Shea,
P. Systems biology coupled with label-free high-throughput detection as a novel approach for
diagnosis of chronic obstructive pulmonary disease. Resp Res, 2009, 10.
10 Kristensen, E. M. E.; Nederberg, F.; Rensmo, H.; Bowden, T.; Hilborn, J.; Siegbahn, H.
Photoelectron spectroscopy studies of the functionalization of a silicon surface with a
phosphorylcholine-terminated polymer grafted onto (3-aminopropyl)trimethoxysilane. Langmuir,
2006, 22, (23), 9651-9657.
11 Scott, V.; Clark, A.; Docherty, K., The Gel Retardation Assay. In Protocols for Gene Analysis,
Harwood, A., Ed. Humana Press: 1994; Vol. 31, pp 339-347.
12 Claxton, N. S.; Fellers, T. J.; Davidson, M. W., Microscopy, Confocal. In Encyclopedia of
Medical Devices and Instrumentation, John Wiley & Sons, Inc.: 2006.
13 Ferrari, M.; Fornasiero, M. C.; Isetta, A. M. Mtt Colorimetric Assay for Testing Macrophage
Cytotoxic Activity Invitro. J Immunol Methods, 1990, 131, (2), 165-172.
14 Ornatsky, O.; Bandura, D.; Baranov, V.; Nitz, M.; Winnik, M. A.; Tanner, S. Highly
multiparametric analysis by mass cytometry. J. Immunol. Methods, 2010, 361, (1-2), 1-20.
15 Mahmood, T.; Yang, P.-C. Western Blot: Technique, Theory, and Trouble Shooting. N. Am. J.
Med. Sci., 2012, 4, (9), 429-434.

Chapter 4 Nanoparticles Mimicking Viral Surface Topography for Enhanced Cellular Delivery
57
Chapter 4
Nanoparticles Mimicking Viral Surface
Topography for Enhanced Cellular Delivery
This chapter reports the synthesis of novel non-viral nanoparticles mimicking virus surface
topography by attaching small shell particles (~10nm) onto the core particle with a large size
(~200nm). We show that increases in nanoscale surface roughness improve both binding of
biomolecules (e.g., protein or genetic molecules) and cellular uptake; thus, the cargo delivery
efficiency is significantly increased, compared to conventional silica nanoparticles with a smooth
surface. We further demonstrate that the contribution of surface roughness is general, regardless of
surface functionality and cell types. Finally, gene delivery efficiency was tested, and the biomimetic
nanoparticles showed a better performance than a commercial transfection reagent. This work has
been published and highlighted as frontispiece paper in Advanced Materials (2013,
Communication).

Chapter 4 Nanoparticles Mimicking Viral Surface Topography for Enhanced Cellular Delivery
58
4.1 Introduction
Delivery of various drug molecules into cells is crucial in modern medicine.1, 2
Most naked
biomolecules and some free drugs are poorly delivered to cells owing to poor stability, low
solubility and/or unwanted toxicity. For these reasons, various natural and synthetic vectors have
been used as cellular delivery vehicles. Compared to viral vectors having a high delivery
efficiency,3, 4
non-viral vectors such as nanoparticles are safer delivery tools,5 but their cellular
delivery efficiency is far from satisfactory.6 It remains an ongoing challenge to develop non-viral
carrier systems having both good safety and high delivery efficiency.
Understanding structure-function relationship in natural systems, such as enveloped viruses,
provides useful guides for the design of new nano-carriers. Enveloped viruses have sizes around 30-
400 nm, which appears to be ideal for cellular uptake.7 Their high infectivity is mainly attributed to
receptor-specific interactions, facilitating subsequent viral fusion or cellular uptake.3, 8
This concept
has been used in the design of nano-carriers.9, 10
Recent developments in state-of-the-art electron
tomo r p y (ET) v prov d d “n no- olo y” n orm t on or m ny nv lop d v rus s, or
example, influenza virus,8 HSV
11 and HIV,
12 all showing rough surfaces patched by glycoprotein
spikes. However, the influence of nanoscale surface roughness on cellular delivery efficiency
remains unclear because it is always associated with receptor-ligand specific interactions in viral
systems.
Synthetic nanoparticles mimicking the surface topography of enveloped viruses may provide useful
tools to study the roles of surface roughness while excluding the influence of receptor-specific
interaction. Cellular delivery efficiency of nano-vectors is dependent on both the binding capability
to cargo molecules and subsequent cellular uptake. It was reported that the saturation uptake of
biomolecules on roughened films increased by up to 70%, higher than the increase of surface area
(20%).13
The enhanced adsorption is attributed to a change in geometrical arrangement and
accumulation of biomolecules in a multi-layered manner on the rough surface.13, 14
Unfortunately,
the impact of surface roughness on biomolecule binding has not been reported for nano-vectors.
Moreover, there exist a small number of literature reports investigating the roles of surface
roughness of polymer nanoparticles in cellular uptake of nanoparticles themselves,15
however, the
contribution from surface roughness fluctuated and may have been interfered by inconsistent
material compositions. A study the impacts of surface roughness of nano-vectors on both binding
ability to cargo molecules and cellular uptake performance has not been reported to our knowledge.
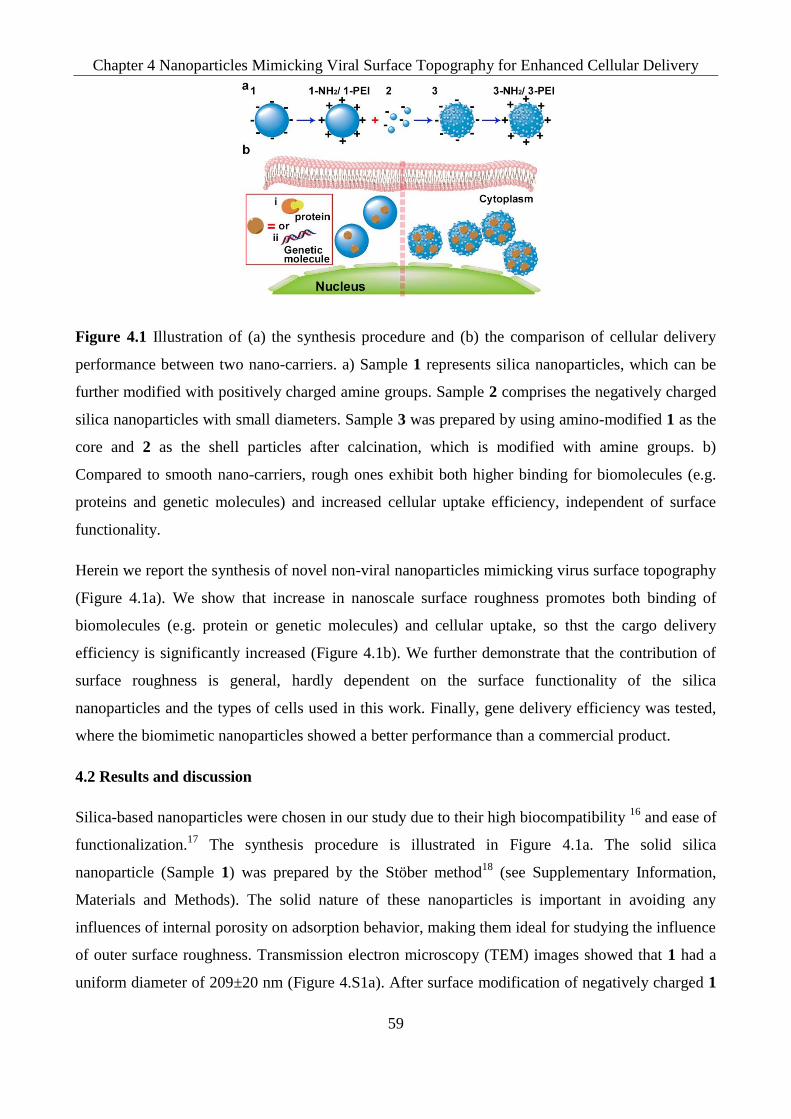
Chapter 4 Nanoparticles Mimicking Viral Surface Topography for Enhanced Cellular Delivery
59
Figure 4.1 Illustration of (a) the synthesis procedure and (b) the comparison of cellular delivery
performance between two nano-carriers. a) Sample 1 represents silica nanoparticles, which can be
further modified with positively charged amine groups. Sample 2 comprises the negatively charged
silica nanoparticles with small diameters. Sample 3 was prepared by using amino-modified 1 as the
core and 2 as the shell particles after calcination, which is modified with amine groups. b)
Compared to smooth nano-carriers, rough ones exhibit both higher binding for biomolecules (e.g.
proteins and genetic molecules) and increased cellular uptake efficiency, independent of surface
functionality.
Herein we report the synthesis of novel non-viral nanoparticles mimicking virus surface topography
(Figure 4.1a). We show that increase in nanoscale surface roughness promotes both binding of
biomolecules (e.g. protein or genetic molecules) and cellular uptake, so thst the cargo delivery
efficiency is significantly increased (Figure 4.1b). We further demonstrate that the contribution of
surface roughness is general, hardly dependent on the surface functionality of the silica
nanoparticles and the types of cells used in this work. Finally, gene delivery efficiency was tested,
where the biomimetic nanoparticles showed a better performance than a commercial product.
4.2 Results and discussion
Silica-based nanoparticles were chosen in our study due to their high biocompatibility 16
and ease of
functionalization.17
The synthesis procedure is illustrated in Figure 4.1a. The solid silica
nanoparticle (Sample 1) was prepared by the Stöber method18
(see Supplementary Information,
Materials and Methods). The solid nature of these nanoparticles is important in avoiding any
influences of internal porosity on adsorption behavior, making them ideal for studying the influence
of outer surface roughness. Transmission electron microscopy (TEM) images showed that 1 had a
uniform diameter of 209±20 nm (Figure 4.S1a). After surface modification of negatively charged 1

Chapter 4 Nanoparticles Mimicking Viral Surface Topography for Enhanced Cellular Delivery
60
(ζ pot nt l o -24 mV) by amine groups, 1-NH2 was obtained with a similar size (211±19 nm,
Figure 4.S1b) but a positively charged surface (+51 mV). By using a modified Stöber method to
prepare silica nanoparticles,19
2 w s o t n d w t ζ pot nt l o -42 mV and a small diameter of
~13 nm (Figure 4.S1d). The association between 1-NH2 as the core and 2 as the shell particle gave
rise to sample 3 after calcination, which was negatively charged (-36 mV) and showed a rough
surface (Figure 4.S1e).
Figure 4.2 Surface characteristics of 3. a, b) SEM images show the virus-mimicking rough surface.
c) A zero-tilt TEM projection from a tilt series. d) Reconstructed surface rendering of a single
particle. The core particle is shown in blue and the shell spikes in yellow. Scale bar: 100 nm.
Scanning electron microscopy (SEM) images (Figure 4.2a & b) clearly showed that the core
particles (~200 nm) of 3 were studded with shell particles (~10 nm). This surface topography is
similar to that of the envelope-spike structure in some viruses, such as HSV.11
3 was also modified
with amine groups to produce 3-NH2 (224 ±16 nm) with a rough (Figure 4.S1f) and positively
charged surface (+54 mV). Moreover, 1 and 3 were conjugated with polyethylenimine (PEI) with
little change in surface topography (1-PEI: Figure 4.S1c, 220±13 nm, +47mV; 3-PEI: Figure 4.S1g,
226±16 nm, +43mV). The size distribution of all samples measured using the dynamic light
scattering (DLS) method is shown in Figure 4.S1h, indicating that all the samples are monodisperse
(see Table 4.S1 and 4.S2 for the polydispersity index, PDI). The surface area of 1 and 3 was
measured to be 19 and 24 m2/g, respectively (Figure 4.S2). It is noted that 1 and 3 (similarly, 1-NH2
and 3-NH2, 1-PEI and 3-PEI) possess similar sizes, surface charges and chemical compositions,
except their surface topographies.

Chapter 4 Nanoparticles Mimicking Viral Surface Topography for Enhanced Cellular Delivery
61
Precision information of the nanoscale surface roughness is important in understanding the impact
o “n no- olo y”.11
Conventional electron microscopy techniques cannot readily be used to
quantitatively determine the surface coverage of shell particles. Therefore, an ET technique was
applied using developed protocols.20
Tilt series were recorded on a 300 kV microscope from virus-
mimicking nanoparticles (3); a bright field TEM image at zero-tilt is shown in Figure 4.2c. The core
diameter was measured to be 168 nm, and the shell particles protruding from the core surface were
clearly visible. The tomographic reconstructed structure of the rough nanoparticle is shown in
Figure 4.2d, reconstructed from 1151 tomogram slices (each 0.15 nm in thickness).
Useful and quantitative information can be obtained from the ET data. By following consecutive ET
slices, a total number of ~320 spikes were found. The size of spikes lay in a broad range of 3.2 to
10.6 nm with an average diameter of 6.4 nm, which we attribute to the calcination treatment in the
preparation of 3. The packing density of the shell particles was variable. The centre-to-centre
distance varies from ~10 to ~40 nm. The structure shown in Figure 4.2d is comparable to the
surface features of some enveloped viruses, such as HSV with a spherical shape (~ 225 nm in
diameter) and 600-750 spikes (~10 nm) in one virion.11
Using the information from ET, the weight
ratio of shell to core particles was estimated to be ~1.8% (see SI). This information will be used in
the evaluation of cellular delivery performance.
The comparison of cellular delivery performance between smooth and rough nano-carriers was first
tested using 1-NH2 and 3-NH2. The cyanine dye (Cy3)-labeled oligoDNA (Cy3-oligoDNA) was
used as a model biomolecule. After coupling 1-NH2 and 3-NH2 (50 µg/mL) with negatively charged
Cy3-oligoDNA (100 nM), the complexes were incubated with HeLa cells for 4 h. Confocal
microscopy showed very weak Cy3 signals (red color) in the sample using 1-NH2 (Figure 4.3a). In
contrast, strong Cy3 signals (Figure 4.3b) localized within the cell borders (green color) were
observed using 3-NH2 as the vector. In addition, no Cy3 signals were observed when the same
amount of Cy3-oligoDNA alone was incubated with cells (Figure 4.S3), indicating the inability of
genetic molecules themselves to penetrate into cells. Fluorescein-activated cell sorting (FACS)
analysis was used to quantitatively evaluate the delivery efficiency of Cy3-oligoDNA (Figure 4.S4).
By comparing the median fluorescence intensity (MFI; Figure 4.3c), it was shown that 3-NH2
delivered ~5.6 times Cy3-OligoDNA into cells compared to 1-NH2, indicating a higher cargo
delivery efficacy of the nano-carrier with a rough surface.
In order to exclude the possibility that the improved cellular delivery performance is attributed to
the unexpected detachment of shell particles, fluorescence microscopy was used. Similar to the

Chapter 4 Nanoparticles Mimicking Viral Surface Topography for Enhanced Cellular Delivery
62
results from confocal microscopy, very weak signals were observed in the groups of naked Cy3-
oligoDNA (Figure 4.S5a-c), Cy3-oligoDNA coupled with 2-NH2 (0.9 µg/mL, dosage calculated
from ET results, Figure 4.S5d-f) and 1-NH2 (Figure 4.S5g-i). Only 3-NH2 induced evident Cy3
signals across all groups (Figure 4.S5j-l). These results further confirmed the enhanced delivery is
attributed to the surface roughness.
Figure 4.3 Virus-mimicking nanoparticles enhance cellular delivery performance in HeLa cells. a,
b) Confocal microscopy images of Cy3-oligoDNA (red color) delivery by (left) 1-NH2 & (right) 3-
NH2. The nuclei are stained in blue (DAPI) and the cell membranes in green (FITC). Scale bar: 20
μm. ) FACS n lys s o Cy3-oligoDNA delivery, showing higher increase of Cy3-signals in MFI
using 3-NH2 than 1-NH2. d) Identification of Cy3-oligoDNA binding for 1-NH2 & 3-NH2. e)
Investigation of biomolecule holding ability by gel retardation assay. f) Comparison of cellular
uptake efficiency of the complexes (1-NH2/3-NH2+Cy3-oligoDNA) measured by ICPOES. For bar
charts, data represent mean ± s.e.m.**p<0.01,***p<0.001, ****p<0.0001 (t-test).
Chapter 4 Nanoparticles Mimicking Viral Surface Topography for Enhanced Cellular Delivery
63
To understand why surface roughness improved cellular delivery of biomolecules, we separately
investigated the impact of surface roughness on either binding towards cargo molecules or cellular
uptake. Figure 4.3d shows that 3-NH2 absorbed ~85% more Cy3-oligoDNA (1.29 nmol/mg) than 1-
NH2 (0.69 nmol/mg). Moreover, agarose gel electrophoresis was used to evaluate the cargo holding
ability of nano-carriers to mimic the release behaviour. 25 pmol of Cy3-oligoDNA was mixed with
50 µg of nanoparticles, a feed ratio (0.5 nmol/mg) lower than the saturation adsorption amount of
both 1-NH2 and 3-NH2. As shown from Figure 4.S6a, in the absence of nano-carriers (Lane 0), all
naked Cy3-oligoDNA migrated to the positive electrode. In the case of 1-NH2, a small amount of
released Cy3-oligoDNA was observed (Lane 1). For 3-NH2, nearly no release could be seen by
naked eyes (Lane 2). After quantitative analysis (ImageJ, see SI), the released amount of Cy3-
oligoDNA was calculated to be 15.1 and 3.9 pmol for 1-NH2 and 3-NH2, respectively (Figure 4.3e).
To quantitatively study the cellular uptake performance, cells were collected after incubating with
the complexes of 1-NH2 /3-NH2 + Cy3-oligoDNA. Because small oxide suspensions rapidly
agglomerate in biological fluids, and this will influence the transport of nanoparticles to cells in a
time dependent manner,21, 22
we fixed the cell incubation time to be 4 h in all experiments. The mass
of silica internalized per cell was measured using inductively coupled plasma optical emission
spectrometry (ICPOES). As shown in Figure 4.3f, 290 pg/cell was detected for 3-NH2 while 178
pg/cell for 1-NH2 (63% increase). Our results have demonstrated that the nanoscale surface
roughness improves both binding towards biomolecules (enhancing adsorption and reducing release
of bound biomolecules simultaneously) and cellular uptake, all aspects contributing to the highly
increased cellular delivery performance.
In addition to 1-NH2 and 3-NH2, pure silica nano-carriers 1 & 3 with negatively charged surfaces
were also investigated. Using a positively charged protein, Cytochrome C (pI= 9.823
), as the model
molecule, its adsorption amount is 2.71 nmol/mg on 3, nearly 2 times higher than that on 1 (0.88
nmol/mg, Figure 4.S7a). In addition, compared to 1, cellular uptake of 3 increased by 108% in
KHOS cells (an osteosarcoma cell line, Figure 4.S7b) and 29.4% (Figure 4.S7c) in HeLa cells.
Dose-dependent cytotoxicity of nano-carriers (1 and 3, 1-NH2 and 3-NH2) was investigated for
further cellular delivery tests by a standard MTT assay in HeLa and KHOS cells. As shown in
Figure 4.S8a-d, generally the cell viability decreases with increasing dose. It is important to notice
that at each dose, the rough particles caused higher toxicity than the smooth ones, independent of
the surface charge or cell types. For example, the cell viability was 91% for KHOS and 93% for
HeLa after incubating with 1 at the dose of 50 µg/mL, but to 82% and 88% after incubation with 3.
The cytotoxicity of 1-PEI and 3-PEI was also tested in KHOS cells for cellular delivery application,

Chapter 4 Nanoparticles Mimicking Viral Surface Topography for Enhanced Cellular Delivery
64
which is higher compared to that of pure and amino-functionalized particles (Figure 4.S8e).
Similarly, 3-PEI was more toxic compared to 1-PEI at all doses. The higher toxicity of rough
particles compared to smooth ones is consistent with the higher cellular uptake induced by the
surface roughness. The above results have shown that the impacts of surface roughness are general
and independent of surface charge, cargos or cell types.
Figure 4.4 Gene delivery performance of virus-mimicking nanoparticles in KHOS cells. a) The
inhibition of cell viability by PLK1-siRNA transfection. S10-siRNA was used as a negative control.
Both 1-PEI and 3-PEI were used as vectors, and a commercial reagent, OligofectamineTM
, was also
applied as a further control. b) PLK1-siRNA adsorption ability of 1-PEI and 3-PEI. c) Comparison
of cellular uptake efficiency of the complexes (1-PEI/3-PEI+PLK1-siRNA) measured by ICPOES.
Data represent mean ± s.e.m.*P<0.05, ***p<0.001 (t-test)
To demonstrate the potential of nanoparticles mimicking virus surface as effective cellular delivery
vehicles, a functional siRNA against polo-like kinase 1 (PLK1) was delivered into KHOS cells.
PLK1 gene is highly expressed in cancer cell lines, such as KHOS (osteosarcoma),16, 22
MCF-7
(breast cancer)24
and HeLa (cervical cancer).25
Silencing PLK1 gene with siRNAs can decrease
PLK1-mRNA and PLK1-protein levels, thus will inhibit cell viability. Due to the inability of
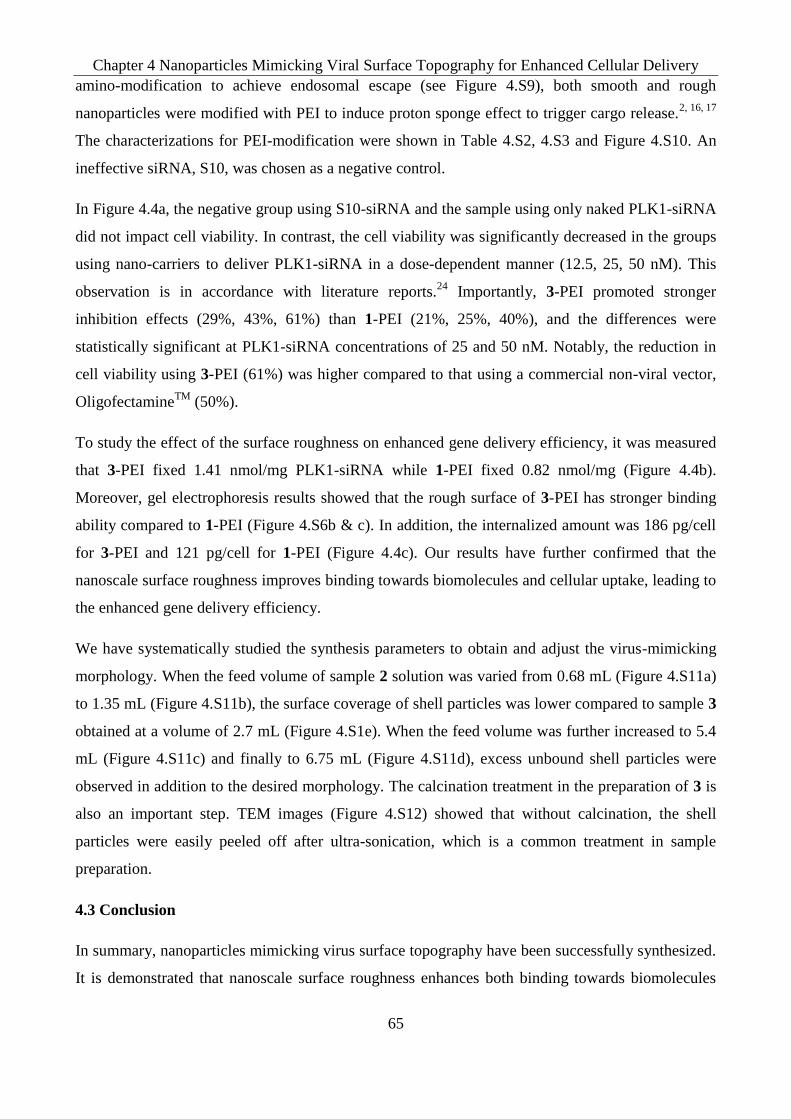
Chapter 4 Nanoparticles Mimicking Viral Surface Topography for Enhanced Cellular Delivery
65
amino-modification to achieve endosomal escape (see Figure 4.S9), both smooth and rough
nanoparticles were modified with PEI to induce proton sponge effect to trigger cargo release.2, 16, 17
The characterizations for PEI-modification were shown in Table 4.S2, 4.S3 and Figure 4.S10. An
ineffective siRNA, S10, was chosen as a negative control.
In Figure 4.4a, the negative group using S10-siRNA and the sample using only naked PLK1-siRNA
did not impact cell viability. In contrast, the cell viability was significantly decreased in the groups
using nano-carriers to deliver PLK1-siRNA in a dose-dependent manner (12.5, 25, 50 nM). This
observation is in accordance with literature reports.24
Importantly, 3-PEI promoted stronger
inhibition effects (29%, 43%, 61%) than 1-PEI (21%, 25%, 40%), and the differences were
statistically significant at PLK1-siRNA concentrations of 25 and 50 nM. Notably, the reduction in
cell viability using 3-PEI (61%) was higher compared to that using a commercial non-viral vector,
OligofectamineTM
(50%).
To study the effect of the surface roughness on enhanced gene delivery efficiency, it was measured
that 3-PEI fixed 1.41 nmol/mg PLK1-siRNA while 1-PEI fixed 0.82 nmol/mg (Figure 4.4b).
Moreover, gel electrophoresis results showed that the rough surface of 3-PEI has stronger binding
ability compared to 1-PEI (Figure 4.S6b & c). In addition, the internalized amount was 186 pg/cell
for 3-PEI and 121 pg/cell for 1-PEI (Figure 4.4c). Our results have further confirmed that the
nanoscale surface roughness improves binding towards biomolecules and cellular uptake, leading to
the enhanced gene delivery efficiency.
We have systematically studied the synthesis parameters to obtain and adjust the virus-mimicking
morphology. When the feed volume of sample 2 solution was varied from 0.68 mL (Figure 4.S11a)
to 1.35 mL (Figure 4.S11b), the surface coverage of shell particles was lower compared to sample 3
obtained at a volume of 2.7 mL (Figure 4.S1e). When the feed volume was further increased to 5.4
mL (Figure 4.S11c) and finally to 6.75 mL (Figure 4.S11d), excess unbound shell particles were
observed in addition to the desired morphology. The calcination treatment in the preparation of 3 is
also an important step. TEM images (Figure 4.S12) showed that without calcination, the shell
particles were easily peeled off after ultra-sonication, which is a common treatment in sample
preparation.
4.3 Conclusion
In summary, nanoparticles mimicking virus surface topography have been successfully synthesized.
It is demonstrated that nanoscale surface roughness enhances both binding towards biomolecules

Chapter 4 Nanoparticles Mimicking Viral Surface Topography for Enhanced Cellular Delivery
66
(more binding and less release) and cellular uptake efficacy, thus the cellular delivery performance
can be improved. This understanding is important in the rational design of new cellular delivery
vectors. By combining both the nanoscale surface roughness and receptor-specific binding moieties,
or by introducing rough surfaces or core particles having other compositions and structures, a
platform of synthetic vectors with high cellular delivery performance is on the horizon.
4.4 References
1 J. W. Yoo, D. J. Irvine, D. E. Discher, S. Mitragotri, Nature Reviews Drug Discovery 2011, 10,
521; R. A. Morgan, M. E. Dudley, J. R. Wunderlich, M. S. Hughes, J. C. Yang, R. M. Sherry, R. E.
Royal, S. L. Topalian, U. S. Kammula, N. P. Restifo, Z. L. Zheng, A. Nahvi, C. R. de Vries, L. J.
Rogers-Freezer, S. A. Mavroukakis, S. A. Rosenberg, Science 2006, 314, 126; A. M. Chen, M.
Zhang, D. G. Wei, D. Stueber, O. Taratula, T. Minko, H. X. He, Small 2009, 5, 2673; I. L. Medintz,
H. T. Uyeda, E. R. Goldman, H. Mattoussi, Nat. Mater. 2005, 4, 435.
2 Y. Niu, A. Popat, M. Yu, S. Karmakar, W. Gu, C. Yu, Ther. Delivery 2012, 3, 1217.
3 D. S. Dimitrov, Nat Rev Microbiol 2004, 2, 109.
4 Q. L. Lu, G. Bou-Gharios, T. A. Partridge, Gene Ther. 2003, 10, 131.
5 C. E. Thomas, A. Ehrhardt, M. A. Kay, Nat. Rev. Genet. 2003, 4, 346.
6 D. A. Jackson, S. Juranek, H. J. Lipps, Mol. Ther. 2006, 14, 613.
7 J. Mercer, M. Schelhaas, A. Helenius, Annu. Rev. Biochem. 2010, 79, 803.
8 A. Harris, G. Cardone, D. C. Winkler, J. B. Heymann, M. Brecher, J. M. White, A. C. Steven,
Proc. Natl. Acad. Sci. U. S. A. 2006, 103, 19123.
9 M. Soliman, R. Nasanit, S. R. Abulateefeh, S. Allen, M. C. Davies, S. S. Briggs, L. W. Seymour,
J. A. Preece, A. M. Grabowska, S. A. Watson, C. Alexander, Mol. Pharmaceutics 2012, 9, 1; P.
Shah, N. Sridevi, A. Prabhune, V. Ramaswamy, Microporous Mesoporous Mater. 2008, 116, 157.
10 K. Grunewald, P. Desai, D. C. Winkler, J. B. Heymann, D. M. Belnap, W. Baumeister, A. C.
Steven, Science 2003, 302, 1396.
11 P. Zhu, J. Liu, J. Bess, E. Chertova, J. D. Lifson, H. Grise, G. A. Ofek, K. A. Taylor, K. H. Roux,
Nature 2006, 441, 847.
12 K. Rechendorff, M. B. Hovgaard, M. Foss, V. P. Zhdanov, F. Besenbacher, Langmuir 2006, 22,
10885.
13 P. E. Scopelliti, A. Borgonovo, M. Indrieri, L. Giorgetti, G. Bongiorno, R. Carbone, A. Podesta,
P. Milani, Plos One 2010, 5.

Chapter 4 Nanoparticles Mimicking Viral Surface Topography for Enhanced Cellular Delivery
67
14 M. Massignani, C. LoPresti, A. Blanazs, J. Madsen, S. P. Armes, A. L. Lewis, G. Battaglia,
Small 2009, 5, 2424; C. LoPresti, M. Massignani, C. Fernyhough, A. Blanazs, A. J. Ryan, J.
Madsen, N. J. Warren, S. P. Armes, A. L. Lewis, S. Chirasatitsin, A. J. Engler, G. Battaglia, ACS
Nano 2011, 5, 1775.
15 S. B. Hartono, W. Y. Gu, F. Kleitz, J. Liu, L. Z. He, A. P. J. Middelberg, C. Z. Yu, G. Q. Lu, S.
Z. Qiao, ACS Nano 2012, 6, 2104.
16 T. A. Xia, M. Kovochich, M. Liong, H. Meng, S. Kabehie, S. George, J. I. Zink, A. E. Nel, ACS
Nano 2009, 3, 3273.
17 W. Stöber, A. Fink, E. Bohn, J. Colloid Interface Sci. 1968, 26, 62.
18 T. Yokoi, Y. Sakamoto, O. Terasaki, Y. Kubota, T. Okubo, T. Tatsumi, J. Am. Chem. Soc. 2006,
128, 13664.
19 P. Yuan, J. Sun, H. Xu, L. Zhou, J. Liu, D. Zhang, Y. Wang, K. S. Jack, J. Drennan, D. Zhao, G.
Lu, X. Zou, J. Zou, C. Yu, Chem. Mater. 2010, 23, 229; P. Yuan, N. Liu, L. Zhao, X. Zhou, L.
Zhou, G. J. Auchterlonie, X. Yao, J. Drennan, G. Q. Lu, J. Zou, C. Yu, Angew. Chem., Int. Ed.
2008, 47, 6670.
20 W. J. Stark, Angew Chem Int Edit 2011, 50, 1242.
21 L. K. Limbach, Y. C. Li, R. N. Grass, T. J. Brunner, M. A. Hintermann, M. Muller, D. Gunther,
W. J. Stark, Environ Sci Technol 2005, 39, 9370.
22 A. Vinu, V. Murugesan, O. Tangermann, M. Hartmann, Chem. Mater. 2004, 16, 3056.
23 Y. D. Yao, T. M. Sun, S. Y. Huang, S. Dou, L. Lin, J. N. Chen, J. B. Ruan, C. Q. Mao, F. Y. Yu,
M. S. Zeng, J. Y. Zang, Q. Liu, F. X. Su, P. Zhang, J. Lieberman, J. Wang, E. W. Song, Science
Translational Medicine 2012, 4.
24 B. Spankuch-Schmitt, A. Bereiter-Hahn, M. Kaufmann, K. Strebhardt, Journal of the National
Cancer Institute 2002, 94, 1863.

Chapter 4 Nanoparticles Mimicking Viral Surface Topography for Enhanced Cellular Delivery
68
Supplementary Information
Material and Methods
4.S1. Synthesis of Samples
Sample 1. Uniform nonporous silica nanoparticles with a smooth surface were synthesized using a
well-known method developed by Stöber et al.18
Typically, 50 mL of ethanol was mixed with 3.8
mL of deionized water and 2 mL of 28% ammonium hydroxide solution (Sigma-Aldrich) at 308 K.
Then, 2.8 mL of 98% tetraethyl orthosilicate (TEOS, Aldrich) was added to the solution under
vigorous stirring. After 6 hours, the as-synthesized nanoparticles were separated by centrifugation,
and washed with ethanol and deionized water. The final product 1 was obtained by drying at 373 K
overnight.
Sample 1-NH2. Amine silane was grafted onto the surface of 1 to create positively charged smooth
silica nanoparticles. First, 0.2 g of sample 1 was suspended in 30 mL toluene. Then, 0.19 mL of (0.8
mmol) of 3-aminopropyltriethoxysilane (APTES, Sigma-Aldrich) was added. The mixture was
refluxed for 20 hours at 383 K.10
Then, 1-NH2 was obtained by centrifugation, washing with ethanol
and deionized water and drying in a vacuum oven at 313 K overnight.
Sample 2. Silica nanoparticles with a small diameter were prepared using a modified Stöber
method.19
First, 87 mg of L-arginine (Sigma-Aldrich) was dissolved in a solution containing 69.5
mL of deionized water and 5.23 mL of 98% octane (Sigma-Aldrich) with stirring overnight at 333
K. Then, 0.5 mL of TEOS was added to the mixture and stirred for a further 5 hours. The solution
containing as-synthesized 3 was used immediately in the synthesis of sample 3 (see below).
Sample 3. As-synthesized 2 (2.7 mL solution) was mixed with 50 mg of 1-NH2 dispersed in 30 mL
of deionized water and stirred for 20 hours at 333 K. The as-synthesized 3 was isolated by
centrifugation at 10000 rpm for 10 min (sample 2 cannot be recovered by centrifugation under these
conditions), followed by drying in a vacuum oven at 313 K overnight. Finally, 3 was obtained by
calcination treatment at 823 K for 5 hours.
Sample 3-NH2. The positively charged 3-NH2 was synthesized by amino-modification of 3, using
the procedure described in the preparation of 1-NH2.
Sample 1-PEI & 3-PEI. In order to achieve endosomal escape for successful gene silencing, 10
kDa polymer of PEI (BioScientific Pty Ltd) was attached to 1 and 3, through a linker of 3-
glycidoxypropyl trimethoxysilane (3-GPS, Sigma-Aldrich).16
First, epoxysilane was connected onto

Chapter 4 Nanoparticles Mimicking Viral Surface Topography for Enhanced Cellular Delivery
69
the surfaces of sample 1 and 3 by suspending 100 mg of solid in 30 mL of toluene and stirring for
15 minutes at 343 K. Then, 1.5 mL of 3-GPS was added into the solution, which was further stirred
for 24 hours at the same temperature. The solid products were centrifuged, washed three times with
toluene and methanol and dried. Solid products (50 mg) were mixed with 250 mg of 10 kDa PEI in
100 mL of carbonate buffer (50 mM, pH 9.5) for 24 hours at 298 K. In this step, PEI is attached to
the nanoparticles via epoxy-groups. The products were washed with 20 mL of 1.0 M NaCl,
followed by three washes with deionized water, and were then recovered by centrifugation. At the
final stage, the solid products were re-suspended in 20 mL of 1.0 M ethanolamine (pH 9) and stirred
at 298 K for 6 hours to block free epoxy groups. The solids were then washed again with 20 mL of
1.0 M NaCl and 20 mL of deionized water.
4.S2. Characterizations
TEM images were taken using a JEOL 1010 microscope operated at 100 kV. The TEM specimens
were dispersed in ethanol, and then transferred to a copper grid. The HRSEM images were obtained
on a JEOL7800F microscope operated at 1 kV with a through-the-lens system and gentle beam
technology.26
T HRSEM sp m ns w r un o t d or o s rv t on. DLS nd ζ pot nt l
measurements were carried out at 298 K using a Zetasizer Nano-ZS from Malvern Instruments. The
samples were dispersed in deionized water by ultrasonication before analysis. ET data was collected
with a FEI Tecnai F30 transmission electron microscope operating at 300 kV. ET specimens were
prepared in the same way of the TEM specimens. All TEM images for ET were recorded at a given
defocus in a bright-field mode to show the thickness contrast. The tomographic tilt series were
obtained by tilting the specimen inside the microscope around a single axis under the electron beam.
TEM images were recorded over a tilt range of +57 to -57° at an increment of 1°. Images of the tilt-
series were aligned with respect to a common origin and rotation axis using the fiducially markers.
Alignment and tomogram generation were performed with IMOD software.20
Nitrogen sorption
isotherms of the samples were obtained at 77 K using a Quantachrome's Quadrasorb SI analyzer.
Before the measurements, the samples were degassed overnight in vacuo. The BET surface area
was calculated using experimental points at a relative pressure of P/P0 = 0.05-0.25. TGA analysis
was conducted using a TGA/DSC 1 Thermogravimetric Analyzer (Mettler-Toledo Inc) at a heating
rate of 2 K/min. X-ray photoelectron spectroscopy (XPS) were recorded on a Kratos Axis Ultra
w t mono rom t Al Kα X-ray source. Each spectrum was recorded at a survey scan from 0 to
1200 eV with a dwell time of 100 ms, and pass energy of 160 eV at steps of 1 eV with 1 sweep. C1s
with a binding energy of 285 eV was used.

Chapter 4 Nanoparticles Mimicking Viral Surface Topography for Enhanced Cellular Delivery
70
4.S3. Estimation of shell / core ratio from ET data
The weight ratio of shell to core particles in 5 can be estimated from the ET data by assuming both
core and shell particles are spheres and that they have the same density. The weight ratio is then the
same as the volume ratio. To calculate the volumes, the diameters of core and shell particles are
measured from ET (Figure 4.2d), giving 168 and 6.45 nm, respectively. The number of shell
particles is measured to 320 from ET. The volume ratio is calculated to be
(320×4/3×3.14×3.2253×10
-21) / (4/3×3.14×83.7
3×10
-21) = 1.83%.
4.S4. Biological experiments
Cell culture: Cell culture reagents were purchased from GIBCO Invitrogen Corporation/Life
Technologies Life Sciences unless otherwise specified. Cell lines used including cervical cancer
cell lines HeLa (ATCC, CCL-2) and osteosarcoma cell line KHOS/NP (CRL-1544) were purchased
from ATCC (American Type Culture Collection). Cells were maintained as monolayer cultures at
310 K and 5% CO2 in Dulbecco's Modified Eagle's Medium (DMEM) supplemented with 10% fetal
bovine serum (FBS) and 1% penicillin-streptomycin. The final concentration is 100 u/mL for
penicillin, 100 u/mL for streptomycin. Twenty-one-nucleotide (oligo) DNA conjugated with
cyanine dye (Cy-3), fetal bovine serum, paraformaldehyde, antifade fluorescent mounting medium
w t 4’-6-diamidino-2-phenylindole (DAPI) and MTT (3-4,5-dimethylthiazol-2-yl-2,5-
diphenyltetrazolium bromide; thiazolyl blue) were purchased from Sigma-Aldrich. A Cell-Titer-Glo
cell viability assay kit was from Promega. The sequences of human PLK1-siRNA (Ambion at
Applied Biosystems, Foster City, California) are PLK1-S: 5’-CCAUUAACGAGCUGCUUAATT-3’
and PLK1-AS: 5’-UUAAGCAGCUCGUUAAUGGTT-3’. T s qu n s o synt t S10-siRNA
(Proligo, Lismore, Australia) are as follows: S10-S, 5’-GCAACAGUUACUGCGACGUUU-3’ nd
S10-AS, 5’-ACGUCGCAGUAACUGUUGCUU- 3’. T Cy3-oligoDNA has the same sequence as
S10-siRNA, except the base of U is replaced with T.
Biomolecule adsorption assay: The adsorption ability of nanoparticles with biomolecules (Cy3-
oligoDNA, PLK1-siRNA and Cytochrome C) was first evaluated. Final results were given as an
v r o tr pl t m sur m nts. For t dsorpt on o n t mol ul s, 4 μl o Cy3-oligoDNA
(100μM) or PLK1-s RNA PBS solut on (100 μM) w r m x d w t 50 μ o 1-NH2/ 3-NH2 or 1-
PEI/ 3-PEI n 30 μl o p osp t u r d s l n (PBS, pH=7.4), r sp t v ly. In dd t on, 1 μl o
Cytochrome C (5 mg/mL), a positively charged protein, was coupled with 50 μ o 1 or 3 in PBS
(25 μl). In ontrol roup, no n nop rt l s w r dd d. T m xtur s w r d sp rs d y vort x n
for 30 seconds and then incubated at 277 K for 4 hours. After this time, the mixtures were

Chapter 4 Nanoparticles Mimicking Viral Surface Topography for Enhanced Cellular Delivery
71
centrifuged at 13000 rpm, and the supernatants were collected for testing. The absorbance of
genetic molecules was determined using a NANODROP 1000 spectrophotometer (Thermo
Scientific), while protein adsorption was tested using a Synergy HT Microplate Reader at 409 nm.
Agarose gel electrophoresis: To examine the holding ability, gel electrophoresis analysis was
performed. For Cy3-oligoDNA, 25 pmol of it was mixed with 50 µg of 1-NH2 or 3-NH2.
Meanwhile, 100, 50 and 25 pmol of PLK1-siRNA were coupled with 50 µg of 1-PEI or 3-PEI,
respectively. For control, 25 pmol of Cy3-oligoDNA or 25 pmol of PLK1-siRNA was prepared in
the absence of nano-carriers. Four hours later, the complexes were loaded into each well of a 2%
agarose gel (UltraPureTM
Agarose, invitrogen), which was then run in Tris-acetate-EDTA (TAE,
UltraPureTM
, invitrogen) buffer containing SYBR® Safe DNA gel Stain (invitrogen) at 80 V for 40
min. Genetic molecule bands were visualized using a GelDoc UV illuminator (Bio-rad
Laboratories). For comparison, software of ImageJ was used to calculate the pixel values of each
genetic molecule band in a fixed area. The genetic molecule amount was estimated after comparing
with the control group.
Cellular delivery assay: HeLa cells were seeded in 6 well-plates at 2×10⁵ cells per well one day
before the assay. Cy3-oligoDNA was used as a model for siRNA, and it was pre-mixed with 1-NH2
and 3-NH2 for 4 hours, followed by incubation with cells for another 4 hours. The final
concentration of nanoparticles is 50 µg/mL and Cy3-oligoDNA is 100 nM. To discriminate between
cell-association and actual internalization, extracellular Cy3-oligoDNA was degraded by addition of
a high concentration DNase I solution. For this treatment, the cells were washed twice with PBS
t n n u t d t 298 K w t 500 μl o tr tm nt solut on, w ont ns 1 mM C Cl2, 0.5 mM
MgCl2, 0.1% (w/v) Bovine serum albumin (BSA, Sigma) and 20 Units of DNase I (Sigma) in PBS.
After 30 minutes, the cells were washed 3 times with PBS and harvested by trypsination. After two
more washes with PBS, the cells were re-susp nd d n 600 μl o 2% p r orm ld yd n PBS
(PFA/PBS) for FACS test using BD LSR-II Analyzer (USA). The results were analysed using
FlowJo software.
Microscopy: For fluorescent imaging, HeLa cells were seeded at 1×10⁵ cells per well in 24 well-
plates one day before the assay. Cy3-oligoDNA alone (100 nM) or the complexes of 50 µg/mL 1-
NH2/ 3-NH2+Cy3 (100 nM), or 1.8 μ o 2-NH2+Cy3 (100 nM) were added to wells containing
serum free medium, and incubated at 310 K for 4 hours. Afterwards, cells were washed twice with
PBS and fixed with 1 mL of 4% PFA/PBS at 277 K for 30 minutes. Subsequently, the cells were
washed again with PBS and t l qu d w s dr n d. A 200 μl port on o nt -fade fluorescent
mounting medium with DAPI was added to stain the nuclei, and the cells were viewed under an

Chapter 4 Nanoparticles Mimicking Viral Surface Topography for Enhanced Cellular Delivery
72
Olympus IX51 fluorescent microscope. High quality fluorescent images were acquired by confocal
laser scanning microscopy (CLSM). After seeding 1×10⁵ HeLa cells onto 24-mm glass coverslips
(PST, Australia) in 6 well-plates, Cy3-oligoDNA-treated (100 nM) and the complexes of 50 µg/mL
1-NH2/ 3-NH2+Cy3 (100 nM)-treated cells were washed with PBS and fixed with 1 mL 4%
PFA/PBS at 277 K for 30 minutes. The liquid was removed and cells were pre-incubated with PBS
containing 1% bovine serum albumin (BSA) for 20–30 minutes prior to adding the staining solution.
T n, 200 μl o st n n solut on ont n n 1% (w/v) BSA nd 5 μl o Hum n CD24 FITC
Conjugate in PBS was added for 2 hours at 298 K. After that, the coverslips were washed three
times with PBS and mounted onto glass slides by fluoroshield with DAPI (Sigma). The slides were
viewed using confocal microscopy (LSM ZEISS 710).
Detection of cellular uptake: To quantitatively compare cellular uptake between smooth and virus-
mimicking silica nanoparticles, 2×10⁵
HeLa or KHOS cells were seeded in 6-well plates one day
or tr ns t on. N nop rt l s (50 μ /mL) alone (sample 1 and 3) or complexes (1-NH2/3-
NH2+Cy3-oligoDNA or 1-PEI/3-PEI+PLK1-siRNA) were incubated with cells under serum free
condition for 4 hours. Afterwards, the cells were washed with PBS three times and harvested with
trypsin. After centrifugation, the cell pellets were washed twice and dried. Cell lysis buffer (Cell
Signaling Technology) was added to allow dissolution of the cells with ultrasound. The
supernatants (containing cell components) were removed by centrifugation at 13,000 rpm for 5
minutes, followed by two washes with PBS. Aqueous NaOH solution (1 M) was then added to
allow dissolution of the nanoparticles with ultrasound. The silicon concentrations in the final
solutions were measured by ICPOES using a Vista-PRO instrument (Varian Inc, Australia), which
were then converted to be silica amount.
MTT assay: The cytotoxicity of nanoparticles was tested in both HeLa and KHOS cell lines. One
day before the test, 5000 cells were seeded in each well of 96-well plates. Nanoparticles (1, 1-NH2,
3, 3-NH2) were dispersed in 2-fold series, from 400 μ /mL to 12.5 μ /mL, in culture medium
supplemented with 10% FBS and 1% penicillin-streptomycin. Because PEI attachment brought
relatively higher toxicity, the concentrations for PEI-modified nanoparticles (1-PEI and 3-PEI) were
determined from 50 to 1.56 μ /mL. After 24 hours incubation at 310 K, the liquid was replaced
with fresh medium and the cells were cultured for another 24 hours. Cell viability was measured by
adding MTT agent and reading the absorbance at 540 nm using a Synergy HT Microplate Reader.
Results were compared to cells not exposed to nanoparticles.
Gene silencing assay: Osteosarcoma KHOS cells were seeded in 96-well plates at 5000 cells/well
one day before transfection. PLK1-siRNA or S10-siRNA was pre-mixed with either 1-NH2/3-NH2

Chapter 4 Nanoparticles Mimicking Viral Surface Topography for Enhanced Cellular Delivery
73
(50 µg/mL) or 1-PEI/3-PEI (20 µg/mL) in PBS at 277 K for 4 hours. Then, nanoparticle-siRNA
(12.5, 25 or 50 nM) complexes were incubated with cells. After 24-hour incubation, the transfection
medium was replaced with fresh medium, followed by another 24 hours culture. The cell
proliferation was determined using Cell-Titer-Glo assay. The positive controls comprised cells
treated with PBS alone. Both S10-siRNA and PLK1-siRNA (50 nM) were also delivered using a
commercial transfect reagent, OligofectamineTM
, as a separate control.

Chapter 4 Nanoparticles Mimicking Viral Surface Topography for Enhanced Cellular Delivery
74
Supplementary Figures and Tables
Figure 4.S1 TEM images of all samples and size distribution. a, e) sample 1 & 3. b, f) 1-NH2 & 3-
NH2. c, g) 1-PEI & 3-PEI. d) sample 2 (shell particle). h) size distribution curves obtained by the
dynamic light scattering (DLS) method.
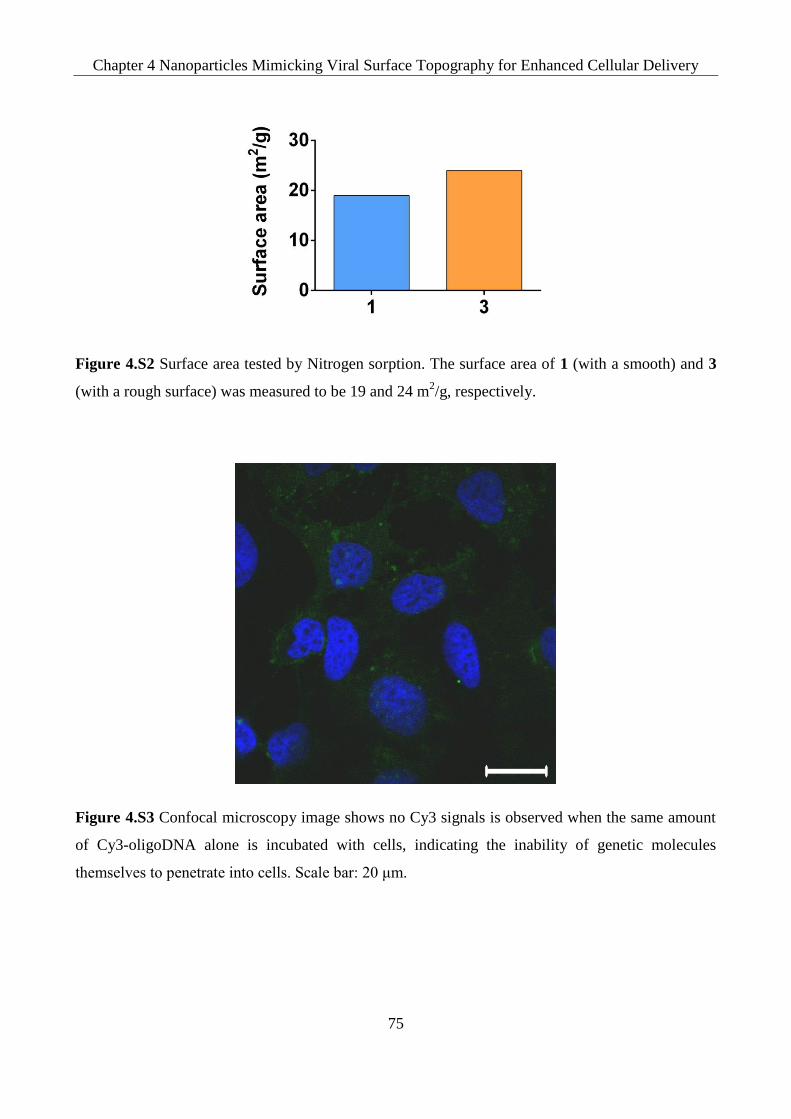
Chapter 4 Nanoparticles Mimicking Viral Surface Topography for Enhanced Cellular Delivery
75
Figure 4.S2 Surface area tested by Nitrogen sorption. The surface area of 1 (with a smooth) and 3
(with a rough surface) was measured to be 19 and 24 m2/g, respectively.
Figure 4.S3 Confocal microscopy image shows no Cy3 signals is observed when the same amount
of Cy3-oligoDNA alone is incubated with cells, indicating the inability of genetic molecules
t ms lv s to p n tr t nto lls. S l r: 20 μm.

Chapter 4 Nanoparticles Mimicking Viral Surface Topography for Enhanced Cellular Delivery
76
Figure 4.S4 FACS analysis showing the peak shifts in the MFI from HeLa cells incubated with the
complexes of 1-NH2 (blue colour)/ 3-NH2 (yellow colour) +Cy3-oligoDNA. The Cy3-oligoDNA in
the absence of nano-carriers (red colour) is used as a control.

Chapter 4 Nanoparticles Mimicking Viral Surface Topography for Enhanced Cellular Delivery
77
Figure 4.S5 Comparison of cellular delivery of cargos among different nanoparticles. a, b, c) Very
weak signals were observed in the groups of naked Cy3-oligoDNA, Cy3-oligoDNA coupled with d,
e, f) 2-NH2 (0.9 µg/mL, dosage calculated from ET results) and g, h & i) 1-NH2. j, k & l) Only 3-
NH2 induced evident Cy3 signals across all groups.

Chapter 4 Nanoparticles Mimicking Viral Surface Topography for Enhanced Cellular Delivery
78
Figure 4.S6 Agarose gel analysis. a) The complex of amino-modified nanocarriers with Cy3-
oligoDNA. Lane 0: 25 pmol Cy3-oligoDNA only. Lane 1: 25 pmol Cy3-oligoDNA coupled with 50
µg of 1-NH2. Lane 2: 25 pmol Cy3-oligoDNA coupled with 50 µg of 3-NH2. In the case of 1-NH2, a
small amount of released Cy3-oligoDNA was observed. For 3-NH2, nearly no release could be seen
by naked eyes. b, c) the complexes of PEI-modified nano-carriers with PLK1-siRNA. Lane 0: 25
pmol PLK1-siRNA only. Lane 1, 2, 3: 100, 50 and 25 pmol PLK1-siRNA are coupled with 50 µg
of 1-PEI and 3-PEI, respectively. In each lane from 1 to 3, the PLK1-siRNA release was evident in
the case of 1-NH2, compared to that of 3-NH2.
Figure 4.S7 Investigation of pure silica nano-carriers in adsorption and cellular uptake. a)
Cytochrome C adsorption. The adsorption amount is 2.71 nmol/mg on 3, and 0.88 nmol/mg on 1. b)
cellular uptake into KHOS cells. 128 pg/cell was internalized for 3, while 62 pg/cell for 1. c)
cellular uptake into HeLa cells. 242 pg/cell was internalized for 3, while 187 pg/cell for 1. Data
represent mean ± s.e.m of three independent experiments. *p<0.05, ***p<0.001,****p<0.0001 (t-
test).

Chapter 4 Nanoparticles Mimicking Viral Surface Topography for Enhanced Cellular Delivery
79
Figure 4.S8 Cytotoxicity of nanoparticles. a, b) sample 1 & 3 in HeLa (left) and KHOS (right) cells.
c, d) 1-NH2 & 3-NH2 in HeLa (left) and KHOS (right) cells. e) 1-PEI & 3-PEI in KHOS cells. Pure
and amino-modified silica nanoparticles have relatively mild cytotoxicity to both HeLa and KHOS
cells, and the ones with rough surface are more toxic due to the improved cellular uptake. However,
the attachment of PEI caused a high toxicity to cells, so that the concentrations of 1-PEI & 3-PEI
will be decreased to 20 µg/mL in gene silencing experiment. Data represent mean ± s.e.m of three
independent experiments.

Chapter 4 Nanoparticles Mimicking Viral Surface Topography for Enhanced Cellular Delivery
80
Figure 4.S9 Gene delivery performance of virus-mimicking nanoparticles in KHOS cells using
amino-modified nanoparticles. Neither PLK1-siRNA nor S10-siRNA delivered by 1-NH2 and 3-
NH2 induced the decrease of cell viability by gene silencing effect. In the bar chart, data represent
mean ± s.e.m of three independent experiments, and were analyzed using t-test.
Figure 4.S10 TGA of PEI-conjugation. In both a) 1–PEI and b) 3-PEI, the TGA curves of (i)
represent pure silica nanoparticles, (ii) show epoxy-group modified nanoparticles, (iii) are the PEI-
conjugated separately.

Chapter 4 Nanoparticles Mimicking Viral Surface Topography for Enhanced Cellular Delivery
81
Figure 4.S11 Morphology adjustment of virus-mimicking nanoparticles. After fabricating the virus-
mimicking nanoparticles by mixing shell particles with core particles, morphology changes were
traced by TEM images. On adjusting the feed volumes of shell particle solutions from a) 0.68 mL to
b) 1.35 mL, to 2.70 mL (Figure 4.S1e), to c) 5.40 mL and finally to d) 6.75 mL, the surface
morphologies changed significantly, with the best sample being obtained when the feed volume was
2.70 mL. It is noted that a failure to obtain optimized virus-mimicking morphologies can be
attributed to either insufficient or excessive feed amount of shell particles, where only a proper feed
amount will lead to successful synthesis. Scale bar: 100 nm.

Chapter 4 Nanoparticles Mimicking Viral Surface Topography for Enhanced Cellular Delivery
82
Figure 4.S12 The influence of calcination treatment. TEM image a) shows that without calcination,
shell particles peeled off on ultrasonication. In contrast, b) shows that the calcined sample 3
maintained its morphology after ultrasonication. Scale bar: 100 nm.
Table 4.S1 | Physicochemical Properties of nanoparticles
Sample
ID
Average Particle size (nm) PDI
ζ pot nt l
(mV) TEMa DLS
1 209 ± 20 249 0.006 -24
1-NH2 211 ± 19 291 0.120 +53
1-PEI 220 ± 13 472 0.403 +47
2 13 ± 2 15 0.105 -42
3 226 ± 18 279 0.135 -36
3-NH2 224 ± 16 298 0.159 +54
3-PEI 226 ± 16 473 0.437 +43
a The particle sizes are obtained by measuring 100 particles from TEM images and shown in
mean±SD.

Chapter 4 Nanoparticles Mimicking Viral Surface Topography for Enhanced Cellular Delivery
83
Table 4.S2 | Atomic composition (%) of nanoparticles
Sample C Si O N
1 2.61 29.74 67.64 --
1-NH2 24.72 21.24 49.41 4.63
1-PEI 37.86 16.79 37.42 7.92
3 1.65 30.92 67.43 --
3-NH2 23.46 22.38 49.69 4.47
3-PEI 36.89 17.49 38.11 7.51
Uncalcined-2 4.22 29.11 66.67 --
Calcined-2 0.84 29.83 69.33 --
Table 4.S3 | Characterization of PEI-modification by TGA
1-PEI 3-PEI
Weight loss % 1 1-epoxy 1-PEI 3 3-epoxy 3-PEI
1.75 3.17 0.44 2.78 3.24 0.32
References
1 J. W. Yoo, D. J. Irvine, D. E. Discher, S. Mitragotri, Nature Reviews Drug Discovery, 2011, 10,
521-535; R. A. Morgan, M. E. Dudley, J. R. Wunderlich, M. S. Hughes, J. C. Yang, R. M. Sherry,
R. E. Royal, S. L. Topalian, U. S. Kammula, N. P. Restifo, Z. L. Zheng, A. Nahvi, C. R. de Vries, L.
J. Rogers-Freezer, S. A. Mavroukakis, S. A. Rosenberg, Science, 2006, 314, 126-129; A. M. Chen,
M. Zhang, D. G. Wei, D. Stueber, O. Taratula, T. Minko, H. X. He, Small, 2009, 5, 2673-2677; I. L.
Medintz, H. T. Uyeda, E. R. Goldman, H. Mattoussi, Nat. Mater., 2005, 4, 435-446.
2 Y. Niu, A. Popat, M. Yu, S. Karmakar, W. Gu, C. Yu, Ther. Delivery, 2012, 3, 1217-1237.
3 D. S. Dimitrov, Nat. Rev. Microbiol., 2004, 2, 109-122.
4 Q. L. Lu, G. Bou-Gharios, T. A. Partridge, Gene. Ther., 2003, 10, 131-142.
5 C. E. Thomas, A. Ehrhardt, M. A. Kay, Nat. Rev. Genet., 2003, 4, 346-358.
6 D. A. Jackson, S. Juranek, H. J. Lipps, Mol. Ther., 2006, 14, 613-626.

Chapter 4 Nanoparticles Mimicking Viral Surface Topography for Enhanced Cellular Delivery
84
7 J. Mercer, M. Schelhaas, A. Helenius, Annu. Rev. Biochem., 2010, 79, 803-833.
8 A. Harris, G. Cardone, D. C. Winkler, J. B. Heymann, M. Brecher, J. M. White, A. C. Steven,
Proc. Natl. Acad. Sci. U. S. A. 2006, 103, 19123-19127.
9 M. Soliman, R. Nasanit, S. R. Abulateefeh, S. Allen, M. C. Davies, S. S. Briggs, L. W. Seymour,
J. A. Preece, A. M. Grabowska, S. A. Watson, C. Alexander, Mol. Pharmaceutics 2012, 9, 1-13.
10 P. Shah, N. Sridevi, A. Prabhune, V. Ramaswamy, Microporous Mesoporous Mater., 2008, 116,
157-165.
11 K. Grunewald, P. Desai, D. C. Winkler, J. B. Heymann, D. M. Belnap, W. Baumeister, A. C.
Steven, Science, 2003, 302, 1396-1398.
12 P. Zhu, J. Liu, J. Bess, E. Chertova, J. D. Lifson, H. Grise, G. A. Ofek, K. A. Taylor, K. H. Roux,
Nature, 2006, 441, 847-852.
13 K. Rechendorff, M. B. Hovgaard, M. Foss, V. P. Zhdanov, F. Besenbacher, Langmuir, 2006, 22,
10885-10888.
14 P. E. Scopelliti, A. Borgonovo, M. Indrieri, L. Giorgetti, G. Bongiorno, R. Carbone, A. Podesta,
P. Milani, Plos One 2010, 5.
15 M. Massignani, C. LoPresti, A. Blanazs, J. Madsen, S. P. Armes, A. L. Lewis, G. Battaglia,
Small 2009, 5, 2424-2432; C. LoPresti, M. Massignani, C. Fernyhough, A. Blanazs, A. J. Ryan, J.
Madsen, N. J. Warren, S. P. Armes, A. L. Lewis, S. Chirasatitsin, A. J. Engler, G. Battaglia, ACS
Nano, 2011, 5, 1775-1784.
16 S. B. Hartono, W. Y. Gu, F. Kleitz, J. Liu, L. Z. He, A. P. J. Middelberg, C. Z. Yu, G. Q. Lu, S.
Z. Qiao, ACS Nano, 2012, 6, 2104-2117.
17 T. A. Xia, M. Kovochich, M. Liong, H. Meng, S. Kabehie, S. George, J. I. Zink, A. E. Nel, ACS
Nano, 2009, 3, 3273-3286.
18 W. Stöber, A. Fink, E. Bohn, J. Colloid Interface Sci., 1968, 26, 62-69.
19 T. Yokoi, Y. Sakamoto, O. Terasaki, Y. Kubota, T. Okubo, T. Tatsumi, J. Am. Chem. Soc., 2006,
128, 13664-13665.
20 P. Yuan, J. Sun, H. Xu, L. Zhou, J. Liu, D. Zhang, Y. Wang, K. S. Jack, J. Drennan, D. Zhao, G.
Lu, X. Zou, J. Zou, C. Yu, Chem. Mater., 2010, 23, 229-238; P. Yuan, N. Liu, L. Zhao, X. Zhou, L.
Zhou, G. J. Auchterlonie, X. Yao, J. Drennan, G. Q. Lu, J. Zou, C. Yu, Angew. Chem., Int. Ed.,
2008, 47, 6670-6673.
21 W. J. Stark, Angew. Chem. Int. Edit., 2011, 50, 1242-1258.
22 L. K. Limbach, Y. C. Li, R. N. Grass, T. J. Brunner, M. A. Hintermann, M. Muller, D. Gunther,
W. J. Stark, Environ. Sci. Technol., 2005, 39, 9370-9376.
23 A. Vinu, V. Murugesan, O. Tangermann, M. Hartmann, Chem. Mater., 2004, 16, 3056-3065.

Chapter 4 Nanoparticles Mimicking Viral Surface Topography for Enhanced Cellular Delivery
85
24 Y. D. Yao, T. M. Sun, S. Y. Huang, S. Dou, L. Lin, J. N. Chen, J. B. Ruan, C. Q. Mao, F. Y. Yu,
M. S. Zeng, J. Y. Zang, Q. Liu, F. X. Su, P. Zhang, J. Lieberman, J. Wang, E. W. Song, Sci. Transl.
Med., 2012, 4.
25 B. Spankuch-Schmitt, A. Bereiter-Hahn, M. Kaufmann, K. Strebhardt, J. Natl. Cancer Inst.,
2002, 94, 1863-1877.
26 S. Asahina, S. Uno, M. Suga, S. M. Stevens, M. Klingstedt, Y. Okano, M. Kudo, F. Schuth, M.
W. Anderson, T. Adschiri, O. Terasaki, Microporous Mesoporous Mat., 2011, 146, 11-17.

Chapter 5 Synthesis of Silica Nanoparticles with Controllable Surface Roughness for Therapeutic
Protein Delivery
86
Chapter 5
Synthesis of Silica Nanoparticles with
Controllable Surface Roughness for
Therapeutic Protein Delivery
This chapter reports a novel "neck-enhancing" approach to synthesize silica nanoparticles with
controllable surface roughness. By roughening the surface of solid silica core particles (~211 nm)
with smaller shell particles having various sizes, a series of rough silica nanoparticles (RSNs) are
obtained, where the shell and core particles are stably connected by bigger "necks", compared to our
previous method. The surface roughness is correlated to the core-to-shell size ratio (from 16.2:1 to
2.2:1), and the interspacing distance between neighboring shell particles increases from 7 to 38 nm
with the increased shell particle sizes from 13 to 98 nm. Protein loading capacity of RSNs is
dependent on the protein size relative to the interspacing distance. The optimal interspacing distance
of RSNs for high protein loading capacity is 7, 21 and 38 nm for cytochrome c (~3nm), IgG-
fragment (IgG-F, ~10nm) and non-specific rabbit IgG antibody (IgG-A, ~20nm), respectively.
Using surface plasmon resonance (SPR), it is demonstrated that the IgG-F maintained efficient
binding function after loading on RSNs. After hydrophobic modification of octadecyl-groups (C18),
C18-RSN with the interspacing distance of 38 nm shows effective intracellular delivery of anti-
pAkt antibody in breast cancer MCF-7 cells, leading to significant cell growth inhibition by
blocking pAkt and downstream anti-apoptotic protein of Bcl-2. This work has been accepted for
publication by Journal of Materials Chemistry B (2015, full paper).

Chapter 5 Synthesis of Silica Nanoparticles with Controllable Surface Roughness for Therapeutic
Protein Delivery
87
5.1 Introduction
Protein therapeutics has attracted increasing attention in cancer therapy due to the high
specificity and less interference with normal biological processes.1 By introducing proteins
that specifically recognize and influence target molecules, deactivation or activation of key
signalling pathways within cells can be manipulated, which strongly affect cell functions.2
However, proteins are poorly delivered into cells owing to poor stability and inability to
cross cell membranes.3 It remains an on-going challenge to develop delivery systems to
efficiently compact and deliver therapeutic proteins for enhanced cancer therapy.4
In the past decade, various nano-carriers have been generated to deliver therapeutic proteins
into cells, including liposomes,5-7
polymers,8-11
inorganic nanoparticles12-14
and protein-based
carriers.15
Among them, silica-based nanomaterials are a promising delivery platform for
protein therapeutics. Bale et al.16
reported a successful delivery of the antibody to phospho-
Akt (anti-pAkt) into MCF-7 cells with a significant cell growth inhibition where anti-pAkt
antibody was absorbed on the surface of solid silica nanoparticles modified by n-
octadecyltrimethoxy silane (n-ODMS) . A recent study has demonstrated that there was an
optimized pore size in the shell of silica hollow spheres for high loading and improved
intracellular delivery of a therapeutic protein, Ribonuclease A.17
The size of protein
molecules may vary from several nanometres (e.g. cytochrome c18
) to dozens of nanometres
(e.g. IgG antibodies19
). Therefore, it is highly desired to fabricate silica nanoparticles with
adjustable voids to optimize the loading/release ability toward therapeutic proteins having
various sizes.
Besides the interaction with cargo molecules, efficient cellular uptake performance of silica
nanoparticles is a prerequisite factor for successful cellular delivery. Recently, silica
nanoparticles mimicking the surface topography of enveloped viruses20
were prepared by
attaching shell particles with a smaller size onto core particles with a larger size.21
The
interspaces between neighbouring shell particles provide the void space for the entrapment
of biomolecules (e.g. siRNA). Compared to nanoparticles with smooth surfaces, silica
nanoparticles with rough surfaces exhibited higher loading, sustained release and enhanced
cellular uptake performance, consequently delivering siRNA successfully into cells.
However, systematic control over core-to-shell size ratios of silica nanoparticles and their
protein delivery efficacy has not been reported. If the surface roughness is adjustable on a

Chapter 5 Synthesis of Silica Nanoparticles with Controllable Surface Roughness for Therapeutic
Protein Delivery
88
nanoparticle, nano-carriers with advantages of both rough surface and controllable void
space would be crucial for exploring the impact of interspacing distance on protein delivery
efficiency. For silica nano-carriers with rough surface, it is also important to investigate the
bioactivity of proteins, for example, the binding activity of antibody, after loading into void
space. Answers to these questions will provide fundamental knowledge to the rational
design of silica nano-carriers for therapeutic protein delivery.
Various approaches have been developed to fabricate rough nanoparticles by attaching small
shell particles on a large core, including the electrostatic interaction22, 23
and covalent
bonding pathways.24
However, the synthesis of inorganic and/or organic rough nanoparticles
with uniform sizes generally have larger particle sizes ( 400 nm), which is not ideal for
cellular delivery.25, 26
Although rough nanoparticles with particle size of 300 nm can be
synthesized,27-29
the surface morphologies are not uniform. More importantly, in all previous
literature reports, the core-to-shell size ratio is larger than 5.6:1. Therefore, it is a challenge
to attach shell particles with relatively large sizes onto core particles.
Herein we report a novel "neck-enhancing" approach to synthesize silica nanoparticles with
controlled surface roughness. By roughening the surface of solid silica core particles (211
nm in diameter) with smaller shell particles (Figure 5.1a) having various sizes, a series of
rough silica nanoparticles (RSNs) are obtained. By forming a big "neck", shell particles with
large sizes can be stably connected to the core particles. The surface roughness is correlated
to the core-to-shell size ratios (from 16.2:1 to 2.2:1), and the interspacing distance between
neighbouring shell particles increases from 7 to 38 nm w t n r s n s ll p rt l s z s
rom 13 to 98 nm. T prot n lo d n p ty o RSNs s d p nd nt on t prot n s z
relative to the interspacing distance. The optimal interspacing distance of RSNs for high
protein loading capacity is 7, 21 and 38 nm for cytochrome c (M.W. 12 kDa), IgG-
fragment (IgG-F, domain antibody, M.W.76 kDa) and non-specific rabbit IgG antibody
(IgG-A, M.W. 150 kDa), respectively. Using surface plasmon resonance (SPR), it is
demonstrated that the IgG-F maintains efficient binding function after loading on RSNs. As
shown in Figure 5.1c, after hydrophobic modification of octadecyl-groups (C18), the C18-
RSN with the interspacing distance o 38 nm s ows t v ntr llul r d l v ry of anti-
pAkt antibody (having a similar structure and animal source with non-specific rabbit IgG-A)
in human breast cancer (MCF-7) cells, leading to significant cell growth inhibition by
blocking pAkt and the downstream anti-apoptotic protein of Bcl-2.

Chapter 5 Synthesis of Silica Nanoparticles with Controllable Surface Roughness for Therapeutic
Protein Delivery
89
Figure 5.1 Schematic illustrations of the synthesis of RSNs using a "neck-enhancing" approach (a)
and a conventional interaction approach (b). Scheme c shows the cellular delivery of therapeutic
anti-pAkt antibody using C18-RSNs and the cell growth inhibition mechanism.
5.2 Experimental section
5.2.1 Materials
Ammonium hydroxide solution (28%), L-arginine, octane (98%), 3-
aminopropyltriethoxysilane (APTES), cytochrome c (95%, from bovine heart), fetal bovine
serum (FBS) and trypan blue solution (0.4%) were purchased from Sigma-Aldrich.
Tetraethyl orthosilicate (TEOS, 98%) and n-octadecyl-trimethoxy silane (n-ODMS, 90%)
were purchased from Aldrich. Toluene was purchase from Merck. Dulbecco's Modified
Eagle Medium (DMEM), penicillin-streptomycin (10000 U mL-1
) and trypsin-EDTA
(0.25%) were purchased from GIBCO or Invitrogen, Life Sciences, Life Technologies. The
monoclonal antibodies (rabbit source) to Bcl-2 and GAPDH and HRP-linked anti-rabbit IgG
antibody were purchased from Cell Signalling. MCF-7 (HTB-22™) ll l n w s pur s d
from American Type Culture Collection (ATCC). IgG-F for adsorption and SPR
m sur m nt w s k ndly prov d d rom P t r P Gr y’s roup. All m als were used
without further purifications.
5.2.2 Synthesis of different nanoparticles
Synthesis of core particle
Uniform nonporous silica core particles were synthesized using a well-known method
developed by Stöber et al.30
Typically, absolute ethanol (50 mL) was mixed with deionized
(DI) water (3.8 mL) and ammonium hydroxide solution (2 mL) at 25 °C. Then, TEOS (3
Chapter 5 Synthesis of Silica Nanoparticles with Controllable Surface Roughness for Therapeutic
Protein Delivery
90
mL) was added to the solution under vigorous stirring. After 6 h, the as-synthesized
nanoparticles were separated by centrifugation at 20000 rpm, and washed with ethanol. The
final product was obtained by drying at 100 °C overnight. After that, amine-silane was
grafted to create positively charged surface. First, dried samples (200 mg) were suspended in
toluene (30 mL) and APTES (0.19 mL, 0.8 mmol) was added. The mixture was refluxed for
20 h at 110 °C.31
Then, amino-modified nanoparticles were obtained by centrifugation at
20000 rpm, washing with ethanol and drying in fume cupboard at 25 °C overnight.
Synthesis of shell particles
Shell nanoparticles with the mean sizes of 28, 54, 98, 135 and 175 nm were also fabricated
using Stöber method with the same recipe as the core particle, except for reacting at 70, 60,
50, 40 and 30 °C, respectively. The reactions were first carried out for 20 minutes for the
formation of shell particles (28, 54, 98 and 135 nm). For the shell particle of 175 nm, the
reaction time is 2 h. In addition, a modified Stöber method was used to fabricate the shell
particle of 13 nm diameter.32
First, L-arginine (87 mg) was dissolved in deionized water
(69.5 mL) containing octane (5.23 mL). Then, the mixture was sonicated and TEOS (0.5
mL) was added to react at 60 °C for 3.5 h for the formation of shell particles.
Synthesis of RSNs with varied shell sizes
The amino-modified core particle (200 mg) was suspended (2 mL) in DI water (for the
synthesis of RSN-211@13) or ethanol (for the synthesis of other RSNs). The core particle
suspensions were added into different shell particle reaction solutions as described above
(including 69.5 mL of DI water, 87 mg of L-arginine, 5.23 mL of octane and 0.5 mL of
TEOS for the synthesis of RSN-211@13; 50 mL of absolute ethanol, 3.8 mL of DI water, 2
mL of ammonium hydroxide solution and 3mL of TEOS for the synthesis of other RSNs),
reacting for another 2 h at the original temperatures for shell particle synthesis. The as-
synthesized RSNs were washed three times with ethanol and isolated by centrifugation at
4750 rpm for 10 min (shell particles cannot be recovered by centrifugation under these
conditions), followed by drying in a fume cupboard at 25 °C overnight. Finally, RSNs were
obtained after calcination treatment at 550 °C for 5 h to remove organic components in silica
frameworks, enabling all RSNs to have a similar surface composition (amorphous silicon
oxide) and surface property (zeta potential).

Chapter 5 Synthesis of Silica Nanoparticles with Controllable Surface Roughness for Therapeutic
Protein Delivery
91
Hydrophobic modification to RSNs
RSNs were functionalized with n-ODMS. Different RSNs (200 mg) were suspended in
toluene (25 mL) containing 0.5% (v/v) n-ODMS. Then, the mixture was refluxed for 20 h at
110 °C, followed by centrifugation at 10000 rpm, washing with ethanol and drying in a fume
cupboard at 25 °C overnight.
5.2.3 Characterizations
Transmission electron microscopy (TEM) images were taken using a JEOL 1010
microscope operated at 100 kV. The TEM specimens were dispersed in ethanol, and then
transferred to a copper grid. The high resolution scanning electron microscopy (HRSEM)
images were obtained on a JEOL JSM 7800 FE-SEM equipped with an in-column upper
electron detector (UED) and gentle beam technology. HRSEM was operated at a low
accelerating voltage of 0.8-1.5 kV with 20% specimen bias.33
For FE-SEM measurements,
the samples were prepared by dispersing the powder samples in DI water, after which they
were dropped to the aluminium foil pieces and attached to conductive carbon film on SEM
mounts. The SEM mounts were dried in a vacuum oven at 70 °C for at least 8 hours before
observations. Dynamic light scattering (DLS) and zeta potential (ZP) measurements were
carried out at 25 °C using a Zetasizer Nano-ZS from Malvern Instruments. The samples
were dispersed in DI water or ethanol by ultra-sonication before analysis. Nitrogen sorption
isotherms of the samples were obtained at -196 °C using a Micrometrics Tristar II system.
Before the measurements, the samples were degassed at 180 °C overnight in vacuum. The
Brunauer–Emmett–Teller specific surface area (SBET) was calculated using experimental
points at a relative pressure of P/P0 = 0.05-0.25. Fourier transform infrared (FTIR) spectra of
rough silica nanoparticles before and after hydrophobic modification were collected using
t T rmo S nt ™ N ol t™ 6700 FT-IR spectrometers. Each spectrum was obtained
using dried powder against a background measured under the same condition. Atomic force
microscopy (AFM) measurement was conducted, where IgG-F was mixed with RSN-
211@54 (500 µg) in PBS pH 7.4 for 2 h at 4 °C, at a protein concentration of 1 mg mL-1
.
After incubation, the samples were washed with DI water to remove free and loosely
attached proteins and salts in solution by centrifugation and pipetting. Then, the suspension
(10 µL) was placed onto silicon wafers. The wafer was evaporated at 25 °C before AFM
observation. RSN-211@54 without protein incubation was used as a control. A Cypher S
AFM (Asylum Research, an Oxford Instruments company) was used for all the
measurements. The images were obtained by employing the tapping mode of the AFM in air

Chapter 5 Synthesis of Silica Nanoparticles with Controllable Surface Roughness for Therapeutic
Protein Delivery
92
by using Al- o t d s l on pro w t t p r d us o 2 nm (NANOSENSORS™, Sw tz rl nd).
The interaction between IgG-F and complementary antigen was monitored utilizing a SPR-
based biosensor (BiacoreTM
T200, GE Healthcare). IgG-F was incubated with RSNs (500
µg) in PBS pH 7.4 for 2 h at 4 °C, and the final protein concentration was 1 mg mL-1
.
Following that, IgG-F-RSNs complexes were washed several times until the supernatant
showed the same UV-vis absorbance at 280 nm as PBS only. Then, IgG-F-RSNs complexes
were suspended in HBS-EP buffer (BiacoreTM
T200, GE Healthcare). Biotinylated peptide
was immobilized via streptavidin capture on a sensor chip CAP (GE Healthcare) pre-
immobilized with ssDNA-streptavidin (Biotin CAPture kit, GE Healthcare) to yield the
peptide surface densities in the range of 2500-5000 R.U. A reference flow cell was
generated by omitting only ssDNA-streptavidin onto the chip surface. Interaction analyses
were performed by injecting IgG-F-RSNs complexes over the reference and peptide surfaces
in series for 120 seconds at a flow-r t o 10μl m n-1
. Complex dissociation was monitored
for 120 seconds. The binding intensity was determined at the peak point 128 seconds after
sample injection. Surface regeneration was performed at the end of each analysis cycle by
injecting guanidine (8 M) mixed with NaOH (1 M) at the ratio of 3:1, followed by washing
with the mixture of acetonitrile (30%), NaOH (0.25 M) and SDS (0.05%).
5.2.4 Biological experiments
Protein adsorption assay
The adsorption ability of RSNs with different proteins (cytochrome c, IgG-F and IgG-A)
was evaluated. Different proteins were mixed with RSNs (100 µg) in PBS pH 7.4 for 2 h at
4 °C, and final protein concentration is 1 mg mL-1
. IgG-A was also incubated with C18-
RSNs. After this time, the mixtures were centrifuged at 15000 rpm, and the supernatants
were collected for testing. The adsorption of protein molecules was determined using a
NANODROP 1000 spectrophotometer (Thermo Scientific) at 280 nm.
Protein therapeutics assay
Cells were maintained as monolayer cultures at 37 °C and 5% CO2 in DMEM supplemented
with 10% FBS and 1% penicillin-streptomycin. MCF-7 cells were seeded in 24 well-plates
at 5×10⁴ cells per well and incubated for 4~6 h. The dose-dependent cytotoxicity of C18-
RSN-211@98+anti-pAkt composite was tested. The anti-pAkt antibody (1 mg mL-1
, sigma)
was incubated with C18-RSN-211@98 in PBS pH 7.4 at 4 °C for 2 h. Following this,
protein-nanoparticle complexes were suspended in serum containing culture medium in two-

Chapter 5 Synthesis of Silica Nanoparticles with Controllable Surface Roughness for Therapeutic
Protein Delivery
93
old d lut ons. T st n nop rt l on ntr t on s 50 μ mL-1
, corresponding to 1 µg
mL-1
of anti-pAkt antibody on the surface of the nanoparticle. Non-specific rabbit IgG-A
and nanoparticle only were used as control. After incubation for 24 h, cells were detached by
incubating with trypsin/EDTA mixture. Detached cells were then suspended in the medium
previously collected from the sample. Cell suspension was diluted with trypan blue solution
in a 1:1 ratio, and live and dead cells were counted on a hemacytometer.
The comparison of protein therapeutics among all the C18-RSNs was also evaluated. The
same amount of C18-RSNs (50 μ ) w s m x d w t nt -pAkt nt ody (1 μ ) n PBS pH
7.4 at 4 °C for 2 h and the complexes were incubated with MCF-7 cells in serum containing
culture medium for 24 h at the nanoparticle concentration of 15 µg mL-1
. Non-specific rabbit
IgG-A and C18-RSNs only were used as control. The cell viability was also determined by
counting live and dead cells.
Detection of cellular uptake performance of C18-RSNs
To quantitatively compare cellular uptake performance of C18-RSNs, 3×10⁵ MCF-7 cells
were seeded in 6-well plates one day before transfection. C18-RSNs (50 μ mL-1
) were
incubated with cells under serum free condition for 4 h. Afterwards, the cells were washed
with PBS three times and harvested with trypsin. Cell number for each sample was recorded.
After centrifugation, the cell pellets were washed twice and dried. DI water was added to
allow dissolution of the cells under ultra-sonication condition. The supernatants (containing
cell components) were removed by centrifugation at 15000 rpm for 5 min. Aqueous NaOH
solution (1 M) was then added to allow dissolution of silica nanoparticles with ultrasound.
The silicon concentrations in the final solutions were measured by inductively coupled
plasma optical emission spectrometry (ICPOES) using a Vista-PRO instrument (Varian Inc,
Australia), which were then converted to be the mass of silica per cell.
Western-blot analysis
MCF-7 cells were seeded in 6-well plates at a seeding density of 3×10⁵ cells per well. The
anti-pAkt antibody and the non-specific IgG-A were incubated with C18-RSN-211@98 in
PBS pH 7.4 at 4 °C for 2 h. Then, protein-nanoparticle complexes, along with C18-RSN-
211@98 only group, were mixed with serum containing culture medium and incubated with
lls or 24 . T n l on ntr t on o n nop rt l s s 50 μ mL-1
and protein is 1 µg mL-
1. At the end of incubation, cells were washed with PBS and lysed. The solutions containing
cell lysates were denatured at 95 °C for 15 min followed by characterization by SDS-PAGE.

Chapter 5 Synthesis of Silica Nanoparticles with Controllable Surface Roughness for Therapeutic
Protein Delivery
94
The protein bands were transferred to a PVDF membrane. Bcl-2 bands were targeted using
Bcl-2 monoclonal antibody (mAb) as the primary antibody, and HRP-linked anti-rabbit IgG
antibody as the secondary antibody. GAPDH mAb was used as an internal reference. Bands
were visualized on a ChemiDoc MP System (Bio-Rad).
5.3 Results and Discussion
Preparation of RSNs
Three relatively large silica shell particles (28±3 nm, Figure 5.S1b, ZP -42±8.3 mV; 54±5
nm, Figure 5.S1c, ZP -53±2.6 mV; 98±7 nm, Figure 5.S1d, ZP -53±1.0 mV) were prepared
by the classical Stöber method.30
The smallest silica shell particle (13±2 nm, Figure 5.S1a,
ZP -42±2.4 mV) was synthesized by a modified Stöber method.32
The silica core particle
(diameter of 211±11 nm, Figure 5.S1g, ZP +31±0.2 mV) was also fabricated using the
classical Stöber method, followed by amino-modification to generate positive charges on the
surface. The particle size distribution curves measured by the DLS method are narrow for all
silica particles (Figure 5.S1h), indicating that the nanoparticles are monodispersed in size
(see Table 5.S1 for the polydispersity index, PDI).
To fabricate RSNs with varied shell sizes, the core particles were suspended and added into
the reaction solution of different shell particles. After reaction for 2 h and washing, the final
calcined samples were denoted as RSN-211@13, RSN-211@28, RSN-211@54 and RSN-
211@98, possessing ZP values of -30, -26, -29 and -29 mV, respectively. The numbers
before and after @ refer to the mean size of core particle and shell particles measured from
TEM images (Figure 5.S1). The core-to-shell size is 16.2:1, 7.5:1, 3.9:1 and 2.2:1,
respectively.
TEM images of four RSNs are shown in Figure 5.1. The particle size of RSN-211@13,
RSN-211@28, RSN-211@54 and RSN-211@98 is 254±26, 270±15, 297±20 and 380±39
nm, respectively (Figure 5.2a-d). HRSEM images (Figure 5.2e-h) clearly show that core
particles are uniformly studded by different shell particles, and the interspacing distance
tw n n our n s ll p rt l s nl r s s t s ll p rt l s z n r s rom 13
to 98 nm. The interspacing distance between shell particles is crucial to the accumulation
of cargo molecules. Although the interspacing distances for RSNs are not uniform and
difficult to measure precisely, the values were determined by measuring 50 edge-to-edge
interspacing between adjacent shell particles to allow a semi-quantitative comparison. As
shown in Figure 5.S2 and Table 5.S2, the average interspacing distance of RSN-211@13,

Chapter 5 Synthesis of Silica Nanoparticles with Controllable Surface Roughness for Therapeutic
Protein Delivery
95
RSN-211@28, RSN-211@54 and RSN-211@98 is 7±2, 14±4, 21±9 and 38±22 nm,
respectively. The particle sizes of the four samples from DLS measurements are close to that
obtained from TEM measurements and the small PDI values confirm that all RSNs are
uniform and well-dispersed (Table 5.S2).
Figure 5.2 TEM (a-d) and HRSEM (e-h) images of RSNs with varied shell particle sizes:
a&e) RSN-211@13, b&f) RSN-211@28, c&g) RSN-211@54, d&h) RSN-211@98 and the
r d rrows nd t t orm t on o r “n ks” onn t n s ll nd or p rt l s.
Scale bar: 100nm.
The nitrogen sorption analysis was further utilized to measure SBET of RSN-211@13, RSN-
211@28, RSN-211@54 and RSN-211@98, which is 25.4, 26.9, 25.2 and 22.4 m2 g
-1,
respectively (Table 5.S2). For RSN-211@28, RSN-211@54 and RSN-211@98 prepared by
the same protocol, SBET of RSNs decreases with increasing shell particle size. The lower
SBET of RSN-211@13, compared to that of RSN-211@28, can be attributed to the difference
in synthesis methods: a longer reaction time (3.5 h vs. 20 min) of shell particles may lead to
more condensed structures and thus reduced surface area.
Using our previous protocol,21 s ll p rt l s o 13 nm w r su ss ully tt d on t
or p rt l s o 211 nm. How v r, l r r s ll p rt l s, or x mpl , w t t s z o 28
nm, are easily peeled off from core particles during washing and drying processes (Figure
5.S3a), even when core-shell structures were formed in solution (Figure 5.S3 ). In t
urr nt ppro , t l r s ll p rt l s ( 28, 54 nd 98 nm) w r orm d using the
classical Stöber method after reaction of 20 min, as the particle sizes were barely changed
Chapter 5 Synthesis of Silica Nanoparticles with Controllable Surface Roughness for Therapeutic
Protein Delivery
96
after about 15 min.30
Afterwards, positively charged core particle suspension was added into
the above shell particle reaction solution. By comparing the difference of current synthesis
strategy to the previous one (shown in Figure 5.1), the pH value of reaction medium (11.0
vs. 9.4) and the weight ratio of shell to core particles (4:1 vs. <1:1) is increased (Figure
5.1a(i) vs. b(i)).
The driving force for the attachment of negatively charged shell particles onto positively
charged core particles is electrostatic interaction21, 22
(Figure 5.1a(ii) and 1b(ii)), however
less attention has been paid to how to stabilize the formed core-shell structure and hence it is
difficult to synthesize rough particles with relatively large shell sizes. The focus of this study
is to address this challenge through silicate chemistry.34
At pH 9.4 the silica solubility is
reduced with both SiO(OH)3- (~50%) and Si(OH)4 (~50%) presenting in solution (Scheme
2b(i)). In contrast, at a stronger basic condition of pH 11, SiO(OH)3- is the predominant
silicate species with a relatively high concentration and thus more negative charges (Figure
5.1a(i)). When shell particles attach to core particles, a space with surfaces of negative
curvature is generated as indicated by a violet arrow in Figure 5.1a(ii). The solubility of a
surface with negative curvature is lower than that with positive curvature (i.e., normal
surface of spheres). Therefore, the net result is silica migration and deposition into the space
near the point of contact between core and shell particles,35
leading to the formation of a
bigger "neck" connecting core and shell particles (indicated by a violet arrow in Figure
5.1a(iii)).
The solubility difference between surfaces with positive and negative curvatures increases
with pH (e.g., 11.0 vs. 9.4), thus a higher pH favours the formation of bigger "necks"35
stabilizing the rough particle morphology. If the neck size is small and not strong enough
(e.g., at pH of 9.4) to hold core and shell particles (especially shell particles with relatively
larger sizes), the shell particles adhered on core particle surface mainly through electrostatic
interaction would easily peel off (iii in Figure 5.1b) during the subsequent treatments
(washing, drying, sonication, etc.). In addition to the increase of pH, the shell particle
concentration is also increased in our synthesis, which is beneficial for the attachment
between core and shell particles and eventually the enhanced neck formation.
The "neck-enhancing" mechanism for core-shell connection is supported by experimental
observations. The formation of neck regions between shell and core particles can be directly
seen using RSN-211@98 as an example (indicated by red arrows in Figure 5.2h).
Noticeably, there is a limitation for our current method. When shell size was further

Chapter 5 Synthesis of Silica Nanoparticles with Controllable Surface Roughness for Therapeutic
Protein Delivery
97
increased to 135 nm (Figure 5.S1e, 135±8nm, ZP -33±1.9 mV) and 175nm (Figure 5.S1f,
175±8nm, ZP -32±0.9 mV), the even larger shell particles failed to attach on the surface of
core particles (Figure 5.S4).
Protein adsorption behaviours on RSNs
To investigate the influence of interspacing distance of RSNs on protein adsorption capacity,
three model proteins with various molecular weights, including cytochrome c, IgG-F and a
non-specific rabbit IgG-A were used. Non-specific rabbit IgG-A was chosen because it has a
similar structure and animal source with anti-pAkt antibody, which will be utilized as the
therapeutic protein in the following biological study. Among the three proteins, cytochrome
c has an isoelectric point (IEP) of ~10, a diameter of ~3 nm and the smallest molecular
weight of ~12 kDa.36
IgG-A with the largest molecular weight of 150 kDa has a diameter of
~20 nm19
and the IEP of ~9. The IgG-F is a domain antibody and exists as a dimer, which
has an IEP value of ~8 and a molecular weight of 76 kDa with an estimated diameter of 10
nm. All proteins can be directly loaded onto RSNs at pH 7.4 in a phosphate buffer solution
(PBS) due to the electrostatic interaction between negatively charged silica nanoparticles
(Figure 5.S5) and the positively charged proteins. All RSNs demonstrate higher adsorption
ability in three tested proteins compared to the smooth core particles (data not shown),
which is consistent with previously reported results.21
Figure 5.3 shows protein adsorption capacity of RSNs with various interspacing distances.
RSN-211@98 with the interspacing distance o 38 nm x ts t st dsorpt on
ability (22.6 µg mg-1
) of IgG-A. RSN-211@54 (18.1 µg mg-1
) and RSN-211@28 (17.2 µg
mg-1
) with small interspacing distances show lower adsorption amount. In addition, the IgG-
A adsorption ability of RSN-211@98 is ~78% higher than RSN-211@13 (12.7 µg mg-1
),
which has the smallest interspacing distance. For IgG-F, the adsorption behaviour becomes
different. RSN-211@54 exhibits the highest protein entrapment ability (48.8 µg mg-1
). RSN-
211@98 shows a lower loading capacity of 42.5 µg mg-1
, because the interspacing distance
of RSN-211@98 is too large to hold the relatively small protein molecules in the voids.17
The lower adsorption ability of RSN-211@28 (40.1 µg mg-1
) and RSN-211@13 (36.7 µg
mg-1
) is attributed to the smaller void size compared to RSN-211@54.

Chapter 5 Synthesis of Silica Nanoparticles with Controllable Surface Roughness for Therapeutic
Protein Delivery
98
Figure 5.3 Protein adsorption profiles ( IgG-A; IgG-F; ▲ yto rom c). Solid lines
represent different protein adsorption onto unmodified rough silica nanoparticles. The dash
line also represents the IgG-A adsorption onto different rough silica nanoparticles, except
they are all modified with C18-groups. Data represent mean ± SD. Specific surface area
variations (×) of different unmodified rough silica nanoparticles are displayed to compare
with protein adsorption trend.
Noticeably, adsorption trend depends on the void size but not the surface area of RSNs
(Figure 5.3, solid line with cross symbol). As calculated in Table 5.S3, the protein coverage
(adsorption capacity versus surface area) is 63%, 80%, 91% and 127% for IgG-A, 91%,
94%, 122% and 117% for IgG-F on RSN- 211@13, RSN-211@28, RSN-211@54 and RSN-
211@98, respectively. The multilayer deposition behaviour of IgG-A on RSN-211@98 and
IgG-F on both RSN-211@54 and RSN-211@98 suggests that the adsorption occurs in the
interspace of particles with rationally controlled surface roughness.37
To confirm this hypothesis, RSN-211@54 was chosen to explore the surface topography
changes before and after IgG-F adsorption using AFM, due to its highest protein adsorption
capacity among the three cases. As shown in Figure 5.4, at the top region, shell particle
height of pure RSN-211@54 (Figure 5.4a, b) is 34-39 nm. After IgG-F adsorption, the shell
particle height (Figure 5.4c, d) decreases to 16-19 nm, suggesting that protein molecules are
entrapped and accumulated into the shell interspaces of RSN-211@54.
When protein size is much smaller than the interspacing distance, the surface area change
dominates protein adsorption behaviour. For the adsorption of cytochrome c, RSN-211@28
(7.5 µg mg-1
) shows the highest adsorption ability, followed by RSN-211@54 (6.9 µg mg-1
).
The adsorption ability of RSN-211@13 and RSN-211@98 are only 5.2 and 3.6 µg mg-1
,
respectively. This adsorption trend is consistent with SBET variations (Figure 5.3, solid line

Chapter 5 Synthesis of Silica Nanoparticles with Controllable Surface Roughness for Therapeutic
Protein Delivery
99
with cross symbol) of different RSNs. In addition, the coverage is calculated to be at most
9% (RSN-211@28, Table 5.S3). These results demonstrate that the interspacing distances of
RSNs are too large to confine very small protein molecules.
Figure 5.4 Surface topography studies. AFM images of RSN-211@54 before (a) and after
(c) the adsorption of IgG-F. A cross-sectional line is drawn to characterize the height
changes of shell particles on the top region before (b) and after (d) protein adsorption. Scale
bar: 100 nm.
Desired surface functionality (e.g., octadecyl-group16
) is of significance for high loading and
efficient delivery of therapeutic proteins into cells. All RSNs were hydrophobically-
modified on the surface, referred to as C18-RSN-211@13, C18-RSN-211@28, C18-RSN-
211@54 and C18-RSN-211@98 with slightly increased ZP values of -23, -18, -25 and -25
mV, respectively. They are used to further investigate the interspacing distance influence of
C18-RSNs on IgG-A adsorption capacity for the following application in therapeutic protein
delivery. FTIR results confirm the successful conjugation of octadecyl-groups for all C18-
RSNs (Figure. 5.S5). No significant topography changes are observed under TEM images
for all samples (Figure. 5.S6).
The IgG-A adsorption ability of C18-RSNs is displayed in Figure 5.3 (dash line). C18-RSNs
show highly improved adsorption capacity, compared to unmodified RSNs. The protein
coverage is calculated to be 179% for C18-RSN-211@13 (37 µg mg-1
), 229% for C18-RSN-
211@28 (49 µg mg-1
), 277% for C18-RSN-211@54 (55 µg mg-1
) and 337% for C18-RSN-
211@98 (60 µg mg-1
). The results are interpreted as IgG-A adsorption in a multi-layered
fashion, both on surface and in voids, where some proteins did not necessarily have strongly
physical contact with the silica surface.19
In addition, the adsorption amount of IgG-A to
C18-RSNs is much higher than the results in literature,16
where IgG-A loading capacity of
octadecyl-group modified smooth solid silica nanoparticles is only 1.25 µg mg-1
.

Chapter 5 Synthesis of Silica Nanoparticles with Controllable Surface Roughness for Therapeutic
Protein Delivery
100
The surface chemistry and nanoscale roughness play important roles in the immobilization
of biomolecules. The adsorption of positively charged IgG-A in PBS onto negatively
charged RSNs is mainly attributed to the electrostatic attraction.38
For C18-RSNs, the
hydrophobic modification leads to partially reduced charge density compared to
corresponding RSNs, however the IgG-A adsorption capacity was increased as much as 2-3
times than that of RSNs. For example, C18-RSN-@211@13 shows 2.8 times of IgG
antibody adsorption compared to RSN-211@13 without C18 modification (Figure 5.3),
indicating that the hydrophobic interaction is more important than the electrostatic
interaction in this case.38, 39
However, when comparing the adsorption capacity of either
RSNs or C18-RSNs with the same surface chemistry but tunable surface roughness (Figure
5.3), it shows that the size of surface voids (or core-to-shell ratios) is also important, e.g. the
IgG-A adsorption capacity of C18-RSN-@211@98 is 1.7 times compared to C18-RSN-
@211@13, which is attributed to protein immobilization in the void spaces of rough
surfaces.37
Evaluation of protein binding ability
Protein secondary structures are possibly disturbed after absorbed onto nanoparticle
surface.40
It is very important to maintain the activity of protein molecules loaded into nano-
carriers for therapeutic applications. Therefore, SPR measurements were conducted to
evaluate whether the binding capability of IgG-F with its complementary antigen will be
maintained after contacting rough nanoparticles.
SPR is a fast and real-time detection technique used to examine the interaction between wide
ranges of biological targets. Based on detecting small changes in the refractive index, SPR is
able to specifically monitor the interaction between analytes (e.g., antibody or peptide) and
the ligand molecules (e.g., antigen), which have been immobilized onto an inert surface.
"Resonance units" (RU, equal to a critical angle shift of 10−4
deg) is used to describe binding
signals between analytes and ligands.41
Unmodified RSNs were used to absorb IgG-F in this
test, because IgG-F is immobilized on unmodified RSNs generally in a monolayer manner,
so that the SPR results can be directly compared with the protein binding ability. After
sample injection, the negative signals from the control groups demonstrate that bare RSNs
and PBS did not exhibit any binding events. In comparison, all RSN-IgG-F complexes show
positive signals in binding with the antigen, which has been immobilized to the sensor chip
as the ligand, indicating the binding activity of IgG-F is maintained after complexing with
all RSNs (Figure 5.5 and Table 5.S4). It is noted that the trend of SPR signal intensity
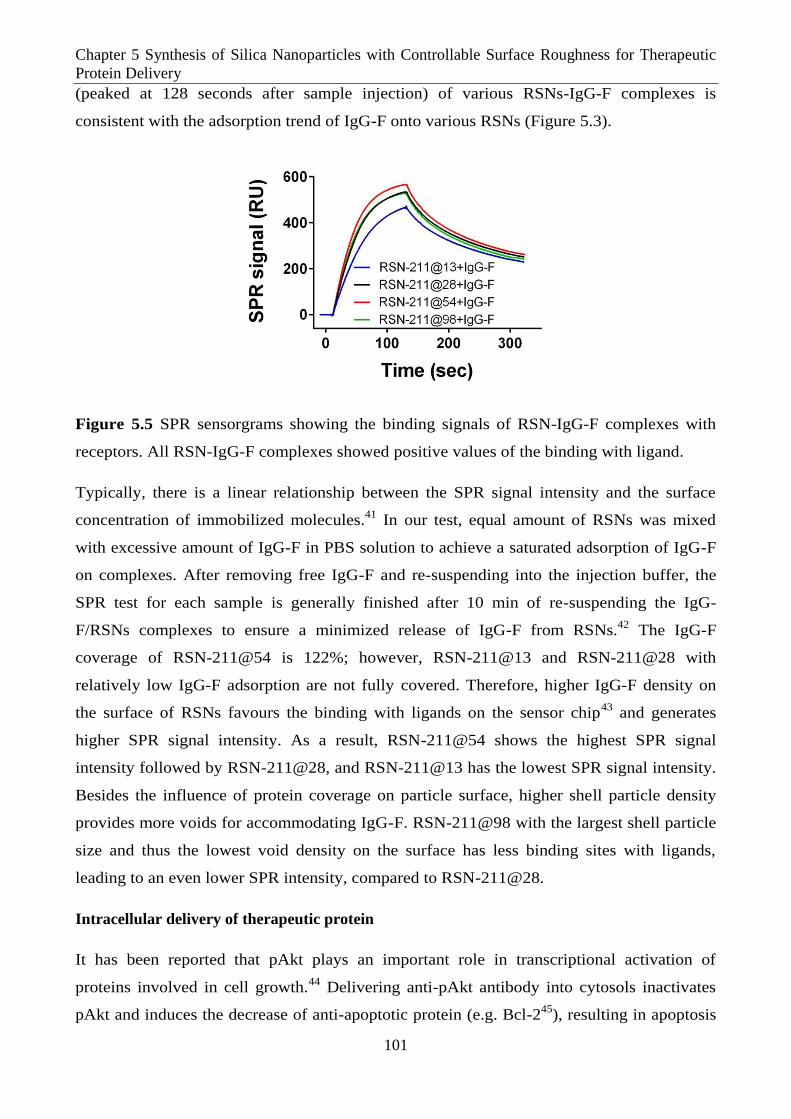
Chapter 5 Synthesis of Silica Nanoparticles with Controllable Surface Roughness for Therapeutic
Protein Delivery
101
(peaked at 128 seconds after sample injection) of various RSNs-IgG-F complexes is
consistent with the adsorption trend of IgG-F onto various RSNs (Figure 5.3).
Figure 5.5 SPR sensorgrams showing the binding signals of RSN-IgG-F complexes with
receptors. All RSN-IgG-F complexes showed positive values of the binding with ligand.
Typically, there is a linear relationship between the SPR signal intensity and the surface
concentration of immobilized molecules.41
In our test, equal amount of RSNs was mixed
with excessive amount of IgG-F in PBS solution to achieve a saturated adsorption of IgG-F
on complexes. After removing free IgG-F and re-suspending into the injection buffer, the
SPR test for each sample is generally finished after 10 min of re-suspending the IgG-
F/RSNs complexes to ensure a minimized release of IgG-F from RSNs.42
The IgG-F
coverage of RSN-211@54 is 122%; however, RSN-211@13 and RSN-211@28 with
relatively low IgG-F adsorption are not fully covered. Therefore, higher IgG-F density on
the surface of RSNs favours the binding with ligands on the sensor chip43
and generates
higher SPR signal intensity. As a result, RSN-211@54 shows the highest SPR signal
intensity followed by RSN-211@28, and RSN-211@13 has the lowest SPR signal intensity.
Besides the influence of protein coverage on particle surface, higher shell particle density
provides more voids for accommodating IgG-F. RSN-211@98 with the largest shell particle
size and thus the lowest void density on the surface has less binding sites with ligands,
leading to an even lower SPR intensity, compared to RSN-211@28.
Intracellular delivery of therapeutic protein
It has been reported that pAkt plays an important role in transcriptional activation of
proteins involved in cell growth.44
Delivering anti-pAkt antibody into cytosols inactivates
pAkt and induces the decrease of anti-apoptotic protein (e.g. Bcl-245
), resulting in apoptosis

Chapter 5 Synthesis of Silica Nanoparticles with Controllable Surface Roughness for Therapeutic
Protein Delivery
102
in some human cancer cell lines, for example, ovarian cancer, breast cancer and pancreatic
cancer.46-48
Hydrophobic-modified silica nanoparticles have been reported to deliver
therapeutic proteins successfully into cytoplasm.16, 17
In this study, C18-RSN-211@98 was
used to deliver anti-pAkt antibody (Figure 5.1c) into human breast cancer cells (MCF-7) due
to its highest antibody adsorption ability.
Figure 5.6 Cell growth inhibition by the delivery of therapeutic protein. a) Cell viability of
MCF-7 cells incubated with increasing concentrations of C18-RSN-211@98+anti-pAkt (),
C18-RSN-211@98+non-specific-IgG-A (♦) nd C18-RSN-211@98. Data represent mean ±
SD. b) Western blotting confirming the degradation of downstream anti-apoptotic protein,
Bcl-2 in MCF-7 cells. Blots presented are representative of typical results. GAPDH served
as an internal reference.
Dose-dependent cell growth inhibition is observed for the complex of C18-RSN-
211@98+anti-pAkt, and a maximum exposure of 1 µg mL-1
of immobilized anti-pAkt
antibody at 50 µg mL-1
of nanoparticle shows an increase in cell growth inhibition up to
85% (Figure 5.6a). This cell growth inhibition of anti-pAkt antibody is greater than the
literature report, where 80% of cell growth inhibition was induced by using as high as 800
µg mL-1
of a C18-modified silica nanoparticle (15 nm in diameter) to deliver 1 µg of anti-
pAkt antibody. In the absence of silica nano-carrier, free anti-pAkt antibody is unable to

Chapter 5 Synthesis of Silica Nanoparticles with Controllable Surface Roughness for Therapeutic
Protein Delivery
103
cause cell growth inhibition, indicating its poor cell internalization ability (Figure 5.S7). In
addition, when cells were treated with C18-RSN-211@98+non-specific rabbit IgG-A or
nanoparticle only, no obvious cell growth inhibition is observed (Figure 5.6a). The anti-pAkt
antibody delivery efficiency was also evaluated using other C18-RSNs (as shown in Figure
5.S8), and C18-RSN-211@98 holds the best performance.
To further test the downstream effects after blocking pAkt, Bcl-2 degradation was evaluated
using western blotting. As shown in Figure 5.6b, Bcl-2 degradation in MCF-7 cells is only
observed following cytosolic delivery of the C18-RSN-211@98+anti-pAkt, compared to cell
only, nanoparticle only and nanoparticle with non-specific IgG-A groups, indicating that cell
growth inhibition is associated with the degradation of Bcl-2 levels in MCF-7 cells.
5.4 Conclusion
In summary, rough silica nanoparticles (RSNs) with varied topographies were successfully
synthesized using a novel "neck-enhancing" approach. Relatively high pH value and shell
particle concentration favour the formation of bigger "necks", which is crucial for the
generation of RSNs with controllable core-to-shell ratios. The increase of shell particle sizes
from 13 to 98 nm while keeping the core particle size at 211 nm enlarges the shell
particle interspacing distance rom 7 to 38 nm, where proteins with comparable sizes are
favourably accumulated without influencing its binding ability. The rough silica
nanoparticles with an optimized loading capacity demonstrate a high efficiency of
intracellular delivery of therapeutic proteins in cancer cells, causing a significant cell growth
inhibition. The "neck-enhancing" approach provides new understanding in the rational
design of cellular delivery vectors with controllable surface roughness for the delivery of
therapeutic proteins.
5.5 References
1 B. Leader, Q. J. Baca and D. E. Golan, Nat. Rev. Drug. Discov, 2008, 7, 21-39.
2 M. Yan, J. J. Du, Z. Gu, M. Liang, Y. F. Hu, W. J. Zhang, S. Priceman, L. L. Wu, Z. H.
Zhou, Z. Liu, T. Segura, Y. Tang and Y. F. Lu, Nat. Nanotechnol, 2010, 5, 48-53.
3 S. Frokjaer and D. E. Otzen, Nat. Rev. Drug. Discov, 2005, 4, 298-306.
4 A. Sood and R. Panchagnula, Chem. Rev, 2001, 101, 3275-3303.
5 F. Cuomo, A. Ceglie and F. Lopez, J. Colloid Interface Sci, 2012, 365, 184-190.
6 H. Kamiya, Y. Fujimura, I. Matsuoka and H. Harashima, Biochem. Biophys. Res. Commun,
2002, 298, 591-597.

Chapter 5 Synthesis of Silica Nanoparticles with Controllable Surface Roughness for Therapeutic
Protein Delivery
104
7 X. Zhou and L. Huang, J. Controlled Release, 1992, 19, 269-274.
8 Z. J. Wang, L. Qian, X. L. Wang, F. Yang and X. R. Yang, Colloid Surface A, 2008, 326, 29-
36.
9 I. Moret, J. Est n P r s, V. M. Gu ll m, M. B n t, F. R v rt, F. D s , A. Cr spo nd S. F.
Aliño, J. Controlled Release, 2001, 76, 169-181.
10 G. Navarro and C. Tros de Ilarduya, Nanomed. Nanotechnol. Biol. Med, 2009, 5, 287-297.
11 X.-B. X on , H. Ulud ğ nd A. L v s nifar, Biomaterials, 2009, 30, 242-253.
12 G. Maiorano, S. Sabella, B. Sorce, V. Brunetti, M. A. Malvindi, R. Cingolani and P. P.
Pompa, Acs Nano, 2010, 4, 7481-7491.
13 F. Osaki, T. Kanamori, S. Sando, T. Sera and Y. Aoyama, J. Am. Chem. Soc., 2004, 126,
6520-6521.
14 Y. Zhu, W. Meng, H. Gao and N. Hanagata, J. Phys. Chem. C, 2011, 115, 13630-13636.
15 S. F. Ye, M. M. Tian, T. X. Wang, L. Ren, D. Wang, L. H. Shen and T. Shang, Nanomed-
Nanotechnol, 2012, 8, 833-841.
16 S. S. Bale, S. J. Kwon, D. A. Shah, A. Banerjee, J. S. Dordick and R. S. Kane, Acs Nano,
2010, 4, 1493-1500.
17 J. Zhang, S. Karmakar, M. H. Yu, N. Mitter, J. Zou and C. Z. Yu, Small, 2014, 10, 5068-
5076.
18 I. I. Slowing and V. S. Y. Lin, J. Am. Chem. Soc., 2007, 233, 186-186.
19 M. Holmberg and X. Hou, Langmuir, 2009, 25, 2081-2089.
20 K. Grunewald, P. Desai, D. C. Winkler, J. B. Heymann, D. M. Belnap, W. Baumeister and
A. C. Steven, Science, 2003, 302, 1396-1398.
21 Y. T. Niu, M. H. Yu, S. B. Hartono, J. Yang, H. Y. Xu, H. W. Zhang, J. Zhang, J. Zou, A.
Dexter, W. Y. Gu and C. Z. Yu, Adv. Mater, 2013, 25, 6233-6237.
22 G. L. Li, X. L. Yang and J. Y. Wang, Colloid Surface A, 2008, 322, 192-198.
23 C. S. Wagner, S. Shehata, K. Henzler, J. Yuan and A. Wittemann, J. Colloid Interf Sci,
2011, 355, 115-123.
24 B. Zhao and M. M. Collinson, Chem. Mater, 2010, 22, 4312-4319.
25 F. Lu, S. H. Wu, Y. Hung and C. Y. Mou, Small, 2009, 5, 1408-1413.
26 Y. Niu, A. Popat, M. Yu, S. Karmakar, W. Gu and C. Yu, Ther Deliv, 2012, 3, 1217-1237.
27 Z. Yuhong, Z. Qichao, S. Xingwang, T. Qingqiong, C. Min and W. Limin, J. Colloid Interf
Sci, 2009, 336, 544-550.
28 M. W. Pi, T. T. Yang, J. J. Yuan, S. Fujii, Y. Kakigi, Y. Nakamura and S. Y. A. Cheng,
Colloid Surface B, 2010, 78, 193-199.

Chapter 5 Synthesis of Silica Nanoparticles with Controllable Surface Roughness for Therapeutic
Protein Delivery
105
29 H. S. Hwang, S. B. Lee and I. Park, Mater. Lett, 2010, 64, 2159-2162.
30 W. Stöber, A. Fink and E. Bohn, J. Colloid Interface Sci, 1968, 26, 62-69.
31 P. Shah, N. Sridevi, A. Prabhune and V. Ramaswamy, Micropor. Mesopor. Mat, 2008, 116,
157-165.
32 T. Yokoi, Y. Sakamoto, O. Terasaki, Y. Kubota, T. Okubo and T. Tatsumi, J. Am. Chem.
Soc, 2006, 128, 13664-13665.
33 S. Asahina, S. Uno, M. Suga, S. M. Stevens, M. Klingstedt, Y. Okano, M. Kudo, F. Schüth,
M. W. Anderson, T. Adschiri and O. Terasaki, Micropor. Mesopor. Mat, 2011, 146, 11-17.
34 C. J. Brinker and G. W. Scherer, in Sol–Gel Science, eds. C. J. Brinker and G. W. Scherer,
Academic Press, San Diego, USA, 1990, pp. 96-233.
35 R. K. ILER, The chemistry of silica: Solubility, polymerization, colloid and surface
properties, and biochemistry, A Wiley-Interscience Publication, New York, USA, 1979.
36 I. I. Slowing, B. G. Trewyn and V. S. Y. Lin, J. Am. Chem. Soc., 2007, 129, 8845-8849.
37 P. E. Scopelliti, A. Borgonovo, M. Indrieri, L. Giorgetti, G. Bongiorno, R. Carbone, A.
Podesta and P. Milani, Plos One, 2010, 5, e11862.
38 W. Norde, Macromol Symp, 1996, 103, 5-18.
39 M. Holmberg and X. L. Hou, Langmuir, 2009, 25, 2081-2089.
40 P. Roach, D. Farrar and C. C. Perry, J. Am. Chem. Soc., 2006, 128, 3939-3945.
41 M. Besenicar, P. Macek, J. H. Lakey and G. Anderluh, Chem. Phys. Lipids, 2006, 141, 169-
178.
42 C. H. Lei, P. Liu, B. W. Chen, Y. M. Mao, H. Engelmann, Y. Shin, J. Jaffar, I. Hellstrom, J.
Liu and K. E. Hellstrom, J. Am. Chem. Soc., 2010, 132, 6906–6907.
43 M. Canovi, J. Lucchetti, M. Stravalaci, F. Re, D. Moscatelli, P. Bigini, M. Salmona and M.
Gobbi, Sensors-Basel, 2012, 12, 16420-16432.
44 J. J. Wallin, J. Guan, W. W. Prior, K. A. Edgar, R. Kassees, D. Sampath, M. Belvin and L.
S. Friedman, Sci. Transl. Med, 2010, 2, 48ra66.
45 S. C. Tsai, C. C. Lu, C. Y. Lee, Y. C. Lin, J. G. Chung, S. C. Kuo, S. Amagaya, F. N. Chen,
M. Y. Chen, S. F. Chan and J. S. Yang, Int. J. Oncol, 2012, 41, 1683-1692.
46 N. Itoh, S. Semba, M. Ito, H. Takeda, S. Kawata and M. Yamakawa, Cancer, 2002, 94,
3127-3134.
47 O. David, J. Jett, H. LeBeau, G. Dy, J. Hughes, M. Friedman and A. R. Brody, Clin.
Cancer. Res, 2004, 10, 6865-6871.
48 O. Stal, G. Perez-Tenorio, L. Akerberg, B. Olsson, B. Nordenskjold, L. Skoog and L. E.
Rutqvist, Breast. Cancer. Res, 2003, 5, R37-R44.

Chapter 5 Synthesis of Silica Nanoparticles with Controllable Surface Roughness for Therapeutic
Protein Delivery
106
Supplementary Figures and Tables
Figure 5.S1 TEM images (a-g) and particle size distribution curves (f) of shell and core particles.
Shell particles: a&h-i) 13nm, b&h-ii) 28nm, c&h-ii) 54nm, d&h-iv) 98nm, e&h-v) 135nm and f&h-
vi) 175nm. Core particle: g&h-vii) 211nm. Scale bar: 100 nm.
Figure 5.S2 The interspacing distance of RSNs. a) RSN-211@13, b) RSN-211@28, c) RSN-
211@54, d) RSN-211@98. The interspaces are measured from SEM images by recording 50 edge-
to-edge interspacing data in each sample.
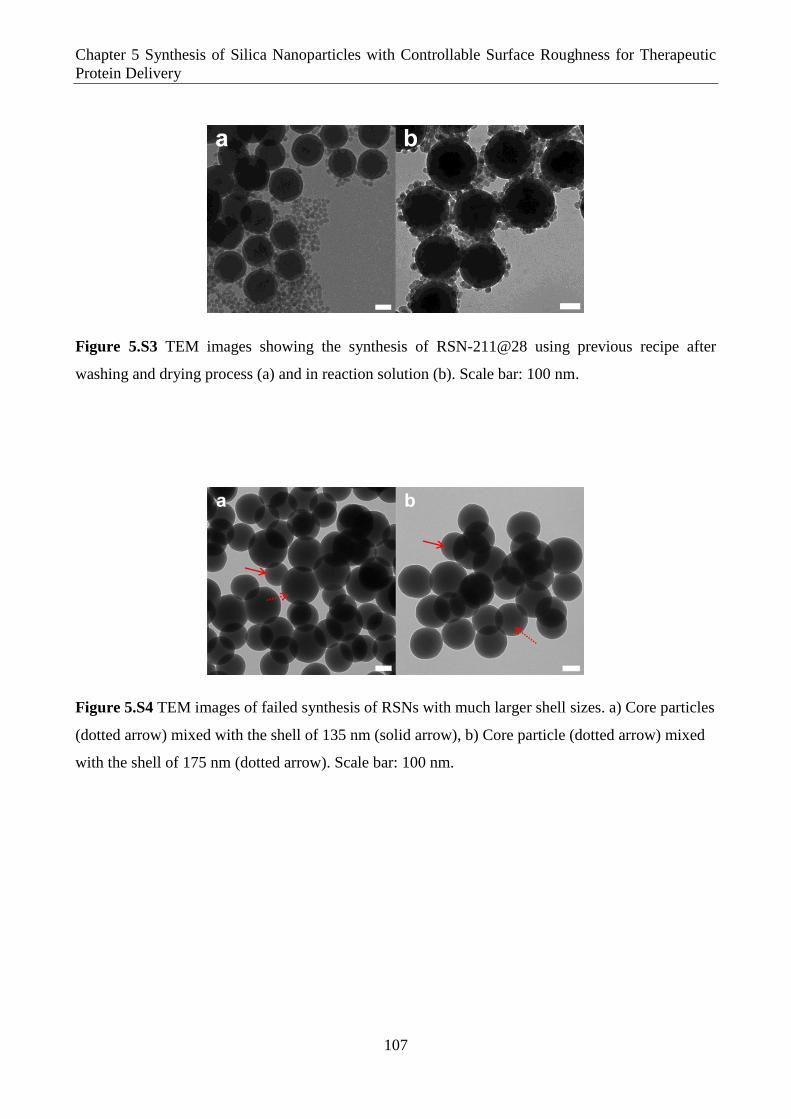
Chapter 5 Synthesis of Silica Nanoparticles with Controllable Surface Roughness for Therapeutic
Protein Delivery
107
Figure 5.S3 TEM images showing the synthesis of RSN-211@28 using previous recipe after
washing and drying process (a) and in reaction solution (b). Scale bar: 100 nm.
Figure 5.S4 TEM images of failed synthesis of RSNs with much larger shell sizes. a) Core particles
(dotted arrow) mixed with the shell of 135 nm (solid arrow), b) Core particle (dotted arrow) mixed
with the shell of 175 nm (dotted arrow). Scale bar: 100 nm.

Chapter 5 Synthesis of Silica Nanoparticles with Controllable Surface Roughness for Therapeutic
Protein Delivery
108
Figure 5.S5 Fourier transform infrared (FTIR) spectra of pure liquid n-ODMS (a) and a series of
RSNs with and without hydrophobic modification (b).
The RSNs before and after modification of octadecyl group is characterized by FTIR technique.
Figure 5.S5a shows the FTIR spectrum of pure liquid n-ODMS, where the six characteristic peaks
at 809, 1085, 1190, 1465, 2856 and 2926 cm-1
n ttr ut d to ν(S -O), ν(C-O)+ ν(C-C),
ρ(CH3), δ(C-H)1 and symmetric and anti-symmetric -CH2- stretching,
2, 3 respectively. All the
spectra of silica nanoparticles show the same characteristic bands at 802 cm-1
and broad band
centrated at 1058 cm-1
, suggesting –Si-O-Si- bonding.4 In the spectra of all silica nanoparticles after
hydrophobic modifications (Figure 5.S5b i, iii, v, vii), two extra peaks at 2856 and 2926 cm-1
can be
observed, shown as the curves enlarged by 5-folds, which can be attributed to symmetric and anti-
symmetric -CH2- stretching, respectively, indicating the successful modification of octadecyl
groups.5
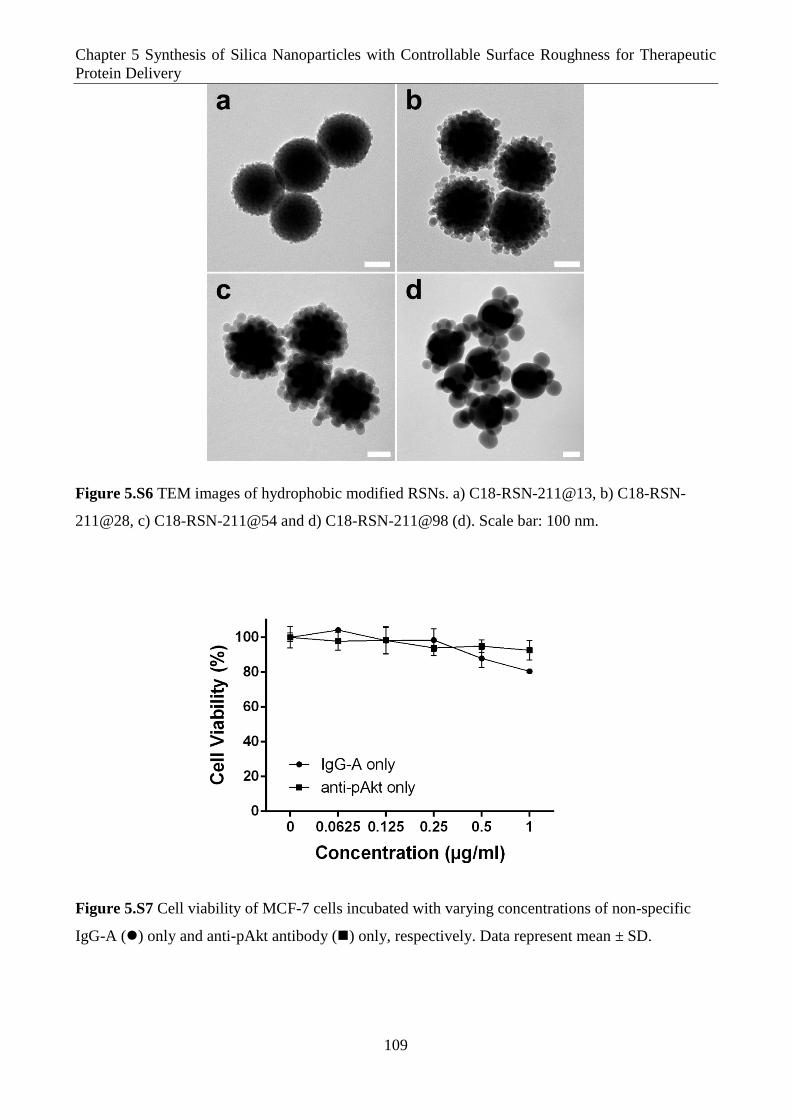
Chapter 5 Synthesis of Silica Nanoparticles with Controllable Surface Roughness for Therapeutic
Protein Delivery
109
Figure 5.S6 TEM images of hydrophobic modified RSNs. a) C18-RSN-211@13, b) C18-RSN-
211@28, c) C18-RSN-211@54 and d) C18-RSN-211@98 (d). Scale bar: 100 nm.
Figure 5.S7 Cell viability of MCF-7 cells incubated with varying concentrations of non-specific
IgG-A () only and anti-pAkt antibody () only, respectively. Data represent mean ± SD.

Chapter 5 Synthesis of Silica Nanoparticles with Controllable Surface Roughness for Therapeutic
Protein Delivery
110
Figure 5.S8 The comparison of anti-pAkt antibody delivery efficiency (a) and cellular uptake
performance of C18-RSNs measured by ICPOES (b). Data represent mean ± SD.
C18-RSN-211@13, C18-RSN-211@28 and C18-RSN-211@54 were also used apart from C18-
RSN-211@98 to deliver anti-pAkt antibody into cells. Both C18-RSNs alone or loaded with non-
specific IgG-A did not cause significant cell growth inhibition. Equal amount of C18-RSNs (50 µg)
was mixed with excessive amount of anti-pAkt antibody (1 µg) in PBS solution to ensure a
saturated adsorption. At the nanoparticle concentration of 15 µg mL-1
, cell viability decreases to
50%, 51% and 46% using C18-RSN-211@13, C18-RSN-211@28 and C18-RSN-211@54 as nano-
carriers, respectively, while C18-RSN-211@98+anti-pAkt induces a lower cell survival rate to 31%
(Figure 5.S8a). This difference is attributed to the combined effects of two factors: the cellular
uptake efficiency and protein adsorption ability. As shown in Figure 5.S8b, averagely 127, 139, 121
and 88 pg of silica from C18-RSN-211@13, C18-RSN-211@28, C18-RSN-211@54 and C18-RSN-
211@98 is taken up by each cell, respectively, because nanoparticles with larger sizes have lower
cell penetration.6-8
This trend is opposite to the adsorption trend (Figure 5.3), where C18-RSN-
211@98 shows the highest adsorption ability to large protein (IgG-A). Consequently, the opposite
trends of adsorption and cellular uptake lead to the highest cell growth inhibition of C18-RSN-
211@98+anti-pAkt.
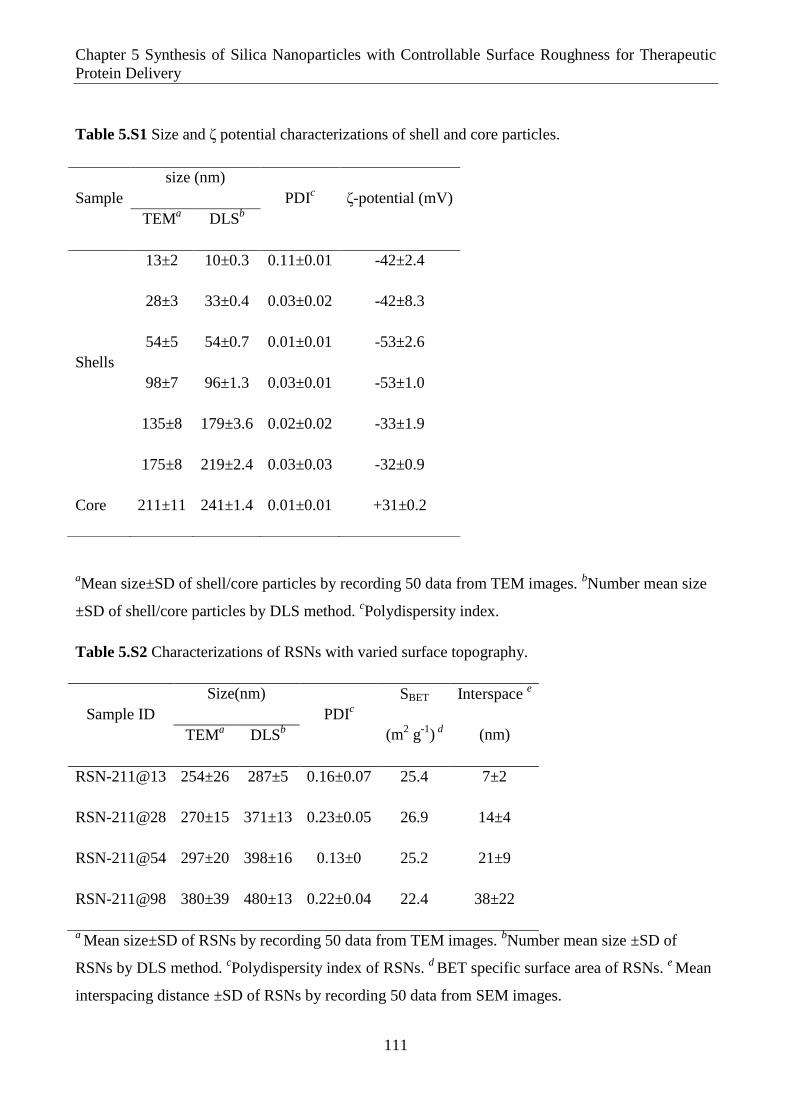
Chapter 5 Synthesis of Silica Nanoparticles with Controllable Surface Roughness for Therapeutic
Protein Delivery
111
Table 5.S1 Size and ζ potential characterizations of shell and core particles.
aMean size±SD of shell/core particles by recording 50 data from TEM images.
bNumber mean size
±SD of shell/core particles by DLS method. cPolydispersity index.
Table 5.S2 Characterizations of RSNs with varied surface topography.
Sample ID
Size(nm)
PDIc
SBET
(m2 g
-1) d
Interspace e
(nm) TEMa DLS
b
RSN-211@13 254±26 287±5 0.16±0.07 25.4 7±2
RSN-211@28 270±15 371±13 0.23±0.05 26.9 14±4
RSN-211@54 297±20 398±16 0.13±0 25.2 21±9
RSN-211@98 380±39 480±13 0.22±0.04 22.4 38±22
a Mean size±SD of RSNs by recording 50 data from TEM images.
bNumber mean size ±SD of
RSNs by DLS method. cPolydispersity index of RSNs.
d BET specific surface area of RSNs.
e Mean
interspacing distance ±SD of RSNs by recording 50 data from SEM images.
Sample
size (nm)
PDIc ζ-potential (mV)
TEMa DLS
b
Shells
13±2 10±0.3 0.11±0.01 -42±2.4
28±3 33±0.4 0.03±0.02 -42±8.3
54±5 54±0.7 0.01±0.01 -53±2.6
98±7 96±1.3 0.03±0.01 -53±1.0
135±8 179±3.6 0.02±0.02 -33±1.9
175±8 219±2.4 0.03±0.03 -32±0.9
Core 211±11 241±1.4 0.01±0.01 +31±0.2

Chapter 5 Synthesis of Silica Nanoparticles with Controllable Surface Roughness for Therapeutic
Protein Delivery
112
Table 5.S3 Estimation of protein coverage on RSNs/C18-RSNs
Protein Sample ID Nmaxa Nads
b Coverage %
c
Cytochrome c
RSN-211@13 3.59×10¹⁸
2.55×10¹⁷
7.11
RSN-211@28 3.81×10¹⁸
3.65×10¹⁷
9.59
RSN-211@54 3.56×10¹⁸
3.38×10¹⁷
9.49
RSN-211@98 3.18×10¹⁸
1.77×10¹⁷
5.58
IgG-F
RSN-211@13 3.23×10¹⁷
2.94×10¹⁷
91.07
RSN-211@28 3.43×10¹⁷
3.22×10¹⁷
94.02
RSN-211@54 3.20×10¹⁷
3.92×10¹⁷
122.23
RSN-211@98 2.86×10¹⁷
3.41×10¹⁷
117.65
IgG-A
RSN-211@13 8.08×10¹⁶
5.08×10¹⁶
62.90
RSN-211@28 8.56×10¹⁶
6.88×10¹⁶
80.40
RSN-211@54 8.02×10¹⁶
7.26×10¹⁶
90.59
RSN-211@98 7.15×10¹⁶
9.07×10¹⁶
126.87
C18-RSN-211@13 8.08×10¹⁶
1.44×10¹⁷
178.57
C18-RSN-211@28 8.56×10¹⁶
1.97×10¹⁷
229.49
C18-RSN-211@54 8.02×10¹⁶
2.22×10¹⁷
276.83
C18-RSN-211@98 7.15×10¹⁶
2.41×10¹⁷
336.88
aNmax represents the theoretical number of protein molecules that is assumed to fully cover the
surface of 1 gram of RSNs in a single-layered fashion.
(1)
bNads represents the actual number of protein molecules (calculated from adsorption amount, Wads)
that associated on the surface of 1 gram of RSNs/C18-RSNs. NA stands for Avogadro constant, and
MWprotein shows protein molecular weight.
(2)
cCoverage% represents the actual protein coverage percentages, compared to theoretical number of
protein molecules where the surface is assumed to be fully covered in a single-layered manner.
⁄ (3)

Chapter 5 Synthesis of Silica Nanoparticles with Controllable Surface Roughness for Therapeutic
Protein Delivery
113
Table 5.S4 SPR signal intensity.
Sample ID without IgG-F(RU) with IgG-F(RU)
RSN-211@13 -1.9 462.3
RSN-211@28 -3.8 531.2
RSN-211@54 -4 564
RSN-211@98 -2.6 527.5
PBS -0.4 --
Note: SRP signal intensity was determined at the peak point 128 seconds after sample injection
References
1 M. I. Tejedor-Tejedor, L. Paredes and M. A. Anderson, Chem. Mater, 1998, 10, 3410-3421.
2 Q. Wu, L. Wang and L. Zu, J. Autom. Methods Manage. Chem., 2011, 2011, 7.
3 K. Kailasam and K. Muller, J. Chromatogr. A, 2008, 1191, 125-135.
4 D. B. Mahadik, A. V. Rao, A. P. Rao, P. B. Wagh, S. V. Ingale and S. C. Gupta, J. Colloid Interf
Sci, 2011, 356, 298-302.
5 J. Zhang, S. Karmakar, M. H. Yu, N. Mitter, J. Zou and C. Z. Yu, Small, 2014, 10, 5068-5076.
6 F. Lu, S. H. Wu, Y. Hung and C. Y. Mou, Small, 2009, 5, 1408-1413.
7 J. Zhu, L. Liao, L. N. Zhu, P. Zhang, K. Guo, J. L. Kong, C. Ji and B. H. Liu, Talanta, 2013, 107,
408-415.
8 J. Rejman, V. Oberle, I. S. Zuhorn and D. Hoekstra, Biochem J, 2004, 377, 159-169.

Chapter 6 Understanding the Contribution of Surface Roughness and Hydrophobic Modification on
Silica Nanoparticles for Enhanced Therapeutic Protein Delivery
114
Chapter 6
Understanding the Contribution of Surface
Roughness and Hydrophobic Modification on
Silica Nanoparticles for Enhanced Therapeutic
Protein Delivery
This chapter quantitatively demonstrates both the individual and combined contributions of surface
roughness and hydrophobic modification for the improvement of protein therapeutics. Both surface
roughening and hydrophobic modification enhance protein (RNase A) adsorption capacity, while
the contribution from surface roughness is more dominant. Hydrophobic modification has a
stronger effect to retard RNase A release. The contribution difference to enhance cellular uptake is
cell type-dependent. Importantly, only hydrophobic modification facilitates endo/lysosomal escape.
Collectively, octadecyl-functionalized rough silica nanoparticles (C18-RSNs) thus show the best
performance in RNase A delivery, causing significant cell viability inhibition in both human breast
cancer (MCF-7) and SCC-25 cell lines, compared to unmodified rough silica nanoparticle and
smooth silica nanoparticles with (C18-SSN) or without (SSN) octadecyl-group modification. This
work has been submitted for publication in Journal of Materials Chemistry B (2015, full
paper).

Chapter 6 Understanding the Contribution of Surface Roughness and Hydrophobic Modification on
Silica Nanoparticles for Enhanced Therapeutic Protein Delivery
115
6.1 Introduction
Protein-based therapeutics has attracted increasing attention in the field of cancer therapy.1
Compared to small molecule drugs, therapeutic proteins such as enzymes can manipulate
key signalling pathways without influencing normal biological functions.2 However, cell
membrane impermeability to protein molecules limits intracellular delivery of therapeutic
proteins. To address this issue, various synthetic vectors have been developed to compact
therapeutic proteins, for example, liposomes,3, 4
cationic polymers,5 micelles,
6 dendrimers
7
and inorganic nanoparticles (e.g., silica nanoparticles8, 9
and gold nanoparticles10
). Among
these synthetic vectors, silica-based nanomaterials possess excellent biocompatibility,
tuneable nanostructures and the ease of surface modification, making them attractive
candidates for therapeutic protein delivery.11
Pristine mesoporous silica nanospheres were
firstly used for intracellular delivery of cytochrome c into cervical cancer cells (HeLa),12
but
the therapeutic efficacy was not demonstrated.
To achieve successful intracellular delivery of proteins, it is crucial to use nano-carriers with
high protein loading level, effective cellular uptake and sustained protein release in
cytosols13
without proteolysis and degradation in endosome/lysozymes.14, 15
Bale and co-
workers16
illustrated that hydrophobically modified solid silica nanospheres can immobilize
protein molecules on the surface and deliver them into cancer cells without extended
entrapment in endosomes. However, extremely large amount of nanoparticles was required
for significant cell growth inhibition, because solid particles have limited surface area for
protein loading. Recently, Zhang and co-workers17
developed silica vesicles with hollow
cavities to provide sufficient space for enhanced protein loading capacity. After octadecyl-
group (C18) attachment, C18-modified silica vesicles successfully delivered ribonuclease A
(RNase A) to human squamous carcinoma cells (SCC-25), causing a significant cell growth
inhibition. Roughening the surface of nanoparticles has been demonstrated as another
approach to improve biomolecule loading capacity.18
More importantly, surface roughness
was confirmed to enhance cellular uptake efficiency.18, 19
As two independent parameters of
nano-carriers, unfortunately there is no report to compare the individual contribution of
surface roughness and hydrophobic modification for protein delivery. A comparative study
to understand their roles is of fundamental importance in the design of advanced nano-
carriers with enhanced delivery efficacy.

Chapter 6 Understanding the Contribution of Surface Roughness and Hydrophobic Modification on
Silica Nanoparticles for Enhanced Therapeutic Protein Delivery
116
Herein, we report a systematic study on the contribution of surface roughness and
hydrophobic modification on silica nanoparticles for therapeutic protein delivery. The
influence of one individual parameter and their combination on protein loading capacity,
release behavior, cellular uptake and endosome escape performance of silica nanoparticles
have been demonstrated. Both surface roughening and hydrophobic modification enhance
protein adsorption capacity, while the contribution from surface roughness is higher. For
sustained protein release, hydrophobic modification has a higher impact compared to rough
surface. Both surface roughness and hydrophobic modification improve cellular uptake
performance; however the contribution difference is cell type-dependent. It is clear that the
surface roughness has little contribution to endo/lysosomal escape. Only the surface
chemistry, i.e., the hydrophobic modification, facilitates the release of nanoparticle/cargo
molecules from endosome/lysosome entrapment. Collectively, octadecyl-functionalized
rough silica nanoparticle (C18-RSN) shows the best performance in therapeutic protein
(RNase A) delivery, causing significant cell viability inhibition in both human breast cancer
(MCF-7) and SCC-25 cell lines among all groups under study.
6.2 Experimental
6.2.1 Materials and reagents
For nanoparticle synthesis: ammonium hydroxide solution (28%), 3-aminopropyltriethoxy
silane (APTES, 98%) and L-arginine (98%), octane (98%) were purchased from Sigma-
Aldrich. Tetraethyl orthosilicate (TEOS, 98%) and trimethoxy(octadecyl) silane (OTMS,
90%) were purchased from Aldrich. Toluene was purchased from Merck. All chemicals
were used without further purifications.
For biology experiments: Dulbecco's Modified Eagle Medium (DMEM), Dulbecco's
modified Eagle's medium and Ham's F12 medium (DMEM/F12), penicillin-streptomycin
(10,000 U/mL) and trypsin-EDTA (0.25%) were purchased from GIBCO or Invitrogen, Life
Sciences, Life Technologies. Fetal bovine serum (FBS) and trypan blue solution (0.4%)
were purchased from Sigma-Aldrich. Ribonuclease A (RNase A) from bovine pancreas was
purchased from ROCHE (Germany). Adenocarcinoma cell line MCF-7 (HTB-22™) nd
human squamous cell carcinoma cell line SCC-25 (ATCC® CRL-1628™) w r pur s d
from ATCC (American Type Culture Collection). MCF-7 cells were maintained as
monolayer cultures in DMEM, supplemented with 10% FBS, 1% penicillin-streptomycin at
37 °C and 5% CO2. SCC-25 cells were maintained as monolayer cultures in DMEM/F12,

Chapter 6 Understanding the Contribution of Surface Roughness and Hydrophobic Modification on
Silica Nanoparticles for Enhanced Therapeutic Protein Delivery
117
supplemented with 10% FBS, 1% penicillin-streptomycin, 0.5 mM sodium pyruvate and
400ng/mL hydrocortisone at 37 C and 5% CO2.
6.2.2 Synthesis of nanoparticles
Synthesis of smooth silica nanoparticles (SSN): Un orm sol d s l p rt l w t t s z
o 232 nm w s synt s z d us n St r m t od.20
Typically, 3.8 mL of deionized (DI)
water and 2 mL of ammonium hydroxide solution were added into 50 mL of absolute
ethanol, and the reaction was carried out for 6 hours after adding 3 mL of TEOS at room
temperature under vigorous stirring. Nanoparticles were collected by centrifugation,
washing and drying. Then calcination treatment at 550 °C was conducted to remove organic
components.
Amine-group modification: Uncalcined SSN was functionalized with amine-silane and used
as positively charged core particle. Dried samples (200 mg) were re-suspended in 30 mL of
toluene with 1% (v/v) APTES. The mixture was refluxed for 2 h at 110 °C. Then, the amino-
modified nanoparticle was obtained by centrifugation, washing and drying at room
temperature overnight, and it will be used as core particles.
Synthesis of shell particle: Shell nanoparticle with the size of 20 nm was also fabricated
using the Stöber method. The reaction components were the same as that for SSN, but the
reaction temperature was increased to 70 °C.
Synthesis of RSN: After reacting for 20 min of the shell particle above, core particle (200
mg) suspension in 2 mL of ethanol was added into the shell reaction solution at 70 °C. Then,
RSN was collected 2 h later by washing with ethanol and drying at room temperature
overnight, followed by calcination treatment at 550 °C for 5 h to remove organic
components in silica framework.
Hydrophobic (octadecyl-group) modification: SSN and RSN were functionalized to have
hydrophobic feature. Nanoparticles (200 mg) were re-suspended in 30 mL of toluene
containing 0.5% (v/v) OTMS. Then, C18-SSN and C18-RSN were obtained after refluxing
at 110 C for 20 h, followed by washing and drying at room temperature overnight.
6.2.3 Characterizations
Hydrodynamic size and z t (ζ)-potential (ZP) measurements: Dynamic light scattering
(DLS) size and ZP values were collected at 25 °C using a Zetasizer Nano-ZS from Malvern

Chapter 6 Understanding the Contribution of Surface Roughness and Hydrophobic Modification on
Silica Nanoparticles for Enhanced Therapeutic Protein Delivery
118
Instruments. The nanoparticles were suspended in DI water or phosphate buffered saline
(PBS, pH 7.4) by ultra-sonication.
Transmission electron microscopy (TEM) and high resolution scanning electron microscopy
(HRSEM): TEM images were taken using a JEOL 1010 microscope operated at 100 kV for
observing nanoparticles, which were dispersed in ethanol and then transferred to a copper
grid. HRSEM images were obtained on a JEOL JSM 7800 FE-SEM operated at a low
accelerating voltage of 0.8-1.5 kV with 20% specimen bias.21
The microscope was equipped
with an in-column upper electron detector (UED) and gentle beam technology. SEM
samples were prepared by dropping nanoparticle suspensions onto the aluminum foil pieces,
which attach to conductive carbon film on SEM mounts, followed by baking in vacuum at
70 °C for overnight.
Surface area test: Brunauer–Emmett–Teller (BET) specific surface area of nanoparticles
were collected from nitrogen sorption isotherms, carried out at -196 °C using a
Micromeritics Tristar II system. Before the measurements, the samples were degassed at 180
°C for at least 6h in vacuum. BET specific surface area was calculated from experimental
points at a relative pressure of P/P0 = 0.05- 0.25.
Fourier transform infrared (FTIR) measurements: FTIR spectra of OTMS, RNase A and
different nanoparticles before and after RNase A adsorption were collected using the
T rmo S nt ™ N ol t™ 6700 FT-IR spectrometers.
C18-modification determination: Elemental analysis was carried out on a CHNS-O Analyzer
(Flash EA1112 Series, Thermo Electron Corporation) to determine the weight percentages
of carbon (C) element. Different nanoparticles of 10-20 mg were required for the test.
Cystine with 29.99% the element of carbon was used as the standard control.
Atomic force microscopy (AFM) measurements: RSN and C18-RSN were dispersed in DI
water, and then the suspensions (10 µl) were placed onto silicon wafers, evaporating at room
temperature. For the preparation of C18-RSN+RNase A, C18-RSN was first mixed with
RNase A, at nanoparticle concentration of 10mg/ml and RNase A concentration of 1mg/ml.
After that, the complex was washed with DI water to remove salts by centrifugation and
pipetting, followed by mounting on silicon wafer. AFM measurements of RSN, C18-RSN
and C18-RSN+RNase A were processed using the instrument of Cypher S AFM (Asylum
Research, an Oxford Instruments company). AFM images were obtained at the tapping

Chapter 6 Understanding the Contribution of Surface Roughness and Hydrophobic Modification on
Silica Nanoparticles for Enhanced Therapeutic Protein Delivery
119
mode of AFM in air using Al-coated silicon probe with tip radius of 2 nm
(NANOSENSORS™, Switzerland).
Stability test of silica nanoparticles: Different nanoparticles were dispersed in PBS pH 7.4 at
the concentration of 1mg/ml, shaking at room temperature for 72h. The suspension (3ml)
was picked up every 24 h and then centrifuged at 20000 rpm for 10 minutes. Silica
concentration of different nanoparticles in supernatant was tested by inductively coupled
plasma optical emission spectrometry (ICPOES) using a Vista-PRO instrument (Varian Inc,
Australia). After 72 h, TEM images of different nanoparticles were taken using a JEOL
1010 microscope operated at 100 kV.
6.2.4 Biological experiments
Loading and Release Profile of RNase A by nanoparticles
Different nanoparticles were mixed with RNase A in PBS for 2 h at room temperature. Final
nanoparticle concentration is 10 mg/ml and RNase A concentration is 1 mg/ml. After this
time, the mixtures were centrifuged, and protein adsorption amount was determined using a
NANODROP 1000 spectrophotometer (Thermo Scientific) at 278 nm, based on the original
and residual RNase A concentrations and volumes. ANOVA analysis is processed. The
precipitates (RNase A loaded nanoparticles) were re-suspended in PBS or acetic buffer (pH
4.5) for protein release, shaking at 1000 rpm at 25 °C using an eppendorf MixMate (Thermo
Fisher Schentific). Certain volume of the mixtures was picked up at different time points and
the same volume of solvent was refilled until 72 h. In addition, RNase A release was also
investigate in DMEM, under static condition at 37 °C for 4h. The released RNase A content
was stained with BCA reagents (Thermal Scientific, Life Sciences, Life Technologies) and
the absorbance was collected at 562 nm using a Synergy HT Microplate Reader.
Detection of cellular uptake performance
To quantitatively compare the cellular uptake of different nanoparticles, 3×10⁵ MCF-7 and
SCC-25 cells were seeded in 6-well plates. RNase A was incubated with nanoparticles for
protein adsorption for 2h, and then the complexes were incubated with cells in serum free
medium for 4h. RNas A on ntr t on s 2 μ /mL, and nanoparticle concentration is 50
μ /mL for each sample. Afterwards, cells were harvested by the digestion of trypsin/EDTA
mixture, and cell number for each sample was recorded. After centrifugation, cell pellets
were washed twice followed by supersonic schizolysis in DI water. Supernatants (containing
cell components) were removed, and aqueous NaOH solution (1 M) was used to allow the

Chapter 6 Understanding the Contribution of Surface Roughness and Hydrophobic Modification on
Silica Nanoparticles for Enhanced Therapeutic Protein Delivery
120
dissolution of silica components with ultrasound. The silicon concentrations were detected
by inductively coupled plasma optical emission spectrometry (ICPOES) using a Vista-PRO
instrument (Varian Inc, Australia), and the mass of silica per cell was then calculated.
ANOVA analysis is processed.
Toxicity assay
Both MCF-7 and SCC-25 cells were seeded in 24-well plates at a density of 3×10⁴ cells per
well and incubated for 24 h. To evaluate the cytotoxicity of different pure nanoparticles,
they were made in a 2-fold serial dilution in culture medium, and incubated for 24 h, 48 h
and 72 h. For the measurements of cell growth inhibition caused by RNase A, protein was
first mixed with SSN, C18-SSN and C18-RSN in PBS for 2 h at 4 °C to achieve a saturated
adsorption. Then the complexes were suspended in serum containing culture medium. The
final RNase A on ntr t on s 2 μ /mL, nd n nop rt l on ntr t on s 50 μ /mL. After
24, 48h and 72 h, culture medium from each sample was collected, and cells were harvested
by incubating with trypsin/EDTA mixture. Detached cells were then re-suspended in the
medium previously collected from the samples. Dead cells were marked with trypan blue
reagent in a 1:1 ratio, and cell viability was recorded by counting live and dead cells.
TEM study on nanoparticle-cell interaction
MCF-7 cells were seeded in 3-cm petri-dishes at a cell number of 3×10⁵ for 24 h, and they
were incubated with a suspension of nanoparticle (SSN, RSN, C18-SSN and C18-RSN) at
t on ntr t on o 50 μ /mL for another 24 hours. Then cells were first fixed with 2.5%
glutaraldehyde at room temperature for 30min, and post-fixed in 1% osmium tetraoxide in
microwave condition. After that, cells were embedded into 2% agarose gel cube, followed
by dehydration in acetone of increasing concentration (50%, 70%, 90%, 100% and 100%) in
microwave condition. The dehydrated cell cubes were embedded in Epon resin, and
solidified in 60°C for 2 days. Microtome (Leica, EM UC6) was then used to cut the
embedded cell-resin cube into ultra-thin slices (70–90 nm in thickness). Samples were
mounted on form-bar coated copper grids and double stained with 2% aqueous uranyl
acetate and commercial lead citrate aqueous solution. TEM images were taken using a JEOL
1010 microscope operated at 80 kV.
6.3 Results and discussion
Preparation of nanoparticles
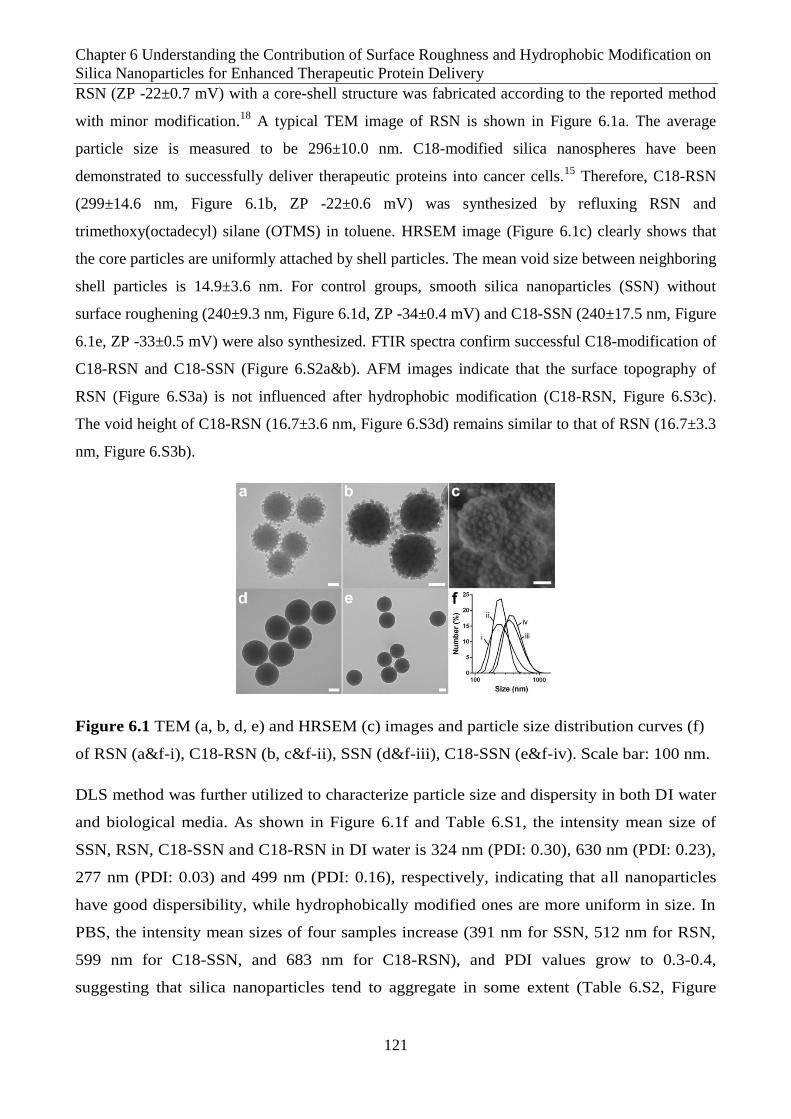
Chapter 6 Understanding the Contribution of Surface Roughness and Hydrophobic Modification on
Silica Nanoparticles for Enhanced Therapeutic Protein Delivery
121
RSN (ZP -22±0.7 mV) with a core-shell structure was fabricated according to the reported method
with minor modification.18
A typical TEM image of RSN is shown in Figure 6.1a. The average
particle size is measured to be 296±10.0 nm. C18-modified silica nanospheres have been
demonstrated to successfully deliver therapeutic proteins into cancer cells.15
Therefore, C18-RSN
(299±14.6 nm, Figure 6.1b, ZP -22±0.6 mV) was synthesized by refluxing RSN and
trimethoxy(octadecyl) silane (OTMS) in toluene. HRSEM image (Figure 6.1c) clearly shows that
the core particles are uniformly attached by shell particles. The mean void size between neighboring
shell particles is 14.9±3.6 nm. For control groups, smooth silica nanoparticles (SSN) without
surface roughening (240±9.3 nm, Figure 6.1d, ZP -34±0.4 mV) and C18-SSN (240±17.5 nm, Figure
6.1e, ZP -33±0.5 mV) were also synthesized. FTIR spectra confirm successful C18-modification of
C18-RSN and C18-SSN (Figure 6.S2a&b). AFM images indicate that the surface topography of
RSN (Figure 6.S3a) is not influenced after hydrophobic modification (C18-RSN, Figure 6.S3c).
The void height of C18-RSN (16.7±3.6 nm, Figure 6.S3d) remains similar to that of RSN (16.7±3.3
nm, Figure 6.S3b).
Figure 6.1 TEM (a, b, d, e) and HRSEM (c) images and particle size distribution curves (f)
of RSN (a&f-i), C18-RSN (b, c&f-ii), SSN (d&f-iii), C18-SSN (e&f-iv). Scale bar: 100 nm.
DLS method was further utilized to characterize particle size and dispersity in both DI water
and biological media. As shown in Figure 6.1f and Table 6.S1, the intensity mean size of
SSN, RSN, C18-SSN and C18-RSN in DI water is 324 nm (PDI: 0.30), 630 nm (PDI: 0.23),
277 nm (PDI: 0.03) and 499 nm (PDI: 0.16), respectively, indicating that all nanoparticles
have good dispersibility, while hydrophobically modified ones are more uniform in size. In
PBS, the intensity mean sizes of four samples increase (391 nm for SSN, 512 nm for RSN,
599 nm for C18-SSN, and 683 nm for C18-RSN), and PDI values grow to 0.3-0.4,
suggesting that silica nanoparticles tend to aggregate in some extent (Table 6.S2, Figure

Chapter 6 Understanding the Contribution of Surface Roughness and Hydrophobic Modification on
Silica Nanoparticles for Enhanced Therapeutic Protein Delivery
122
6.S4), due to the decrease of electrical double layer thickness under the condition of high
ionic strength.22
Nitrogen sorption analysis was used to measure BET specific surface area (SBET) of SSN,
RSN, C18-SSN and C18-RSN, which is 13.0, 26.5, 11.6 and 21.8 m2/g, respectively (Table
6.1). The shell particles with a smaller size on the core particle surface provide higher SBET
to RSN compared to SSN. The slight decrease in surface area after hydrophobic
modification can be attributed to the grafted layer of silica-octadecyl-groups.17
All
nanoparticles showed excellent stability in physiological solution of PBS after shaking for
three days (Figure 6.S5).
RNase A (13.7 kD) with hydrophobic nature and dimensions of 2.2 nm × 2.8 nm × 3.8 nm
was chosen as a model of therapeutic protein.23
The isoelectric point of RNase A is 9.3, so
that it can be directly immobilized onto negatively charged silica nanoparticles at pH 7.4 in
PBS.24
FTIR data (Figure 6.S2c&d) demonstrate the successful immobilization of RNase A
molecules on four different silica nanoparticles. As shown in Figure 6.2a, both RSN (16.4
µg/mg) and C18-SSN (9.4 µg/mg) have higher RNase A adsorption capacity compared to
SSN (7.3 µg/mg). The increment of RSN over SSN is much higher than that of C18-SSN
(225% vs 129%), suggesting surface roughness is more effective in the improvement of
RNase A loading than hydrophobic modification. By the combination of surface roughness
and hydrophobic modification, C18-RSN shows the highest adsorption capacity of RNase A
(20.7 µg/mg) among the four samples. A decrease in void height from 16.7±3.6 nm (Figure
6.S3c&d) to 14.8±5.3 nm (Figure 6.S3e&f) is detected after RNase A loading under AFM
characterization, suggesting that protein molecules are entrapped and accumulated into the
voids on C18-RSN.
Compared to SSN, the surface area of RSN increased to 204% (p<0.05), which is slightly
lower than the increase of RNase A adsorption (to 225%, see also Table 6.1). RNase A
adsorption capacity per unit surface area (RNase A adsorption density, mg/m2) is calculated
(Table 6.S3), dividing the adsorption capacity by SBET. It can be seen that the rough surface
also enhances protein adsorption density (to 109%), which can be explained by regional
protein aggregation in void spaces of rough surface.25
Therefore, the improvement of RNase
A adsorption caused by surface roughness is resulted from the increase of both surface area
and in-void protein adsorption.

Chapter 6 Understanding the Contribution of Surface Roughness and Hydrophobic Modification on
Silica Nanoparticles for Enhanced Therapeutic Protein Delivery
123
Figure 6.2 (a) RNase A adsorption and (b) release profiles of SSN, RSN, C18-SSN and C18-RSN.
Data represent mean ± SD.
Hydrophobic modification improves protein adsorption by the dehydration around C18-
groups, resulting in the reduction of Gibbs energy and the enhancement of spontaneous
RNase A adsorption.24, 26
C18-RSN with 82% surface areas of RSN promotes stronger
RNase A adsorption to 126% (p<0.05). This enhancement is consistent with that of smooth
nanoparticles, where C18-SSN having 89% surface areas of SSN enables RNase A
adsorption to 129% (p<0.05). Therefore, the improvement of RNase A adsorption caused by
hydrophobic modification is limited compared to the role of surface roughness.
It should be noted that C18-RSN increases RNase A loading amount to 220% (p<0.05) and
284% (p<0.05), compared to C18-SSN and SSN, highly beyond their corresponding surface
area enlargement of 188% and 168%, respectively. This can be explained by the
significantly increased RNase A adsorption density of 117% and 170%, due to the densified
C18-groups on C18-RSN surface (2.42 µmol/m2), compared to C18-SSN (1.61 µmol/m
2,
Table 6.S3), respectively, implying stronger interaction with RNase A molecules.
Noticeably, although stronger negative charges on C18-SSN and SSN (Table 6.S1) are
beneficial for RNase A adsorption, C18-SSN and SSN show much lower loading capacity
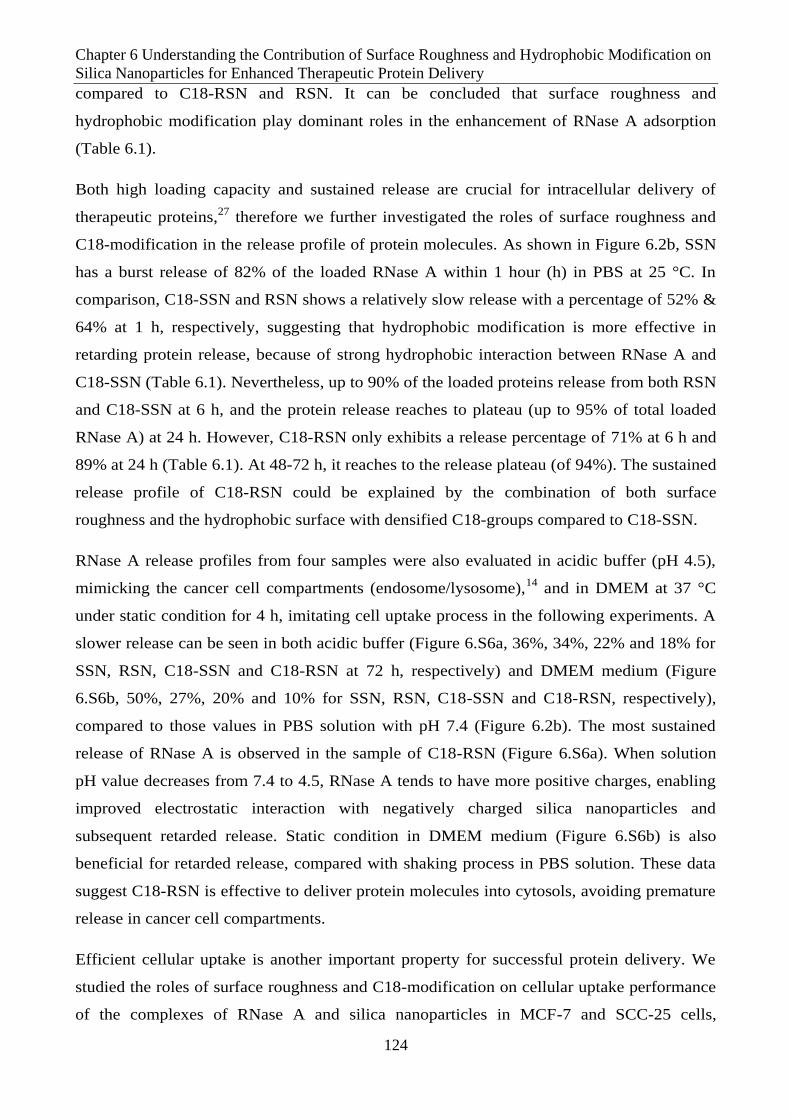
Chapter 6 Understanding the Contribution of Surface Roughness and Hydrophobic Modification on
Silica Nanoparticles for Enhanced Therapeutic Protein Delivery
124
compared to C18-RSN and RSN. It can be concluded that surface roughness and
hydrophobic modification play dominant roles in the enhancement of RNase A adsorption
(Table 6.1).
Both high loading capacity and sustained release are crucial for intracellular delivery of
therapeutic proteins,27
therefore we further investigated the roles of surface roughness and
C18-modification in the release profile of protein molecules. As shown in Figure 6.2b, SSN
has a burst release of 82% of the loaded RNase A within 1 hour (h) in PBS at 25 °C. In
comparison, C18-SSN and RSN shows a relatively slow release with a percentage of 52% &
64% at 1 h, respectively, suggesting that hydrophobic modification is more effective in
retarding protein release, because of strong hydrophobic interaction between RNase A and
C18-SSN (Table 6.1). Nevertheless, up to 90% of the loaded proteins release from both RSN
and C18-SSN at 6 h, and the protein release reaches to plateau (up to 95% of total loaded
RNase A) at 24 h. However, C18-RSN only exhibits a release percentage of 71% at 6 h and
89% at 24 h (Table 6.1). At 48-72 h, it reaches to the release plateau (of 94%). The sustained
release profile of C18-RSN could be explained by the combination of both surface
roughness and the hydrophobic surface with densified C18-groups compared to C18-SSN.
RNase A release profiles from four samples were also evaluated in acidic buffer (pH 4.5),
mimicking the cancer cell compartments (endosome/lysosome),14
and in DMEM at 37 °C
under static condition for 4 h, imitating cell uptake process in the following experiments. A
slower release can be seen in both acidic buffer (Figure 6.S6a, 36%, 34%, 22% and 18% for
SSN, RSN, C18-SSN and C18-RSN at 72 h, respectively) and DMEM medium (Figure
6.S6b, 50%, 27%, 20% and 10% for SSN, RSN, C18-SSN and C18-RSN, respectively),
compared to those values in PBS solution with pH 7.4 (Figure 6.2b). The most sustained
release of RNase A is observed in the sample of C18-RSN (Figure 6.S6a). When solution
pH value decreases from 7.4 to 4.5, RNase A tends to have more positive charges, enabling
improved electrostatic interaction with negatively charged silica nanoparticles and
subsequent retarded release. Static condition in DMEM medium (Figure 6.S6b) is also
beneficial for retarded release, compared with shaking process in PBS solution. These data
suggest C18-RSN is effective to deliver protein molecules into cytosols, avoiding premature
release in cancer cell compartments.
Efficient cellular uptake is another important property for successful protein delivery. We
studied the roles of surface roughness and C18-modification on cellular uptake performance
of the complexes of RNase A and silica nanoparticles in MCF-7 and SCC-25 cells,

Chapter 6 Understanding the Contribution of Surface Roughness and Hydrophobic Modification on
Silica Nanoparticles for Enhanced Therapeutic Protein Delivery
125
measured by ICPOES. In both cell lines (Figure 6.3), RSN/ RNase A and C18-SSN/ RNase
A show a higher cellular uptake performance than SSN/ RNase A, suggesting that both
surface roughness and hydrophobic modification could enhance cellular uptake,
independently. Noticeably, in MCF-7 cells, RSN/RNase A (10.8 pg silica/cell) shows better
performance than C18-SSN/RNase A (8.2 pg silica/cell). However, this difference trend is
reversed and C18-SSN/ RNase A (9.0 pg silica/cell) is taken up more than RSN/ RNase A
(7.6 pg silica/cell) in SCC-25 cells. Therefore, the influence of surface roughness and
hydrophobic modification on cellular uptake performance is cell type-dependent. In
addition, C18-RSN/RNase A exhibits the best cellular uptake performance of 14.8 pg
silica/cell in MCF-7 and 10.4 pg silica/cell in SCC-25, which is almost 3 (p<0.05) and 2
(p<0.05) times of SSN/RNase A (5.5 and 5.6 pg silica/cell), respectively. These significant
improvements of C18-RSN in cellular uptake are also attributed to the contribution of both
surface roughness and hydrophobic modification.
Figure 6.3 Cellular uptake performance of RNase A loaded nanoparticles in (a) MCF-7 and
(b) SCC-25 cells, measured by ICPOES. Cells only were used as a control group. Data
represent mean ± SD.
The endocytic pathway is the major cell uptake mechanism of silica nanoparticles with the
sizes from several nanometers to hundreds of nanometers.28
After taken up by cells, the
internalized protein-nanoparticle complexes tend to be entrapped in endosome/lysosomes,
followed by protein degradation by enzymes.14, 29
Therefore, it is very important to facilitate
efficient endo/lysosomal escape (EE/LE) to ensure cytosolic delivery of the therapeutics.
The EE/LE performance of SSN, RSN, C18-SSN and C18-RSN was evaluated by TEM
(Figure 6.4), which show nanoparticle distributions on outer surface of cell membranes
(CM, white arrows), in cytoplasm (C), electron-lucent endosomes (E) or electron-dense
lysosomes (L) of MCF-7 cells after 24 h incubation with nanoparticles. Both SSN (Figure

Chapter 6 Understanding the Contribution of Surface Roughness and Hydrophobic Modification on
Silica Nanoparticles for Enhanced Therapeutic Protein Delivery
126
6.4a) and RSN (Figure 6.4b) are generally localized in endosome/lysosomes (black arrow),
indicating inefficient EE/LE. On the contrary, the majority of C18-SSNs (Figure 6.4c) and
C18-RSNs (Figure 6.4c) are found distributed in cytoplasm (black dash arrow). The
disrupted membranes of endosome/lysosomes (Figure 6.4c &d, black arrowhead) indicate
successful release of the enclosed C18-SSNs and C18-RSNs into cytosols, with the help of
hydrophobic modification.16
Therefore, hydrophobic modification plays the dominant role in
EE/LE.
Figure 6.4 Typical TEM images of ultra-thin sections of MCF-7 cells incubated with (a)
SSN, (b) RSN, (c) C18-SSN and (d) C18-RSN for 24 h. White arrow indicates cell
membrane (CM), black arrow indicates nanoparticles entrapped in endosome (E) or
lysosome (L), black arrowhead shows locally disrupted membrane of endosomes, black dash
arrow indicates nanoparticles distributed in cytoplasm (C). "N" refers to nucleus. Scale bar:
100 nm.
The contribution of surface roughness, hydrophobic modification and their combination on
protein loading capacity, sustained release, cellular uptake and endosome escape
performance is summarized in Table 6.1. Both surface roughness and hydrophobic
modification can enhance RNase A adsorption compared to the smooth particle, while the
contribution from surface roughness is more important. The combination of surface
roughening and hydrophobic modification (C18-RSN) thus significantly increase the RNase
A loading capacity compared to SSN (20.7 vs 7.3 mg/g). In terms of protein release, the
hydrophobic modification is more effective compared to rough surface. It is clear only

Chapter 6 Understanding the Contribution of Surface Roughness and Hydrophobic Modification on
Silica Nanoparticles for Enhanced Therapeutic Protein Delivery
127
hydrophobic modification can induce effective endo/lysosomal escape, independent of
smooth or rough silica surface. Moreover, different cell types have varied sensitivity to
surface roughness and hydrophobic modification for cellular uptake performance. MCF-7
cells internalized higher amount of the nanoparticles with a rough surface, while more
hydrophobically modified nanoparticles have been taken up into SCC-25 cells. However, it
is evident both functionalization increases the cellular uptake of silica nanoparticles
although their individual contribution is cell type-dependent. Collectively, silica
nanoparticles with both rough surface and hydrophobic modification are desired nano-
carriers for the cellular delivery of proteins.
Table 6.1 Summary of the contribution of surface roughness and hydrophobic modification
SBETa
(m2/g)
Adsb
(µg/mg)
Desc(%) CU (pg /cell)
d
eEE/
LE 1h 24h MCF-7 SCC-25
SSN 13.0 7.3 82 97 5.5±0.5 5.6±0.6 -
RSN 26.5 16.4 64 95 10.8±0.2 7.6±1.9 -
C18-SSN 11.6 9.4 52 93 8.2±0.7 9.0±0.2 +
C18-RSN 21.8 20.7 36 89 14.8±2.1 10.4±0.4 +
Note: a: surface area; b: adsorption capacity of RNase A; c: RNase A desorption percentage;
d: cellular uptake of silica amount per cell; e: qualitative endo/lysosomal escape (EE/LE)
performance, where "-" represents inefficient escape, "+" represents efficient escape.
It has been reported the delivery of RNase A into cytosols will degrade mRNA and tRNA
and inhibit protein synthesis, thus strongly influence cell functions and cause deleterious
effects on cell viability.4 Therefore, we evaluated the cytotoxicity of RNase A delivered by
different silica nanoparticles to MCF-7 and SCC-25 cells. C18-SSN and C18-RSN were
mixed with excessive RNase A to achieve saturated adsorption for intracellular delivery, and
SSN was used as a control group. The total protein concentration in each well is 2 µg/mL
and the nanoparticle concentration is 50 µg/mL, which is much lower than that in the
literature report (800 µg/mL).16
The toxicity of SSN, C18-SSN and C18-RSN is mild to
either MCF-7 or SCC-25 cells at a concentration of 50 µg/mL (Figure 6.S7). As shown in
Figure 6.5, free RNase A cannot significantly impact cell viability in both cell lines at all-
time points of 24, 48, 72 h, because naked protein cannot enter cells. As expected, C18-
SSN/ RNase A and C18-RSN/ RNase A exhibit evident reduction of cell survival rate in a
time-dependent manner. C18-RSN/ RNase A inhibits the viability of MCF-7 and SCC-25

Chapter 6 Understanding the Contribution of Surface Roughness and Hydrophobic Modification on
Silica Nanoparticles for Enhanced Therapeutic Protein Delivery
128
cells from 76%/69% at 24 h to 44%/50% at 48 h and finally to 25%/24% at 72 h,
respectively. This effect is stronger than C18-SSN/ RNase A (from 85%/92% at 24 h to
67%/75% at 48 h and finally to 45%/53% at 72 h). In contrast, SSN/RNase A causes little
inhibition to cell viability in both MCF-7 (75%) and SCC-25 (79%) cells even after 72 h
incubation, because pure silica nanospheres (SSN and RSN) cannot achieve effective
endo/lysosomal escape30
as demonstrated in Figure 6.4.
Figure 6.5 Cell viability of (a) MCF-7 and (b) SCC-25 cells treated with RNase A at a dosage of 2
μ /mL after 24, 48, and 72 h incubation. Data represent mean ± SD.
6.4 Conclusion
In summary, we have systematically studied the contribution of surface roughness and
hydrophobic modification on silica nanoparticles for protein (RNase A) delivery in different
aspects of protein loading capacity, release behavior, cellular update and endosome escape
performance. Both surface roughness and hydrophobic modification demonstrate improved
RNase A adsorption, sustained release and cellular uptake performance. However, surface
roughness plays more important role in RNase A adsorption enhancement and hydrophobic
modification has stronger influence on sustained release. The contribution difference of two
structural parameters in enhanced cell uptake efficiency is cell-type dependent. Only

Chapter 6 Understanding the Contribution of Surface Roughness and Hydrophobic Modification on
Silica Nanoparticles for Enhanced Therapeutic Protein Delivery
129
hydrophobic modification demonstrates contribution to endo/lysosomal escape. Therefore,
the combination of surface roughening and hydrophobic modification demonstrates
enhanced therapeutic RNase A delivery, leading to significant cell growth inhibition in
cancer cells of MCF-7 and SCC-25. Our work provides understanding of the importance of
surface roughness and modification in the design of promising nano-carriers with enhanced
delivery efficacy.
6.5 References
1 S. D. Putney and P. A. Burke, Nat. Biotechnol., 1998, 16, 153-157.
2 C. H. Lee, T. S. Lin and C. Y. Mou, Nano Today, 2009, 4, 165-179.
3 G. Storm, F. Koppenhagen, A. Heeremans, M. Vingerhoeds, M. C. Woodle and D. J. A.
Crommelin, J. Control. Release, 1995, 36, 19-24.
4 S. Martins, B. Sarmento, D. C. Ferreira and E. B. Souto, Int. J. Nanomed., 2007, 2, 595-607.
5 M. R. Islam, Y. F. Gao, X. Li and M. J. Serpe, J. Mater. Chem. B, 2014, 2, 2444-2451.
6 W. Y. Kim, J. T. Xiao and E. L. Chaikof, Langmuir, 2011, 27, 14329-14334.
7 H. K. Bayele, C. Ramaswamy, A. F. Wilderspin, K. S. Srai, I. Toth and A. T. Florence, J
Pharm Sci-Us, 2006, 95, 1227-1237.
8 S. Martin-Ortigosa, D. J. Peterson, J. S. Valenstein, V. S. Y. Lin, B. G. Trewyn, L. A. Lyznik
and K. Wang, Plant Physiol., 2014, 164, 537-547.
9 J. S. Lim, K. Lee, J. N. Choi, Y. K. Hwang, M. Y. Yun, H. J. Kim, Y. S. Won, S. J. Kim, H.
Kwon and S. Huh, Nanotechnology, 2012, 23, 085101.
10 Y. Z. Huang, F. Q. Yu, Y. S. Park, J. X. Wang, M. C. Shin, H. S. Chung and V. C. Yang,
Biomaterials, 2010, 31, 9086-9091.
11 C. Argyo, V. Weiss, C. Brauchle and T. Bein, Chem Mater, 2014, 26, 435-451.
12 I. I. Slowing, B. G. Trewyn and V. S. Y. Lin, J. Am. Chem. Soc., 2007, 129, 8845-8849.
13 K. E. Sapsford, W. R. Algar, L. Berti, K. B. Gemmill, B. J. Casey, E. Oh, M. H. Stewart
and I. L. Medintz, Chem Rev, 2013, 113, 1904-2074.
14 A. K. Varkouhi, M. Scholte, G. Storm and H. J. Haisma, J. Control. Release, 2011, 151,
220-228.
15 S. Frokjaer and D. E. Otzen, Nat. Rev. Drug. Discov, 2005, 4, 298-306.
16 S. S. Bale, S. J. Kwon, D. A. Shah, A. Banerjee, J. S. Dordick and R. S. Kane, Acs Nano,
2010, 4, 1493-1500.
17 J. Zhang, S. Karmakar, M. H. Yu, N. Mitter, J. Zou and C. Z. Yu, Small, 2014, 10, 5068-
5076.

Chapter 6 Understanding the Contribution of Surface Roughness and Hydrophobic Modification on
Silica Nanoparticles for Enhanced Therapeutic Protein Delivery
130
18 Y. T. Niu, M. H. Yu, S. B. Hartono, J. Yang, H. Y. Xu, H. W. Zhang, J. Zhang, J. Zou, A.
Dexter, W. Y. Gu and C. Z. Yu, Adv. Mater, 2013, 25, 6233-6237.
19 C. LoPresti, M. Massignani, C. Fernyhough, A. Blanazs, A. J. Ryan, J. Madsen, N. J.
Warren, S. P. Armes, A. L. Lewis, S. Chirasatitsin, A. J. Engler and G. Battaglia, Acs Nano,
2011, 5, 1775-1784.
20 W. Stöber, A. Fink and E. Bohn, J. Colloid Interface. Sci., 1968, 26, 62-69.
21 S. Asahina, S. Uno, M. Suga, S. M. Stevens, M. Klingstedt, Y. Okano, M. Kudo, F. Schüth,
M. W. Anderson, T. Adschiri and O. Terasaki, Micropor. Mesopor. Mat, 2011, 146, 11-17.
22 H. Ohshima, in Electrical Phenomena at Interfaces and Biointerfaces, John Wiley & Sons,
Inc., 2012, pp. 27-34.
23 A. Wlodawer and L. Sjolin, P. Natl. Acad. Sci-Biol, 1981, 78, 2853-2855.
24 W. Norde, Macromol Symp, 1996, 103, 5-18.
25 P. E. Scopelliti, A. Borgonovo, M. Indrieri, L. Giorgetti, G. Bongiorno, R. Carbone, A.
Podesta and P. Milani, Plos One, 2010, 5, e11862.
26 M. Holmberg and X. L. Hou, Langmuir, 2009, 25, 2081-2089.
27 J. P. Yang, F. Zhang, W. Li, D. Gu, D. K. Shen, J. W. Fan, W. X. Zhang and D. Y. Zhao,
Chem Commun, 2014, 50, 713-715.
28 Ling Hu, Zhengwei Mao, Yuying Zhang and C. Gao, J. Nanosci. Lett., 2011, 1, 1-16.
29 M. Dominska and D. M. Dykxhoorn, J. Cell Sci., 2010, 123, 1183-1189.
30 I. Slowing, B. G. Trewyn and V. S. Y. Lin, J. Am. Chem. Soc., 2006, 128, 14792-14793.
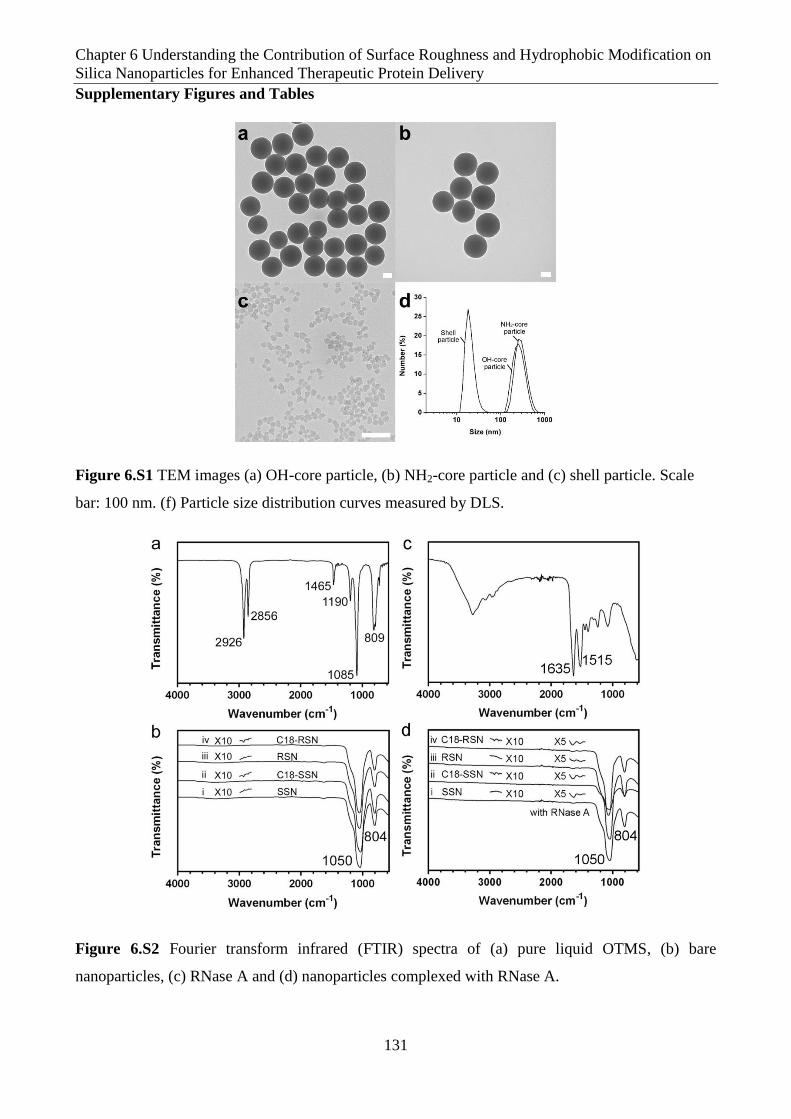
Chapter 6 Understanding the Contribution of Surface Roughness and Hydrophobic Modification on
Silica Nanoparticles for Enhanced Therapeutic Protein Delivery
131
Supplementary Figures and Tables
Figure 6.S1 TEM images (a) OH-core particle, (b) NH2-core particle and (c) shell particle. Scale
bar: 100 nm. (f) Particle size distribution curves measured by DLS.
Figure 6.S2 Fourier transform infrared (FTIR) spectra of (a) pure liquid OTMS, (b) bare
nanoparticles, (c) RNase A and (d) nanoparticles complexed with RNase A.

Chapter 6 Understanding the Contribution of Surface Roughness and Hydrophobic Modification on
Silica Nanoparticles for Enhanced Therapeutic Protein Delivery
132
The nanoparticles with and without modification of octadecyl group was characterized by FTIR
technique. Figure S2a shows the FTIR spectrum of pure liquid OTMS, in which the characteristic
peaks at 809, 1085, 1190, 1465, 2856 and 2926 cm-1
n ttr ut d to ν(S -O), ν(C-O)+ ν(C-C),
ρ(CH3), δ(C-H) 1 and symmetric and anti-symmetric -CH2- stretching,2, 3 respectively. The spectra
of SSN (Figure S2b i), C18-SSN (Figure S2b ii), RSN (Figure S2b iii) and C18-RSN (Figure S2b
iv) show the same characteristic bands at 804 cm-1
and broad band peaked at 1050 cm-1
, which
indicate -Si-O-Si- bonding.4 In the spectra of hydrophobic modified silica nanoparticles (Figure S2b
ii & iv), besides the characteristic peaks of silica, two extra peaks at 2858 and 2929 cm-1
can be
observed, which are assigned to symmetric and anti-symmetric -CH2- stretching, respectively,
indicating the successful attachment of octadecyl-groups.5
Figure S2c exhibits the FTIR spectrum of RNase A. The characteristic amide I band centered at
1635 cm-1
is mainly attributed to C꞊O str t n v r t on and the amide II band centered at 1515
cm-1
can be assigned to in-plane N-H bending and C-N stretching.6, 7
After RNase A adsorption
onto silica nanoparticles, the two characteristic peaks of RNase A at 1635 and 1515 cm-1
can be
clearly observed (Figure S2d). SSN (Figure S2d i) and RSN (Figure S2d iii) also show
characteristic peaks of silica, while C18-SSN (Figure S2d ii) and C18-RSN (Figure S2d iv) show
additional characteristic peaks of silica and octadecyl-groups. These results suggest RNase A
molecules have been successfully loaded onto the four samples.

Chapter 6 Understanding the Contribution of Surface Roughness and Hydrophobic Modification on
Silica Nanoparticles for Enhanced Therapeutic Protein Delivery
133
Figure 6.S3 (a, c, e) AFM images and (b, d, f) void height profiles of ( & ) RSN, ( & d) C18-
RSN nd ( & ) C18-RSN + RN s A, generated by drawing a typical cross-sectional line on the
top region, Scale bar: 100 nm. The average height values are measured and calculated by recording
20 data. Data represent mean ± SD.

Chapter 6 Understanding the Contribution of Surface Roughness and Hydrophobic Modification on
Silica Nanoparticles for Enhanced Therapeutic Protein Delivery
134
Figure 6.S4 Particle size distribution curves of (a) SSN, (b) C18-SSN, (c) RSN and (d) C18-RSN.
Figure 6.S5 Silica dissolution of different nanoparticles, tested by (a) ICPOES and TEM images of
(b) SSN, (c) C18-SSN, (d) RSN and (e) C18-RSN, after shaking in PBS for 3 days. Scale bar: 100
nm.
SSN, RSN, C18-SSN and C18-RSN show good stability in PBS with silica dissolution percentages
less than 10% after 3 days (Figure S5a). Slight increases in the silica dissolution percentage are
observed in four samples as shaking time increases. After 3 days, RSN and C18-RSN exhibit
relatively higher silica dissolution percentages (7.6% and 4.1%), compared to SSN and C18-SSN
(6.4% and 3.1%), respectively. This can be explained by the larger surface area of rough
nanoparticles, which facilitates quicker interaction with medium and subsequent silica dissolution.

Chapter 6 Understanding the Contribution of Surface Roughness and Hydrophobic Modification on
Silica Nanoparticles for Enhanced Therapeutic Protein Delivery
135
In addition, the hydrophobic layer has an obvious protection effect to reduce silica dissolution. The
stability of nanoparticles was further confirmed by TEM images, where the surface morphologies of
both smooth (Figure S5b&c) and rough nanoparticles (Figure S5d&e) were not significantly
affected after shaking in PBS for 3 days.
Figure 6.S6 RNase A release profiles of SSN, RSN, C18-SSN and C18-RSN at (a) acidic condition
(pH 4.5) and (b) in DMEM under static condition at 37 °C for 4 h. Data represent mean±SD.

Chapter 6 Understanding the Contribution of Surface Roughness and Hydrophobic Modification on
Silica Nanoparticles for Enhanced Therapeutic Protein Delivery
136
Figure 6.S7 The evaluation of toxicity from pure nanoparticles (a,c,e) in MCF-7 cells and (b,d,f) in
SCC-25 cells, at 24 h, 48 h and 72 h, respectively. Data represent mean ± SD.

Chapter 6 Understanding the Contribution of Surface Roughness and Hydrophobic Modification on
Silica Nanoparticles for Enhanced Therapeutic Protein Delivery
137
Table 6.S1 S z nd ζ pot nt l r t r z t ons o n nop rt l s.
Sample ID
Size
PDIc ζ-potential
TEMa DLS
b
Shell particle 20±2.4 34±0.6 0.07±0.01 -42±8.3
OH-core particle 232±9.6 281±10.4 0.13±0.03 -24±1.3
NH2-core particle 235±10.9 328±11.5 0.24±0.09 +38±0.9
SSN 240±9.3 324±10.3 0.30±0.07 -34±0.4
C18-SSN 240±17.5 277±7.0 0.03±0.03 -33±0.5
RSN 296±10.0 630±44.3 0.23±0.01 -22±0.7
C18-RSN 299±14.6 499±42.6 0.16±0.01 -22±0.6
aMean size±SD of shell/core particles by recording 50 data from TEM images.
bIntensity mean size
±SD of shell/core particles by DLS method. cPolydispersity index.
Table 6.S2 DLS size measurements in PBS.
Sample ID Sizea PDI
b
SSN 391±68.1 0.40±0.05
C18-SSN 599±111.3 0.31±0.01
RSN 512±158.2 0.43±0.01
C18-RSN 683±12.9 0.30±0.01
aIntensity mean size ±SD of shell/core particles by DLS method.
bPolydispersity index.

Chapter 6 Understanding the Contribution of Surface Roughness and Hydrophobic Modification on
Silica Nanoparticles for Enhanced Therapeutic Protein Delivery
138
Table 6.S3 RNase A adsorption density and C18-modification characterization of nanoparticles
aRNase A adsorption density
bCarbon percentage tested by Elemental Analysis.
cOctadecyl-group (C18) -group density: C18-group amount per unit surface area. The molecular
weight of C18 (MWC18) is 236g/mol. SSN nd RSN w r us d s ontrol roup.
C 8 density
(1)
References
1 M. I. Tejedor-Tejedor, L. Paredes and M. A. Anderson, Chem. Mater, 1998, 10, 3410-3421.
2 H. Huang, Y. Ji, Z. Qiao, C. Zhao, J. He and H. Zhang, Microporous Mesoporous Mater, 2010,
2010, 7.
3 K. Kailasam and K. Muller, J. Chromatogr A, 2008, 1191, 125-135.
4 D. B. Mahadik, A. V. Rao, A. P. Rao, P. B. Wagh, S. V. Ingale and S. C. Gupta, J. Colloid Interf
Sci, 2011, 356, 298-302.
5 J. Zhang, S. Karmakar, M. H. Yu, N. Mitter, J. Zou and C. Z. Yu, Small, 2014, 10, 5068-5076.
S mpl ID
DRNase Aa
(m /m2)
C r on (%)
DC18
(µmol/m2)
SSN 0.56 0.011 --
C18-SSN 0.81 0.453 1.61
RSN 0.61 0.025 --
C18-RSN 0.95 1.274 2.42

Chapter 7 Conclusions and Outlook
139
Chapter 7
Conclusions and outlook
7.1 Conclusions
The understanding of structure–function relationship of natural particulates provides a useful guide
for the design of new nanocarriers. Currently, many research attempts have focused on the synthesis
of new drug delivery systems by mimicking the advantages of natural particulates, for example,
enveloped viruses, which have evolved sophisticated mechanisms that make use of or shield off
cellular signalling and transport pathways to traffic within host cells and deliver cargos into the
appropriate subcellular compartment.1 In this thesis, virus-mimicking silica nanoparticles with well-
controlled surface roughness have been synthesized. The understanding of the structure-function
relationship for the significantly enhanced intracellular cargo delivery, including genetic molecules
and therapeutic proteins, has been revealed. In addition, the mechanism for the synthesis of stable
core-shell structure has been investigated, providing guidelines for the design of effective non-viral
carriers. The following conclusions can be drawn based on the studies in this thesis.
1. A virus-mimicking silica nanoparticle (VMSN) for enhanced gene delivery has been developed.
It possesses a core-shell structure, where small shell particles (~13 nm) were studded onto large
core particles (~211 nm), forming a rough morphology. The increase in nanoscale surface
roughness can promote adsorption, while reducing the leakage of genetic molecules, including cy3-
oligoDNAs and siRNAs. Cellular uptake of VMSN was also improved, thus cargo delivery
performance was significantly enhanced. Importantly, the advantages from nanoscale surface
roughness were confirmed generalizable, regardless of surface functionality (amine-groups or PEI-
modification) and cell types (HeLa or KHOS cells). Moreover, using VMSN as the nanocarrier to
deliver PLK1-siRNA into KHOS cells, cell growth inhibition by knocking down PLK1 gene was
significantly enhanced, compared to smooth nanoparticles and a commercial transfection reagent
(OligofectamineTM
). (Relevant content: Chapter 4)
2. Following the intracellular delivery of genetic molecules, in Chapter 5, therapeutic protein
delivery performance using rough silica nanoparticles (RSNs) as the nanocarriers, with
systematically controlled surface morphologies, have been investigated. RSNs with a fixed core

Chapter 7 Conclusions and Outlook
140
particle of ~211 nm and different shell particles, from ~13 nm to ~98 nm, were fabricated by the
"neck-enhancing" approach, and the surface roughness was correlated to the core-to-shell size ratios
from 16.2:1 to 2.2:1. In comparison to the method detailed in Chapter 4 and other reported methods,
rough morphologies of different RSNs can be stably maintained by a bigger "neck" between shell
and core particles, which extended the synthesis limitation of core-to-shell ratio of larger than 5.6:1.
The increase of shell particle size from ~13 nm to ~98 nm, enlarged interspacing distance between
neighbouring shell particles from ~7 to ~38 nm, and protein loading capacity of RSNs was also
found interspacing distance-dependent. Proteins with a suitable molecule size were favourably
absorbed onto one of the RSNs. The optimal interspacing distance of RSNs for high protein loading
capacity was 7, 21 and 38 nm for cytochrome c (~3 nm), IgG-fragment (IgG-F, domain antibody,
~10 nm) and non-specific rabbit IgG antibody (IgG-A, ~20 nm), respectively. Moreover, the
hydrophobically modified RSNs (C18-RSNs) were confirmed effective nanocarriers. The C18-RSN
with an interspacing distance of ~38 nm facilitated the intracellular delivery of therapeutic anti-
pAkt antibody (an IgG type antibody), causing enhanced cell growth inhibition to MCF-7 cells,
compared to literature reports.
3. After understanding the influence of surface morphology on protein adsorption behaviour, we
further quantitatively investigated the individual and combined contribution of surface roughness
and surface modification (e.g., C18-modification) for the improvement of protein therapeutics. To
achieve this goal, four samples, smooth silica nanoparticle (SSN), rough silica nanoparticle (RSN),
C18-SSN and C18-RSN, have been fabricated, where the core size was ~232 nm and shell diameter
was ~20 nm, suitable for the entrapment of ribonuclease A (RNase A, ~3 nm). Both surface
roughening and hydrophobic modification enhance RNase A adsorption capacity, while the
contribution from surface roughness was more dominant. Hydrophobic modification had a stronger
effect to retard RNase A release. The contribution difference to enhance cellular uptake was cell
type-dependent. Importantly, only hydrophobic modification facilitated endo/lysosomal escape.
Collectively, C18-RSN showed the best performance in RNase A delivery, causing significant cell
viability reduction in both human breast cancer (MCF-7) and SCC-25 cell lines, compared to other
nanoparticles in this study. (Relevant content: Chapter 6)
In summary, rough silica nanoparticles bio-inspired by the nanoscale structure of enveloped viruses
are promising nanocarriers for intracellular delivery of either genetic molecules or therapeutic
proteins, regardless of surface chemistry and cell types. The surface roughness allows the
entrapment of biomolecules in the valley or void space between neighbouring shell particles,
improving adsorption capacity and retarding release r. In addition, cellular uptake performance has
also been increased. Taking these advantages, the delivery performance of therapeutic agents has

Chapter 7 Conclusions and Outlook
141
been significantly enhanced, compared to silica spheres with smooth surfaces. Our research
suggests a new parameter for the rational design and synthesis of efficient drug delivery carriers for
highly improved disease therapy.
7.2 Recommendations for future work
The following recommendations are made for the future work.
1. To extend the advantages of rough nanoparticles, porous structures should be included for
enhanced drug loading or co-delivery of therapeutic molecules.
2. To further imitate the features of enveloped viruses with specific infectivity, targeting moieties,
for example, F3 peptide2 or Tat peptide,3 are needed to be conjugated onto the rough surface for
targeted and enhanced delivery.
3. Apart from replacing solid shell or core particle by porous ones, the particles can pre-encapsulate
drug molecules inside for multi-functional applications. For example, the photosensitiser of silicon
phthalocyanine dichloride (SiPCCl2) can be encapsulated in solid silica nanoparticle of 20-50 nm,4
and they can be used as shell particles for combined chemotherapy and photodynamic therapy.
4. In addition to silica materials, other materials can be introduced into the system. Calcium
phosphate nanoparticles (CaP-NPs) are good candidates. For example, the siRNA encapsulated and
lipid-coated CaP-NPs of ~30 nm can be used as shell particles for multifunctional drug delivery.5
7.3 References
1 Glover, D. J. Artificial Viruses: Exploiting Viral Trafficking for Therapeutics. Infect. Disord.
Drug Targets, 2012, 12, (1), 68-80.
2 Christian, S.; Pilch, J.; Akerman, M. E.; Porkka, K.; Laakkonen, P.; Ruoslahti, E. Nucleolin
expressed at the cell surface is a marker of endothelial cells in angiogenic blood vessels. J. Cell.
Biol., 2003, 163, (4), 871-878.
3 Pan, L.; He, Q.; Liu, J.; Chen, Y.; Ma, M.; Zhang, L.; Shi, J. Nuclear-Targeted Drug Delivery of
TAT Peptide-Conjugated Monodisperse Mesoporous Silica Nanoparticles. J. Am. Chem. Soc.,
2012, 134, (13), 5722-5725.
4 Roy, I.; Ohulchanskyy, T. Y.; Bharali, D. J.; Pudavar, H. E.; Mistretta, R. A.; Kaur, N.; Prasad, P.
N. Optical tracking of organically modified silica nanoparticles as DNA carriers: A nonviral,
nanomedicine approach for gene delivery. P. Natl. Acad. Sci. USA., 2005, 102, (2), 279-284.
5 Li, J.; Yang, Y.; Huang, L. Calcium phosphate nanoparticles with an asymmetric lipid bilayer
coating for siRNA delivery to the tumor. J. Control Release, 2012, 158, (1), 108-114.