biochemistry 2 lab packet spring...
TRANSCRIPT

1
BIOCHEMISTRY 2
LAB PACKET
SPRING 07

2

Lab Schedule
WEEK DATE TOPIC 1,2 4/11, Sec A,B
4/18, Sec C,D
Isolation and Quantification of Cholesterol Pre-lab assignment: Have a pictorial flow chart of the procedure completed.
3,4 4/25, Sec A,B 5/2 Sec C,D
Aspartame, The Study of Dipeptide Bonds
5,6 5/9 Sec A,B 5/16 Sec C,D
Restriction Enzyme
7.8 5/23, Sec A,B 5/30, Sec C,D
Bacterial Transformation
9,10 6/6, Sec A,B 6/13 Sec C,D
Finish Bacterial Transformation
3

4

Spectrophotometric Determination of Cholesterol in Food
Cholesterol is small molecule, one of the steroids. It is essential to life. It has also been responsible for 17 Nobel Prizes, countless pages of reports in scientific journals and the popular press, and mounting anxiety on the part of health-conscious people. Why?
The human body contains about 100 g of cholesterol. Most of this is incorporated in the membranes from which cells are constructed and is an indispensable component of them. The insulating layers of myelin wound around neurons are especially rich in cholesterol. In far smaller quantities, but no less important, cholesterol is starting ingredient for the synthesis of the steroid hormones:
• Progesterone • Estrogen • Glucocorticoids (e.g., cortisol) • Androgens (e.g., testosterone) • Mineralcorticoids (e.g., aldosterone)
Cholesterol is also the precursor from which the body synthesizes vitamin D.
One of the major uses of cholesterol is the synthesis of bile acids. These are synthesized in the liver from cholesterol and are secreted in the bile. They are essential for the absorption of fat from the contents of the intestine. A clue to the importance of cholesterol is that most of the bile acids are not lost in the feces but are reabsorbed from the lower intestine and recycled to the liver. There is some loss, however, and to compensate for this and to meet other needs, the liver synthesizes some 1500–2000 mg of new cholesterol each day. It synthesizes cholesterol from the products of fat metabolism.
There is also an unceasing transport of cholesterol in the blood between the liver and all the other tissues. Most of this cholesterol travels complexed with fatty acids and protein in the form of low density lipoproteins (LDLs). Cells that need cholesterol trap and ingest LDLs by receptor-mediated endocytocis.
Cholesterol can also create problems. Cholesterol in the bile can crystallize to form gall stones that may block the bile ducts. Cholesterol is also strongly implicated in the development of atherosclerosis: fatty deposits (plaques) that form on the inside of blood vessels and predispose
5

6
to heart attacks. The major culprit seems to be levels of LDLs that are in excess of the body's needs.
The level of cholesterol in the blood is measured in milligrams per deciliter (mg/dl), which is equivalent to parts per 100,000. The levels range from less than 50 in infants to an average of 215 in adults. For those of us in the normal range, approximately two-thirds of our cholesterol is transported as LDLs. Most of the rest is carried by so-called high density lipoproteins (HDL).
Because of their relationship to cardiovascular disease, the analysis of serum lipids has become an important health measure.
The table shows the range of typical values as well as the values above (or below) which the subject may be at increased risk of developing atherosclerosis.
LIPID Typical values (mg/dl) Desirable (mg/dl)
Cholesterol (total) 170–210 <200 LDL cholesterol 60–140 <130 HDL cholesterol 35–85 >40 Triglycerides 40–150 <135
• Total cholesterol is the sum of o HDL cholesterol o LDL cholesterol and o 20% of the triglyceride value
• Note that o high LDL values are bad, but o high HDL values are good (because HDL cholesterol transports cholesterol from
the tissues back to the liver where it is secreted in the bile). • Using the various values, one can calculate a
cardiac risk ratio = total cholesterol divided by HDL cholesterol • A cardiac risk ratio greater than 7 is considered a warning.
In May of 2001, a panel of the National Institutes of Health recommended a more aggressive attack on reducing cholesterol levels in the U.S. population. In addition to a better diet and more exercise, they urged that many more people at risk of developing heart disease be put on cholesterol-lowering drugs.
There are several types:
• drugs that interfere with the ability of the liver to synthesize cholesterol by blocking the action of the enzyme HMG-CoA reductase. These are the "statins", e.g., lovastatin (Mevacor®), pravastatin (Pravachol®), atorvastatin (Lipitor®).
• insoluble powders ("colestipol", "cholestyramine") that bind to bile acids in the intestine so that instead of being reabsorbed they are eliminated in the feces. In compensation, the

liver increases its consumption of blood-borne cholesterol. The main drawback to these drugs is that they are gritty powders and must be consumed in rather large amounts.
• Nicotinic acid (niacin); • "fibric acids" such as gemfibrozil and clofibrate.
Although drugs that lowering cholesterol are readily available by prescription, adjusting diets to minimize high cholesterol food and incorporating exercise in ones daily regiment are the first steps in controlling serum cholesterol.
In this experiment, cholesterol will be determined spectrophotometrically after its extraction from food samples. The cholesterol is reacted with acidic FeCl3 which forms a colored solution. The more concentrated the solution, the darker the color becomes. The darker solution absorbs more light or transmits less light through the solution. The percent transmission of the standard cholesterol solutions is measured by the Spec 20. You will convert % transmission to absorbance mathematically using the formula,
A= - log (T/100).
A standard curve of cholesterol concentration vs. absorbance is plotted as shown in the example below.
Standard curvey = 0.3165x
0
0.1
0.2
0.3
0.4
0.5
0.6
0.7
0 0.5 1 1.5 2 2.
cholesterol in ug/mL
abso
rban
ce
5
The slope of the line is determined. Using the slope formula of the standard curve, the concentrations (x) of the samples are calculated.
7

8
Experiment Precautions: Wear Goggles!
• Do not use open flames in the lab! • Always keep solutions lidded because many of the solutions used in these experiments
are highly volatile. This will prevent accumulation of toxic and/or highly flammable vapors in the lab.
• The ferric chloride reagent is dissolved in concentrated phosphoric and sulfuric acids. Wear gloves and dispense the reagent on trays sprinkled with sodium bicarbonate. Immediately rinse with cold water if you get the reagent on your skin.
Materials: 1. Micropipettes (20 µl) and tips. 2. Hexane:isopropanol (3:2 vol/vol) made and kept on ice bath before Lipid Extraction. 3. Cold mortars and pestles. 4. Absolute ethanol. 6.Cholesterol Stock Solution: 0.1 mg/ml absolute ethanol. 7. Acid-ferric chloride reagent: 80 ml of 2.5% FeCl3 in concentrated H3PO4 to which 920 ml of conc H2SO4 are added. Procedure Part A Lipids can be extracted from intact cells by grinding in relatively, nonpolar, organic solvents (hexane-isopropanol). The tissue is re-extracted several times and tissue debris is removed by centrifugation. 1. Each group will be given a sample to extract (liver, egg yolks, pork rinds, shrimp and cheese). Weigh 5.0 g of food sample, record the weight to the nearest 0.01 g, and transfer into a mortar. 2. Add about an equal amount of acid-washed sand and grind with a pestle. 3. In the hood, add 5 ml of hexane-isopropanol (3:2) and grind to a smooth paste; add an additional 5 ml of solvent and continue grinding. 4. Transfer to a centrifuge tube and prepare a balance tube by volume 5. Centrifuge at 10,000 x g for 5 min. Decant the supernatant fluid into another centrifuge tube. 6. Re-extract the pellet from the original extract with 10 ml of hexane-isopropanol (3:2), shake and mix with a vortex mixer. Centrifuge and combine the supernatant fluids. 7. Add 5 ml of 15% Na2SO4 to the combined supernatants and vortex for 1 min. Centrifuge at 10,000 x g for 5 min to separate the phases. 8. Remove the organic (top) layer using a pipette and transfer to a new centrifuge tube. 9. Add the volumes listed below of the extract prepared from Part A into cuvets.
Cuvet 1 20 µl using the micropipet Cuvet 2 0.10 ml (use a 1mL pipet) Cuvet 3 0.50 ml (use a 1mL pipet) 10. Evaporate the solution to a moist dryness in a water bath heated to 60oC. Pipet 2 ml of ethanol into each tube. Mix using the vortex mixer. Cover the test tubes with parafilm and save for Part B #2.

9
Part B Determination of Cholesterol Cholesterol concentration can be determined spectrophotometrically. The procedure does use reagents prepared with concentrated acids so be careful and do the pipetting on a tray sprinkled with sodium bicarbonate to neutralize any spills. You will prepare a blank and standard and sample solution in cuvets that fit into the spectrophotometers. 1. Standard Curve. The cholesterol stock solution contains 100ug/mL cholesterol. Prepare the standard solutions by pipeting volumes below into cuvets to achieve the concentrations in a final volume of 2 mL. Two groups can share the standard solutions.
Standard Solution Concentration ug/mL
Volume of Stock Cholesterol
Volume of Ethanol
0 (Blank) 0 2.0 10 .2 1.8 20 .4 1.6 40 .8 1.2 80 1.6 0.4 100 2.0 0
2. Add 2 ml of acid-ferric chloride reagent carefully to the blank and each of the standard solutions and samples from Part A. Cover with parafilm and mix using the vortex mixer CAREFULLY. 4. Incubate for 30 minutes at room temperature. Calibrate the Spec 20 while incubating. Calibration of the Spec 20 1. Turn the spec 20 on to warm up. Set the wavelength to 550 nm (top right knob). 2. For digital Spec 20 only. Set the toggle to Transmission mode. The decimal should be on top of the
letter T. 3. With nothing in the cell holder, adjust to 0.00%T with the left front knob. 4. Place the cuvet with the blank solution into the cell holder. Adjust to 100%T with the right front
knob. 5. You are now ready to take % Transmission readings. Do not adjust the knobs or you will de-calibrate
the machine. 6. Wipe the test tube with Kim-wipe to remove any finger prints. Determine the % transmission of each
of the standard and sample solutions by placing each the cuvets in the sample cell and recording the % transmission.
Data Analysis 1. Convert the % Transmission to Absorbance using the formula below. A = -log (%T/100) 2. Construct a standard curve by graphing Absorbance, A, in the y axis and concentration in the x axis. Use Excel for this.
• Enter concentration on the first column and A, absorbance on the second column.. Highlight the entries.

10
• Click on the “chart icon” • Click on scatter and then middle left icon. Click next and then next again. • Enter information. Click next and finish. • Right click on the line and pick “add trendline”. Click “linear” and ok. • Click options.” Check set intercept = 0” and “Display equation on chart.” Click ok. • The slope equation (y=****x) will appear on the graph. The number,****, is the slope of
the line. 3. Determine the cholesterol samples concentrations using the slope formula and solving for
x. y= ****x Where y is the Absorbance, A;**** is the slope of the line and x is the concentration of the cholesterol sample. Post Lab Questions 1. Why is cholesterol called a non-saponifiable liquid?
2. What was the purpose of preparing three different dilutions of the sample extracts.

11
Data Table 1 Cholesterol Standard
Cholesterol Concentration of Standards, ug/mL
% Transmission %T
Calculated Absorbance A
10
20
40
80
100
Calculations Table 2 Cholesterol Sample Cuvet # % Transmission Calculated
Absorbance Cholesterol Concentration
1
2 3 Calculations

12

ASPARTAME The Study of a Peptide Bond
INTRODUCTION
Aspartame, commonly known as NutraSweet or Equal, is the most popular artificial, low-calorie sweetener available to consumers today. Chemically, aspartame is much different than sucrose, the natural sugar. Its chemical name is L-aspartyl-L-phenyl-alanine methyl ester; it is categorized as a modified dipeptide consisting of two amino acids, aspartic acid and phenylalanine. The phenylalanine possesses a methyl ester group on its carboxyl end.
Weight for weight, aspartame is almost 200 times sweeter than sucrose. Aspartame is used in almost phenomenal amounts, where an estimated 100 million Americans consume the artificial sweetener every year. The use of aspartame does register some drawbacks. Aspartame seems to have a relatively short shelf life since it can be converted to a tasteless cyclic form in solution in as little as 3 months. Aspartame appears to decompose in the presence of heat or strongly acidic/basic media. Aspartame breaks down into its respective amino acids and methanol when it is metabolized in the body. Methanol is normally toxic to the body, but studies has shown that the amount formed is so small that it does not cause any harmful effects. During the process of digestion, aspartame releases aspartic acid. Aspartic acid is an excitatory amino acid that is used by the neurons in the brain as a neurotransmitter. This neurotransmitter may provide resistance to fatigue and thus lead to possessing more endurance. It is a natural and necessary body chemical that is allowed to cross the blood-brain barrier. This barrier is meant to protect the brain from the invasion of harmful chemicals. It, however, cannot discern the right level up for which the natural neurotransmitters should cross the barrier. As a result, these excitatory amino acids cross the barrier in excess; they can build up to undetected toxic levels.
13

Methanol, a highly toxic substance (the adult minimum lethal dose is two teaspoons), accounts for ten percent of aspartame. Once consumed, it is converted to formaldehyde and formic acid. Both of these are deadly toxins. The other component of aspartame is phenylalanine, along with aspartic acid require no digestion and quickly enter the brain and central nervous system at abnormally high levels.
Amino acid Symptoms such as fibromyalgia, spasms, shooting pains, numbness of the legs, cramps, vertigo, seizures, dizziness, headaches, tinnitus (ringing in the ears), joint pain, depression, anxiety attacks, slurred speech, blurred vision and memory loss were sighted in conjunction with aspartame consumption. Other artificial sweeteners available now to consumers include saccharin and sorbitol. Sorbitol is similar in structure to glucose, a monosaccharide. Instead of possessing an aldehyde group in its structure, sorbitol is a polyalcohol. The use of saccharin is hampered by its controversial cancer link. Sorbitol also has its limitations due to the symptoms that can appear with heavy consumption. These include abdominal cramps, intestinal bloating, and diarrhea. Furthermore, unlike its competition, it is NOT non-caloric.
14

The newest artificial sweeteners that are closest to being approved or found some limited approval by the FDA include Sunnette (noncaloric, 200X sweeter than sucrose); Sucrolose (chlorinated sucrose derivative, 600X sweeter than sucrose); and Alitame (amino acid derivative, 2000X sweeter than sucrose.) Experiment One part of the experiment test for the presence of alcohol, one of product of hydrolysis of aspartatme. Remember that the methanol is a product in the hydrolysis of aspartame. The ceric nitrate reagent turns from yellow to reddish orange in the presence of alcohol. The potassium permanganate reagent acts as an oxidizing agent. A positive test form methanol is indicated by a change in color from purple to brown. The second part is the determination of the presence of the other products of aspartame hydrolysis, phenylalanine and aspartic acid by paper chromatography. Chromatography is a technique used widely to purify, to separate or to identify substance. While several types of chromatography are available, the theory behind each type is the same. Chromatography involves two phases; the stationary phase that works to adsorb the substance to some extent, and the moving phase which works to move the substances along the stationary phase. The technique works on the concept that compounds of similar structure or polarity attract and hold together. For example, if the stationary phase is made up of a very polar compound/s, a substance being tested that possesses polar groups will tend to be held to this stationary phase. Polar substances, in this will not be carried will by the moving phase. Non-polar substances, on the other hand, would move easily along a polar stationary. They would not be readily adsorbed by the polar stationary phase. The substances to be tested will be spotted on this plate. The paper will be set in a covered jar that contains a small amount of solvent. This is called the developing chamber. The solvent makes up the moving phase, as it functions to carry the substances up the paper. When the solvent nears the top of the plate, the paper is removed from the jar and the solvent front (the place where the solvent stops) is marked. The spots represent how far the substances traveled and should be marked or circles lightly with a pencil.
15
16
By knowing the distance the solvent moves and the distance that each substance moves, Rf values can be calculated. Rf values have no units and are solvent dependent. Calculate the Rf value of each spot.
Rf = Distance substance traveled Distance solvent traveled
PROCEDURE Part 1 Paper Chromatography
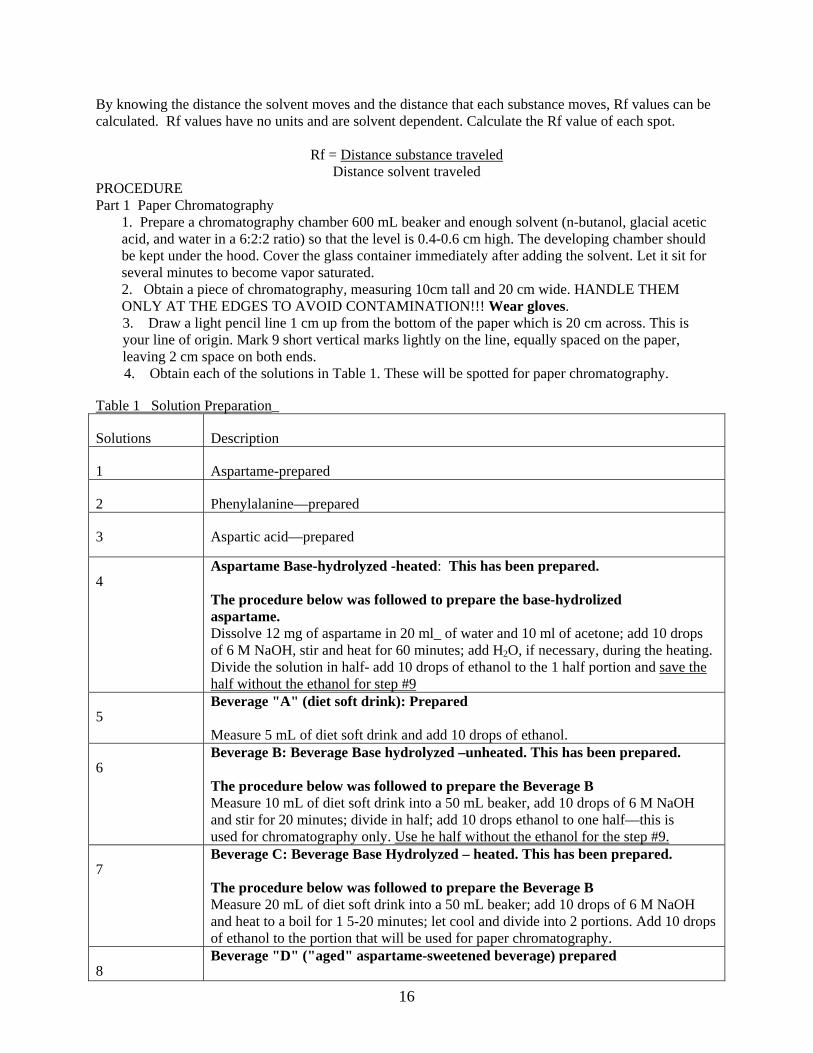
1. Prepare a chromatography chamber 600 mL beaker and enough solvent (n-butanol, glacial acetic acid, and water in a 6:2:2 ratio) so that the level is 0.4-0.6 cm high. The developing chamber should be kept under the hood. Cover the glass container immediately after adding the solvent. Let it sit for several minutes to become vapor saturated. 2. Obtain a piece of chromatography, measuring 10cm tall and 20 cm wide. HANDLE THEM ONLY AT THE EDGES TO AVOID CONTAMINATION!!! Wear gloves. 3. Draw a light pencil line 1 cm up from the bottom of the paper which is 20 cm across. This is your line of origin. Mark 9 short vertical marks lightly on the line, equally spaced on the paper, leaving 2 cm space on both ends. 4. Obtain each of the solutions in Table 1. These will be spotted for paper chromatography.
Table 1 Solution Preparation_
Solutions Description
1 Aspartame-prepared
2 Phenylalanine—prepared
3 Aspartic acid—prepared
4 Aspartame Base-hydrolyzed -heated: This has been prepared. The procedure below was followed to prepare the base-hydrolized aspartame. Dissolve 12 mg of aspartame in 20 ml_ of water and 10 ml of acetone; add 10 drops of 6 M NaOH, stir and heat for 60 minutes; add H2O, if necessary, during the heating. Divide the solution in half- add 10 drops of ethanol to the 1 half portion and save the half without the ethanol for step #9
5 Beverage "A" (diet soft drink): Prepared
Measure 5 mL of diet soft drink and add 10 drops of ethanol.
6 Beverage B: Beverage Base hydrolyzed –unheated. This has been prepared. The procedure below was followed to prepare the Beverage B Measure 10 mL of diet soft drink into a 50 mL beaker, add 10 drops of 6 M NaOH and stir for 20 minutes; divide in half; add 10 drops ethanol to one half—this is used for chromatography only. Use he half without the ethanol for the step #9.
7 Beverage C: Beverage Base Hydrolyzed – heated. This has been prepared. The procedure below was followed to prepare the Beverage B Measure 20 mL of diet soft drink into a 50 mL beaker; add 10 drops of 6 M NaOH and heat to a boil for 1 5-20 minutes; let cool and divide into 2 portions. Add 10 drops of ethanol to the portion that will be used for paper chromatography.
8 Beverage "D" ("aged" aspartame-sweetened beverage) prepared

17
Measure 5 ml and add 10 drops of ethanol.
5. Spot the TLC plates according to Table 2. Make sure that the spots dry before applying more solution. Remember that the beverage and aspartame solutions should contain ethanol to facilitate the spotting procedure. The ethanol-spiked solutions should not be used for the ceric nitrate and potassium permanganate tests.
Table 2 Spotting descriptions____________________________ Spot No. of spotting times Solution Plate #1 #1 2-3 Aspartame (solution #I) #2 2-3 Phenylalanine (solution #2) #3 2-3 Aspartic acid (.solution #3) #4 6 Hvdrolyzed aspartame (solution #4) #5 6 Untreated Beverage "A" (solution #5) #6 6 Unheated base hydrolyzed Beverage "B" (solution #6) #7 6 Heated base hydrolyzed Beverage "C" (solution #7) #8 2-3 Aspartame (solution #1)
#9 6 Aged Beverage "D" (solution #8)
6. Adjust the paper to make a cylinder and staple the end together without overlapping the ends! Make sure that the solvent is below the line of origin. Be careful that the solvent does not cover the 1 cm line. Cover the chamber immediately after the placement and try / not to disturb the chamber. While waiting for the chromatography to complete proceed to Part 2.
7. When the solvent reaches approximately 1-2 cm from the top, remove the plate, MARK THE SOLVENT FRONT, and let the TLC plate dry under the hood.
8. Carefully spray the plate with a ninhydrin (or isatin) solution. Then place the plate in an oven at 100°C for a few minutes. Measure the distance the solvent moved as well as the distances moved by each substance (to the middle of the spots). If more than one spot is seen, measure the distance for each spot. Calculate Rf values. Turn in your chromatograph with your data sheets.
9. Some spot take time to develop. Re-inspect the chromatogram 24 hours after the experiment for more spots.
Part 2 Testing for the presence of alcohol.
Do not use the solutions from Part 1.
1. KMnO4 Test. While the chromatogram is being developed, the oxidation tests can be performed. Using a dropper:
• add 6 drops of fresh aspartame solution to depression 1 in a spot plate, • add 6 drops of heated base hydrolyzed aspartame solution to depression , • add 6 drops of the unheated base-hydrolyzed beverage solution to depression 3. • add 6 drops of a methanol to depression 4. This is your positive control • add 6 drops of distilled water to depression 5 to use as a blank. This is your negative
constrol • add 6 drops of the aged aspartame-sweetened beverage to depression 6
To each of the six solution, 2 drops of KMnO4 reagent and stir. Notice any change in color.

2. Ceric Nitrate Test. Place 2 drops of the ceric nitrate reagent into each of four depressions on a spot plate. To the first of the three, add 5 drops of distilled water.
• The first depression is your negative control • Add 5 drops of the freshly prepared aspartame solution to the second depression. • Add 5 drops of the base- hydrolyzed aspartame to the third area of the spot plate. • To the fourth depression add 5 drops of methanol. Record the observed colors.
18

Post lab questions 1. Show the hydrolysis of aspartame, using structural formula.
a. Name the products that are formed b. Which one of the products can readily undergo oxidation
2. What is the importance of running standard along side with test solutions in chromatography? 3. What does the Rf value show?
19

20
Analysis of Precut Lambda DNA
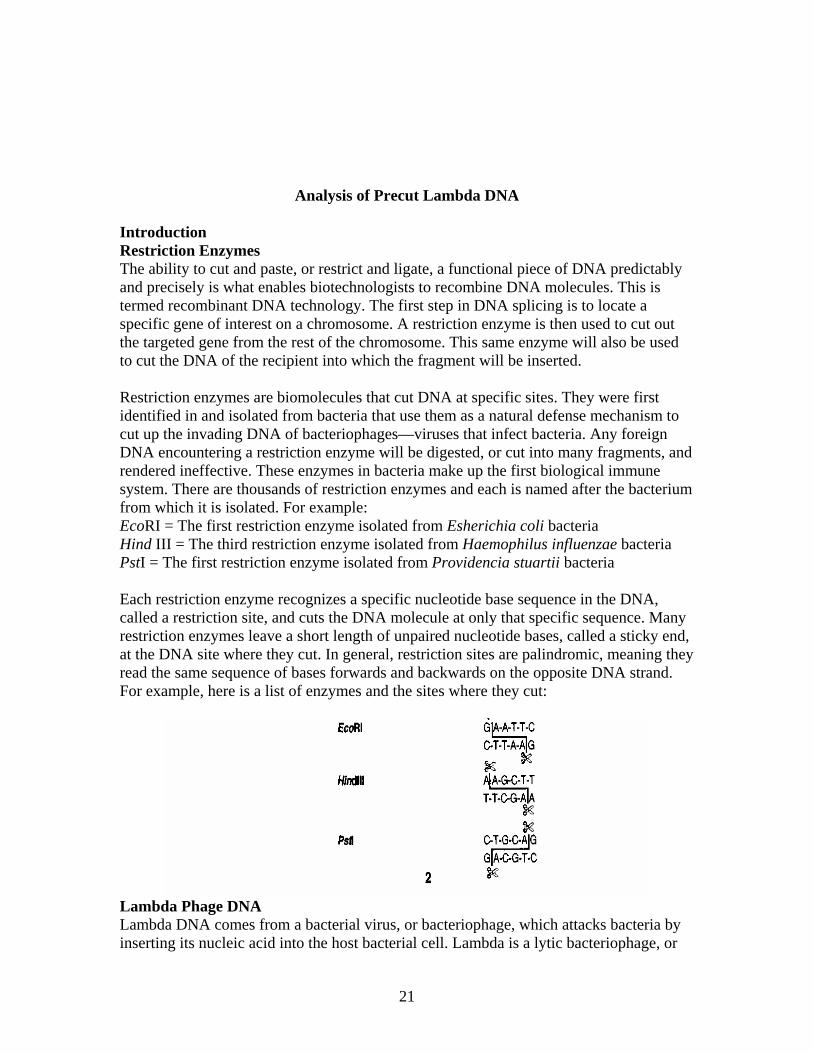
Introduction Restriction Enzymes The ability to cut and paste, or restrict and ligate, a functional piece of DNA predictably and precisely is what enables biotechnologists to recombine DNA molecules. This is termed recombinant DNA technology. The first step in DNA splicing is to locate a specific gene of interest on a chromosome. A restriction enzyme is then used to cut out the targeted gene from the rest of the chromosome. This same enzyme will also be used to cut the DNA of the recipient into which the fragment will be inserted. Restriction enzymes are biomolecules that cut DNA at specific sites. They were first identified in and isolated from bacteria that use them as a natural defense mechanism to cut up the invading DNA of bacteriophages—viruses that infect bacteria. Any foreign DNA encountering a restriction enzyme will be digested, or cut into many fragments, and rendered ineffective. These enzymes in bacteria make up the first biological immune system. There are thousands of restriction enzymes and each is named after the bacterium from which it is isolated. For example: EcoRI = The first restriction enzyme isolated from Esherichia coli bacteria Hind III = The third restriction enzyme isolated from Haemophilus influenzae bacteria PstI = The first restriction enzyme isolated from Providencia stuartii bacteria Each restriction enzyme recognizes a specific nucleotide base sequence in the DNA, called a restriction site, and cuts the DNA molecule at only that specific sequence. Many restriction enzymes leave a short length of unpaired nucleotide bases, called a sticky end, at the DNA site where they cut. In general, restriction sites are palindromic, meaning they read the same sequence of bases forwards and backwards on the opposite DNA strand. For example, here is a list of enzymes and the sites where they cut:
Lambda Phage DNA Lambda DNA comes from a bacterial virus, or bacteriophage, which attacks bacteria by inserting its nucleic acid into the host bacterial cell. Lambda is a lytic bacteriophage, or
21
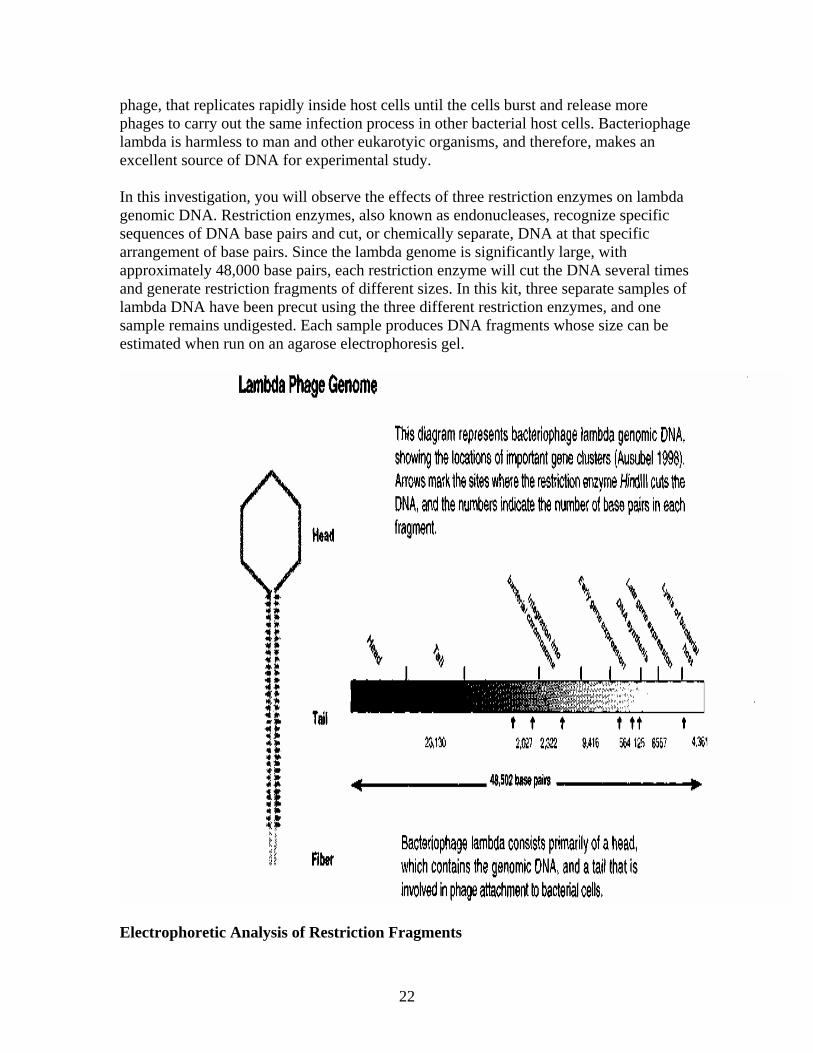
phage, that replicates rapidly inside host cells until the cells burst and release more phages to carry out the same infection process in other bacterial host cells. Bacteriophage lambda is harmless to man and other eukarotyic organisms, and therefore, makes an excellent source of DNA for experimental study. In this investigation, you will observe the effects of three restriction enzymes on lambda genomic DNA. Restriction enzymes, also known as endonucleases, recognize specific sequences of DNA base pairs and cut, or chemically separate, DNA at that specific arrangement of base pairs. Since the lambda genome is significantly large, with approximately 48,000 base pairs, each restriction enzyme will cut the DNA several times and generate restriction fragments of different sizes. In this kit, three separate samples of lambda DNA have been precut using the three different restriction enzymes, and one sample remains undigested. Each sample produces DNA fragments whose size can be estimated when run on an agarose electrophoresis gel.
Electrophoretic Analysis of Restriction Fragments
22

The three-dimensional structure or shape of a restriction enzyme allows it to fit perfectly in the groove formed by the two strands of a DNA molecule. When attached to the DNA, the enzyme slides along the double helix until it recognizes a specific sequence of base pairs, which signals the enzyme to stop sliding. The enzyme then chemically separates, or digests, the DNA molecule at that site—called a restriction site. In this way, a restriction enzyme acts like molecular scissors, making cuts at the specific sequence of base pairs that it recognizes. If a specific restriction site occurs in more than one location on a DNA molecule, a restriction enzyme will make a cut at each of those sites, resulting in multiple fragments of DNA. Therefore, if a given piece of linear DNA is cut with a restriction enzyme whose specific recognition sequence is found at five different locations on the DNA molecule, the result will be six fragments of different lengths. The length of each fragment will depend upon the location of restriction sites on the DNA molecule. A DNA molecule that has been cut with restriction enzymes can be separated using a process known as agarose gel electrophoresis. The term electrophoresis means to carry with electricity. Agarose gel electrophoresis separates DNA fragments by size. DNA fragments are loaded into an agarose gel slab, which is placed into a chamber filled with a conductive buffer solution. A direct current is passed between wire electrodes at each end of the chamber. DNA fragments are negatively charged, and when placed in an electric field will be drawn toward the positive pole, called the anode. The matrix of the agarose gel acts as a molecular sieve, or a matrix of holes, through which smaller DNA fragments can move more easily than larger ones. Therefore, the rate at which a DNA fragment migrates through the gel is inversely proportional to its size in base pairs. Over a period of time smaller DNA fragments will travel farther than larger ones. Fragments of the same size stay together and migrate in single bands of DNA. These bands will be seen in the gel after the DNA is stained. An analogy would be to equate this situation to your classroom in which all the desks have been randomly pushed together. An individual student can wind his/her way through the chair maze quickly and with little difficulty, whereas a string of four students would require more time and have difficulty working their way through the maze of chairs. The result of electrophoresis of the lambda DNA samples digested using three different restriction enzymes is shown in Figure 1. In each case, the same lambda DNA was used. Notice that each restriction enzyme produces a unique banding pattern in each lane. The relative size of fragments contained in each band can be determined by how far each band has traveled from its origin. In this example, the PstI enzyme has produced the smallest fragment, as depicted by the farthest migration.
23

The DNA electrophoresis can be used to determine the approximate sizes of each of your restriction fragments. This can be done by comparing the DNA restriction fragments to the DNA fragments of known sizes, a DNA standard. The method relies on using the lambda Hindlll digest as a DNA standard, or marker. The distance (in mm) that each of your DNA fragments traveled from the well is measured from the bottom of the loading well to the bottom of each DNA band. Since the exact size and position of these fragments are given, they can be used as standard reference points to estimate the size of unknown fragment bands. A standard curve based upon the measurements obtained from the known DNA HindIII ladder is constructed. In the example below, the agarose gel below shows two lanes. A lane is the column of bands below a well. The right lane contains a banding pattern from four fragments of known length, 6,000, 5,000, 3,000, and 1,000 base pairs (bp).
The top band has 6,000 bp, the second has 5000 bp, the third 3000 bp and the lowest
24

band has 1000 bp. The fragments of known size were plotted on semi-log graph paper, producing the standard curve shown below.
The distances migrated by two fragments of unknown length were also marked on the standard curve. • For each fragment, line up a ruler vertically from the distance traveled position on the
horizontal X-axis to the line that you constructed. • From the point where your ruler intersected your line, place the ruler horizontally and
note where it intersects with the vertical Y-axis for fragment size. This will be your determination of the size for that fragment.
Part I Procedure A. Preparation of the electrophoretic chamber: Electrophoretic devices vary a great deal. What follows in steps 1 through 4 are specific instructions for the BRL Model 200 power supply and associated Horizon 58 chamber. 1. A removable chamber acts as a reservoir and is seated inside the Horizon 58 cabinet. Check to see if the chamber is clean. If not, rinse thoroughly with distilled water and return it to the Horizon 58 cabinet. 2. A plastic gel-bed fits into the bottom of the chamber or reservoir. It is rectangular with open ends and a channel to form a gel between 4 and 5 mm deep. 3. Once the bottom 'gel-bed' is in its place, insert two wedge-shaped end-dams on each end of the gel bed. You have now constructed a mold for the casting of your gel. 4. Set the cabinet with the reservoir atop the cabinet housing (Horizon 58) of power supply (Model 200). Do not turn the apparatus on or connect the electrode wires at this time.
25

B. Agar Preparation 1. Weigh 0.30 gram of agar in a 100-mL beaker. 2. Add 30 mL of 1x TAE (Tris-acetate-EDTA) electrophoresis buffer to the agar. 3. Heat the agar mixture in the microwave for at high setting and heat 1 minute at a time
until the agar is completely dissolved. 4. Seal the edges of the bed with agar and let it solidify. 5. Pour the agar solution into the gel-bed while it is still molten (it will solidify when cooled to
about 40°C). Pour the gel to a depth of 3 to 5 mm. (That is usually close to the height of the channel in the BRL model 58 gel-bed.)
6. While the solution is still molten, place the comb in the black end slot. This will cause wells to form and once the gel has set, samples can be loaded. The comb used in this experiment produces 8 wells.
7. Leave the agar solution at room temperature for at least 20 minutes to completely gel. C. Sample Preparation 1. Obtain one of each colored microtube. Each of the color tubes contains the following:
yellow, L = lambda DNA violet, P = PsfI digest green, E = EcoRI digest orange, H = HindIII digest white, S=DNA standard
blue, P = 20 uL buffer for loading practice D. Agarose Gel Electrophoresis 1. Tap the above tubes ently on the benchtop. 2. Add 2 ul of sample loading dye into each tube. Mix the contents by flicking the tube
with your finger. Centrifuge the tubes gently to collect the sample to the bottom of the tube.
3. Heat the samples at 65OC in a waterbath for 5 minutes and then chill on ice. This results in better separation of the bands.
4. Remove the comb and the dams from the agar. Fill the electrophoresis chamber and cover the gel the bottom of the box completely with 1x buffer.
5. Check that the wells of the agarose gels are near the black (-) electrode and the base of the gel is near the red (+) electrode.
6. Practice by loading with 10 uL of the buffer (blue) into wells 7 and 8. 7. Load 10 uL of each sample into separate wells in the gel chamber in the following
order: • Lane 1: L, yellow • Lane 2: P, violet • Lane 3: E, green • Lane 4: H, orange • Lane 5: S, white
8. Place the lid on the electrophoresis chamber carefully. Connect the electrical leads into the power supply, red-to-red and black-to-black.
9. Turn on the power and run the gel at 120 V for until the tracking dye reaches within a 1.5 mm distance from the top of the gel.
26
10. While the electrophoresis is running, start Separation of Hemoglobin and Vitamin B12 by Size Exclusion Chromatography E. Staining and Destaining 1. When the electrophoresis run is complete, turn off the power and remove the top of
the gel box. Carefully remove the gel and tray from the gel box. Be careful—the gel is very slippery. Slide the gel into the staining tray.
2. Add 120 ml of 100x Fast Blast stain to the tray. Stain for 2 to 3 minutes but not more than 3 minutes. Very carefully pour out the stain into a beaker. Transfer the stain into the bottle provided for storage.
3. Transfer the gel into a tray containing 500 mL of clean, warm (44-45 oC) tap water. Move the gels gently in the water once every minute for 5 minutes. Perform a second wash.
4. The bands may appear fuzzy but will develop into sharper bands within 5-15 minutes. 5. Place your gel on a light background and record your results. Part II Data Analysis 1. Measure the distance (in mm) that each of your DNA fragments traveled from the
well measured from the bottom of the loading well to the bottom of each DNA band. Record the data in the data sheet.
2. With a three-cycle, semi-log graph paper provided the fragment size will be on the vertical (Y) axis and the horizontal (X) axis should have your scale for distance traveled through the gel in millimeters. Rescale the axis as needed.
3. Using the fragments from the DNA standard (White S, Lane 5), plot the distance traveled in relationship to fragment size for each fragment. There should be 6 bands for the DNA standard. Connect as many of the points as you can by drawing a straight line through them. This will provide a standard curve with which you will be able to determine the size of your unknown fragments from the other two samples.
4. Determine the sizes of the fragments in your lambda (L), PstI digest (P), and EcoRI digest (E), and Genomic DNA, (G) using the method described on the previous page.
27

28

Electrophoresis Data Measure the distance in millimeters that each fragment traveled from the well and record on the table below. Estimate its size, in base pairs, by comparing it position to the DNA standard.
Largest Frag- ment first
L, Uncut Lamda DNA
P, PstI Restriction digest
EcoRI Restriction digest
HindIII Restricion digest
DNA standard
Distance In mm
Estimated base pairs
Distance In mm
Estimated base pairs
Distance In mm
Estimated base pairs
Distance In mm
Estimated base pairs
Distance In mm
Estimated base pairs
1 (closest to the well)
23,130
2 9,416 3 6,557 4 4,361 5 2,322 6 2,027 7 8 9 10 11 12 13 14
29

30

Bacterial Transformation A study of the living world reveals that all living organisms organize themselves in some unique fashion. A detailed blueprint of this organization is passed on to offspring. Cells are the smallest functional units capable of independent reproduction. Many bacteria, for instance, can survive as single cells. The chemical molecules within each cell are organized to perform in concert.
Cells can be grown in culture and harvested Cells can be gathered from their natural locations and grown inside laboratory containers. Appropriate food and environment must be provided for the cells to grow. Bacteria and yeast are very easy to grow in culture. Cells taken from plants, insects and animals can also be grown, but are more difficult to care for. After growth is complete, cells in culture can be harvested and studied. Cloning When a population of cells is prepared by growth from a single cell, all the cells in the population will be genetically identical. Such a population is called clonal. The process of creating a clonal population is called cloning. The purpose of streaking bacteria on agar is to generate single colonies, each arising from a single cell. Looking inside cells The molecules inside a cell each perform a given function. For instance, DNA molecules store information (like the hard drive in a computer). Proteins are the workhorses of the cell. To study these molecules we prepare a clonal population from a cell type of interest, break open the cells and sort the contents. For instance, it is fairly easy to separate all the proteins from all the DNA molecules. Purifying a single species of protein out of the mixture of proteins found inside a cell type is also possible. Each type of protein has unique physical and chemical properties. These properties allow the separation of protein species based on size, charge or hydrophobicity, for instance.
Special molecules, specialized functions We will take a close look at three very special kinds of molecules found inside cells: DNA, RNA and Proteins. Each of these molecules performs a different function. DNA molecules are like file cabinets in which information is stored. RNA helps to retrieve and execute the instructions, which are stored in DNA. Proteins are designed to perform chemical chores inside (and often outside) the cell.
DNA—The universal template for biological information The master script for each organism is encoded within its deoxyribonucleic acid (DNA). The information within the DNA molecule/s of each cell is sufficient to initiate every function that cell will perform. DNA molecules are very long chains composed of repeating subunits. Each subunit ("nucleotide") contains one of four possible bases protruding from its side: ADENINE ("A") CYTOSINE ("C") THYMINE ("T") GUANINE ("G")
31

Since nucleotides are joined head-to-tail, a long strand of DNA essentially consists of a chemical backbone with bases protruding along its side. The information carried by this molecule is encoded in the sequence of As, Gs, Cs, and Ts along its length. Some further points to note about DNA structure 1. Because the subunits of DNA chains are joined head-to-tail, the sequence is directional "GTCAA". By convention, we write DNA sequence from the free 5' end of the backbone and work our way toward the other free end (3').
i.e. 5'...AACTG...3'
2. The protruding bases along the chain are free form spontaneous bonds with available bases on other DNA strands according to the following rules:
" A" pairs with "T" " C" pairs with "G"
Because of these rules, "A" and "T" are said to be complementary bases; "G" and "C" are also complementary. For two DNA strands to pair up, they must be complementary and run in opposite directions.
i.e. (5'...AGGTC...3') can pair with (5'...GACCT...3'). These two strands have complementary sequences. The double-stranded pair is written as follows:
5'...AGGTC...3' 3'...TCCAG...5'
The above molecule contains five base pairs. Indeed, in nature, DNA almost always occurs in double-stranded form, the two strands containing complementary sequences. 3. DNA molecules are typically thousands, sometimes millions of base pairs long. Sometimes
the two ends of a DNA molecule are joined to form circular DNA. 4. Double-stranded DNA, in its native form, occurs as a coiled spring, or helix. Because it is
two-stranded, it is often referred to as a double helix. The architecture of DNA allows for a very simple strategy during reproduction: The two strands of each DNA molecule unwind and "unzip"; then, each strand allows a new complementary copy of itself to be made by an enzyme called DNA polymerase. This results in two daughter molecules, each double-stranded, and each identical to the parent molecule.
Proteins and RNA are the workhorses of the cell The biochemistry of life requires hundreds of very specific and efficient chemical interactions, all happening simultaneously. The major players in these interactions are short-lived protein and RNA molecules which can work together or independently to serve a variety of functions. Like DNA, RNA and proteins are also long chains of repeating units.
32

RNA RNA (ribonucleic acid), like DNA, consists of four types of building blocks strung together in a chain. It differs from DNA in the following respects: The four bases in RNA are "A", "G", "C", and "U" (uracil); the pairing rules are the same as for DNA except that "A" pairs with "U". Although RNA can pair with complementary RNA or DNA, in cells RNA is usually single-stranded. The sugar in the RNA backbone is ribose, not deoxyribose. RNA molecules are generally short, compared to DNA molecules; this is because each RNA is itself a copy of a short segment from a DNA molecule. The process of copying segments of DNA into RNA is called transcription, and is performed by a protein called RNA polymerase.
Proteins Proteins (more precisely, polypeptides) are also long, chain-like molecules but more structurally diverse than either DNA or RNA. This is because the subunits of proteins called amino acids, come in twenty different types. The exact sequence of amino acids along apolypeptide chain determines how that chain will fold into a compact structure. The precise 3-dimensional features of this structure, in turn, determine its function. What a protein will do depends on the exact sequence of its amino acids. In most cases, a protein will perform a single function. Very diverse functions can be performed by proteins: Some proteins, called enzymes, act as catalysts in chemical reactions; some carry signals from one part of a cell to another—or, in the case of "hormones", from one cell to another; some proteins ("antibodies") have the task of fighting intruders; many become integral parts of the various physical structures inside cells; and still others (regulatory proteins) police various activities within cells so as to keep them within legal limits.
Linear code, three-dimensional consequences DNA is the primary depot for information in living systems. As mentioned, this information is linear i.e. encoded in the sequence of "A", "G", "C", "T" building blocks along the DNA molecule. This linear code can be passed on to offspring—because DNA can make exact copies of itself. Short segments of each DNA molecule are chosen for transcription at any given time. These segments are called genes. The enzyme RNA polymerase copies the entire segment, base by base, assembling an RNA molecule which contains a sequence of "A", "G", "C" and "U" exactly complementary to the DNA sequence of the transcribed gene. In addition to providing a master template for copying RNAs, DNA also contains sequence information which tells the RNA polymerase where to start transcribing a gene (promoter) and where to stop; how many copies it should make and when; and it can even embed certain information within the RNA sequence to determine the longevity and productivity of that RNA. There are three major classes of RNAs copied off DNA templates: messenger RNAs, or mRNAs, which relay the sequence information required for assembling proteins; transfer RNAs, or tRNAs, which work in the assembly line for proteins; and RNAs which perform structural functions. For example, ribosomal RNAs, or rRNAs, help build the scaffolding for ribosomes, the factories where proteins are assembled. mRNAs carry the sequence information for making proteins. Ribosomes read this sequence of
33

nucleotides, by a process called "translation" into a sequence of amino acids. How is this accomplished? There are only four kinds of nucleotides, but twenty kinds of amino acids. During translation, the ribosome reads 3 nucleotides at a time and assigns an amino acid to each successive triplet. Note: Triplets are often referred to as "codons". Each amino acid is then attached to the end of the growing protein chain. There are 64 possible triplets codons. Thus, the linear information residing in DNA is used to assemble a linear sequence of amino acids in a protein. This sequence, in turn, will determine the way that protein will fold into a precise shape with characteristic chemical properties. In summary, the primary transfer of information within cells follows the order:
DNA >>>>RNA>>>>PROTEIN>>>>TRAIT Although the information itself is linear, the implications are 3-dimensional. A fundamental assumption of recombinant DNA technology is that permanent and desirable changes in the functioning of living cells can be accomplished by changing the linear sequence of their DNA.
Genes are discrete files of DNA information A gene is a segment within a DNA molecule singled out for copying into RNA. Directly or indirectly, this RNA will perform a function. It is convenient to think of a gene, therefore, as a unit of function. Many traits, such as bacterial resistance to an antibiotic, are governed by single genes. Several genes acting in concert govern most traits—such as the color of a rose, or the shape of a nose -. Genes can vary in length: Some are only a few hundred base pairs long; some can be tens of thousands of base pairs long. A DNA molecule may carry from a handful to thousands of genes. A cell, in turn, may contain one or several DNA molecules (chromosomes). Thus the number of genes in a cell can vary greatly. E.coli, a bacterium, contains one DNA molecule with about five thousand genes on it. A human cell contains 46 DNA molecules carrying a total of about 100,000 genes. All genes in a given cell are not copied into RNA (i.e. "expressed") at the same time or at the same rate. Thus, when speaking of gene function, one refers to its expression level. This rate can be controlled by the cell, according to predetermined rules, which are themselves written into the DNA. An example: The cells in our bodies (all 100 trillion of them) each contain identical DNA molecules. Yet liver cells, for example, express only those genes required for liver function, whereas skin cells express a quite different subset of genes. DNA can be cut into pieces with restriction enzymes Restriction enzymes are proteins made by bacteria as a defense against foreign, invading DNA (for example, viral DNA). Each restriction enzyme recognizes a unique sequence of typically 4-6 base pairs, and will cut any DNA whenever that sequence occurs. For example, the restriction enzyme BamH I recognizes the sequence (5'..GGATCC..3') and cuts the DNA strand between the two G nucleotides in that sequence. Restriction enzymes will cut DNA from any source, provided the recognition sequence is present.
34

It does not matter if the DNA is of bacterial, plant or human origin.
Pieces of DNA can be joined by DNA ligase DNA ligase is an enzyme that glues pieces of DNA together, provided the ends are compatible. Thus, a piece of human or frog or tomato DNA cut with BamH I can be easily joined to a piece of bacterial DNA also cut with BamH I. This allows the creation of recombinant DNAs i.e. hybrids, created by joining pieces of DNA from two different sources. Genes can be cut out of human DNA, or plant DNA, and placed inside bacteria. For example, the human authentic human insulin.
Plasmids are small circular pieces of DNA Plasmids are small circular DNAs found inside some bacterial cells. They replicate their own DNA by borrowing the cells' polymerases. Thus they can persist indefinitely inside cells without doing very much work of their own. Because of their small size, plasmid DNAs are easy to extract and purify from bacterial cells. When cut with a restriction enzyme, they can be joined to foreign DNAs - from any source - which have been cut with the same enzyme. The resulting hybrid DNAs can be re-introduced into bacterial cells by a procedure called transformation. Now the hybrid plasmids can perpetuate themselves in the bacteria just as before except that the foreign DNA which was joined to it is also being perpetuated. The foreign DNA gets a free ride, so to speak. Every hybrid plasmid now contains a perfect copy of the piece of foreign DNA originally joined to it. We say that foreign piece of DNA has been cloned; the plasmid which carried the foreign DNA is called a cloning vehicle or vector. In addition to their usefulness for cloning foreign genes, plasmids sometimes carry genes of their own. Bacteria die when exposed to antibiotics. However, antibiotic-resistance genes allow bacteria to grow in the presence of an antibiotic such as ampicillin. Such genes are often found on plasmids. When foreign DNA is inserted into such plasmids, and the hybrids introduced into bacterial cells by transformation, it is easy to select those bacteria that have received the plasmid - because they have acquired the ability to grow in the presence of the antibiotic, whereas all other bacterial cells are killed.
Gene Regulation, One Gene, One Protein Our bodies contain thousands of different proteins which perform many different jobs. Digestive enzymes are proteins; some of the hormone signals that run through our bodies and the antibodies protecting us from disease are proteins. The information for assembling a protein is carried in our DNA. The section of DNA which contains the code for making a protein is called a gene. There are over 100,000 genes in the human genome. Each gene codes for a unique protein: one gene-one protein. The gene which makes a digestive enzyme in your mouth is different from one which makes an antibody or the pigments that color your eyes. Organisms regulate expression of their genes and ultimately the amounts and kinds of proteins
35

present within their cells for a myriad of reasons including developmental, cellular specialization and adaptation to the environment. Gene regulation not only allows for adaptation to differing conditions, but also prevents wasteful overproduction of unneeded proteins which would put the organism at a competitive disadvantage. The genes involved in the transport and breakdown (catabolism) of food are good examples of highly regulated genes. For example, the sugar arabinose is both a source of energy and a source of carbon. E. coli bacteria produce three enzymes (proteins) needed to digest arabinose as a food source. The genes which code for these enzymes are not expressed when arabinose is absent, but they are expressed when arabinose is present in their environment. How is this so? Regulation of the expression of proteins often occurs at the level of transcription from DNA into RNA. This regulation takes place at a very specific location on the DNA template, called a promoter, where RNA polymerase sits down on the DNA and begins transcription of the gene. In bacteria, groups of related genes are often clustered together and transcribed into RNA from one promoter. These clusters of genes controlled by a single promoter are called operons. The three genes (araB, am A. and araD) that code for three digestive enzymes involved in the breakdown of arabinose are clustered together in what is known as the arabinose oper-on.3 These three proteins are dependent on initiation of transcription from a single promoter, (PBAD). Transcription of these three genes requires the simultaneous presence of the DNA template (promoter and operon), RNA polymerase, a DNA binding protein called araC and arabinose. araC binds to the DNA at the binding site for the RNA polymerase (the beginning of the arabinose operon). When arabinose is present in the environment, bacteria take it up. Once inside, the arabinose interacts directly with araC which is bound to the DNA. The interaction causes araC to change its shape which in turn promotes (actually helps) the binding of RNA polymerase and the three genes B, A and D, are transcribed. Three enzymes are produced, they do their job, and eventually the arabinose runs out. In the absence of arabinose the araC returns to its original shape and transcription is shut off. The DNA code of the pGLO plasmid has been engineered to incorporate aspects of the arabinose operon. Both the promoter (PBAD) and the araC gene are present. However, the genes which code for arabinose catabolism, araB, A and D, have been replaced by the single gene which codes for the Green Fluorescent Protein (GFP). Therefore, in the presence of arabinose, araC protein promotes the binding of RNA polymerase and GFP is produced. Cells fluoresce a brilliant green color as they produce more and more protein. In the absence of arabinose, araC no longer facilitates the binding of RNA polymerase and the GFP gene is not transcribed. When the GFP protein is not made, bacteria colonies will appear to have a wild type (natural) phenotype - of white colonies with no florescence. This is an excellent example of the central molecular framework of biology in action:
DNA>RNA>PROTEIN>TRAIT.
36

37

Procedure
1. Label one closed micro test tube +DNA and another -DNA. Label both tubes with your group's name. Place them in the foam tube rack.
2. Open the tubes and using a sterile transfer pipette, transfer 250 ul of Transformation Solution (CaCl2).
3. Place the tubes on ice. 4. Use a sterile loop to pick up one single colony of bacteria from your starter plate. Pick up
the + DNA tube and immerse the loop into the Transformation Solution at the bottom of the tube. Spin the loop between your index finger and thumb until the entire colony is dispersed in the Transformation Solution (no floating chunks). Place the tube back in the tube rack in the ice. Using a new sterile loop, repeat for the -DNA tube.
5. Examine the pGLO DNA solution with the UV lamp. Note your observations. Immerse a new sterile loop into the plasmid DNA stock tube. Withdraw a loop full. There should be a film of plasmid solution across the ring. This is similar to seeing a soapy film across a ring for blowing soap bubbles. Mix the loop full into the cell suspension of the +DNA tube. Close the tube and return it to the rack on ice. Also close the -DNA tube. Do not add plasmid DNA to the -DNA tube. Why not?
6. Incubate the tubes on ice for 10 minutes. Make sure to push the tubes all the way down in the rack so the bottom of the tubes sticks out and make contact with the ice.
7. While the tubes are sitting on ice, label your four agar plates on the bottom (not the lid) as follows: Label one LB/amp plate: +DNA; Label the LB/amp/ara plate: + DNA Label the other LB/amp plate: -DNA; Label the LB plate: -DNA.
8. Heat shock. Using the foam rack as a holder, transfer both the (+) and (-) tubes into the water bath set at 42 °C for exactly 50 seconds. Make sure to push the tubes all the way down in the rack so the bottom of the tubes sticks out and make contact with the warm water. When the 50 seconds are done, place both tubes back on ice. For the best transformation results, the change from the ice (0 °C) to 42°C and then back to the ice must be rapid. Incubate tubes on ice for 2 minutes.
9. Remove the rack containing the tubes from the ice and place on the bench top. Open a tube and, using a new sterile pipette, add 250 ul of LB broth to the tube and re-close it. Repeat with a new sterile pipette for the other tube. Incubate the tubes for 10 minutes a room temperature.
10. Tap the closed tubes with your finger to mix. Using a new sterile pipette for each tube, pipette 100 ul of the transformation (+DNA) and control suspensions (-DNA) onto the appropriate plates.
11. Use a new sterile loop for each plate. Spread the suspensions evenly around the surface of the agar by quickly skating the flat surface of a new sterile loop back and forth across the plate surface.
12. Stack up your plates and tape them together. Put your group name and class period on bottom of the stack and place it upside down in the 25°C incubator until the Friday.
13. After the incubation period, check your plate under a uv light. Check for fluorescence.
38

Name:__________________________________________________________ Experiment 5 Data Sheet Analysis of Results
A. Data Collection
Observe the results you obtained from the transformation lab under normal room lighting. Then turn out the lights and hold the ultraviolet light over the plates. 1. Observe and draw what you see on each of the four plates carefully. Put your drawings in
the data table in the column on the right. Record your data to allow.you to compare observations of the "+ DNA" cells with those you record for the non-transformed E. coli. Write down the following observations for each plate.
2. How much bacterial growth do you see on each, relatively speaking?
3. What color are the bacteria?
4. Count how many bacterial colonies there are on each plate (the spots you see).
39
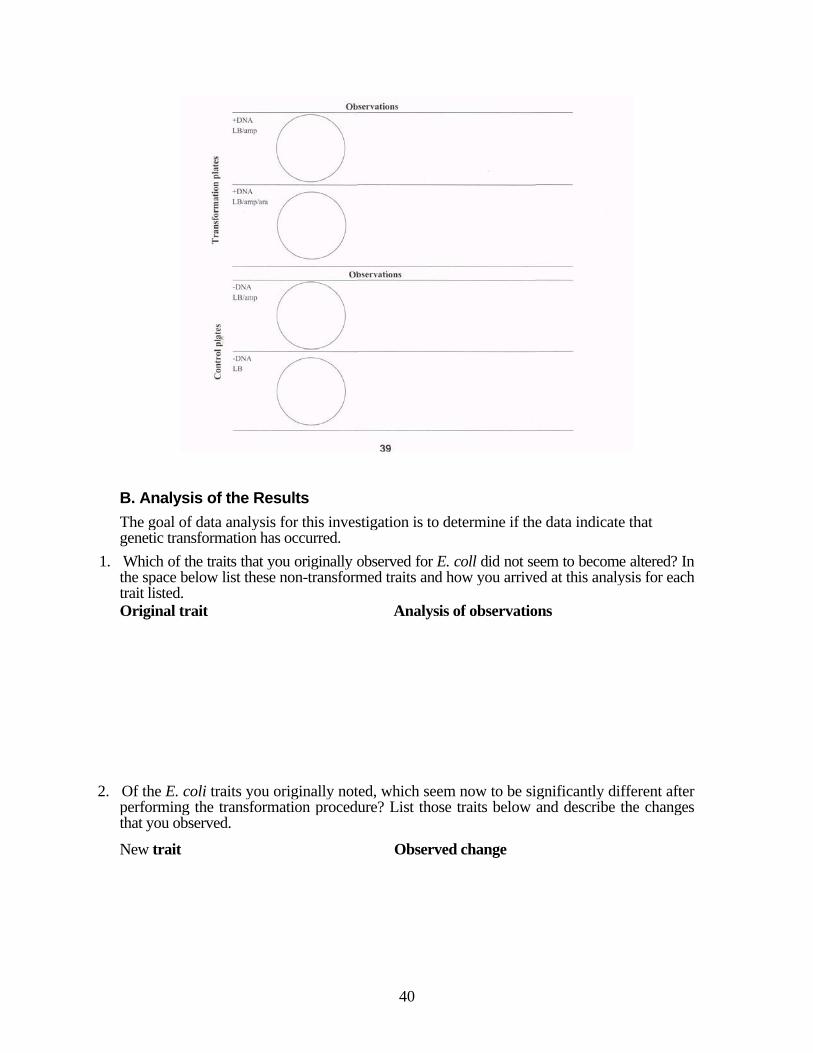
B. Analysis of the Results The goal of data analysis for this investigation is to determine if the data indicate that genetic transformation has occurred.
1. Which of the traits that you originally observed for E. coll did not seem to become altered? In the space below list these non-transformed traits and how you arrived at this analysis for each trait listed. Original trait Analysis of observations
2. Of the E. coli traits you originally noted, which seem now to be significantly different after performing the transformation procedure? List those traits below and describe the changes that you observed.
New trait Observed change
40

3. If the genetically transformed cells have acquired the ability to live in the presence of the antibiotic ampicillin, then what might be inferred about the other genes on the plasmid that you used in your transformation procedure?
4. From the results that you obtained, how could you prove that these changes that occurred were due to the procedure that you performed?
41