bioconjugação oh
DESCRIPTION
Artigo sobre bioconjugação de quantum dots com OHTRANSCRIPT
Journal ofMaterials Chemistry B
PAPER
Publ
ishe
d on
15
Nov
embe
r 20
12. D
ownl
oade
d by
UN
IVE
RSI
D F
ED
ER
AL
DE
UB
ER
LA
ND
IA o
n 30
/05/
2014
15:
01:2
8. View Article Online
View Journal | View Issue
aUniversite de Lorraine and CNRS, Laborato
3349), 1 rue Grandville, BP 20451, 54001 N
univ-lorraine.fr; Tel: +33 3 83 17 50 53bDepartment of Pharmaceutical Technology
Grunwaldzka 6, 60-780 Poznan, PolandcDepartment of Toxicology, Poznan Universi
60-780 Poznan, PolanddInstitut de Science des Materiaux de Mulho
Mulhouse, France
† Electronic supplementary informa10.1039/c2tb00247g
Cite this: J. Mater. Chem. B, 2013, 1,698
Received 12th October 2012Accepted 14th November 2012
DOI: 10.1039/c2tb00247g
www.rsc.org/MaterialsB
698 | J. Mater. Chem. B, 2013, 1, 698
Thioglycerol-capped Mn-doped ZnS quantum dotbioconjugates as efficient two-photon fluorescentnano-probes for bioimaging†
Malgorzata Geszke-Moritz,ab Hanna Piotrowska,c Marek Murias,c Lavinia Balan,d
Michal Moritz,b Janina Lulekb and Raphael Schneider*a
Water-dispersible 1-thioglycerol (TG)-capped Mn-doped ZnS quantum dots were prepared in aqueous
solution using the nucleation-doping strategy. Using 4% Mn relative to Zn and a Zn(OAc)2/Na2S ratio of
0.9, Mn:ZnS nanocrystals with an average diameter of 3.9 � 0.5 nm, with pure Mn2+-related
photoluminescence (PL) at 585 nm, and with a PL quantum yield of 13.2% were obtained. Transmission
electron microscopy, X-ray powder diffraction, electron spin resonance, X-ray photoelectron
spectroscopy, UV-visible spectroscopy and spectrofluorometry have been used to characterize the crystal
structure, the doping status, and the optical properties of the doped-dots. Folic acid (FA) was linked to
TG-capped Mn:ZnS nanocrystals to produce Mn:ZnS@TG-FA nanobioconjugates that were used for
targeted in vitro delivery to a human cancer cell line. Folate receptor mediated cellular uptake of FA-
functionalized dots is proven via confocal and two-photon imaging.
1 Introduction
Semiconductor nanocrystals (quantum dots, QDs) are regardedas excellent uorescent probes due to the size-dependentemission wavelengths and large extinction coefficient which areunavailable from conventional organic uorophores.1–3 Inrecent years, the synthesis of binary metal chalcogenide QDs,especially cadmium chalcogenides CdSe and CdTe, has becomea rapidly growing area in materials chemistry aimed at afundamental understanding for practical applications such aslight-emitting devices, lasers, and as biological uorescencelabels.4–10 Despite the usefulness of Cd-based QDs in numerousapplications, these nanocrystals have an intrinsic limitation;because the photooxidation of QDs can cause the release ofcadmium and that photoexcited QDs can produce reactiveoxygen species (ROS), a doubt has been shed on the futureapplicability of Cd-containing QDs, particularly in view ofenvironmental regulations.11–14
ire Reactions et Genie des Procedes (UPR
ancy, France. E-mail: raphael.schneider@
, Poznan University of Medical Sciences,
ty of Medical Sciences, Dojazd 30 Street,
use LRC 7228, 15 rue Jean Starcky, 68093
tion (ESI) available. See DOI:
–706
In recent developments, doped QDs (d-dots) without heavymetal ions have been explored as alternative emissive materialsin view of their efficient and stable uorescence from the dopedtransition metal ions.15–17 Additionally, d-dots exhibit severaladvantages over QDs, such as longer luminescence excited statelifetime, large Stoke shis leading to avoidance of self-absorp-tion, and high thermal and photochemical stabilities. Amongd-dots, Mn-doped nanocrystals, especially Mn-doped ZnS dots,have been regarded as a promising new class of nanophosphorsand stimulated many efforts of synthesis to investigatethe photoluminescence mechanism of the Mn2+ 4T1 / 6A1
transition.15–17
With the development of a new doping strategy by decou-pling the doping from nucleation and/or growth throughnucleation-doping or growth-doping approaches,18 manyimprovements made in the preparation of high-quality Mn-doped ZnS dots have come from organometallic routes.19–24
Hydrophobic d-dots thus produced could be made water-dispersible by several methods, most of which rely on thesurface-exchange of hydrophobic ligands for hydrophilic ones.Direct synthesis of Mn:ZnS d-dots in water is a promisingalternative route to organometallic reactions and facilitates theuse of the dots in biological systems. The aqueous route toMn:ZnS dots is however not so advanced that the organome-tallic one and only a few papers describe the preparation ofgood quality Mn:ZnS dots with pure dopant emission, generallyusing 3-mercaptopropionic acid as a stabilizer.25–28
Herein, we report a simple aqueous synthetic procedure forMn:ZnS d-dots using 1-thioglycerol (TG) as a capping ligand. Wefound that the use of TG ensured the reproducible access to
This journal is ª The Royal Society of Chemistry 2013
Paper Journal of Materials Chemistry B
Publ
ishe
d on
15
Nov
embe
r 20
12. D
ownl
oade
d by
UN
IVE
RSI
D F
ED
ER
AL
DE
UB
ER
LA
ND
IA o
n 30
/05/
2014
15:
01:2
8.
View Article Online
Mn:ZnS nanocrystals with good photoluminescence quantumyield (up to 13.2%), with pure dopant emission and withoutshell introduction. To the best of our knowledge, there is noreport of such good quality Mn:ZnS d-dot preparation inaqueous solution without shell deposition on the doped core.Furthermore, we have chosen to decorate the surface of the dotswith a tumor-specic ligand, folic acid (FA), by taking advantageof the functional polyhydroxyl shell of Mn:ZnS@TG nano-crystals. Folic acid was used as the targeting ligand for thisstudy because the a-folate receptor (FR) is observed to be up-regulated in various types of human cancers, while it is onlyminimally distributed in normal tissues.29,30 FA, a high affinityligand to FR, is internalized into the cell through the receptormediated endocytosis even when conjugated with a wide varietyof molecules or nanoparticles.28,31,32 The uptake of FA-conju-gated Mn:ZnS d-dots into T47D breast cancer cells wasconrmed by confocal imaging under biphotonic excitation. Inaddition, the toxicity of the dots to human model cells wasassessed.
2 Materials and methods2.1 Materials
Zinc acetate (Zn(OAc)2$2H2O, 99.999%), zinc nitrate(Zn(NO3)2$6H2O, 98%), zinc sulfate (ZnSO4$7H2O, >99%),manganese acetate tetrahydrate (Mn(OAc)2$4H2O, 99%),Na2S$9H2O (98+%), 1-thioglycerol (TG, >97%), folic acid (FA,>97%), 1-ethyl-3-(3-dimethylaminopropyl)carbodiimide hydro-chloride (EDC, >98%), N-hydroxysuccinimide (NHS, 98%), andethanol (HPLC grade) were used as received without additionalpurication. All solutions were prepared using Milli-Q water(18.2 MU cm, Millipore) as the solvent. Sodium borate buffer(0.1 M) was prepared from Na3BO3 and the pH adjusted to 8.8using 0.1 M H3BO3.
2.2 Synthesis of Mn:ZnS@TG d-dots
The preparation of Mn:ZnS@TG dots was adapted from thatpresented by Kim et al.33 Briey, solutions of 1 MZn(OAc)2$2H2O (5 mL), 0.1 M Mn(OAc)2$4H2O (1.5 mL) for aMn2+ doping of 4 at.%, and 1 M TG (20 mL) were mixed, titratedto pH 10.3 with 2 M NaOH and saturated with N2 for 30 min. Anaqueous solution of Na2S$9H2O (1 M, 4.5 mL) was then quicklyinjected in the reaction ask and the mixture reuxed for 20 h.Aer cooling to room temperature, the d-dots were separatedfrom the aqueous solution by the addition of ethanol and bycentrifugation. Aer washing with ethanol and drying in avacuum at room temperature, the nanocrystals could be redis-persed in water.
2.3 Conjugation of Mn:ZnS@TG d-dots with folic acid
TG-cappedMn:ZnS dots (5 mg) were dispersed in 6 mL of boratebuffer to which 160 mL solution of FA in borate buffer(1.025 mmol, 0.45 mg), 160 mL solution of EDC in borate buffer(2.05 mmol, 0.38 mg) and 160 mL of a NHS solution in boratebuffer (2.05 mmol, 0.24 mg) were added. The resulting solutionwas then allowed to stir for 3 h under an inert atmosphere and
This journal is ª The Royal Society of Chemistry 2013
in the dark. Folic acid functionalized d-dots were precipitatedby adding ethanol to the reaction mixture, washed twice withethanol and dried in a vacuum.
2.4 Characterization of d-dots
Transmission electron microscopy (TEM) images were taken byplacing a drop of the particles in water onto a carbon lm-supported copper grid. Samples were studied using a PhilipsCM20 instrument operating at 200 kV equipped with EnergyDispersive X-ray Spectrometer (EDS). The X-ray powder diffrac-tion data were collected from an X'Pert MPD diffractometer(Panalytical AXS) with a goniometer radius 240 mm, xeddivergence slit module (1/2� divergence slit, 0.04 rd Sollers slits)and an X'Celerator as a detector. The powder samples wereplaced on zerobackground quartz sample holders and the XRDpatterns were recorded at room temperature using Cu Ka radi-ation (l ¼ 0.15418 nm). The average particle size was calculatedfrom line broadening using the Topas application (Bruker XAS).We used the Fundamental Parameters (FP) approach34 and theinstrumental broadening was determined using standard LaB6
powder. A VARIAN 720-ES Inductively Coupled Plasma-OpticalEmission Spectrometer (ICP-OES) was used for multielementalanalyses. XPS measurements were performed at a residualpressure of 10�9 mbar, using a KRATOS Axis Ultra electronenergy analyser operating with an Al Kamonochromatic source.
Absorption spectra were recorded on a Perkin-Elmer(Lambda 2) UV-Visible spectrophotometer. Fluorescencespectra were recorded on a uorolog-3 spectrouorimeter F222(Jobin Yvon) using a 450W xenon lamp. The quantum yield (QY)values were determined from the following equation:
QYðsampleÞ ¼�Fsample
Fref
��Aref
Asample
� nsample
2
nref 2
!QYðrefÞ (1)
where F, A and n are the measured uorescence (area under theemission peak), absorbance at the excitation wavelength andrefractive index of the solvent respectively. PL spectra werespectrally corrected and quantum yields were determined rela-tive to Rhodamine 6G in water (QY ¼ 94%).35 Electron spinresonance (ESR) experiments were carried out using a X-BandEMX-plus spectrometer (Bruker Biospin). The samples wereinvestigated at room temperature. 2,2,6,6-Tetramethylpiper-idine-1-oxyl (TEMPO) was used as standard for calibration (g ¼2.0061).
2.5 Cell cultures
T47D breast cancer cells were purchased from the EuropeanCollection of Cell Cultures (ECACC, Porton Down Salisbury UK).Cells were grown in phenol red-free DMEM (Dulbecco's modi-ed Eagle's medium) tissue culture medium, supplementedwith 10% fetal bovine serum (FBS) and 1% penicillin-strepto-mycin under standard conditions at 37 �C and humidiedatmosphere containing 5% CO2 and 95% air. For experiment,logarithmically growing cells (2 � 104 cells) were subcultured in96-well microtiter plates in a volume of 200 mL. Cells wereallowed to attach overnight and were then exposed to various
J. Mater. Chem. B, 2013, 1, 698–706 | 699
Journal of Materials Chemistry B Paper
Publ
ishe
d on
15
Nov
embe
r 20
12. D
ownl
oade
d by
UN
IVE
RSI
D F
ED
ER
AL
DE
UB
ER
LA
ND
IA o
n 30
/05/
2014
15:
01:2
8.
View Article Online
concentrations of dots in different tests. All the materials usedin cell culture experiments were from Sigma-Aldrich, St Louis,MO unless otherwise stated.
2.6 Confocal uorescent microscopy studies
Subconuent stock cultures of T47D cells were trypsinized andseeded in 8-well chamber slides at a density of 4 � 104 cells perwell in growth medium. Cells were allowed to attach overnightbefore treating with Mn:ZnS d-dots. Then, the supernatant wasdiscarded, followed by replacement of media supplementedwith 10% FBS containing Mn:ZnS d-dots (50 mM). Aer 24 h ofincubation at 37 �C, the incubation medium was removed, andmixed solution of Mitochondria Staining Kit and Hoechst 33342was added. Hoechst 33342 is used as DNA stain while Mito-chondria Staining Mix is used for detection of changes in themitochondrial inner-membrane electrochemical potential. TheMitochondrial Staining Kit contains 5,50,6,60-tetrachloro-1,10,3,30-tetraethylbenzimidazolocarbocyanine iodide (JC-1),DMSO, JC-1 Staining Buffer and Valinomycin Ready MadeSolution and was prepared according to the procedure providedby the producer. The mixed solution of two dyes was a combi-nation of 7.5 mL of Hoechst 33342 stock solution (1.5 mg ofHoechst 33342 in 1.5 mL of ultra-pure water) and 1.5 mL ofMitochondria Staining Mix. Aer 10 min of incubation, dyesolution was discarded, the cells were washed with culturemedium and xed using 4% formaldehyde (500 mL per well).Then the cells were washed twice with PBS and mounted withthe mounting medium (Dako Faramount Aqueous MountingMedium). Mn:ZnS d-dots and Hoechst-labeled cells wereimaged on a Leica TCS SP5 confocal microscope equipped witha Ti:Sapphire MaiTai biphotonic laser (Spectra Physics) and aHCX PL APO CS 63� 1.40 OIL objective. An argon laser was usedfor JC-1-labeled cells. Fluorescence of d-dots and Hoechst 33342was detected using excitation 800 nm (effective excitation400 nm) and emission lters 500–650 nm and 400–500 nm,respectively. Fluorescence of JC-1 was detected using excitation488 nm and emission lters 500–550 nm.
2.7 In vitro cytotoxicity
Dose dependent cytotoxicity effects of Mn:ZnS d-dots wereevaluated by using standard MTT and XTT assays.
MTT assay: The MTT assay is a colorimetric assay based onthe ability of viable cells to reduce a soluble yellow tetrazoliumsalt, (3-(4,5-dimethylthiazol-2-yl)-2,5-diphenyltetrazoliumbromide) (MTT), to blue formazan crystals. MTT assay wasemployed to assess the cells viability aer treatment with d-dots. Following the incubation of cells with different types andconcentrations of dots, the supernatant was removed and 200mL of MTT solution (0.5 mg mL�1 in serum-free DMEM) wasadded. Aer 4 h, themediumwas aspirated and the precipitatedformazan was dissolved in 200 mL of dimethylsulfoxide (DMSO).Cell viability was determined by measuring the absorbance at570 nm using a Biotek microplate reader (Biotek InstrumentsUSA). In this study, the nanocrystal concentration required toinhibit cell growth by 50% (IC50) was determined from a plot ofpercent cell viability of control untreated cells versus logarithm
700 | J. Mater. Chem. B, 2013, 1, 698–706
of concentration. The experimental plate included wells withoutcells (in order to exclude direct reaction between MTT and d-dots), wells with cells treated with d-dots and wells of untreatedcells. Each treatment was performed in triplicate.
XTT assay: an XTT cell proliferation assay kit was purchasedfrom Cayman Chemical and used to study cell proliferationaccording to the manufacturer's protocol. The assay is based onthe extracellular reduction of 2,3-bis(2-methoxy-4-nitro-5-sulfo-phenyl)-5-[(phenylamino)-carbonyl]-2H-tetrazolium hydroxide(XTT) by a reduced form of nicotinamide adenine dinucleotide(NADH) produced in the mitochondria via trans-plasmamembrane electron transport and an electron mediator.Reduction of XTT produces a water-soluble formazan whichdissolves directly into the culture medium, eliminating theneed for an additional solubilization step. Immediately beforeuse the Electron Mediator Solution was used to reconstitute theentire vial of XTT Reagent and mixed well.
The experimental plate included wells without cells (in orderto exclude direct reaction between XTT and d-dots), wells withcells treated with d-dots and wells of untreated cells. Eachtreatment was performed in triplicate.
T47D human breast cancer cells were seeded in 96-wellmicrotiter plates at a density of 2 � 104 cells per well and led togrowth for 24 h in a CO2 atmosphere at 37 �C. Aer this timedifferent concentrations (0.08–5 mM) of Mn:ZnS@TG andMn:ZnS@TG-FA d-dots in culture medium were added. Aer72 h, 10 mL of the reconstituted XTT mixture to each well wereadded. The microtiter plates were gently shaken and thenincubated for two hours at 37 �C in a CO2 atmosphere. Theplates were gently shaken for 1 minute and absorption of eachwell was measured using a microplate reader at a wavelength of450 nm.
3 Results and discussion3.1 PL properties of Mn:ZnS d-dots
We rst studied the synthesis and the optical properties of Mn-doped TG-capped ZnS nanocrystals. The synthetic conditionswere found to play a critical role in determining the PL prop-erties of the resulting Mn:ZnS@TG d-dots. First, the reactiontemperature for the synthesis inuences the PL QY of the d-dotsmarkedly. The experimental results showed that to obtainnanocrystals with good optical properties, the optimal reactiontemperature was 100 �C. If the temperature was too low (60 or 80�C), the PL intensity (normalized to the same absorption at theexcitation wavelength) of the Mn2+ emission at ca. 585 nm of theresulting d-dots was signicantly lower than that obtained at100 �C. Too high temperature (130 or 150 �C), obtained byheating the reaction mixture in a sealed Teon tube, led to theformation of poorly water-dispersible and large-sized nano-crystals exhibiting only a surface defect emission located at ca.450 nm. In our case, this situation probably originates frompartial decomposition of TG at high temperature leading todangling bond states on the d-dots surface due to incompletesurface passivation by the ligand.36,37
Initial experiments performed with 4% Mn2+ relative to Zn2+
and a ca. 0.19 M Zn2+ solution showed that good quality d-dots
This journal is ª The Royal Society of Chemistry 2013
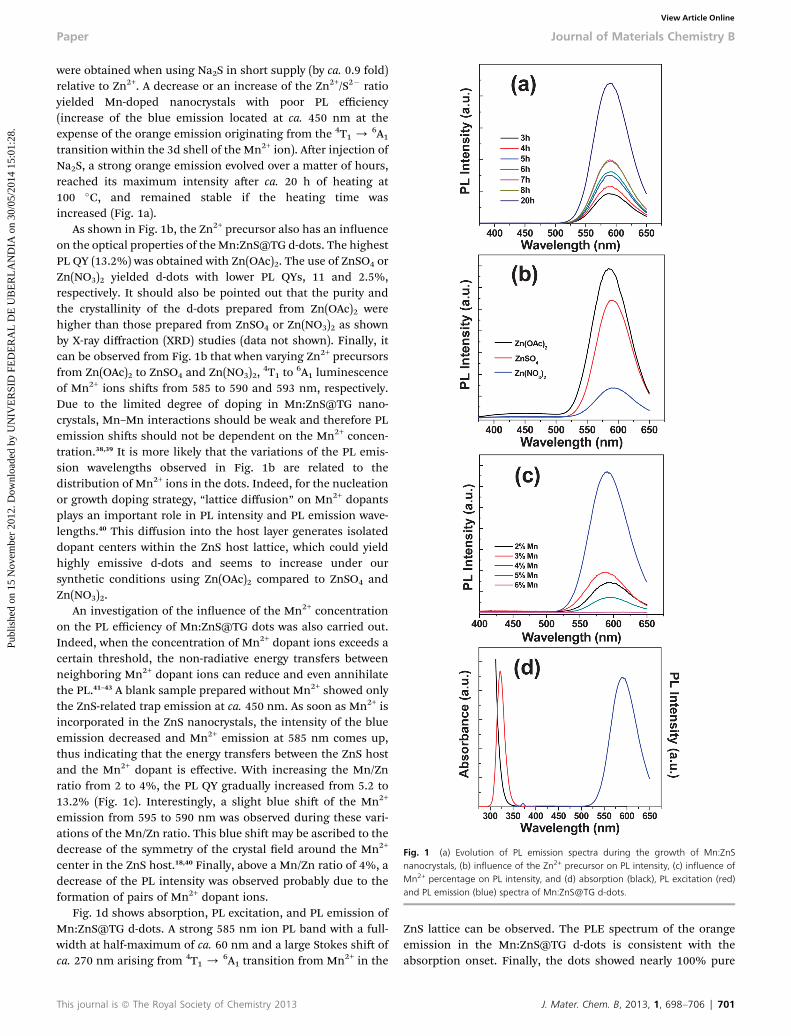
Fig. 1 (a) Evolution of PL emission spectra during the growth of Mn:ZnSnanocrystals, (b) influence of the Zn2+ precursor on PL intensity, (c) influence ofMn2+ percentage on PL intensity, and (d) absorption (black), PL excitation (red)and PL emission (blue) spectra of Mn:ZnS@TG d-dots.
Paper Journal of Materials Chemistry B
Publ
ishe
d on
15
Nov
embe
r 20
12. D
ownl
oade
d by
UN
IVE
RSI
D F
ED
ER
AL
DE
UB
ER
LA
ND
IA o
n 30
/05/
2014
15:
01:2
8.
View Article Online
were obtained when using Na2S in short supply (by ca. 0.9 fold)relative to Zn2+. A decrease or an increase of the Zn2+/S2� ratioyielded Mn-doped nanocrystals with poor PL efficiency(increase of the blue emission located at ca. 450 nm at theexpense of the orange emission originating from the 4T1 /
6A1
transition within the 3d shell of the Mn2+ ion). Aer injection ofNa2S, a strong orange emission evolved over a matter of hours,reached its maximum intensity aer ca. 20 h of heating at100 �C, and remained stable if the heating time wasincreased (Fig. 1a).
As shown in Fig. 1b, the Zn2+ precursor also has an inuenceon the optical properties of theMn:ZnS@TG d-dots. The highestPL QY (13.2%) was obtained with Zn(OAc)2. The use of ZnSO4 orZn(NO3)2 yielded d-dots with lower PL QYs, 11 and 2.5%,respectively. It should also be pointed out that the purity andthe crystallinity of the d-dots prepared from Zn(OAc)2 werehigher than those prepared from ZnSO4 or Zn(NO3)2 as shownby X-ray diffraction (XRD) studies (data not shown). Finally, itcan be observed from Fig. 1b that when varying Zn2+ precursorsfrom Zn(OAc)2 to ZnSO4 and Zn(NO3)2,
4T1 to6A1 luminescence
of Mn2+ ions shis from 585 to 590 and 593 nm, respectively.Due to the limited degree of doping in Mn:ZnS@TG nano-crystals, Mn–Mn interactions should be weak and therefore PLemission shis should not be dependent on the Mn2+ concen-tration.38,39 It is more likely that the variations of the PL emis-sion wavelengths observed in Fig. 1b are related to thedistribution of Mn2+ ions in the dots. Indeed, for the nucleationor growth doping strategy, “lattice diffusion” on Mn2+ dopantsplays an important role in PL intensity and PL emission wave-lengths.40 This diffusion into the host layer generates isolateddopant centers within the ZnS host lattice, which could yieldhighly emissive d-dots and seems to increase under oursynthetic conditions using Zn(OAc)2 compared to ZnSO4 andZn(NO3)2.
An investigation of the inuence of the Mn2+ concentrationon the PL efficiency of Mn:ZnS@TG dots was also carried out.Indeed, when the concentration of Mn2+ dopant ions exceeds acertain threshold, the non-radiative energy transfers betweenneighboring Mn2+ dopant ions can reduce and even annihilatethe PL.41–43 A blank sample prepared without Mn2+ showed onlythe ZnS-related trap emission at ca. 450 nm. As soon as Mn2+ isincorporated in the ZnS nanocrystals, the intensity of the blueemission decreased and Mn2+ emission at 585 nm comes up,thus indicating that the energy transfers between the ZnS hostand the Mn2+ dopant is effective. With increasing the Mn/Znratio from 2 to 4%, the PL QY gradually increased from 5.2 to13.2% (Fig. 1c). Interestingly, a slight blue shi of the Mn2+
emission from 595 to 590 nm was observed during these vari-ations of the Mn/Zn ratio. This blue shimay be ascribed to thedecrease of the symmetry of the crystal eld around the Mn2+
center in the ZnS host.18,40 Finally, above a Mn/Zn ratio of 4%, adecrease of the PL intensity was observed probably due to theformation of pairs of Mn2+ dopant ions.
Fig. 1d shows absorption, PL excitation, and PL emission ofMn:ZnS@TG d-dots. A strong 585 nm ion PL band with a full-width at half-maximum of ca. 60 nm and a large Stokes shi ofca. 270 nm arising from 4T1 /
6A1 transition from Mn2+ in the
This journal is ª The Royal Society of Chemistry 2013
ZnS lattice can be observed. The PLE spectrum of the orangeemission in the Mn:ZnS@TG d-dots is consistent with theabsorption onset. Finally, the dots showed nearly 100% pure
J. Mater. Chem. B, 2013, 1, 698–706 | 701
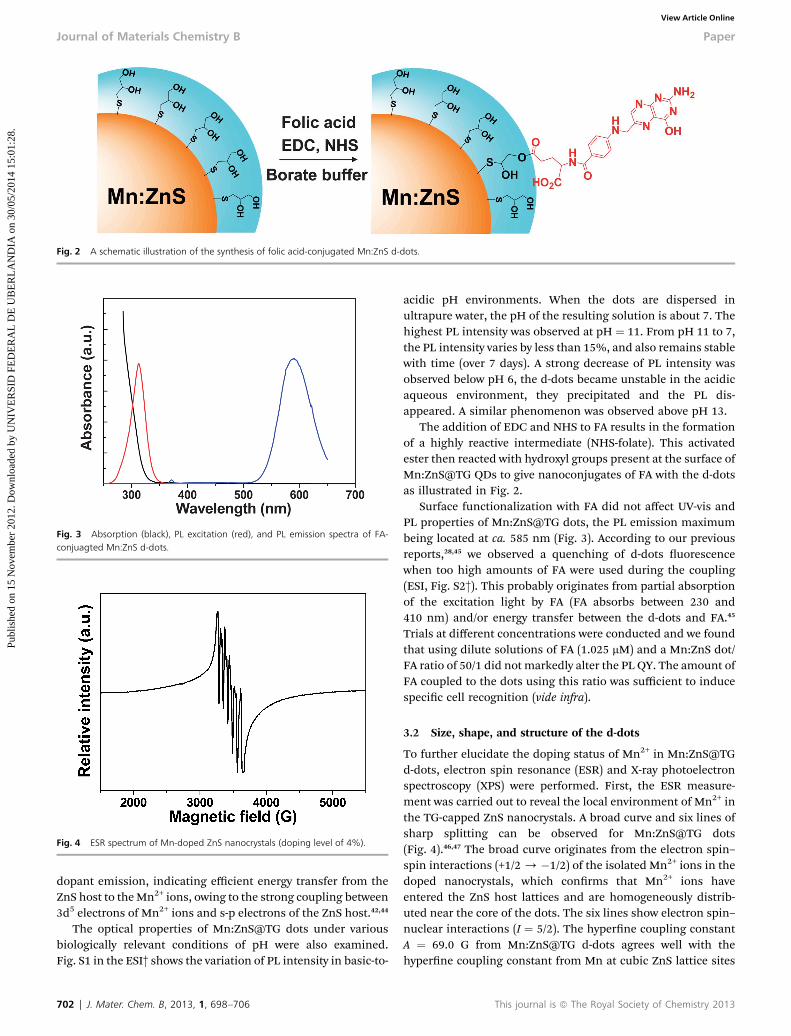
Fig. 2 A schematic illustration of the synthesis of folic acid-conjugated Mn:ZnS d-dots.
Fig. 3 Absorption (black), PL excitation (red), and PL emission spectra of FA-conjuagted Mn:ZnS d-dots.
Fig. 4 ESR spectrum of Mn-doped ZnS nanocrystals (doping level of 4%).
Journal of Materials Chemistry B Paper
Publ
ishe
d on
15
Nov
embe
r 20
12. D
ownl
oade
d by
UN
IVE
RSI
D F
ED
ER
AL
DE
UB
ER
LA
ND
IA o
n 30
/05/
2014
15:
01:2
8.
View Article Online
dopant emission, indicating efficient energy transfer from theZnS host to theMn2+ ions, owing to the strong coupling between3d5 electrons of Mn2+ ions and s-p electrons of the ZnS host.42,44
The optical properties of Mn:ZnS@TG dots under variousbiologically relevant conditions of pH were also examined.Fig. S1 in the ESI† shows the variation of PL intensity in basic-to-
702 | J. Mater. Chem. B, 2013, 1, 698–706
acidic pH environments. When the dots are dispersed inultrapure water, the pH of the resulting solution is about 7. Thehighest PL intensity was observed at pH ¼ 11. From pH 11 to 7,the PL intensity varies by less than 15%, and also remains stablewith time (over 7 days). A strong decrease of PL intensity wasobserved below pH 6, the d-dots became unstable in the acidicaqueous environment, they precipitated and the PL dis-appeared. A similar phenomenon was observed above pH 13.
The addition of EDC and NHS to FA results in the formationof a highly reactive intermediate (NHS-folate). This activatedester then reacted with hydroxyl groups present at the surface ofMn:ZnS@TG QDs to give nanoconjugates of FA with the d-dotsas illustrated in Fig. 2.
Surface functionalization with FA did not affect UV-vis andPL properties of Mn:ZnS@TG dots, the PL emission maximumbeing located at ca. 585 nm (Fig. 3). According to our previousreports,28,45 we observed a quenching of d-dots uorescencewhen too high amounts of FA were used during the coupling(ESI, Fig. S2†). This probably originates from partial absorptionof the excitation light by FA (FA absorbs between 230 and410 nm) and/or energy transfer between the d-dots and FA.45
Trials at different concentrations were conducted and we foundthat using dilute solutions of FA (1.025 mM) and a Mn:ZnS dot/FA ratio of 50/1 did not markedly alter the PL QY. The amount ofFA coupled to the dots using this ratio was sufficient to inducespecic cell recognition (vide infra).
3.2 Size, shape, and structure of the d-dots
To further elucidate the doping status of Mn2+ in Mn:ZnS@TGd-dots, electron spin resonance (ESR) and X-ray photoelectronspectroscopy (XPS) were performed. First, the ESR measure-ment was carried out to reveal the local environment of Mn2+ inthe TG-capped ZnS nanocrystals. A broad curve and six lines ofsharp splitting can be observed for Mn:ZnS@TG dots(Fig. 4).46,47 The broad curve originates from the electron spin–spin interactions (+1/2/ �1/2) of the isolated Mn2+ ions in thedoped nanocrystals, which conrms that Mn2+ ions haveentered the ZnS host lattices and are homogeneously distrib-uted near the core of the dots. The six lines show electron spin–nuclear interactions (I ¼ 5/2). The hyperne coupling constantA ¼ 69.0 G from Mn:ZnS@TG d-dots agrees well with thehyperne coupling constant from Mn at cubic ZnS lattice sites
This journal is ª The Royal Society of Chemistry 2013
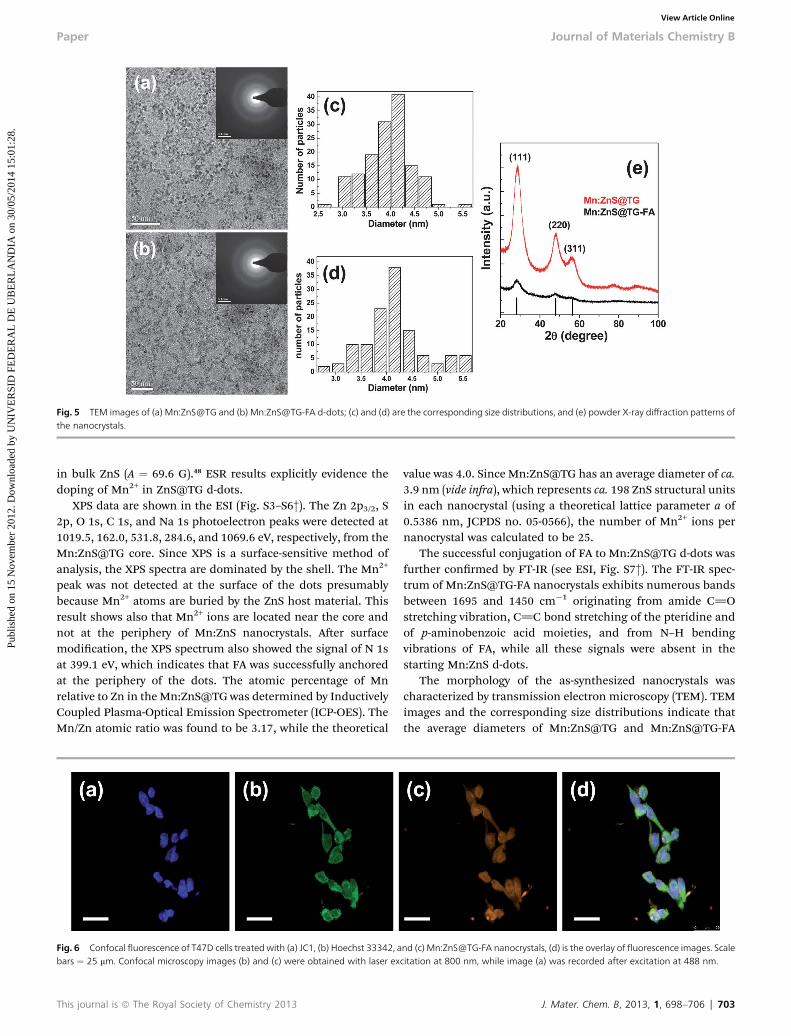
Fig. 5 TEM images of (a) Mn:ZnS@TG and (b) Mn:ZnS@TG-FA d-dots; (c) and (d) are the corresponding size distributions, and (e) powder X-ray diffraction patterns ofthe nanocrystals.
Paper Journal of Materials Chemistry B
Publ
ishe
d on
15
Nov
embe
r 20
12. D
ownl
oade
d by
UN
IVE
RSI
D F
ED
ER
AL
DE
UB
ER
LA
ND
IA o
n 30
/05/
2014
15:
01:2
8.
View Article Online
in bulk ZnS (A ¼ 69.6 G).48 ESR results explicitly evidence thedoping of Mn2+ in ZnS@TG d-dots.
XPS data are shown in the ESI (Fig. S3–S6†). The Zn 2p3/2, S2p, O 1s, C 1s, and Na 1s photoelectron peaks were detected at1019.5, 162.0, 531.8, 284.6, and 1069.6 eV, respectively, from theMn:ZnS@TG core. Since XPS is a surface-sensitive method ofanalysis, the XPS spectra are dominated by the shell. The Mn2+
peak was not detected at the surface of the dots presumablybecause Mn2+ atoms are buried by the ZnS host material. Thisresult shows also that Mn2+ ions are located near the core andnot at the periphery of Mn:ZnS nanocrystals. Aer surfacemodication, the XPS spectrum also showed the signal of N 1sat 399.1 eV, which indicates that FA was successfully anchoredat the periphery of the dots. The atomic percentage of Mnrelative to Zn in the Mn:ZnS@TG was determined by InductivelyCoupled Plasma-Optical Emission Spectrometer (ICP-OES). TheMn/Zn atomic ratio was found to be 3.17, while the theoretical
Fig. 6 Confocal fluorescence of T47D cells treated with (a) JC1, (b) Hoechst 33342, abars ¼ 25 mm. Confocal microscopy images (b) and (c) were obtained with laser ex
This journal is ª The Royal Society of Chemistry 2013
value was 4.0. Since Mn:ZnS@TG has an average diameter of ca.3.9 nm (vide infra), which represents ca. 198 ZnS structural unitsin each nanocrystal (using a theoretical lattice parameter a of0.5386 nm, JCPDS no. 05-0566), the number of Mn2+ ions pernanocrystal was calculated to be 25.
The successful conjugation of FA to Mn:ZnS@TG d-dots wasfurther conrmed by FT-IR (see ESI, Fig. S7†). The FT-IR spec-trum of Mn:ZnS@TG-FA nanocrystals exhibits numerous bandsbetween 1695 and 1450 cm�1 originating from amide C]Ostretching vibration, C]C bond stretching of the pteridine andof p-aminobenzoic acid moieties, and from N–H bendingvibrations of FA, while all these signals were absent in thestarting Mn:ZnS d-dots.
The morphology of the as-synthesized nanocrystals wascharacterized by transmission electron microscopy (TEM). TEMimages and the corresponding size distributions indicate thatthe average diameters of Mn:ZnS@TG and Mn:ZnS@TG-FA
nd (c) Mn:ZnS@TG-FA nanocrystals, (d) is the overlay of fluorescence images. Scalecitation at 800 nm, while image (a) was recorded after excitation at 488 nm.
J. Mater. Chem. B, 2013, 1, 698–706 | 703
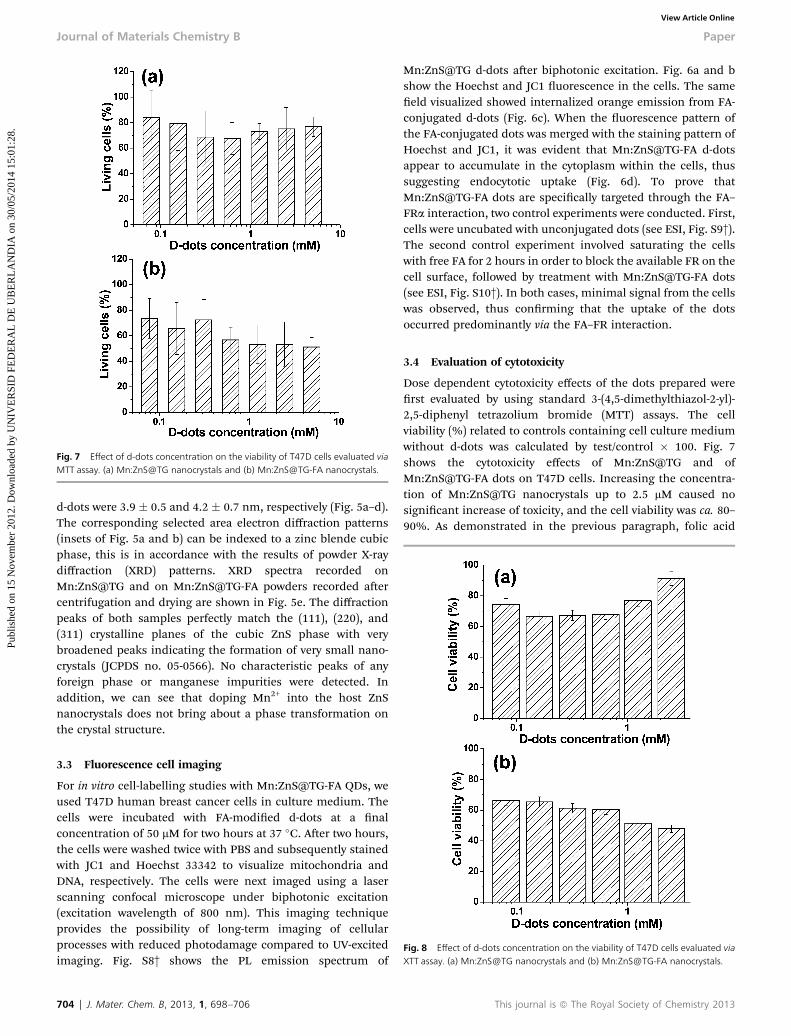
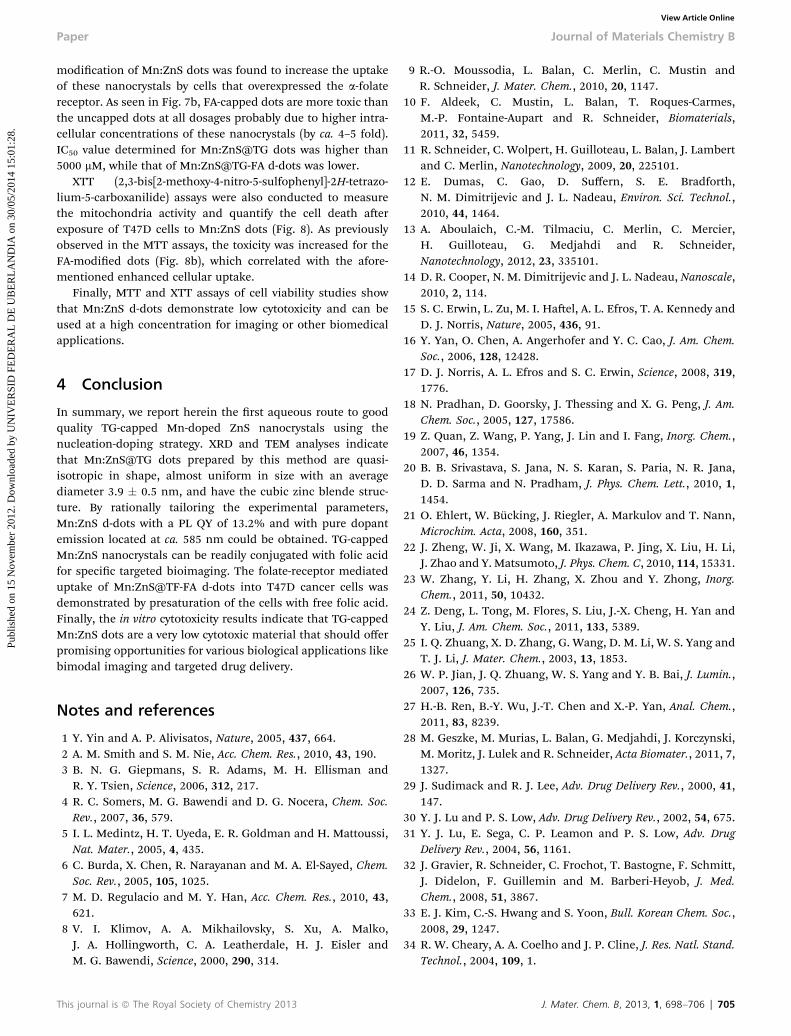
Fig. 7 Effect of d-dots concentration on the viability of T47D cells evaluated viaMTT assay. (a) Mn:ZnS@TG nanocrystals and (b) Mn:ZnS@TG-FA nanocrystals.
Journal of Materials Chemistry B Paper
Publ
ishe
d on
15
Nov
embe
r 20
12. D
ownl
oade
d by
UN
IVE
RSI
D F
ED
ER
AL
DE
UB
ER
LA
ND
IA o
n 30
/05/
2014
15:
01:2
8.
View Article Online
d-dots were 3.9 � 0.5 and 4.2 � 0.7 nm, respectively (Fig. 5a–d).The corresponding selected area electron diffraction patterns(insets of Fig. 5a and b) can be indexed to a zinc blende cubicphase, this is in accordance with the results of powder X-raydiffraction (XRD) patterns. XRD spectra recorded onMn:ZnS@TG and on Mn:ZnS@TG-FA powders recorded aercentrifugation and drying are shown in Fig. 5e. The diffractionpeaks of both samples perfectly match the (111), (220), and(311) crystalline planes of the cubic ZnS phase with verybroadened peaks indicating the formation of very small nano-crystals (JCPDS no. 05-0566). No characteristic peaks of anyforeign phase or manganese impurities were detected. Inaddition, we can see that doping Mn2+ into the host ZnSnanocrystals does not bring about a phase transformation onthe crystal structure.
Fig. 8 Effect of d-dots concentration on the viability of T47D cells evaluated viaXTT assay. (a) Mn:ZnS@TG nanocrystals and (b) Mn:ZnS@TG-FA nanocrystals.
3.3 Fluorescence cell imaging
For in vitro cell-labelling studies with Mn:ZnS@TG-FA QDs, weused T47D human breast cancer cells in culture medium. Thecells were incubated with FA-modied d-dots at a nalconcentration of 50 mM for two hours at 37 �C. Aer two hours,the cells were washed twice with PBS and subsequently stainedwith JC1 and Hoechst 33342 to visualize mitochondria andDNA, respectively. The cells were next imaged using a laserscanning confocal microscope under biphotonic excitation(excitation wavelength of 800 nm). This imaging techniqueprovides the possibility of long-term imaging of cellularprocesses with reduced photodamage compared to UV-excitedimaging. Fig. S8† shows the PL emission spectrum of
704 | J. Mater. Chem. B, 2013, 1, 698–706
Mn:ZnS@TG d-dots aer biphotonic excitation. Fig. 6a and bshow the Hoechst and JC1 uorescence in the cells. The sameeld visualized showed internalized orange emission from FA-conjugated d-dots (Fig. 6c). When the uorescence pattern ofthe FA-conjugated dots was merged with the staining pattern ofHoechst and JC1, it was evident that Mn:ZnS@TG-FA d-dotsappear to accumulate in the cytoplasm within the cells, thussuggesting endocytotic uptake (Fig. 6d). To prove thatMn:ZnS@TG-FA dots are specically targeted through the FA–FRa interaction, two control experiments were conducted. First,cells were uncubated with unconjugated dots (see ESI, Fig. S9†).The second control experiment involved saturating the cellswith free FA for 2 hours in order to block the available FR on thecell surface, followed by treatment with Mn:ZnS@TG-FA dots(see ESI, Fig. S10†). In both cases, minimal signal from the cellswas observed, thus conrming that the uptake of the dotsoccurred predominantly via the FA–FR interaction.
3.4 Evaluation of cytotoxicity
Dose dependent cytotoxicity effects of the dots prepared wererst evaluated by using standard 3-(4,5-dimethylthiazol-2-yl)-2,5-diphenyl tetrazolium bromide (MTT) assays. The cellviability (%) related to controls containing cell culture mediumwithout d-dots was calculated by test/control � 100. Fig. 7shows the cytotoxicity effects of Mn:ZnS@TG and ofMn:ZnS@TG-FA dots on T47D cells. Increasing the concentra-tion of Mn:ZnS@TG nanocrystals up to 2.5 mM caused nosignicant increase of toxicity, and the cell viability was ca. 80–90%. As demonstrated in the previous paragraph, folic acid
This journal is ª The Royal Society of Chemistry 2013
Paper Journal of Materials Chemistry B
Publ
ishe
d on
15
Nov
embe
r 20
12. D
ownl
oade
d by
UN
IVE
RSI
D F
ED
ER
AL
DE
UB
ER
LA
ND
IA o
n 30
/05/
2014
15:
01:2
8.
View Article Online
modication of Mn:ZnS dots was found to increase the uptakeof these nanocrystals by cells that overexpressed the a-folatereceptor. As seen in Fig. 7b, FA-capped dots are more toxic thanthe uncapped dots at all dosages probably due to higher intra-cellular concentrations of these nanocrystals (by ca. 4–5 fold).IC50 value determined for Mn:ZnS@TG dots was higher than5000 mM, while that of Mn:ZnS@TG-FA d-dots was lower.
XTT (2,3-bis[2-methoxy-4-nitro-5-sulfophenyl]-2H-tetrazo-lium-5-carboxanilide) assays were also conducted to measurethe mitochondria activity and quantify the cell death aerexposure of T47D cells to Mn:ZnS dots (Fig. 8). As previouslyobserved in the MTT assays, the toxicity was increased for theFA-modied dots (Fig. 8b), which correlated with the afore-mentioned enhanced cellular uptake.
Finally, MTT and XTT assays of cell viability studies showthat Mn:ZnS d-dots demonstrate low cytotoxicity and can beused at a high concentration for imaging or other biomedicalapplications.
4 Conclusion
In summary, we report herein the rst aqueous route to goodquality TG-capped Mn-doped ZnS nanocrystals using thenucleation-doping strategy. XRD and TEM analyses indicatethat Mn:ZnS@TG dots prepared by this method are quasi-isotropic in shape, almost uniform in size with an averagediameter 3.9 � 0.5 nm, and have the cubic zinc blende struc-ture. By rationally tailoring the experimental parameters,Mn:ZnS d-dots with a PL QY of 13.2% and with pure dopantemission located at ca. 585 nm could be obtained. TG-cappedMn:ZnS nanocrystals can be readily conjugated with folic acidfor specic targeted bioimaging. The folate-receptor mediateduptake of Mn:ZnS@TF-FA d-dots into T47D cancer cells wasdemonstrated by presaturation of the cells with free folic acid.Finally, the in vitro cytotoxicity results indicate that TG-cappedMn:ZnS dots are a very low cytotoxic material that should offerpromising opportunities for various biological applications likebimodal imaging and targeted drug delivery.
Notes and references
1 Y. Yin and A. P. Alivisatos, Nature, 2005, 437, 664.2 A. M. Smith and S. M. Nie, Acc. Chem. Res., 2010, 43, 190.3 B. N. G. Giepmans, S. R. Adams, M. H. Ellisman andR. Y. Tsien, Science, 2006, 312, 217.
4 R. C. Somers, M. G. Bawendi and D. G. Nocera, Chem. Soc.Rev., 2007, 36, 579.
5 I. L. Medintz, H. T. Uyeda, E. R. Goldman and H. Mattoussi,Nat. Mater., 2005, 4, 435.
6 C. Burda, X. Chen, R. Narayanan and M. A. El-Sayed, Chem.Soc. Rev., 2005, 105, 1025.
7 M. D. Regulacio and M. Y. Han, Acc. Chem. Res., 2010, 43,621.
8 V. I. Klimov, A. A. Mikhailovsky, S. Xu, A. Malko,J. A. Hollingworth, C. A. Leatherdale, H. J. Eisler andM. G. Bawendi, Science, 2000, 290, 314.
This journal is ª The Royal Society of Chemistry 2013
9 R.-O. Moussodia, L. Balan, C. Merlin, C. Mustin andR. Schneider, J. Mater. Chem., 2010, 20, 1147.
10 F. Aldeek, C. Mustin, L. Balan, T. Roques-Carmes,M.-P. Fontaine-Aupart and R. Schneider, Biomaterials,2011, 32, 5459.
11 R. Schneider, C. Wolpert, H. Guilloteau, L. Balan, J. Lambertand C. Merlin, Nanotechnology, 2009, 20, 225101.
12 E. Dumas, C. Gao, D. Suffern, S. E. Bradforth,N. M. Dimitrijevic and J. L. Nadeau, Environ. Sci. Technol.,2010, 44, 1464.
13 A. Aboulaich, C.-M. Tilmaciu, C. Merlin, C. Mercier,H. Guilloteau, G. Medjahdi and R. Schneider,Nanotechnology, 2012, 23, 335101.
14 D. R. Cooper, N. M. Dimitrijevic and J. L. Nadeau, Nanoscale,2010, 2, 114.
15 S. C. Erwin, L. Zu, M. I. Hael, A. L. Efros, T. A. Kennedy andD. J. Norris, Nature, 2005, 436, 91.
16 Y. Yan, O. Chen, A. Angerhofer and Y. C. Cao, J. Am. Chem.Soc., 2006, 128, 12428.
17 D. J. Norris, A. L. Efros and S. C. Erwin, Science, 2008, 319,1776.
18 N. Pradhan, D. Goorsky, J. Thessing and X. G. Peng, J. Am.Chem. Soc., 2005, 127, 17586.
19 Z. Quan, Z. Wang, P. Yang, J. Lin and I. Fang, Inorg. Chem.,2007, 46, 1354.
20 B. B. Srivastava, S. Jana, N. S. Karan, S. Paria, N. R. Jana,D. D. Sarma and N. Pradham, J. Phys. Chem. Lett., 2010, 1,1454.
21 O. Ehlert, W. Bucking, J. Riegler, A. Markulov and T. Nann,Microchim. Acta, 2008, 160, 351.
22 J. Zheng, W. Ji, X. Wang, M. Ikazawa, P. Jing, X. Liu, H. Li,J. Zhao and Y. Matsumoto, J. Phys. Chem. C, 2010, 114, 15331.
23 W. Zhang, Y. Li, H. Zhang, X. Zhou and Y. Zhong, Inorg.Chem., 2011, 50, 10432.
24 Z. Deng, L. Tong, M. Flores, S. Liu, J.-X. Cheng, H. Yan andY. Liu, J. Am. Chem. Soc., 2011, 133, 5389.
25 I. Q. Zhuang, X. D. Zhang, G. Wang, D. M. Li, W. S. Yang andT. J. Li, J. Mater. Chem., 2003, 13, 1853.
26 W. P. Jian, J. Q. Zhuang, W. S. Yang and Y. B. Bai, J. Lumin.,2007, 126, 735.
27 H.-B. Ren, B.-Y. Wu, J.-T. Chen and X.-P. Yan, Anal. Chem.,2011, 83, 8239.
28 M. Geszke, M. Murias, L. Balan, G. Medjahdi, J. Korczynski,M. Moritz, J. Lulek and R. Schneider, Acta Biomater., 2011, 7,1327.
29 J. Sudimack and R. J. Lee, Adv. Drug Delivery Rev., 2000, 41,147.
30 Y. J. Lu and P. S. Low, Adv. Drug Delivery Rev., 2002, 54, 675.31 Y. J. Lu, E. Sega, C. P. Leamon and P. S. Low, Adv. Drug
Delivery Rev., 2004, 56, 1161.32 J. Gravier, R. Schneider, C. Frochot, T. Bastogne, F. Schmitt,
J. Didelon, F. Guillemin and M. Barberi-Heyob, J. Med.Chem., 2008, 51, 3867.
33 E. J. Kim, C.-S. Hwang and S. Yoon, Bull. Korean Chem. Soc.,2008, 29, 1247.
34 R. W. Cheary, A. A. Coelho and J. P. Cline, J. Res. Natl. Stand.Technol., 2004, 109, 1.
J. Mater. Chem. B, 2013, 1, 698–706 | 705
Journal of Materials Chemistry B Paper
Publ
ishe
d on
15
Nov
embe
r 20
12. D
ownl
oade
d by
UN
IVE
RSI
D F
ED
ER
AL
DE
UB
ER
LA
ND
IA o
n 30
/05/
2014
15:
01:2
8.
View Article Online
35 M. Grabolle, M. Spiles, V. Lesnyak, N. Gaponik,A. Eychmuller and U. Resch-Genger, Anal. Chem., 2009, 81,6285.
36 B. H. Dong, L. X. Cao, G. Su, W. Liu, H. Qu and H. Zhai,J. Alloys Compd., 2010, 492, 363.
37 B. Dong, L. Cao, G. Su and W. Liu, J. Colloid Interface Sci.,2012, 367, 178.
38 H. Yang, P. H. Holloway and B. B. Ratua, J. Appl. Phys., 2003,93, 586.
39 W. Chen, R. Sammynaiken, R. Wallenberg and J. Bovin,J. Appl. Phys., 2001, 89, 1120.
40 N. Pradhan and X. G. Peng, J. Am. Chem. Soc., 2007, 129,3339.
41 A. A. Khosravi, M. Kundu, B. A. Kuruvilla, G. S. Shekhawat,R. P. Gupta, A. K. Sharma, P. D. Vyas and S. K. Kulkarni,Appl. Phys. Lett., 1995, 67, 2506.
706 | J. Mater. Chem. B, 2013, 1, 698–706
42 K. Sooklal, B. S. Cullum, S. M. Angel and C. J. Murphy, J.Phys. Chem., 1996, 100, 4551.
43 A. A. Bol and A. Meijerink, J. Phys. Chem. B, 2001, 105, 10197.44 J. J. Zheng, X. Yuan, M. Ikezawa, P. T. Jing, X. Y. Liu,
Z. H. Zheng, X. G. Kong, J. L. Zhao and Y. Masumoto,J. Phys. Chem. C, 2009, 113, 16969.
45 M. Geszke-Moritz, G. Clavier, J. Lulek and R. Schneider,J. Lumin., 2012, 132, 987.
46 P. H. Borse, D. Srinivas, R. F. Shinde, S. K. Date, W. Vogeland S. K. Kulkarni, Phys. Rev. B: Condens. Matter Mater.Phys., 1999, 60, 8659.
47 F. V. Mikulec, M. Kuno, M. Bennati, D. A. Hall, R. G. Griffinand M. G. Bawendi, J. Am. Chem. Soc., 2000, 122, 2532.
48 J. J. Li, Y. A. Wang, W. Z. Guo, J. C. Keay, T. D. Mishima,M. B. Johnson and X. G. Peng, J. Am. Chem. Soc., 2003, 125,12567.
This journal is ª The Royal Society of Chemistry 2013