biodiversitas vol. 12, no. 2, october 2013
DESCRIPTION
Biodiversitas , Journal of Biological Diversity” or Biodiversitas encourages submission of manuscripts dealing with all biodiversity aspects of plants, animals and microbes at the level of gene, species, and ecosystem.TRANSCRIPT

ISSN: 1412-033XE-ISSN: 2085-4722

J o u r n a l o f B i o l o g i c a l D i v e r s i t y V o l u m e 1 4 – N u m b e r 2 – O c t o b e r 2 0 1 3
ISSN/E-ISSN: 1412-033X (printed edition)
2085-4722 (electronic)
EDITORIAL BOARD (COMMUNICATING EDITORS): Abdel Fattah N.A. Rabou (Palestine), Alan J. Lymbery (Australia), Bambang H. Saharjo (Indonesia), Daiane H. Nunes (Brazil),
Guofan Shao (USA), Hassan Pourbabaei (Iran), Hwan Su Yoon (USA), I Made Sudiana (Indonesia), Joko R. Witono (Indonesia), Katsuhiko Kondo (Japan), Livia Wanntorp (Sweden), Mahendra K. Rai (India), María La Torre Cuadros (Peru),
Mochamad A. Soendjoto (Indonesia), Shahabuddin (Indonesia), Sugiyarto (Indonesia)
EDITOR-IN-CHIEF: S u t a r n o
EDITORIAL MEMBERS: English Editors: Suranto, Wiryono ([email protected]); Technical Editor & Banking: Solichatun ([email protected])
Distribution & Marketing: Rita Rakhmawati ([email protected]); Webmaster: Ari Pitoyo ([email protected])
MANAGING EDITORS: Ahmad Dwi Setyawan ([email protected])
PUBLISHER: The Society for Indonesian Biodiversity
CO-PUBLISHER:
Department of Biology, Faculty of Mathematics and Natural Sciences, Sebelas Maret University, Surakarta
ADDRESS: Jl. Ir. Sutami 36A Surakarta 57126. Tel. +62-271-7994097, Tel. & Fax.: +62-271-663375, Email: [email protected]
BANKING:
Solichatun, BNI KC Sebelas Maret, Acc. No. 0033691646
ONLINE: biodiversitas.mipa.uns.ac.id
EXPERTISE AND CORRESPONDING EMAIL OF THE COMMUNICATING EDITORS: GENETIC DIVERSITY: Alan J. Lymbery ([email protected]), Hwan Su Yoon ([email protected]), Mahendra K. Rai ([email protected]). SPECIES DIVERSITY: Joko R. Witono ([email protected]), Katsuhiko Kondo ([email protected]),
Livia Wanntorp ([email protected]). ECOSYSTEM DIVERSITY: Abdel Fattah N.A. Rabou ([email protected]), Bambang H. Saharjo ([email protected]), Daiane H. Nunes ([email protected]), Edi Rudi ([email protected]),
Guofan Shao ([email protected]), Hassan Pourbabaei ([email protected]), I Made Sudiana ([email protected]), Mochamad A. Soendjoto ([email protected]), Shahabuddin ([email protected]), Sugiyarto ([email protected]).
ETHNOBIOLOGY: María La Torre Cuadros ([email protected]).
Society for Indonesia Biodiversity
Sebelas Maret University Surakarta

BIODIVERSITAS ISSN: 1412-033XVolume 14, Number 2, October 2013 E-ISSN: 2085-4722Pages: 55-60 DOI: 10.13057/biodiv/d140201
Genetic diversity among fourteen different Fusarium species usingRAPD marker
SHITAL R. BONDE♥, ANIKET K. GADE, MAHENDRA K. RAIDepartment of Biotechnology, S.G.B. Amravati University, Amravati-444602, Maharashtra, India. Tel: +91-721-2662208-9; Ext 267, Fax: +91-721-
2662135, 2660949, email: [email protected]
Manuscript received: 4 February 2013. Revision accepted: 22 May 2013.
ABSTRACT
Bonde SR, Gade AK, Rai MK. 2012. Genetic diversity among fourteen different Fusarium species using RAPD marker. Biodiversitas 14:55-60. We report genetic diversity of total fourteen different Fusarium species by RAPD-PCR analysis using 25 random primers. Thegenus Fusarium is food borne pathogen responsible for T-2 toxin production which affects human and animal health. In the presentstudy, total 14-different species of Fusarium were analyzed on the basis of genetic diversity using RAPD method. A dendrogram wasdeveloped by UPGMA method. RAPD analysis was carried out by using 25 different universal primers each of them consisted of 10bases. Genetic similarity coefficients between pair wise varied from 0.00 to 0.9 based on an unweighted paired group method ofarithmetic average (UPGMA) cluster analysis. RAPD-PCR technique can be used as an important tool for the genetic differentiationFusarium species.
Key words: Fusarium, genetic diversity, RAPD, UPGMA.
INTRODUCTION
The word ‘mycotoxin’ is used for the toxic chemicalproducts produced by fungi that readily colonize crops inthe field or after harvest (Richard et al. 2007; Turner et al.2009). Mycotoxins are secondary metabolites produced bycertain filamentous fungi, which can be produced in foodand food-products as a result of fungal growth. They causea toxic response, termed as mycotoxicosis, when ingestedby higher vertebrates and other animals (Menaka et al. 2011).
T-2 toxin is a Type A chemical class of non-macrocyclic trichothecenes. The principle fungusresponsible for the production of T-2 toxinis is Fusariumsporotrichioides (CAST 2003). T-2 toxin is produced byvarious species of Fusarium, which are widespread on avariety of plants and in soil throughout the cold temperateregions (Omurtag et al. 2001). T-2 toxin is generally foundin various cereal crops such as wheat, corn, barley, rye,oats and processed grains (malt, beer and bread) (SCF2001). Symptoms of T-2 toxin include nausea, emesis,dizziness, chills, abdominal pain, diarrhea, dermal necrosis,irreversible damage to the bone marrow, reduction in whiteblood cells (aleukia), inhibition of protein synthesis, and istoxic for the hematological and lymphatic systems(Omurtag et al. 2001).T-2-contaminated products can causesevere effects in humans/animals which can result in death(Moss and Long 2002). T-2 toxin also alters the level ofdopamine, tryptophan, serotonine and serotoninemetabolites in the brain of rodents and pigs (Pestka andSmolinski 2005). T-2 toxin is quite known for inhibition ofDNA, RNA and protein synthesis, mitochondrial functionas well as other subcellular processes, and to cause death of
eukaryotic cells (Gyongyossy-Issa et al. 1985). The genusFusarium is commonly associated with many economicallyimportant crop diseases, however, distribution and diversityof this species is very important (Latiffah et al. 2007).Wang et al. (Wang et al. 1993) reported human toxicosiscaused by mouldy rice contaminated with Fusarium and T-2 toxin. Mycotoxin ingestion by humans, which occursmainly through plant-based foods and the residues andmetabolites present in animal-derived foods can lead todeterioration of liver or kidney function The mycotoxigenicfungi involved with the human food chain belong mainly tothree genera Aspergillus, Fusarium and Penicillium. WhileFusarium species are destructive plant pathogensproducing mycotoxins before, or immediately altersharvesting. The use of molecular markers based on thepolymerase chain reaction for species identification and asdiagnostic tool has become very popular during the lastdecade (Sabir 2006).
RAPD assays have been used extensively to definefungal populations at species, intraspecific, race and strainlevels (Miller 1996; Ingle et al. 2009) and RAPD-PCR istechnique for detecting genetic variability (Edwards et al.2002; Sabir 2006). Different molecular markers areavailable for the differentiation of fungal taxa (Steinkellneret al. 2008). Mostly used Random amplified polymorphicDNA (RAPD) (Gupta et al. 2009) and amplified fragmentlength polymorphisms (AFLP) (Niessen 2007) are specificPCR-based molecular markers. These markersdemonstrated remarkable genetic variation (Skaria et al.2011). RAPD technique has been used since a long time forphylogenetic studies (Niessen 2007; Gupta et al. 2009).
BIODIVERSITAS 14 (2): 55-60, October 201356
There are several reports on differentiation of Fusariumspecies using RAPD markers. Gupta et al. (2009) reportedthe genetic polymorphism among six isolates of F. solanicausing wilt disease in guava, isolated from different placesin India. Ingle and Rai (2011) reported genetic diversity ofF. semitectum, Fusarium associated with mango malformationwere identified and analysed for their genetic diversityamong Fusarium isolates (Smith et al. 2001; Arif et al. 2011).Similarly, a genetic variation in F. oxysporum f. sp. fragariaecausing wilt disease in strawberry was characterized byNagarajan et al. (2004). RAPD markers are easy, rapid foran evaluation of genetic variation (Niessen 2007). The studyof RAPD analysis has been used widely in phylogeneticanalysis of bacteria, fungi and plants (Singh et al. 2011).
The aim of the present study was to estimate the geneticdiversity of 14-different secreting Fusarium species studiedby RAPD-PCR.
MATERIALS AND METHODS
Fungal speciesDifferent Fusarium were procured from Institute of
Microbial Technology (IMTECH), Chandigarh, India(Table 1).
Table 1. Fourteen different Fusarium cultures were used forRAPD analysis
Cultures Fusarium species
MTCC-3325 F. avenaceumMTCC-3731 F. equisetiMTCC-350 F. solaniMTCC-7375 F. sporotrichioidesMTCC-349 F. culmorumMTCC-3730 F. tricinctumMTCC-636 F. lateritiumMTCC-156 F. moniliformeMTCC-1755 F. oxysporumMTCC-6580 F. nivaleMTCC-2086 F. poaeMTCC-1983 F. acuminatumDBT-18 F. graminearumDBT-21 F. semitectum
DNA IsolationDifferent Fusarium species were grown on Potato
Dextrose Agar (PDA) at 25 ± 20C for 3 days. The myceliagrown were harvested and total DNA was extracted usingfungal genomic DNA isolation kit from Chromous BiotechPvt. Ltd, Bangalore, India according to manufacturer’sinstructions.
RAPD analysisTwenty five fungal primers from Random Fungal
Primer Kit (RFu ‘D’) Genie Pvt. Ltd, Bangalore, India,were evaluated for PCR amplification of 14 Fusariumspecies. In the preliminary experiments, 12 out of the 25primers tested produced distinct and reproducible bandprofile, and polymorphisms produced by ten primers. Fourof 12 primers were used for comparative analysis of the
forteen Fusarium species. The primers, including Rfu-9(5’-CCTGGGTGCA-3’), Rfu-10 (5’-CCTGGGTGAC-3’),Rfu-23 (5’-CCGGCCATAC-3’) and Rfu-25 (5’-CCGGCTGGAA-3’) (Table 2).
Table 2. Primer and their sequences tested in RAPD analysis.
Sequences 5’-3’ Primer
CCTGGGCCAG RFu 1CCTGGGCGAG RFu 2**CCTGGGCTGG RFu 3CCTGGGCTAT RFu 4**CCTGGGCTTG RFu 5CCTGGGCTAC RFu 6CCTGGGCTTA RFu 7**CCTGGGTCGA RFu 8CCTGGGTGCA RFu 9*CCTGGGTGAC RFu 10*CCTGGCTTAC RFu 11CCTGGGTTAC RFu 12**CGGGGGATGG RFu 13CTCCCTGACC RFu 14GAGCACCTGT RFu 15**GAGCACGTCA RFu 16GAGCACGGCA RFu 17GAGCACGGAG RFu 18**GAGCTCGCAT RFu 19GAGGGCATGT RFu 20CCGGCCCCAA RFu 21CCGGCCTTAA RFu 22**CCGGCCATAC RFu 23*CCGGCCTTCC RFu 24**CCGGCTGGAA RFu 25*Note: *) Primers used in this study; **) Primers produced distinctand reproducible band, but not used in this study.
Preliminary amplifications determined the optimalconcentration of the component in the PCR reactionmixture and amplification conditions. Amplifications wereperformed in a total volume of 25 µL containing 12.5 µLPCR master mix (2X) (Fermentas Life Sciences, Canada) 5µL of template DNA (20 ng), 1.5 µL MgCl2 (25 mM), 0.3µL Taq DNA polymerase (Genexy, 5U/µL), 1 µL eachprimer and 4.7 µL nuclease free distilled water (suppliedwith Fermentas PCR master mix).
PCR was carried out on gradient PCR machine (Palm-Cycler from Corbett Research, Australia). The programincluded an initial denaturation at 940C for 2 min, 35 cycleswith denaturation at 940C for 30 sec, annealing 40 0C for 1min, extension at 720C for 2 min and final extension at720C for 5 min with holding temperature at 40C for 10 min.All experiments were repeated for three times. PCRproducts were electrophorezed on 1.5% agarose by using1X TAE buffer (Fermentas Life Sciences, Canada), stainedwith ethidium bromide, visualized in a UV-transilluminatorand the gel were photographed using Gel Doc(AlphaImager, Gel documentation system, USA), system.
Data analysesStatistical analyses of all 14-different Fusarium were
carried out using software PAST PAleontologicalSTatistics (Version 2.07). While, Unweighted Pair Group
BONDE et al. – Genetic diversity of Fusarium 57
Method with Arithmetic Mean Analysis (UPGMA) wasused to construct phylogenetic dendrogram. This method isone of the oldest techniques to be used in phylogeneticanalysis, is an offshoot of the linkage methods that werepopular in numerical taxonomy studies. Its simplicity andease of interpretation has made its survival in phylogeneticstudies. It works on the assumption that the rates of evolutionin all lineages are same and gives output clustering inincreasing order of distance (Sahoo et al. 2010).
RESULTS AND DISCUSSION
RAPD analysisGenomic DNA isolated from 14 different species was
subjected to RAPD-PCR analysis with 25 random decamerprimers of Fungal RAPD Primer (RFu ‘D’) kit (Table 2). Inthe preliminary experiments, 12 out of the 25 primerstested produced distinct and reproducible band profile, andpolymorphisms produced by ten primers. Four of 12
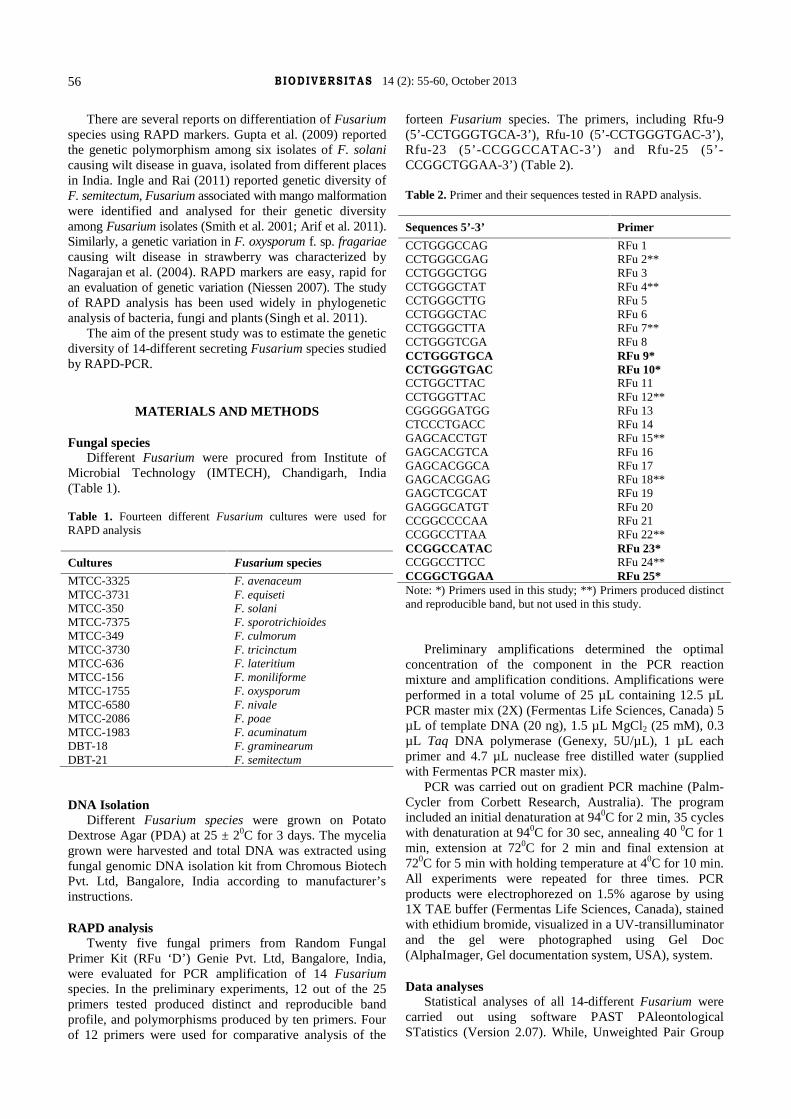
primers were used for comparative analysis of the fourteenFusarium species. The primers, including RFu 9, RFu 10,RFu 23 and 25 generated polymorphic bands in all 14different species (Figure 1).
All the amplified fragments were ranged 1 kb to 3.0 kb.RAPD assays of all 14 species with four above mentionedprimers yielded 180 bands which were found to bepolymorphic. Above data showed that RAPD is aconvenient method for distinguishing the different speciesof Fusarium and also reveal a significant genetic variationamong these species. There was other most studiedFusarium species viz. F. oxysporum also showed thegenetic variation (Ingle and Rai 2011). Assigbetse et al.(1994) differentiated races of F. oxysporum f. sp.vasinfectum on cotton by using RAPD as molecular tooland Bonde et al. (2013) studied genetic variation of F.equiseti isolated from fruits and vegetables. In anotherstudy carried out by Edel et al. (2001) it was observed thatthe isolates of F. oxysporum isolated from soil samples inFrance showed genetic diversity. While, Nagarajan and
Figure 1. RAPD patterns on 1.5% agarose gel of amplified fragments generated from different Fusarium sp. with primers RFu-9 (B)RFu-10 (C) RFu-23 (D) RFu-25. Lane M, DNA marker (1 kb), lane 1. F. avenaceum, lane 2. F. equiseti, lane 3. F. solani, lane 4. F.sporotrichioides, lane 5. F. culmorum, lane 6. F. tricinctum, lane 7. F. lateritium, lane 8. F. moniliforme, lane 9. F.oxysporum, lane 10.F. nivale, lane 11. F. poae, lane 12. F. acuminatum, lane 13. F. graminearum, lane 14. F. semitectum
A B
C D
BIODIVERSITAS 14 (2): 55-60, October 201358
group (2004) studied the genetic variation in F. oxysporumf. sp. fragariae population causing wilt in strawberry usingRAPD and RFLP analysis. The work carried out by Leslieet al. (2006) supports the findings of present study. Theyobserved inter-and intra specific genetic variation indifferent Fusarium species. RAPD-PCR technique assuitable method was used to rapid identification anddifferentiation of Fusarium species (Pujo et al. 1997; El-Fadly et al. 2008). Gupta et al. (2009) reported the geneticpolymorphism and diversity in isolates of F. solani isolatedfrom wilt disease of Guava in India. Ingle et al. (2009)suggested RAPD marker is important, reliable tool forgenetic variation among ten phytopathogenic isolates of F.semitectum from India.
UPGMARAPD markers along with appropriate statistical
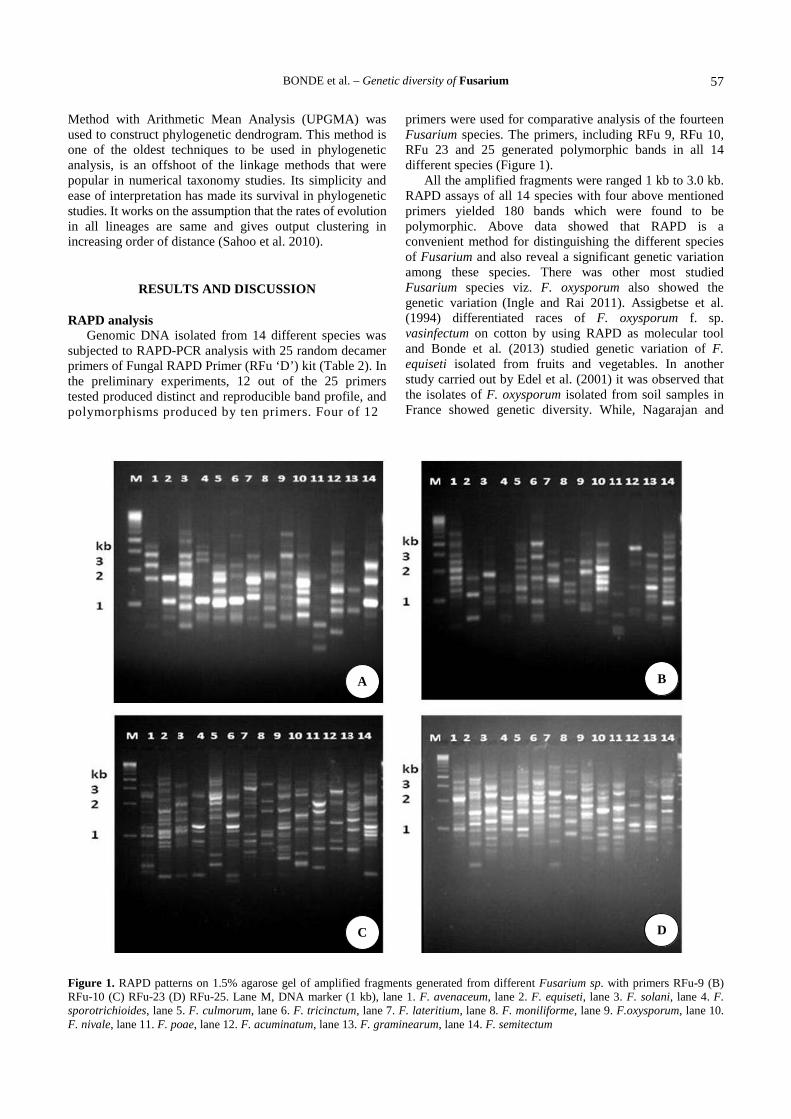
procedures are suitable for genetic variation analyses atboth intra and inter-population levels (Leon et al. 2011).Fusarium species secreting T-2 toxin were analyzed withseveral UPGMA dendrograms with bootstrap analysis. Inaddition, bootstrap values of UPGMA dendogram obtainedwith the utilization of RAPDs were slightly higher. Geneticrelationship calculated in the form of similarity coefficientfrom dendrogram showed high level of genetic similarityamong all different Fusarium, which ranges from 0 to 0.9.Clustering was performed by UPGMA method. UPGMAanalysis of the RAPD data separated the Fusarium speciesin two clusters (Figure 2).
Table 3. Distance matrix
F. a
vena
ceum
F. e
quis
eti
F. s
olan
i
F. s
poro
tric
hioi
des
F. c
ulm
orum
F.t
rici
nctu
m
F.l
ater
itium
F. m
onili
form
e
F. o
xysp
orum
F. n
ival
e
F. p
oae
F.a
cum
inat
um
F. g
ram
inea
rum
F.s
emite
ctum
F. avenaceum 0
F. equiseti 1.00 0
F. solani 1.10 1.11 0
F. sporotrichioides 1.00 1.01 1.00 0
F. culmorum 1.11 1.00 1.10 1.00 0
F. tricinctum 1.10 1.10 9.89 9.99 1.10 0
F. lateritium 1.00 1.00 8.90 9.00 1.00 9.91 0
F. moniliforme 1.10 9.89 1.11 1.01 1.10 1.10 1.00 0
F. oxysporum 1.00 1.01 1.00 1.11 1.00 9.99 9.00 1.01 0
F. nivale 1.11 1.00 1.10 1.00 9.99 1.10 1.00 1.10 1.00 0
F. poae 1.00 1.00 1.11 1.01 1.00 1.10 1.00 9.90 1.01 1.00 0
F. acuminatum 1.01 1.00 1.10 1.00 9.99 1.10 1.00 1.10 1.00 9.99 1.00 0
F. graminearum 1.09 8.91 1.10 1.00 1.10 1.10 1.00 9.90 1.00 1.10 8.91 1.10 0
F. semitectum 1.11 1.00 1.10 1.00 1.00 1.10 1.00 1.10 1.00 9.00 1.00 9.99 1.10 0
Figure 2. Phylogenetic analysis using UPGMA method
F. tricinctum
F. semitectum
F. lateritium
F. acuminatum
F. nivale
F. culmorum
F. moniliforme
F. poae
F. graminearum
F. avenaceum
F. equiseti
F. solani
F. sporotrichioides
F. oxysporum
BONDE et al. – Genetic diversity of Fusarium 59
UPGMA dendrogram showed the F. sporotrichioidesand F. oxysporum in one clade and other species in anotherclade. In upper clade F. equiseti and F. solani showedgreater similarity than other F. tricinctum, F. semitectum,F. lateritium, F. acuminatum, F. nivale, F. culmorum, F.moniliforme, F. poae, F. graminearum and F. avenaceum.UPGMA analysis thus carried out in the present studyshowed the genetic variation in these 14 different Fusariumspecies. A distance matrix on simple matching coefficientswas calculated from the data based on the RAPD of all 14Fusarium species. The matrix was used to construct adendrogram using distance tool with UPGMA method ofPHYLIP for establishing to analyze the level of relatednessamong the ten isolates. The dendrogram obtained from thedata showed that hierarchical clustering separated theisolates into three groups according to their similaritycoefficients. The similarity coefficients among the allisolates ranged from 0 to 0.9. Distance matrix of different14 Fusarium species was obtained (Table 3).
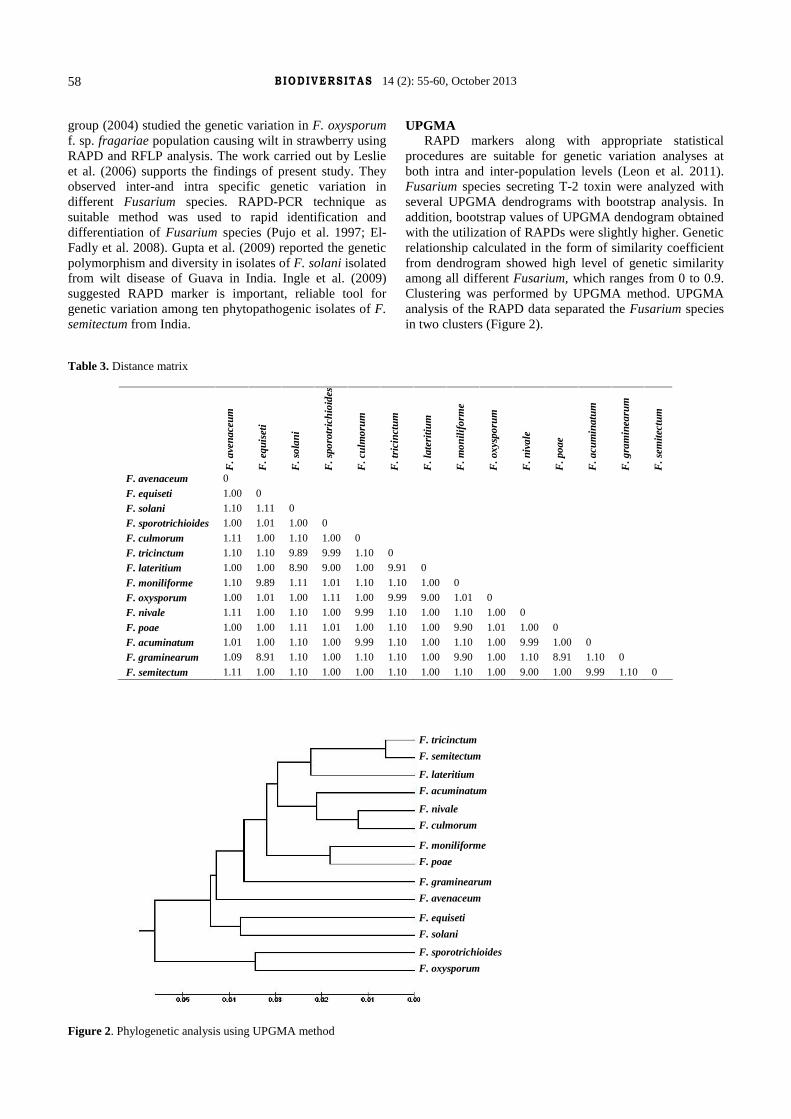
UPGMA is a simple agglomerative or hierarchicalclustering method used in bioinformatics for thephylogenetic analysis. The results obtained in the presentstudy are noteworthy and showed the similarity with theobservations of Ingle and Rai 2009, Bonde et al. (2012),Gupta et al. (2009) and Nagarajan et al. (2004). In theirstudies on isolates of F. semitectum, F. equiseti, F. solaniand F. oxysporum respectively, they used data generatedfrom RAPD banding pattern for the UPGMA analysis andfound that there was genetic variations in different isolatesof same Fusarium (Abd-Elsalam et al. 2003). Statisticalanalysis were carried out of all 14 Fusarium species usingPAST software in which diversity graph (Figure 3) whichcomputes a number of similarity or distance measuresbetween all pairs of rows.
Figure 3. Diversity profile of 14 different Fusarium species
The diversity indices are applied in statistics ofassociation data, where numbers of individuals aretabulated in rows (taxa) and possibly several columns(associations) and test for normal distribution (Table 4)asymptotically normal distribution with mean 0 andvariance 1 under the null hypothesis of zero correlation,
which is the basis for the calculation of p 0.002596 inwhich three statistical tests for normal distribution of oneor several samples of univariate data, given in columns.Diversity indices statistics apply to association data, wherenumbers of individuals are tabulated in rows (taxa) andpossibly several columns (associations). The availablestatistics are as follows, for each association:
Number of taxa (S), total number of individuals (n),Dominance = 1-Simpson index. Ranges from 0 (all taxa areequally present) to 1 (one taxon dominates the communitycompletely), Simpson index 1-D. Measures 'evenness' ofthe community from 0 to 1. Diversity indexes, taking intoaccount the number of individuals as well as number oftaxa. Varies from 0 for communities with only a singletaxon to high values for communities with many taxa, eachwith few individuals. Buzas and Gibson's evenness,Brillouin’s index, Menhinick's richness index, Margalef'srichness index, Equitability. Shannon diversity divided bythe logarithm of number of taxa. This measures theevenness with which individuals are divided among thetaxa present. Fisher's alpha-a diversity index, definedimplicitly by the formula S=a*ln (1+n/a) where S isnumber of taxa, n is number of individuals and a is theFisher's alpha. Berger-Parker dominance is simply thenumber of individuals in the dominant taxon relative to n.
The data below were generated by a random numbergenerator with uniform distribution and tests such asShapiro-Wilk test, Jarque-Bera test and Chi-square tests(Table 5) were studied to check the univariate normaldistribution of data.
Table 4. Diversity indices
0 59Taxa_S 14Individuals 2.4212309315201E58Dominance_ D 0.383Shannon_H 1.152Simpson 1-D 0.617Evenness_e^H/S 0.2261Menhinick 8.997E-29Margalef 0.0967Equitability_J 0.4365Fisher_alpha 0.1024Berger-Parker 0.4544
Table 5. Shapiro-Wilk test, Jarque-Bera test and Chi-square testsas it is other statistical analysis
Statistical parameter Values
Min 1E30Max 1.10011E58Sum 2.42123E58Mean 1.72945E57Std. error 1.00174E57Variance 1.40487E115Stand. dev 3.74815E57Median 1.11111E55Geom. mean 4.01722E55
BIODIVERSITAS 14 (2): 55-60, October 201360
Our results suggest existence of significant geneticvariation among these Fusarium species secretingmycotoxin, on the basis of RAPD analysis. Fusariumspecies secrets mycotoxin and to reduce mycotoxincontamination in food and feed by these species as well asto search for remedy for infected food and feed the presentstudy of genetic diversity of Fusarium species will be useful.
CONCLUSION
RAPD marker was found to be powerful tool to analyzethe genetic variation among the Fusarium species. TheseFusarium species are responsible for producing mycotoxin,which is hazardous to animals and human beings. Theresults of the present study provide evidence that RAPDtechnique can be used for identification and differentiationof different Fusarium species. Study of mycotoxinsecreting Fusarium is necessary to avoid T-2 toxincontamination in food and feed. We suggest that RAPDmarker may be used as one of reliable alternative for thedetermination of genetic variation among the differentFusarium species.
ACKNOWLEDGEMENTS
The authors are grateful to Defense Research andDevelopment Organization (DRDO), New Delhi forproviding financial assistance for the present research.
REFERENCES
Abd-Elsalam KA, Schnieder F, Asran-Amal A, Khalil MS, Verreet JA.2003. Intra-species genomic groups in Fusarium semitectum and theircorrelation with origin and cultural characteristics. J Plant Dis Prot10: 409-418.
Arif M, Pani DR, Zaidi NW, Singh US. 2011. PCR-based identificationand characterization of Fusarium sp. associated with mangomalformation. Biotech Res Int. Article ID 141649, 6 pages, 2011.doi:10.4061/2011/141649
Assigbetse KB, Fernandez D, Dubois MP, Geiger JP. 1994.Differentiation of Fusarium oxysporum f. sp. vasinfectum races oncotton by Random amplified polymorphic DNA (RAPD) analysis.Phytopathol 84: 622-626.
Bonde SR, Gade AK, Rai MK. 2013. Genetic diversity among differentisolates of Fusarium equiseti (Corda Saccardo) isolated from fruitsand vegetables. Ind J Biotech (In press).
CAST [Council for Agricultural Science and Technology]. 2003.Mycotoxins: risks in plant, animal and human systems. Task ForceReport no. 139. Council for Agricultural Science and Technology,Ames IA 1-191.
Edel V, Steinberg C, Gautheron N, Recorbet G, Alabouvette C. 2001.Genetic diversity of Fusarium oxysporum populations isolated fromdifferent soils in France. FEMS Microb Ecol 36: 61-71.
Edwards SG, Callaghan J, Dobson AW. 2002. PCR-based detection andquantification of mycotoxigenic fungi. Mycol Res 106: 1005-1025.
El-Fadly GB, El-Kazzaz M, Hassan MA, El-Kot GA. 2008. Identificationof some Fusarium spp. using RAPD-PCR technique. Egyp JPhytopathol 36: 71-80.
Gupta VK, Misra AK, Gaur R, Pandey R, Chauhan UK. 2009. Studies ofgenetic polymorphism in the isolates of Fusarium solani. Austr JCrop Sci 3:101-106.
Gyongyossy-Issa MI, Khanna V, Khachatourians GC. 1985.Characterization of hemolysis induced by T-2 toxin. BiochimBiophys Acta 838: 252-256.
Ingle AP, Karwa A, Rai MK, Gherbawy Y. 2009. Fusarium: Moleculardetection, mycotoxins and biocontrol. In: Gherbawy Y, Mach R, RaiM (eds.). Curent Advance in Molecular Mycology. SciencePublishers Inc., Enfield, New Hampshire.
Ingle AP, Rai MK. 2011. Genetic Diversity among Indianphytopathogenic isolates of Fusarium semitectum Berkeley andRavenel. Adv Biosci Biotech 2: 142-148.
Latiffah Z, Zariman M, Baharuddin S. 2007. Diversity of Fusariumspecies in cultivated soils in Penang. Malay J Microb 3: 27-30.
Leon T, Raj S, Britto JD, Benjamin P, Kumar JR. 2011. RAPD-PCRfingerprint analysis of Cassia angustifolia Vahl. in TirunelveliDistrict of Tamil Nadu. Int J BioTechnol 2: 17-20.
Leslie JF, Summerell BA. 2006. The Fusarium laboratory manual, 3rd ed.Blackwell publishing professional, Ames IA, USA.
Menaka M, Phanni M, Malathy NS . 2011. Isolation and identification ofmicrocystin and mycotoxin from food borne fngus and to study aboutits antibacterial activity. EJLS 1:5-13.
Miller S. 1996. Detecting Propagules of plant pathogenic fungi. Adv BotRes 23: 73-102.
Moss MO, Long MT. 2002. Fate of patulin in the presence of yeastSaccharomyces cerevisiae. Food Addit Contam 19: 387-399.
Nagarajan G, Nam MH, Song JY, Yoo SJ, Kim HG. 2004. Geneticvariation in Fusarium oxysporum f. sp. fragariae populations basedon RAPD and rDNA RFLP analyses. Pl Pathol J 20: 264-270.
Niessen L. 2007. PCR based diagnosis and quantification of mycotoxinproducing fungi. Int J Food Microb 119:38-46.
Omurtag GZ, Yazıcıoglu Z. 2001. Occurrence of T-2 toxin in processedcereals and pulses in Turkey determined by HPLC and TLC. FoodAddit Contam 18: 844-849.
Pestka JJ, Smolinski AT. 2005. Deoxynivalenol: Toxicology and potentialeffects on humans. J Environ Sci Health B 8: 39-69.
Pujo I, Guarro J, Gene J, Sala JP. 1997. In vitro antifungal susceptibilityof clinical and environmental Fusarium spp. strains. J AntimicrobChemoth 39: 163-167.
Richard JL. 2007. Some major mycotoxins and their mycotoxicoses-anoverview. Int J Food Microbiol 119 (2) 3-10.
Sabir SM. 2006. Genotypic identification for some Fusarium sambucinumstrains isolated from Wheat in Upper Egypt. World J Agri Sci 2 (1) 6-10.
Sahoo L, Das BK, Parhi K, Mukherjee SC. 2010.DNA fingerprinting ofFlavobacterium columnare using RAPD-PCR. Ind J Microbiol 50:S10-S16.
SCF [Scientific Committee on Food]. 2001. Opinion on Fusarium Toxins.Part 5: T-2toxinandHT-2toxin.www.europa.eu.int/comm/food/fs/sc/scf/out88en.pdf._3.
Singh M, Chaudhuri I, Mandal SK, Chaudhuri RK. 2011. Development ofRAPD Markers linked to Fusarium Wilt Resistance Gene in CastorBean (Ricinus communis L). Genet Eng Biotech J (GEBJ-28): 1-8.
Skaria R, Sen S, Muneer PM. 2011. Analysis of genetic variability in ricevarieties (Oryza sativa L) of Kerala using RAPD markers. Genet EngBiotech J (GEBJ-24): 1-9.
Smith SN, Decay JE, Hsui HW, Jen LH, Hsieh WH, Lee HL. 2001. Soil-borne populations of Fusarium oxysporum f. sp. vasinfectum, cottonwilt fungus in California fields. Mycologia 93:737-743.
Steinkellner S, Mammerler R, Vierheilig H. 2008. Germination ofFusarium oxysporum in root exudates from tomato plants challengedwith different Fusarium oxysporum strains. Eur J Plant Path 122: 395-401.
Turner NW, Subrahmanyam S, Piletsky SA. 2009. Analytical methods fordetermination of mycotoxins: a review. Anal Chim Acta 632 : 168-180.
Wang ZG, Feng JN, Tonq Z. 1993. Human toxicosis caused by moldy ricecontaminated with Fusarium and T-2 toxin. Biomed Environ Sci 6:65-70.
BIODIVERSITAS ISSN: 1412-033XVolume 14, Number 2, October 2013 EISSN: 2085-4722Pages: 61-66 DOI: 10.13057/biodiv/d140202
Fungal species isolated from Quercus castaneifolia in HyrcanianForests, North of Iran
MOHAMMAD REZA KAVOSI1, FERIDON FARIDI1, GOODARZ HAJIZADEH2,♥1Department of Forest Science, Faculty of Forest Ecology, Gorgan University of Agricultural Sciences and Natural Resources, Gorgan, Golestan, Iran.
2Department of Forestry, Faculty of Natural Resources, Sari University of Agricultural Sciences and Natural Resources, Sari, Mazandaran, Iran. Tel./fax.+98 151 3822715, email: [email protected]
Manuscript received: 6 May 2013, Revision accepted: 17 July 2013.
ABSTRACT
Kavosi MR, Feridon F, Hajizadeh G. 2013. Fungal species isolated from Quercus castaneifolia in Hyrcanian Forests, North of Iran.Biodiversitas 14: 61-66. In order to isolate and identify of fungi associated with Quercus castaneifolia seed, sampling carried out inShast-Kalate, Ghorogh, Loveh and Golestan forest. Collected seeds sterilized and then separated sections including: outer section ofseed (crust) and inner seed section (endosperm). Each section of seed tissue is cultured on potato dextrose agar media. After sub-cultureand providing of the fungi pure cultures, various species isolated and identified by spores characteristics, their size and color, including:Aspergillus flavus, A. niger, Curvularia affinis, Trichoderma harzianum, Trichothecium roseum, Eurotium rubrum, E. amstelodami,Penicillium implicatum, P. fellutanum, Diplodia sp. Nigrospora gossypi, Alternaria alternata , Fusarium oxysporum and Beltraniasantapaui. The most frequency of fungus in Shast-Kalate forest was P. implicatum by 74% of frequency within seed section, the mostfrequency in Ghorogh and Loveh Forest was P. fellutanum with 63 and 66% of frequency within seed section respectively and the mostfrequency in Golestan forest was B. santapaui by 51% of frequency outer seed section. The result showed diversity of the fungi on theouter seed section is higher than within seed section. The results also showed during several isolation a saprophyte fungus always couldbe finding on the acorn seeds. This is the comprehensive report on fungi associated with Quercus castaneifolia seed in Hyrcanian forest,North of Iran.
Key words: crust, endosperm, fungal, Hyrcanian forest, Quercus castaneifolia, seed
INTRODUCTION
Forest tree seeds continuously are affected by physicaland physiological disturbance which most of these diseasescaused by fungi. Health and growth ability saplingconsiderably depend on seed quality (Mittal and Mathur1998). Most of fungi associate with seeds of forest trees aremolds which expand on surface of seed and sometime theyare inner pollution factor (Huss 1956). Effect of mold onseeds is that they seem health apparently but they originallyhave spoiled on basis of vitality considerable (Shea 1957).Recently known that all seeds contain microscopic fungispores whether on surface of seed or inside of seed (Singhand Mathur 1993). Urosevic (1961) was specified thatsome of fungi spores have germinated and after growingand mycelium penetrating, it influences in to the cotyledonwhich through have nourished from germs.
Fungus associate with seed can cause weakness of seedgermination directly and indirectly and can dispose theseseeds to earthborn pathogen fungi attack (Gibson 1957).Healthy seed in forest for natural regeneration is importantissues which future life forest depends on it. Disease anddamaged seeds even under suitable environmentalcondition cannot have desired regeneration for forestsurvival or cannot cause specific species. The treesappeared from damaged and diseased seeds have slightgrowth and seeds produced by these trees will be had low
vitality (Rai and Mamatha 2005).The purpose of this study was identification of inner
and outer fungi of Chestnut-leaved oak (Quercuscastaneifolia) seed and specifying their frequency inGolestan province forests.
MATERIALS AND METHODS
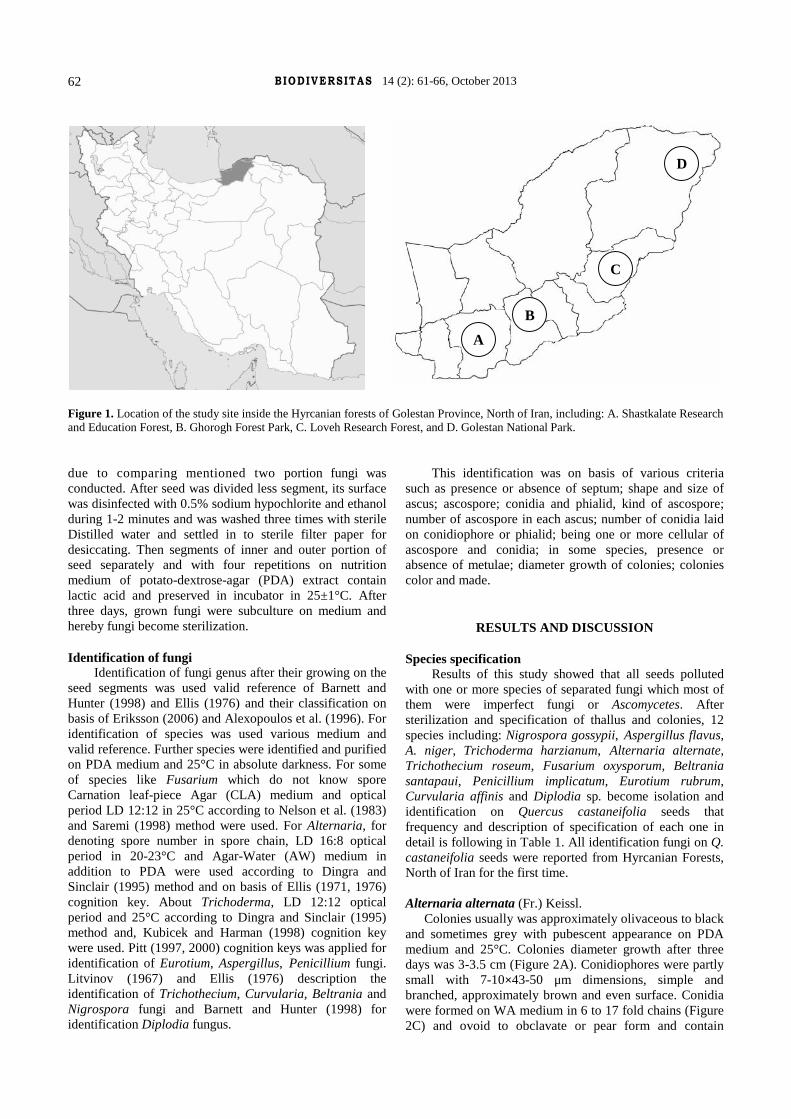
Sampling siteIn this research four forest regions in Golestan
province, north of Iran including (i) Shast-Kalate Researchand Education Forest, (ii) Ghorogh Forest Park, (iii) LovehResearch Forest, and (iv) Golestan National Park wereselected (Figure 1). In each region, four trees were chosenrandomly, and 25 seeds of each tree were selected randomly.Collected seeds have been settled in new and sterile bagsand after recording region specification and collection date,they transferred to laboratory and settled in a place withsuitable temperature and ventilation. In finally, foursamples of 25 kinds of seeds of each region were collected.
Isolation and purification seed fungiFor fungus isolation, seeds were divided less segments
and also inner (crust) and outer (endosperm) portion.Separation of inner portion from outer portion of seed
BIODIVERSITAS 14 (2): 61-66, October 201362
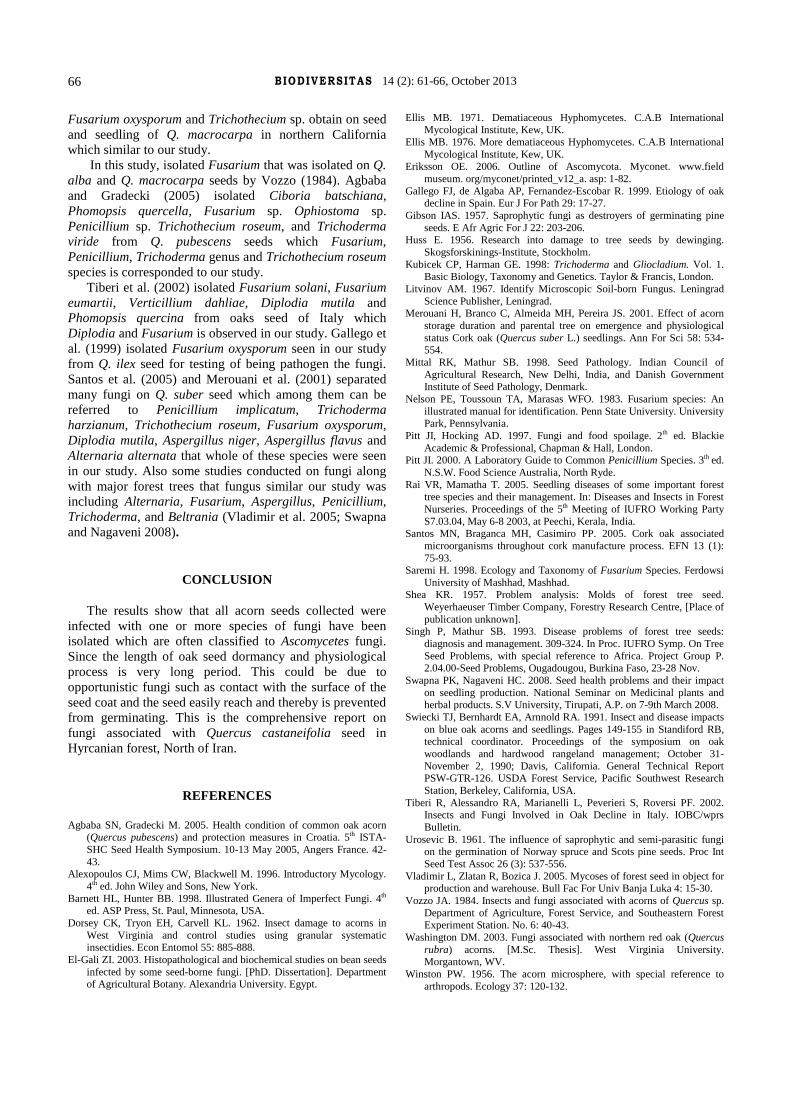
Figure 1. Location of the study site inside the Hyrcanian forests of Golestan Province, North of Iran, including: A. Shastkalate Researchand Education Forest, B. Ghorogh Forest Park, C. Loveh Research Forest, and D. Golestan National Park.
due to comparing mentioned two portion fungi wasconducted. After seed was divided less segment, its surfacewas disinfected with 0.5% sodium hypochlorite and ethanolduring 1-2 minutes and was washed three times with sterileDistilled water and settled in to sterile filter paper fordesiccating. Then segments of inner and outer portion ofseed separately and with four repetitions on nutritionmedium of potato-dextrose-agar (PDA) extract containlactic acid and preserved in incubator in 25±1°C. Afterthree days, grown fungi were subculture on medium andhereby fungi become sterilization.
Identification of fungiIdentification of fungi genus after their growing on the
seed segments was used valid reference of Barnett andHunter (1998) and Ellis (1976) and their classification onbasis of Eriksson (2006) and Alexopoulos et al. (1996). Foridentification of species was used various medium andvalid reference. Further species were identified and purifiedon PDA medium and 25°C in absolute darkness. For someof species like Fusarium which do not know sporeCarnation leaf-piece Agar (CLA) medium and opticalperiod LD 12:12 in 25°C according to Nelson et al. (1983)and Saremi (1998) method were used. For Alternaria, fordenoting spore number in spore chain, LD 16:8 opticalperiod in 20-23°C and Agar-Water (AW) medium inaddition to PDA were used according to Dingra andSinclair (1995) method and on basis of Ellis (1971, 1976)cognition key. About Trichoderma, LD 12:12 opticalperiod and 25°C according to Dingra and Sinclair (1995)method and, Kubicek and Harman (1998) cognition keywere used. Pitt (1997, 2000) cognition keys was applied foridentification of Eurotium, Aspergillus, Penicillium fungi.Litvinov (1967) and Ellis (1976) description theidentification of Trichothecium, Curvularia, Beltrania andNigrospora fungi and Barnett and Hunter (1998) foridentification Diplodia fungus.
This identification was on basis of various criteriasuch as presence or absence of septum; shape and size ofascus; ascospore; conidia and phialid, kind of ascospore;number of ascospore in each ascus; number of conidia laidon conidiophore or phialid; being one or more cellular ofascospore and conidia; in some species, presence orabsence of metulae; diameter growth of colonies; coloniescolor and made.
RESULTS AND DISCUSSION
Species specificationResults of this study showed that all seeds polluted
with one or more species of separated fungi which most ofthem were imperfect fungi or Ascomycetes. Aftersterilization and specification of thallus and colonies, 12species including: Nigrospora gossypii, Aspergillus flavus,A. niger, Trichoderma harzianum, Alternaria alternate,Trichothecium roseum, Fusarium oxysporum, Beltraniasantapaui, Penicillium implicatum, Eurotium rubrum,Curvularia affinis and Diplodia sp. become isolation andidentification on Quercus castaneifolia seeds thatfrequency and description of specification of each one indetail is following in Table 1. All identification fungi on Q.castaneifolia seeds were reported from Hyrcanian Forests,North of Iran for the first time.
Alternaria alternata (Fr.) Keissl.Colonies usually was approximately olivaceous to black
and sometimes grey with pubescent appearance on PDAmedium and 25°C. Colonies diameter growth after threedays was 3-3.5 cm (Figure 2A). Conidiophores were partlysmall with 7-10×43-50 μm dimensions, simple andbranched, approximately brown and even surface. Conidiawere formed on WA medium in 6 to 17 fold chains (Figure2C) and ovoid to obclavate or pear form and contain
Golestan D
A
B
C
KAVOSI et al. – Fungal species isolated from Quercus castanifolia 63
surface covered by tiny tubers. Conidia have 2 to 7transverse walls and 2 to 4 vertical walls and 12-34×6.5-12.5 μm dimensions and the end of the conidium nearestthe conidiophore was round while it tapers towards theapex with 2.5-4 μm width (Figure 2B).
Diplodia sp.Colonies was specified with whitish yellow on PDA
medium and 25°C (Figure 3A). Pycnidia were black,individual, spherical and stomatous (Figure 3B).Conidiophores were tiny and simple and conidia were dark,bicellular, 5-7 μm, elliptical or ovoid and in some of themthere was curve (Figure 3C).
Aspergillus flavus LinkColonies on PDA medium and 25°C was olive to lime
green with a cream reverse. Colonies has fast diametergrowth, after three days it was about 5.2 cm and has woollyto cottony texture which contain small granular (Figure4A). Hyphae have light and septum. Conidia were settledon vesicle radially or perpendicular. Conidiophores werecoarse and colourless and up to 800 μm length and 15-20μm width. Vesicles were spherical to semi spherical (20-40μm) and phialids (3-4×8-12 μm) covered approximately allsurface of vesicle. Conidia were 3-6 μm, even, tiny andspherical to semi spherical (Figure 4B).
Aspergillus niger Tiegh. nom. cons.Colonies at first was white but due to producing conidia
become black and the reverse side seemed light yellow orpail on PDA medium and 25°C which during the growth,they produced radial gaps on medium (Figure 5A).Colonies diameter growth after three days was 4.3 cm.Hyphae had transparent and septum that conidia weresettled on vesicle radially. This species produced metulae.Conidiophores were long (400 to 3000 μm), even andtransparent that were dark in tip and end to bubble or cellof spherical vesicle (30-75 μm). Metulaes and phialids
cover all surface of vesicle. Conidia were brown to black,uneven and with tuber, spherical and 4-5 μm (Figure 5B).
Curvularia affinis Boedijn.Colonies was black to dark greenish black on PDA
medium and 25°C which in white margins, colonies texturewas cotton and its diameter growth after three days was 4.4cm (Figure 6A). Conidiophores mostly were simple andhad spores that formed with two sympodial geniculate.Conidia were 2 to 4 cells, 23-33×8-14 μm, fusiform andcurve so that the central cell was typically darker andenlarged compared to the end cells in the conidium and theswelling of the central cell usually gave the conidium acurved appearance (Figure 6B).
Eurotium rubrum Jos. König etal Bainier & SartoryColonies on PDA medium and 25°C was reddish
orange that in white margin, colonies texture was cottonand its diameter growth after three days was 3.5 cm (Figure7A). Cleistothecia were occurred spherical to nearlyelliptical form and with yellow colour (Figure 7B).Ascuses were almost egg form to elliptical, 12-13 μm andthey had a tiny and unstable wall. Ascospores wereunicellular, oblate (like a flattened sphere) and haveequatorial ridges, thus resembling pulleys, 4.4-5×6.2-6.8μm, elliptical, yellow with even margin and with eight foldform in to the Ascus (Figure 7C).
Nigrospora gossypii Jacz.Colonies on PDA medium and 25°C was dark grey with
small and large while point in its background which werebasically cotton form that stick fungus mycelium to top ofthe container. It’s colour was black grey and approximatelydark-blue behind of container and colonies diametergrowth after 3 days was 7-7.5 cm (Figure 8A).Conidiophores were simple, transparent and were settledvertically on mycelium which their length was 10-12.5 μm.Conidia were black, unicellular and semi spherical andpartiy elliptical form with even surface and flat section thattheir size was 11-15 μm. This fungus also had middlechlamydospores (Figure 8B).
Penicillium implicatum BiourgeColonies on PDA medium and 25°C at first was cotton
white that finally will become powdery blue-green (Figure9A). Colonies diameter growth after 3 days was 2.6 cm.Conidiophores were out of growth mycelium individuallyand ended to phialids. Conidiophore height was 25-50 μmand phialids length was 8-10 μm. Conidia were spherical,dark green, 2-3.5 μm, unicellular, and were formed fromchains which youngest conidia settled in base of chain(Figure 9B).
Beltrania santapaui Pirozynski & PatilColonies on PDA medium and 25°C was grayish dark
brown which behind of container was light grey andcolonies growth on PDA medium after three days was 3.5cm (Figure 10A). Conidiophores were simple and hadseptum which at the end, they were branched and conidiawere formed on each of these branches (Figure 10B).Conidiophore length was 87.5 μm and conidia were seen
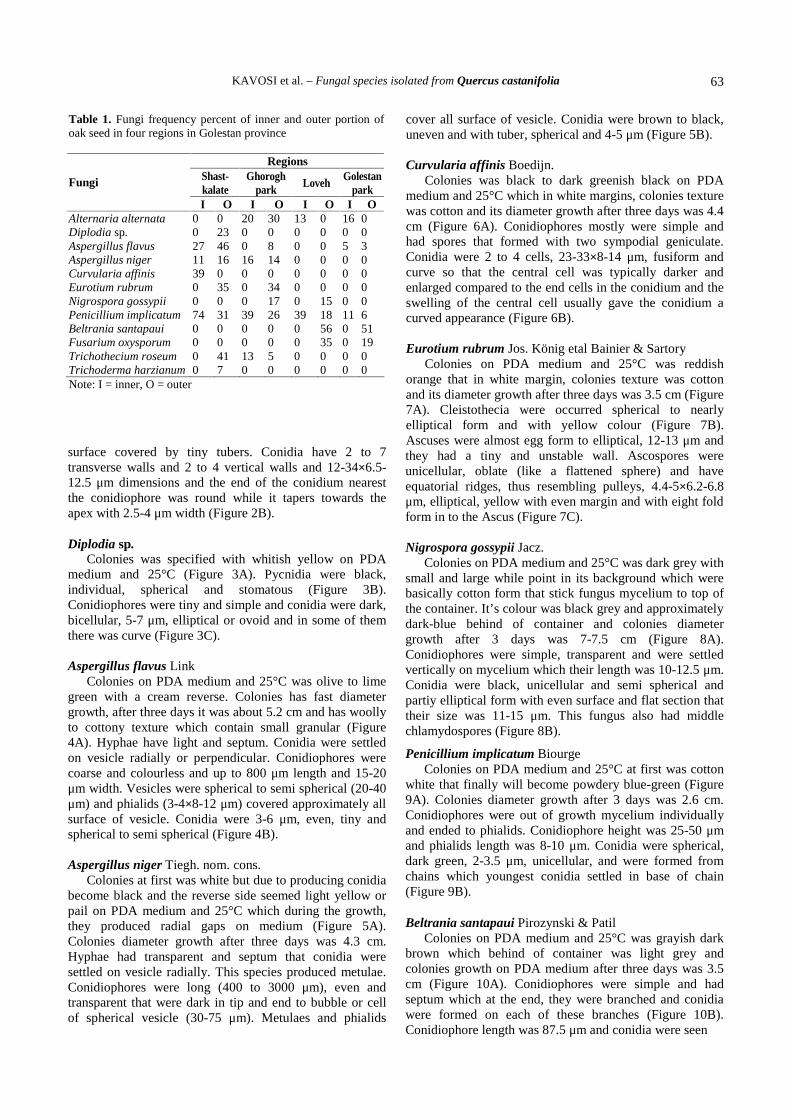
Table 1. Fungi frequency percent of inner and outer portion ofoak seed in four regions in Golestan province
RegionsShast-kalate
Ghoroghpark Loveh Golestan
parkFungi
I O I O I O I OAlternaria alternata 0 0 20 30 13 0 16 0Diplodia sp. 0 23 0 0 0 0 0 0Aspergillus flavus 27 46 0 8 0 0 5 3Aspergillus niger 11 16 16 14 0 0 0 0Curvularia affinis 39 0 0 0 0 0 0 0Eurotium rubrum 0 35 0 34 0 0 0 0Nigrospora gossypii 0 0 0 17 0 15 0 0Penicillium implicatum 74 31 39 26 39 18 11 6Beltrania santapaui 0 0 0 0 0 56 0 51Fusarium oxysporum 0 0 0 0 0 35 0 19Trichothecium roseum 0 41 13 5 0 0 0 0Trichoderma harzianum 0 7 0 0 0 0 0 0Note: I = inner, O = outer
BIODIVERSITAS 14 (2): 61-66, October 201364
4A
5A
4B
5B 6A 6B
7A 7B 6C
b1
7C 8A 8B
9A 9B 10A 10B 10C
11A 11B 11C
3B 3C
3A2A 2B 2CA
KAVOSI et al. – Fungal species isolated from Quercus castanifolia 65
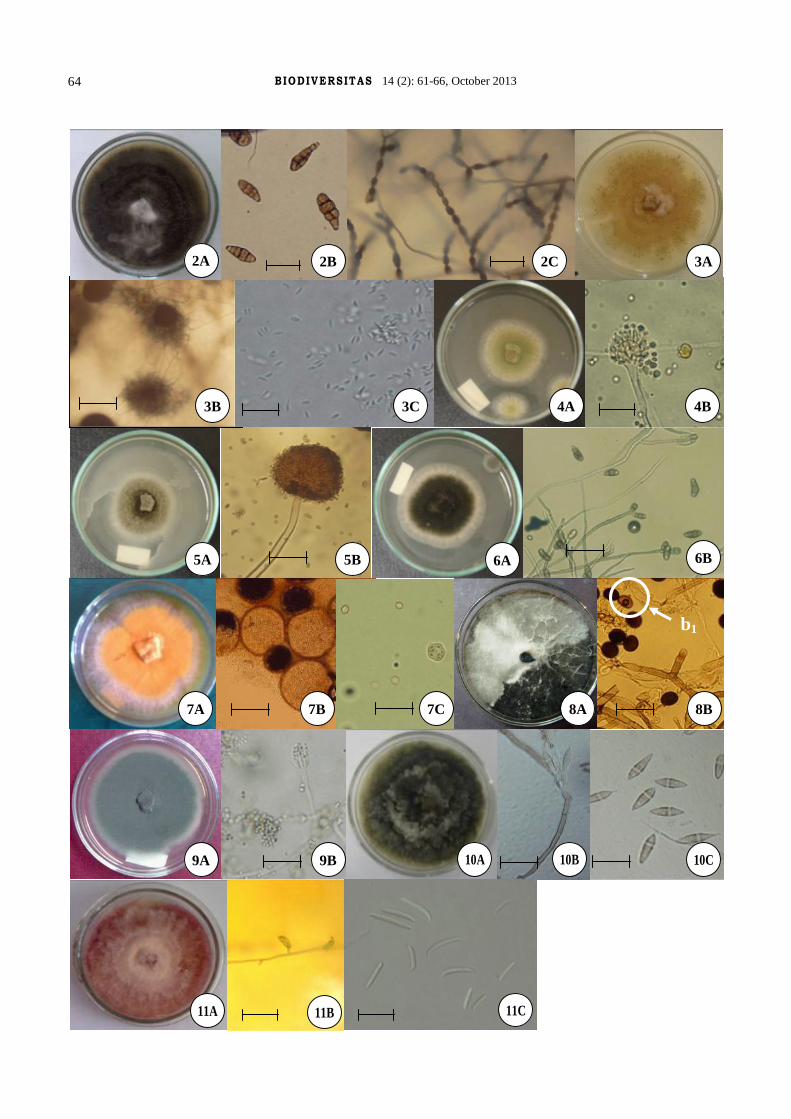
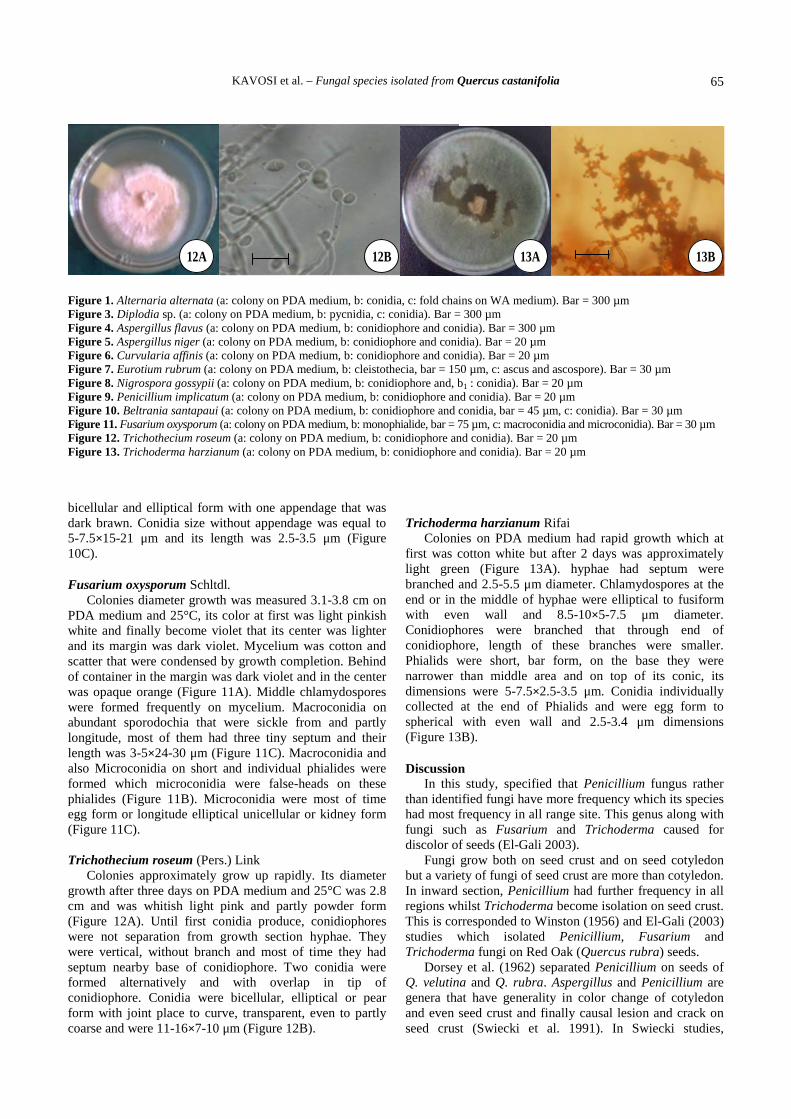
Figure 1. Alternaria alternata (a: colony on PDA medium, b: conidia, c: fold chains on WA medium). Bar = 300 µmFigure 3. Diplodia sp. (a: colony on PDA medium, b: pycnidia, c: conidia). Bar = 300 µmFigure 4. Aspergillus flavus (a: colony on PDA medium, b: conidiophore and conidia). Bar = 300 µmFigure 5. Aspergillus niger (a: colony on PDA medium, b: conidiophore and conidia). Bar = 20 µmFigure 6. Curvularia affinis (a: colony on PDA medium, b: conidiophore and conidia). Bar = 20 µmFigure 7. Eurotium rubrum (a: colony on PDA medium, b: cleistothecia, bar = 150 µm, c: ascus and ascospore). Bar = 30 µmFigure 8. Nigrospora gossypii (a: colony on PDA medium, b: conidiophore and, b1 : conidia). Bar = 20 µmFigure 9. Penicillium implicatum (a: colony on PDA medium, b: conidiophore and conidia). Bar = 20 µmFigure 10. Beltrania santapaui (a: colony on PDA medium, b: conidiophore and conidia, bar = 45 µm, c: conidia). Bar = 30 µmFigure 11. Fusarium oxysporum (a: colony on PDA medium, b: monophialide, bar = 75 µm, c: macroconidia and microconidia). Bar = 30 µmFigure 12. Trichothecium roseum (a: colony on PDA medium, b: conidiophore and conidia). Bar = 20 µmFigure 13. Trichoderma harzianum (a: colony on PDA medium, b: conidiophore and conidia). Bar = 20 µm
bicellular and elliptical form with one appendage that wasdark brawn. Conidia size without appendage was equal to5-7.5×15-21 μm and its length was 2.5-3.5 μm (Figure10C).
Fusarium oxysporum Schltdl.Colonies diameter growth was measured 3.1-3.8 cm on
PDA medium and 25°C, its color at first was light pinkishwhite and finally become violet that its center was lighterand its margin was dark violet. Mycelium was cotton andscatter that were condensed by growth completion. Behindof container in the margin was dark violet and in the centerwas opaque orange (Figure 11A). Middle chlamydosporeswere formed frequently on mycelium. Macroconidia onabundant sporodochia that were sickle from and partlylongitude, most of them had three tiny septum and theirlength was 3-5×24-30 μm (Figure 11C). Macroconidia andalso Microconidia on short and individual phialides wereformed which microconidia were false-heads on thesephialides (Figure 11B). Microconidia were most of timeegg form or longitude elliptical unicellular or kidney form(Figure 11C).
Trichothecium roseum (Pers.) LinkColonies approximately grow up rapidly. Its diameter
growth after three days on PDA medium and 25°C was 2.8cm and was whitish light pink and partly powder form(Figure 12A). Until first conidia produce, conidiophoreswere not separation from growth section hyphae. Theywere vertical, without branch and most of time they hadseptum nearby base of conidiophore. Two conidia wereformed alternatively and with overlap in tip ofconidiophore. Conidia were bicellular, elliptical or pearform with joint place to curve, transparent, even to partlycoarse and were 11-16×7-10 μm (Figure 12B).
Trichoderma harzianum RifaiColonies on PDA medium had rapid growth which at
first was cotton white but after 2 days was approximatelylight green (Figure 13A). hyphae had septum werebranched and 2.5-5.5 μm diameter. Chlamydospores at theend or in the middle of hyphae were elliptical to fusiformwith even wall and 8.5-10×5-7.5 μm diameter.Conidiophores were branched that through end ofconidiophore, length of these branches were smaller.Phialids were short, bar form, on the base they werenarrower than middle area and on top of its conic, itsdimensions were 5-7.5×2.5-3.5 μm. Conidia individuallycollected at the end of Phialids and were egg form tospherical with even wall and 2.5-3.4 μm dimensions(Figure 13B).
DiscussionIn this study, specified that Penicillium fungus rather
than identified fungi have more frequency which its specieshad most frequency in all range site. This genus along withfungi such as Fusarium and Trichoderma caused fordiscolor of seeds (El-Gali 2003).
Fungi grow both on seed crust and on seed cotyledonbut a variety of fungi of seed crust are more than cotyledon.In inward section, Penicillium had further frequency in allregions whilst Trichoderma become isolation on seed crust.This is corresponded to Winston (1956) and El-Gali (2003)studies which isolated Penicillium, Fusarium andTrichoderma fungi on Red Oak (Quercus rubra) seeds.
Dorsey et al. (1962) separated Penicillium on seeds ofQ. velutina and Q. rubra. Aspergillus and Penicillium aregenera that have generality in color change of cotyledonand even seed crust and finally causal lesion and crack onseed crust (Swiecki et al. 1991). In Swiecki studies,
a12A 12B 13A 13B
BIODIVERSITAS 14 (2): 61-66, October 201366
Fusarium oxysporum and Trichothecium sp. obtain on seedand seedling of Q. macrocarpa in northern Californiawhich similar to our study.
In this study, isolated Fusarium that was isolated on Q.alba and Q. macrocarpa seeds by Vozzo (1984). Agbabaand Gradecki (2005) isolated Ciboria batschiana,Phomopsis quercella, Fusarium sp. Ophiostoma sp.Penicillium sp. Trichothecium roseum, and Trichodermaviride from Q. pubescens seeds which Fusarium,Penicillium, Trichoderma genus and Trichothecium roseumspecies is corresponded to our study.
Tiberi et al. (2002) isolated Fusarium solani, Fusariumeumartii, Verticillium dahliae, Diplodia mutila andPhomopsis quercina from oaks seed of Italy whichDiplodia and Fusarium is observed in our study. Gallego etal. (1999) isolated Fusarium oxysporum seen in our studyfrom Q. ilex seed for testing of being pathogen the fungi.Santos et al. (2005) and Merouani et al. (2001) separatedmany fungi on Q. suber seed which among them can bereferred to Penicillium implicatum, Trichodermaharzianum, Trichothecium roseum, Fusarium oxysporum,Diplodia mutila, Aspergillus niger, Aspergillus flavus andAlternaria alternata that whole of these species were seenin our study. Also some studies conducted on fungi alongwith major forest trees that fungus similar our study wasincluding Alternaria, Fusarium, Aspergillus, Penicillium,Trichoderma, and Beltrania (Vladimir et al. 2005; Swapnaand Nagaveni 2008).
CONCLUSION
The results show that all acorn seeds collected wereinfected with one or more species of fungi have beenisolated which are often classified to Ascomycetes fungi.Since the length of oak seed dormancy and physiologicalprocess is very long period. This could be due toopportunistic fungi such as contact with the surface of theseed coat and the seed easily reach and thereby is preventedfrom germinating. This is the comprehensive report onfungi associated with Quercus castaneifolia seed inHyrcanian forest, North of Iran.
REFERENCES
Agbaba SN, Gradecki M. 2005. Health condition of common oak acorn(Quercus pubescens) and protection measures in Croatia. 5th ISTA-SHC Seed Health Symposium. 10-13 May 2005, Angers France. 42-43.
Alexopoulos CJ, Mims CW, Blackwell M. 1996. Introductory Mycology.4th ed. John Wiley and Sons, New York.
Barnett HL, Hunter BB. 1998. Illustrated Genera of Imperfect Fungi. 4th
ed. ASP Press, St. Paul, Minnesota, USA.Dorsey CK, Tryon EH, Carvell KL. 1962. Insect damage to acorns in
West Virginia and control studies using granular systematicinsectidies. Econ Entomol 55: 885-888.
El-Gali ZI. 2003. Histopathological and biochemical studies on bean seedsinfected by some seed-borne fungi. [PhD. Dissertation]. Departmentof Agricultural Botany. Alexandria University. Egypt.
Ellis MB. 1971. Dematiaceous Hyphomycetes. C.A.B InternationalMycological Institute, Kew, UK.
Ellis MB. 1976. More dematiaceous Hyphomycetes. C.A.B InternationalMycological Institute, Kew, UK.
Eriksson OE. 2006. Outline of Ascomycota. Myconet. www.fieldmuseum. org/myconet/printed_v12_a. asp: 1-82.
Gallego FJ, de Algaba AP, Fernandez-Escobar R. 1999. Etiology of oakdecline in Spain. Eur J For Path 29: 17-27.
Gibson IAS. 1957. Saprophytic fungi as destroyers of germinating pineseeds. E Afr Agric For J 22: 203-206.
Huss E. 1956. Research into damage to tree seeds by dewinging.Skogsforskinings-Institute, Stockholm.
Kubicek CP, Harman GE. 1998: Trichoderma and Gliocladium. Vol. 1.Basic Biology, Taxonomy and Genetics. Taylor & Francis, London.
Litvinov AM. 1967. Identify Microscopic Soil-born Fungus. LeningradScience Publisher, Leningrad.
Merouani H, Branco C, Almeida MH, Pereira JS. 2001. Effect of acornstorage duration and parental tree on emergence and physiologicalstatus Cork oak (Quercus suber L.) seedlings. Ann For Sci 58: 534-554.
Mittal RK, Mathur SB. 1998. Seed Pathology. Indian Council ofAgricultural Research, New Delhi, India, and Danish GovernmentInstitute of Seed Pathology, Denmark.
Nelson PE, Toussoun TA, Marasas WFO. 1983. Fusarium species: Anillustrated manual for identification. Penn State University. UniversityPark, Pennsylvania.
Pitt JI, Hocking AD. 1997. Fungi and food spoilage. 2th ed. BlackieAcademic & Professional, Chapman & Hall, London.
Pitt JI. 2000. A Laboratory Guide to Common Penicillium Species. 3th ed.N.S.W. Food Science Australia, North Ryde.
Rai VR, Mamatha T. 2005. Seedling diseases of some important foresttree species and their management. In: Diseases and Insects in ForestNurseries. Proceedings of the 5th Meeting of IUFRO Working PartyS7.03.04, May 6-8 2003, at Peechi, Kerala, India.
Santos MN, Braganca MH, Casimiro PP. 2005. Cork oak associatedmicroorganisms throughout cork manufacture process. EFN 13 (1):75-93.
Saremi H. 1998. Ecology and Taxonomy of Fusarium Species. FerdowsiUniversity of Mashhad, Mashhad.
Shea KR. 1957. Problem analysis: Molds of forest tree seed.Weyerhaeuser Timber Company, Forestry Research Centre, [Place ofpublication unknown].
Singh P, Mathur SB. 1993. Disease problems of forest tree seeds:diagnosis and management. 309-324. In Proc. IUFRO Symp. On TreeSeed Problems, with special reference to Africa. Project Group P.2.04.00-Seed Problems, Ougadougou, Burkina Faso, 23-28 Nov.
Swapna PK, Nagaveni HC. 2008. Seed health problems and their impacton seedling production. National Seminar on Medicinal plants andherbal products. S.V University, Tirupati, A.P. on 7-9th March 2008.
Swiecki TJ, Bernhardt EA, Arnnold RA. 1991. Insect and disease impactson blue oak acorns and seedlings. Pages 149-155 in Standiford RB,technical coordinator. Proceedings of the symposium on oakwoodlands and hardwood rangeland management; October 31-November 2, 1990; Davis, California. General Technical ReportPSW-GTR-126. USDA Forest Service, Pacific Southwest ResearchStation, Berkeley, California, USA.
Tiberi R, Alessandro RA, Marianelli L, Peverieri S, Roversi PF. 2002.Insects and Fungi Involved in Oak Decline in Italy. IOBC/wprsBulletin.
Urosevic B. 1961. The influence of saprophytic and semi-parasitic fungion the germination of Norway spruce and Scots pine seeds. Proc IntSeed Test Assoc 26 (3): 537-556.
Vladimir L, Zlatan R, Bozica J. 2005. Mycoses of forest seed in object forproduction and warehouse. Bull Fac For Univ Banja Luka 4: 15-30.
Vozzo JA. 1984. Insects and fungi associated with acorns of Quercus sp.Department of Agriculture, Forest Service, and Southeastern ForestExperiment Station. No. 6: 40-43.
Washington DM. 2003. Fungi associated with northern red oak (Quercusrubra) acorns. [M.Sc. Thesis]. West Virginia University.Morgantown, WV.
Winston PW. 1956. The acorn microsphere, with special reference toarthropods. Ecology 37: 120-132.

BIODIVERSITAS ISSN: 1412-033XVolume 14, Number 2, October 2013 E-ISSN: 2085-4722Pages: 67-72 DOI: 10.13057/biodiv/d140203
Observations on arbuscular mycorrhiza associated with importantedible tuberous plants grown in wet evergreen forest in Assam, India
RAJESH KUMAR1,♥, ASHWANI TAPWAL2, SHAILESH PANDEY1, RAJA RISHI1, DEVAPOD BORAH1
1Rain Forest Research Institute, P.O. 136, Jorhat 785001, Assam, India. Tel.: +91-0376-2305106, ♥e-mail: [email protected] Research Institute, Dehradun 248006, Uttrakhand, India
Manuscript received: 9 May 2013. Revision accepted: 16 July 2013.
ABSTRACT
Kumar R, Tapwal A, Pandey S, Rishi R, Borah D. 2013. Observations on arbuscular mycorrhiza associated with important edibletuberous plants grown in wet evergreen forest in Assam, India. Biodiversitas 14: 67-72. Non-timber forest products constitute animportant source of livelihood for rural households from forest fringe communities across the world. Utilization of wild edible tuberplants is an integral component of their culture. Mycorrhizal associations influence the establishment and production of tuber plantsunder field conditions. The aim of present study is to explore the diversity and arbuscular mycorrhizal (AMF) colonization of wildedible tuber plants grown in wet evergreen forest of Assam, India. A survey was conducted in 2009-10 in Sunaikuchi, Khulahat, andBura Mayong reserved forest of Morigaon district of Assam to determine the AMF spore population in rhizosphere soils and rootcolonization of 14 tuberous edible plants belonging to five families. The results revealed AMF colonization of all selected species in allseasons. The percent colonization and spore count was less in summer, moderate in winter and highest in rainy season. Seventeenspecies of arbuscular mycorrhizal fungi were recorded in four genera viz. Acaulospora (7 species), Glomus (5 species), Sclerocystis (3species) and Gigaspora (2 species).
Key words: AMF, root colonization, wild edible tuber
INTRODUCTION
Wild edible plants refer to species that are neithercultivated nor domesticated, but available from theirnatural habitat and used as source of food (Beluhan andRanogajec 2010). They are collected by forest fringecommunities for their requirement of food and livelihoods.Earlier works have reported the wild edible plants as apotential source of nutrition and many of them have highernutrition than conventionally eaten crops (Grivetti andOgle 2000). Arbuscular mycorrhizal fungi (AMF) colonizethe roots of higher plant as obligate symbionts, where thehost generally benefited through increased nutrient uptake,improved growth and better survival (Linderman 1994;Akhtar and Siddiqui 2007; Smith and Read, 2008). Soil ischaracterized by the presence of a diverse population ofmicroorganisms of which mycorrhizal fungi constitutes oneof important component. Arbuscular mycorrhizal (AM)fungi are the most common types among all mycorrhizaeand represent a major group of soil microbial community(Linderman 1992). Arbuscular Mycorrhiza is a widespreadmutualistic symbiosis between land plants and fungibelonging to the phylum Glomeromycota. Their occurrenceas root symbionts has been reported from exceptionallywide range of plants (Sharma et al. 2007). The AMFassociation may also increase the tolerance of host plantagainst biotic (Hol and Cook 2005; Akhtar and Siddiqui2007) and abiotic stresses, including salinity and drought(Cartmill et al. 2007). In modern years, AM fungi gained
considerable importance in horticulture, agriculture,afforestation and land reclamation (Javot et al. 2007)because of their potentially to improve growth and yield ofthe plants by increasing the nutrient uptake (Jensen 1984).AM fungal association found in all organs of plants whichare concerned with the absorption of substances from thesoil (Srivastava et al. 1996). The occurrence of AM fungiassociation with the portions other than roots was reviewedby Nazim (1990). Presence of AM association has beenreported in tubers of Pueraria tuberosa (Willd.) DC(Rodrigues 1996), Colocasia esculenta (L.) Scott (Bhat andKaveriappa 1997), garlic bulbs (Kunwar et al. 1999) andtubers of Gloriosa superba L. (Khade and Rodrigues2003). AMF colonization varies with season and its effectsalso influence the establishment of plants under fieldcondition (Giovannetti and Nicolson 1983). Information onAM association with tuberous plants is scanty. Therefore,the present study is aimed to determine the AMF sporepopulation in rhizosphere soils and its colonization for wildedible tuberous plants during different seasons inSunaikuchi, Khulahat and Bura Mayong reserve forest ofMorigaon district in Assam, India.
MATERIALS AND METHODS
Study area The Sunaikuchi, Khulahat, and Bura Mayong Reserved
Forests are situated in Morigaon district of Assam, India
BIODIVERSITAS 14 (2): 67-72, October 201368
between 26.15° to 26.5° Northern latitude and 92° to 95.5°Eastern longitude (Figure 1). These three Reserved Forest,(RF) of Morigaon district formed under Assam ForestRegulation Act, 1891. The area receives annual rainfall isabout 1530.9 mm and the annual average maximumtemperature is 30.4°C and the minimum is 19.8°C. Fringearea of the RF is inhabited by a few ethnic groups such asKarbis, Bodos, Kukis, Dimasas, Hmars, Garos, RengmaNagas and Tiwas. These communities are dependent onforest for habitat and other needs for well-being; the forestcontributes livelihoods to many households as well.
Target speciesThe root and rhizosphere soil samples of 14 wild edible
tuberous plants belonging to five families were collected
viz; Ipomoea batatas (L.) Lam., Pueraria thomsoniiBenth., Pueraria tuberosa (Wild.) D.C, Vigna vexillata (L.)Rich., Alocasia odora (Roxb.) C. L. Koch, Alocasiacucullata Schott., Colocasia esculenta (L.) Schott.,Sagittaria sagittifolia L., Amorphophallus campanulatusRoxb., Dioscorea pentaphylla L., Dioscorea puber (Bl.),Dioscorea alata L., Dioscorea esculenta Burk., Dioscoreabatatas Decene (Figure 2), belonging to four familiesFabaceae, Araceae, Araceae and Dioscoreaceaerespectively) and studied.
AMF spore isolation, enumeration and identificationA total of 150 soil samples were collected from the
rhizosphere of 14 plants species having tuber from a depthof 5-30 cm during mid-May, late July, and early September
Figure 1. Study sites at Sunaikuchi, Khulahat and Bura Mayong Reserved Forests (●) in Morigaon district of Assam, India
CHINA
BUTAN
MYANMAR
BANGLADESH
KUMAR et al. – Arbuscular mycorrhiza in wet evergreen forest in Assam 69
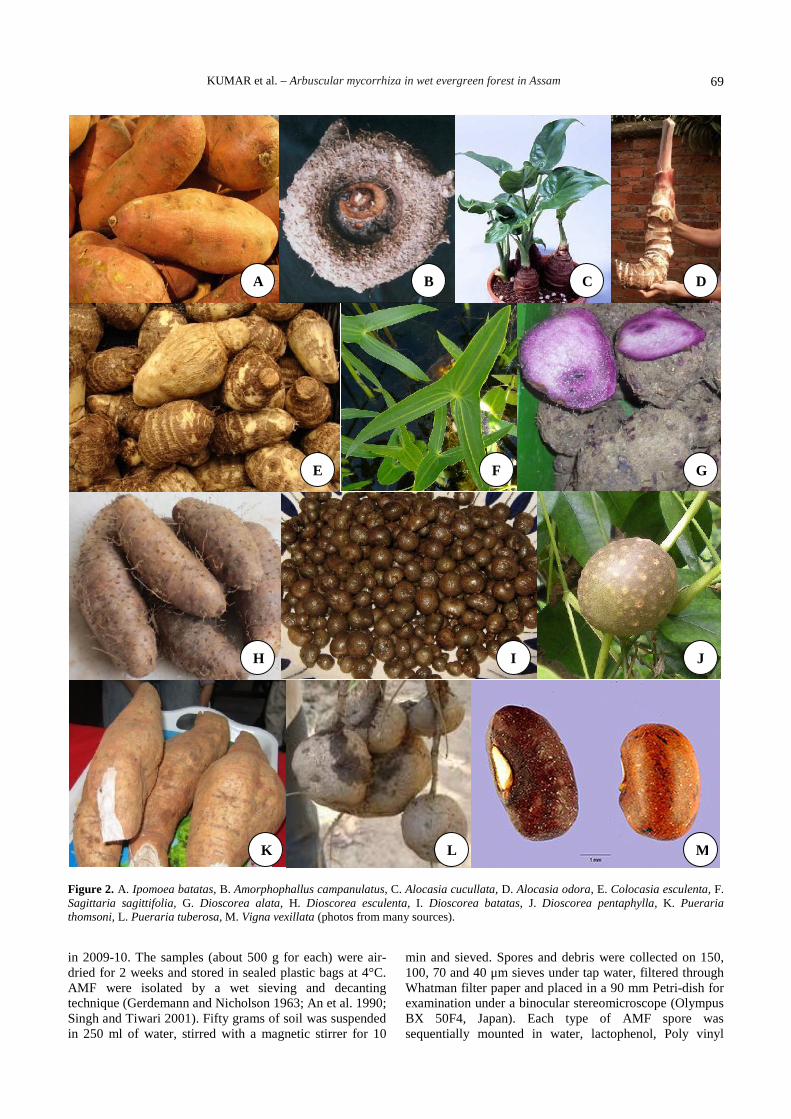
Figure 2. A. Ipomoea batatas, B. Amorphophallus campanulatus, C. Alocasia cucullata, D. Alocasia odora, E. Colocasia esculenta, F.Sagittaria sagittifolia, G. Dioscorea alata, H. Dioscorea esculenta, I. Dioscorea batatas, J. Dioscorea pentaphylla, K. Puerariathomsoni, L. Pueraria tuberosa, M. Vigna vexillata (photos from many sources).
in 2009-10. The samples (about 500 g for each) were air-dried for 2 weeks and stored in sealed plastic bags at 4°C.AMF were isolated by a wet sieving and decantingtechnique (Gerdemann and Nicholson 1963; An et al. 1990;Singh and Tiwari 2001). Fifty grams of soil was suspendedin 250 ml of water, stirred with a magnetic stirrer for 10
min and sieved. Spores and debris were collected on 150,100, 70 and 40 μm sieves under tap water, filtered throughWhatman filter paper and placed in a 90 mm Petri-dish forexamination under a binocular stereomicroscope (OlympusBX 50F4, Japan). Each type of AMF spore wassequentially mounted in water, lactophenol, Poly vinyl
A B D
E F G
H I J
K L M
C
BIODIVERSITAS 14 (2): 67-72, October 201370
alcohol and Melzer’s reagent (Morton 1988; Morton andBenny 1990) for identification. The spores were identifiedup to the species level with the help of a VAM fungiidentification manual (Schenck and Perez 1990). Theidentification was based on spore color, size, surfaceornamentation and wall structure with reference to thedescriptions and pictures provided by the InternationalCollection of Vesicular and Arbuscular Mycorrhizal Fungi(http://invam.caf.wvu.edu) and originally published speciesdescriptions.
Analysis of AMF and DSE colonizationRoots were washed thoroughly in tap water and cut into
approximately 1cm long segments. The roots were clearedin 10% (w/v) KOH by heating at 90°C for 1 to 2 h,depending on the degree of lignifications of the roots, thenwashed and stained with stamp pad ink (Das and Kayang2008). The stained root samples were mounted on slidesand examined for AM colonization under a lightmicroscope. The colonization of root length witharbuscules, vesicles, hyphae and dark septate endophytesper sample were quantified by the magnified intersectionsmethod (McGonigle et al. 1990). Percent root colonizationwas determined using the following formula:
% Root colonization = No. of positive segments x 100No. of segments observed
RESULTS AND DISCUSSION
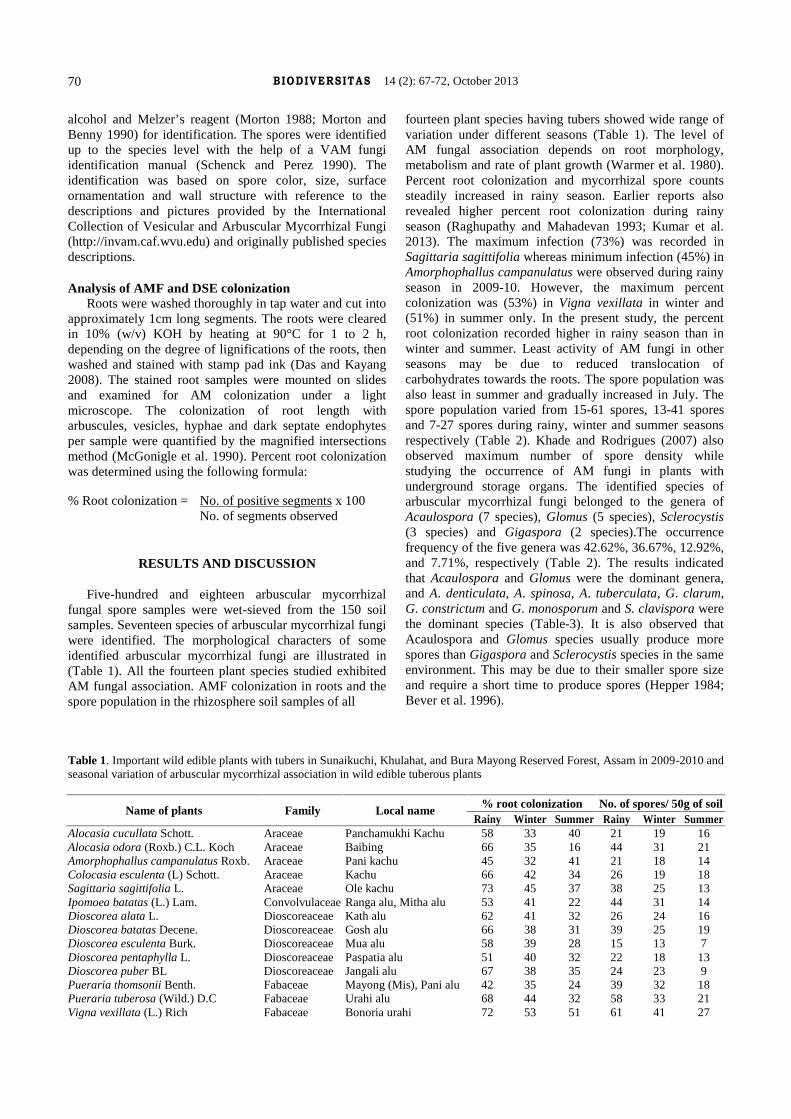
Five-hundred and eighteen arbuscular mycorrhizalfungal spore samples were wet-sieved from the 150 soilsamples. Seventeen species of arbuscular mycorrhizal fungiwere identified. The morphological characters of someidentified arbuscular mycorrhizal fungi are illustrated in(Table 1). All the fourteen plant species studied exhibitedAM fungal association. AMF colonization in roots and thespore population in the rhizosphere soil samples of all
fourteen plant species having tubers showed wide range ofvariation under different seasons (Table 1). The level ofAM fungal association depends on root morphology,metabolism and rate of plant growth (Warmer et al. 1980).Percent root colonization and mycorrhizal spore countssteadily increased in rainy season. Earlier reports alsorevealed higher percent root colonization during rainyseason (Raghupathy and Mahadevan 1993; Kumar et al.2013). The maximum infection (73%) was recorded inSagittaria sagittifolia whereas minimum infection (45%) inAmorphophallus campanulatus were observed during rainyseason in 2009-10. However, the maximum percentcolonization was (53%) in Vigna vexillata in winter and(51%) in summer only. In the present study, the percentroot colonization recorded higher in rainy season than inwinter and summer. Least activity of AM fungi in otherseasons may be due to reduced translocation ofcarbohydrates towards the roots. The spore population wasalso least in summer and gradually increased in July. Thespore population varied from 15-61 spores, 13-41 sporesand 7-27 spores during rainy, winter and summer seasonsrespectively (Table 2). Khade and Rodrigues (2007) alsoobserved maximum number of spore density whilestudying the occurrence of AM fungi in plants withunderground storage organs. The identified species ofarbuscular mycorrhizal fungi belonged to the genera ofAcaulospora (7 species), Glomus (5 species), Sclerocystis(3 species) and Gigaspora (2 species).The occurrencefrequency of the five genera was 42.62%, 36.67%, 12.92%,and 7.71%, respectively (Table 2). The results indicatedthat Acaulospora and Glomus were the dominant genera,and A. denticulata, A. spinosa, A. tuberculata, G. clarum,G. constrictum and G. monosporum and S. clavispora werethe dominant species (Table-3). It is also observed thatAcaulospora and Glomus species usually produce morespores than Gigaspora and Sclerocystis species in the sameenvironment. This may be due to their smaller spore sizeand require a short time to produce spores (Hepper 1984;Bever et al. 1996).
Table 1. Important wild edible plants with tubers in Sunaikuchi, Khulahat, and Bura Mayong Reserved Forest, Assam in 2009-2010 andseasonal variation of arbuscular mycorrhizal association in wild edible tuberous plants
% root colonization No. of spores/ 50g of soilName of plants Family Local nameRainy Winter Summer Rainy Winter Summer
Alocasia cucullata Schott. Araceae Panchamukhi Kachu 58 33 40 21 19 16Alocasia odora (Roxb.) C.L. Koch Araceae Baibing 66 35 16 44 31 21Amorphophallus campanulatus Roxb. Araceae Pani kachu 45 32 41 21 18 14Colocasia esculenta (L) Schott. Araceae Kachu 66 42 34 26 19 18Sagittaria sagittifolia L. Araceae Ole kachu 73 45 37 38 25 13Ipomoea batatas (L.) Lam. Convolvulaceae Ranga alu, Mitha alu 53 41 22 44 31 14Dioscorea alata L. Dioscoreaceae Kath alu 62 41 32 26 24 16Dioscorea batatas Decene. Dioscoreaceae Gosh alu 66 38 31 39 25 19Dioscorea esculenta Burk. Dioscoreaceae Mua alu 58 39 28 15 13 7Dioscorea pentaphylla L. Dioscoreaceae Paspatia alu 51 40 32 22 18 13Dioscorea puber BL Dioscoreaceae Jangali alu 67 38 35 24 23 9Pueraria thomsonii Benth. Fabaceae Mayong (Mis), Pani alu 42 35 24 39 32 18Pueraria tuberosa (Wild.) D.C Fabaceae Urahi alu 68 44 32 58 33 21Vigna vexillata (L.) Rich Fabaceae Bonoria urahi 72 53 51 61 41 27
KUMAR et al. – Arbuscular mycorrhiza in wet evergreen forest in Assam 71
CONCLUSION
The study revealed that the plantswith tubers growing in the tropicalwet ever green forest of Sunaikuchi,Khulahat, and Bura MayongReserved Forest of Assam, India arecolonized by arbuscular mycorrhizalfungi. It is also apparent that rainyseason may considered as the bestseason for the propagation of plantsby the application of AMF as bio-inoculants even for the plants of rareand threatened species. Our resultsalso revealed that uneven spatialdistribution (clumped distribution) ofarbuscular mycorrhizal fungal sporesand the complex below groundstructure of tropical wet ever greenforests are major factors that affectthe spore density.
ACKNOWLEDGEMENTS
The authors are thankful to theIndian Council of Forestry Researchand Education (ICFRE) for fundingthe research project No: RFRI-13/2008-09/FP.
REFERENCES
Akhtar MS, and Siddiqui ZA. 2007. Biocontrol of a chickpea root-rotdisease complex with Glomus intraradices, Pseudomonas putida andPaenibacillus polymyxa. Aust Plant Pathol 36: 175-180.
An ZQ, Hendrix JW, Hershman DE, and Henson GT. 1990. Evaluation ofthe most probable number (MPN) and wet-sieving methods fordetermining soil-borne populations of endogonaceous mycorrhizalfungi. Mycologia 82: 516-581.
Beluhan S, and Ranogajec A. 2010. Chemical composition and non-volatile components of Crotial wild edible mushrooms. FoodChemistry 124: 1076-1082.
Bever JD, Morton JB, Antonovics J, Schultz PA. 1996. Host-dependentsporulation and species diversity of arbuscular mycorrhizal fungi in amown grassland. J Ecol 84: 71-82.
Bhat RP, Kaveriappa KM. 1997.Occurrence of vesicular Arbuscularmycorrizal fungi in the tubers of Colocasia esculenta (L.) Schott.,Mycorrhiza News 912-13.
Cartmill AD, Alarcon A, Valdez-Aguilar LA. 2007. Arbuscularmycorrhizal fungi enhance tolerance of Rosa multiflora cv. Burr tobicarbonate in irrigation water. J Plant Nutr 30: 1517-1540.
Das P, Kayang H. 2008. Stamp pad ink, an effective stain for observingarbuscular mycorrhizal structure in roots. World J Agric Sci 4: 58-60
Gerdemann JW, Nicolson TH. 1963. Spores of mycorrhizal Endogoneextracted from soil by wet sieving and decanting. Trans Br Mycol Soc46: 235-244.
Giovannetti M, Nicolson TH. 1983. Vesicular-arbuscular mycorrhizas inItalian sand dunes. Trans Br Mycol Soc 80: 552-557.
Grivetti LE, Ogle BM. 2000. Value of traditional foods in meeting macro-and micronutrient needs: the wild plant connection. Nutr Res Rev 13:31-46.
Hepper CM. 1984. Isolation and culture of VA mycorrhizal (VAM) fungi.In: Powell CL, Bagyaraj DJ (eds). VA Mycorrhizae. CRC Press,Florida.
Hol GW, Cook R. 2005. An overview of arbuscular mycorrhizal fungi-nematode interactions. Basic Appl Ecol 6: 489-503.
Javot H, Pumplin N, Harrison MJ. 2007. Phosphate in the arbuscularmycorrhizal symbiosis: transport properties and regulatory roles.Plant Cell Environ 30 (3): 310-322.
Jensen A.1984. Responses of barley, pea and maize to inoculation withdifferent vesicular Arbuscular Mycorrhizal fungi in irradiated soils. PlSoil 78: 315-323.
Khade SW, Rodrigues BF. 2003. Incidence of Arbuscular Mycorrhizalcolonization in tubers of Gloriosa superba L., Mycorrhiza News 15:14-16.
Khade SW, Rodrigues BF. 2007. Incidence of arbuscular mycorrhizal(AM) fungi in some angiosperms with underground storage organsfrom Western Ghat region of Goa. Trop Ecol 48 (1): 115-118.
Kumar R, Tapwal A, Jaime A Teixeira da Silva, JA, Pandey S, Borah DP.2013. Biodiversity of arbuscular mycorrhizal fungi associated withmixed natural forest of Jeypore, Assam. Bioremed Biodiv Bioavail 7(1): 91-93.
Kunwar IK, Reddy PJM, Manoharachary C. 1999. Occurrence anddistribution of AMF associated with garlic rhizosphere soil.Mycorrhiza News 11: 4-6.
Linderman RG. 1992. Vesicular-arbiscular mycorrhizae and soil microbialinteractions, In: Bethlenfalvay GJ, Linderman RG (eds). Mycorrhizaein sustainable agriculture. Soil Science Society of America, Madison,WI.
Linderman RG. 1994. Role of VAM fungi in biocontrol. In: Pfleger FL,Linderman RG (eds). Mycorrhizae and plant health. The AmericanPhytopathological Society, St. Paul, Minnesota.
McGonigle TP, Miller MH, Evans DG, Fairchild GL, Swan JA. 1990. Anew method which gives an objective measure of colonization ofroots by vesicular arbuscular mycorrhizal fungi. New Phytol 115:495-501.
Morton JB. 1988. Taxonomy of VA mycorrhizal fungi: classification,nomenclature, and identification. Mycotaxon 37: 267-324.
Morton JB, Benny GL. 1990. Revised classification of arbuscularmycorrhizal fungi (Zygomycetes), a new order Glomales, two newsuborders Glomineae and Gigasporinae and two new familiesAcaulosporaceae and Gigasporaceae with an emendation ofGlomaceae. Mycotaxon 37: 471-479.
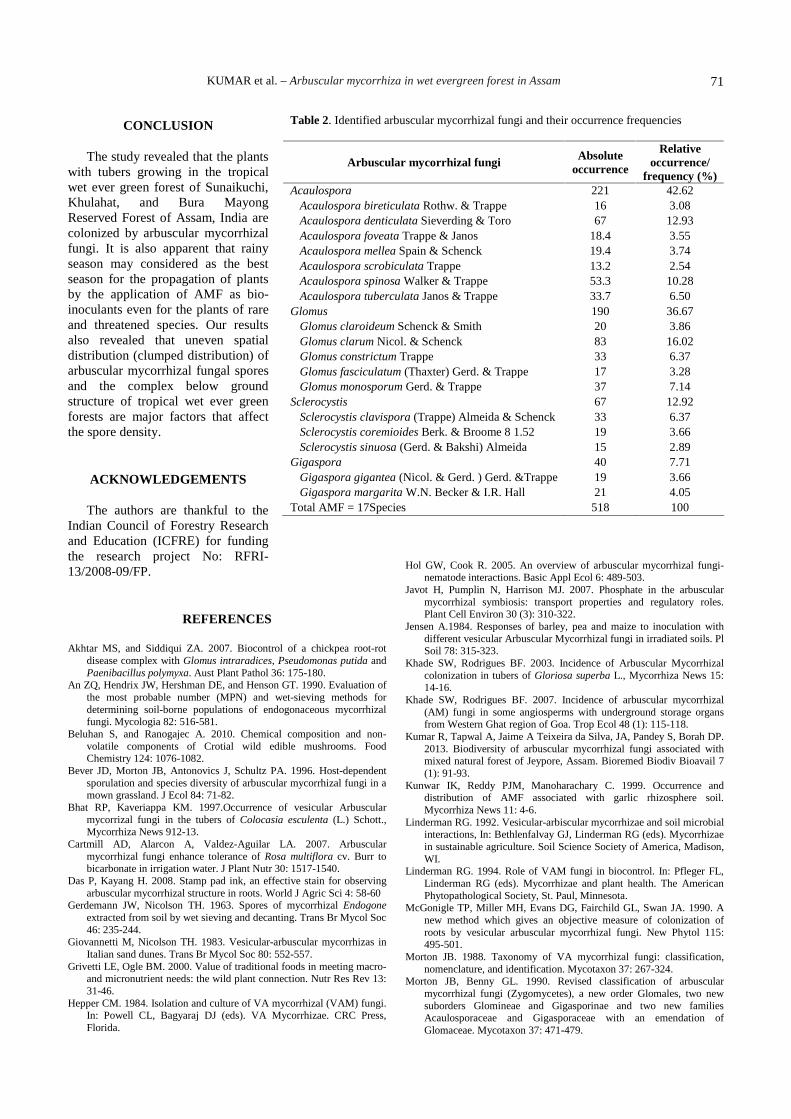
Table 2. Identified arbuscular mycorrhizal fungi and their occurrence frequencies
Arbuscular mycorrhizal fungi Absoluteoccurrence
Relativeoccurrence/
frequency (%)Acaulospora 221 42.62
Acaulospora bireticulata Rothw. & Trappe 16 3.08Acaulospora denticulata Sieverding & Toro 67 12.93Acaulospora foveata Trappe & Janos 18.4 3.55Acaulospora mellea Spain & Schenck 19.4 3.74Acaulospora scrobiculata Trappe 13.2 2.54Acaulospora spinosa Walker & Trappe 53.3 10.28Acaulospora tuberculata Janos & Trappe 33.7 6.50
Glomus 190 36.67Glomus claroideum Schenck & Smith 20 3.86Glomus clarum Nicol. & Schenck 83 16.02Glomus constrictum Trappe 33 6.37Glomus fasciculatum (Thaxter) Gerd. & Trappe 17 3.28Glomus monosporum Gerd. & Trappe 37 7.14
Sclerocystis 67 12.92Sclerocystis clavispora (Trappe) Almeida & Schenck 33 6.37Sclerocystis coremioides Berk. & Broome 8 1.52 19 3.66Sclerocystis sinuosa (Gerd. & Bakshi) Almeida 15 2.89
Gigaspora 40 7.71Gigaspora gigantea (Nicol. & Gerd. ) Gerd. &Trappe 19 3.66Gigaspora margarita W.N. Becker & I.R. Hall 21 4.05
Total AMF = 17Species 518 100

BIODIVERSITAS 14 (2): 67-72, October 201372
Nazim G. 1990.Vesicular Arbuscular Mycorrhiza in portions other thanroots. In: Jalali BL, Chand H (eds). Current Trends in MycorrhizalResearch. Sankat Mochan Art Press, Hisar, India.
Raghupathy S. Mahadevan A.1993. Distribution of vesicular Arbuscularmycorrhizae in plants and rhizosphere soils of the tropical plains,Tamilnadu, India. Mycorrhiza 3: 123- 136.
Rodrigues BF. 1996. Occurrence of VAM fungi in the tubers of Puerariatuberosa (Willd.) DC. Mycorrhiza News 8-9.
Schenck NC, Perez Y. 1990. Manual for the Identification of VAMycorrhizal Fungi (2nd End), International Culture Collection of VAMycorrhizal Fungi (INVAM), University of Florida, Gainesville, FL.
Sharma S, Aggarwal A, Kaushish S. 2007. Biodiversity ofendomycorrhizal fungi associated with some medicinally importantplants of Himachal Pradesh. J Indian Bot Soc 86: 14-17.
Singh SS, Tiwari SC. 2001. Modified wet-sieving and decantingtechnique for enhanced recovery of spores of vesicular-arbuscularmycorrhizal (VAM) fungi in forest soils. Mycorrhiza News 12: 12-13.
Smith SE, Read DJ. 2008. Mycorrhizal Symbiosis. 3rd ed. AcademicPress, London.
Srivastava D, Kapoor R, Srivastava SK, Mukerji KG. 1996. Vesiculararbuscular mycorrhiza-an overview In: Mukerji KG (ed). Concepts inMycorrhizal Research. Kluwer, Netherlands.
Warner A, Mosse B. 1980. Independent spread of Vesicular ArbuscularMycorrhizal fungi in soil. Trans Br Mycol Soc 74: 407-410.

BIODIVERSITAS ISSN: 1412-033XVolume 14, Number 2, October 2013 E-ISSN: 2085-4722Pages: 73-78 DOI: 10.13057/biodiv/d140204
Diversity and frequency of macrofungi associated with wet ever greentropical forest in Assam, India
ASHWANI TAPWAL1,♥, RAJESH KUMAR2, SHAILESH PANDEY2
1Forest Pathology Division, Forest Research Institute, P.O. New Forest, Dehradun 248006, Uttrakhand, India. Tel.: +91-0135-222-4259,♥email: [email protected]
2Rain Forest Research Institute, P.O. 136, Jorhat 785001, Assam, India.
Manuscript received: 17 May 2013. Revision accepted: 18 July 2013.
ABSTRACT
Tapwal A, Kumar R, Pandey S. 2013. Diversity and frequency of macrofungi associated with wet ever green tropical forest in Assam,India. Biodiversitas 14: 73-78. A study was conducted in Jeypore Reserve Forest located in Assam, India to investigate the diversity ofmacrofungi associated with different tree species. The diversity of broad leaves trees and high humidity during monsoon period favoursideal growth of diverse group of macrofungal fruiting bodies. Thirty macrofungal species representing 26 genera belonging to 17families were collected from six different sites in the study area. Out of these maximum six genera assignable to family Polyporaceae,five genera to Russulaceae, three genera to Agaricaceae, two genera to Ganodermataceae and Cantharellaceae each and rest of thefamilies were represented by single genus only. The ecological preference of the species reveled that maximum (17) species weresaprophyte, living on dead substrates or decaying wood debris, ten species were found associated with roots of higher trees, while threespecies were found parasitic. Overall 20 species were found edible including some species having medicinal utilization. The presentstudy revealed that maximum frequency of occurrence was exhibited by Trametes versicolor and Schizophyllum commune (83.33%),followed by Microporus xanthopus, Pycnoporus sanguineus (66.67%) and Coprinus disseminates (50%). The rest of the speciesexhibited the frequency distribution ranging between 16.67-33.33%. The maximum density was recorded for Schizophyllum commune(126.67%) followed by Trametes versicolor (120%) and Xylaria polymorpha (93.33%) . The density of rest of the species were rangedbetween 3.33- 6.67%. The key objective of the present study was to generate a database on macrofungal diversity of Jeypore ReserveForest along with their ecological preferences and utilization, which is not earlier documented.
Key words: Jeypore Reserve Forest, macrofungi, mycorrhiza
INTRODUCTION
The Jeypore Reserve Forest is an important wet evergreen tropical forest patch of eastern Assam whichconstitutes a part of the Eastern Himalaya biodiversityhotspot region. This reserve forest is relatively lessdisturbed by humans beings in comparison to otherprotected areas of the state (Saikia and Devi 2011). Themajor tree species of the area are Dipterocarpus retusus,Shorea assamica, Baccaurea ramiflora, Begoniaroxburghii, Gmelina arborea, Litsea salicifolia, Mesuaferrea, Syzygium cumini, Terminalia myriocarpa, Vaticalanceaefolia etc in addition to diverse population of herbsand shrubs. Plantations provide a habitat for diverse macrofungal communities, which vary markedly in compositionfrom site to site. Fungi are some of the most importantorganisms in the world, because of their vital role inecosystem function, influence on humus and human-relatedactivities (Mueller and Bill, 2004). Mushrooms arecosmopolitan heterotrophic organisms that are quitespecific in their nutritional and ecological requirements.They can grow in soil or degrading plant residues assaprophytes, wood decaying and many live in symbioticassociation with the roots of higher plant species. Theyplay important role in nutrient recycling; growth and
establishment of seedlings in forest floor. While somefungal species forms parasitic association with trees andcause considerable damage. The peak season for theformation of fruit body of macrofungi is different for eachecological climate (Arora 1991). Defining the exactnumber of fungi on the earth has always been a point ofdiscussion and several studies have been focused onenumerating the world’s fungal diversity (Crous 2006).Current studies have estimated about 1.5 million species offungi on globe (Hawksworth 2004). One-third of whichexists in India and of this only 50% are characterized tilldate (Manoharachary et al. 2005). More than 27,000 fungalspecies are recorded from India, which is the largest bioticcommunity after insects (Sarbhoy et al. 1996).
Despite the great bio-geographic significance of theJeypore Reserve Forest, it remains poorly documented interms of macrofungal diversity. This broad leaf forestpresumably possesses great diversity not only in plantspecies but also in macrofungi. Some selected pockets ofthis forest have been surveyed for the diversity ofmacrofungi. The macrofungi observed in the study area areeither edible, medicinal, saprophyte or wood rotting fungi.These fungal species vary in their abundance andphenology of fruiting. Most of the macrofungal speciesproducing hypogeous/ epigeal sporocarp are thought to be
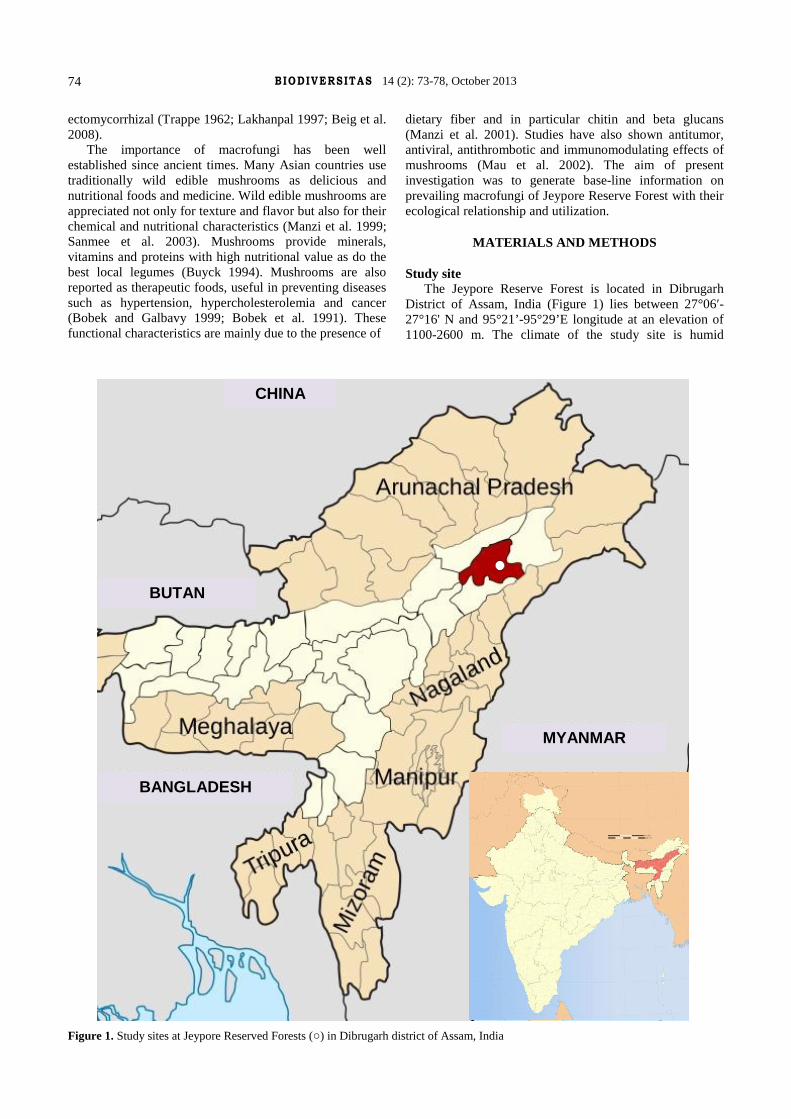
BIODIVERSITAS 14 (2): 73-78, October 201374
ectomycorrhizal (Trappe 1962; Lakhanpal 1997; Beig et al.2008).
The importance of macrofungi has been wellestablished since ancient times. Many Asian countries usetraditionally wild edible mushrooms as delicious andnutritional foods and medicine. Wild edible mushrooms areappreciated not only for texture and flavor but also for theirchemical and nutritional characteristics (Manzi et al. 1999;Sanmee et al. 2003). Mushrooms provide minerals,vitamins and proteins with high nutritional value as do thebest local legumes (Buyck 1994). Mushrooms are alsoreported as therapeutic foods, useful in preventing diseasessuch as hypertension, hypercholesterolemia and cancer(Bobek and Galbavy 1999; Bobek et al. 1991). Thesefunctional characteristics are mainly due to the presence of
dietary fiber and in particular chitin and beta glucans(Manzi et al. 2001). Studies have also shown antitumor,antiviral, antithrombotic and immunomodulating effects ofmushrooms (Mau et al. 2002). The aim of presentinvestigation was to generate base-line information onprevailing macrofungi of Jeypore Reserve Forest with theirecological relationship and utilization.
MATERIALS AND METHODS
Study siteThe Jeypore Reserve Forest is located in Dibrugarh
District of Assam, India (Figure 1) lies between 27°06′-27°16' N and 95°21’-95°29’E longitude at an elevation of1100-2600 m. The climate of the study site is humid
Figure 1. Study sites at Jeypore Reserved Forests (○) in Dibrugarh district of Assam, India
CHINA
BUTAN
MYANMAR
BANGLADESH

TAPWAL et al. – Diversity of macrofungi in a Jeypore reserve forest 75
tropical characterized by high rainfall and high humidity(up to 90%). The annual mean precipitation in the last threeyears ranged from 3600 to 5500 mm of which 82% isreceived during the monsoon season from May to Augustand 17% during dry periods from September to March. Themean ambient temperature is 27°C.
Sample collection and diversity analysisPeriodic surveys were made to the study area for the
collection of macrofungi during rainy season (June toSeptember) and winter (October to December) in 2010-2011. Six sites in Jeypore Reserve Forest (JRF) have beensurveyed in winter and rainy season for the collection ofmacrofungi. The collected samples were wrapped in waxpaper and brought to the laboratory for identification.The macroscopic characters like shape, size, color, texture,attachment of stipe, smell, spore print, habit and habitat hasdocumented during the survey and collection work. Thetaxonomy has been worked on the basis of macro andmicroscopic characteristic following available literatures(Zoberi 1973; Alexopoulos et al. 1996; Purakasthya 1985).The soft textured specimens were preserved in 2%formaldehyde and leathery textured were preserved in 4%formaldehyde. The utilization of different mushroomspecies for food and as medicine has been documentedfrom the available literature. The frequency and density ofdifferent species has been determined by the followingformulas:
No. of site in which the sp. is presentFreq. of fungal sp. (%) = ----------------------------------------- x 100
Total no. of sites
Total no. of individual of a particular speciesDensity = ------------------------------------------------------- x 100
Total no. of species
RESULTS AND DISCUSSIONS
Species diversity of macrofungi is related to theirparticular habitats. The factors like geographic location,elevation, temperature, humidity, light and surroundingflora greatly influence the growth and development ofmacrofungi. Thirty macrofungal species representing 26genera belonging to 17 families were collected from thestudy area (Figure 1).
Maximum six genera assignable to familyPolyporaceae, five genera to Russulaceae, three genera toAgaricaceae, two genera to Ganodermataceae andCantharellaceae each and rest of the families wererepresented by single genus only. The diversity analysisrevealed that maximum frequency occurrence wasexhibited by Trametes versicolor and Schizophyllumcommune (83.33%), followed by Microporus xanthopus(66.67%), Pycnoporus sanguineus (66.67%) and Coprinusdisseminates (50%). The frequency distribution of rest ofthe species was ranged between 16.67-33.33%. Almost in asimilar trend maximum density was recorded forSchizophyllum commune (126.67%) followed by Trametes
versicolor (120.00%), Xylaria polymorpha (93.33%) andthe rest were ranged between 3.33- 76.67% (Table 1).
Figure 1. Macrofungal distribution in families, ecologicalrelationship and utilization
Twenty species were found edible, out of which somehave medicinal properties. Mushrooms are delicious fooddue their high quality protein, vitamins and minerals. Freshmushrooms contain about 90% moisture and 10% drymatter. Dry mushrooms contain about 90% dry matter and10% moisture (Chang and Buswell 1996). For localpopulations, mushrooms are usually considered assubstitutes for animal protein, and are known as meat forthe poor (Buyck 1994). Most common edible macrofungifound in JRF are the species of Agaricus, Lactarius,Lycoperdon, Russula, Scleroderma, Cantharellus,Pleurotus, Lentinus, Schizophyllum etc. In India,mushrooms are a non wood forest produce and popular asfood among the ethnic people of North east India. Some ofthe edible species like Termitomyces eurrhizus, Lentinusconatus, Schizophyllum commune, Tricholoma giganteumand Pleurotus are sold in the markets of Kohima district ofNagaland by the local people (Tanti et al. 2011). Inaddition to these Kumar et al. (2013) described 15 ediblefungi along with their macronutrient content collected fromdifferent forest areas of Nagaland.
The ecological preference of the species revealed thatmaximum number of (17) species were saprophyte and 10species were found associated with higher trees. Themycorrhizal fungi basically serves as an extension of theplant root system, exploring soil far beyond the roots andtransporting water and nutrients to the roots. The fungusgrows from the colonized roots into the surrounding soil.Mycelial colonization of the soil varies amongectomycorrhizal fungi; some may only grow a fewcentimeters into the soil and others can grow several metersfrom the ectomycorrhiza. Some fungi produce dense,hyphal mats that strongly bind the soil and organic matter(Molina 1994). Mycorrhizae increase the survival, growthand development of associated plants by performingessential physiological processes i.e. increased absorptionsurface, selective ion absorption and accumulation
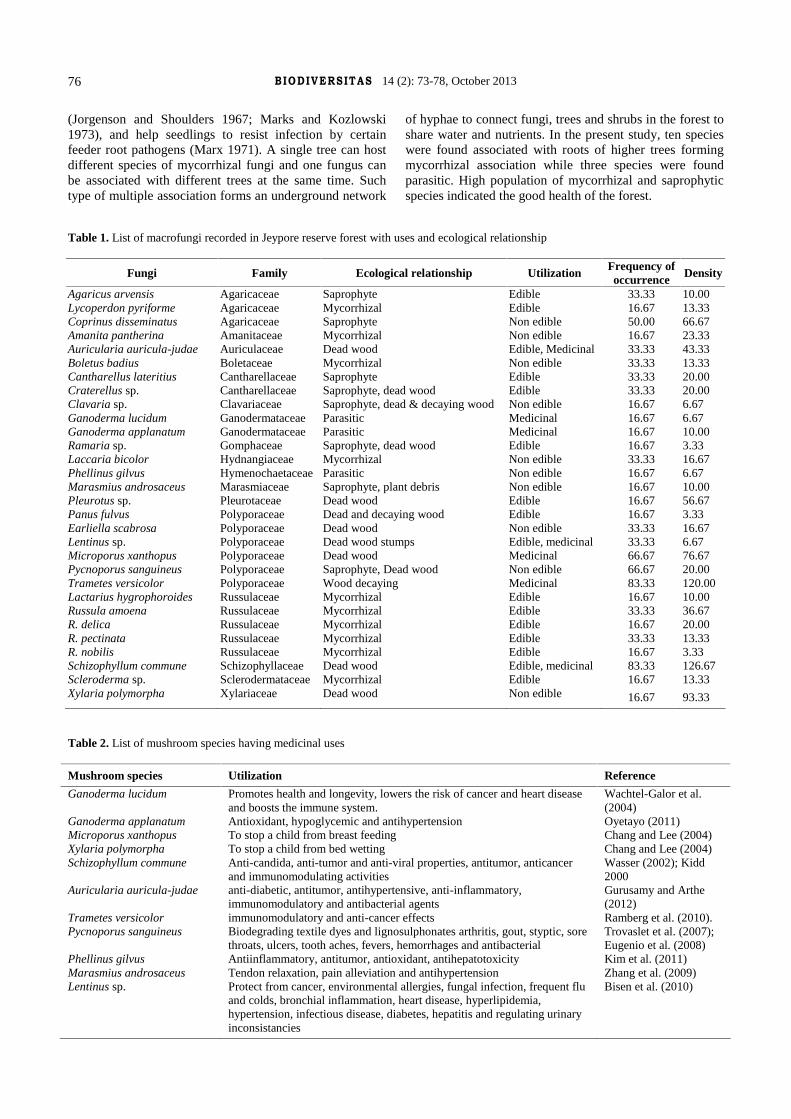
BIODIVERSITAS 14 (2): 73-78, October 201376
(Jorgenson and Shoulders 1967; Marks and Kozlowski1973), and help seedlings to resist infection by certainfeeder root pathogens (Marx 1971). A single tree can hostdifferent species of mycorrhizal fungi and one fungus canbe associated with different trees at the same time. Suchtype of multiple association forms an underground network
of hyphae to connect fungi, trees and shrubs in the forest toshare water and nutrients. In the present study, ten specieswere found associated with roots of higher trees formingmycorrhizal association while three species were foundparasitic. High population of mycorrhizal and saprophyticspecies indicated the good health of the forest.
Table 1. List of macrofungi recorded in Jeypore reserve forest with uses and ecological relationship
Fungi Family Ecological relationship Utilization Frequency ofoccurrence Density
Agaricus arvensis Agaricaceae Saprophyte Edible 33.33 10.00Lycoperdon pyriforme Agaricaceae Mycorrhizal Edible 16.67 13.33Coprinus disseminatus Agaricaceae Saprophyte Non edible 50.00 66.67Amanita pantherina Amanitaceae Mycorrhizal Non edible 16.67 23.33Auricularia auricula-judae Auriculaceae Dead wood Edible, Medicinal 33.33 43.33Boletus badius Boletaceae Mycorrhizal Non edible 33.33 13.33Cantharellus lateritius Cantharellaceae Saprophyte Edible 33.33 20.00Craterellus sp. Cantharellaceae Saprophyte, dead wood Edible 33.33 20.00Clavaria sp. Clavariaceae Saprophyte, dead & decaying wood Non edible 16.67 6.67Ganoderma lucidum Ganodermataceae Parasitic Medicinal 16.67 6.67Ganoderma applanatum Ganodermataceae Parasitic Medicinal 16.67 10.00Ramaria sp. Gomphaceae Saprophyte, dead wood Edible 16.67 3.33Laccaria bicolor Hydnangiaceae Mycorrhizal Non edible 33.33 16.67Phellinus gilvus Hymenochaetaceae Parasitic Non edible 16.67 6.67Marasmius androsaceus Marasmiaceae Saprophyte, plant debris Non edible 16.67 10.00Pleurotus sp. Pleurotaceae Dead wood Edible 16.67 56.67Panus fulvus Polyporaceae Dead and decaying wood Edible 16.67 3.33Earliella scabrosa Polyporaceae Dead wood Non edible 33.33 16.67Lentinus sp. Polyporaceae Dead wood stumps Edible, medicinal 33.33 6.67Microporus xanthopus Polyporaceae Dead wood Medicinal 66.67 76.67Pycnoporus sanguineus Polyporaceae Saprophyte, Dead wood Non edible 66.67 20.00Trametes versicolor Polyporaceae Wood decaying Medicinal 83.33 120.00Lactarius hygrophoroides Russulaceae Mycorrhizal Edible 16.67 10.00Russula amoena Russulaceae Mycorrhizal Edible 33.33 36.67R. delica Russulaceae Mycorrhizal Edible 16.67 20.00R. pectinata Russulaceae Mycorrhizal Edible 33.33 13.33R. nobilis Russulaceae Mycorrhizal Edible 16.67 3.33Schizophyllum commune Schizophyllaceae Dead wood Edible, medicinal 83.33 126.67Scleroderma sp. Sclerodermataceae Mycorrhizal Edible 16.67 13.33Xylaria polymorpha Xylariaceae Dead wood Non edible 16.67 93.33
Table 2. List of mushroom species having medicinal uses
Mushroom species Utilization Reference
Ganoderma lucidum Promotes health and longevity, lowers the risk of cancer and heart diseaseand boosts the immune system.
Wachtel-Galor et al.(2004)
Ganoderma applanatum Antioxidant, hypoglycemic and antihypertension Oyetayo (2011)Microporus xanthopus To stop a child from breast feeding Chang and Lee (2004)Xylaria polymorpha To stop a child from bed wetting Chang and Lee (2004)Schizophyllum commune Anti-candida, anti-tumor and anti-viral properties, antitumor, anticancer
and immunomodulating activitiesWasser (2002); Kidd2000
Auricularia auricula-judae anti-diabetic, antitumor, antihypertensive, anti-inflammatory,immunomodulatory and antibacterial agents
Gurusamy and Arthe(2012)
Trametes versicolor immunomodulatory and anti-cancer effects Ramberg et al. (2010).Pycnoporus sanguineus Biodegrading textile dyes and lignosulphonates arthritis, gout, styptic, sore
throats, ulcers, tooth aches, fevers, hemorrhages and antibacterialTrovaslet et al. (2007);Eugenio et al. (2008)
Phellinus gilvus Antiinflammatory, antitumor, antioxidant, antihepatotoxicity Kim et al. (2011)Marasmius androsaceus Tendon relaxation, pain alleviation and antihypertension Zhang et al. (2009)Lentinus sp. Protect from cancer, environmental allergies, fungal infection, frequent flu
and colds, bronchial inflammation, heart disease, hyperlipidemia,hypertension, infectious disease, diabetes, hepatitis and regulating urinaryinconsistancies
Bisen et al. (2010)
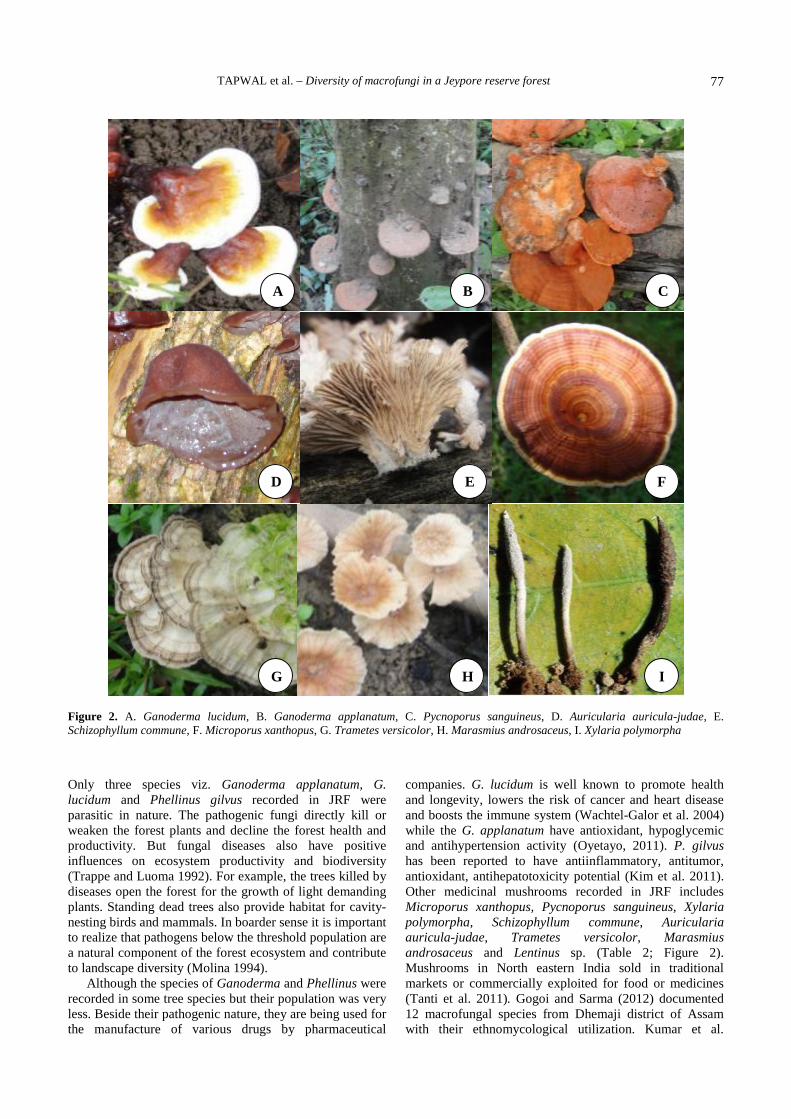
TAPWAL et al. – Diversity of macrofungi in a Jeypore reserve forest 77
Figure 2. A. Ganoderma lucidum, B. Ganoderma applanatum, C. Pycnoporus sanguineus, D. Auricularia auricula-judae, E.Schizophyllum commune, F. Microporus xanthopus, G. Trametes versicolor, H. Marasmius androsaceus, I. Xylaria polymorpha
Only three species viz. Ganoderma applanatum, G.lucidum and Phellinus gilvus recorded in JRF wereparasitic in nature. The pathogenic fungi directly kill orweaken the forest plants and decline the forest health andproductivity. But fungal diseases also have positiveinfluences on ecosystem productivity and biodiversity(Trappe and Luoma 1992). For example, the trees killed bydiseases open the forest for the growth of light demandingplants. Standing dead trees also provide habitat for cavity-nesting birds and mammals. In boarder sense it is importantto realize that pathogens below the threshold population area natural component of the forest ecosystem and contributeto landscape diversity (Molina 1994).
Although the species of Ganoderma and Phellinus wererecorded in some tree species but their population was veryless. Beside their pathogenic nature, they are being used forthe manufacture of various drugs by pharmaceutical
companies. G. lucidum is well known to promote healthand longevity, lowers the risk of cancer and heart diseaseand boosts the immune system (Wachtel-Galor et al. 2004)while the G. applanatum have antioxidant, hypoglycemicand antihypertension activity (Oyetayo, 2011). P. gilvushas been reported to have antiinflammatory, antitumor,antioxidant, antihepatotoxicity potential (Kim et al. 2011).Other medicinal mushrooms recorded in JRF includesMicroporus xanthopus, Pycnoporus sanguineus, Xylariapolymorpha, Schizophyllum commune, Auriculariaauricula-judae, Trametes versicolor, Marasmiusandrosaceus and Lentinus sp. (Table 2; Figure 2).Mushrooms in North eastern India sold in traditionalmarkets or commercially exploited for food or medicines(Tanti et al. 2011). Gogoi and Sarma (2012) documented12 macrofungal species from Dhemaji district of Assamwith their ethnomycological utilization. Kumar et al.
G H I
E F
A B C
D
BIODIVERSITAS 14 (2): 73-78, October 201378
(2013) described four medicinal mushrooms fromNagaland along with their nutrient contents.
CONCLUSION
The mushrooms grown in the wild plays an importantrole to maintain the forest health besides their medicinalimportance and nutritional value. Therefore, it becomesquite necessary to explore, document and conserve thisnatural wealth. The present study provides a database onmacrofungal diversity of Jeypore Reserve Forest, Assam,India along with their ecological preferences andutilization, which was not documented earlier.
ACKNOWLEDGEMENTS
The authors are gratefully acknowledged to IndianCouncil of Forestry Research and Education (ICFRE) forfunding the research project: No-RFRI-39/2010-11/FP.
REFERENCES
Alexopoulos CJ, Mims CW, Blackwell. 1996. Introductory Mycology.John Wiley and Sons Inc., New York.
Arora D. 1991. All that the Rain Promises and More. A hip pocket guideto Western Mushroom. Ten Speed Press, New York.
Beig MA, Dar GH, Ganai NA. 2008. Some Hitherto unrecordedmacrofungi from India. J Mycol Pl Pathol 38:158-160.
Bisen PS, Baghel RK, Sanodiya BS, Thakur GS, Prasad GBKS. 2010.Lentinus edodes: A Macrofungus with Pharmacological Activities.Curr Med Chem 17: 2419-2430.
Bobek P, Galbavy S. 1999. Hypocholesterolemic and antiatherogeniceffect of oyster mushroom (Pleurotus ostreatus) in Rabbit. Nahrung43: 339.
Bobek P, Ginter E, Jurcovicova M, Kunlak L. 1991. Cholesterol loweringeffect of mushroom Pleurotus ostreatus in hereditaryhypercholesterolomic rats. Ann Nutr Metab 35: 191-195.
Buyck B. 1994. UBWOBA: Les Champignons Comestibles de l'Ouest duBurundi. AGCD, Rue du Trône, 4-1050, Bruxelles. Publ. Agricole#34 [French].
Chang ST, Buswell JA. 1996. Mushroom nutraceuticals. World JMicrobiol Biotechnol 12: 473-476.
Chang YS, Lee SS. 2004. Utilisation of macrofungi species in Malaysia.Fungal Diversity 15: 15-22.
Crous PW. 2006. How many species of fungi are there in tip of Africa.Stud Mycol 55:13
Eugenio ME, Carbajo JM, Terrón MC, González AE, Villar JC. 2008.Bioremediation of lignosulphonates by lignin-degradingbasidiomycetous fungi. Biores Technol 99 (11): 4929-4934.
Gogoi Y, Sarma TC. 2012. An ethnomycological survey in some areas ofDhemaji district (Assam). Proceedings of International Conference onAnthropogenic Impact on Environment & Conservation Strategy.Ranchi, November 2-4, 2012.
Gurusamy R, Arthe R. 2012. Effect of medicinal mushroom, Auriculariaauriculajudae, polysaccharides against EAC cell lines. Res J Biotech7 (2): 14-17.
Hawksworth DL. 2004. Fungal diversity and its implifications for geneticresource collections. Stud Mycol 50: 19.
Jorgenson JR, Shoulders E. 1967. Mycorrhizal root development vital tosurvival of slash pine nursery stock US Dep. Agric. For. Serv., TreePlant Notes 18: 7- 11.
Kidd PM. 2000. The use of mushroom glucans and proteoglycans incancer treatment. Alter Med Rev 5 (1): 4-27.
Kim SH, Lim JH, Moon C, Park SH, Kim SH, Shin DH, Park SC, KimCJ. 2011. Antiinflammatory and antioxidant effects of Aqueousextracts from Phellinus gilvus in Rats. J Health Sci 57 (2): 171-176.
Kumar R, Tapwal A, Pandey S, Borah RK, Borah D, Borgohain J. 2013.Macro-fungal diversity and nutrient content of some ediblemushrooms of Nagaland, India. Nusantara Biosci 5 (1): 1-7.
Lakhanpal TN. 1997. Diversity of mushroom mycoflora in the North-West Himalaya. In: Sati SC, Saxena J, Dubey RC (eds) Recentresearches in ecology, environment and pollution. Today andTomorrow’s Printers and Publishers, New Delhi.
Manoharachary C, Sridhar K, Singh R, Adholeya, Suryanarayanan TS,Rawat S, Johri BN. 2005. Fungal Biodiversity: Distribution,Conservation and Prospecting of Fungi from India. Curr Sci 89 (1):58-71.
Manzi P, Gambelli L, Marconi S, Vivanti V, Pizzoferrato L. 1999.Nutrients in edible mushrooms: An interspecies comparative study.Food Chem 65: 477-482.
Manzi P, Aguzzi A, Pizzoferrato L. 2001. Nutritional value of mushroomswidely consumed in Italy. Food Chem 73: 321.
Marks GC, Kozolowski TT. 1973. Ectomycorrhizae: Their ecology andPhysiology. Academic Press, New York.
Marx DH. 1971. Ectomycorrhizae as biological deterents to pathogenicroot infections. In: Hacskaylo E. (ed). Mycorrhizae US Govt. PrintingOffice, Washington.
Mau LL, Lim HC, Chen CC. 2002. Antioxidant properties of severalmedicinal mushrooms. J Agric Food Chem 50: 6072.
Molina R. 1994. The role of mycorrhizal symbioses in the health of giantredwoods and other forest ecosystems. USDA Forest Service Gen.Tech. Rep. PSW-151
Mueller GM, Bills GF. 2004. Introduction. In: Mueller GM, Bills GF.Foster MS (eds). Biodiversity of Fungi Inventory and MonitoringMethod. Elsevier Academic Press, San Diego.
Oyetayo OV. 2011. Medicinal uses of mushrooms in Nigeria: towards fulland sustainable exploitation. Afr J Tradit Compl Altern Med 8 (3):267-274.
Purakasthya RP, Chandra A. 1985. Manual of Indian Edible Mushrooms.Today and Tomorrow’s Publication, New Delhi.
Ramberg JE, Nelson ED, Sinnott RA. 2010. Immunomodulatory dietarypolysaccharides: A systematic review of the literature. Nutrition J 9:1-22.
Saikia PK, Devi OS. 2011. A checklist of avian fauna at Jeypore ReserveForest, eastern Assam, India with special reference to globallythreatened and endemic species in the Eastern Himalayan biodiversityhotspot. J Threat Taxa 3 (4): 1711-1718.
Sanmee R, Dell B, Lumyong P, Izumori K, Lumyong S. 2003. Nutritivevalue of popular wild edible mushrooms from northern Thailand.Food Chem 84: 527-532.
Sarbhoy AK, Agarwal DK, Varshney JL. 1996. Fungi of India 1982-1992.CBS Publi. & Distributors, New Delhi.
Tanti B, Gurung L, Sarma GC. 2011. Wild edible fungal resource used bythe ethnic tribes of Nagaland, India. Indian J Trad Know 10 (3):512-515.
Trappe JM. 1962. Fungus associates of ectotrophic mycorrhizae. Bot rev28: 538-606.
Trappe JM., Louma D. 1992. The ties that bind: fungi in ecosystems. In:Carroll GC, Wicklow DT (eds). The fungal community, itsorganization and role in the ecosystem. Marcel Dekker, New York.
Trovaslet M, Enaud E, Guiavarc'h Y, Corbisier AM, Vanhulle S. 2007.Potential of a Pycnoporus sanguineus laccase in bioremediation ofwastewater and kinetic activation in the presence of an anthraquinonicacid dye. Enz Microb Technol 41 (3): 368-376.
Wachtel-Galor S, Tomlinson B, Benzie IFF. 2004. Ganoderma lucidum(‘Lingzhi’), a Chinese medicinal mushroom: biomarker responses in acontrolled human supplementation study. Br J Nutr 91: 263-269.
Wasser SP. 2002. Review of medicinal mushrooms advances: good newsfrom good allies. Herbal Gram 56: 28-33.
Zhang L, Yang M, Song Y, Sun Z, Peng Y, Qu K, Zhu H. 2009.Antihypertensive effect of 3,3,5,5-tetramethyl-4-piperidone, a newcompound extracted from Marasmius androsaceus. J Ethnopharmacol123: 34-39.
Zoberi MH. 1973. Some edible mushrooms from Nigeria. Nigerian Field38: 81-90.
BIODIVERSITAS ISSN: 1412-033XVolume 14, Number 2, October 2013 E-ISSN: 2085-4722Pages: 79-88 DOI: 10.13057/biodiv/d140205
Fungal diversity associated with bamboo litter from Bambusetum ofRain Forest Research Institute, Northeast India
RAJESH KUMAR1,♥, ASHWANI TAPWAL2, SHAILESH PANDEY1, RAJA RISHI1
1Rain Forest Research Institute, P.O. 136, Jorhat 785001, Assam, India. Tel.: +91-0376-2305106, ♥email: [email protected] Research Institute, Dehradun 248006, Uttrakhand, India
Manuscript received: 22 May 2013. Revision accepted: 29 July 2013.
ABSTRACT
Kumar R, Tapwal A, Pandey S, Rishi R. 2013. Fungal diversity associated with bamboo litter from Bambusetum of Rain ForestResearch Institute, Northeast India. Biodiversitas 14: 79-88. Fungi play an important role in leaf litter decomposition due to their abilityto break down the lignocelluloses matrix, which other organisms are unable to digest. Diversity of bamboo leaf litter fungi from fallenleaves and undergoing active decomposition leaves in different season and different depth was carried out in 2009-10. Twenty foursamples were collected from Bambusetum of Rain Forest Research Institute (RFRI), Northeast India. The moist chamber, directisolation and dilution plate methods were used to assess the diversity of fungal species. Fungi were cultivated on 3% malt extract agarand half strength potato dextrose agar. The litter was divided into freshly fallen senescent leaves (grade 1) and leaves alreadyundergoing active decomposition (grade 2). Moist chamber incubation of the litter revealed 45 fungal taxa belonging to 22 genera.fungal taxa were found on grade I and 39 fungal taxa found on grade II litter. Although 24 fungal taxa were common to both grades,Differences were observed in percentage occurrence of fugal species between the two grades of litter. Periodic surveys were carried outto collect macrofungi. Young and matured carpophores of 16 macro fungi species were collected in different seasons. Out of thesemacrofungi, 3 species belongs to family Entolomataceae and Agaricacea, two species belongs to Tricholomataceae and Geoglossaceae onespecies belongs to each family Dacrymycetaceae, Pluteaceae, Coprinaceae, Marasmiaceae Lycoperdaceae and Phallaceae. The bambooleaf-litter was selected for the present syudy because of the dominance and great economic value of bamboo vegetation in North-east India.
Key words: carpophores, decomposition, leaf litter, RFRI
INTRODUCTION
Fungi are one of the most important organisms in theworld, because of their vital role in ecosystem functionsand human-related activities (Mueller and Bill 2004). Fungiplay a significant role in the daily life of human beingsbesides their utilization in industry, agriculture, medicine,food industry, textiles, bioremediation, natural cycling anddecomposing the dead organic matter present in soil andlitter. (Molina et al. 1993; Keizer 1998; Pilz 2001; Cowan2001; Chang and Miles 2004, Hunt 1999; Gates 2005). Thepeak mushrooms and macrofungi season for each regionvary with ecological climate (Arora 1991). The number ofexisting fungi worldwide has been estimated to 1.5 millionspecies (Hawksworth 2004). One-thirds of the fungaldiversity of the globe exists in India and of this, only 50%are characterized yet (Manoharachary et al 2005). Thenumber of fungi recorded in India exceeds 27,000 species, thelargest biotic community after insects (Sarbhoy et al. 1996).
Macrofungal biodiversity also play an important role inbalancing ecological services. Fungi are one of the keyfunctional components of forest ecosystems (Brown et al.2006). They are omnipresent but drawing less attentionthan animal and plants. They are highly diverse in nature(Piepenbring 2007). Having a stable and estimate oftaxonomic diversity for fungi is also necessary to enablefungi to be included in considerations of biodiversity
conservation, land-use planning and management (Muellerand Schmit 2007). Decomposition on the forest floor is avery complex phenomenon and is achieved by differentgroups of microorganisms. The major component of the topsoil consists of different parts of plant materials. These areimmediately colonized by diverse groups of microorganismsas they fall on the soil surface and soon after the processesof decomposition starts. Litter decomposition is also animportant link in nutrient cycling of the forest (Grigal andMcColl 1977). During the last few years various workers havedeveloped interest to understand the nature of fungi both inforest and cultivated fields. The study on diversity of leaf litterfungi from various host plants were reported earlier (Billsand Polishook 1994; Saravanan 2004; Tokumasu et al. 1997).
Some fungi were found to be common on leaf litter inprevious studies, while many new fungal taxa have beendescribed from decaying leaves and dead wood (Hughes1989). A total of 26 genera, 31 species of Hyphomycetes, 8species of Coelomycetes and 5 species of Ascomycetes werereported in Thiland. Two leaf litter fungi, Myrotheciumverrucaria and Ciliochorella sp. were found to supress thegrowth of Alternaria alternata, Colletotrichum capsici,Curvularia lunata and Fusarium oxysporum under in vitroconditions (Manoch et al. 2006). In addition, morphologicalstudy of 42 genera 48 species leaf litter fungi was reportedusing light microscope (Manoch et al. 2006). Six newspecies of dematiaceous hyphomycetes from dead wood
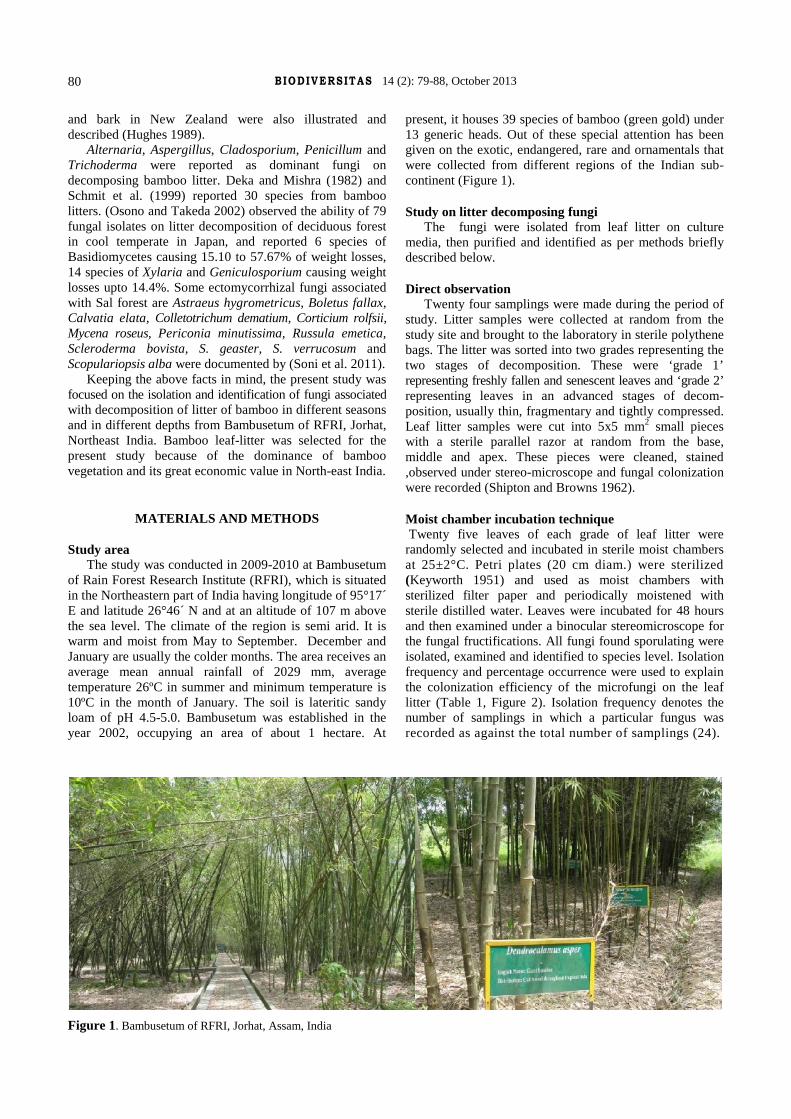
BIODIVERSITAS 14 (2): 79-88, October 201380
and bark in New Zealand were also illustrated anddescribed (Hughes 1989).
Alternaria, Aspergillus, Cladosporium, Penicillum andTrichoderma were reported as dominant fungi ondecomposing bamboo litter. Deka and Mishra (1982) andSchmit et al. (1999) reported 30 species from bamboolitters. (Osono and Takeda 2002) observed the ability of 79fungal isolates on litter decomposition of deciduous forestin cool temperate in Japan, and reported 6 species ofBasidiomycetes causing 15.10 to 57.67% of weight losses,14 species of Xylaria and Geniculosporium causing weightlosses upto 14.4%. Some ectomycorrhizal fungi associatedwith Sal forest are Astraeus hygrometricus, Boletus fallax,Calvatia elata, Colletotrichum dematium, Corticium rolfsii,Mycena roseus, Periconia minutissima, Russula emetica,Scleroderma bovista, S. geaster, S. verrucosum andScopulariopsis alba were documented by (Soni et al. 2011).
Keeping the above facts in mind, the present study wasfocused on the isolation and identification of fungi associatedwith decomposition of litter of bamboo in different seasonsand in different depths from Bambusetum of RFRI, Jorhat,Northeast India. Bamboo leaf-litter was selected for thepresent study because of the dominance of bamboovegetation and its great economic value in North-east India.
MATERIALS AND METHODS
Study areaThe study was conducted in 2009-2010 at Bambusetum
of Rain Forest Research Institute (RFRI), which is situatedin the Northeastern part of India having longitude of 95°17´E and latitude 26°46´ N and at an altitude of 107 m abovethe sea level. The climate of the region is semi arid. It iswarm and moist from May to September. December andJanuary are usually the colder months. The area receives anaverage mean annual rainfall of 2029 mm, averagetemperature 26ºC in summer and minimum temperature is10ºC in the month of January. The soil is lateritic sandyloam of pH 4.5-5.0. Bambusetum was established in theyear 2002, occupying an area of about 1 hectare. At
present, it houses 39 species of bamboo (green gold) under13 generic heads. Out of these special attention has beengiven on the exotic, endangered, rare and ornamentals thatwere collected from different regions of the Indian sub-continent (Figure 1).
Study on litter decomposing fungiThe fungi were isolated from leaf litter on culture
media, then purified and identified as per methods brieflydescribed below.
Direct observationTwenty four samplings were made during the period of
study. Litter samples were collected at random from thestudy site and brought to the laboratory in sterile polythenebags. The litter was sorted into two grades representing thetwo stages of decomposition. These were ‘grade 1’representing freshly fallen and senescent leaves and ‘grade 2’representing leaves in an advanced stages of decom-position, usually thin, fragmentary and tightly compressed.Leaf litter samples were cut into 5x5 mm2 small pieceswith a sterile parallel razor at random from the base,middle and apex. These pieces were cleaned, stained,observed under stereo-microscope and fungal colonizationwere recorded (Shipton and Browns 1962).
Moist chamber incubation technique Twenty five leaves of each grade of leaf litter wererandomly selected and incubated in sterile moist chambersat 25±2°C. Petri plates (20 cm diam.) were sterilized(Keyworth 1951) and used as moist chambers withsterilized filter paper and periodically moistened withsterile distilled water. Leaves were incubated for 48 hoursand then examined under a binocular stereomicroscope forthe fungal fructifications. All fungi found sporulating wereisolated, examined and identified to species level. Isolationfrequency and percentage occurrence were used to explainthe colonization efficiency of the microfungi on the leaflitter (Table 1, Figure 2). Isolation frequency denotes thenumber of samplings in which a particular fungus wasrecorded as against the total number of samplings (24).
Figure 1. Bambusetum of RFRI, Jorhat, Assam, India

KUMAR et al. – Fungal diversity from Bambusetum of RFRI, India 81
Figure 2. Micro fungal colony of Mucor, Aspergillus, Penicillum, Rhizopus, Cunninughumella and Trichoderma, from leaf litter culture ofBambusitum of RFRI, Jorhat, Assam, India.
Based on this, the fungi were categorized into 5 groups;most common(81-100%);common(61-80%); frequent(41-60%); occasional (21-40%) and rare(1-20%). Percentageoccurrence was used to denote the number of leaves onwhich a particular fungus was present as against the totalnumber of leaves (25) examined per grade by moistchamber incubation.
Leaf litter washing techniqueIn addition to the moist chamber incubation, a second
technique of washing fresh leaves removed from the plant andleaf litter was performed (Subramanian and Vittal 1979).Fifteen fresh leaves and fifteen litter leaves were randomlyselected from each grade of litter. From each leaf, five 1 cm2
pieces were cut with a pair of sterile scissors. The samples werewashed in 100 mL of sterile water in a 250 mL Erlenmeyerflask for 30 minutes on a shaker. From this initial suspension,serial dilutions were prepared. One mL of the requireddilution (1/1000) was pipetted into each of six replicateplates. Potato dextrose agar (potato 200 g, dextrose 20 g,Agar 20 g, distilled water 1 L) with streptomycin sulfate(300μg/mL) was cooled to 45°C and poured into each Petridish. The plates were incubated at room temperature inglass chambers under aseptic conditions for 4 days andexamined for fungal growth. All fungal colonies wererecorded and the fungi were sub-cultured and identified.
Identification of fungiFungi were identified on the basis of their growth
characteristics, morphological characteristics and ontogenywith the help of manuals, monographs and taxonomicpapers of various authors (Gilman 1957; Grove 1967;Subramanian 1971; Ainsworth et al. 1972; Barnett andHunter 1972; Ellis 1971, 1976; Sutton 1980; and von Arx1981). Identification was based on morphological studyexamined under stereo, light, microscopes (Olympus BX50 F4, Japan and Axio Scope A, Carl Zeiss). Frequency ofoccurrence and percentage contribution were calculated asper the procedures described by (Saksena 1955). Wherefrequency of occurrence refers to the number of samplingsin which a fungus was recorded out of the total number ofsamplings made during the period of study. This wasconverted to a percentage and on this basis the fungi were
classified as most common (8-100%); common (61-80%);frequent (41-60%); occasional (21-40%); rare (1-20%).
Collection of macro fungal and diversity analysisThe periodic surveys were made for the collection of
macrofungi during rainy season (June to September) andwinter (October to December) in 2009-2010. The collectedsamples were wrapped in wax paper and brought to thelaboratory for identification and proximate analysis. Thetaxonomy has been worked on the basis of macro andmicroscopic characteristic following available literatures(Zoberi 1973; Alexopolous et al. 1996; Purakasthya 1985). Thesoft textured specimens were preserved in 2% formaldehydeand leathery textured were preserved in 4% formaldehydeand kept in museum of Forest Protection Division, Rain ForestResearch Institute, Jorhat, Assam by assigning identificationnumber. The frequency and density of different species hasbeen determined by the following formulas:
No. of site in which the sp. is presentFreq. of fungal sp. (%) =----------------------=-------------------x 100
Total no. of sites
Total no. of individual of a particular speciesDensity =-------------------------------------------------------x 100
Total no. of species
RESULTS AND DISCUSSION
The rapid bamboo leaf litter decomposition can beattributed mainly due to the soft cuticle, low lignin content,high moisture content and suitable temperature. Many workershave reported that changes in the relative proportions ofchemical constituents of litter may influence the rate ofdecomposition (Frankland 1966; Van Cleve 1974). In grade1 litter, 29 species belonging to 22 genera were isolated.Thirty nine species belonging to 17 genera were isolatedfrom grade 2 litter (Table 1). Significant variation inmicrobial quantity was recorded in different seasons of theyear. Our study revealed that the highest micobialpopulation in all the sampeling sites was recorded in themonth of September and second highest number of fungalpropagules.was recorded in the month of March and April.The lowest microbial population in all the sampling sites
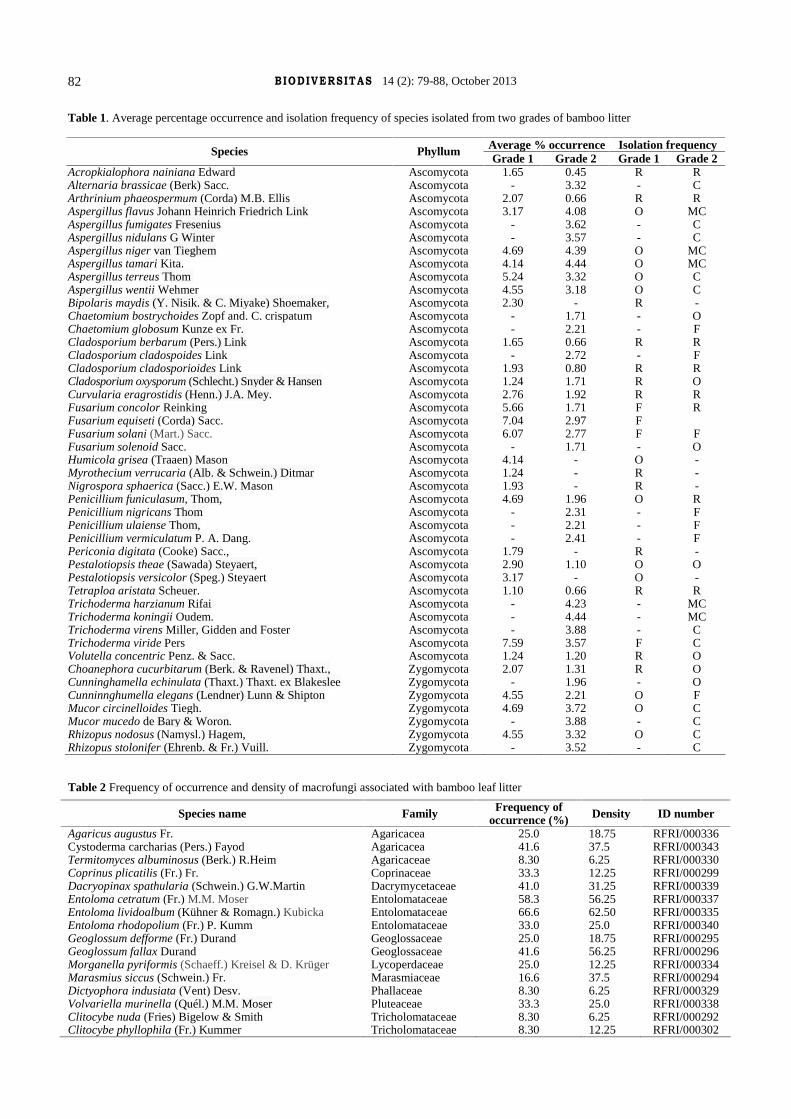
BIODIVERSITAS 14 (2): 79-88, October 201382
Table 1. Average percentage occurrence and isolation frequency of species isolated from two grades of bamboo litter
Average % occurrence Isolation frequencySpecies PhyllumGrade 1 Grade 2 Grade 1 Grade 2
Acropkialophora nainiana Edward Ascomycota 1.65 0.45 R RAlternaria brassicae (Berk) Sacc. Ascomycota - 3.32 - CArthrinium phaeospermum (Corda) M.B. Ellis Ascomycota 2.07 0.66 R RAspergillus flavus Johann Heinrich Friedrich Link Ascomycota 3.17 4.08 O MCAspergillus fumigates Fresenius Ascomycota - 3.62 - CAspergillus nidulans G Winter Ascomycota - 3.57 - CAspergillus niger van Tieghem Ascomycota 4.69 4.39 O MCAspergillus tamari Kita. Ascomycota 4.14 4.44 O MCAspergillus terreus Thom Ascomycota 5.24 3.32 O CAspergillus wentii Wehmer Ascomycota 4.55 3.18 O CBipolaris maydis (Y. Nisik. & C. Miyake) Shoemaker, Ascomycota 2.30 - R -Chaetomium bostrychoides Zopf and. C. crispatum Ascomycota - 1.71 - OChaetomium globosum Kunze ex Fr. Ascomycota - 2.21 - FCladosporium berbarum (Pers.) Link Ascomycota 1.65 0.66 R RCladosporium cladospoides Link Ascomycota - 2.72 - FCladosporium cladosporioides Link Ascomycota 1.93 0.80 R RCladosporium oxysporum (Schlecht.) Snyder & Hansen Ascomycota 1.24 1.71 R OCurvularia eragrostidis (Henn.) J.A. Mey. Ascomycota 2.76 1.92 R RFusarium concolor Reinking Ascomycota 5.66 1.71 F RFusarium equiseti (Corda) Sacc. Ascomycota 7.04 2.97 FFusarium solani (Mart.) Sacc. Ascomycota 6.07 2.77 F FFusarium solenoid Sacc. Ascomycota - 1.71 - OHumicola grisea (Traaen) Mason Ascomycota 4.14 - O -Myrothecium verrucaria (Alb. & Schwein.) Ditmar Ascomycota 1.24 - R -Nigrospora sphaerica (Sacc.) E.W. Mason Ascomycota 1.93 - R -Penicillium funiculasum, Thom, Ascomycota 4.69 1.96 O RPenicillium nigricans Thom Ascomycota - 2.31 - FPenicillium ulaiense Thom, Ascomycota - 2.21 - FPenicillium vermiculatum P. A. Dang. Ascomycota - 2.41 - FPericonia digitata (Cooke) Sacc., Ascomycota 1.79 - R -Pestalotiopsis theae (Sawada) Steyaert, Ascomycota 2.90 1.10 O OPestalotiopsis versicolor (Speg.) Steyaert Ascomycota 3.17 - O -Tetraploa aristata Scheuer. Ascomycota 1.10 0.66 R RTrichoderma harzianum Rifai Ascomycota - 4.23 - MCTrichoderma koningii Oudem. Ascomycota - 4.44 - MCTrichoderma virens Miller, Gidden and Foster Ascomycota - 3.88 - CTrichoderma viride Pers Ascomycota 7.59 3.57 F CVolutella concentric Penz. & Sacc. Ascomycota 1.24 1.20 R OChoanephora cucurbitarum (Berk. & Ravenel) Thaxt., Zygomycota 2.07 1.31 R OCunninghamella echinulata (Thaxt.) Thaxt. ex Blakeslee Zygomycota - 1.96 - OCunninnghumella elegans (Lendner) Lunn & Shipton Zygomycota 4.55 2.21 O FMucor circinelloides Tiegh. Zygomycota 4.69 3.72 O CMucor mucedo de Bary & Woron. Zygomycota - 3.88 - CRhizopus nodosus (Namysl.) Hagem, Zygomycota 4.55 3.32 O CRhizopus stolonifer (Ehrenb. & Fr.) Vuill. Zygomycota - 3.52 - C
Table 2 Frequency of occurrence and density of macrofungi associated with bamboo leaf litter
Species name Family Frequency ofoccurrence (%) Density ID number
Agaricus augustus Fr. Agaricacea 25.0 18.75 RFRI/000336Cystoderma carcharias (Pers.) Fayod Agaricacea 41.6 37.5 RFRI/000343Termitomyces albuminosus (Berk.) R.Heim Agaricaceae 8.30 6.25 RFRI/000330Coprinus plicatilis (Fr.) Fr. Coprinaceae 33.3 12.25 RFRI/000299Dacryopinax spathularia (Schwein.) G.W.Martin Dacrymycetaceae 41.0 31.25 RFRI/000339Entoloma cetratum (Fr.) M.M. Moser Entolomataceae 58.3 56.25 RFRI/000337Entoloma lividoalbum (Kühner & Romagn.) Kubicka Entolomataceae 66.6 62.50 RFRI/000335Entoloma rhodopolium (Fr.) P. Kumm Entolomataceae 33.0 25.0 RFRI/000340Geoglossum defforme (Fr.) Durand Geoglossaceae 25.0 18.75 RFRI/000295Geoglossum fallax Durand Geoglossaceae 41.6 56.25 RFRI/000296Morganella pyriformis (Schaeff.) Kreisel & D. Krüger Lycoperdaceae 25.0 12.25 RFRI/000334Marasmius siccus (Schwein.) Fr. Marasmiaceae 16.6 37.5 RFRI/000294Dictyophora indusiata (Vent) Desv. Phallaceae 8.30 6.25 RFRI/000329Volvariella murinella (Quél.) M.M. Moser Pluteaceae 33.3 25.0 RFRI/000338Clitocybe nuda (Fries) Bigelow & Smith Tricholomataceae 8.30 6.25 RFRI/000292Clitocybe phyllophila (Fr.) Kummer Tricholomataceae 8.30 12.25 RFRI/000302

KUMAR et al. – Fungal diversity from Bambusetum of RFRI, India 83
was recorded either in May or June. It was observed that70-85 % of the total population was shared by Ascomycota,1-10% by Zygomycota and other by the macrofungi. Themajor groups of fungi in order of their dominance were thegenera Aspergillus, Penicillium, Fusarium, Trichodermaand Cladosporium. In total, 7 species of Asperqillus and 4species of each Penicillium, Fusarium, Trichoderma andCladosporium were recorded. Among them A. terreus, A.tamari and A. wentii occasionally occurred in grade 1 litterisolation plates. Most common members of the group wereA. niger, A. tamari and A. flavus in grade 2 litter isolationplates. Similarly, Trichoderma viride frequently present inlitter1 and T. harzianum and T. koningii were the mostcommon in litter 2. A. terreus, A. tamarii and A. niger. A.fumigatus were isolated in greater numbers during summermonths, whereas, A. tamarii and A. nidulans in wintermonths. Although, A. niger and A. flavus were recordedregularly throughout the year but they were moreprominent during June to October after the monsoon break.The second dominant group was the genus Penicilliumwhich shared 10-15 % of the Deuteromycetes population. Itwas isolated in good numbers during winter monthsextending from November to March. Frequently isolatedspecies were P. funiculasum, P. nigricans P. vermiculatumand Penicillium ulaiense. The genus Fusarium were quitefrequent in rainy and winter months which comprised about5 % of the population. Winter months were also favourablefor Cladosporium but in summer it was recordedinfrequently. Second dominant class was the Phycomyceteswhich shared 15-20 % of the total population. Rainy seasonwas highly congenial for their occurrence. Frequently listedmembers were Choanephora cucurbitarum,Cunninghamella echinulata and Cunninghamella elegans.Mucor mucedo, M. circinelloides, Rhizopus nodosus and R.stolonifer are the common occurrence fungi and the rarelynoted ones were Acropkialophora nainiana, Cladosporiumcladosporioides, Tetraploa aristata, Curvulariaeragrostidis, Bipolaris maydis and Arthriniumphaeospermum (Fugure 3 and 4). The fungal communitycomposition was found to be distinct at each stage ofsuccession (Promputtha et al. 2002). The method used forassessing the phylloplane mycota of green as well as litterleaves in the present study was also used by several earlierworkers (Dickinson 1965, 1967; Hering 1965; Hogg andHudson 1966; Tokumasu 1980; Shirouzu et al. 2009). Thereason for using these techniques was to establish if anyfungi that were missed by the direct observation would befound. Environmental variables exert great influence ontheir occurrence in different seasons. Therefore, somemembers were predominantly isolated in one season ratherthan other seasons. But certain fungi which consistentlyoccurred throughout the year perhaps did not suffer muchfrom such extremes as the soil environment is physicallybetter buffered than subaerial environment to support them(Garrett 1955). The occurrence and distribution ofmicrofungi studied in different seasons in bamboo leaflitter of RFRI were mostly governed by the temperatureand moisture contents of soils. The abundance of fungi indifferent soils depends on the organic and nitrogen contentstogether with the other nutrient factors. The surface layer
always exhibits maximum population, isolates and speciesnumbers which gradually decline with depth increased. Theperiodic surveys were made for the collection ofmacrofungi, young and matured carpophores of 16 macrofungi species were also collected in different seasons.(Table 2.) The description of the collected specimensrecorded as follows:
Entoloma rhodopolium (Fr.) P. Kumm (Figure 1A,2A). The cap is 5-12 cm; convex, sometimes with a slightcentral bump, becoming broadly convex, broadly bell-shaped, or nearly flat; sticky when fresh; tan to yellow-brown or grayish brown, fading and drying out to grayishor almost whitish; the margin lined, at least by maturity.The gills are attached to the stem; close or nearly distant;white at first, becoming pink with maturity. The stem is 4-10 cm long; 6-12 mm thick; more or less equal; fairly dry;smooth, or very finely hairy at the apex; white; becominghollow. The spore print is pink. The spores measure 6.5-11x 7-9 µm, angular and inamyloid. Cystidia absent. Clampconnections present. It is inedible.
Dacryopinax spathularia (Schwein.) G.W.Martin(Figure 3B,4B). The fruit bodies of Dacryopinaxspathularia are spatula-shaped, usually 1-1.5 cm (0.4-0.6in) tall and between 0.5-3 mm wide. The color is orangewhen fresh, but it darkens to orangish-red when dry. Thespore print is white. Spores are ellipsoid, smooth-surfaced,translucent, and measure 7-10 by 3-4 μm. It has four-spored basidia that are 25-35 by 3-5 μm. It is edible.Cystoderma carcharias (Pers.) Fayod (Figure 3C, 4C).The cap is 2-5 cm across, sometimes white but usuallyshaded with pinkish or, more rarely, pale lilac, convex, flat,often umbonate, covered with minute granules, withappendiculate margin or cap edge. The gills are white,crowded, adnate. The stipe is 3-6 x 0.4-0.8 cm long, capcolored below ring and covered with small, pointed warts,white higher up, slightly enlarged at base and slightlynarrower at top. Ring of the same color, smooth on interior,like the lower part of the stipe externally. The flesh iswhitish or ochreous, strong fetid smell and unpleasantflavor. The spores measure 4-5x3-4 μm, white, elliptical,smooth, microns, and amyloid. It is edible.
Volvariella murinella (Quél.) M.M. Moser (Figure 3D,4D). The cap is 3.5 cm across oval becoming convex tobroadly convex to nearly flat; whitish, sometimes veryslightly darker over the center; the margin lined; slightlysticky when fresh but soon dry. The gills are free from thestem; whitish becoming pink to salmon; close or almostdistant. The stem is 1-5 cm long; 1-3 mm thick; more orless equal; dry; white; smooth; without a ring; the baseencased in a thick, white to grayish, sack-like volva whichmay be buried. The spore print is Salmon pink. The sporesmeasure 5.5-8 x 4-6 µm, elliptical and smooth. Clampconnections absent.
Entoloma cetratum (Fr.) M.M. Moser (Figure 3E, 4E).The cap is 2-5cm across, domed to bell-shaped with anipple, transparently striate, yellowish-brown darker whenwet. The stem is 4-8x2.5mm long, same colour as the cap.The gills are whitish at first then ochraceous-pink. Thespores measure 11-12.5x6.5-7.5 µm. The spore print ispink. It is inedible.
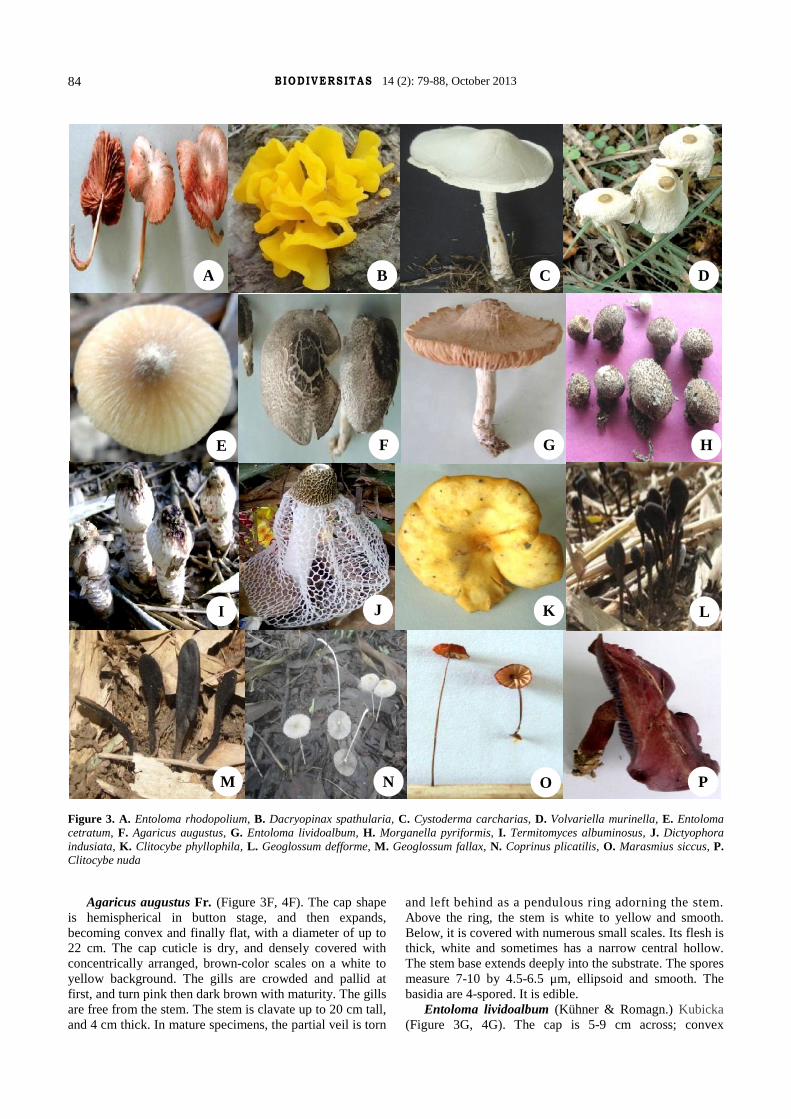
BIODIVERSITAS 14 (2): 79-88, October 201384
Figure 3. A. Entoloma rhodopolium, B. Dacryopinax spathularia, C. Cystoderma carcharias, D. Volvariella murinella, E. Entolomacetratum, F. Agaricus augustus, G. Entoloma lividoalbum, H. Morganella pyriformis, I. Termitomyces albuminosus, J. Dictyophoraindusiata, K. Clitocybe phyllophila, L. Geoglossum defforme, M. Geoglossum fallax, N. Coprinus plicatilis, O. Marasmius siccus, P.Clitocybe nuda
Agaricus augustus Fr. (Figure 3F, 4F). The cap shapeis hemispherical in button stage, and then expands,becoming convex and finally flat, with a diameter of up to22 cm. The cap cuticle is dry, and densely covered withconcentrically arranged, brown-color scales on a white toyellow background. The gills are crowded and pallid atfirst, and turn pink then dark brown with maturity. The gillsare free from the stem. The stem is clavate up to 20 cm tall,and 4 cm thick. In mature specimens, the partial veil is torn
and left behind as a pendulous ring adorning the stem.Above the ring, the stem is white to yellow and smooth.Below, it is covered with numerous small scales. Its flesh isthick, white and sometimes has a narrow central hollow.The stem base extends deeply into the substrate. The sporesmeasure 7-10 by 4.5-6.5 μm, ellipsoid and smooth. Thebasidia are 4-spored. It is edible.
Entoloma lividoalbum (Kühner & Romagn.) Kubicka(Figure 3G, 4G). The cap is 5-9 cm across; convex
C DBA
HGFE
K LJIONM P
A B C
E F G
I J K
M N O
D
H
L
P
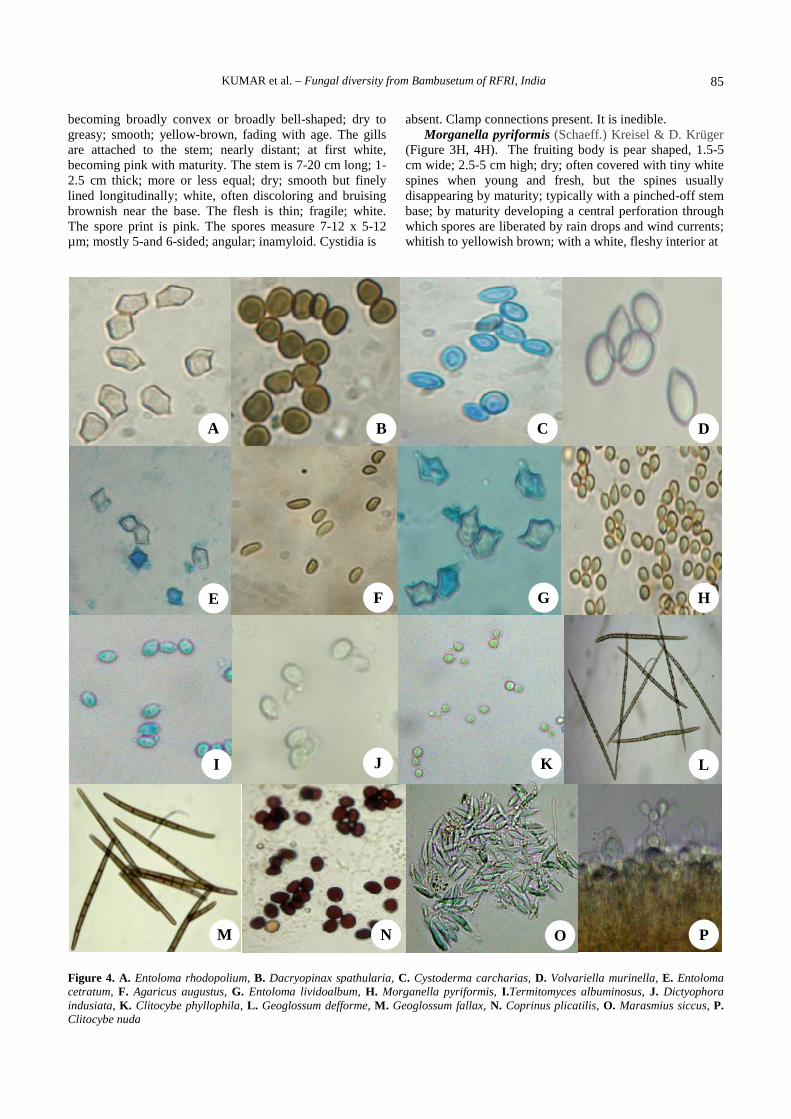
KUMAR et al. – Fungal diversity from Bambusetum of RFRI, India 85
becoming broadly convex or broadly bell-shaped; dry togreasy; smooth; yellow-brown, fading with age. The gillsare attached to the stem; nearly distant; at first white,becoming pink with maturity. The stem is 7-20 cm long; 1-2.5 cm thick; more or less equal; dry; smooth but finelylined longitudinally; white, often discoloring and bruisingbrownish near the base. The flesh is thin; fragile; white.The spore print is pink. The spores measure 7-12 x 5-12µm; mostly 5-and 6-sided; angular; inamyloid. Cystidia is
absent. Clamp connections present. It is inedible.Morganella pyriformis (Schaeff.) Kreisel & D. Krüger
(Figure 3H, 4H). The fruiting body is pear shaped, 1.5-5cm wide; 2.5-5 cm high; dry; often covered with tiny whitespines when young and fresh, but the spines usuallydisappearing by maturity; typically with a pinched-off stembase; by maturity developing a central perforation throughwhich spores are liberated by rain drops and wind currents;whitish to yellowish brown; with a white, fleshy interior at
Figure 4. A. Entoloma rhodopolium, B. Dacryopinax spathularia, C. Cystoderma carcharias, D. Volvariella murinella, E. Entolomacetratum, F. Agaricus augustus, G. Entoloma lividoalbum, H. Morganella pyriformis, I.Termitomyces albuminosus, J. Dictyophoraindusiata, K. Clitocybe phyllophila, L. Geoglossum defforme, M. Geoglossum fallax, N. Coprinus plicatilis, O. Marasmius siccus, P.Clitocybe nuda
D
H
L
P
A B C
E F G
I J K
M N O
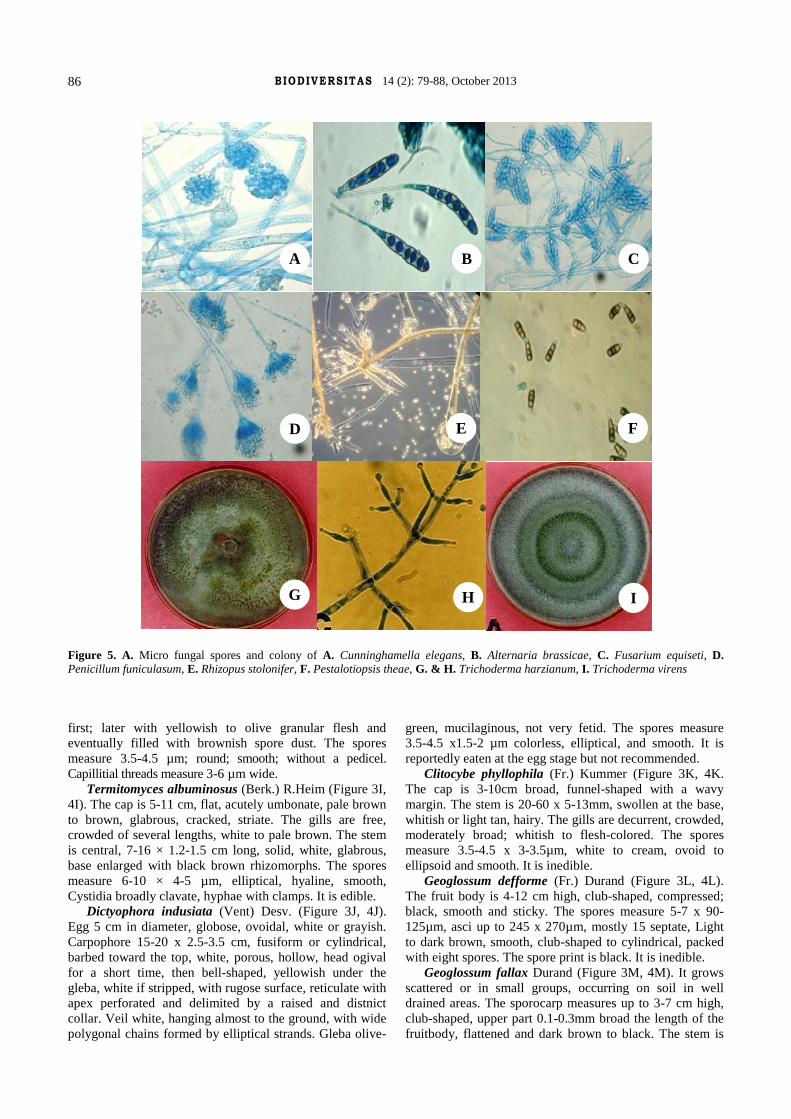
BIODIVERSITAS 14 (2): 79-88, October 201386
Figure 5. A. Micro fungal spores and colony of A. Cunninghamella elegans, B. Alternaria brassicae, C. Fusarium equiseti, D.Penicillum funiculasum, E. Rhizopus stolonifer, F. Pestalotiopsis theae, G. & H. Trichoderma harzianum, I. Trichoderma virens
first; later with yellowish to olive granular flesh andeventually filled with brownish spore dust. The sporesmeasure 3.5-4.5 µm; round; smooth; without a pedicel.Capillitial threads measure 3-6 µm wide.
Termitomyces albuminosus (Berk.) R.Heim (Figure 3I,4I). The cap is 5-11 cm, flat, acutely umbonate, pale brownto brown, glabrous, cracked, striate. The gills are free,crowded of several lengths, white to pale brown. The stemis central, 7-16 × 1.2-1.5 cm long, solid, white, glabrous,base enlarged with black brown rhizomorphs. The sporesmeasure 6-10 × 4-5 µm, elliptical, hyaline, smooth,Cystidia broadly clavate, hyphae with clamps. It is edible.
Dictyophora indusiata (Vent) Desv. (Figure 3J, 4J).Egg 5 cm in diameter, globose, ovoidal, white or grayish.Carpophore 15-20 x 2.5-3.5 cm, fusiform or cylindrical,barbed toward the top, white, porous, hollow, head ogivalfor a short time, then bell-shaped, yellowish under thegleba, white if stripped, with rugose surface, reticulate withapex perforated and delimited by a raised and distnictcollar. Veil white, hanging almost to the ground, with widepolygonal chains formed by elliptical strands. Gleba olive-
green, mucilaginous, not very fetid. The spores measure3.5-4.5 x1.5-2 µm colorless, elliptical, and smooth. It isreportedly eaten at the egg stage but not recommended.
Clitocybe phyllophila (Fr.) Kummer (Figure 3K, 4K.The cap is 3-10cm broad, funnel-shaped with a wavymargin. The stem is 20-60 x 5-13mm, swollen at the base,whitish or light tan, hairy. The gills are decurrent, crowded,moderately broad; whitish to flesh-colored. The sporesmeasure 3.5-4.5 x 3-3.5µm, white to cream, ovoid toellipsoid and smooth. It is inedible.
Geoglossum defforme (Fr.) Durand (Figure 3L, 4L).The fruit body is 4-12 cm high, club-shaped, compressed;black, smooth and sticky. The spores measure 5-7 x 90-125µm, asci up to 245 x 270µm, mostly 15 septate, Lightto dark brown, smooth, club-shaped to cylindrical, packedwith eight spores. The spore print is black. It is inedible.
Geoglossum fallax Durand (Figure 3M, 4M). It growsscattered or in small groups, occurring on soil in welldrained areas. The sporocarp measures up to 3-7 cm high,club-shaped, upper part 0.1-0.3mm broad the length of thefruitbody, flattened and dark brown to black. The stem is
A B C
D E F
G H I
KUMAR et al. – Fungal diversity from Bambusetum of RFRI, India 87
0.06-0.3 cm wide, slender, dark brown to black, viscid,bald and minutely downy. The ascospores measure (40)60-78(90) x 4.6-6.7 um, straight or somewhat curved, darkbrown; asci mostly 8-spored. paraphyses colorless tobrown. The spore print is brown. It is inedible.
Coprinus plicatilis (Fr.) Fr. (Figure 3N, 4N). The cap is10-30 mm, bell shaped, grooved from the margin, yellow tolight brown, gray in the groves. The stem is 30-90 mm longand 2.5 mm thick, fragile, hollow and white. The gills arewhite at first, becoming gray, free from the stem. The sporeprint is black. The spores measure 9-15 x 7-11 µm,ellipsoid to almond shaped, large, and have an eccentricpore. It is Inedible.
Marasmius siccus (schwein.) Fr. (Figure 3O, 4O)..The cap up to 0.4-3cm across, bell-shaped with deep wideradial pleats; rust-orange to rust-brown, minutely velvety.The stem is 2.4-6.5 cm long, 1 mm thick, equal, yellowishabove, brown toward the base; smooth basal. The sporeprint is white. The spores measure 14-20 x 3-4.5 µm,spindle-to club-shaped, smooth, often curved. It is inedible.
Clitocybe nuda (Fries) Bigelow & Smith (Figure 3P,4P). The cap is 3-20 cm; convex to nearly flat, surfacesmooth, dull purple, flesh-colored, tan. The stem is 2.5-9cm long, 1-2 cm In diameter, pale purple colored like thegills, base covered with buff mycelium. The gills areattached to the stem, crowded, lilac, pinkish-buff. Thespore print is pinkish. The spores measure 4.5-7 x 4.5-5µm; ellipsoid and smooth. It is edible.
CONCLUSION
It is clear that in different grades of litter shifts inactivity of the various species of the mycota occurred. Asassessment of such activity is based on percentageoccurrence of these fungi in different grades of litter,computed on the basis of sporulating colonies on the litter,and not on dilution plate counts, the data so obtained maybe considered sufficiently reliable. It is obvious that thefungi colonizing the phylloplane or litter must be alreadypresent in that area. The phylloplane serves as a settlingarea for propagules of numerous fungi, several of which arecomponents of the air spora. The host leaf allows thedevelopment of only a few species and inhibits others.Those fungi which are able to establish on living leaves arefoliicolous. These can, in turn, be classified in to: (i) thosewhose activity is confined to living leaves and (ii) thosethat continue to be active after colonizing a living leaf evenafter it is shed. The true litter fungi are perhaps those thatcolonize the leaves after they are shed and show activity forvarying periods.
ACKNOWLEDGEMENTS
The authors are gratefully acknowledged to IndianCouncil of Forestry Research and Education (ICFRE) forfunding the research project: No-RFRI-39/2010-11/FP.
REFERENCES
Ainsworth GC, Sparrow FK, Sussan AS. 1972. The Fungi, an AdvancedTreatise. Vol. IV A. Academic Press, New York.
Alexopoulos CJ, Mims CW, Blackwell. 1996. Introductory Mycology.John Wiley and Sons Inc., New York.
Arora D. 1991. All that the Rain Promises and More. A Hip Pocket Guideto Western Mushroom. Ten Speed Press, Berkeley.
Barnett HL, Hunter B. 1972. Illustrated Genera of Imperfect Fungi. 3rd ed.Burgess Pub. Co., Minneapolis.
Bills GF, Polishook JD. 1994. Abundance and diversity of microfungi inleaf litter of a lowland rain forest in Costa Rica. Mycologia 86: 187-198.
Brown NS, Bhagwat S, Watkinson. 2006. Macrofungal diversity infragmented and disturbed forests of the Western Ghats of India. JAppl Ecol 43 (1): 11-17.
Change ST, Miles PG. 2004. Mushrooms-Cultivation, National Value,Medicinal Effect and Environmental Impact. 2nd ed. CRC Press, NewYork.
Cowan A. 2001. Fungi-Life Support for Ecosystems. Essential ARB4,West Wickham, Kent, UK.
Deka HK, Mishra RR. 1982. Decomposition of bamboo (Dendrocalamushamiltoni Mess) leaf litter in relation to age of jhum fallows in north-east India. Pl Soil 68:151-159.
Dickinson CH, Pugh GJF. 1974. Biology of Plant Litter Decomposition,Vol. I & II. (eds CH Dickinson, GJF Pugh). Academic Press, London.
Dickinson CH. 1967. Fungal colonization of Pisum leaves. Canadian J Bot45: 915-927.
Ellis MB. 1971. Dematiaceous Hyphomycetes. CMI, Ferry Lane, Kew,Surrey, England.
Ellis MB. 1976. More Dematiaceous Hyphomycetes. CMI Ferry Lane,Kew, Surrey, England.
Frankland JC. 1966. Succession of fungi on decaying petioles ofPteridium aquilinum. J Ecol 54: 41-63.
Garrett S D. 1955. Microbial ecology of the soil. Trans Br Mycol Soc 38:1-9.
Gates GM, Ratkowsky DA, Grove SJ. 2005. A Comparision ofmacrofungi in young Silvicultural regeneration and mature forest atthe Warra LTER siet in the southern forests of Tasmania. Tasforests16: 127.
Gilman JC. 1957. A Manual of Soil Fungi. Rev 2nd ed. Oxford and IBHPublishing Co. Calcutta, India.
Grigal DF, McColl JG. 1977. Litter decomposition following forest fire innortheastern Minnesota. J Appl Ecol 14: 531-538.
Grove WB. 1967. British stem and leaf fungi (Coelomycetes). Vol. 2.Cambridge University Press, London.
Hawksworth DL. 2004. Fungal diversity and its implifications for geneticresource collections. Stud Mycol 50: 19.
Hering TF. 1965. Succession of fungi in the litter of a Lake DistrictOakwood. Trans Br Mycol Soc 48: 391-408.
Hogg BM, Hudson HJ. 1966. Microfungi on leaves of Fagus sylvatica. I.The microfungal succession. Trans Br Mycol Soc 49: 185-192.
Hudson HJ. 1968.The ecology of fungi on plant remains above the soil.New Phytol 67: 837-874.
Hughes SJ. 1989. New Zealand fungi 33. Some new species and newrecord of dematiaceous hyphomycetes. New Zealand J Bot 27: 449-459.
Hunt GA. 1999. Assessing macrofungi of special concern for conservationin forested ecosystems. In: Proc Biology and Management of Speciesand Habitats at Risk. Vol 2, 15-19 Feb 1999, University College ofthe Cariboo, Kamloops.
Keizer GJ. 1998. The Complete Encyclopedia of Mushrooms. ReboPublishers, Netherland.
Keyworth PK. 1951. A petridish moist chamber. Trans Br Mycol Soc 34:291-292
Manoch L, Kokaew J, Jeamjitt O, Dethoup T. 2006. Leaf litter fungi andstudies on antagonistic effect against plant pathogenic fungi in vitro.In: The Proceedings of 44th Kasetsart University Annua Conference,Subject: Plants. Kasetsart University, Bangkok. 30 January-2February 2006.
Manoharachary C, Sridhar K, Singh R, Adholeya, Suryanarayanan TS,Rawat S, Johri BN. 2005. Fungal biodiversity: Distribution,conservation and prospecting of fungi from India. Curr Sci 89: 58-71.
Molina R, O’Dell T, Luoma D, Amaranthus M, Castellano and Russell K.1993. Biology, Ecology and Social aspects of Wild Edible

BIODIVERSITAS 14 (2): 79-88, October 201388
Mushrooms in the Forests of the Pacific Northwest: A Preface ofManaging Commercial Harvest. U.S. Dept. of Agriculture Forestservice, Pacific Northwest Research station, United States.
Mueller GM, Schmit JP. 2007. Fungal biodiversity: what do we know?What can we predict? Biodiv Conserv 16 (1): 1-5.
Osono T, Takeda H. 2002. Comparison of litter decomposing abilityamong diverse fungi in a cool temperate deciduous forest in Japan.Mycologia 94:421-427.
Piepenbring M. 2007. Inventoring the fungi of Panama. Biodiv Conserv16 (1): 73-84.
Pilz D, Molina R. 2001. Commercial harvests of edible mushrooms fromthe forests of the Pacific Northewst United States: Issues,management and monitoring for sustainability. For Ecol Manag: 155(1): 3-16.
Promputtha I, Lumyong S, Lumyong P, McKenzie EHC, Hyde KD. 2002.Fungal succession on senescent leaves of Manglietia garrettii in DoiSuthep-Pui National Park, Northern Thailand. Fungal Divers 10: 89-100.
Purakasthya RP, Chandra A. 1985. Manual of Indian Edible Mushrooms.Today and Tomorrow’s Publication, New Delhi.
Saksena SB. 1955. Ecological factors governing the distribution ofmicrofungi in forest soil of Sagar. J Indian Bot Soc 34: 262-298.
Saravanan T. 2004. Studies on the Biodiversity of Microfungi in theEastern Ghats of Tamilnadu, India. [Ph.D. Dissertation]. University ofMadras, India.
Sarbhoy AK, Agarwal DK, Varshney JL. 1996. Fungi of India 1982-1992.CBS Publ. & Distributors, New Delhi.
Schmit JP, Murphy JF, Mueller GM. 1999. Macrofungal diversity of atemperate oak forest: a test of species richness estimators. Can J Bot77: 1014-1027.
Shipton WA, Brown JF. 1962. A whole leaf cleaning and stainingtechnique to demonstrate host pathogen relationship of wheat stemrust. Phytopathol 52: 1813.
Shirouzu T, Hirose D, Fukasawa Y, Tokumasu S. 2009. Fungal successionassociated with the decay of leaves of an evergreen oak, Quercusmyrsinaefolia. Fungal Divers 34: 87-109.
Soni KK, Pyasi A, Verma RK. 2011. Litter decomposing fungi in sal(Shorea robusta) forests of central India. Nusantara Biosci 3: 136-144.
Subramanian CV, Vittal BPR. 1979. Studies on litter fungi II. Fungalcolonization of Atlantia monophylla Corr. leaves and litter. NovaHedwigia 63: 361-369.
Subramanian CV. 1971. Hyphomycetes. Indian Council of AgriculturalResearch, New Delhi.
Sutton BC. 1980. The Coelomycetes, fungi imperfectii with pycnidia,ascervulii and stromata. CMI, Kew, England.
Tokumasu S. 1980. Observations on the fungal flora in pine leaf litter. In:Kenkyu K (ed). Biseibutsu no Seitai (Ecology of Microorganism).Vol. 7. Gakkai Shuppan Center, Japan.
Tokumasu S, Tubaki K, Manoch L. 1997. Microfungal communities ondecaying pine needles in Thailand. In: Janardhanan KK, NatarajanKR, Hawksworth DL. (eds.). Tropical Mycology. Science PublishersInc, Enfield, New Hampshire.
Van Cleve K. 1974. Organic matter quality in relation to decomposition.In: Holding AJ, Heal OW, MacLean SF Jr, Flanagan PW (eds). SoilOrganisms and Decomposition in Tundra. Tundra Biome SteeringCommittee, Stockholm, Sweden.
Venkobachar C. 1995. Screening of tropical wood-rotting mushroom forcopper biosorption. Appl Env Microbiol 61 (9): 3507.
Von Arx JA. 1981. The genera of fungi sporulating in pure culture. 3rd ed..J Cramer, Vaduz, Germany.
Zoberi MH. 1973. Some edible mushrooms from Nigeria. Nigerian Field38: 81-90.
BIODIVERSITAS ISSN: 1412-033XVolume 14, Number 2, October 2013 E-ISSN: 2085-4722Pages: 89-94 DOI: 10.13057/biodiv/d140206
The influence of gap size on plant species diversity and composition inbeech (Fagus orientalis) forests, Ramsar, Mazandaran Province, North
of Iran
HASSAN POURBABAEI1,♥, HAMIDREZA HADDADI-MOGHADDAM1, MARZIEH BEGYOM-FAGHIR2,TOOBA ABEDI3
1Department of Forestry, Faculty of Natural Resources, University of Guilan, Somehsara, Iran. P.O. Box 1144, Tel.: +98-182-3220895, Fax.: +98-182-3223600, ♥email: [email protected]
2Department of Biology, Faculty of Sciences, University of Guilan, Rasht, Iran3Environmental Research Institute of Academic Center for Education, Culture and Research (ACECR), Rasht, Iran
Manuscript received: 28 March. 2013. Revision accepted: 18 July 2013.
ABSTRACT
Pourbabaei H, Haddadi-Moghaddam H, Begyom-Faghir M, Abedi T. 2013. The influence of gap size on plant species diversity andcomposition in beech (Fagus orientalis) forests, Ramsar, Mazandaran Province, North of Iran. Biodiversitas 14: 89-94.This study wasconducted to investigate the influence of gap size on plant species diversity and composition in beech (Fagus orientalis Lipsky.) forests,Ramsar, Mazandaran province. Fifteen gaps in small, medium, and large sizes were randomly selected. Abundance of tree saplings,shrubs and herbaceous species were counted on 4 m2 micro-plots within the gaps. Diversity indices including Shannon-Wiener,Simpson, Mc Arthur's N1, Hill's N2, species richness and Smith-Wilson’s evenness index were computed. The results revealed that therewas significant difference among three gap categories in terms of diversity. The highest diversity values of tree and herbaceous specieswere obtained in the large gaps, while the highest diversity value of shrub species was in the medium gaps. Species composition ofsmall gaps (28 species: 7 trees and 21 herbaceous), medium gaps (37 species: 7 trees, 5 shrubs and 25 herbaceous) and large gaps (40species: 7 trees, 4 shrubs and 29 herbaceous) were recognized. Therefore, based on the results of this study, it is recommended that inorder to maintain plant diversity and composition up to 400 m2 gap size cloud be used in this forests.
Key words: Fagus orientalis, gap size, plant diversity
INTRODUCTION
The oriental beech (Fagus orientalis Lipsky.) is adeciduous tree species (Salehi et al. 2011), distributed fromMacedonia, Bulgaria, northwest Turkey (Asia Minor),Azerbaijan, Caucasus to Iran (Rechinger 1963-2010;Komarov 1934-1963). Iranian beech forests are dominantin the Montane and submontane zones of central andwestern Caspian forests (Mobayen and Tregubov 1970;Asli and Nedialkov 1973). These forests occupyapproximately 18% of the forested area (Bayramzadeh etal. 2012) and comprise the most productive and importantcommercial forests in the Caspian zone (Salehi et al. 2011).However, these forests are subjected to constant changes(Sampson and DeCoster 1998), a variety of natural andanthropogenic perturbations (Odum and Barrett 2004;Thompson 2010; Alongi 2007). Several researches werecarried out on forest structural changes, silvicultural systemand especially gap silviculture system (Tuomela et al.1996; Albanesi et al. 2005; Boudreau and Lawes 2005;Renato and De Lima 2005).
A planned program of silvicultural treatments (BritishColombia 2003) ensures the conservation and maintenanceof biological diversity and richness for sustainable forestry
(Torras and Saura 2008; Schumann et al. 2004; Battles andFahey 2000; Simila et al. 2006). Whenever one or severalnumber of trees fall in the forest, certain physical space iscreated this is called gap (Denslow 1987; Runkle 1991).Based on Gray and Spies (1996) gaps are two types: I)Natural gaps formed by falling single tree or a small groupof trees, produced by windfall or broken trunk and II)Artificial gaps created by man as a result of single or groupcutting of trees.
Several investigators reported the effect of gaps onmaintaining and enhancing biological diversity (Poulsonand Platt 1989; Coates 2002; Gray and Spies 1996;Albanesi et al. 2005), their importance to the speciesdynamics of forests types (White and Pikett 1985; Platt andStrong 1989) and their impact on soil (Haghverdi et al.2012). Several investigations about gap’s characteristicsespecially gap size (Sagheb-Talebi 1995; Mousavi et al.2003), shape, dynamics (e.g. McCarthy 2001; Fujita et al.2003; Zeibig et al. 2005; Kenderes et al. 2008) and itsrelation to plant diversity and species richness (Gray andSpies 1996; Goleij 2006; Scheller and Mladenof 2002;Heywood and Watson 1995) have been carried out indifferent forests of the temperate regions.
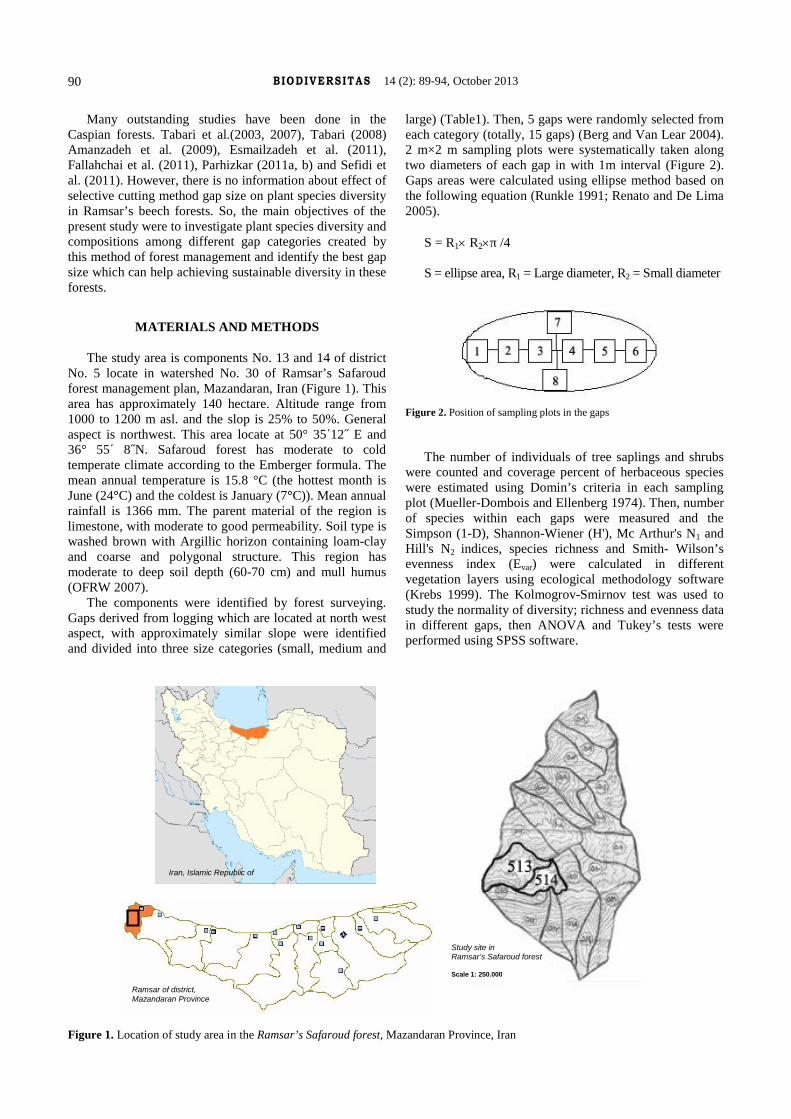
BIODIVERSITAS 14 (2): 89-94, October 201390
Many outstanding studies have been done in theCaspian forests. Tabari et al.(2003, 2007), Tabari (2008)Amanzadeh et al. (2009), Esmailzadeh et al. (2011),Fallahchai et al. (2011), Parhizkar (2011a, b) and Sefidi etal. (2011). However, there is no information about effect ofselective cutting method gap size on plant species diversityin Ramsar’s beech forests. So, the main objectives of thepresent study were to investigate plant species diversity andcompositions among different gap categories created bythis method of forest management and identify the best gapsize which can help achieving sustainable diversity in theseforests.
MATERIALS AND METHODS
The study area is components No. 13 and 14 of districtNo. 5 locate in watershed No. 30 of Ramsar’s Safaroudforest management plan, Mazandaran, Iran (Figure 1). Thisarea has approximately 140 hectare. Altitude range from1000 to 1200 m asl. and the slop is 25% to 50%. Generalaspect is northwest. This area locate at 50° 35΄12˝ E and36° 55΄ 8˝N. Safaroud forest has moderate to coldtemperate climate according to the Emberger formula. Themean annual temperature is 15.8 °C (the hottest month isJune (24°C) and the coldest is January (7°C)). Mean annualrainfall is 1366 mm. The parent material of the region islimestone, with moderate to good permeability. Soil type iswashed brown with Argillic horizon containing loam-clayand coarse and polygonal structure. This region hasmoderate to deep soil depth (60-70 cm) and mull humus(OFRW 2007).
The components were identified by forest surveying.Gaps derived from logging which are located at north westaspect, with approximately similar slope were identifiedand divided into three size categories (small, medium and
large) (Table1). Then, 5 gaps were randomly selected fromeach category (totally, 15 gaps) (Berg and Van Lear 2004).2 m×2 m sampling plots were systematically taken alongtwo diameters of each gap in with 1m interval (Figure 2).Gaps areas were calculated using ellipse method based onthe following equation (Runkle 1991; Renato and De Lima2005).
S = R1 R2π /4
S = ellipse area, R1 = Large diameter, R2 = Small diameter
Figure 2. Position of sampling plots in the gaps
The number of individuals of tree saplings and shrubswere counted and coverage percent of herbaceous specieswere estimated using Domin’s criteria in each samplingplot (Mueller-Dombois and Ellenberg 1974). Then, numberof species within each gaps were measured and theSimpson (1-D), Shannon-Wiener (H'), Mc Arthur's N1 andHill's N2 indices, species richness and Smith- Wilson’sevenness index (Evar) were calculated in differentvegetation layers using ecological methodology software(Krebs 1999). The Kolmogrov-Smirnov test was used tostudy the normality of diversity; richness and evenness datain different gaps, then ANOVA and Tukey’s tests wereperformed using SPSS software.
Figure 1. Location of study area in the Ramsar’s Safaroud forest, Mazandaran Province, Iran
Iran, Islamic Republic of
Ramsar of district,Mazandaran Province
Study site inRamsar’s Safaroud forest
Scale 1: 250.000
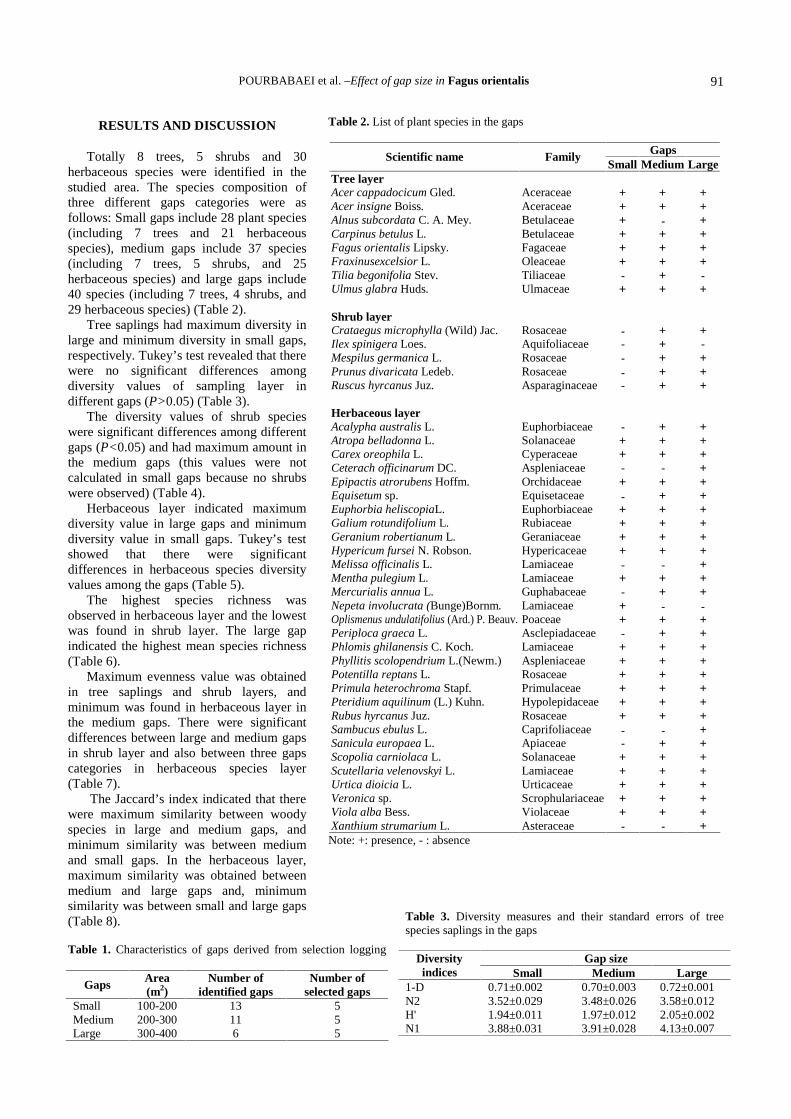
POURBABAEI et al. –Effect of gap size in Fagus orientalis 91
RESULTS AND DISCUSSION
Totally 8 trees, 5 shrubs and 30herbaceous species were identified in thestudied area. The species composition ofthree different gaps categories were asfollows: Small gaps include 28 plant species(including 7 trees and 21 herbaceousspecies), medium gaps include 37 species(including 7 trees, 5 shrubs, and 25herbaceous species) and large gaps include40 species (including 7 trees, 4 shrubs, and29 herbaceous species) (Table 2).
Tree saplings had maximum diversity inlarge and minimum diversity in small gaps,respectively. Tukey’s test revealed that therewere no significant differences amongdiversity values of sampling layer indifferent gaps (P>0.05) (Table 3).
The diversity values of shrub specieswere significant differences among differentgaps (P<0.05) and had maximum amount inthe medium gaps (this values were notcalculated in small gaps because no shrubswere observed) (Table 4).
Herbaceous layer indicated maximumdiversity value in large gaps and minimumdiversity value in small gaps. Tukey’s testshowed that there were significantdifferences in herbaceous species diversityvalues among the gaps (Table 5).
The highest species richness wasobserved in herbaceous layer and the lowestwas found in shrub layer. The large gapindicated the highest mean species richness(Table 6).
Maximum evenness value was obtainedin tree saplings and shrub layers, andminimum was found in herbaceous layer inthe medium gaps. There were significantdifferences between large and medium gapsin shrub layer and also between three gapscategories in herbaceous species layer(Table 7).
The Jaccard’s index indicated that therewere maximum similarity between woodyspecies in large and medium gaps, andminimum similarity was between mediumand small gaps. In the herbaceous layer,maximum similarity was obtained betweenmedium and large gaps and, minimumsimilarity was between small and large gaps(Table 8).
Table 1. Characteristics of gaps derived from selection logging
Number ofselected gaps
Number ofidentified gaps
Area(m2)Gaps
513100-200Small511200-300Medium56300-400Large
Table 3. Diversity measures and their standard errors of treespecies saplings in the gaps
Gap sizeLargeMediumSmall
Diversityindices
0.72±0.0010.70±0.0030.71±0.0021-D3.58±0.0123.48±0.0263.52±0.029N22.05±0.0021.97±0.0121.94±0.011H'4.13±0.0073.91±0.0283.88±0.031N1
Table 2. List of plant species in the gaps
GapsLargeMediumSmall
FamilyScientific name
Tree layer+++AceraceaeAcer cappadocicum Gled.+++AceraceaeAcer insigne Boiss.+-+BetulaceaeAlnus subcordata C. A. Mey.+++BetulaceaeCarpinus betulus L.+++FagaceaeFagus orientalis Lipsky.+++OleaceaeFraxinusexcelsior L.-+-TiliaceaeTilia begonifolia Stev.+++UlmaceaeUlmus glabra Huds.
Shrub layer++-RosaceaeCrataegus microphylla (Wild) Jac.-+-AquifoliaceaeIlex spinigera Loes.++-RosaceaeMespilus germanica L.++-RosaceaePrunus divaricata Ledeb.++-AsparaginaceaeRuscus hyrcanus Juz.
Herbaceous layer++-EuphorbiaceaeAcalypha australis L.+++SolanaceaeAtropa belladonna L.+++CyperaceaeCarex oreophila L.+--AspleniaceaeCeterach officinarum DC.+++OrchidaceaeEpipactis atrorubens Hoffm.++-EquisetaceaeEquisetum sp.+++EuphorbiaceaeEuphorbia heliscopiaL.+++RubiaceaeGalium rotundifolium L.+++GeraniaceaeGeranium robertianum L.+++HypericaceaeHypericum fursei N. Robson.+--LamiaceaeMelissa officinalis L.+++LamiaceaeMentha pulegium L.++-GuphabaceaeMercurialis annua L.--+LamiaceaeNepeta involucrata (Bunge)Bornm.+++PoaceaeOplismenus undulatifolius (Ard.) P. Beauv.++-AsclepiadaceaePeriploca graeca L.+++LamiaceaePhlomis ghilanensis C. Koch.+++AspleniaceaePhyllitis scolopendrium L.(Newm.)+++RosaceaePotentilla reptans L.+++PrimulaceaePrimula heterochroma Stapf.+++HypolepidaceaePteridium aquilinum (L.) Kuhn.+++RosaceaeRubus hyrcanus Juz.+--CaprifoliaceaeSambucus ebulus L.++-ApiaceaeSanicula europaea L.+++SolanaceaeScopolia carniolaca L.+++LamiaceaeScutellaria velenovskyi L.+++UrticaceaeUrtica dioicia L.+++ScrophulariaceaeVeronica sp.+++ViolaceaeViola alba Bess.+--AsteraceaeXanthium strumarium L.
Note: +: presence, - : absence
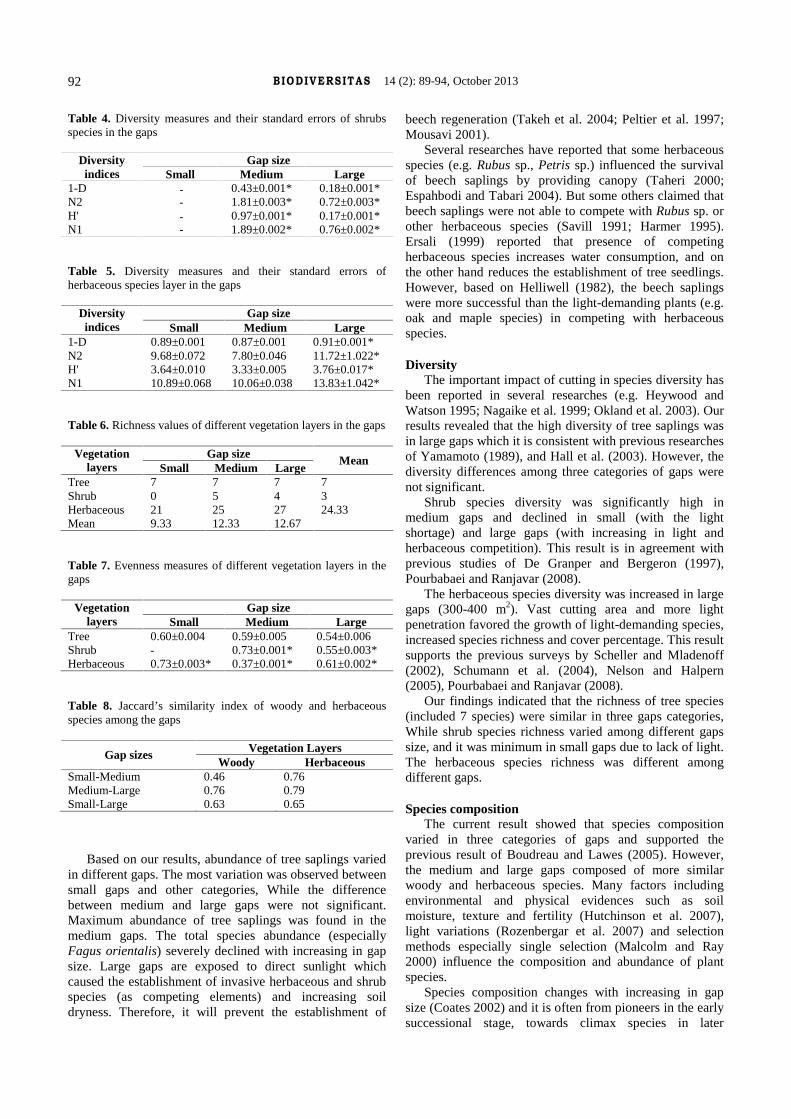
BIODIVERSITAS 14 (2): 89-94, October 201392
Table 4. Diversity measures and their standard errors of shrubsspecies in the gaps
Gap sizeLargeMediumSmall
Diversityindices
0.18±0.001*0.43±0.001*-1-D0.72±0.003*1.81±0.003*-N20.17±0.001*0.97±0.001*-H'0.76±0.002*1.89±0.002*-N1
Table 5. Diversity measures and their standard errors ofherbaceous species layer in the gaps
Gap sizeLargeMediumSmall
Diversityindices
0.91±0.001*0.87±0.0010.89±0.0011-D11.72±1.022*7.80±0.0469.68±0.072N23.76±0.017*3.33±0.0053.64±0.010H'13.83±1.042*10.06±0.03810.89±0.068N1
Table 6. Richness values of different vegetation layers in the gaps
Gap size MeanLargeMediumSmall
Vegetationlayers
7777Tree3450Shrub24.33272521Herbaceous
12.6712.339.33Mean
Table 7. Evenness measures of different vegetation layers in thegaps
Gap sizeLargeMediumSmall
Vegetationlayers
0.54±0.0060.59±0.0050.60±0.004Tree0.55±0.003*0.73±0.001*-Shrub0.61±0.002*0.37±0.001*0.73±0.003*Herbaceous
Table 8. Jaccard’s similarity index of woody and herbaceousspecies among the gaps
Vegetation LayersGap sizesWoody Herbaceous
Small-Medium 0.46 0.76Medium-Large 0.76 0.79Small-Large 0.63 0.65
Based on our results, abundance of tree saplings variedin different gaps. The most variation was observed betweensmall gaps and other categories, While the differencebetween medium and large gaps were not significant.Maximum abundance of tree saplings was found in themedium gaps. The total species abundance (especiallyFagus orientalis) severely declined with increasing in gapsize. Large gaps are exposed to direct sunlight whichcaused the establishment of invasive herbaceous and shrubspecies (as competing elements) and increasing soildryness. Therefore, it will prevent the establishment of
beech regeneration (Takeh et al. 2004; Peltier et al. 1997;Mousavi 2001).
Several researches have reported that some herbaceousspecies (e.g. Rubus sp., Petris sp.) influenced the survivalof beech saplings by providing canopy (Taheri 2000;Espahbodi and Tabari 2004). But some others claimed thatbeech saplings were not able to compete with Rubus sp. orother herbaceous species (Savill 1991; Harmer 1995).Ersali (1999) reported that presence of competingherbaceous species increases water consumption, and onthe other hand reduces the establishment of tree seedlings.However, based on Helliwell (1982), the beech saplingswere more successful than the light-demanding plants (e.g.oak and maple species) in competing with herbaceousspecies.
DiversityThe important impact of cutting in species diversity has
been reported in several researches (e.g. Heywood andWatson 1995; Nagaike et al. 1999; Okland et al. 2003). Ourresults revealed that the high diversity of tree saplings wasin large gaps which it is consistent with previous researchesof Yamamoto (1989), and Hall et al. (2003). However, thediversity differences among three categories of gaps werenot significant.
Shrub species diversity was significantly high inmedium gaps and declined in small (with the lightshortage) and large gaps (with increasing in light andherbaceous competition). This result is in agreement withprevious studies of De Granper and Bergeron (1997),Pourbabaei and Ranjavar (2008).
The herbaceous species diversity was increased in largegaps (300-400 m2). Vast cutting area and more lightpenetration favored the growth of light-demanding species,increased species richness and cover percentage. This resultsupports the previous surveys by Scheller and Mladenoff(2002), Schumann et al. (2004), Nelson and Halpern(2005), Pourbabaei and Ranjavar (2008).
Our findings indicated that the richness of tree species(included 7 species) were similar in three gaps categories,While shrub species richness varied among different gapssize, and it was minimum in small gaps due to lack of light.The herbaceous species richness was different amongdifferent gaps.
Species compositionThe current result showed that species composition
varied in three categories of gaps and supported theprevious result of Boudreau and Lawes (2005). However,the medium and large gaps composed of more similarwoody and herbaceous species. Many factors includingenvironmental and physical evidences such as soilmoisture, texture and fertility (Hutchinson et al. 2007),light variations (Rozenbergar et al. 2007) and selectionmethods especially single selection (Malcolm and Ray2000) influence the composition and abundance of plantspecies.
Species composition changes with increasing in gapsize (Coates 2002) and it is often from pioneers in the earlysuccessional stage, towards climax species in later
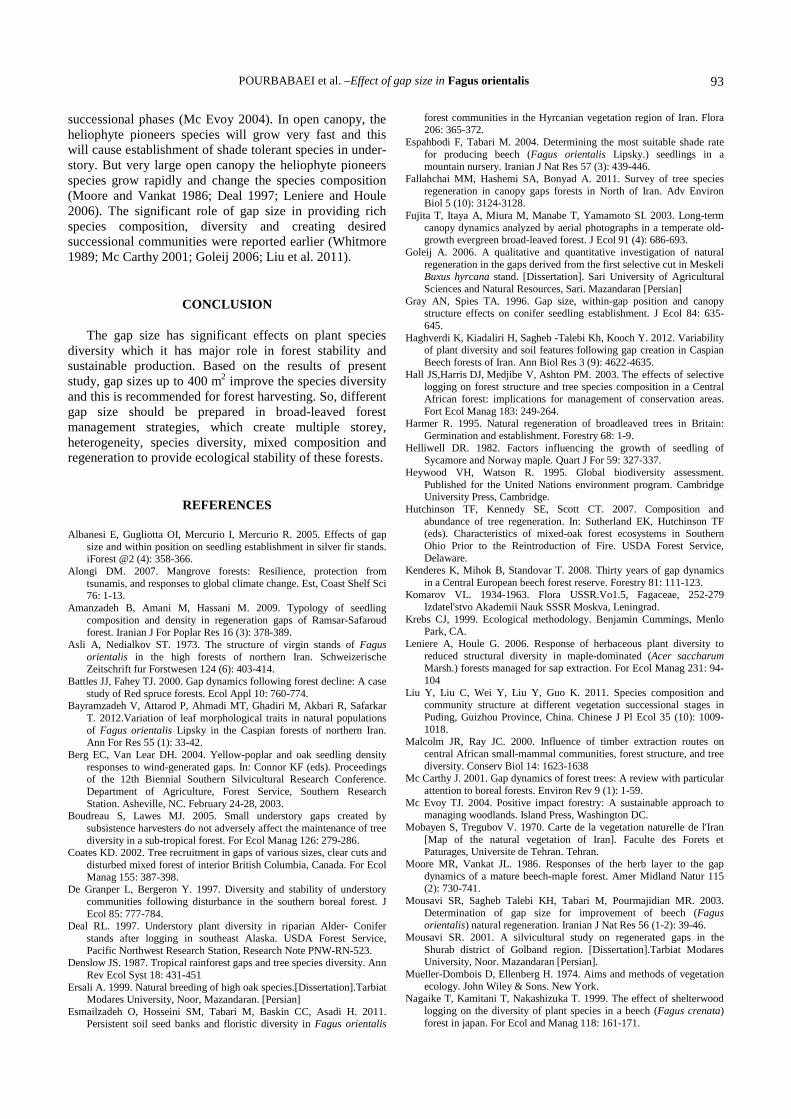
POURBABAEI et al. –Effect of gap size in Fagus orientalis 93
successional phases (Mc Evoy 2004). In open canopy, theheliophyte pioneers species will grow very fast and thiswill cause establishment of shade tolerant species in under-story. But very large open canopy the heliophyte pioneersspecies grow rapidly and change the species composition(Moore and Vankat 1986; Deal 1997; Leniere and Houle2006). The significant role of gap size in providing richspecies composition, diversity and creating desiredsuccessional communities were reported earlier (Whitmore1989; Mc Carthy 2001; Goleij 2006; Liu et al. 2011).
CONCLUSION
The gap size has significant effects on plant speciesdiversity which it has major role in forest stability andsustainable production. Based on the results of presentstudy, gap sizes up to 400 m2 improve the species diversityand this is recommended for forest harvesting. So, differentgap size should be prepared in broad-leaved forestmanagement strategies, which create multiple storey,heterogeneity, species diversity, mixed composition andregeneration to provide ecological stability of these forests.
REFERENCES
Albanesi E, Gugliotta OI, Mercurio I, Mercurio R. 2005. Effects of gapsize and within position on seedling establishment in silver fir stands.iForest @2 (4): 358-366.
Alongi DM. 2007. Mangrove forests: Resilience, protection fromtsunamis, and responses to global climate change. Est, Coast Shelf Sci76: 1-13.
Amanzadeh B, Amani M, Hassani M. 2009. Typology of seedlingcomposition and density in regeneration gaps of Ramsar-Safaroudforest. Iranian J For Poplar Res 16 (3): 378-389.
Asli A, Nedialkov ST. 1973. The structure of virgin stands of Fagusorientalis in the high forests of northern Iran. SchweizerischeZeitschrift fur Forstwesen 124 (6): 403-414.
Battles JJ, Fahey TJ. 2000. Gap dynamics following forest decline: A casestudy of Red spruce forests. Ecol Appl 10: 760-774.
Bayramzadeh V, Attarod P, Ahmadi MT, Ghadiri M, Akbari R, SafarkarT. 2012.Variation of leaf morphological traits in natural populationsof Fagus orientalis Lipsky in the Caspian forests of northern Iran.Ann For Res 55 (1): 33-42.
Berg EC, Van Lear DH. 2004. Yellow-poplar and oak seedling densityresponses to wind-generated gaps. In: Connor KF (eds). Proceedingsof the 12th Biennial Southern Silvicultural Research Conference.Department of Agriculture, Forest Service, Southern ResearchStation. Asheville, NC. February 24-28, 2003.
Boudreau S, Lawes MJ. 2005. Small understory gaps created bysubsistence harvesters do not adversely affect the maintenance of treediversity in a sub-tropical forest. For Ecol Manag 126: 279-286.
Coates KD. 2002. Tree recruitment in gaps of various sizes, clear cuts anddisturbed mixed forest of interior British Columbia, Canada. For EcolManag 155: 387-398.
De Granper L, Bergeron Y. 1997. Diversity and stability of understorycommunities following disturbance in the southern boreal forest. JEcol 85: 777-784.
Deal RL. 1997. Understory plant diversity in riparian Alder- Coniferstands after logging in southeast Alaska. USDA Forest Service,Pacific Northwest Research Station, Research Note PNW-RN-523.
Denslow JS. 1987. Tropical rainforest gaps and tree species diversity. AnnRev Ecol Syst 18: 431-451
Ersali A. 1999. Natural breeding of high oak species.[Dissertation].TarbiatModares University, Noor, Mazandaran. [Persian]
Esmailzadeh O, Hosseini SM, Tabari M, Baskin CC, Asadi H. 2011.Persistent soil seed banks and floristic diversity in Fagus orientalis
forest communities in the Hyrcanian vegetation region of Iran. Flora206: 365-372.
Espahbodi F, Tabari M. 2004. Determining the most suitable shade ratefor producing beech (Fagus orientalis Lipsky.) seedlings in amountain nursery. Iranian J Nat Res 57 (3): 439-446.
Fallahchai MM, Hashemi SA, Bonyad A. 2011. Survey of tree speciesregeneration in canopy gaps forests in North of Iran. Adv EnvironBiol 5 (10): 3124-3128.
Fujita T, Itaya A, Miura M, Manabe T, Yamamoto SI. 2003. Long-termcanopy dynamics analyzed by aerial photographs in a temperate old-growth evergreen broad-leaved forest. J Ecol 91 (4): 686-693.
Goleij A. 2006. A qualitative and quantitative investigation of naturalregeneration in the gaps derived from the first selective cut in MeskeliBuxus hyrcana stand. [Dissertation]. Sari University of AgriculturalSciences and Natural Resources, Sari. Mazandaran [Persian]
Gray AN, Spies TA. 1996. Gap size, within-gap position and canopystructure effects on conifer seedling establishment. J Ecol 84: 635-645.
Haghverdi K, Kiadaliri H, Sagheb -Talebi Kh, Kooch Y. 2012. Variabilityof plant diversity and soil features following gap creation in CaspianBeech forests of Iran. Ann Biol Res 3 (9): 4622-4635.
Hall JS,Harris DJ, Medjibe V, Ashton PM. 2003. The effects of selectivelogging on forest structure and tree species composition in a CentralAfrican forest: implications for management of conservation areas.Fort Ecol Manag 183: 249-264.
Harmer R. 1995. Natural regeneration of broadleaved trees in Britain:Germination and establishment. Forestry 68: 1-9.
Helliwell DR. 1982. Factors influencing the growth of seedling ofSycamore and Norway maple. Quart J For 59: 327-337.
Heywood VH, Watson R. 1995. Global biodiversity assessment.Published for the United Nations environment program. CambridgeUniversity Press, Cambridge.
Hutchinson TF, Kennedy SE, Scott CT. 2007. Composition andabundance of tree regeneration. In: Sutherland EK, Hutchinson TF(eds). Characteristics of mixed-oak forest ecosystems in SouthernOhio Prior to the Reintroduction of Fire. USDA Forest Service,Delaware.
Kenderes K, Mihok B, Standovar T. 2008. Thirty years of gap dynamicsin a Central European beech forest reserve. Forestry 81: 111-123.
Komarov VL. 1934-1963. Flora USSR.Vo1.5, Fagaceae, 252-279Izdatel'stvo Akademii Nauk SSSR Moskva, Leningrad.
Krebs CJ, 1999. Ecological methodology. Benjamin Cummings, MenloPark, CA.
Leniere A, Houle G. 2006. Response of herbaceous plant diversity toreduced structural diversity in maple-dominated (Acer saccharumMarsh.) forests managed for sap extraction. For Ecol Manag 231: 94-104
Liu Y, Liu C, Wei Y, Liu Y, Guo K. 2011. Species composition andcommunity structure at different vegetation successional stages inPuding, Guizhou Province, China. Chinese J Pl Ecol 35 (10): 1009-1018.
Malcolm JR, Ray JC. 2000. Influence of timber extraction routes oncentral African small-mammal communities, forest structure, and treediversity. Conserv Biol 14: 1623-1638
Mc Carthy J. 2001. Gap dynamics of forest trees: A review with particularattention to boreal forests. Environ Rev 9 (1): 1-59.
Mc Evoy TJ. 2004. Positive impact forestry: A sustainable approach tomanaging woodlands. Island Press, Washington DC.
Mobayen S, Tregubov V. 1970. Carte de la vegetation naturelle de l'Iran[Map of the natural vegetation of Iran]. Faculte des Forets etPaturages, Universite de Tehran. Tehran.
Moore MR, Vankat JL. 1986. Responses of the herb layer to the gapdynamics of a mature beech-maple forest. Amer Midland Natur 115(2): 730-741.
Mousavi SR, Sagheb Talebi KH, Tabari M, Pourmajidian MR. 2003.Determination of gap size for improvement of beech (Fagusorientalis) natural regeneration. Iranian J Nat Res 56 (1-2): 39-46.
Mousavi SR. 2001. A silvicultural study on regenerated gaps in theShurab district of Golband region. [Dissertation].Tarbiat ModaresUniversity, Noor. Mazandaran [Persian].
Mueller-Dombois D, Ellenberg H. 1974. Aims and methods of vegetationecology. John Wiley & Sons. New York.
Nagaike T, Kamitani T, Nakashizuka T. 1999. The effect of shelterwoodlogging on the diversity of plant species in a beech (Fagus crenata)forest in japan. For Ecol and Manag 118: 161-171.
BIODIVERSITAS 14 (2): 89-94, October 201394
Nelson CR, Halpern CB. 2005. Edge-related responses of understory plantto aggregated retention harvest in the Pacific Northwest. Ecol Appl15: 196-209.
Odum EP, Barrett GW. 2004. Fundamentals of ecology. W.B. SaundersCo, Philadelphia.
OFRW [Organization of Forests, Rangelands and WatershedManagement]. 2007. Forest Management Plan of Safaroud.DistrictNo. 5. Department of Natural Resources of Western Mazandaran.Sari.
Okland T, Rydgren K, Okland RH, Storaunet KO, Rolstad J. 2003.Variation in environmental conditions, under-story species number,abundance and composition among natural and managed Picea abiesforest stands. For Ecol Manag 177 (1-3): 17-37.
Parhizkar P, Sagheb-Talebi K, Mataji A, Namiranian M. 2011a. Influenceof gap size and development stages on the silvicultural characteristicsof oriental beech (Fagus orientalis Lipsky.) regeneration. Caspian JEnviron Sci 9 (1): 55-65.
Parhizkar P, Sagheb-Talebi K, Mataji A, Nyland R, Namiranian M.2011b. Silvicultural characteristics of oriental beech (Fagus orientalisLipsky.) regeneration under different RLI and positions within gaps.Forestry 84 (2): 177-185.
Peltier A, Touzet MC, Armengaul C, Ponge JF. 1997. Establishment ofFagus sylvatica and Fraxinus excelsior in an old-growth beech forest.J Veg Sci 8 (1): 13-20.
Platt WJ, Strong DR. 1989. Special feature: Gaps in forest ecology.Ecology 70: 535-576.
Poulson TL, Platt WJ. 1989. Gap light regimes influence canopy treediversity. Ecology 70: 553-555.
Pourbabaei H, Ranjavar AR. 2008. Effect of shelterwood silviculturalmethod on plant species diversity in beech (Fagus orientalis Lipsky.)Forests in Shafaroud, Guilan Province. J Iranian For Poplar Res 16(1): 61-73.
Rechinger KH. 1963-2010. Flora Iranica, 1-178. Akademsiche Druck- u.Verlagsanstalt und Naturhistorisches Museum Wien. Graz & Wien.
Renato A, De Lima F. 2005. Gap size measurement: The proposal of anew field method. For Ecol Manag 214: 413-419.
Rozenbergar D, Mikax CS, ANI ĆI, Diaci J. 2007. Gap regenerationpatterns in relationship to light heterogeneity in two old-growth beech- fir forest reserves in south east Europe. Forestry 80 (4): 432-443.
Runkle JR. 1991. Gap dynamics of old-growth eastern forests:management implications. Nat Areas J 11 (1): 19-25.
Sagheb-Talebi K. 1995. Study of some characteristics of young beech(Fagus sylvatica L.) in the regeneration gaps of irregular shelter woodsystem (Femelschlag). In: Madsen SF (ed). Genetics and silvicultureof beech: Proceedings from the 5th Beech Symposium of the IUFROProject Group, Denmark. Forskingsserien, 24 September 1994.
Salehi SP, Giuseppe VG, Mohsen C. 2011. Altitudinal genetic variationsamong the Fagus orientalis Lipsky. populations in Iran. Iranian JBiotechnol 9 (1): 11-20.
Sampson RN, DeCoster LA. 1998. Forest Health in the United States.Idaho Forest Products Commission. http://www.idahoforests.org/health2.htm
Savill PS. 1991. The Silviculture of Trees Used in British Forestry. CABI,Wallingford. UK.
Scheller R, Mladenoff D. 2002. Understory species patterns and diversityin old-growth and managed Northern Hardwood forests. Ecol Appl12: 1329-1343.
Schumann ME, White AS, Witham JW. 2004. The effects of harvest-created gaps on plant species diversity, composition, and abundancein a main oak-pine forest. For Ecol Manag 176 (1-3): 543-561.
Sefidi K, Marvie Mohadjer MR, Mosandl R, Copenheaver CA. 2011.Canopy gaps and regeneration in old-growth oriental beech (Fagusorientalis Lipsky.) stands, northern Iran. For Ecol Manag 262 (6):1094-1099.
Simila M, Kouki J, Monkkonen M, Sippola A, Huhta E. 2006. Co-variation and indicators of species diversity: Can richness of forest-dwelling species be predicted in northern boreal forests?. Ecol Indicat6: 686-700.
Tabari M, Espahbodi K, Poormadjidian MR. 2007. Composition andstructure of a Fagus orientalis-dominated forest managed with shelterwood aim (a case study in the Caspian forests, northern Iran) CaspianJ Environ Sci 5 (1): 35-40.
Tabari M, Fayaz P, Emadian SFA, Espahbodi K, Pourmajdian MR. 2003.Effect of gap size on survival and activity of Beech (Fagus orientalisLipsky.). J Pajouhesh va Sazandegi 16 (1): 32-36.
Tabari M. 2008. Germination and growth of Fagus orientalis seedlingunder different stand canopies. J Appl Sci 8 (9): 1776-1780.
Taheri AK. 2000. Study on regeneration structure of natural beech forestof Asalem region.[Dissertation]. Tarbiat Modares University, Noor.Mazandaran [Persian].
Takeh G, Jalali SG, Hosseini SM, Tabari M. 2004. Quantity and qualitycomparison of natural regeneration establishment of Fagus, Acer andCarpinus in forest stands under management of tree and groupselection system (Dr. Bahramnia forest management plan). J Agri SciNat Res 10 (4): 125-134.
Thompson I. 2010.The role of forest biodiversity in the sustainable use ofecosystem goods and services in agriculture, agro-forestry, andforestry. In: KoizumiT, OkabeK, Thompson I, SugimuraK, Takeshi T,Fujita K (eds). Forestry and Forest Products Research Institute;Proceedings of International Symposium for the Convention onBiological Diversity, Tokyo, Japan, 26-28 April 2010.
Torras O, Saura S. 2008. Effects of silvicultural treatments on forestbiodiversity indicators in the Mediterranean. For Ecol Manag 255:3322-3330.
Tuomela K, Kuusipalo J, Vesa L, Nuryanto K, Sagala APS, Adjers G.1996. Growth of dipterocarp saplings in artificial gaps. For EcolManag 81: 95-100.
Whitmore TC. 1989. Canopy gaps and the two major groups of foresttrees. Ecol 70 (3): 536-538.
Yamamoto SI. 1989. Gap dynamics in climax Fagus crenata forests. BotManag 102: 93-114.
Zeibig A, Diaci J, Wagner S. 2005. Gap disturbance patterns of a Fagussylvatica virgin forest remnant in the mountain vegetation belt ofSlovenia. For Snow Landscape Res 79: 69-80.
BIODIVERSITAS ISSN: 1412-033XVolume 14, Number 2, October 2013 E-ISSN: 2085-4722Pages: 95-100 DOI: 10.13057/biodiv/d140207
Population dynamics of cuscus in tourist island of Ahe, District ofNabire, Papua
ANTON SILAS SINERY1,♥, CHANDRADEWANA BOER2, WARTIKA ROSA FARIDA3
1Faculty of Forestry, State University of Papua, Jl. Gunung Salju, Amban-Manokwari 98314, West Papua, Indonesia. Tel & Fax.: +62-986-211364,♥email: [email protected]
2Faculty of Forestry, Mulawarman University, Samarinda 75119, East Kalimantan, Indonesia3Zoology Division, Reserach Center for Biology, Indonesian Institute of Sciences, Cibinong, Bogor 16911, West Java, Indonesia
Manuscript received: 25 April 2013. Revision accepted: 14 July 2013.
ABSTRACT
Sinery AS, Boer C, Farida WR.2013. Population dynamics of cuscus in tourist island of Ahe, District of Nabire, Papua. Biodiversitas14: 95-100. Cuscus is a pouched herbivorous mammal of the family Phalangeridae which is arboreal and nocturnal.. The animals areprotected by law because, in addition to having a low reproduction and limited distribution area, they face a very high level of hunting.Hunting in the wild by people is done not only in production forest areas but also in forest conservation areas such as recreational forestof Table Mountain, Arfak Mountains Nature Reserve, and other places. Directly or indirectly, the hunting affects the quality of theecosystem in these areas, especially the cuscus population. Better management efforts are required in these areas to ensure the survivalof many organisms in it, especially the cuscus. This study aimed to determine the cuscus population in Ahe Island, and the methodapplied was descriptive method using direct observation. The study was conducted in one month. The results demonstrate that cuscus in AheIsland consisted of common spotted cuscus (Spilocuscus maculatus) and eastern cuscus (Phalanger orientalis). The number of individualsof S. maculatus was 24, consisting of 14 females and 10 males, whereas P. orientalis consisted of 2 individuals and both were males. Thenumber of adult cuscus individuals was 16, while adolescents and children, were respectively 8 and 2. At least 10 plant species wereidentified as a source of feed for cuscus in Ahe Island recreation area. Plant parts consumed by cuscus were fruit and young leaves, butbased on level of need, most of the cuscus consumed fresh fruit because of its sweet taste and high water content that helps the digestive process.
Key words: Ahe Island, cuscus populations, feed resources, Papua, plant species
INTRODUCTION
Cuscus, a pouched mammal (marsupials), is a herbivorewhich is arboreal and nocturnal. Menzies (1991), Flannery(1994), and Petocz (1994) mention that the distribution areasof cuscus include the islands of Indonesia (Papua,Sulawesi, Maluku and Timor Islands), Papua New Guinea(PNG), New Britain, Solomon Islands, Cape York, andQueensland Australia. In New Guinea (PNG and Papua)there are 11 species of the genus Spilocuscus (spotted cuscus)and genus Phalanger (unspotted cuscus). In Papua, there are7 species of cuscus, namely common spotted cuscus(Spilocuscus maculates), spotted black cuscus (S. rufoniger),Waigeo cuscus (S. papuensis), cuscus Timor (Phalangerorientalis), ground cuscus (P. gymnotis), hair silk cuscus (P.vestitus) and hill forest cuscus (P. permixtio) (Menzies 1991;Petocz 1994; Aplin and Helgen 2008; Saragih et al. 2010).
All seven species of cuscus in Papua are protected bythe decree of the Minister of Agriculture No.247/KPTS/UM/4/1979 and Government Regulation No. 7Year 1999 on the Preservation of Plants and Animals.Globally, cuscuses are listed in the Appendix II of theConvention on International Trade in Endangered Speciesof Wild Fauna and Flora (CITES). Although there havebeen government rules issued to protect the cuscus, itsimplementation is still considered less effective and needs
to be improved (Sinery 2002; Sinery 2010).Cuscus utilization for consumption and for other
purposes in Papua nowadays is increasing. In addition, thecuscus fur is also used to make various ornaments likebags, hats, and for decoration in the customary fashion.Such utilization can affect the cuscus population(Ariantiningsih 2000). The consumption of cuscus meat bylocal people shows an increasing trend. It can be seen fromthe number of hunting results which reaches 2-5 headsevery hunting activity done at least once every month.Although it is generally done in areas with a high densityof cuscus populations, hunting is still a serious threat to theexistence of these animals. The condition is influenced byvarious factors, including lack of public awareness aboutthe legal status of cuscus as protected animals according toboth the national laws and local customs. This hasimplications for the pattern of utilization, which in turnaffects the existence of wildlife such as cuscus. People inthe islands of Numfor, Biak, Arui, Moor, Auki, Yoop,Napan, and Yapen tend to use cuscus for consumption, andso do the residents of mainland Papua in areas such asArfak Mountains, Meja Mountain, Jayapura, Sarmi,Sorong, and a few other areas.
Ahe Island with an area of approximately 2.5 ha is oneof the smallest islands in the island-chain of Mamboraround Cenderawasih National Park. As one of the isolated
BIODIVERSITAS 14 (2): 95-100, October 201396
areas which are not inhabited, Ahe Island has good lowlandforest formation dominated by Ficus sp., Intsia sp.,Syzygium sp., Linociera macrophylla, Morinda citrifolia,and Glochidion sp., and the coastal vegetation dominatedby Terminalia sp. and Barringtonia sp. Forests in theregion spreads from the middle of the island to the shoresurrounded by white sand beaches. The species of wildlifefound on the island are green lizard (Mabouyamultifasciata), Lizard (Varanus sp.), mambruk bird (Gourasp.), maleo bird (Megapodius freycinet), and cuscus(Spilocuscus and Phalanger). Other potential touristattraction is the remains of Allied Forces aircraft relics inWorld War II largely been transferred to the mainland. Theexpanse of water adorned with coral reefs and a wealth ofother biotas add to the beauty of this island.
At this time, Ahe Island is managed by society withcoordination of the Agent of Tourism of Nabire Districtand the Government of Papua Province. Legally, themanagement of the tourist area of Ahe Island is done byCV Ahe (a private business) based on the decree of theGovernor of Papua Province in 2007, and the operationbegan in 2009. Since its establishment, the managementhas successfully developed a variety of this island’spotential with the main goal of improving the potential oftourism, education, and research through the provision ofvarious facilities, such as accommodation, lighting, andfacilities of recreation. To add value to the potential of thisisland, the management has introduced four species ofwildlife: maleo bird, mambruk bird, lizards, and cuscus.
In 2007, a total of 7 species cuscus were introduced inAhe Island, consisting of the species that are distinguishedbased on plumage characters, namely eastern cuscus(Phalanger orientalis) and common spotted cuscus(Spilocuscus maculatus). The current population isestimated to have increased, which can be seen from thenumber of juveniles. This condition is a positive thing interms of the protection and conservation of cuscus.However it is necessary to consider the possibility that anincrease in population will affect the carrying capacity ofthe island's cuscus habitat. Taking into account the verysmall size of the forest, it is necessary to carry out well-planned management to control cuscus populations anddevelop their habitats in this island. For this purpose it isnecessary to study the cuscus population and its habitatconditions in Ahe Island.
This study aimed to determine the condition of cuscuspopulation and habitat’s carrying capacity based on theavailability of cuscus feed. The results are expected to besources of information and consideration for all parties inthe wildlife management efforts, both in situ and ex situ,particularly for C.V. Ahe (a private business) in managingcuscus in Ahe Island in the future.
MATERIALS AND METHODS
The research was conducted on the island of Ahe,Mambor, Nabire District, Papua Province, Indonesia(Figure 1) and lasted for 1 month, i.e. in November 2012.
The method used in this research was descriptive methodbased on observations.
Taking into account the location of the study area of 2.5ha and the solitary nature of the cuscus, data collection wasdone using census method by monitoring cuscuspopulations. To facilitate the process of data collection, thestudy site was divided by several transects or observationlines. Results of preliminary observations indicated that thedistribution of cuscus in the research area was uniform sothe Ahe Island’s beach was used as a baseline. Thetransects were made parallel to the shoreline or cutting thecontour lines.. Furthermore, the baseline was divided into 5transects perpendicular to north-south baseline. Alltransects were set proportionally, and the distance betweentransects was 50m. The length of the transects were 100m,335m, 320m, 150m, and 120m, so that the total length ofall transects was 1.025m while transect width was adjustedwith minimal visibility (40m or 20m either side of thetransect). According to Sinery (2010), the effective widthof observation transect for dense forest types such as foresttypes in Arfak Mountains is 50m (25m either side of thetransect) and we should use a narrower measure which ismore effective in the observation of the population (Sinery2009).
Monitoring of cuscus was performed simultaneously by5 groups of 2 people (1 identifying and recording and 1measuring the distance from objects to transect). Cuscuspopulation monitoring was not accompanied by the capture(sampling), but if possible, limited capturing was done.Identification was done for each species using Flannery(1994, 1995). Data collected consisted of (i) primary data,i.e. data from field observations, and (ii) secondary data,i.e. data obtained from the relevant agencies. Primary dataconsisted of: species, cuscus descriptions, cuscuspopulations, type of feed and the general condition ofcuscus habitat. Secondary data included data on climateand the general state of research locations obtained fromthe relevant authorities.
The data of cuscus morphological were analyzed usingthe tabulation and were used to identify the species ofcuscus. The estimation of cuscus population density as theresult of observation was carried out using the equationfrom Lewis (1994) as follows.
n (2n - 1) AN = ------------------
2L Σ r
N = population density,n = number of individuals encountered,A = area of region (plot observations),L = length of line/transect,Σr = distance from the point where cuscus found to the
line of transect
Furthermore, the result analysis of population densitywas tabulated according to the structure and speciescomposition. Structure and species composition includedstratification by type of cuscus species, sex, and age.
DISTRICT OF NABIRE
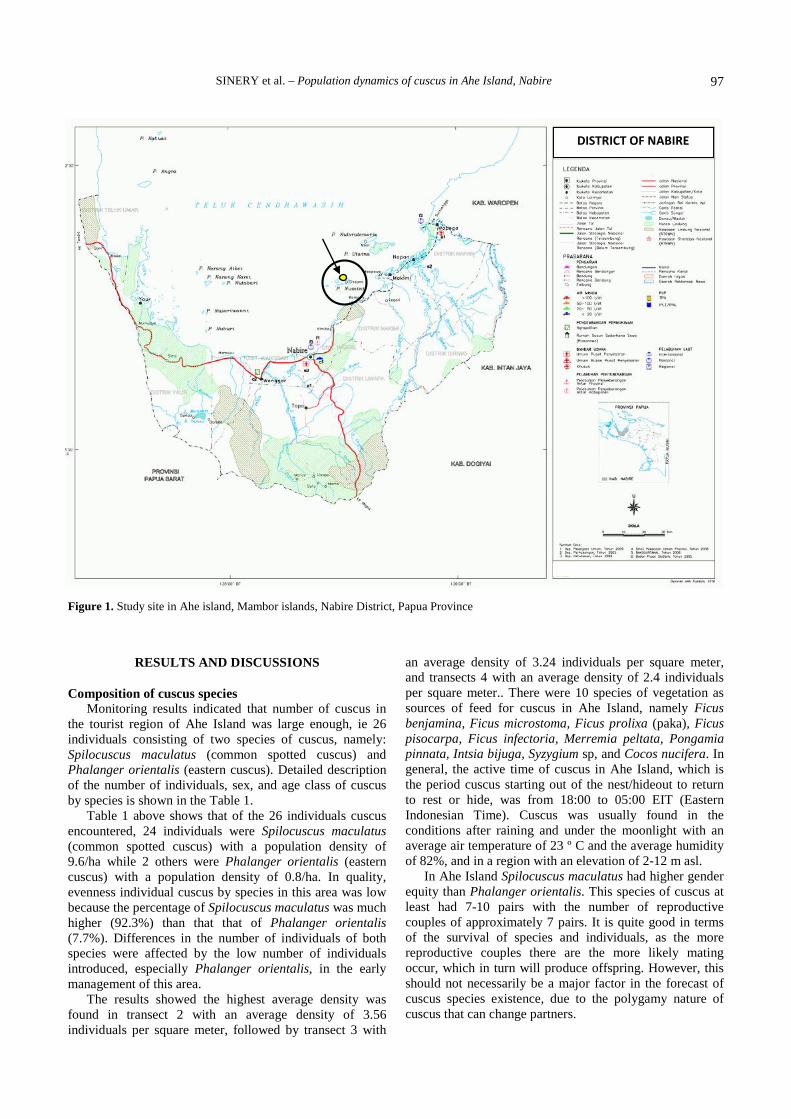
SINERY et al. – Population dynamics of cuscus in Ahe Island, Nabire 97
Figure 1. Study site in Ahe island, Mambor islands, Nabire District, Papua Province
RESULTS AND DISCUSSIONS
Composition of cuscus speciesMonitoring results indicated that number of cuscus in
the tourist region of Ahe Island was large enough, ie 26individuals consisting of two species of cuscus, namely:Spilocuscus maculatus (common spotted cuscus) andPhalanger orientalis (eastern cuscus). Detailed descriptionof the number of individuals, sex, and age class of cuscusby species is shown in the Table 1.
Table 1 above shows that of the 26 individuals cuscusencountered, 24 individuals were Spilocuscus maculatus(common spotted cuscus) with a population density of9.6/ha while 2 others were Phalanger orientalis (easterncuscus) with a population density of 0.8/ha. In quality,evenness individual cuscus by species in this area was lowbecause the percentage of Spilocuscus maculatus was muchhigher (92.3%) than that that of Phalanger orientalis(7.7%). Differences in the number of individuals of bothspecies were affected by the low number of individualsintroduced, especially Phalanger orientalis, in the earlymanagement of this area.
The results showed the highest average density wasfound in transect 2 with an average density of 3.56individuals per square meter, followed by transect 3 with
an average density of 3.24 individuals per square meter,and transects 4 with an average density of 2.4 individualsper square meter.. There were 10 species of vegetation assources of feed for cuscus in Ahe Island, namely Ficusbenjamina, Ficus microstoma, Ficus prolixa (paka), Ficuspisocarpa, Ficus infectoria, Merremia peltata, Pongamiapinnata, Intsia bijuga, Syzygium sp, and Cocos nucifera. Ingeneral, the active time of cuscus in Ahe Island, which isthe period cuscus starting out of the nest/hideout to returnto rest or hide, was from 18:00 to 05:00 EIT (EasternIndonesian Time). Cuscus was usually found in theconditions after raining and under the moonlight with anaverage air temperature of 23 º C and the average humidityof 82%, and in a region with an elevation of 2-12 m asl.
In Ahe Island Spilocuscus maculatus had higher genderequity than Phalanger orientalis. This species of cuscus atleast had 7-10 pairs with the number of reproductivecouples of approximately 7 pairs. It is quite good in termsof the survival of species and individuals, as the morereproductive couples there are the more likely matingoccur, which in turn will produce offspring. However, thisshould not necessarily be a major factor in the forecast ofcuscus species existence, due to the polygamy nature ofcuscus that can change partners.
DISTRICT OF NABIRE
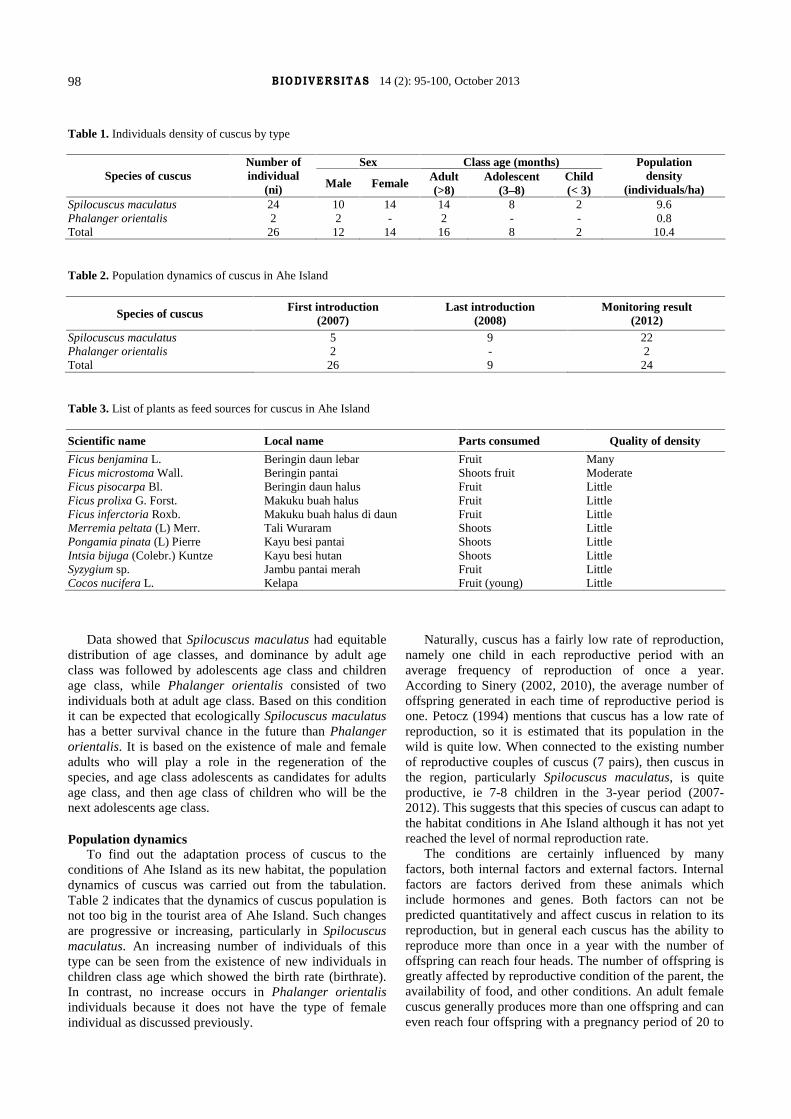
BIODIVERSITAS 14 (2): 95-100, October 201398
Table 1. Individuals density of cuscus by type
Sex Class age (months)Species of cuscus
Number ofindividual
(ni) Male Female Adult(>8)
Adolescent(3–8)
Child(< 3)
Populationdensity
(individuals/ha)Spilocuscus maculatus 24 10 14 14 8 2 9.6Phalanger orientalis 2 2 - 2 - - 0.8Total 26 12 14 16 8 2 10.4
Table 2. Population dynamics of cuscus in Ahe Island
Species of cuscus First introduction(2007)
Last introduction(2008)
Monitoring result(2012)
Spilocuscus maculatus 5 9 22Phalanger orientalis 2 - 2Total 26 9 24
Table 3. List of plants as feed sources for cuscus in Ahe Island
Scientific name Local name Parts consumed Quality of density
Ficus benjamina L.Ficus microstoma Wall.Ficus pisocarpa Bl.Ficus prolixa G. Forst.Ficus inferctoria Roxb.Merremia peltata (L) Merr.Pongamia pinata (L) PierreIntsia bijuga (Colebr.) KuntzeSyzygium sp.Cocos nucifera L.
Beringin daun lebarBeringin pantaiBeringin daun halusMakuku buah halusMakuku buah halus di daunTali WuraramKayu besi pantaiKayu besi hutanJambu pantai merahKelapa
FruitShoots fruitFruitFruitFruitShootsShootsShootsFruitFruit (young)
ManyModerateLittleLittleLittleLittleLittleLittleLittleLittle
Data showed that Spilocuscus maculatus had equitabledistribution of age classes, and dominance by adult ageclass was followed by adolescents age class and childrenage class, while Phalanger orientalis consisted of twoindividuals both at adult age class. Based on this conditionit can be expected that ecologically Spilocuscus maculatushas a better survival chance in the future than Phalangerorientalis. It is based on the existence of male and femaleadults who will play a role in the regeneration of thespecies, and age class adolescents as candidates for adultsage class, and then age class of children who will be thenext adolescents age class.
Population dynamicsTo find out the adaptation process of cuscus to the
conditions of Ahe Island as its new habitat, the populationdynamics of cuscus was carried out from the tabulation.Table 2 indicates that the dynamics of cuscus population isnot too big in the tourist area of Ahe Island. Such changesare progressive or increasing, particularly in Spilocuscusmaculatus. An increasing number of individuals of thistype can be seen from the existence of new individuals inchildren class age which showed the birth rate (birthrate).In contrast, no increase occurs in Phalanger orientalisindividuals because it does not have the type of femaleindividual as discussed previously.
Naturally, cuscus has a fairly low rate of reproduction,namely one child in each reproductive period with anaverage frequency of reproduction of once a year.According to Sinery (2002, 2010), the average number ofoffspring generated in each time of reproductive period isone. Petocz (1994) mentions that cuscus has a low rate ofreproduction, so it is estimated that its population in thewild is quite low. When connected to the existing numberof reproductive couples of cuscus (7 pairs), then cuscus inthe region, particularly Spilocuscus maculatus, is quiteproductive, ie 7-8 children in the 3-year period (2007-2012). This suggests that this species of cuscus can adapt tothe habitat conditions in Ahe Island although it has not yetreached the level of normal reproduction rate.
The conditions are certainly influenced by manyfactors, both internal factors and external factors. Internalfactors are factors derived from these animals whichinclude hormones and genes. Both factors can not bepredicted quantitatively and affect cuscus in relation to itsreproduction, but in general each cuscus has the ability toreproduce more than once in a year with the number ofoffspring can reach four heads. The number of offspring isgreatly affected by reproductive condition of the parent, theavailability of food, and other conditions. An adult femalecuscus generally produces more than one offspring and caneven reach four offspring with a pregnancy period of 20 to
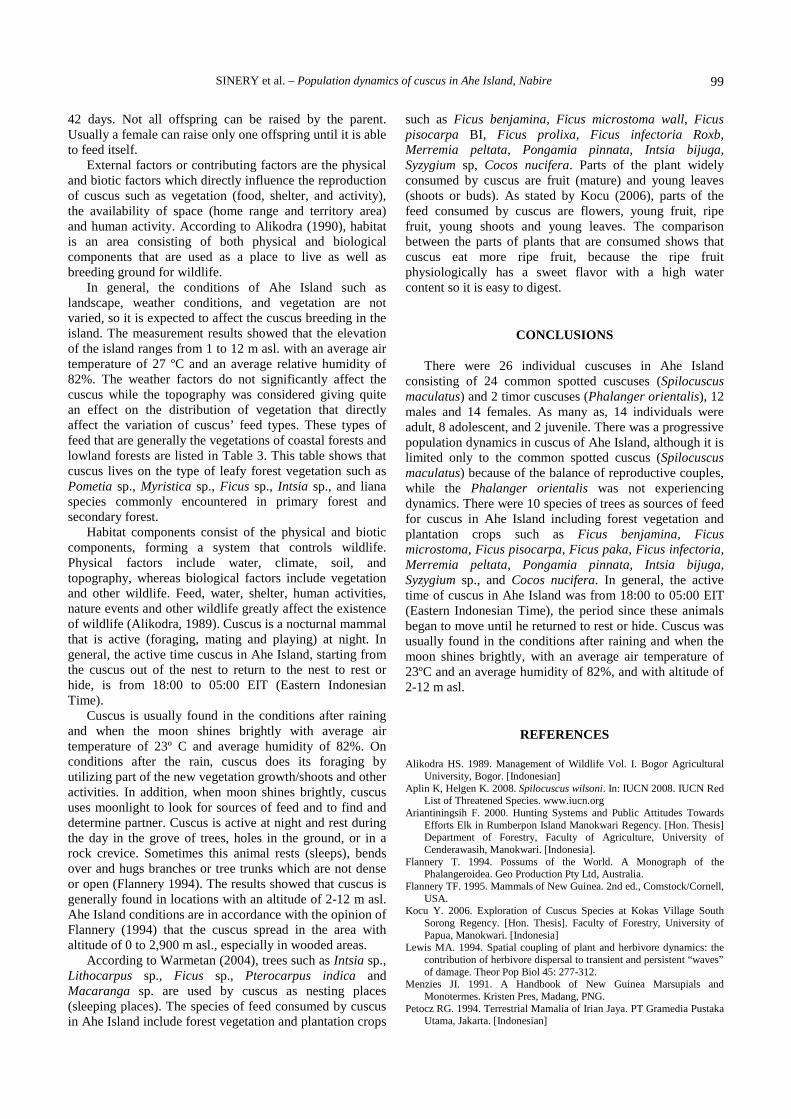
SINERY et al. – Population dynamics of cuscus in Ahe Island, Nabire 99
42 days. Not all offspring can be raised by the parent.Usually a female can raise only one offspring until it is ableto feed itself.
External factors or contributing factors are the physicaland biotic factors which directly influence the reproductionof cuscus such as vegetation (food, shelter, and activity),the availability of space (home range and territory area)and human activity. According to Alikodra (1990), habitatis an area consisting of both physical and biologicalcomponents that are used as a place to live as well asbreeding ground for wildlife.
In general, the conditions of Ahe Island such aslandscape, weather conditions, and vegetation are notvaried, so it is expected to affect the cuscus breeding in theisland. The measurement results showed that the elevationof the island ranges from 1 to 12 m asl. with an average airtemperature of 27 ºC and an average relative humidity of82%. The weather factors do not significantly affect thecuscus while the topography was considered giving quitean effect on the distribution of vegetation that directlyaffect the variation of cuscus’ feed types. These types offeed that are generally the vegetations of coastal forests andlowland forests are listed in Table 3. This table shows thatcuscus lives on the type of leafy forest vegetation such asPometia sp., Myristica sp., Ficus sp., Intsia sp., and lianaspecies commonly encountered in primary forest andsecondary forest.
Habitat components consist of the physical and bioticcomponents, forming a system that controls wildlife.Physical factors include water, climate, soil, andtopography, whereas biological factors include vegetationand other wildlife. Feed, water, shelter, human activities,nature events and other wildlife greatly affect the existenceof wildlife (Alikodra, 1989). Cuscus is a nocturnal mammalthat is active (foraging, mating and playing) at night. Ingeneral, the active time cuscus in Ahe Island, starting fromthe cuscus out of the nest to return to the nest to rest orhide, is from 18:00 to 05:00 EIT (Eastern IndonesianTime).
Cuscus is usually found in the conditions after rainingand when the moon shines brightly with average airtemperature of 23º C and average humidity of 82%. Onconditions after the rain, cuscus does its foraging byutilizing part of the new vegetation growth/shoots and otheractivities. In addition, when moon shines brightly, cuscususes moonlight to look for sources of feed and to find anddetermine partner. Cuscus is active at night and rest duringthe day in the grove of trees, holes in the ground, or in arock crevice. Sometimes this animal rests (sleeps), bendsover and hugs branches or tree trunks which are not denseor open (Flannery 1994). The results showed that cuscus isgenerally found in locations with an altitude of 2-12 m asl.Ahe Island conditions are in accordance with the opinion ofFlannery (1994) that the cuscus spread in the area withaltitude of 0 to 2,900 m asl., especially in wooded areas.
According to Warmetan (2004), trees such as Intsia sp.,Lithocarpus sp., Ficus sp., Pterocarpus indica andMacaranga sp. are used by cuscus as nesting places(sleeping places). The species of feed consumed by cuscusin Ahe Island include forest vegetation and plantation crops
such as Ficus benjamina, Ficus microstoma wall, Ficuspisocarpa BI, Ficus prolixa, Ficus infectoria Roxb,Merremia peltata, Pongamia pinnata, Intsia bijuga,Syzygium sp, Cocos nucifera. Parts of the plant widelyconsumed by cuscus are fruit (mature) and young leaves(shoots or buds). As stated by Kocu (2006), parts of thefeed consumed by cuscus are flowers, young fruit, ripefruit, young shoots and young leaves. The comparisonbetween the parts of plants that are consumed shows thatcuscus eat more ripe fruit, because the ripe fruitphysiologically has a sweet flavor with a high watercontent so it is easy to digest.
CONCLUSIONS
There were 26 individual cuscuses in Ahe Islandconsisting of 24 common spotted cuscuses (Spilocuscusmaculatus) and 2 timor cuscuses (Phalanger orientalis), 12males and 14 females. As many as, 14 individuals wereadult, 8 adolescent, and 2 juvenile. There was a progressivepopulation dynamics in cuscus of Ahe Island, although it islimited only to the common spotted cuscus (Spilocuscusmaculatus) because of the balance of reproductive couples,while the Phalanger orientalis was not experiencingdynamics. There were 10 species of trees as sources of feedfor cuscus in Ahe Island including forest vegetation andplantation crops such as Ficus benjamina, Ficusmicrostoma, Ficus pisocarpa, Ficus paka, Ficus infectoria,Merremia peltata, Pongamia pinnata, Intsia bijuga,Syzygium sp., and Cocos nucifera. In general, the activetime of cuscus in Ahe Island was from 18:00 to 05:00 EIT(Eastern Indonesian Time), the period since these animalsbegan to move until he returned to rest or hide. Cuscus wasusually found in the conditions after raining and when themoon shines brightly, with an average air temperature of23ºC and an average humidity of 82%, and with altitude of2-12 m asl.
REFERENCES
Alikodra HS. 1989. Management of Wildlife Vol. I. Bogor AgriculturalUniversity, Bogor. [Indonesian]
Aplin K, Helgen K. 2008. Spilocuscus wilsoni. In: IUCN 2008. IUCN RedList of Threatened Species. www.iucn.org
Ariantiningsih F. 2000. Hunting Systems and Public Attitudes TowardsEfforts Elk in Rumberpon Island Manokwari Regency. [Hon. Thesis]Department of Forestry, Faculty of Agriculture, University ofCenderawasih, Manokwari. [Indonesia].
Flannery T. 1994. Possums of the World. A Monograph of thePhalangeroidea. Geo Production Pty Ltd, Australia.
Flannery TF. 1995. Mammals of New Guinea. 2nd ed., Comstock/Cornell,USA.
Kocu Y. 2006. Exploration of Cuscus Species at Kokas Village SouthSorong Regency. [Hon. Thesis]. Faculty of Forestry, University ofPapua, Manokwari. [Indonesia]
Lewis MA. 1994. Spatial coupling of plant and herbivore dynamics: thecontribution of herbivore dispersal to transient and persistent “waves”of damage. Theor Pop Biol 45: 277-312.
Menzies JI. 1991. A Handbook of New Guinea Marsupials andMonotermes. Kristen Pres, Madang, PNG.
Petocz RG. 1994. Terrestrial Mamalia of Irian Jaya. PT Gramedia PustakaUtama, Jakarta. [Indonesian]

BIODIVERSITAS 14 (2): 95-100, October 2013100
Saragih EW, Sadsoeitoeboen MJ, Pattiselanno F. 2010. The diet of spottedcuscus (Spilocuscus maculatus) in natural and captivity habitat.Nusantara Biosci 2: 78-83. [Indonesian]
Sinery A. 2002. Exploration of Cuscus at Numfor Island, Biak NumforRegency. [Hon. Thesis]. Faculty of Forestry, University of Papua,Manokwari. [Indonesian].
Sinery A. 2009. Utilization of Cucsus as Animal Protein in Papua. CahayaPapua, Manokwari. [Indonesian]
Sinery A. 2010. Population of cucsus at Arfak Nature Reserve,Manokwari Regency, West Papua. Agrifor 9 (2): 79-88 [Indonesian]
Warmetan H. 2004. Exploration of Cuscus Species at Central YapenNature Reserve and its Surroundings, South Yapen Sub district,Yapen Waropen Regency. [Hon. Thesis]. Faculty of Forestry,University of Papua, Manokwari. [Indonesian]
BIODIVERSITAS ISSN: 1412-033XVolume 14, Number 2, October 2013 E-ISSN: 2085-4722Pages: 101-105 DOI: 10.13057/biodiv/d140208
Evolution of oviposition behavior in gypsy moth (Lymantria dispar) inHyrcanian forests, North of Iran
GOODARZ HAJIZADEH1,♥, MOHAMMAD REZA KAVOSI2, HAMID JALILVAND1
1Department of Forestry, Faculty of Natural Resources, Sari Agricultural Sciences & Natural Resources University, P.O.Box:#578, Sari, MazandaranProvince, IR-Iran. Tel./Fax. +98 151 3822715, ♥email: [email protected]
2Department of Forest Ecology, Faculty of Forest Sciences, Gorgan University of Agricultural Sciences & Natural Resources, Gorgan, GolestanProvince, IR-Iran.
Manuscript received: 26 June 2013. Revision accepted: 24 July 2013.
ABSTRACT
Hajizadeh G, Kavosi MR, Jalilvand H. 2013. Evolution of oviposition behavior in gypsy moth (Lymantria dispar) in Hyrcanian forests,North of Iran. Biodiversitas 14: 101-105. Oviposition behavior has been introduced at the center of many of the major debates on theecology and evolution of interactions between insects and plants. The objective of this research was to determine the number of eggmasses gypsy moth in relation to diameter at breast height (dbh), egg placement, orientation and host tree species. Sampling was carriedout in Daland national park, Gorgan province. By global position system (GPS) device using polygons with width of 20 m anddetermined azimuth, defoliated trees were recorded. Data and means were compared using Duncan's multiple range tests. Resultsshowed that the diameter at breast height was not significantly affected by the number of egg masses. The effect of oviposition place onnumber of egg masses gypsy moth were significant (P<0.01). The highest number of egg masses (2.148 egg masses/tree) was observedat trunk of defoliated trees; also, minimum (1.65 egg masses/tree) occurred in branches of defoliated trees. The effects of ovipositionorient were significant (P<0.05). The means comparison showed that the maximum rates of egg masses was occurred in the southgeographical position (2.04 egg masses/tree), the least of defoliation was related to the north direction (1.57 egg masses/tree). Theprimary host tree species was Persian iron wood (Parrotia persica). In finally, the selectivity of oviposition females may often providethe initial basis for divergence of insect populations on to different plant species, and it may drive the evolution of some plant defenses.
Key words: behavior, egg masses, gypsy moth, Lymantria dispar, oviposition
INTRODUCTION
The gypsy moth Lymantria dispar L. (Lepidoptera:Lymantriidae) is a major pest of forests and shade trees inthe north-eastern United States (Thorpe et al. 2007).Subsequent to its introduction from Europe inapproximately 1868, it has defoliated more than 34 millionha and more than five million ha have been treated withinsecticides to suppress populations (Gypsy Moth Digest2005). Defoliation stresses and kills trees; and indirecteffects of defoliation can reverberate throughout forestedecosystems. Social impacts are also substantial.Recreational use of parks grounds is sharply curtailedduring outbreaks; and the substantial nuisance created bylarge number of wandering larvae and frass raining fromtrees exacerbates its pest status in urban areas (Herms2003).
The female moth does not fly, even though she haslarge wings. Egg masses or clumps are usually found nearempty pupal cases of females. Eggs are placed in darksheltered areas, bark crevices, under loose bark, and theundersides of limbs, rocks, stumps, leaf litter, vehicles, andoutdoor household equipment (Leonard 1981).
The gypsy moth is a highly polyphagous folivore whichwill feed on over 300 species of woody plants (Leonard1981). Among its favored foods are oaks and aspens.
Newly hatched gypsy moth larvae are carried to hosts bywind dispersal in the spring, landing on plants and theneither remaining to feed or redispersing (Capinera andBarbosa 1976; Lance and Barbosa 1981).
Gypsy moth is one of the most important pests inHyrcanian forests, north of Iran. It was observed for thefirst time in 1937 in Guilan region, Hyrcanian forest zone.The largest outbreaks of gypsy moth occurred in Taleshforest in Guilan forests in 1975 (Kavosi 2008). It is spearedin Hyrcanian, Arasbaran and Zagros forests (oak forests)during this time. It was recognized that gypsy moth isdistributing in thorough Hyrcanian forests and the mostimportantly, its focus are, Daland park (Golestan province),Zare and Noor parks (Mazandaran province) andRezvanshahr and Masal forests (Guilan province)(Hajizadeh 2010). The activity of this pest in central partsand the south western forests of IR-Iran has been admittedoutside these regions. The defoliated rate in Hyrcanianzone is further more than the other zones and thousands ofhectares of forests in this zone are getting extinct (rate ofdefoliated in Guilan region has reached to the fields andhouses) (Hajizadeh and Kavosi 2011).
Hajizadeh et al. (2012) studied the effects ofoviposition height and host tree species on some L. dispar’sbiological parameters of gypsy moth in Hyrcanian forests.Samples were taken on five oviposition heights (0.5, 1, 1.5,

BIODIVERSITAS 14 (2): 101-105, October 2013102
2, 2.5 m) on trunk of four common host tree speciesincluding, Zelkova carpinifolia, P. persica, Quercuscastaneifolia and Carpinus carpinifolia. Results showedthat the oviposition heights significantly affected pestbiological parameters (egg clutch size, egg hatchingpercent, larval body length and mortality percent of firstinstars), but the effects of host tree species and interactingeffects were not significant. The highest survival percent,egg clutch size and body length was observed atoviposition height of 0.5 m on the P. persica species, andthe most egg mortality of first instars was recorded atoviposition height of 2.5 m on the Q. castaneifolia species.
Lechowicz and Jobin (1983) studied the effects ofestimating the susceptibility of tree species to attack by thegypsy moth. Numbers of gypsy moth larvae feeding oneach of 922 randomly sampled trees in a Quercu-Acer-Fraxinetum forest in the southwestern Quebec, Canadawere counted in 1979 and in 1980 to quantify the larvalfeeding preferences as observed in the field for eighteendeciduous and one coniferous tree species at the northernrange limit of the gypsy moth. Both the diameter height(dbh) and the estimated foliage biomass of the sampledtrees were used to calculate the relative proportions offoliage represented by each of the nineteen tree species inthe forest canopy.
The objective of this research was to determine theeffects of diameter at breast height (dbh), egg placement,orientation and host tree species on number of egg massesgypsy moth, Lymantria dispar (L.) in Hyrcanian forests atthe north of Iran.
MATERIALS AND METHODS
The experiment was conducted in Daland park, whichis part of the larger Golestan forest in Hyrcanian zone, IR-Iran (latitude 36°2′S-36°4′S, longitude 36°3′E-41°5′E)(Figure 1). This area is approximately, 3750 m long and2900 m wide and has a total area of 608 ha. The studyregion has an average temperature of 16.5°C, a total annual
rainfall of 660 mm and an altitudinal range of 75-119 mabove sea level. The park consists almost entirely of P.persica, Q. castaneifolia, Z. carpinifolia and C. betuluswith a few small areas of other species (Populus alba,Ficus carica, Morus alba, Cupressus S.V. horizentalis,Pinus eladerica, Thuja orientalis and Acer insigne). Thestudy site was recently infested by the gypsy moth. It wasconsidered to be part of the eastern leading edge of thegenerally infested area (Anon 2005). To coordinate the eggmasses gypsy moth, to zigzag between the trees weremoving. By global position system (GPS) device with awidth of 20 m and azimuth polygon specific coordinationof defoliated trees was recorded (Figures 2 and 3). Dataand means were compared using Duncan’s multiple rangetests.
RESULTS AND DISCUSSION
Results showed that the diameter at breast height (dbh)of host tree species has no significant effect on the numberof egg masses gypsy moth (Table 1). Maximum of eggmasses were observed at 80-90 cm dbh (2.37 eggmasses/tree) (Figure 4). In geographical direction of thetrunk of host tree species, there was no significantdifference (P<0.01) (Table 2). The compare of meansshowed that the maximum rates of egg masses in defoliatedtrees occurred in the south position (2.04 egg masses/tree),the least of defoliation was related to the north (1.57 eggmasses/tree) (Figure 5). The effects of oviposition placewere significant (P<0.01). The highest number of eggmasses (2.148 egg masses/tree) was observed at the trunkof defoliated trees (Table 3). As expected, tree species hadsignificant effect (ɤ = 0.05) on egg masses of gypsy moth(Table 4). The maximum of egg masses of defoliated treeswas observed on Persian iron wood, Parrotia persica(average 1.92 egg masses per defoliated tree). Minimum(average 1.15 egg masses per defoliated tree) occurred inthe trunk of Cupressus Sempervirences var horizontalis(Figure 6).
Figure 2. Location of the study site inside Daland park, the part of Hyrcanian forests, Golestan, North of Iran.
Islamic Republic of Iran
Daland Park
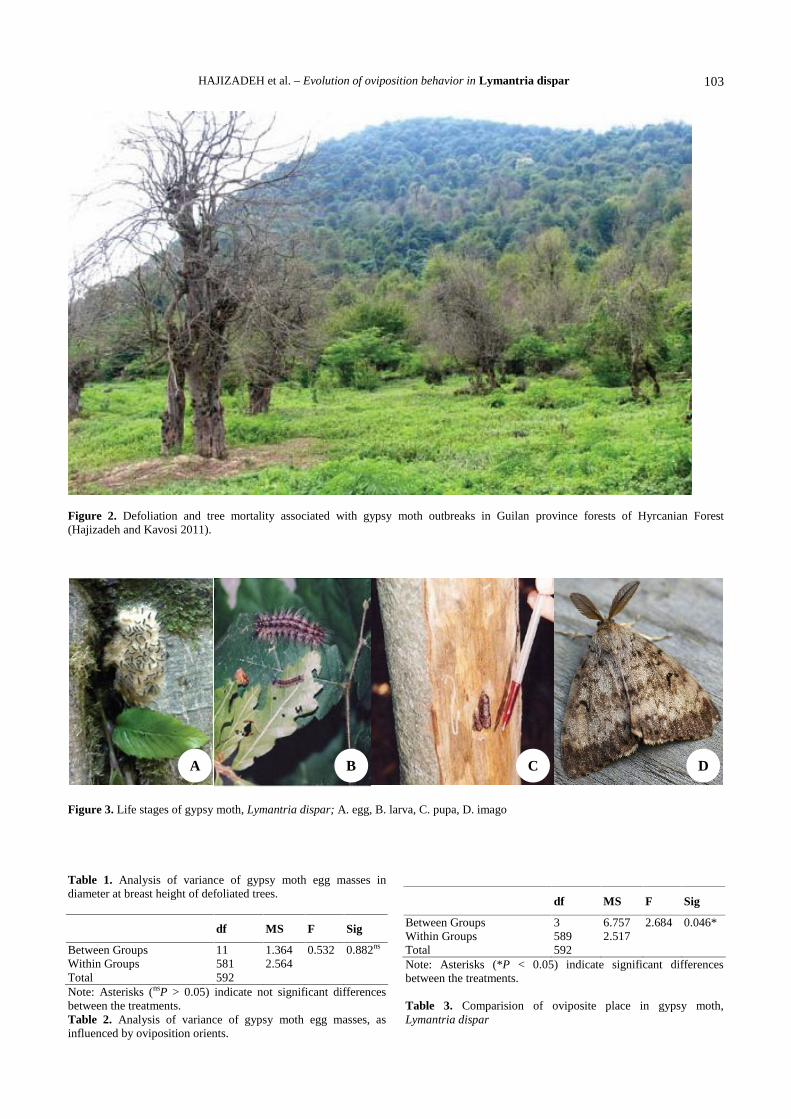
HAJIZADEH et al. – Evolution of oviposition behavior in Lymantria dispar 103
Figure 2. Defoliation and tree mortality associated with gypsy moth outbreaks in Guilan province forests of Hyrcanian Forest(Hajizadeh and Kavosi 2011).
A B C
D
Figure 3. Life stages of gypsy moth, Lymantria dispar; A. egg, B. larva, C. pupa, D. imago
Table 1. Analysis of variance of gypsy moth egg masses indiameter at breast height of defoliated trees.
df MS F Sig
Between Groups 11 1.364 0.532 0.882ns
Within Groups 581 2.564Total 592Note: Asterisks (nsP > 0.05) indicate not significant differencesbetween the treatments.Table 2. Analysis of variance of gypsy moth egg masses, asinfluenced by oviposition orients.
df MS F Sig
Between Groups 3 6.757 2.684 0.046*Within Groups 589 2.517Total 592Note: Asterisks (*P < 0.05) indicate significant differencesbetween the treatments.
Table 3. Comparision of oviposite place in gypsy moth,Lymantria dispar
A B C D
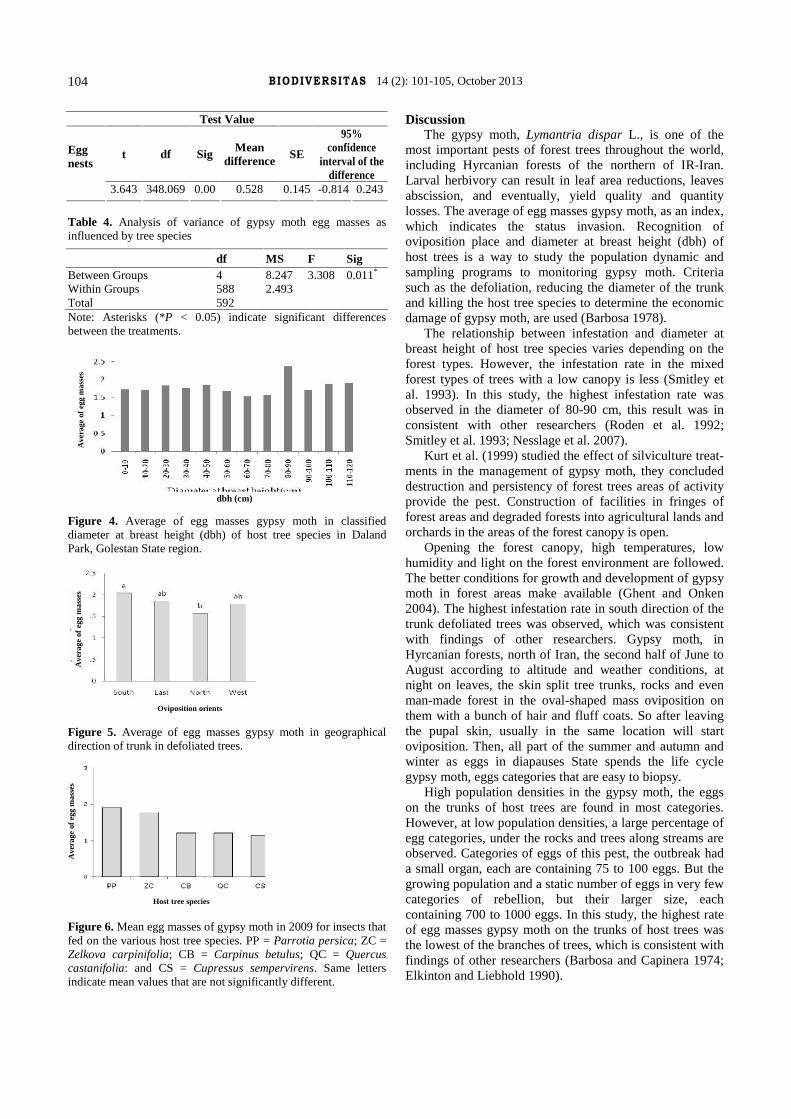
BIODIVERSITAS 14 (2): 101-105, October 2013104
Test Value
t df Sig Meandifference SE
95%confidence
interval of thedifference
Eggnests
3.643 348.069 0.00 0.528 0.145 -0.814 0.243
Table 4. Analysis of variance of gypsy moth egg masses asinfluenced by tree species
df MS F SigBetween Groups 4 8.247 3.308 0.011*
Within Groups 588 2.493Total 592Note: Asterisks (*P < 0.05) indicate significant differencesbetween the treatments.
Figure 4. Average of egg masses gypsy moth in classifieddiameter at breast height (dbh) of host tree species in DalandPark, Golestan State region.
Figure 5. Average of egg masses gypsy moth in geographicaldirection of trunk in defoliated trees.
Figure 6. Mean egg masses of gypsy moth in 2009 for insects thatfed on the various host tree species. PP = Parrotia persica; ZC =Zelkova carpinifolia; CB = Carpinus betulus; QC = Quercuscastanifolia: and CS = Cupressus sempervirens. Same lettersindicate mean values that are not significantly different.
DiscussionThe gypsy moth, Lymantria dispar L., is one of the
most important pests of forest trees throughout the world,including Hyrcanian forests of the northern of IR-Iran.Larval herbivory can result in leaf area reductions, leavesabscission, and eventually, yield quality and quantitylosses. The average of egg masses gypsy moth, as an index,which indicates the status invasion. Recognition ofoviposition place and diameter at breast height (dbh) ofhost trees is a way to study the population dynamic andsampling programs to monitoring gypsy moth. Criteriasuch as the defoliation, reducing the diameter of the trunkand killing the host tree species to determine the economicdamage of gypsy moth, are used (Barbosa 1978).
The relationship between infestation and diameter atbreast height of host tree species varies depending on theforest types. However, the infestation rate in the mixedforest types of trees with a low canopy is less (Smitley etal. 1993). In this study, the highest infestation rate wasobserved in the diameter of 80-90 cm, this result was inconsistent with other researchers (Roden et al. 1992;Smitley et al. 1993; Nesslage et al. 2007).
Kurt et al. (1999) studied the effect of silviculture treat-ments in the management of gypsy moth, they concludeddestruction and persistency of forest trees areas of activityprovide the pest. Construction of facilities in fringes offorest areas and degraded forests into agricultural lands andorchards in the areas of the forest canopy is open.
Opening the forest canopy, high temperatures, lowhumidity and light on the forest environment are followed.The better conditions for growth and development of gypsymoth in forest areas make available (Ghent and Onken2004). The highest infestation rate in south direction of thetrunk defoliated trees was observed, which was consistentwith findings of other researchers. Gypsy moth, inHyrcanian forests, north of Iran, the second half of June toAugust according to altitude and weather conditions, atnight on leaves, the skin split tree trunks, rocks and evenman-made forest in the oval-shaped mass oviposition onthem with a bunch of hair and fluff coats. So after leavingthe pupal skin, usually in the same location will startoviposition. Then, all part of the summer and autumn andwinter as eggs in diapauses State spends the life cyclegypsy moth, eggs categories that are easy to biopsy.
High population densities in the gypsy moth, the eggson the trunks of host trees are found in most categories.However, at low population densities, a large percentage ofegg categories, under the rocks and trees along streams areobserved. Categories of eggs of this pest, the outbreak hada small organ, each are containing 75 to 100 eggs. But thegrowing population and a static number of eggs in very fewcategories of rebellion, but their larger size, eachcontaining 700 to 1000 eggs. In this study, the highest rateof egg masses gypsy moth on the trunks of host trees wasthe lowest of the branches of trees, which is consistent withfindings of other researchers (Barbosa and Capinera 1974;Elkinton and Liebhold 1990).
Ave
rage
of
egg
mas
ses
Ave
rage
of
egg
mas
ses
Ave
rage
of
egg
mas
ses
dbh (cm)
Oviposition orients
Host tree species
HAJIZADEH et al. – Evolution of oviposition behavior in Lymantria dispar 105
CONCLUSION
The gypsy moth, Lymantria dispar L., is one of themost important pests of forest trees throughout the world.Larval herbivory can result in leaf area reductions, leavesabscission, and eventually, yield quality and quantitylosses. In fact, in this study, we found significantdifferences in defoliation levels among tree species. Wefound that the primary host tree species of gypsy moth inIran was Persian ironweed, Parrotia persica. In finally,identification of suitable host trees and high spawning ofgypsy moth a appropriate way to run a program ofsampling and population dynamics of the pest smoothly.
REFERENCES
Anon. 2005. Revision plan of national park Daland. Forest, Range andWatershed Management Organization Press. Gorgan.
Barbosa P, Capinera JL. 1974. The influence of food on developmentalcharacteristics of the gypsy moth. Can J Zool 55: 1427-1429
Barbosa P. 1978. Distribution of egg masses and endemic larvae of gypsymoth population among various tree species. Can J Zool 56: 28-37.
Capinera JL, Barbosa P. 1976. Dispersal of first-instar gypsy moth larvaein relation to population quality. Oecologia 26: 53-64.
Elkinton JS, Liebhold AM. 1990. Population dynamics of gypsy moth inNorth America. Ann Rev Entomol 35: 571-596.
Ghent JH, Onken AH. 2004. Trip report on assistance to MongolianMinistry for Nature and Environment for the control of forestdefoliators, FAO Project TCP/MON/2902, Asheville, NC.
Gypsy Moth Digest. 2005. http://www.na.fs.fed.us/fhp/gm/.Hajizadeh G, Kavosi MR, Afshari A, Shataee S. 2012. Effects of
oviposition height and host tree species on some biological
parameters of gypsy moth, Lymantria dispar L. J For Wood Sci 19(1): 149-162. [Persian]
Hajizadeh G, Kavosi MR. 2011. Primary Host Tree Species of the gypsyMoth Lymantria dispar (Lepidoptera: Lymantriidae) in HyrcanianForests. J Agri Sci Tech B 1: 342-346.
Hajizadeh G. 2010. The comparison of integrated and pheromone controlon the intensity and spatial distribution of Lymantria dispar L.,[M.Sc. Thesis], Gorgan of Agricultural Sciences and NaturalResources, University Press. [Persian]
Herms DA. 2003. Assessing management options for gypsy moth.Pesticide Outlook 14: 14-18.
Kavosi MR. 2008. Study of distribution gypsy moth, Lymantria dispar L.in the North forests. The First Symposium of Climate Change andDendrochronology, Sari University, Mazandaran.
Kurt W, Gottschalk R, Mark J. 1999. Managing forest for gypsy mothsilviculture treatments in reducing foliation and mortality, 12thCentral Hardwood Forest Conference of Natural Resources, Univ.Missouri, Columbia.
Lance D, Barbosa P. 1981. Host tree influences on the dispersal of firstinstar gypsy moths, Lyrnantria dispar L. J Ecol Entomol 6:411-416.
Lechowicz MJ, Jobin L. 1983. Estimating the susceptibility of tree speciesto attack by the gypsy moth. J Ecol Entomol 8: 171-183.
Leonard DE. 1981. Bioecology of the Gypsy Moth. In: Doane CC,McManus ML (eds.). The Gypsy Moth: Research toward IntegratedPest Management. USDA Technical Bulletin, Washington DC.
Nesslage GM, Maurer BA, Gage SH. 2007. Gypsy moth response tolandscape structure differs from neutral model predictions:implications for invasion monitoring. J Biol Invas 9: 585-595.
Roden DB, Miller JR, Simmons GA. 1992. Visual stimuli influencingorientation by larval gypsy moth, Lymantria dispar L. J Can Entomol122: 304-617.
Smitley DR, Rao RP, Roden DB. 1993. Role of tree trunks foliage type,and canopy size in host selection by Lymantria dispar (Lepidoptera:Lymantriidae). J Environ Entomol 22: 134-140.
Thorpe KW, Hickman AD, Tcheslavskaia KS, Leonard DS, Roberts A.2007. Comparison of methods for deploying female gypsy moths toevaluate mating disruption treatments. Agric For Entomol 9: 31-37.
BIODIVERSITAS ISSN: 1412-033XVolume 14, Number 2, October 2013 E-ISSN: 2085-4722Pages: 106-111 DOI: 10.13057/biodiv/d140209
Ethnobotanical study and nutrient content of local vegetables consumedin Central Kalimantan, Indonesia
HASTIN E.N.C. CHOTIMAH1,♥, SUSI KRESNATITA1, YULA MIRANDA2
1Department of Agronomy, Faculty of Agriculture, Palangkaraya University. Jl. Yos. Sudarso, Palangkaraya 73112, Central Kalimantan, Indonesia. Tel.+62-536-3326196, ♥email: [email protected]
2Department of Mathematics and Natural Sciences Education, Faculty of Teacher Training Education, Palangkaraya University, Central Kalimantan,Indonesia
Manuscript received: 4 May 2013. Revision accepted: 15 May 2013.
Abstract. Chotimah HENC, Kresnatita S, Miranda Y. 2013. Ethnobotanical study and nutrient content of local vegetables consumed inCentral Kalimantan, Indonesia. Biodiversitas 14: 106-111. People in Central Kalimantan consume vegetables collected from the wild ortraditionally cultivated. Documentation effort of them is very important because the diversity of local vegetables is threatened withextinction due to the conversion of peat land and forest fires. This study aimed to determine the diversity of local vegetables in CentralKalimantan, its use as a vegetable and nutrient content of some vegetables. The method used was the exploration and interviews.Exploration was carried out in three districts, namely Palangkaraya, Pulang Pisau, and Seruyan. Sampling of plants was done randomlyand selectively. Data analysis was performed descriptively. The results showed that we recorded 42 plant species belonging to 30families. There were many vegetables processing: stir-fry, make into clear soup, a light coconut milk soup, acidic soup, or justconsumed as fresh vegetables. Based on the nutritional value, Helminthostachys zeylanica (L.) Hook had a potential to be developed asvegetables or medicinal plant. It had the highest protein, carbohydrate and minerals, namely P, Fe, Na and K among the vegetablesanalyzed.
Key words: ethnobotany, indigenous vegetables, nutritional value, Central Kalimantan
INTRODUCTION
Conserving the world’s biodiversity is very important tosupport sustainable living. Kalimantan island is endowedwith agro-biodiversity like local vegetables which havehigh nutritional value, health benefits, income-generationpotential, and agronomic advantages that can be exploited.Major constraints that hinder optimal production andutilization of the local vegetables include neglect bystakeholders, lack of quality seed, lack of technicalproduction and utilization packages, and poor marketingchannels. Consequently, their potential has not been fullyexploited. In this study, the term ‘local vegetables’ is usedto refer to both native and introduced vegetables. Nativevegetables are edible plants indigenous to an area, whileintroduced vegetables are those that have been introducedinto a particular area. Introduced vegetables have adaptedto local condition after their introduction with the resultthat they are considered as local or even thought as native(Laker 2007; Dweba and Mearns 2011). It is reported thatin Central Kalimantan more than 200 plants are used aslocal vegetables. Some of them are believed to haveproperties to maintain a healthy body from disease. InAfrican communities, African indigenous vegetables havebeen reported to have high nutritional value, whereconsumption of 100 g of the vegetables provides over100% of the daily requirement of vitamins and mineralsand 40% of proteins (Onyango 2003).
Some local vegetables that are currently found andconsumed a lot by people in Central Kalimantan are
Stenochlaena palustris, Ceratopteris thalictroides,Calamus sp., Cnesmone javanica, Nauclea sp. and others(Irawan et al. 2006). Meanwhile research on the utilizationof plant fruits and wild vegetables by the Dayak Kenyah ofEast Kalimantan showed that many species of fruit bearingplants are cultivated by the tribe, but it is not the case withvegetables. The reason is that many wild plants can beutilized for the vegetable, making it less necessary tocultivate. Leaves, shoots and roots of various wild plantscan be eaten as a vegetable. Buds and shoots of Cyperusbancanus, shoot of Imperata cylindrica are consumed asfresh vegetables. Young leaves and stems of Cyatheacontaminans as well as Diplazium ferns, Nephrolepisbisserata, and Stenochlaena are boiled or pan-friedvegetables and sometimes traditionally cooked in bambootubes. Likewise, other species of Zingiberaceae such asAlpinia sp., Kaempferia sp., Nicolaia speciosa are sourceof vegetables and the preferred flavoring. The tip of theharvested rattan trunk is usually processed by fire untilwithered, then the tough skin and thorn are peeled. Theinside is then used as a vegetable. Likewise, young rattantrunk of Eugeissona utilis, Oncosperma and Pinanga arevegetables usually cooked along with fish (Hendra 2002).In Central Kalimantan, documentation effort is veryimportant because the diversity of local vegetables arethreatened with extinction due to land conversion forplantations and transmigration areas. The condition wasfurther exacerbated by the presence of peat forest fireswhich almost always occur every dry season. This researchwas intended to conserve local vegetables in Central
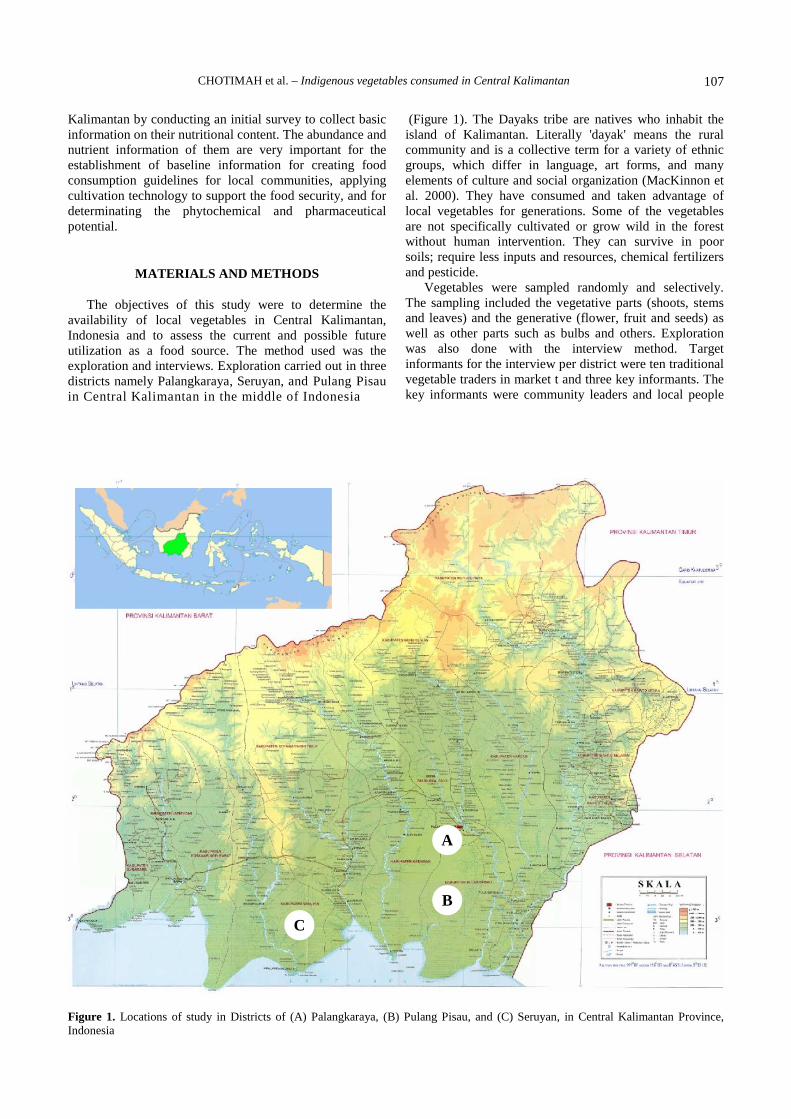
CHOTIMAH et al. – Indigenous vegetables consumed in Central Kalimantan 107
Kalimantan by conducting an initial survey to collect basicinformation on their nutritional content. The abundance andnutrient information of them are very important for theestablishment of baseline information for creating foodconsumption guidelines for local communities, applyingcultivation technology to support the food security, and fordeterminating the phytochemical and pharmaceuticalpotential.
MATERIALS AND METHODS
The objectives of this study were to determine theavailability of local vegetables in Central Kalimantan,Indonesia and to assess the current and possible futureutilization as a food source. The method used was theexploration and interviews. Exploration carried out in threedistricts namely Palangkaraya, Seruyan, and Pulang Pisauin Central Kalimantan in the middle of Indonesia
(Figure 1). The Dayaks tribe are natives who inhabit theisland of Kalimantan. Literally 'dayak' means the ruralcommunity and is a collective term for a variety of ethnicgroups, which differ in language, art forms, and manyelements of culture and social organization (MacKinnon etal. 2000). They have consumed and taken advantage oflocal vegetables for generations. Some of the vegetablesare not specifically cultivated or grow wild in the forestwithout human intervention. They can survive in poorsoils; require less inputs and resources, chemical fertilizersand pesticide.
Vegetables were sampled randomly and selectively.The sampling included the vegetative parts (shoots, stemsand leaves) and the generative (flower, fruit and seeds) aswell as other parts such as bulbs and others. Explorationwas also done with the interview method. Targetinformants for the interview per district were ten traditionalvegetable traders in market t and three key informants. Thekey informants were community leaders and local people
Figure 1. Locations of study in Districts of (A) Palangkaraya, (B) Pulang Pisau, and (C) Seruyan, in Central Kalimantan Province,Indonesia
A
B
C
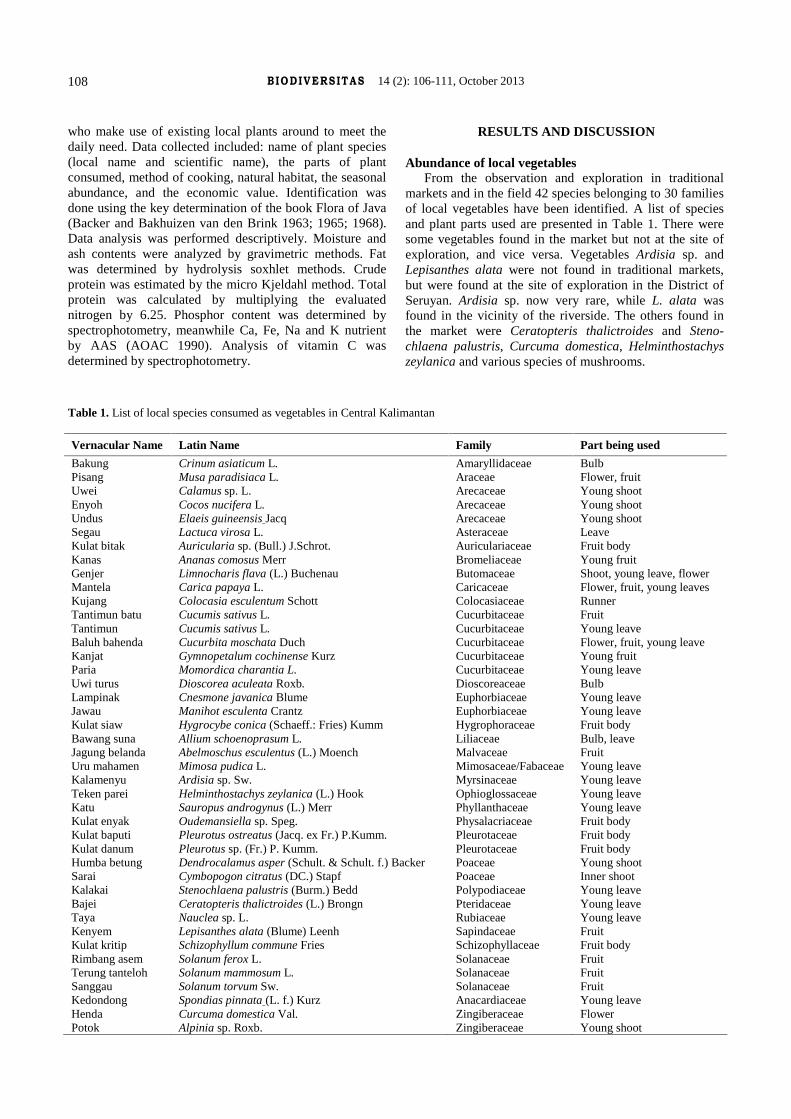
BIODIVERSITAS 14 (2): 106-111, October 2013108
who make use of existing local plants around to meet thedaily need. Data collected included: name of plant species(local name and scientific name), the parts of plantconsumed, method of cooking, natural habitat, the seasonalabundance, and the economic value. Identification wasdone using the key determination of the book Flora of Java(Backer and Bakhuizen van den Brink 1963; 1965; 1968).Data analysis was performed descriptively. Moisture andash contents were analyzed by gravimetric methods. Fatwas determined by hydrolysis soxhlet methods. Crudeprotein was estimated by the micro Kjeldahl method. Totalprotein was calculated by multiplying the evaluatednitrogen by 6.25. Phosphor content was determined byspectrophotometry, meanwhile Ca, Fe, Na and K nutrientby AAS (AOAC 1990). Analysis of vitamin C wasdetermined by spectrophotometry.
RESULTS AND DISCUSSION
Abundance of local vegetablesFrom the observation and exploration in traditional
markets and in the field 42 species belonging to 30 familiesof local vegetables have been identified. A list of speciesand plant parts used are presented in Table 1. There weresome vegetables found in the market but not at the site ofexploration, and vice versa. Vegetables Ardisia sp. andLepisanthes alata were not found in traditional markets,but were found at the site of exploration in the District ofSeruyan. Ardisia sp. now very rare, while L. alata wasfound in the vicinity of the riverside. The others found inthe market were Ceratopteris thalictroides and Steno-chlaena palustris, Curcuma domestica, Helminthostachyszeylanica and various species of mushrooms.
Table 1. List of local species consumed as vegetables in Central Kalimantan
Vernacular Name Latin Name Family Part being used
Bakung Crinum asiaticum L. Amaryllidaceae BulbPisang Musa paradisiaca L. Araceae Flower, fruitUwei Calamus sp. L. Arecaceae Young shootEnyoh Cocos nucifera L. Arecaceae Young shootUndus Elaeis guineensis Jacq Arecaceae Young shootSegau Lactuca virosa L. Asteraceae LeaveKulat bitak Auricularia sp. (Bull.) J.Schrot. Auriculariaceae Fruit bodyKanas Ananas comosus Merr Bromeliaceae Young fruitGenjer Limnocharis flava (L.) Buchenau Butomaceae Shoot, young leave, flowerMantela Carica papaya L. Caricaceae Flower, fruit, young leavesKujang Colocasia esculentum Schott Colocasiaceae RunnerTantimun batu Cucumis sativus L. Cucurbitaceae FruitTantimun Cucumis sativus L. Cucurbitaceae Young leaveBaluh bahenda Cucurbita moschata Duch Cucurbitaceae Flower, fruit, young leaveKanjat Gymnopetalum cochinense Kurz Cucurbitaceae Young fruitParia Momordica charantia L. Cucurbitaceae Young leaveUwi turus Dioscorea aculeata Roxb. Dioscoreaceae BulbLampinak Cnesmone javanica Blume Euphorbiaceae Young leaveJawau Manihot esculenta Crantz Euphorbiaceae Young leaveKulat siaw Hygrocybe conica (Schaeff.: Fries) Kumm Hygrophoraceae Fruit bodyBawang suna Allium schoenoprasum L. Liliaceae Bulb, leaveJagung belanda Abelmoschus esculentus (L.) Moench Malvaceae FruitUru mahamen Mimosa pudica L. Mimosaceae/Fabaceae Young leaveKalamenyu Ardisia sp. Sw. Myrsinaceae Young leaveTeken parei Helminthostachys zeylanica (L.) Hook Ophioglossaceae Young leaveKatu Sauropus androgynus (L.) Merr Phyllanthaceae Young leaveKulat enyak Oudemansiella sp. Speg. Physalacriaceae Fruit bodyKulat baputi Pleurotus ostreatus (Jacq. ex Fr.) P.Kumm. Pleurotaceae Fruit bodyKulat danum Pleurotus sp. (Fr.) P. Kumm. Pleurotaceae Fruit bodyHumba betung Dendrocalamus asper (Schult. & Schult. f.) Backer Poaceae Young shootSarai Cymbopogon citratus (DC.) Stapf Poaceae Inner shootKalakai Stenochlaena palustris (Burm.) Bedd Polypodiaceae Young leaveBajei Ceratopteris thalictroides (L.) Brongn Pteridaceae Young leaveTaya Nauclea sp. L. Rubiaceae Young leaveKenyem Lepisanthes alata (Blume) Leenh Sapindaceae FruitKulat kritip Schizophyllum commune Fries Schizophyllaceae Fruit bodyRimbang asem Solanum ferox L. Solanaceae FruitTerung tanteloh Solanum mammosum L. Solanaceae FruitSanggau Solanum torvum Sw. Solanaceae FruitKedondong Spondias pinnata (L. f.) Kurz Anacardiaceae Young leaveHenda Curcuma domestica Val. Zingiberaceae FlowerPotok Alpinia sp. Roxb. Zingiberaceae Young shoot
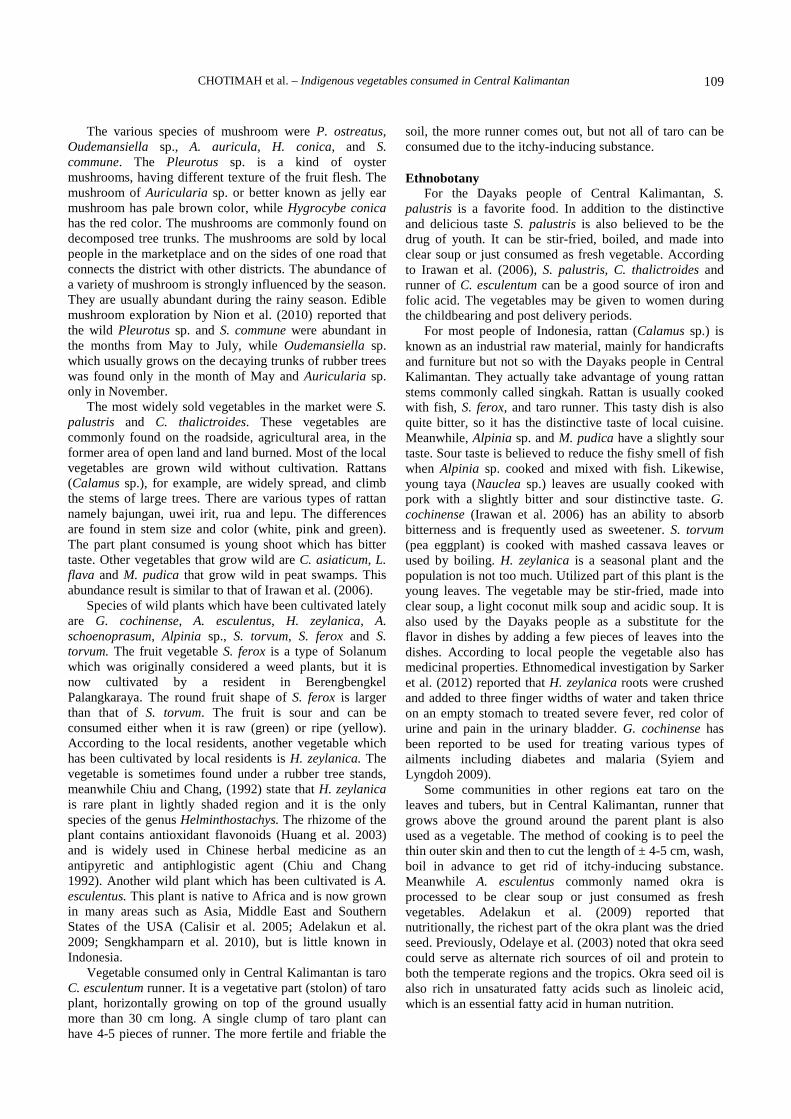
CHOTIMAH et al. – Indigenous vegetables consumed in Central Kalimantan 109
The various species of mushroom were P. ostreatus,Oudemansiella sp., A. auricula, H. conica, and S.commune. The Pleurotus sp. is a kind of oystermushrooms, having different texture of the fruit flesh. Themushroom of Auricularia sp. or better known as jelly earmushroom has pale brown color, while Hygrocybe conicahas the red color. The mushrooms are commonly found ondecomposed tree trunks. The mushrooms are sold by localpeople in the marketplace and on the sides of one road thatconnects the district with other districts. The abundance ofa variety of mushroom is strongly influenced by the season.They are usually abundant during the rainy season. Ediblemushroom exploration by Nion et al. (2010) reported thatthe wild Pleurotus sp. and S. commune were abundant inthe months from May to July, while Oudemansiella sp.which usually grows on the decaying trunks of rubber treeswas found only in the month of May and Auricularia sp.only in November.
The most widely sold vegetables in the market were S.palustris and C. thalictroides. These vegetables arecommonly found on the roadside, agricultural area, in theformer area of open land and land burned. Most of the localvegetables are grown wild without cultivation. Rattans(Calamus sp.), for example, are widely spread, and climbthe stems of large trees. There are various types of rattannamely bajungan, uwei irit, rua and lepu. The differencesare found in stem size and color (white, pink and green).The part plant consumed is young shoot which has bittertaste. Other vegetables that grow wild are C. asiaticum, L.flava and M. pudica that grow wild in peat swamps. Thisabundance result is similar to that of Irawan et al. (2006).
Species of wild plants which have been cultivated latelyare G. cochinense, A. esculentus, H. zeylanica, A.schoenoprasum, Alpinia sp., S. torvum, S. ferox and S.torvum. The fruit vegetable S. ferox is a type of Solanumwhich was originally considered a weed plants, but it isnow cultivated by a resident in BerengbengkelPalangkaraya. The round fruit shape of S. ferox is largerthan that of S. torvum. The fruit is sour and can beconsumed either when it is raw (green) or ripe (yellow).According to the local residents, another vegetable whichhas been cultivated by local residents is H. zeylanica. Thevegetable is sometimes found under a rubber tree stands,meanwhile Chiu and Chang, (1992) state that H. zeylanicais rare plant in lightly shaded region and it is the onlyspecies of the genus Helminthostachys. The rhizome of theplant contains antioxidant flavonoids (Huang et al. 2003)and is widely used in Chinese herbal medicine as anantipyretic and antiphlogistic agent (Chiu and Chang1992). Another wild plant which has been cultivated is A.esculentus. This plant is native to Africa and is now grownin many areas such as Asia, Middle East and SouthernStates of the USA (Calisir et al. 2005; Adelakun et al.2009; Sengkhamparn et al. 2010), but is little known inIndonesia.
Vegetable consumed only in Central Kalimantan is taroC. esculentum runner. It is a vegetative part (stolon) of taroplant, horizontally growing on top of the ground usuallymore than 30 cm long. A single clump of taro plant canhave 4-5 pieces of runner. The more fertile and friable the
soil, the more runner comes out, but not all of taro can beconsumed due to the itchy-inducing substance.
EthnobotanyFor the Dayaks people of Central Kalimantan, S.
palustris is a favorite food. In addition to the distinctiveand delicious taste S. palustris is also believed to be thedrug of youth. It can be stir-fried, boiled, and made intoclear soup or just consumed as fresh vegetable. Accordingto Irawan et al. (2006), S. palustris, C. thalictroides andrunner of C. esculentum can be a good source of iron andfolic acid. The vegetables may be given to women duringthe childbearing and post delivery periods.
For most people of Indonesia, rattan (Calamus sp.) isknown as an industrial raw material, mainly for handicraftsand furniture but not so with the Dayaks people in CentralKalimantan. They actually take advantage of young rattanstems commonly called singkah. Rattan is usually cookedwith fish, S. ferox, and taro runner. This tasty dish is alsoquite bitter, so it has the distinctive taste of local cuisine.Meanwhile, Alpinia sp. and M. pudica have a slightly sourtaste. Sour taste is believed to reduce the fishy smell of fishwhen Alpinia sp. cooked and mixed with fish. Likewise,young taya (Nauclea sp.) leaves are usually cooked withpork with a slightly bitter and sour distinctive taste. G.cochinense (Irawan et al. 2006) has an ability to absorbbitterness and is frequently used as sweetener. S. torvum(pea eggplant) is cooked with mashed cassava leaves orused by boiling. H. zeylanica is a seasonal plant and thepopulation is not too much. Utilized part of this plant is theyoung leaves. The vegetable may be stir-fried, made intoclear soup, a light coconut milk soup and acidic soup. It isalso used by the Dayaks people as a substitute for theflavor in dishes by adding a few pieces of leaves into thedishes. According to local people the vegetable also hasmedicinal properties. Ethnomedical investigation by Sarkeret al. (2012) reported that H. zeylanica roots were crushedand added to three finger widths of water and taken thriceon an empty stomach to treated severe fever, red color ofurine and pain in the urinary bladder. G. cochinense hasbeen reported to be used for treating various types ofailments including diabetes and malaria (Syiem andLyngdoh 2009).
Some communities in other regions eat taro on theleaves and tubers, but in Central Kalimantan, runner thatgrows above the ground around the parent plant is alsoused as a vegetable. The method of cooking is to peel thethin outer skin and then to cut the length of ± 4-5 cm, wash,boil in advance to get rid of itchy-inducing substance.Meanwhile A. esculentus commonly named okra isprocessed to be clear soup or just consumed as freshvegetables. Adelakun et al. (2009) reported thatnutritionally, the richest part of the okra plant was the driedseed. Previously, Odelaye et al. (2003) noted that okra seedcould serve as alternate rich sources of oil and protein toboth the temperate regions and the tropics. Okra seed oil isalso rich in unsaturated fatty acids such as linoleic acid,which is an essential fatty acid in human nutrition.
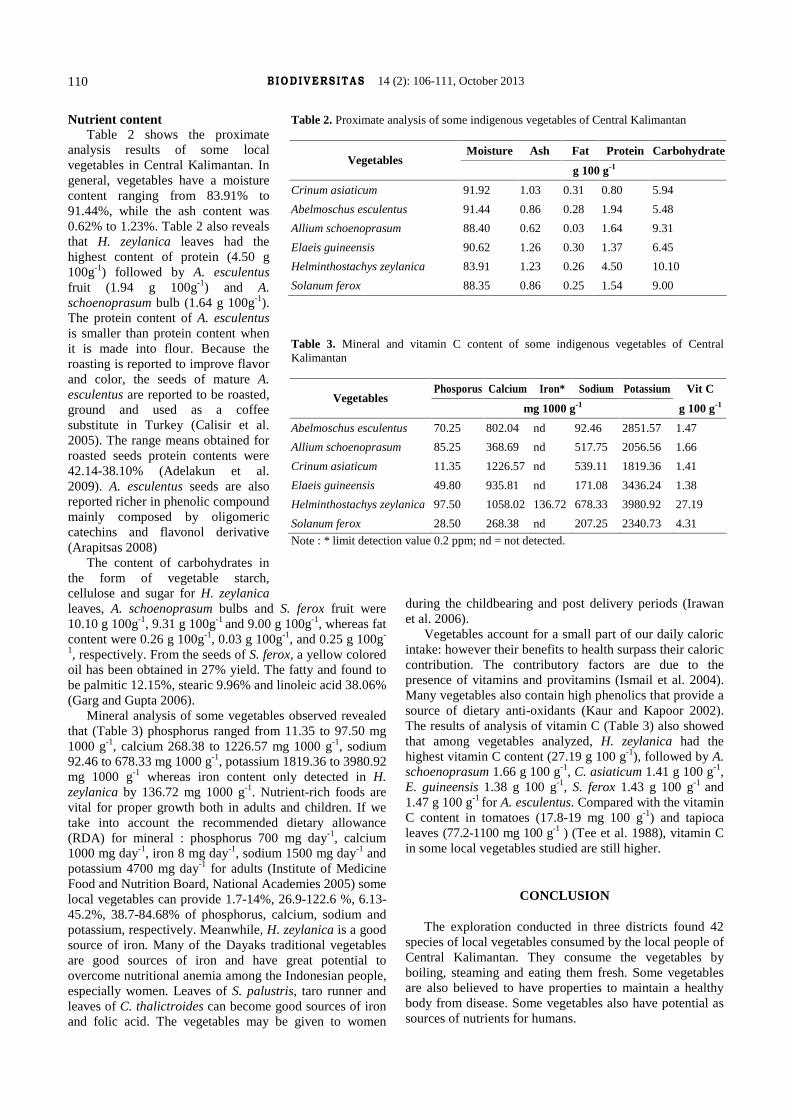
BIODIVERSITAS 14 (2): 106-111, October 2013110
Nutrient contentTable 2 shows the proximate
analysis results of some localvegetables in Central Kalimantan. Ingeneral, vegetables have a moisturecontent ranging from 83.91% to91.44%, while the ash content was0.62% to 1.23%. Table 2 also revealsthat H. zeylanica leaves had thehighest content of protein (4.50 g100g-1) followed by A. esculentusfruit (1.94 g 100g-1) and A.schoenoprasum bulb (1.64 g 100g-1).The protein content of A. esculentusis smaller than protein content whenit is made into flour. Because theroasting is reported to improve flavorand color, the seeds of mature A.esculentus are reported to be roasted,ground and used as a coffeesubstitute in Turkey (Calisir et al.2005). The range means obtained forroasted seeds protein contents were42.14-38.10% (Adelakun et al.2009). A. esculentus seeds are alsoreported richer in phenolic compoundmainly composed by oligomericcatechins and flavonol derivative(Arapitsas 2008)
The content of carbohydrates inthe form of vegetable starch,cellulose and sugar for H. zeylanicaleaves, A. schoenoprasum bulbs and S. ferox fruit were10.10 g 100g-1, 9.31 g 100g-1 and 9.00 g 100g-1, whereas fatcontent were 0.26 g 100g-1, 0.03 g 100g-1, and 0.25 g 100g-
1, respectively. From the seeds of S. ferox, a yellow coloredoil has been obtained in 27% yield. The fatty and found tobe palmitic 12.15%, stearic 9.96% and linoleic acid 38.06%(Garg and Gupta 2006).
Mineral analysis of some vegetables observed revealedthat (Table 3) phosphorus ranged from 11.35 to 97.50 mg1000 g-1, calcium 268.38 to 1226.57 mg 1000 g-1, sodium92.46 to 678.33 mg 1000 g-1, potassium 1819.36 to 3980.92mg 1000 g-1 whereas iron content only detected in H.zeylanica by 136.72 mg 1000 g-1. Nutrient-rich foods arevital for proper growth both in adults and children. If wetake into account the recommended dietary allowance(RDA) for mineral : phosphorus 700 mg day-1, calcium1000 mg day-1, iron 8 mg day-1, sodium 1500 mg day-1 andpotassium 4700 mg day-1 for adults (Institute of MedicineFood and Nutrition Board, National Academies 2005) somelocal vegetables can provide 1.7-14%, 26.9-122.6 %, 6.13-45.2%, 38.7-84.68% of phosphorus, calcium, sodium andpotassium, respectively. Meanwhile, H. zeylanica is a goodsource of iron. Many of the Dayaks traditional vegetablesare good sources of iron and have great potential toovercome nutritional anemia among the Indonesian people,especially women. Leaves of S. palustris, taro runner andleaves of C. thalictroides can become good sources of ironand folic acid. The vegetables may be given to women
during the childbearing and post delivery periods (Irawanet al. 2006).
Vegetables account for a small part of our daily caloricintake: however their benefits to health surpass their caloriccontribution. The contributory factors are due to thepresence of vitamins and provitamins (Ismail et al. 2004).Many vegetables also contain high phenolics that provide asource of dietary anti-oxidants (Kaur and Kapoor 2002).The results of analysis of vitamin C (Table 3) also showedthat among vegetables analyzed, H. zeylanica had thehighest vitamin C content (27.19 g 100 g-1), followed by A.schoenoprasum 1.66 g 100 g-1, C. asiaticum 1.41 g 100 g-1,E. guineensis 1.38 g 100 g-1, S. ferox 1.43 g 100 g-1 and1.47 g 100 g-1 for A. esculentus. Compared with the vitaminC content in tomatoes (17.8-19 mg 100 g-1) and tapiocaleaves (77.2-1100 mg 100 g-1 ) (Tee et al. 1988), vitamin Cin some local vegetables studied are still higher.
CONCLUSION
The exploration conducted in three districts found 42species of local vegetables consumed by the local people ofCentral Kalimantan. They consume the vegetables byboiling, steaming and eating them fresh. Some vegetablesare also believed to have properties to maintain a healthybody from disease. Some vegetables also have potential assources of nutrients for humans.
Table 2. Proximate analysis of some indigenous vegetables of Central Kalimantan
Moisture Ash Fat Protein CarbohydrateVegetables
g 100 g-1
Crinum asiaticum 91.92 1.03 0.31 0.80 5.94
Abelmoschus esculentus 91.44 0.86 0.28 1.94 5.48
Allium schoenoprasum 88.40 0.62 0.03 1.64 9.31
Elaeis guineensis 90.62 1.26 0.30 1.37 6.45
Helminthostachys zeylanica 83.91 1.23 0.26 4.50 10.10
Solanum ferox 88.35 0.86 0.25 1.54 9.00
Table 3. Mineral and vitamin C content of some indigenous vegetables of CentralKalimantan
Phosporus Calcium Iron* Sodium Potassium Vit CVegetables
mg 1000 g-1 g 100 g-1
Abelmoschus esculentus 70.25 802.04 nd 92.46 2851.57 1.47
Allium schoenoprasum 85.25 368.69 nd 517.75 2056.56 1.66
Crinum asiaticum 11.35 1226.57 nd 539.11 1819.36 1.41
Elaeis guineensis 49.80 935.81 nd 171.08 3436.24 1.38
Helminthostachys zeylanica 97.50 1058.02 136.72 678.33 3980.92 27.19
Solanum ferox 28.50 268.38 nd 207.25 2340.73 4.31
Note : * limit detection value 0.2 ppm; nd = not detected.
CHOTIMAH et al. – Indigenous vegetables consumed in Central Kalimantan 111
ACKNOWLEDGMENTS
We would like to thank to Direktorat JenderalPendidikan Tinggi Kementerian Pendidikan KebudayaanIndonesia for granting financial support under FundamentalGrant No. 0541/023-04.1.01/00/2011, and to Cenarung asnative Dayak person for his ethnobotanical knowledge ofvegetables.
REFERENCES
Adelakun OE, Oyelade OJ, Ade-Omowaye BIO, Adeyemi IA, Van deVenter M. 2009. Chemical composition and the antioxidativeproperties of Nigerian okra seed (Abelmochus esculentus Moench)flour. Food Chem Toxicol 47: 1123-1126
AOAC. 1990. Official Methods of Analysis. Association of OfficialAnalytical Chemists. Washington DC.
Arapitsas P. 2008. Identification and quantification of phlyphenoliccompounds from okra seeds and skin. Food Chem 110: 1041-1045
Backer CA, Bakhuizen v.d. Brink Jr RC. 1963. Flora of Java. Vol. I.P.Noordhoff, Gronigen.
Backer CA, Bakhuizen v.d. Brink Jr RC. 1965. Flora of Java. Vol. II.P.Noordhoff, Gronigen.
Backer CA, Bakhuizen v.d. Brink Jr RC. 1968. Flora of Java. Vol. III.P.Noordhoff, Gronigen.
Calisir S, Ozcan M, Haciseferogullari H, Yidiz MU. 2005. A study onsome physic-chemical properties of Turkey okra (Hibiscus esculentaL.) seeds. J Food Eng 68: 73-78
Chiu NY and Chang KH. 1992. The Illustrated Medicinal Plants ofTaiwan. Vol 3. Southern Materials Center Inc. Taipei
Dweba TP and Mearns MA. 2011. Conserving indigenous knowledge asthe key to the current and future use of traditional vegetables. Int. J. ofInf. Management 31: 564-571
Garg SK, Gupta DR. 2006. Chemical examination of the seed fat ofSolanum ferox L. Eur J Lipid Sci Technol 68 (6): 449-450.
Hendra M. 2002. Utilization of fruits and wild vegetables by DayakKenyah of East Kalimantan. [Dissertation]. Bogor AgriculturalUniversity, Bogor. [Indonesian]
Huang YL, Yeh PY, Shen CC, Chen CC. 2003. Antioxidant flavonoidsfrom the rhizomes of Helminthostachys zeylanica. Phytochemistry 64:1277-1283
Institute of Medicine, Food and Nutrition Board. 2005. Dietary ReferenceIntakes for Energy, Carbohydrate, Fiber, Fat, Fatty Acids,Cholesterol, Protein, and Amino Acids (Macronutrients). TheNational Academies Press, Washington, DC. doi:10.17226/10490.
Irawan D, Wijaya CH, Limin SH, Hashidoko Y, Osaki M, Kulu IP. 2006.Ethnobotanical study and nutrient potency of local traditionalvegetables in Central Kalimantan. Tropics 15 (4): 441-448
Ismail A, Marjan ZM, Foong CW. 2004. Total antioxidant activity andphenolic content in selected vegetables. Food Chem 87 (4): 581-586
Kaur C and Kapoor HC. 2002. Anti-oxidant activity and total phenoliccontent of some Asian vegetables. Int J Food Sci Technol 37 (2): 15
Laker MC. 2007. African leafy vegetables in South Africa. Water SA 33(3): 161-315
MacKinnon K, Hatta G, Halim H, Mangalik A. 2000. The Ecology ofKalimantan. Prenhallindo. Jakarta.
Nion YA, Agus Djaya A, Kadie EM, Lunne, Sumarlan. 2010. Ediblemushrooms of Central Kalimantan. Proceeding of Science NationalSeminar in FKIP-MIPA. Palangka Raya University, Palangka Raya, 7Agustus 2010 [Indonesian]
Odelaye OJ, Ade-Omowaye BIO, Adeomi VF. 2003. Influence of varietyon protein, fat contents and some physical characteristics of okraseed. J Food Eng 57: 111-114
Onyango MOA. 2003. Development and promotion of technologies forsustainable production and utilization of indigenous vegetables fornutrition security and wealth creation in Kenya. In: Urama K, FancisJ, Momanyi M, Ochugboju S, Ominde A, Ozor N, Manners G (eds.)Agricultural Innovations fo Sustainable Development. AfricanTechnology Policy Studies Network, Nairobi Kenya
Sarker B, Akther F, Ayman U, Sifa R, Jahan I, Sarker M, Chakma SK,Podder PK, Khatun Z, Rahmatullah M. 2012. Ethnomedicinalinvestigations among the Sigibe clan of the Khumi tribe of Thanchisub-district in Bandarban district of Bangladeesh. Amer-Eur J SustainAgric 6 (4): 378-386
Sengkhamparn N, Sagis LMC, de Vries R, Schols AA, Sajjaanantakul T,Voragen AGJ. 2010. Physicochemical properties of pectins from okra(Abelmochus esculentus (L) Moench. Food Hydrocoll 24: 35-41
Syiem D, Lyngdoh W. 2009. Effect of Gymnopetalum cochinchinensis onblood glucose level in normal and alloxan-induced diabetic mice.Pharmacologyonline 2: 728-738
Tee ES, Young SI, Ho SK, Mizura S. 1988. Determination of vitamin C infresh fruits and vegetables using the Dye-titration andmicrofluorometric methods. Pertanika 11 (1): 39-44

THIS PAGE INTENTIONALLY LEFT BLANK
A-1
Authors Index
Abdelreheem A 43Abedi T 89AlKhanjari SS 10Ammar MSA 43Arafat A 17Arisoesilaningsih E 37Begyom-Faghir M 89Belal A 43Boer C 95Bonde SR 55Borah D 67Borgohain J 79Bramandito A 17Budiharta S 37Chotimah HENC 106El-Gammal F 43El-Haddad K 43El-Mesiry G 43El-Nagerabi SAF 10Elshafie AE 10Fallah A 25Farag W 43Farida WR 95Faridi F 61Gade AK 55Haddadi-Moghaddam H 89
Hajizadeh G 61, 101Hojjati SM 25Hosseini SM 25Jalilvand H 101Kavosi MR 61, 101Kooch Y 25Kresnatita S 106Kumar R 67, 73, 79Madduppa HH 17Miranda Y 106Nassar M 43Orabi A 43Pandey S 67, 73Pourbabaei H 89Rai MK 55Rishi R 67Setyawan AD 1Shaaban A 43Siahaan AB 31Sinery AS 95Soejono 37Subhan B 17Sugiyarto 1Sutarno 1Tapwal A 67, 73, 79Wiryono 31

A-2
Subject Index
Ahe Island 95, 96, 97, 98, 99Al-Jabal Al-Akhdar 10, 11, 12AMF 67, 68, 69, 70, 71anthropogenic 17, 19, 26, 89aquaculture 43artificial reefs 43, 45, 47, 48, 49, 50, 51behavior 101biodiversity 2, 10, 11, 12, 13, 14, 15, 17, 18,
23, 41, 43, 44, 51, 73, 77, 79,106
bulk density 25, 27, 28, 29carpophores 79, 83, 86Central Kalimantan 106, 107, 108, 109, 110coal mined 31, 32, 33, 34, 35coral transplantation 43, 44, 48, 49, 51crust 61, 65cuscus populations 95, 96, 98decomposition 25, 79, 80, 81degraded areas 37, 41egg masses 101, 102, 103, 104endophytic fungi 10, 11, 12, 13, 14, 15endosperm 61ethnobotany 106, 109Fagus orientalis 25, 26, 29, 89, 91, 92feed resources 95fish-habitat association 17fungal 10, 11, 12, 13, 14, 55, 56, 57,
61, 67, 70, 71, 73, 75, 76, 77,78, 79, 80, 81, 83, 86
Fusarium 10, 12, 13, 14, 55, 56, 57, 58,59, 60, 62, 63, 65, 66, 79, 82,83, 86
gap size 89, 90, 91, 92, 93genetic diversity 44, 55, 56, 57, 60gypsy moth 101, 102, 103, 104, 105Hyrcanian forest 25, 26, 27, 29, 61, 62, 66, 101,
102, 103, 104indigenous 10, 34, 106, 107, 108, 110Java 1, 2, 4, 5, 6, 7, 8, 17, 18, 38Jeypore Reserve Forest 73, 74, 75, 76, 78leaf litter 25, 79, 80, 81, 82, 83, 101
Lymantria dispar 101, 102, 103, 104, 105macrofungi 73, 74, 75, 76, 79, 81, 82, 83mariculture 43, 44, 49moisture 25, 27, 28, 29, 75, 81, 83, 92,
108, 110Mount Lawu 1, 2, 3, 4, 5, 7multivariate analysis 17, 19, 22mycorrhiza 31, 67, 70, 71, 73, 74, 75, 76,
79, 80nursery 43, 47, 48, 49, 51nutritional value 74, 78, 106old trees 25, 27, 28Oman 10, 11, 12, 13, 14oviposition 101, 102, 103, 104Papua 95, 96plant diversity 1, 41, 89plant species 11, 13, 14, 33, 70, 73, 89, 90,
91, 92, 93, 95, 101, 106, 108Quercus castaneifolia 61, 62, 66, 102RAPD 55, 56, 57, 58, 59, 60rehabilitation 37, 39, 40, 41, 43, 44, 45, 49RFRI 79, 80, 81, 82, 83root colonization 67, 70seed 39, 40, 61, 62, 63, 65, 66, 106,
107, 109, 110soil texture 25, 26, 27, 29species diversity 1, 2, 4, 5, 13, 17, 19, 21, 22, 25,
26, 33, 33, 37, 40, 75, 89, 90,91, 92, 93
species-specificity 10, 11, 14spring 6, 7, 14, 37, 38, 39, 40, 41, 101taxonomy 1, 57, 75, 81tissue 10, 12, 13, 14, 43, 48, 51, 61tree diversity 37understory 31, 33, 34, 35UPGMA 55, 57, 58, 59vegetables 57, 106, 107, 108, 109, 110wild edible tuber 67, 68, 70Z. hajanensis 10, 11, 12, 13, 14Ziziphus spina-christi 10, 11, 12, 13, 14

A-3
List of Peer Reviewers
Ahmad Dwi Setyawan Department of Biology, Faculty of Mathematics and Natural Sciences, Sebelas MaretUniversity. Surakarta 57126, Central Java, Indonesia
Amir Hamidy Zoology Division, Research Center for Biology, Indonesian Institute of Sciences (LIPI),Cibinong Bogor 16911, West Java, Indonesia
Dharmendra K. Gupta Departamento de Bioquimica, Biologia Cellular y Molicular de Plantas, EstacionExperimental Del Zaidin, CSIC, Apartado 419, Granada 18008, Spain
Fahmi Research Centre for Oceanography, Indonesian Institute of Sciences (LIPI), Jakarta14430, Indonesia
Hassan Pourbabaei Department of Forestry, Faculty of Natural Resources, University of Guilan, Somehsara,P.O. Box 1144, Iran.
Irvan Sidik Zoology Division, Research Center for Biology, Indonesian Institute of Sciences (LIPI),Cibinong Bogor 16911, West Java, Indonesia
Kiomars Sefidi Department of Range and Watershed Management, Faculty of Agriculture, University ofMohaghegh Ardabili, Ardabil, Iran
Leena Hamberg Finnish Forest Research Institute, P.O. Box 18 (Jokiniemenkuja 1), FI-01301, Vantaa,Finland
Mahendra K. Rai Department of Biotechnology, Sant Gadge Baba (SGB) Amravati University, Amravati444602, Maharashtra, India
María de los Ángeles LaTorre-Cuadros
Departamento de Manejo Forestal, Facultad de Ciencias Forestales, Universidad NacionalAgraria La Molina, Peru
Mirza Dikari Kusrini Department of Forest Resources Conservation and Ecotourism, Faculty of Forestry, BogorAgricultural University, Darmaga Campus, West Java, Indonesia
Mousa Najafiniya Jiroft and Kahnooj Center for Agricultural Research, P.O. Box 78615-115, Jiroft, Iran
Nataša Radić Celica, Biomedical Center, Technology Park, Ljubljana, Slovenia.
Rajesh Kumar Rain Forest Research Institute, P.O. Box 136, Jorhat 785001, Assam, India.
Rui Jorge Miranda Rocha Departamento de Biologia, Centro de Estudos do Ambiente e do Mar (CESAM),Universidade de Aveiro, Campus de Santiago, 3810-193 Aveiro, Portugal
Showket Ahmed Pala Department of Botany, Faculty of Biological Sciences, University of Kashmir, Hazratbal,Srinagar 190006, Jammu and Kashmir, India.
Suman Sankar Birbal Sahni Institute of Palaeobotany (BSIP), 53 University Road, Lucknow 226007,Uttar Pradesh, India.
Sutarno Department of Biology, Faculty of Mathematics and Natural Sciences, Sebelas MaretUniversity. Surakarta 57126, Central Java, Indonesia
Sutomo Bali Botanic Garden, Indonesian Institute of Sciences, Candikuning, Baturiti, Tabanan82191, Bali, Indonesia.
Tytti Sarjala Finnish Forest Research Institute, Kaironiementie 15, FI-39700 Parkano, Findland
Wiryono Department of Forestry, Faculty of Agriculture, University of Bengkulu. Bengkulu38371A, Bengkulu, Indonesia.
Xiao-Long Yang College of Pharmaceutical Science, Hebei University, Baoding 071002, P.R. China
A-4
Table of Contents
Vol. 14, No. 1, Pp. 1-53, April 2013
SPECIES DIVERSTYSpecies diversity of Selaginella in Mount Lawu, Java, IndonesiaAHMAD DWI SETYAWAN, SUTARNO, SUGIYARTO
1-9
ECOSYSTEM DIVERSTYEndophytic fungi associated with Ziziphus species from mountainous area of Oman and new recordsSAIFELDIN A.F. EL-NAGERABI, ABDULQADIR E. ELSHAFIE, SULEIMAN S. ALKHANJARI
10-16
Dynamics of fish diversity across an environmental gradient in the Seribu Islands reefs off JakartaHAWIS H. MADDUPPA, BEGINER SUBHAN, DONDY ARAFAT, ADITYA BRAMANDITO
17-24
Variability of soil physical indicators imposed by beech and hornbeam individual trees in a local scaleYAHYA KOOCH, SEYED MOHSEN HOSSEINI, SEYED MOHAMMAD HOJJATI, ASGHAR FALLAH
25-30
Species composition of understory vegetation in coal mined land in Central Bengkulu, IndonesiaWIRYONO, ARIF BUHA SIAHAAN
31-36
Proposing local trees diversity for rehabilitation of degraded lowland areas surrounding springsSOEJONO, SUGENG BUDIHARTA, ENDANG ARISOESILANINGSIH
37-42
REVIEWReview: Current trends in coral transplantation – an approach to preserve biodiversityMOHAMMED S.A. AMMAR, FAHMY EL-GAMMAL, MOHAMMED NASSAR, AISHA BELAL,WAHID FARAG, GAMAL EL-MESIRY, KHALED EL-HADDAD, ABDELNABY ORABI, ALIABDELREHEEM, AMGAD SHAABAN
43-53
Vol. 14, No. 2, Pp. 55-111, October 2013
GENETIC DIVERSTYGenetic diversity among fourteen different Fusarium species using RAPD markerSHITAL R. BONDE, ANIKET K. GADE, MAHENDRA K. RAI
55-60
ECOSYSTEM DIVERSTYFungal species isolated from Quercus castaneifolia in Hyrcanian Forests, North of IranMOHAMMAD REZA KAVOSI, FERIDON FARIDI, GOODARZ HAJIZADEH
61-66
Observations on arbuscular mycorrhiza associated with important edible tuberous plants grown in wetevergreen forest in Assam, IndiaRAJESH KUMAR, ASHWANI TAPWAL, SHAILESH PANDEY, RAJA RISHI, DEVAPOD BORAH
67-72
Diversity and frequency of macrofungi associated with wet ever green tropical forest in Assam, IndiaASHWANI TAPWAL, RAJESH KUMAR, SHAILESH PANDEY
73-78
Fungal diversity associated with bamboo litter from Bambusetum of Rain Forest Research Institute,Northeast IndiaRAJESH KUMAR, ASHWANI TAPWAL, JAYASREE BORGOHAIN
79-88
Effect of gap size of selective cutting method on plant species diversity and composition in beech (Fagusorientalis) forests, Ramsar, Mazandaran Province, North of IranHASSAN POURBABAEI, HAMIDREZA HADDADI-MOGHADDAM, MARZIEH BEGYOM-FAGHIR,TOOBA ABEDI
89-94
Cuscus population dynamics in tourist island of Ahe, District of Nabire, PapuaANTON SILAS SINERY, CHANDRADEWANA BOER, WARTIKA ROSA FARIDA
95-100

A-5
Evolution of oviposition behavior in gypsy moth (Lymantria dispar) in Hyrcanian forests, North of IranGOODARZ HAJIZADEH, MOHAMMAD REZA KAVOSI, HAMID JALILVAND
101-105
ETHNOBIOLOGYEthnobotanical study and nutrient content of indigenous vegetables consumed in Central Kalimantan,IndonesiaHASTIN E.N.C. CHOTIMAH, SUSI KRESNATITA, YULA MIRANDA
106-111

A-6
THIS PAGE INTENTIONALLY LEFT BLANK
GUIDANCE FOR AUTHORS
Aims and Scope ”Biodiversitas, Journal of Biological Diversity” or Biodiversitas encourages submission of manuscripts dealing with all biodiversity aspects of plants, animals and microbes at the level of gene, species, and ecosystem.
Article types The journal seeks original full-length research papers, reviews, and scientific feedback (short communication) about material previously published.
Acceptance The only articles written in English (U.S. English) are accepted for publication. Manuscripts will be reviewed by managing editor, communicating editor and invited peer review according to their disciplines. Authors will generally be notified of acceptance, rejection, or need for revision within 2 to 3 months of receipt. Manuscript is rejected if the content is not in line with the journal scope, dishonest, does not meet the required quality, written in inappropriate format, has incorrect grammar, or ignores correspondence in three months. The primary criteria for publication are scientific quality and biodiversity significance. The accepted papers will be published in a chronological order. This journal periodically publishes in January, April, July, and October.
Uncorrection proofs will be sent to the corresponding author by e-mail as .doc or .docx files for checking and correcting of typographical errors. To avoid delay in publication, proofs should be returned in 7 days.
A charge The cost of each manuscript is IDR 250,000,- plus postal cost or IDR 150,000,- for SIB members. There is free of charge for non Indonesian author(s), but need to pay postal cost for hardcopy.
Reprints Two copies of journal will be supplied to authors; reprint is only available with special request. Additional copies may be purchased by order when sending back the uncorrection proofs by e-mail.
Submission The journal only accepts online submission, through e-mail to the managing editor at [email protected]; better to forward to one of the communicating editor for accelerating evaluation.. The manuscript must be accompanied with a cover letter containing the article title, the first name and last name of all the authors, a paragraph describing the claimed novelty of the findings versus current knowledge, and a list of five suggested international reviewers (title, name, postal address, email address). Reviewers must not be subject to a conflict of interest involving the author(s) or manuscript(s). The editor is not obligated to use any reviewer suggested by the author(s).
Copyright Submission of a manuscript implies that the submitted work has not been published before (except as part of a thesis or report, or abstract); that it is not under consideration for publication elsewhere; that its publication has been approved by all co-authors. If and when the manuscript is accepted for publication, the author(s) agree to transfer copyright of the accepted manuscript to Biodiversitas. Authors shall no longer be allowed to publish manuscript without permission. For the new invention, authors suggested to manage its patent before publishing in this journal.
Open access The journal is committed to free open access that does not charge readers or their institutions for access. Users are entitled to read, download, copy, distribute, print, search, or link to the full texts of the articles, as long as not for commercial purposes. For the new invention, authors are suggested to manage its patent before published. Preparing the Manuscript
Manuscript is typed at one side of white paper of A4 (210x297 mm2) size, in a single column, double space, 12-point Times New Roman font, with 2 cm distance step aside in all side. Smaller letter size and space can be applied in presenting table. Word processing program or additional software can be used, however, it must be PC compatible and Microsoft Word based. Names of sub-species until phylum should be written in italic, except for italic sentence. Scientific name (genera, species, author), and cultivar or strain should be mentioned completely at the first time mentioning it, especially for taxonomic manuscripts. Name of genera can be shortened after first mentioning, except generating confusion. Name of author can be eliminated after first mentioning. For example, Rhizopus oryzae L. UICC 524, hereinafter can be written as R. oryzae UICC 524. Using trivial name should be avoided, otherwise generating confusion. Mentioning of scientific name completely can be repeated at Materials and Methods. Biochemical and chemical nomenclature should follow the order of IUPAC-IUB, while its translation to Indonesian-English refers to Glossarium Istilah Asing- Indonesia (2006). For DNA sequence, it is better used Courier New font.
Symbols of standard chemical and abbreviation of chemistry name can be applied for common and clear used, for example, completely written butilic hydroxytoluene to be BHT hereinafter. Metric measurement use IS denomi- nation, usage other system should follow the value of equivalent with the denomination of IS first mentioning. Abbreviation set of, like g, mg, mL, etc. do not follow by dot. Minus index (m-2, L-1, h-1) suggested to be used, except in things like “per-plant” or “per-plot”. Equation of mathematics does not always can be written down in one column with text, for that case can be written separately. Number one to ten are expressed with words, except if it relates to measurement, while values above them written in number, except in early sentence. Fraction should be expressed in decimal. In text, it should be used “%” rather than “gratuity”. Avoid expressing idea with complicated
sentence and verbiage, and used efficient and effective sentence. Manuscript of original research should be written in no more than 25 pages (including tables and picture), each page contain 700-800 word, or proportional with article in this publication number. Invited review articles will be accommodated.
Title of article should be written in compact, clear, and informative sentence preferably not more than 20 words. Name of author(s) should be completely written. Running title is about five words. Name and institution address should be also completely written with street name and number (location), zip code, telephone number, facsimile number, and e-mail address. Manuscript written by a group, author for correspondence along with address is required. First page of the manuscript is used for writing above information.
Abstract should not be more than 200 words, written in English. Keywords is about five words, covering scientific and local name (if any), research theme, and special methods which used. Introduction is about 400-600 words, covering background and aims of the research. Materials and Methods should emphasize on the procedures and data analysis. Results and Discussion should be written as a series of connecting sentences, however, for manuscript with long discussion should be divided into sub titles. Thorough discussion represents the causal effect mainly explains for why and how the results of the research were taken place, and do not only re-express the mentioned results in the form of sentences. Concluding sentence should preferably be given at the end of the discussion. Acknowledgments are expressed in a brief.
Figures and Tables of maximum of three pages should be clearly presented. Title of a picture is written down below the picture, while title of a table is written in the above the table. Colored picture and photo can be accepted if information in manuscript can lose without those images. Photos and pictures are preferably presented in a digital file. JPEG format should be sent in the final (accepted) article. Author could consign any picture or photo for front cover, although it does not print in the manuscript. There is no appendix, all data or data analysis are incorporated into Results and Discussions. For broad data, it can be displayed in website as Supplement.
Citation in manuscript is written in “name and year” system; and is arranged from oldest to newest and from A to Z. The sentence sourced from many authors, should be structured based on the year of recently. In citing an article written by two authors, both of them should be mentioned, however, for three and more authors only the family (last) name of the first author is mentioned followed by et al., for example: Saharjo and Nurhayati (2006) or (Boonkerd 2003a, b, c; Sugiyarto 2004; El-Bana and Nijs 2005; Balagadde et al. 2008; Webb et al. 2008). Extent citation as shown with word “cit” should be avoided. Reference to unpublished data and personal communication should not appear in the list but should be cited in the text only (e.g., Rifai MA 2007, personal communication; Setyawan AD 2007, unpublished data). In the reference list, the references should be listed in an alphabetical order. Names of journals should be abbreviated according to the ISSN List of Title Word Abbreviations (www.issn.org/2-22661-LTWA-online.php).
APA style in double space is used in the journal reference as follow: Journal: Saharjo BH, Nurhayati AD (2006) Domination and composition structure
change at hemic peat natural regeneration following burning; a case study in Pelalawan, Riau Province. Biodiversitas 7: 154-158.
Book: Rai MK, Carpinella C (2006) Naturally occurring bioactive compounds.
Elsevier, Amsterdam. Chapter in book: Webb CO, Cannon CH, Davies SJ (2008) Ecological organization, biogeography and
the phylogenetic structure of rainforest tree communities. In: Carson W, Schnitzer S (eds) Tropical forest community ecology. Wiley-Blackwell, New York.
Abstract: Assaeed AM (2007) Seed production and dispersal of Rhazya stricta. 50th
annual symposium of the International Association for Vegetation Science, Swansea, UK, 23-27 July 2007.
Proceeding: Alikodra HS (2000) Biodiversity for development of local autonomous
government. In: Setyawan AD, Sutarno (eds) Toward mount Lawu national park; proceeding of national seminary and workshop on biodiversity conservation to protect and save germplasm in Java island. Sebelas Maret University, Surakarta, 17-20 July 2000. [Indonesian]
Thesis, Dissertation: Sugiyarto (2004) Soil macro-invertebrates diversity and inter-cropping plants
productivity in agroforestry system based on sengon. [Dissertation]. Brawijaya University, Malang. [Indonesian]
Information from internet: Balagadde FK, Song H, Ozaki J, Collins CH, Barnet M, Arnold FH, Quake
SR, You L (2008) A synthetic Escherichia coli predator-prey ecosystem. Mol Syst Biol 4: 187. www.molecularsystemsbiology.com
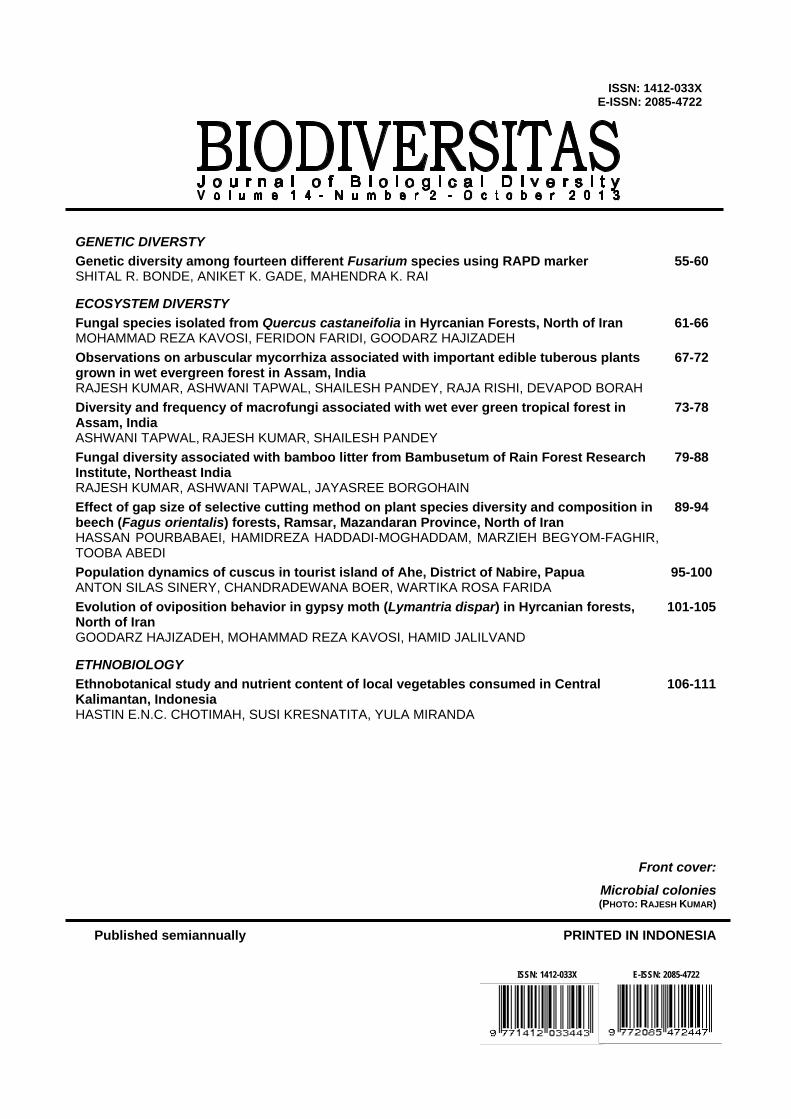
GENETIC DIVERSTY Genetic diversity among fourteen different Fusarium species using RAPD marker SHITAL R. BONDE, ANIKET K. GADE, MAHENDRA K. RAI
55-60
ECOSYSTEM DIVERSTY
Fungal species isolated from Quercus castaneifolia in Hyrcanian Forests, North of Iran MOHAMMAD REZA KAVOSI, FERIDON FARIDI, GOODARZ HAJIZADEH
61-66
Observations on arbuscular mycorrhiza associated with important edible tuberous plants grown in wet evergreen forest in Assam, India RAJESH KUMAR, ASHWANI TAPWAL, SHAILESH PANDEY, RAJA RISHI, DEVAPOD BORAH
67-72
Diversity and frequency of macrofungi associated with wet ever green tropical forest in Assam, India ASHWANI TAPWAL, RAJESH KUMAR, SHAILESH PANDEY
73-78
Fungal diversity associated with bamboo litter from Bambusetum of Rain Forest Research Institute, Northeast India RAJESH KUMAR, ASHWANI TAPWAL, JAYASREE BORGOHAIN
79-88
Effect of gap size of selective cutting method on plant species diversity and composition in beech (Fagus orientalis) forests, Ramsar, Mazandaran Province, North of Iran HASSAN POURBABAEI, HAMIDREZA HADDADI-MOGHADDAM, MARZIEH BEGYOM-FAGHIR, TOOBA ABEDI
89-94
Population dynamics of cuscus in tourist island of Ahe, District of Nabire, Papua ANTON SILAS SINERY, CHANDRADEWANA BOER, WARTIKA ROSA FARIDA
95-100
Evolution of oviposition behavior in gypsy moth (Lymantria dispar) in Hyrcanian forests, North of Iran GOODARZ HAJIZADEH, MOHAMMAD REZA KAVOSI, HAMID JALILVAND
101-105
ETHNOBIOLOGY
Ethnobotanical study and nutrient content of local vegetables consumed in Central Kalimantan, Indonesia HASTIN E.N.C. CHOTIMAH, SUSI KRESNATITA, YULA MIRANDA
106-111
Front cover: Microbial colonies
(PHOTO: RAJESH KUMAR)
Published semiannually PRINTED IN INDONESIA
ISSN: 1412-033X E-ISSN: 2085-4722
E-ISSN: 2085-4722 ISSN: 1412-033X