biodiversity - de anza college
TRANSCRIPT

Community Ecology: Biodiversity
Heyer 1
Biodiversity
Levels of biological diversity
• Population – Genetic heterozygosity &
allelic frequencies – Age structure
• Communty – Species richness – Relative abundances – Distribution & dispersal
• Landscape – Patchiness – Ecotones
Biodiversity
• Species richness = # species/area
• Relative abundance = proportion of total diversity taken up by a few dominant species
• ñspecies richness + òrelative abundances ðñbiodiversity stability
N.Am. bird species diversity
Two communities can have the same species richness, but a different relative abundance
• A community with an even species abundance is more diverse than one in which one or two species are abundant and the remainder rare
Figure 54.9
Community 1 A: 25% B: 25% C: 25% D: 25%
Community 2 A: 80% B: 5% C: 5% D: 10%
D
C
B A
Estimating Community Diversity • Shannon Diversity Index (H)
Estimating Community Diversity • Shannon Diversity Index
Community 1 A: 25% B: 25% C: 25% D: 25%
Community 2 A: 80% B: 5% C: 5% D: 10%
D
C
B A
A: (0.25 x ln 0.25) B: (0.25 x ln 0.25) C: (0.25 x ln 0.25) D: (0.25 x ln 0.25) ------------------------ ∑ = 1.39 = H
A: (0.80 x ln 0.80) B: (0.05 x ln 0.05) C: (0.05 x ln 0.05) D: (0.10 x ln 0.10) ------------------------ ∑ = 0.71 = H
Dominant Species
• Vegetation with the highest density and/or biomass
redwoods

Community Ecology: Biodiversity
Heyer 2
Effects of biodiversity on community productivity & stability
>20 year-study at Cedar Creek Ecosystem Science Reserve, MN • manipulate vegetation diversity
ñ Plant diversity è ñ Productivity (biomass) ñ Stability
ü Consistent productivity ü Withstand/recover from environmental stress ü Resist invasive species
In addition to habitat complexity, other major factors related to
community diversity: • Climate
– especially water availability
(b) Vertebrates
500 1,000 1,500 2,000
Potential evapotranspiration (mm/yr)
10
50
100
200
Verte
brat
e sp
ecie
s ric
hnes
s (lo
g sc
ale)
1
100 300 500 700 900 1,100
180
160
140
120
100
80
60
40
20
0
Tree
spe
cies
rich
ness
(a) Trees Actual evapotranspiration (mm/yr)
Figure 53.25
In addition to habitat complexity, other major factors related to
community diversity: • Available geographical area for the community
Figure 54.26
Species-area curve (log-log) S=cAz
S: # spp. c: constant A: area Z: slope of line = rate of Δ S
Num
ber o
f bird
spe
cies
(lo
g sc
ale)
Area of island (mi2) (log scale)
1,000
100
10
1 1 10 102 103 104 105
Biodiversity Hot Spots • A biodiversity hot spot is a relatively small area with an
exceptional concentration of endemic species and a large number of endangered and threatened species
• Particularly resulting from habitat destruction. • Most impacted biomes:
– Tropical rain forest – Chaparral
Terrestrial biodiversity hot spots
Equator
Figure 55.17
“On a global basis...the two great destroyers of biodiversity are:
1. habitat destruction, and
2. invasion by exotic species”
• The Nature Conservancy / University of California, Davis Wildland Invasive Species Team
• http://tncweeds.ucdavis.edu
Invasive Introduced Species
European bull thistle in Yosemite National Park
THE PROBLEM OF INTRODUCED SPECIES
• Zebra mussels • Introduced from Caspian Sea • Ballast water • 750,000 per m2
• Reduce phytoplankton levels • Loss of fish • Cover every
hard surface • Clogged
water intake pipes

Community Ecology: Biodiversity
Heyer 3
Invasive Introduced Species Terms: • Weed: an organism growing in a given area where it is not wanted by
humans. May be native or non-native. • Introduced / Non-native / Exotic / Alien / Non-indigenous: species
introduced to an area outside their original range by human activity — directly or indirectly / intentionally or unintentionally.
• Invasive: non-native species that spreads from its site of introduction into new areas. – Some authors limit this definition to those species having a
measurable effect on native wild communities. – By either definition, only a tiny fraction of the tens of thousands of
introduced species to North America are invasive. • Noxious: legally designated as a pest species by governmental agency.
Invasive?
• Berteroa incana is native to Eurasia but now widespread in grasslands in North America. However, it is rarely if ever abundant in wildlands and not known to have negative impacts on biodiversity.
Invasive Introduced Species • Community and Population Level Impacts
- Vegetation structure - Community composition - Resource competition - Negative impacts on native animals - Promotion of non-native invasive animals - Population reductions, eliminations - Reduced recruitment of natives (succession) - Hybridization with native species
• Ecosystem Level Impacts - Disturbance regimes (i.e. fires)
- Hydrology - Geomorphological processes (i.e. erosion, sedimentation) - Soil chemistry (i.e. nutrients, salinity, pH)
Changed vegetation structure
• Scotch broom (Cytisus scoparius, the dark green shrub) invades grasslands and marshes, converting them to shrublands.
• Pampas grass (Cortaderia selloana and C. jubata) invade coastal sage scrub and maritime chaparral communities along the California coast converting them to alien grasslands.
Changed vegetation structure Change in coastal community invaded by pampas grass
Community Ecology: Biodiversity
Heyer 4
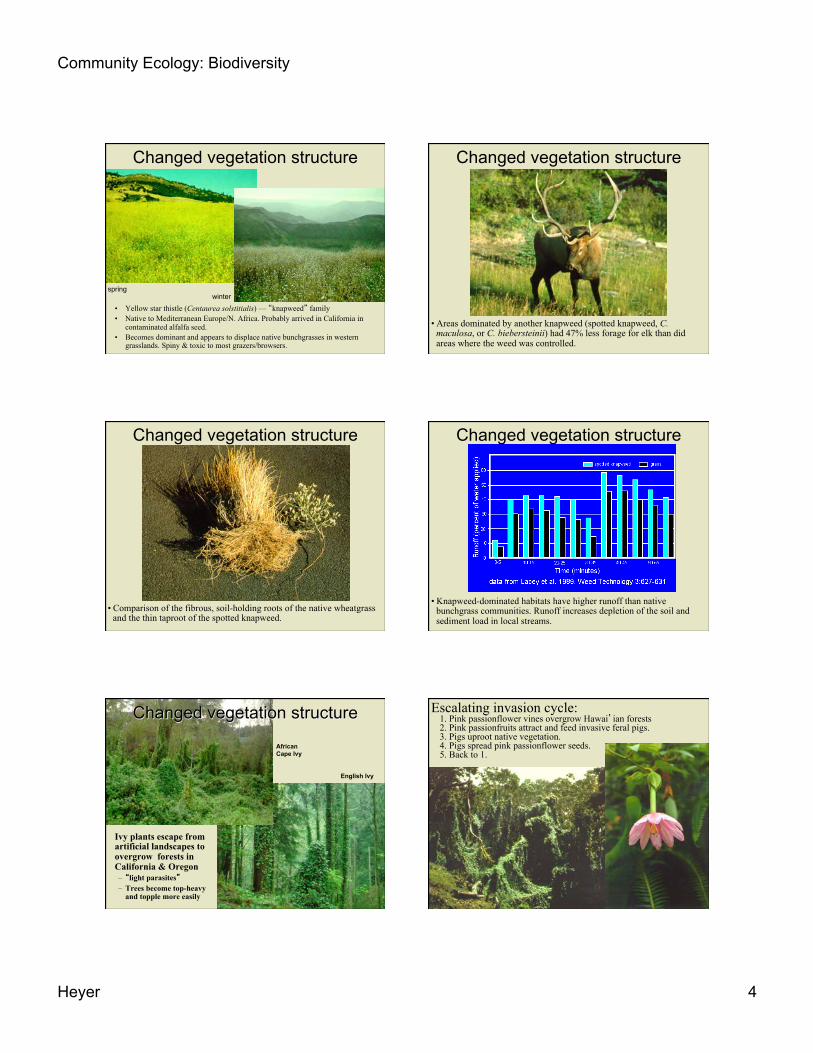
Changed vegetation structure
• Yellow star thistle (Centaurea solstitialis) — “knapweed” family • Native to Mediterranean Europe/N. Africa. Probably arrived in California in
contaminated alfalfa seed. • Becomes dominant and appears to displace native bunchgrasses in western
grasslands. Spiny & toxic to most grazers/browsers.
spring winter
Changed vegetation structure
• Areas dominated by another knapweed (spotted knapweed, C. maculosa, or C. biebersteinii) had 47% less forage for elk than did areas where the weed was controlled.
Changed vegetation structure
• Comparison of the fibrous, soil-holding roots of the native wheatgrass and the thin taproot of the spotted knapweed.
Changed vegetation structure
• Knapweed-dominated habitats have higher runoff than native bunchgrass communities. Runoff increases depletion of the soil and sediment load in local streams.
Ivy plants escape from artificial landscapes to overgrow forests in California & Oregon – “light parasites” – Trees become top-heavy
and topple more easily
Changed vegetation structure
African Cape Ivy
English Ivy
Escalating invasion cycle: 1. Pink passionflower vines overgrow Hawai’ian forests 2. Pink passionfruits attract and feed invasive feral pigs. 3. Pigs uproot native vegetation. 4. Pigs spread pink passionflower seeds. 5. Back to 1.

Community Ecology: Biodiversity
Heyer 5
Altered ecosystems
Crystalline iceplant invades California coastal communities. It accumulates salts to the soil, preventing or retarding native species
Altered ecosystems
Southwestern desert plants, such as saguaro cactus, are usually widely spaced with no build up of leaf litter, therefore fires are rare and the native vegetation has little fire resistance. Non-native grasses such as this buffelgrass form nearly continuous cover which allows fires that spread rapidly, killing native cacti, shrubs and other perennials over large areas.
Altered ecosystems
• Saltcedar (Tamarix) invades and displaces desert riparian habitats. • It clogs stream beds altering erosion patterns. • Increased transpiration rates cause vital pools and streams to dry up. • Saltcedar foilage decomposes more rapidly removing the primary
productivity. Abundance and diversity of stream macroinvertebrates and fish decrerases significantly.
Altered ecosystems • Invasive aquatic plants can sharply reduce light levels and
dissolved oxygen concentrations in the waters they occupy.
Dissolved oxygen and light penetration in the Hudson River with native (Vallisneria) or invasive (Trapa) plant cover
Minimum DO2 for fish & invertebrate respiration
Altered ecosystems
Atlantic smooth cordgrass (Spartina alterniflora) has invaded mudflat communities in Pacific coast estuaries
• Encroaches further over mudflats than native cordgrass • Reduces tidal flow over saltmarsh

Community Ecology: Biodiversity
Heyer 6
Atlantic smooth cordgrass (Spartina alterniflora) hybridizes with native Pacific saltmarsh cordgrass (Spartina foliosa) – Local populations
eliminated as distinct species
• ! Spartina foliosa • ! Spartina alterniflora • ! Spartina hybrid
Altered gene pools Invasives from North America!
North American pines invading grassland and riparian habitat in southern Brazil
Deliberately Introduced Species Anthropogenic Loss of Diversity Community Stability
• Community stability may be due to lack of disturbance or community resistance or resilience in the face of disturbance
– Stability: Absence of change. – Resistance: Ability to maintain structure and
function in face of potential disturbance. – Resilience: Ability to recover from
disturbance.
Community Succession • Succession: The gradual change in community
structure, composition and distribution over time, generally following a significant disturbance to the environment.
• A disturbance is an event that changes a community – Removes organisms from a community – Alters resource availability
Community Succession • 1° succession is a change from a prebiotic to a biotic habitat
following a catastrophic disturbance. – The pioneer community is typified by rapid colonizing opportunistic (r-type)
species.
• 2° succession is the gradual replacement of opportunistic species by more specialized competitors.
• Stability is the end-product of succession when it is not interrupted by significant disturbances. – The climax community is a
stable association of dominant K-type specialists.
Time to climax recovery following disturbance

Community Ecology: Biodiversity
Heyer 7
Community Succession • 1° succession.
– Earliest pioneer species mostly lichens
• fungal/algal symbionts — Survive on sunlight, air moisture & dust
– Lichen acids + physical erosion ⇒ minimal soil ⇒ non-vascular mosses/liverworts
– Further erosion + organic detritus ⇒ more soil ⇒ herbaceous grasses & N-fixers
• Early 2° succession. – Grass fibrous roots stabilize soil
and moisture – N-fixation + organic deposition ⇒ ↑ quality & quantity of soil ⇒ ↓ “bulk density” of soil
Secondary Succession
Figure 54.22
Pioneer stage Glacier
Bay
Alaska
Kilometers 0 5 10 15
1760
1941 1907
1860 Dryas stage
Spruce stage Alder stage
1 2
3 4
Primary succession on moraines behind retreating glaciers
Primary succession on moraines behind retreating glaciers
• Pioneer community species may facilitate the appearance of later species by making the environment more favorable
Figure 54.23
(b) Dryas stage
(c) Spruce stage (d) Nitrogen fixation by Dryas and alder increases the soil nitrogen content.
Soi
l nitr
ogen
(g/m
2 )
Successional stage Pioneer Dryas Alder Spruce
0
10
20
30
40
50
60
(a) Pioneer stage, with fireweed dominant
• Glacier Bay, Alaska – Succession follows a
predictable pattern of change in vegetation and soil characteristics
McBride glacier retreating
0 5 10
Miles
Glacier Bay
Pleasant Is.
Johns Hopkins Gl.
Reid Gl.
Grand Pacific Gl.
Canada Alaska
1940 1912
1���899
1879
1879 1949 1879
1935
1760
1780 1830
1860
1913
1911
1892 1900
1879
1907 1948 1931 1941
1948
Case
men
t Gl. McB
ride
Gl.
Plateau Gl.
Muir Gl. Riggs Gl.
Primary succession on moraines behind retreating glaciers
– pattern of change in vegetation and soil characteristics
• Glacier Bay, Alaska
Succession of Vegetation ⇒ Succession of Community Community Succession
• You can see we’ve come full circle back to those life history concepts of r and K.
• Dunes in Indiana were the first place succession was studied: from sand dunes to invading grasses to low shrubs to birches to other hardwoods.
• Ponds and bogs will slowly fill with vegetation and transform into terrestrial habitat, eventually becoming forest.

Community Ecology: Biodiversity
Heyer 8
Community Succession — The Intermediate Disturbance Hypothesis • Although few species are hardy enough to pioneer the
colonization of a harsh, prebiotic habitat, most disturbances are not severe enough to reduce the environment to bare rock. Therefore most disturbances propagate only 2o succession.
• Climax communities are dominated by a few long-lived ultra-competitors which may limit species diversity.
• Therefore community diversity is greatest before the climax community is reached — while competitive interactions have not yet eliminated many of the species. – Disturbances, by preventing the climax community, may be
important for maintaining high species diversity in tropical reefs and forests.
Intermediate Disturbance Hypothesis stream ecology
Index of disturbance intensity (log scale) 0.9 1.0 1.1 1.2 1.3 1.4 1.5 1.6 1.7 1.8 1.9 2.0
Num
ber o
f tax
a
35
30
25
20
15
10
Figure 54.20
[flooding]
Intermediate Disturbance Hypothesis forest ecology Secondary succession following
FIRE • Fire is a significant disturbance in most
terrestrial ecosystems – It is often a necessity in some communities
(a) Before a controlled burn. A prairie that has not burned for several years has a high proportion of detritus (dead grass).
(b) During the burn. The detritus serves as fuel for fires.
(c) After the burn. Approximately one month after the controlled burn, virtually all of the biomass in this prairie is living.
Figure 53.21
Secondary succession following FIRE
• The large-scale fire in Yellowstone National Park in 1988
Figure 53.22
(a) Soon after fire. As this photo taken soon after the fire shows, the burn left a patchy landscape. Note the unburned trees in the distance.
(���b) One year after fire. This photo of the same general area taken the following year indicates how rapidly the community began to recover. A variety of herbaceous plants, different from those in the former forest, cover the ground.
Succession is not always predictable Variations in stages may result in different climax communities