biodiversity planning and design
TRANSCRIPT
Landscape Architecture Foundation
BIODIVERSITY PLANNING AND DESIGNS U S T A I N A B L E P R A C T I C E S
JACK AHERN,ELISABETH LEDUC, AND MARY LEE YORK

A B O U T I S L A N D P R E S S
Island Press is the only nonprofit organization in the United States whose principal purpose is the publi-
cation of books on environmental issues and natural resource management. We provide solutions-orient-
ed information to professionals, public officials, business and community leaders, and concerned citizens
who are shaping responses to environmental problems.
Since 1984, Island Press has been the leading provider of timely and practical books that take a mul-
tidisciplinary approach to critical environmental concerns. Our growing list of titles reflects our commit-
ment to bringing the best of an expanding body of literature to the environmental community through-
out North America and the world.
Support for Island Press is provided by the Agua Fund, The Geraldine R. Dodge Foundation,
Doris Duke Charitable Foundation, The Ford Foundation, The William and Flora Hewlett
Foundation, The Joyce Foundation, Kendeda Sustainability Fund of the Tides Foundation, The Forrest
& Frances Lattner Foundation, The Henry Luce Foundation, The John D. and Catherine T. MacArthur
Foundation, The Marisla Foundation, The Andrew W. Mellon Foundation, Gordon and Betty Moore
Foundation, The Curtis and Edith Munson Foundation, National Fish and Wildlife Foundation, Oak
Foundation, The Overbrook Foundation, The David and Lucile Packard Foundation, Wallace Global
Fund, The Winslow Foundation, and other generous donors.
The opinions expressed in this book are those of the author(s) and do not necessarily reflect the views
of these foundations.
A B O U T T H E L A N D S C A P E A R C H I T E C T U R E F O U N D A T I O N
The Landscape Architecture Foundation is a national nonprofit organization whose mission is the preser-
vation, improvement, and enhancement of the environment. LAF accomplishes its mission through infor-
mation, research, leadership development, and scholarship on sustainable landscape planning and design.
Sustainable land design provides a holistic, systemic way of integrating science, design, and tech-
nology to issues at the intersection of land, people, and nature and is relevant to critical issues such as
urban revitalization, transportation, public health and safety, affordable housing, cultural identity, and
water and air quality.
LAF’s purpose is to support design and planning solutions that preserve and conserve natural and
cultural resources and create safer, healthier, more livable communities.
ABOUT THE LAND AND COMMUNITY DES IGN CASE STUDY SER IES
The Landscape Architecture Foundation’s Land and Community Design Case Studies is a series of analytical
publications by contemporary scholars and practitioners about topical issues and actual places in which
design offers holistic solutions to economic, social, and environmental problems. The goal of the series is
to provide a legacy of critical thinking that will advance enlightened planning and development in the
classroom, in practice and in policy.

BI O D I V E R S I T Y PL A N N I N G A N D DE S I G N


BIODIVERSITY PLANNING AND DESIGN
S U S T A I N A B L E P R A C T I C E S
JA C K AH E R N
EL I Z A B E T H LE D U C
MA R Y LE E YO R K
WASHINGTON • COVELO • LONDON
© 2006 Island Press
All rights reserved under International and Pan-American Copyright Conventions.
No part of this book may be reproduced in any form or by any means without
permission in writing from the publisher:
Island Press, Suite 300, 1718 Connecticut Ave., NW, Washington, DC 20009
ISLAND PRESS is a trademark of the Center for Resource Economics.
Library of Congress Cataloging-in-Publication Data
Ahern, Jack (John F.)Biodiversity planning and design : sustainable practices / Landscape Architecture
Foundation ; Jack Ahern, Elizabeth Leduc, and Mary Lee York.p. cm.
Includes bibliographical references.ISBN-13: 978-1-59726-108-1 (cloth : alk. paper)ISBN-10: 1-59726-108-4 (cloth : alk. paper)ISBN-13: 978-1-59726-109-8 (pbk. : alk. paper)ISBN-10: 1-59726-109-2 (pbk. : alk. paper)
1. Biodiversity--Conservation. 2. Landscape design. 3. Restoration ecology. 4.Sustainable development. I. Leduc, Elizabeth. II. York, Mary Lee. III. Title.
QH75.A347 2006333.95'16--dc22
2006021688
Printed on recycled, acid-free paper
Design by Lyle Rosbotham
Manufactured in the United States of America
10 9 8 7 6 5 4 3 2 1
C O N T E N T S
C A S E S T U D Y M E T H O D S A N D D E S I G N 1
C H A P T E R 1
I N T R O D U C T I O N :
B I O D I V E R S I T Y P L A N N I N G A N D D E S I G N 3
C H A P T E R 2
W O O D L A N D P A R K Z O O 2 3
C H A P T E R 3
D E V E N S F E D E R A L M E D I C A L C E N T E R
C O M P L E X : S T O R M W AT E R P R O J E C T 3 7
C H A P T E R 4
C R O S S W I N D S M A R S H 4 7
C H A P T E R 5
W I L L A M E T T E VA L L E Y A LT E R N AT I V E
F U T U R E S P R O J E C T 5 7
C H A P T E R 6
F L O R I D A S TAT E W I D E G R E E N W AY S S Y S T E M
P L A N N I N G P R O J E C T 6 9
C H A P T E R 7
C O N C L U S I O N S A N D D I S C U S S I O N 7 9
A C K N O W L E D G E M E N T S 9 1
G L O S S A R Y 9 3
B I B L I O G R A P H Y 9 9
I N D E X 1 0 7


The research methods used in this study are based on the article “A Case Study Methodfor Landscape Architecture” (Francis 2001) and Yin’s methods (1994) for case studydesign and analysis. We also consulted the Land and Community Design Case StudySeries, jointly published by the Landscape Architecture Foundation (LAF) and IslandPress (Francis 2003a, 2003b; Schneider 2003). In this work, a range of case studyresearch methods were used, including structured interviews, document review, proj-ect review, field visits, and published literature. To gain a broader perspective on eachcase, a range of information sources were consulted, including landscape architectureand planning academicians, ecologists and conservation biologists, landscape architectpractitioners, and U.S. agency professionals.
This issue-based case study examined the topic of biodiversity from an applicationsperspective in both public and private landscape architecture and planning practice.Through a cross-case analysis method, the research analyzed strategies and approachesto biodiversity planning, design, restoration, and management. It considered biodiver-sity across a spectrum from statewide to individual project scales. The cases are pre-sented in a sequence from fine to broad scale, starting with site-based projects inWashington, Massachusetts, and Michigan, and then moving to river basin andstatewide planning efforts in Oregon and Florida.
R E S E A R C H P R O C E S S
The case study selection and analysis followed several specific steps: 1. Review biodiversity planning and design from multiple perspectives to deter-
mine definitions, trends, key questions, and planning and design strategies.2. Review literature on biodiversity and apply it for constructing research proposi-
tions to structure the case study design, protocol, and analysis. 3. Select projects to represent (a) a diversity of scales (alpha, beta, gamma), (b) mul-
tiple geographic contexts in the United States (Washington, Massachusetts,Michigan, Oregon, and Florida), (c) significant involvement of landscape archi-
C A S E S T U D Y M E T H O D S A N D
D E S I G N
2 | B I O D I V E R S I T Y P L A N N I N G A N D D E S I G N
tects and planners, and (d) projects that represent innovative work of high pro-fessional and academic standards.
4. Identify key individuals, organizations and applications for in-depth analysis ofeach project.
5. Gather evidence (conduct interviews, visit projects, literature review, and appli-cations research).
6. Analyze the case study evidence, and prepare a draft report for review andcomment.
7. Prepare the final case study, including illustrations.
C A S E S T U D Y P R O P O S I T I O N S
Preliminary research on biodiversity planning and design helped us to articulate fourresearch propositions. These propositions were designed to reflect key theoretical issuesand to raise important “how” and “why” questions about biodiversity planning anddesign. The propositions, listed below, were addressed in each case study and are dis-cussed in the concluding chapter.
1. Biodiversity planning is in demand in rural, suburban, and urban areas. 2. Landscape architects and planners will play a larger role in biodiversity planning
and restoration ecology as nondegraded habitat becomes scarce. 3. Biodiversity goals that are explicitly part of a project’s goal or design process are
more likely to be achieved.4. Integrating biological and ecological information with the planning and design
process will contribute to a better balance between land use and the naturalenvironment and will increase public awareness of biodiversity’s value to humans.
The state of biodiversity is of increasing concern around the world. Considerable agree-ment exists among scientists that habitat loss and degradation are among the leadingcauses of global biodiversity decline. Renowned entomologist and champion of biodi-versity awareness E. O. Wilson (1988, 3) claims: “Overall we are locked into a race.We must hurry to acquire the knowledge on which a wise policy of conservation anddevelopment can be based for centuries to come.”
If habitat loss is the leading cause of biodiversity decline, it follows that planningand design will be essential in any viable solution by directly conserving, protecting,or managing landscapes and habitats. Planners set policy and make plans to organizeland use to meet multiple goals. Landscape architects create designs that are realizedin physical form, affecting protection, change, and restoration of land and habitat.Landscape architects and planners engage biodiversity by working independently or ininterdisciplinary teams that include conservation biologists, restoration ecologists, andnatural and social scientists. Some of these teams have very successfully addressed bio-diversity across a range of scales and geographical contexts.
As part of its case study series, the Landscape Architecture Foundation (LAF) spon-sored this issue-based research into how landscape architects and planners have addressedbiodiversity in their work. This case study undertook to learn how biodiversity fits withother goals in professional planning and design work; the role(s) of landscape architectsand planners in interdisciplinary teams; and strategies for moving forward with biodiver-sity planning and design when faced with uncertainty and incomplete knowledge. Thestudy includes five biodiversity planning and design projects, arranged into a compara-tive, issue-based case study representing a range of scales and geographic locations acrossthe United States. The projects include the following:
• The Woodland Park Zoo’s long-range plan, by Jones & Jones, Architects andLandscape Architects, in Seattle, Washington.
• A storm water management and wetland restoration project by Carol R.Johnson and Associates in Devens, Massachusetts.
C H A P T E R 1
I N T R O D U C T I O N :B I O D I V E R S I T Y
P L A N N I N G A N DD E S I G N
• The Crosswinds Marsh Wetland Mitigation project, in Wayne County,Michigan, by the Smith Group/JJR of Ann Arbor, Michigan.
• The Willamette River Basin Study in Oregon, by University of Oregon landscape architect David Hulse and colleagues.
• The Florida Statewide Greenways System Planning Project, by the Universityof Florida Department of Landscape Architecture.
Our research found that biodiversity planning best succeeds when it is integratedwith other goals, including environmental education, environmental impact mitiga-tion, and regulatory compliance. Achieving multiple goals requires an interdisciplinaryapproach, and planners and designers often excel in leading such teams. Landscapearchitects and planners offer the ability to synthesize and visualize complex information,a familiarity with construction processes, skills in facilitating public participation, andexpertise in implementing and managing projects. Additionally, the case study foundthat, although important, biodiversity is often a secondary or minor project goal inplanning and design projects. It becomes more important in broad-scale, public policy-related projects and when mandated by regulatory and permitting agencies.
Data for planning and designing biodiversity projects are often incomplete forexplicitly supporting planning and design decisions—an inherent problem related tothe site- and species-specific nature of the data required. Despite the lack of gooddata, however, monitoring has rarely been conducted, due mostly to cost and conven-ience. This limits the ongoing involvement of landscape architects and planners in theprojects they conceive, design, and build and thus to learn if the intended results wereachieved. The lack of monitoring misses opportunities to (1) contribute new knowl-edge to science, (2) afford planners and designers the chance to expand their interdis-ciplinary collaboration with scientists and decision makers, and (3) “to learn bydoing” to develop and refine planning strategies and design responses to address bio-diversity more effectively.
Biodiversity is implicit in virtually all of the work of planners and landscape archi-tects, and many signs point toward increased global interest and support for biodiver-sity planning. Both disciplines—planning and landscape architecture—include prin-ciples guiding the treatment of the natural environment in the ethical codes put forthby their professional societies. Landscape architects are expected to uphold values ofenvironmental stewardship, especially as described in section ES1.13 in the AmericanSociety of Landscape Architects’ (ASLA) Code of Environmental Ethics: “The princi-ples of land use planning and design and the principles of wildlife habitat protectionshould be integrated to promote the enhancement, protection, and management oflandscapes that promote wildlife” (American Society of Landscape Architects 2000, 1).
Similarly, the American Planning Association outlines its “Ethical Principles inPlanning” to guide the behavior of both certified planners and all other working plan-ners. Included in these principles is the statement that planners must “strive to pro-tect the integrity of the natural environment” (American Planning Association 1992,
4 | B I O D I V E R S I T Y P L A N N I N G A N D D E S I G N
I N T R O D U C T I O N : B I O D I V E R S I T Y P L A N N I N G A N D D E S I G N | 5
1). Biodiversity planning and design are central issues for the Society of EcologicalRestoration International, which states the following as part of its mission: “to pro-mote ecological restoration as a means of sustaining the diversity of life on Earth andreestablishing an ecologically healthy relationship between nature and culture”(Society for Ecological Restoration International 2004).
Biodiversity represents a significant growth opportunity for planning and designprofessionals. To become more active players, landscape architects and planners need to:become more familiar with the issues, terminology, and methods for biodiversity plan-ning and design; understand the complex issue of representative species selection andhow to apply a method in the context of species/habitat associations and ecological mod-els; and to develop advanced skills for leading interdisciplinary teams. By examininghow planners and designers have been involved in five specific projects in the UnitedStates and by identifying areas of strength and points of weakness, this study seeks toidentify specific ways these professionals can participate in and contribute to biodiver-sity conservation. The study is intended to not only encourage design and planning pro-fessionals to take a more active role in projects that involve biodiversity issues but alsoto better inform them about biodiversity and conservation efforts in general.
D E F I N I T I O N S O F B I O D I V E R S I T Y
Biodiversity has many definitions in the current literature written by independentresearchers, government agencies, and international organizations. The differencesamong the definitions emphasize the complexity of the issue. Some include detailed spa-tial or temporal considerations, whereas others are quite simple. For example, theKeystone Center (1991, 2) describes biodiversity as “the variety of life and its processes,”while biologist B. A. Wilcox (1982, 640) calls it “the variety of life forms, the ecologi-cal roles they perform, and the genetic diversity they contain.” These simple definitionsrecognize that both the quantity of species and the ecological processes that affect thosespecies are important. Conservation biologists R. F. Noss and A. Y. Cooperrider (1994,5) extend the Keystone Center’s definition to say: “Biodiversity is the variety of life andits processes. It includes the variety of living organisms, the genetic differences amongthem, the communities and ecosystems in which they occur, and the ecological and evo-lutionary processes that keep them functioning, yet ever changing and adapting.”
Similarly, the U.S. National Biological Information Infrastructure (NBII), anorganization composed of a wide array of federal, state, international, nongovernmental,academic, and industry partners, states that “biodiversity or biological diversity is thesum total of the variety of life and its interactions and can be subdivided into 1) genet-ic diversity, 2) species diversity, and 3) ecological or ecosystem diversity” (NBI I 2003).In 1992 the World Resources Institute, the World Conservation Union (otherwiseknown as the IUCN, or International Union for Conservation of Nature and NaturalResources), and the United Nations Environment Programme (UNEP) produced ajoint publication, Global Biodiversity Strategy, in which biodiversity is defined as “the
6 | B I O D I V E R S I T Y P L A N N I N G A N D D E S I G N
variability among living organisms from all sources, including, inter alia, terrestrial,marine and other aquatic ecosystems and the ecological complexes of which they arepart; this includes diversity within species, between species and of ecosystems” (WRI,1992). Global Biodiversity Strategy further characterizes these three categories:
1. Genetic, or alpha, diversity is concerned with the variation of genes withinspecies, including separate populations of the same species or genetic disparitywithin populations.
2. Species, or beta, diversity refers to the variety of species within a region, whilespecies diversity can be measured in many ways; the number of species in an area,or species richness, is often used. Species diversity is also thought of in terms oftaxonomic diversity, which considers the relationship of one species to another.
3. Ecosystem, or gamma, diversity refers to numbers of species in a particular loca-tion, the ecological functions of the species, the manner in which the composi-tion of the species varies within a region, the associations of species in particu-lar areas, and the processes within and between these ecosystems. Ecosystemdiversity extends to the landscape and biome level.
One of the first scientists to address the issue of scale when measuring species rich-ness was noted ecologist Robert Whittaker, who suggested thinking about speciesdiversity in terms of alpha, beta, and gamma levels: alpha diversity referred to thespecies in a small, well-defined area, such as a study plot; beta diversity addressed thediversity of species between habitats, such as along a gradient; and gamma diversitywas a tally of the number of species over landscapes or vast geographic areas(Whittaker 1975). Likewise, landscape ecologist Sheila Peck (1998) suggests that bio-diversity can be characterized according to four different levels of biological organiza-tion: landscape, community, population, and genetic.
Some organizations and researchers include temporal and evolutionary aspects of biodiversity in their definitions. For instance, the broad definition put forth by TheNature Conservancy (TNC) and the Association for Biodiversity Information in theirjoint project Precious Heritage: The Status of Biodiversity in the United States not onlyincludes references to genes, species, and ecosystems but expands to say that “biodiversi-ty also encompasses the processes—both ecological and evolutionary—that allow life onEarth to continue adapting and evolving” (Groves et al. 2000, 7). This temporal compo-nent also surfaces in Peck’s definition of biodiversity as “not only the range of variationthat can be seen today, but that which is expressed over a period of time” (Peck 1998, 17).
The definitions above show three principal similarities: (1) biodiversity exists andneeds to be understood at multiple scales, (2) biodiversity is inseparable from its phys-ical environment, and (3) biodiversity is integral with ecological processes. For thisstudy, we have integrated these similarities into the following working definition:Biodiversity is the totality, over time, of genes, species, and ecosystems in an ecosystem or region,including the ecosystem structure and function that supports and sustains life.

T H E S T A T U S O F B I O D I V E R S I T Y —
M E A S U R E M E N T A N D T R E N D S
Whether or not such issues as spatial or temporal contexts or accompanying ecologicalprocesses are addressed, a general consensus exists that, at the very least, the concept ofbiodiversity rests on baseline knowledge of the number of species that exist on earth. Thisitself is a controversial topic; estimates of the number of species span orders of magnitude,ranging widely according to the method of calculation and the data used. E. O. Wilson(1988) suggests that the true number of species ranges anywhere from 5 to 30 million. In1982, Terry L. Erwin’s (1982) method of gassing and collecting insects from select treesin a Panamanian rain forest lead him to propose that, worldwide, there are 30 millionspecies of tropical arthropods alone. Basing his estimates on the assumption that an inverserelationship exists between the numbers of species and body size, University of Oxfordzoologist Robert M. May (1988) estimated global species richness to be between 10 and50 million species. In 1995, the United Nations Environment Programme (UNEP) esti-mated that there are 13.6 million species on earth (Hammond 1995). This figure—whichis very close to that of 13.4 million species proposed by Nigel Stork (1999) for the “LivingPlanet in Crisis” conference sponsored by the American Museum of Natural History in1995—is currently considered an acceptable working estimate.
Ironically, biologists have the least information about the groups that are mostcommon, such as insects. Currently, most “named” species are vertebrate and plantspecies, while the number of insect species is yet unknown. The best estimate of thetotal number of insect species on earth is 8.75 million, while only about 1.025 million(12 percent) have been named (see Table 1.1). In contrast, 4,650, or 97 percent, of theestimated 4,800 total number of mammal species have been named (Gibbs 2001).
I N T R O D U C T I O N : B I O D I V E R S I T Y P L A N N I N G A N D D E S I G N | 7
Estimated Worldwide Total Total Number Currently Named Percent
All Species 8,750,000 1,025,000 12
Mammals 4,800 4,650 97
In response to such uncertainties, efforts to catalog species diversity are ongoing atglobal, national, and regional scales. On a global scale, the World Conservation Unionhas an initiative to evaluate the status of more than one hundred thousand species in afive year period (World Conservation Union–IUCN 2000). This organization has beenworking for forty years to assess the global conservation status of species in order todraw attention to taxa threatened with extinction. One product of this assessment isthe Red Book program, formed to reduce global extinction rates by making an indexof biodiversity loss worldwide and by identifying species at the highest risk (WorldConservation Union–IUCN 2001). By comparing the results from the year 2000 RedList of Endangered Species with those from the 1996 Red List, the World ConservationUnion found that the severity of the extinction crisis was actually worse than had been
Table 1.1. Named vs.Unnamed Global Species. Source: Gibbs 2001.
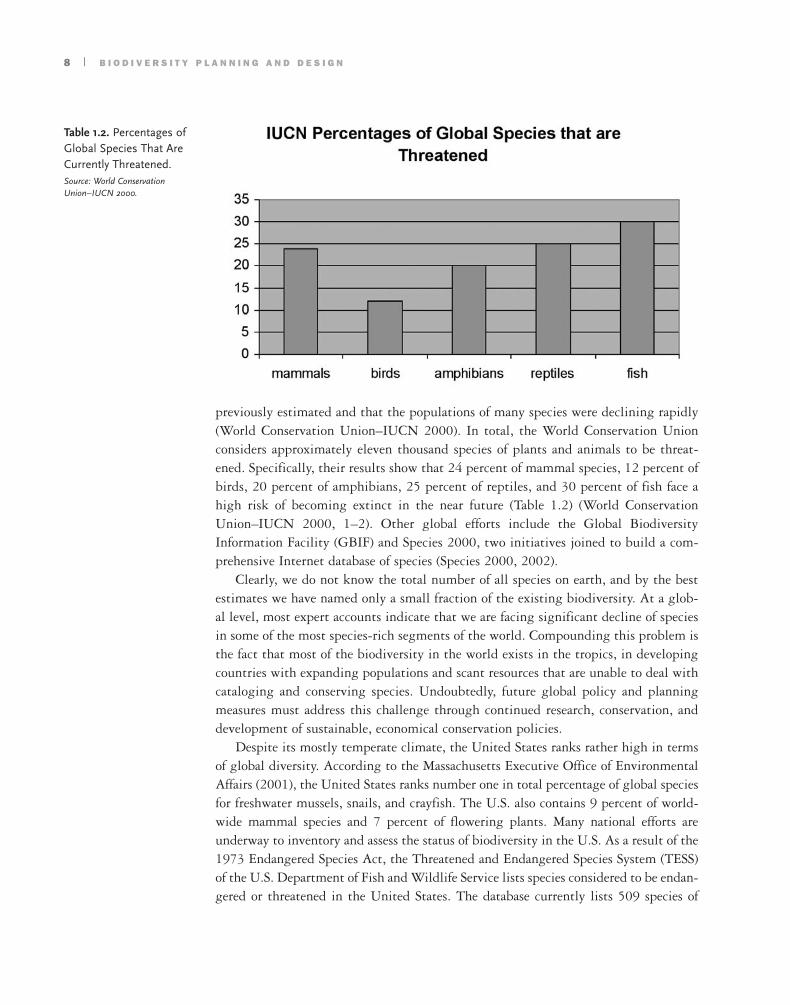
previously estimated and that the populations of many species were declining rapidly(World Conservation Union–IUCN 2000). In total, the World Conservation Unionconsiders approximately eleven thousand species of plants and animals to be threat-ened. Specifically, their results show that 24 percent of mammal species, 12 percent ofbirds, 20 percent of amphibians, 25 percent of reptiles, and 30 percent of fish face ahigh risk of becoming extinct in the near future (Table 1.2) (World ConservationUnion–IUCN 2000, 1–2). Other global efforts include the Global BiodiversityInformation Facility (GBIF) and Species 2000, two initiatives joined to build a com-prehensive Internet database of species (Species 2000, 2002).
Clearly, we do not know the total number of all species on earth, and by the bestestimates we have named only a small fraction of the existing biodiversity. At a glob-al level, most expert accounts indicate that we are facing significant decline of speciesin some of the most species-rich segments of the world. Compounding this problem isthe fact that most of the biodiversity in the world exists in the tropics, in developingcountries with expanding populations and scant resources that are unable to deal withcataloging and conserving species. Undoubtedly, future global policy and planningmeasures must address this challenge through continued research, conservation, anddevelopment of sustainable, economical conservation policies.
Despite its mostly temperate climate, the United States ranks rather high in termsof global diversity. According to the Massachusetts Executive Office of EnvironmentalAffairs (2001), the United States ranks number one in total percentage of global speciesfor freshwater mussels, snails, and crayfish. The U.S. also contains 9 percent of world-wide mammal species and 7 percent of flowering plants. Many national efforts areunderway to inventory and assess the status of biodiversity in the U.S. As a result of the1973 Endangered Species Act, the Threatened and Endangered Species System (TESS)of the U.S. Department of Fish and Wildlife Service lists species considered to be endan-gered or threatened in the United States. The database currently lists 509 species of
8 | B I O D I V E R S I T Y P L A N N I N G A N D D E S I G N
Table 1.2. Percentages ofGlobal Species That AreCurrently Threatened. Source: World ConservationUnion–IUCN 2000.
I N T R O D U C T I O N : B I O D I V E R S I T Y P L A N N I N G A N D D E S I G N | 9
Figure 1.1. The NatureConservancy rankings for native U.S. fauna and flora. See NatureConservancy conservationstatus rank in the glos-sary for explanations ofranking categories. Source: Master et al. 2000.
animals, with twenty-five proposed to be added to the list, and 740 species of plants,with ten additional species proposed (U.S. Fish and Wildlife Service 2002).
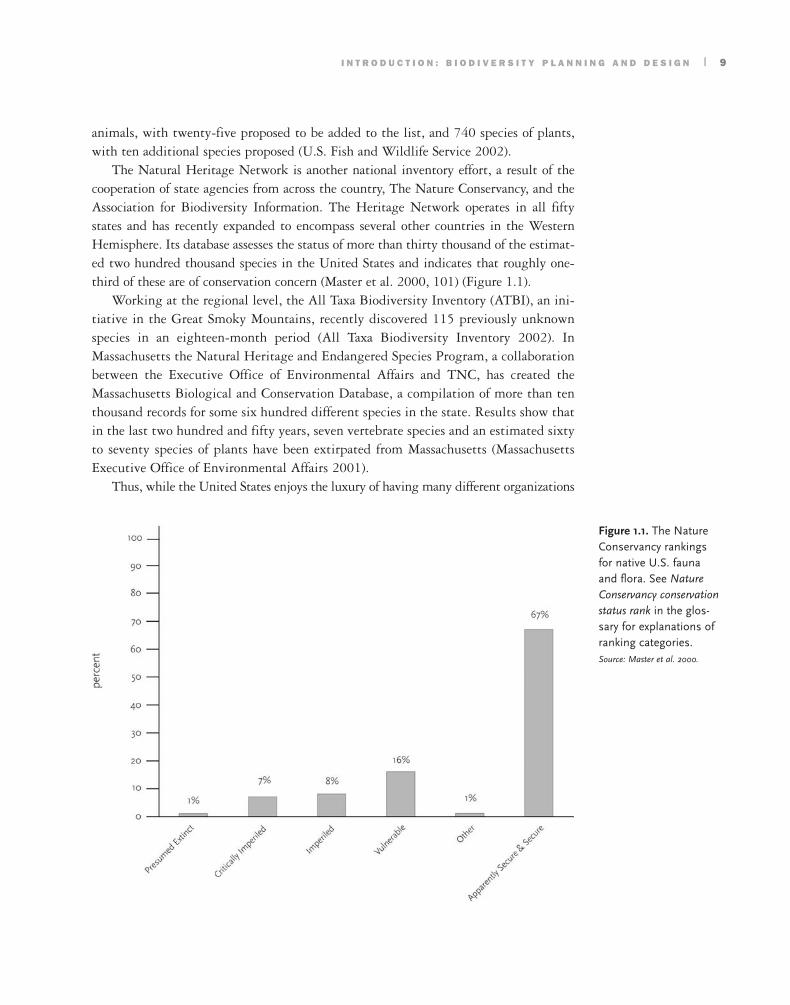
The Natural Heritage Network is another national inventory effort, a result of thecooperation of state agencies from across the country, The Nature Conservancy, and theAssociation for Biodiversity Information. The Heritage Network operates in all fiftystates and has recently expanded to encompass several other countries in the WesternHemisphere. Its database assesses the status of more than thirty thousand of the estimat-ed two hundred thousand species in the United States and indicates that roughly one-third of these are of conservation concern (Master et al. 2000, 101) (Figure 1.1).
Working at the regional level, the All Taxa Biodiversity Inventory (ATBI), an ini-tiative in the Great Smoky Mountains, recently discovered 115 previously unknownspecies in an eighteen-month period (All Taxa Biodiversity Inventory 2002). InMassachusetts the Natural Heritage and Endangered Species Program, a collaborationbetween the Executive Office of Environmental Affairs and TNC, has created theMassachusetts Biological and Conservation Database, a compilation of more than tenthousand records for some six hundred different species in the state. Results show thatin the last two hundred and fifty years, seven vertebrate species and an estimated sixtyto seventy species of plants have been extirpated from Massachusetts (MassachusettsExecutive Office of Environmental Affairs 2001).
Thus, while the United States enjoys the luxury of having many different organizations

working at different scales to assess and conserve biodiversity, many challenges stillexist. According to the U.S. Department of Agriculture, roughly 70 percent of theland area of the United States is privately owned and a significant number (nearly onefourth) of imperiled and endangered species reside on these lands. Furthermore, a com-parison of concentrations of threatened biodiversity with concentrations of the U.S.human population reveals an alarming degree of overlap (Groves et al. 2000). Futuredecisions about how to conserve biodiversity will involve complex negotiations withthe needs and interests of humans, including consideration of the biodiversity of urbanand suburban areas.
Although a general consensus exists that the rate of extinction has been increasing,uncertainty remains regarding the actual magnitude of this rate. According to RobertMay, the extinction rate has accelerated during the past one hundred years to roughlyone thousand times what it was before humans appeared on earth. He explains that var-ious lines of argument “suggest a speeding up by a further factor of 10 over the nextcentury or so. . . . And that puts us squarely on the breaking edge of the sixth greatwave of extinction in the history of life on earth” (May, cited by Gibbs 2001, 42).Citing statistics by the World Conservation Union, May (1988) predicts that extinc-tion rates will rise twelve to fifty-five times over the next three centuries. In 1993,Smith et al. extrapolated from current recorded extinction rates to predict an alarmingextinction rate of 50 percent for some taxonomic groups, such as birds and mammals,within three to four hundred years. Even more extreme estimates of 8 to 11 percentspecies loss per decade were suggested by researchers in the 1980s (Lovejoy 1980;Raven 1988).
Many of these scientists based their estimates on the species-area theory offered byMacArthur and Wilson (1967), which predicts that a 90 percent reduction in habitatarea will result in a loss of half of the total species in that area. E.O. Wilson suggeststhat species loss will continue until the human population stops increasing; he refersto the present day as the “bottleneck” period “because we have to pass through thatscramble for remaining resources in order to get to an era, perhaps sometime in thetwenty-second century, of declining human population. Our goal is to carry as muchof the biodiversity through as possible” (quoted in Gibbs 2001, 49).
Some scientists, however, disagree with these estimates. Brown and Brown (1992)noted that, although Atlantic rain forests had been reduced to 12 percent of their orig-inal extent, the 50 percent extinction rate estimated by species-area predictions did notseem to be holding up. Others have noted that it is very difficult to precisely identifywhen the last specimen of a given species has died (Ehrlich and Wilson 1991; Mawdsleyand Stork 1995). It may take years for the cumulative factors affecting extinction todraw the final blow (Heywood et al. 1994). These species are therefore condemned tocertain extinction, though they may survive for several decades before becoming extinct.
By far the greatest challenge to the startling extinction predictions from biologistsover the years has come from Danish statistician Bjørn Lomborg. In his book TheSkeptical Environmentalist, Lomborg charges that reports of the decline of biodiversity
10 | B I O D I V E R S I T Y P L A N N I N G A N D D E S I G N
have been greatly exaggerated and that environmentalists have ignored evidence thattropical deforestation has not taken the predicted toll on species diversity (Lomborg2001). The scientific community, however disregards his extremely conservative esti-mate of 0.15 percent of species loss per decade on the basis that he is not a biologicalscientist and that he relies on poor data (Gibbs 2001, 43).
At the very least, scientists agree that the rate of extinction is increasing above whatwould be considered normal background levels and that, as a result, global biodiversityis declining. Ongoing efforts to name and catalog species will improve our understand-ing of these losses and what can be done to prevent or slow them. However, while thenaming and describing of species continues, scientists and other conservation profession-als must also make decisions about how to conserve existing biodiversity with limitedinformation and resources. What approach should they take? How can they decide whichspecies to conserve? How many individuals are needed to sustain a viable population fora given species in a region? Indeed, how can they assess population trends?
S T R A T E G I E S F O R A S S E S S I N G A N D
C O N S E R V I N G B I O D I V E R S I T Y
Landscape architects and planners must rely on the expertise of biologists to conductbiodiversity assessments, and it is important that they understand the pertinent con-cepts and terminology so they can collaborate effectively. Methods to assess and conservebiodiversity fall into two broad categories: reactive strategies, which are undertakenonce a problem or issue has been identified, and proactive strategies, undertaken beforea problem arises. Biodiversity plans that integrate both are likely to be more successful.
Biodiversity is commonly evaluated by either an “endangered species” reactiveapproach that addresses species that are already in trouble; or a “hot spot” proactiveapproach that focuses on protecting geographical areas with high concentrations ofbiodiversity. Historically in North America, species conservation methods were aimedat preserving single species that had some perceived value to humankind and whosedeclining numbers needed to be managed to ensure the species’ future use by humans.Desirable species (such as deer and caribou) were managed, while undesirable species(such as wolves) were pushed to the brink of extinction. These early efforts tended tofocus on large-game vertebrates that could be exploited for their meat or hides.Gradually, aided by the passage of the Endangered Species Act of 1973 (the ESA), thescope of species to be conserved expanded to include invertebrates, plants, and otherhistorically undervalued species (Noss and Cooperrider 1994). Under the ESA, vulner-able species are those in danger of becoming extinct or those federally listed as beingthreatened or endangered (TES) (Feinsinger 2001). This vulnerable species approachhas several drawbacks:
• Until recently, it has focused on large vertebrates to the exclusion of plants andinvertebrates.
I N T R O D U C T I O N : B I O D I V E R S I T Y P L A N N I N G A N D D E S I G N | 11

• This fine filter, single-species approach cannot possibly keep tabs on the vastnumbers of species in the world.
• Historically, this approach has addressed direct threats to species survival, suchas poaching and hunting—a focus that has become increasingly misguided ashabitat loss has eclipsed direct killing as the major threat to species.
• Most single-species efforts are reactive, coming into play only after a givenspecies is imperiled (Noss and Cooperrider 1994).
The endangered species approach came into fundamental conflict with developmentactivities, leading to multispecies habitat conservation plans that attempted to negotiatea reasonable compromise between conservation and development, informed by speciesbiology and development alternatives, while operating within the legal guidelines of theESA. To the purist, habitat conservation plans represent an unacceptable weakening ofthe ESA; to others, they provide a model for sustainable “balancing” of conservation anddevelopment in which serious consideration is granted to biodiversity (Beatley 1994).
Alternatively, a hotspot approach is more strategic and proactive in that it entailsthe protection of areas that help conserve overall diversity before the quality of theecosystems and species within those areas degrades entirely. Generally, hotspots arehigh in species richness and endemic species (those species found only in a single loca-tion in the world). Hotspots may also be determined by the degree of threat to the area.For example, Conservation International, a U.S.-based, international nonprofit organ-ization, uses a hotspot approach as its central strategy for preserving biodiversity. It hasidentified twenty-five hotspots worldwide, where it concentrates its efforts. Accordingto Russell A. Mittermeier, president of Conservation International: “The hotspotsstrategy makes the extinction crisis more manageable by enabling us to prioritize andtarget conservation investments in order to have the greatest impact” (ConservationInternational 2002).
Another example of the hotspot approach is the National Gap Analysis Program(GAP), conducted by the Biological Resource Division of the U.S. Geological Survey.It is used to analyze how well native animal species and natural plant communities arerepresented in the network of currently protected lands. In the GAP analysis, “gaps”are areas in which particular species or natural communities are not adequately repre-sented in currently protected lands. GAP assessment classifies lands into four manage-ment classes, which range from permanently protected with natural disturbanceregimes (class 1) to unprotected areas with extensive human changes allowed to existingecosystems and plant communities (class 4) (Jennings 2000). When “gaps” are identi-fied, they may be targeted for acquisition or for alternative management approaches.GAP is a type of hotspot approach in which both ecological processes and species distribution are examined to determine which areas should receive protection beforethey become vulnerable. A stated goal of the project is “to ensure that all ecosystemsand areas rich in species diversity are represented adequately in biodiversity manage-ment areas” (Scott et al. 1993, 1).
12 | B I O D I V E R S I T Y P L A N N I N G A N D D E S I G N
GAP analysis is a habitat-association method of biodiversity assessment. In GAP,given habitat types are correlated with species needs and preferences (identified in the lit-erature) and then used to predict where those species could potentially exist. GAP infor-mation is then verified through field checks. This is a coarse filter approach in whichlarge, mappable vegetation units are presumed to support a wide array of species (Scottet al. 1993; Jennings 2000). Vegetation is mapped using satellite images, and distribu-tions of native animal species are mapped using museum or agency specimen collectionrecords, known general ranges, and habitat associations. The resulting geographic infor-mation systems (GIS) maps are then overlaid with maps of land management areas toidentify “gaps” and to focus conservation and land acquisitions efforts. Since its inceptionin 1988, GAP mapping has been completed for the forty-eight contiguous states, sup-porting not only gap planning but other multipurpose statewide and regional planningactivities, including greenway planning. Jennings (2000) predicts that human activitieswill be more explicitly integrated with GAP analysis in the future, leading to the devel-opment of a comprehensive biodiversity decision support system.
Another coarse filter, proactive conservation and planning approach that attemptsto work at regional scales and over broader time periods is the ecoregion approach usedby the World Wildlife Fund (WWF), based on the work of James Omernick of theU.S. Environmental Protection Agency (EPA) and Robert Bailey of the U.S. ForestService (Stein, Kutner, and Adams 2000). Ecoregions are broad regions of land or waterthat include “geographically distinct assemblage of natural communities,” which con-tain many of the same ecological processes and species, exist under similar environ-mental conditions, and depend on ecological interactions for long-term survival(Dinerstein et al. 2000, 13). The WWF has identified more than two hundred ecore-gions and uses them to set conservation priorities. Ecoregions simplify landscapes toreveal underlying patterns. To address biodiversity with a more fine-grained, interme-diate-scale approach, The Nature Conservancy and the National Heritage Networkrely instead on mapping ecological communities which are assemblages of species thatexist together in the same areas and whose life processes are potentially interrelated(McPeek and Miller 1996).
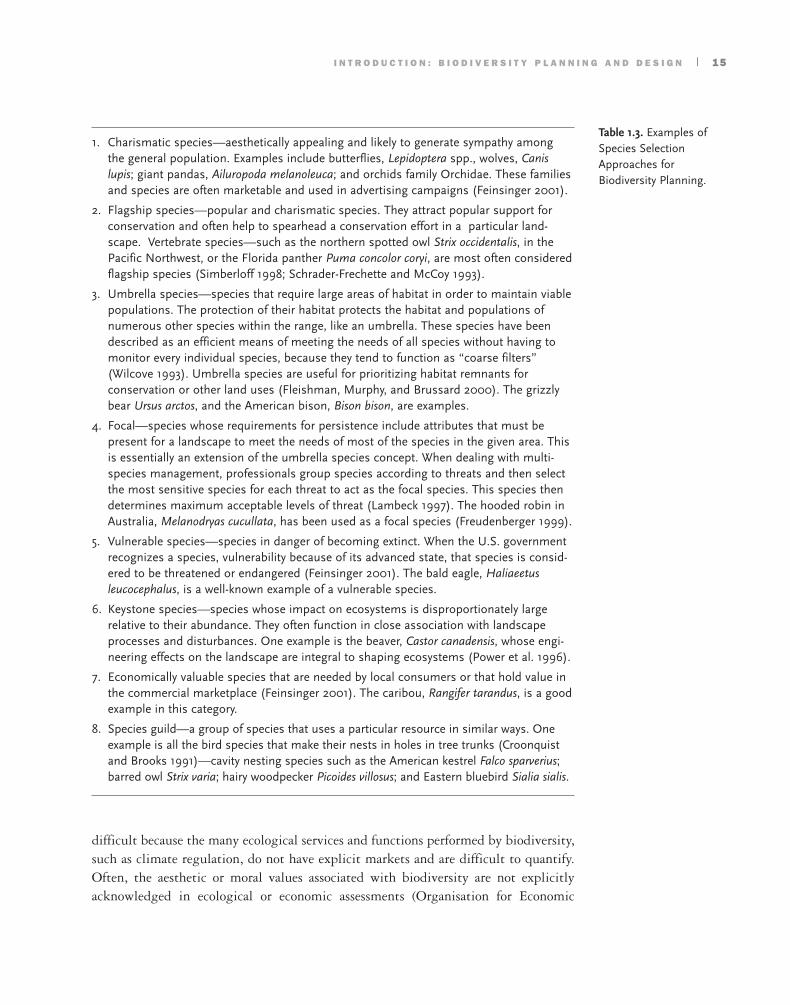
Selecting species for biodiversity planning presents a great dilemma: to be trulyinclusive many species need to be considered, yet there is rarely enough species-specific knowledge, information, or time to support this type of inclusive approach.As the number of species considered increases, so too do the time and cost of plan-ning. In response to this dilemma, biodiversity planners often use representative, orindicator, species. An indicator species is a species whose status provides informationon the overall condition of an ecosystem and of other species in that ecosystem.Indicator species flag changes in biotic or abiotic conditions. They reflect the qualityof and changes in environmental conditions as well as aspects of community compo-sition (Heywood and Watson 1995).
Biodiversity planners commonly think of the term indicator species as synonymouswith target species. However, some experts contend that target species are often chosen
I N T R O D U C T I O N : B I O D I V E R S I T Y P L A N N I N G A N D D E S I G N | 13
more for their value in conservation politics than for their validity as true biologicalindicators (Landres et al. 1988; Noss 1990; Feinsinger 2001; Storch and Bissonette2003). In this way, target species are used reactively. In addition, problems can arise indetermining what species should serve as indicators; there appears to be little consen-sus in the literature regarding methods of selection for indicator fauna (Hilty andMerenlender 2000). Table 1.3 provides a list of common methods for selecting speciesfor biodiversity planning.
The selection process for indicators is critical and should consider sampling tech-niques and sample sizes, scale, environmental stressors, and appropriateness of thespecies as a surrogate for a larger community of species. Reed Noss (1990) explains theneed to select indicators at different levels of organization and outlines variables forcataloging, observing, and assessing biodiversity at regional, ecosystem, species, andgenetic scales. Indicators may be positive, in that they are expected to correlate posi-tively with ecological integrity or biodiversity, or negative, in that their presence indi-cates a degradation of ecosystem health. Most ecologists suggest that a single speciesshould never be used as a positive indicator for biodiversity planning; rather, multi-species indicators that range across spatial scales should be used. However, when usingnegative indicators, one may be sufficient. An example is the bacteria Escherichia coli,the presence of which always indicates poor water quality, usually originating fromimproperly treated human waste.
The use of target species is generally reactive, focusing on the species itself but notgenerally on the biota interacting with that species. Targets commonly receive atten-tion because they are in some danger of extinction. Indicators, on the other hand, aremore proactive because they are chosen to act as “signals” that change before changeactually occurs. Finally, ecosystem patterns, processes, or relationships are receivingmore attention as indicators to biodiversity, as “species based approaches have beencriticized on the grounds that they do not provide whole-landscape solutions to con-servation problems” (Lambeck 1997, 850).
Because the design of a project may depend on the type of biodiversity strategyused, landscape architects must consult with ecologists before any planning or designprocess begins. We will now examine why landscape architects and planners shouldacknowledge biodiversity in their planning and design efforts.
W H Y S H O U L D B I O D I V E R S I T Y B E
I M P O R T A N T T O L A N D S C A P E
A R C H I T E C T S A N D P L A N N E R S ?
All societies depend on biodiversity and biological resources either directly or indirect-ly. Humans rely directly on the diversity of life on earth as a source of air (plants pro-duce oxygen through photosynthesis), fuel, fiber, medicines and, most importantly, forfood. We also depend on microbes and scavengers to break down wastes, recycle nutri-ents, and replenish our soils (Miller et al. 1985). Placing a value on biodiversity is
14 | B I O D I V E R S I T Y P L A N N I N G A N D D E S I G N
difficult because the many ecological services and functions performed by biodiversity,such as climate regulation, do not have explicit markets and are difficult to quantify.Often, the aesthetic or moral values associated with biodiversity are not explicitlyacknowledged in ecological or economic assessments (Organisation for Economic
I N T R O D U C T I O N : B I O D I V E R S I T Y P L A N N I N G A N D D E S I G N | 15
Table 1.3. Examples ofSpecies SelectionApproaches forBiodiversity Planning.
1. Charismatic species—aesthetically appealing and likely to generate sympathy among the general population. Examples include butterflies, Lepidoptera spp., wolves, Canislupis; giant pandas, Ailuropoda melanoleuca; and orchids family Orchidae. These familiesand species are often marketable and used in advertising campaigns (Feinsinger 2001).
2. Flagship species—popular and charismatic species. They attract popular support forconservation and often help to spearhead a conservation effort in a particular land-scape. Vertebrate species—such as the northern spotted owl Strix occidentalis, in thePacific Northwest, or the Florida panther Puma concolor coryi, are most often considered flagship species (Simberloff 1998; Schrader-Frechette and McCoy 1993).
3. Umbrella species—species that require large areas of habitat in order to maintain viablepopulations. The protection of their habitat protects the habitat and populations ofnumerous other species within the range, like an umbrella. These species have beendescribed as an efficient means of meeting the needs of all species without having tomonitor every individual species, because they tend to function as “coarse filters”(Wilcove 1993). Umbrella species are useful for prioritizing habitat remnants for conservation or other land uses (Fleishman, Murphy, and Brussard 2000). The grizzlybear Ursus arctos, and the American bison, Bison bison, are examples.
4. Focal—species whose requirements for persistence include attributes that must be present for a landscape to meet the needs of most of the species in the given area. Thisis essentially an extension of the umbrella species concept. When dealing with multi-species management, professionals group species according to threats and then selectthe most sensitive species for each threat to act as the focal species. This species thendetermines maximum acceptable levels of threat (Lambeck 1997). The hooded robin inAustralia, Melanodryas cucullata, has been used as a focal species (Freudenberger 1999).
5. Vulnerable species—species in danger of becoming extinct. When the U.S. governmentrecognizes a species‚ vulnerability because of its advanced state, that species is consid-ered to be threatened or endangered (Feinsinger 2001). The bald eagle, Haliaeetus leucocephalus, is a well-known example of a vulnerable species.
6. Keystone species—species whose impact on ecosystems is disproportionately large relative to their abundance. They often function in close association with landscapeprocesses and disturbances. One example is the beaver, Castor canadensis, whose engi-neering effects on the landscape are integral to shaping ecosystems (Power et al. 1996).
7. Economically valuable species that are needed by local consumers or that hold value inthe commercial marketplace (Feinsinger 2001). The caribou, Rangifer tarandus, is a goodexample in this category.
8. Species guild—a group of species that uses a particular resource in similar ways. Oneexample is all the bird species that make their nests in holes in tree trunks (Croonquistand Brooks 1991)—cavity nesting species such as the American kestrel Falco sparverius;barred owl Strix varia; hairy woodpecker Picoides villosus; and Eastern bluebird Sialia sialis.
Co-operation and Development 2002). Today, justification of the importance of con-serving biodiversity falls into three main categories:
1. The vast repository of genetic information stored in the diversity of the earth’sorganisms provides a buffer against disease and famine because it holds the build-ing blocks for biotechnological discoveries (e.g., future foods and medicines).
2. Ecosystems provide services to the earth (e.g., filtering carbon dioxide), and wedo not yet understand the full extent or economic value of the possible services.
3. Humans have a moral obligation to preserve the balance of life on earth (Gibbs2001). Ehrenfeld’s “Noah principle” makes this point elegantly: “They [species]should be conserved because they exist and because this existence is itself but thepresent expression of a continued historical process of immense antiquity andmajesty. Long-standing existence in nature is deemed to carry with it the unim-peachable right to continued existence” (quoted in Beatley, 1994, 9).
The state of biodiversity is currently fragile and is heavily influenced by land usedecisions. Understanding biodiversity and its functions is important to landscapearchitects and planners because, by definition, planning and design change spatial configurations, ecological patterns, and the processes linked to these—often uninten-tionally. For example, most road construction causes habitat fragmentation, disruptshydrological processes, subjects species to roadkill, and introduces pollutants and peo-ple into areas that were previously inaccessible (Forman et al. 2003). Additionally, listing biodiversity protection as one objective among many may help landscape archi-tects and planners to garner a wider range of support and to form partnerships thatfacilitate other efforts in landscape planning, such as water resource planning, agricul-ture and wood production, and community and cultural adhesion (Forman 1995).
Human land use and development are quickly fragmenting and decreasing theamount of available open space suitable for habitat. Many biologists consider habitatfragmentation to be the “single greatest threat to biological diversity” (Noss 1991,27). As the human population increases, the amount of land altered by the culturallandscape also increases. A case in point: in the past fifty years, the human populationin the state of Massachusetts has increased by 28 percent while the developed landarea has increased by 200 percent. In fact, this state loses forty-four acres (17.8hectares) of land each day to development (Massachusetts Executive Office ofEnvironmental Affairs 2001).
In the book Once There Were Greenfields: How Urban Sprawl is Undermining America’sEnvironment, Economy and Social Fabric, authors Benfield, Raimi, and Chen (1999), ofthe Natural Resources Defense Council, cite the following statistics: from 1995 to2020, Maryland is expected to witness the conversion of more of its land into housingthan that which occurred over the past 350 years. Likewise, from 1970 to 1990,Chicago experienced a 74 percent increase in the metropolitan region’s commercial andindustrial land use, which is eighteen times greater than the population increase. Thisacceleration of land consumption is occurring even in areas experiencing a decrease in
16 | B I O D I V E R S I T Y P L A N N I N G A N D D E S I G N
population: in the past thirty years, the population of greater Cleveland has decreasedby 11 percent while urban land use has increased by 33 percent.
Scientists have tried to quantify the direct statistical relationship between loss ofhabitat area and loss of species. As stated earlier, species-area theories assert that elim-inating 90 percent of a given habitat area cuts the number of species in half. Thoughthis figure is hotly debated in the scientific community, it is widely acknowledged thatthe fragmentation and conversion of habitat to urbanized and agricultural lands gen-erally reduces biodiversity of native species (Mac et al. 1998).
Habitat destruction affects not only the quantity of species but also the quality ofthose species that survive. Species are disproportionately affected depending on the sizeof their habitat and where their habitat exists in relation to the altered land.Generalists or edge species, which are able to survive in a variety of habitats, are lesslikely to suffer from habitat loss and fragmentation than specialist species, whichrequire unique pockets of habitat. Likewise, all species have a minimum area point—how large a given habitat area must be in order for a viable population to survive.Different species or groups will have different minimum area requirements and thuswill be affected differently by habitat fragmentation and loss (Forman 1995).
Specifically, fragmentation of the landscape affects habitat size, shape, and distancefrom other areas of suitable habitat. Those organisms dependent on a particular habi-tat size or distance (or both) from the edge of their habitat are pressured by the increaseof “edge” environment that accompanies fragmentation. This, in turn, affects speciesdiversity directly and indirectly. These effects include changes in predator-prey rela-tionships, alteration of seed dispersal mechanisms, and nest parasitism. Fragmentationalso affects abiotic factors, such as hydrologic regimes, mineral nutrient cycles, radia-tion balance, wind patterns, disturbance regimes, and soil movements. These, in turn,can affect species movement and survival. In particular, forests and the species (includ-ing humans) living both within these habitats and in surrounding areas are negative-ly affected by fragmentation. Normally, forests play a large role in protecting the quality of water by protecting aquifers from evaporation, by monitoring stream net-work connectivity, and by acting as floodplains (Forman 1995).
One specific consideration relevant in terms of biodiversity for environmentaldesigners and planners is habitat composition, which affects the populations and com-munities relying on different types of land cover. An example is the decline since the1950s of certain New England bird and mammal populations commonly linked toyoung forest habitats that are maturing, thereby losing their brushy quality (Kittredgeand O’Shea 1999, 34).
A second aspect of species composition that can be affected by the actions and deci-sions of landscape architects is the use of native versus exotic species in designed land-scapes. Introducing nonindigenous species to an area can disrupt population, commu-nity, and ecosystem structure and function (Vitousek 1988; Drake et al. 1989). Certainexotic invasives outcompete native species, leading to habitat degradation and poten-tially to a monoculture. Some of the most harmful invasive species—such as kudzu
I N T R O D U C T I O N : B I O D I V E R S I T Y P L A N N I N G A N D D E S I G N | 17

(Pueraria lobata), water hyacinth (Eichhornia crassipes), and Asian bittersweet (Celastrusorbiculatus)—were intentionally introduced to solve agriculture or soil managementproblems. Other invasives were introduced unintentionally through such means as bal-last water in ships, transport on military vehicles, and cut flowers (Mac et al. 1998).One example of the effect of invasive plants is the success of purple loosestrife (Lythrumsalicaria), which accidentally arrived in the dry ballast in cargo holds of ships and isnow overrunning river floodplains and coastal and inland marshes throughout thenortheastern United States (Wilcove et al. 2000). As the public’s appetite for exoticlandscape plants and animals has increased, many of these organisms have been unin-tentionally released into the wild in the United States, disrupting native ecosystems.
Human land use has significantly affected biodiversity through habitat change,loss, and fragmentation. For example, of the list of federally listed species under theESA and those listed as species at risk by the Natural Heritage Central Databases,habitat loss has affected 90 percent of bird species, 94 percent of fish, 87 percent ofamphibians, 97 percent of reptiles, and 89 percent of mammals in the U.S. (Wilcoveet al. 2000). The goal now should be to more deeply understand this threat and deter-mine ways to decrease its negative effects.
C O N C L U S I O N
To be seen as leaders in the environmental community, landscape architects and plan-ners cannot afford to dismiss the importance of biodiversity. They must recognize thatthe elements of biodiversity planning are interdependent and cannot be addressed inisolation. For example, decisions concerning types of linkages used to increase connectivity for a particular animal species may also increase the connectivity for thedispersal of an invasive plant. By acknowledging these connections, landscape archi-tects and planners can potentially protect and restore biodiversity. Clearly, landscapearchitects and planners working in both the public and private sectors could have alarge effect on the future of any unprotected landscape. They must examine how wellthey are able to adhere to the overarching priorities of sustainability in their dailywork. The current state of biodiversity calls for a reevaluation of ethics and a returnto Aldo Leopold’s concept of human beings as stewards of the land, safeguardingresources for future generations:
All ethics so far evolved rest upon a single premise: that the individual is a mem-ber of a community of interdependent parts. His instincts prompt him to compete for his place in that community, but his ethics prompt him also to co-operate (perhaps in order that there may be a place to compete for). The landethic simply enlarges the boundaries of the community to include soils, waters,plants, and animals, or collectively: the land. (Leopold 1949, 203–4)
18 | B I O D I V E R S I T Y P L A N N I N G A N D D E S I G N
I N T R O D U C T I O N : B I O D I V E R S I T Y P L A N N I N G A N D D E S I G N | 19
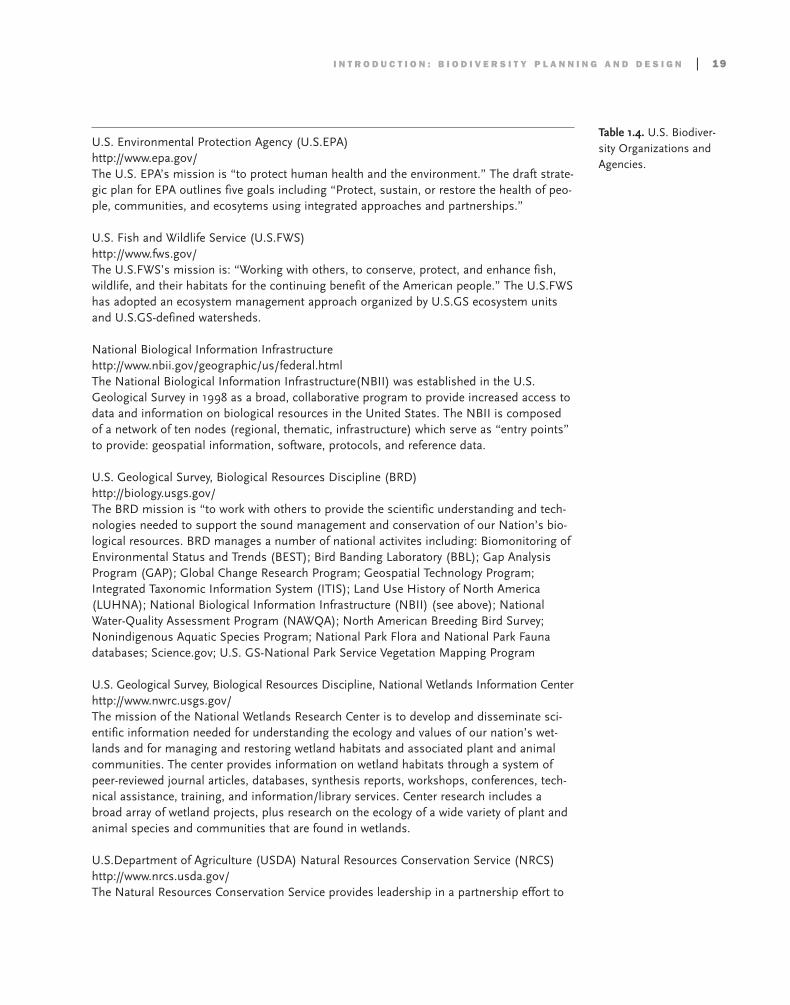
U.S. Environmental Protection Agency (U.S.EPA)http://www.epa.gov/The U.S. EPA’s mission is “to protect human health and the environment.” The draft strate-gic plan for EPA outlines five goals including “Protect, sustain, or restore the health of peo-ple, communities, and ecosytems using integrated approaches and partnerships.”
U.S. Fish and Wildlife Service (U.S.FWS) http://www.fws.gov/The U.S.FWS’s mission is: “Working with others, to conserve, protect, and enhance fish,wildlife, and their habitats for the continuing benefit of the American people.” The U.S.FWShas adopted an ecosystem management approach organized by U.S.GS ecosystem unitsand U.S.GS-defined watersheds.
National Biological Information Infrastructure http://www.nbii.gov/geographic/us/federal.htmlThe National Biological Information Infrastructure(NBII) was established in the U.S.Geological Survey in 1998 as a broad, collaborative program to provide increased access todata and information on biological resources in the United States. The NBII is composedof a network of ten nodes (regional, thematic, infrastructure) which serve as “entry points”to provide: geospatial information, software, protocols, and reference data.
U.S. Geological Survey, Biological Resources Discipline (BRD) http://biology.usgs.gov/The BRD mission is “to work with others to provide the scientific understanding and tech-nologies needed to support the sound management and conservation of our Nation’s bio-logical resources. BRD manages a number of national activites including: Biomonitoring ofEnvironmental Status and Trends (BEST); Bird Banding Laboratory (BBL); Gap AnalysisProgram (GAP); Global Change Research Program; Geospatial Technology Program;Integrated Taxonomic Information System (ITIS); Land Use History of North America(LUHNA); National Biological Information Infrastructure (NBII) (see above); NationalWater-Quality Assessment Program (NAWQA); North American Breeding Bird Survey;Nonindigenous Aquatic Species Program; National Park Flora and National Park Faunadatabases; Science.gov; U.S. GS-National Park Service Vegetation Mapping Program
U.S. Geological Survey, Biological Resources Discipline, National Wetlands Information Centerhttp://www.nwrc.usgs.gov/The mission of the National Wetlands Research Center is to develop and disseminate sci-entific information needed for understanding the ecology and values of our nation’s wet-lands and for managing and restoring wetland habitats and associated plant and animalcommunities. The center provides information on wetland habitats through a system ofpeer-reviewed journal articles, databases, synthesis reports, workshops, conferences, tech-nical assistance, training, and information/library services. Center research includes abroad array of wetland projects, plus research on the ecology of a wide variety of plant andanimal species and communities that are found in wetlands.
U.S.Department of Agriculture (USDA) Natural Resources Conservation Service (NRCS)http://www.nrcs.usda.gov/The Natural Resources Conservation Service provides leadership in a partnership effort to
Table 1.4. U.S. Biodiver-sity Organizations andAgencies.
help people conserve, maintain, and improve our natural resources and environment.NRCS assists local, state, and federal agencies, and private landowners with conservationexpertise for soil, water, and other natural resources.
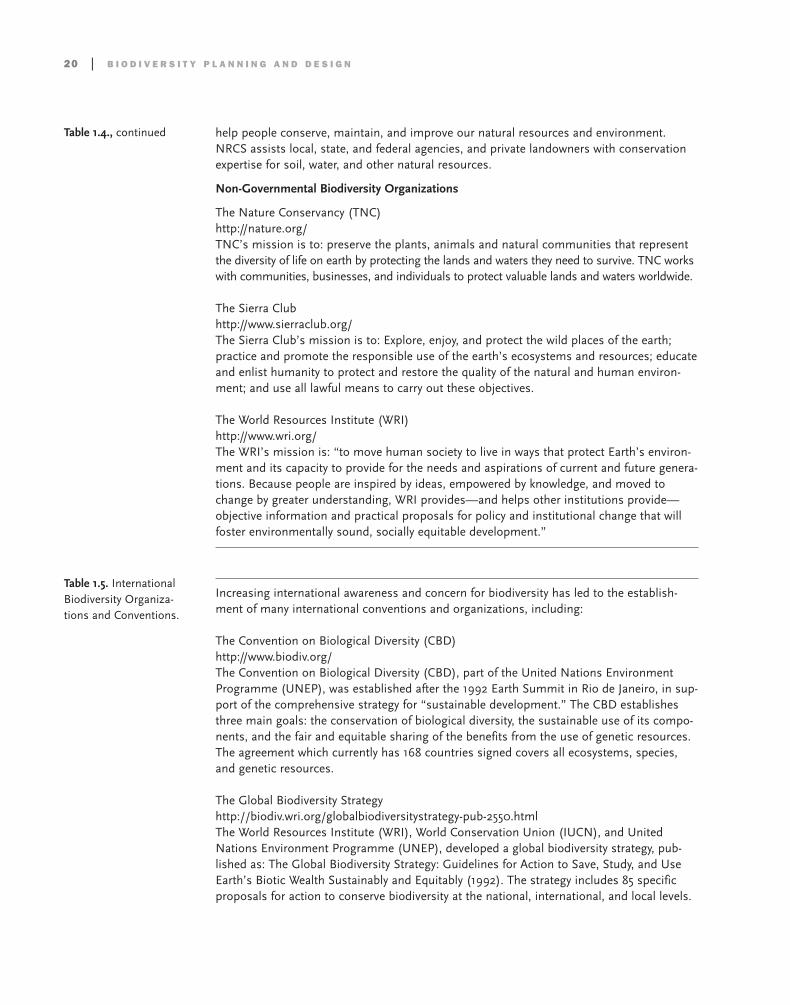
Non-Governmental Biodiversity Organizations
The Nature Conservancy (TNC)http://nature.org/TNC’s mission is to: preserve the plants, animals and natural communities that representthe diversity of life on earth by protecting the lands and waters they need to survive. TNC workswith communities, businesses, and individuals to protect valuable lands and waters worldwide.
The Sierra Club http://www.sierraclub.org/The Sierra Club’s mission is to: Explore, enjoy, and protect the wild places of the earth;practice and promote the responsible use of the earth’s ecosystems and resources; educateand enlist humanity to protect and restore the quality of the natural and human environ-ment; and use all lawful means to carry out these objectives.
The World Resources Institute (WRI)http://www.wri.org/The WRI’s mission is: “to move human society to live in ways that protect Earth’s environ-ment and its capacity to provide for the needs and aspirations of current and future genera-tions. Because people are inspired by ideas, empowered by knowledge, and moved tochange by greater understanding, WRI provides—and helps other institutions provide—objective information and practical proposals for policy and institutional change that willfoster environmentally sound, socially equitable development.”
20 | B I O D I V E R S I T Y P L A N N I N G A N D D E S I G N
Table 1.4., continued
Table 1.5. InternationalBiodiversity Organiza-tions and Conventions.
Increasing international awareness and concern for biodiversity has led to the establish-ment of many international conventions and organizations, including:
The Convention on Biological Diversity (CBD) http://www.biodiv.org/ The Convention on Biological Diversity (CBD), part of the United Nations EnvironmentProgramme (UNEP), was established after the 1992 Earth Summit in Rio de Janeiro, in sup-port of the comprehensive strategy for “sustainable development.” The CBD establishesthree main goals: the conservation of biological diversity, the sustainable use of its compo-nents, and the fair and equitable sharing of the benefits from the use of genetic resources.The agreement which currently has 168 countries signed covers all ecosystems, species,and genetic resources.
The Global Biodiversity Strategy http://biodiv.wri.org/globalbiodiversitystrategy-pub-2550.htmlThe World Resources Institute (WRI), World Conservation Union (IUCN), and UnitedNations Environment Programme (UNEP), developed a global biodiversity strategy, pub-lished as: The Global Biodiversity Strategy: Guidelines for Action to Save, Study, and UseEarth’s Biotic Wealth Sustainably and Equitably (1992). The strategy includes 85 specificproposals for action to conserve biodiversity at the national, international, and local levels.
It is intended to simulate fundamental changes in how individuals, nations, and organiza-tions perceive, manage, and use the earth’s biological wealth. The Strategy is a comple-ment to the Convention on Biological Diversity (CBD) providing a framework for actionsthat should be taken by governments and non-governmental organizations in support ofthe Convention.
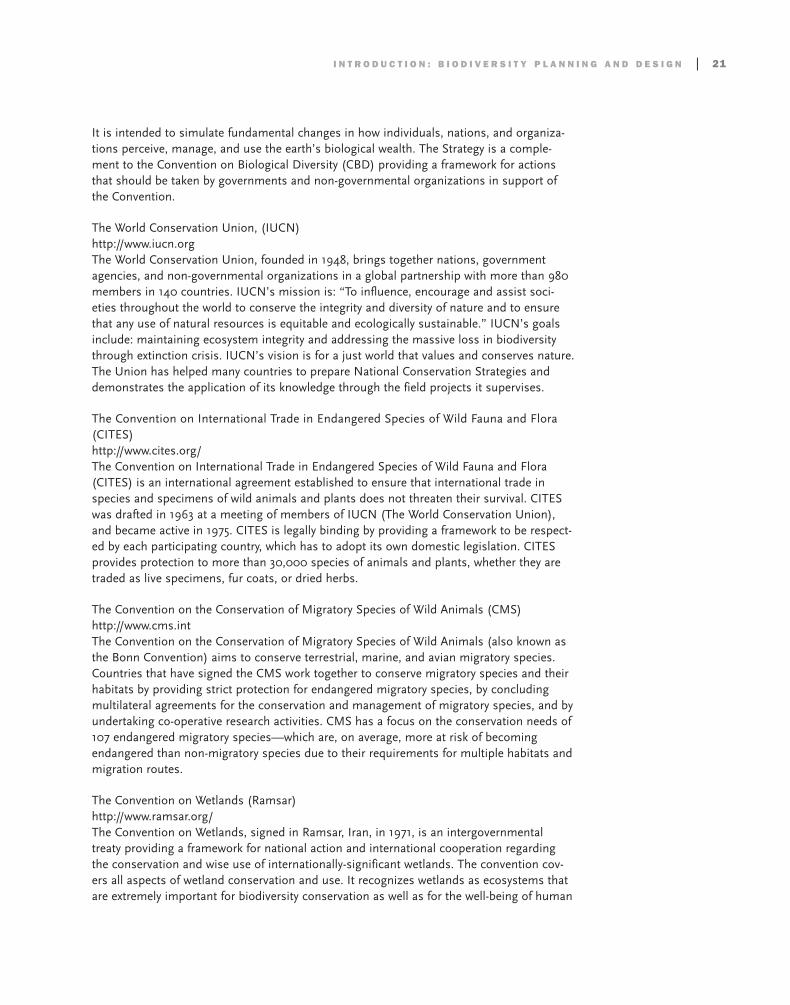
The World Conservation Union, (IUCN)http://www.iucn.orgThe World Conservation Union, founded in 1948, brings together nations, governmentagencies, and non-governmental organizations in a global partnership with more than 980members in 140 countries. IUCN’s mission is: “To influence, encourage and assist soci-eties throughout the world to conserve the integrity and diversity of nature and to ensurethat any use of natural resources is equitable and ecologically sustainable.” IUCN’s goalsinclude: maintaining ecosystem integrity and addressing the massive loss in biodiversitythrough extinction crisis. IUCN’s vision is for a just world that values and conserves nature.The Union has helped many countries to prepare National Conservation Strategies anddemonstrates the application of its knowledge through the field projects it supervises.
The Convention on International Trade in Endangered Species of Wild Fauna and Flora(CITES) http://www.cites.org/The Convention on International Trade in Endangered Species of Wild Fauna and Flora(CITES) is an international agreement established to ensure that international trade inspecies and specimens of wild animals and plants does not threaten their survival. CITESwas drafted in 1963 at a meeting of members of IUCN (The World Conservation Union),and became active in 1975. CITES is legally binding by providing a framework to be respect-ed by each participating country, which has to adopt its own domestic legislation. CITESprovides protection to more than 30,000 species of animals and plants, whether they aretraded as live specimens, fur coats, or dried herbs.
The Convention on the Conservation of Migratory Species of Wild Animals (CMS) http://www.cms.intThe Convention on the Conservation of Migratory Species of Wild Animals (also known asthe Bonn Convention) aims to conserve terrestrial, marine, and avian migratory species.Countries that have signed the CMS work together to conserve migratory species and theirhabitats by providing strict protection for endangered migratory species, by concludingmultilateral agreements for the conservation and management of migratory species, and byundertaking co-operative research activities. CMS has a focus on the conservation needs of107 endangered migratory species—which are, on average, more at risk of becomingendangered than non-migratory species due to their requirements for multiple habitats andmigration routes.
The Convention on Wetlands (Ramsar) http://www.ramsar.org/The Convention on Wetlands, signed in Ramsar, Iran, in 1971, is an intergovernmentaltreaty providing a framework for national action and international cooperation regardingthe conservation and wise use of internationally-significant wetlands. The convention cov-ers all aspects of wetland conservation and use. It recognizes wetlands as ecosystems thatare extremely important for biodiversity conservation as well as for the well-being of human
I N T R O D U C T I O N : B I O D I V E R S I T Y P L A N N I N G A N D D E S I G N | 21
communities. There are presently 136 contracting countries to the convention, with 1,250RAMSAR wetland sites, totaling 106.9 million hectares in area.
The World Heritage Convention (UNESCO) http://whc.unesco.orgThe Convention Concerning the Protection of the World Cultural and Natural Heritage (theWorld Heritage Convention) was adopted by the General Conference of United NationsEducational, Scientific, and Cultural Organization in 1972. To date, more than 170 countrieshave joined the Convention. The primary mission of the World Heritage Convention is toidentify and conserve the world’s cultural and natural heritage, by drawing up a list of siteswhose outstanding values should be preserved for all humanity and to ensure their protec-tion through a closer co-operation among nations.
22 | B I O D I V E R S I T Y P L A N N I N G A N D D E S I G N
Table 1.5. continued
Zoos play an important role in the conservation of biodiversity—not only as refuges orplaces for captive breeding but as centers for education, raising humans’ intellectualunderstanding of the world environment and its species, and building an emotionalattachment with species other than our own. When people see animals living in anaccurate replication of their natural habitat and engaging in natural social behaviors,they begin to respect animals as having a dignified existence in their own right, andthey may become more interested in protecting wild habitats. On the contrary, animalsconfined to concrete cages and separated from the public by metal bars garner littlesympathy or understanding. As David Hancocks argues in A Different Nature (2001,160), “zoos can and must become gateways to the wild, metaphorically and practical-ly.” Landscape architects can play an important role in the future development of zoosin the United States and worldwide by bringing together interdisciplinary teams andcoordinating the science necessary to create successful, biocentric zoos (see Figure 2.1;see also Figure 2.2 in color insert).
Zoos have evolved significantly since the first public zoos were created two hundred years ago (Figure 2.3). Despite their current roles as conservation centers,however, many zoos still base their design on an anthropocentric, rather than a biocen-tric, point of view. The architecture and landscape architecture firm of Jones & Jones,located in Seattle, Washington, succeeded in making the fundamental change to a bio-centric perspective at the Woodland Park Zoo in Seattle. Inventing the concept of
C H A P T E R 2
W O O D L A N D P A R K Z O O
KikiBeyond the open doorShadows bend,
Whose eyes hear waterNear the tree who grew a streamBirds appear and disappear
Whose water face makes friendsWhose eyes see clouds of wind in his hairWhat’s in that hole,Deepness doesn’t move?
Who are those beyond the leaves?Take my hand.
A poem by Grant Jones about Kiki’s first day in
the new gorilla exhibit at Woodland Park Zoo, in 1979.
landscape immersion, a term coined by Grant Jones, they became the first zoo design-ers to describe the animals as clients (Jones 1982).
P R O J E C T D A T A
The Woodland Park Zoo long-range plan was completed in 1976 by Jones & Jones,Architects and Landscape Architects, Ltd. The ninety-acre (36.4-hectare) zoo is situat-ed in the northwest sector of Seattle, Washington, and is bounded on the east by AuroraAvenue, on the west by Phinney Avenue, and on the north and south by residentialcommunities (Figure 2.4). In 1968, $4.5 million was set aside by the Forward ThrustBond Issue for specific zoo improvements, based on a comprehensive plan. Because nosuch plan existed, an advisory committee called the Mayor’s Zoo Action Task Force wasformed, and the long-range plan was developed as a response to objectives set forth in1975. Once the long-range plan was completed and approved in 1976, the actual proj-ects contained within the plan (i.e., individual exhibits) were completed in phases asfunding became available. While much funding has come from Forward Thrust monies,philanthropic support has helped complete numerous other improvements.
Landscape immersion emphasizes that animals in zoos should be exhibited in theirnatural environment (or the closest facsimile possible), which should reach out into theobservation area so that visitors also experience the environment by standing in itrather than just looking at it. Cultural resonance, another term coined by Grant Jones,moves beyond landscape immersion to include aspects of the interdependent relation-ship between humans and animals in their native environment. For example, the archi-tecture, religion, and culture of Southeast Asia is intimately tied to people’s experiencewith elephants. The multipurpose, interdisciplinary design framework used by the
24 | B I O D I V E R S I T Y P L A N N I N G A N D D E S I G N
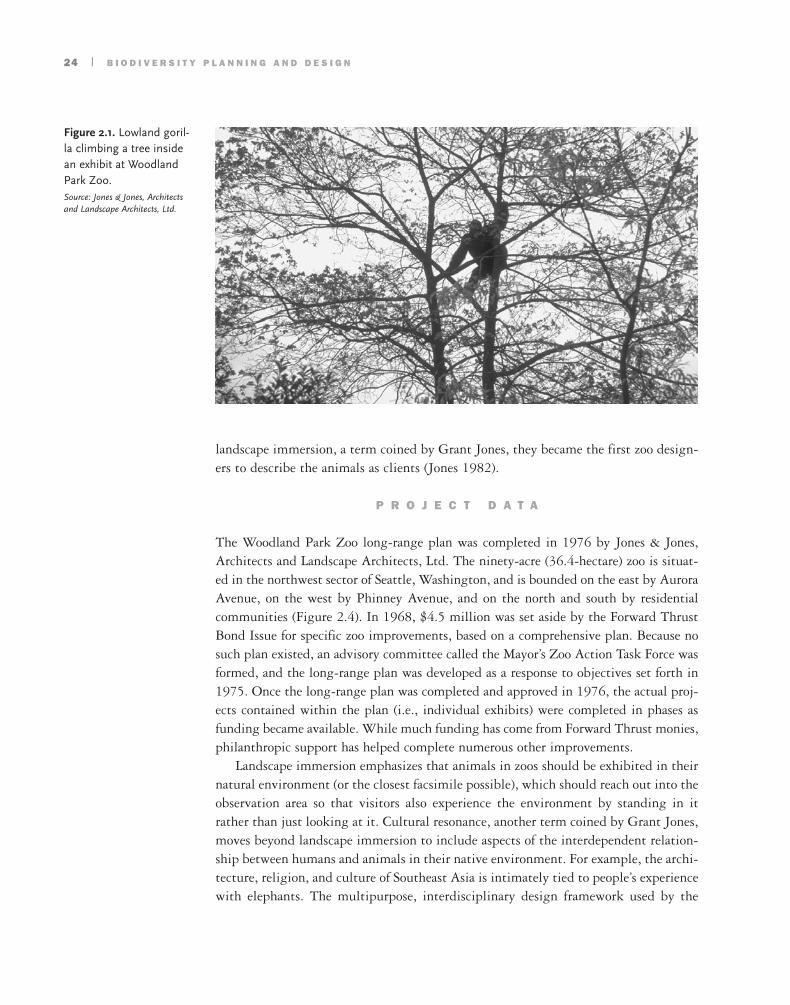
Figure 2.1. Lowland goril-la climbing a tree insidean exhibit at WoodlandPark Zoo. Source: Jones & Jones, Architectsand Landscape Architects, Ltd.

W O O D L A N D P A R K Z O O | 25
Figure 2.4. WoodlandPark Zoo is located in aresidential area of Seattle,Washington. Source: Jones & Jones Architectsand Landscape Architects, Ltd.
Figure 2.5. The design framework for the development of the Woodland Park Zoo long-range plan illustrates the “cen-tripetal process” designed by Jones & Jones. The processincluded the synthesis of the following steps: inventory, analy-sis, generation of alternatives, and concept selection. Source: Jones & Jones, Architects and Landscape Architects, Ltd.
Figure 2.3. Over the pasttwo hundred years, thepurpose of zoos hasevolved dramatically,from museum-like cen-ters of natural history toenvironmental resourcecenters. Source: World Zoo Organization1993.
Evolution of Zoos CONSERVATION CENTRE
Environmental Resource Centre
Theme Environmental
Subjects EcosystemsSurvival of the Species
Concerns Holistic conservationOrganizational networks
Exhibitry Immersion exhibits
21st century
ZOOLOGICAL PARK
Living Museum
Theme Ecological
Subjects Habitats of animalsBehavioral biology
Concerns Cooperative species management
Professional development
Exhibitry Dioramas
20th century
MENAGERIE
Natural History Cabinet
Theme Taxonomic
Subjects Diversity of speciesAdaptions for life
Concerns Species husbandrySpecies propagation
Exhibitry Cages
19th century
26 | B I O D I V E R S I T Y P L A N N I N G A N D D E S I G N
designers of Woodland Park Zoo is presented in Figure 2.5, which shows the particu-lar influences on the long-range plan.
P R O J E C T P A R T I C I P A N T S
The long-range plan was initiated by the City of Seattle in response to the require-ments of the Forward Thrust Bond Issue in 1975 after a previous plan, developed byarchitect G. R. Bartholick, was rejected by a public initiative because of its monumen-tal scale and incompatibility with the neighborhood. Many landscape architects andarchitects at Jones & Jones were closely involved in developing the master plan,including Grant R. Jones (the principal-in-charge), Jon Charles Coe, Johnpaul Jones,Peter Harvard, John Ady, David Walters, John Swanson, Eric Schmidt, and KeithLarson. Jim Brighton, a partner in the firm, noted that the landscape architects spent95 percent of their project time acting as leaders and coordinators within interdiscipli-nary teams. Landscape architects are needed, he says, to pull together a conceptual ideaand to give it a physical form. Jones & Jones was chosen for this project because theywere known for their “groundbreaking methodology for reading a landscape to deter-mine natural process and form” (Hancocks 2001, 113) as well as for their commitmentto “placing nature first” in their designs. They further promoted this reputation withthe Woodland Park Zoo long-range plan, which incorporated the concepts of landscapeimmersion and cultural resonance to fully engage visitors in the natural environmentsof the animals they came to observe (Jones & Jones 1976).
Consultants were also an integral part of the team, including Dennis Paulson, bio-logist; Donald Hogan, civil engineer; and Phillip Osborn, geologist. The interimdirector of the Woodland Park Zoo at the time was James Foster. The “living zoo”expert, David Hancocks, originally acted as design coordinator, establishing the pres-entation and exhibit themes, and later became the new zoo director. Trained as anarchitect, Hancocks had previously consulted with Ian McHarg on the Pardisan proj-ect in Iran (discussed below). Hancocks, who came to the Woodland Zoo project byretaining the services of Jones & Jones, sought to understand the landscape in order todetermine the feasibility of organizing the zoo around the bioclimatology of plants.Dennis Paulson described the effort as “teamwork across disciplines,” with no prede-fined roles. Additionally, members of the Forward Thrust Development Committee,the Seattle Design Commission, and many scholars and naturalists provided theirinput as the plan was developed. Community/public participation took the form of theForward Thrust Development Committee, which acted as “the medium for accounta-bility and continuity of intent” (Jones & Jones 1976, 1).
P R O J E C T G O A L S A N D O B J E C T I V E S
The stated goal of this project was set forth by the Zoo Action Task Force: “TheWoodland Park Zoological Garden should be a Life Science Institute demonstrating
the value and beauty as well as behavioral and physical adaptations of animal life. Assuch, primary emphasis should be placed on fostering public understanding of animallife and its relationship to ecological systems” (Jones & Jones 1976, 1).
As the long-range plan describes, a zoo differs from a natural history museumbecause it houses living animals; as such, it becomes “essential to give the animals allthe necessary opportunities to engage in natural behavior, to the benefit of the animaland the zoo visitor” (Jones & Jones 1976, 4). To achieve this end, David Hancocksdeveloped the exhibit theme of social biology by selecting larger, natural group sizesof fewer animal species, such as a band of gorillas (Figure 2.6 and Figure 2.7 in colorinsert) or a herd of antelope. This focus allows visitors to observe many different aspectsof the animals, not just their morphological characteristics, and is intended to encour-age people to reflect on their own social species. Another intention of the zoo was toprovide visitors with a “total environmental experience.” To this end, the presentationtheme of bioclimatic zones moves away from conventional zoo design in that it pres-ents the animals within microclimates that replicate natural climates, rather thandividing the zoo into different continents or zoogeographic areas (Jones & Jones 1976).
Like Woodland Park, Pardisan was designed at the same time by Wallace McHargRoberts and Todd (WMRT) to provide an ecologically-based zoo environment and vis-itor experience on 1000 acres (400 hectares) in the Iranian desert in metropolitan Tehran(Figure 2.8 in color insert). The name Pardisan derives from the old Persian word par-dis, which means a royal garden where “all good things the earth provides” might beenjoyed, and from which the English word paradise was derived (MandalaCollaborative/Wallace McHarg Roberts Todd 1975). WMRT planned an innovative zooat Pardisan, unprecedented in scale and species diversity, where comparative examplesof adaptation to specific regions of the world were analyzed to discern environmentalanalogues to those found in Iran (Figures 2.9 and 2.10) (McHarg 1996, 294). Jones &Jones worked with WMRT on the zoo design and contributed to species lists and exhib-it scenarios, and the Pardisan work informed the Jones & Jones approach for Woodland
W O O D L A N D P A R K Z O O | 27
Figure 2.9. Animal andplant adaptations to theplateau desert of Iran.
Figure 2.10. Cisterns ashuman adaptations tothe plateau desert ofIran. Source for both: MandalaCollaborative/ Wallace McHargRoberts Todd 1975; illustrations by Colin Franklin.

Park Zoo. Unfortunately, the visionary Pardisan project was never constructed due toradical social and political changes resulting from the Iranian Revolution.
The approach by Jones & Jones for Woodland Park Zoo marked a progressivedeparture from the status quo in zoo design, in which animals are displayed in habi-tats that fail to resemble their natural environment or, even worse, displayed in con-crete cages with metal bars separating them from zoo visitors. Often, social animalsare exhibited in solitary confinement, which leads to unnatural behaviors. In these sit-uations, the animals not only are stripped of their dignity but often lose the chanceof gaining sympathy from zoo visitors, who may see the animals negatively—forexample, describing them as dirty or aggressive (Figure 2.11 in color insert).Additionally, most zoos advance a false image of animals, presenting a disproportion-ately large number of mammalian species and exotic species. In contrast, WoodlandPark Zoo includes animals of regional importance, educating visitors about the biot-ic world immediately surrounding them as well as about environments far from thePacific Northwest (Hancocks 2001).
Zoos have several main purposes: recreation, education, research, and conservation(Jones 1982). In 1993, the World Zoo Organization published the World ZooConservation Strategy, which notes that the greatest purpose of zoos and aquariums isto contribute to the conservation movement, whether directly (through captive breed-ing) or indirectly (through visitor awareness). Furthermore, as noted above, a greateremphasis on local or regional species is needed, as poor land use practices destroy moreand more local habitat across the country. Grant Jones says that the true contribution(and justification) of zoos is the way they increase public awareness and concern forenvironmental issues. Likewise, Hancocks writes: “There is a very different need forzoos today and going to a zoo to see pandas and tigers is no longer sufficient justifica-tion for its existence” (2001, 160).
The priority at Woodland Park Zoo is clearly animal comfort and protection as wellas increasing visitors’ empathy for the animals they see and their wild cousins.Landscape immersion can reinforce emotional and cognitive learning (Berlein 2002).Grant Jones explained how Jones & Jones attempted to re-create the feelings peoplehave when they’re in the wilderness: feelings of being the intruder, of being very smallin a big world. Woodland Park Zoo was designed to give visitors the perspective ofbeing a guest “in the animal’s domain” and of observing animals that behave and inter-act on their own terms.
P U B L I C / P R I V A T E P A R T N E R S H I P
A N D C O L L A B O R A T I O N
Although members of the public were part of the Forward Thrust DevelopmentCommittee, this project was mostly an institutional venture and did not involve citizensin the development of the long-range plan. Today, however, citizens are involved inreviewing the long-range plan as well as in fund-raising efforts for the zoo (Berlein 2002).
28 | B I O D I V E R S I T Y P L A N N I N G A N D D E S I G N
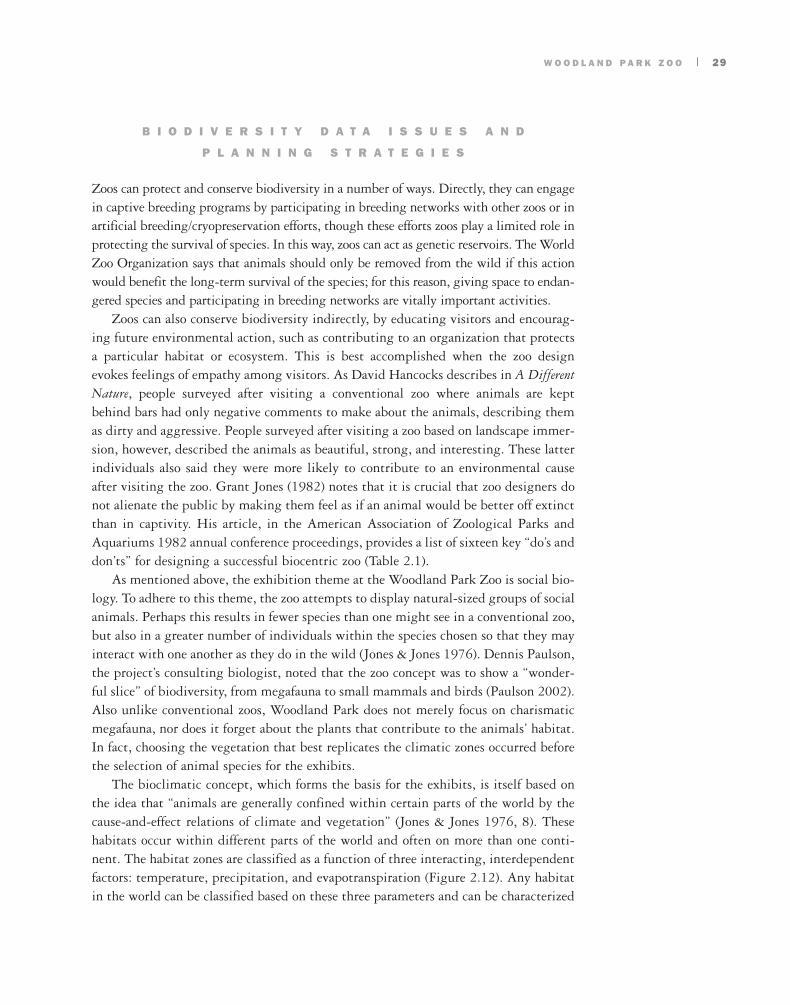
W O O D L A N D P A R K Z O O | 29
B I O D I V E R S I T Y D A T A I S S U E S A N D
P L A N N I N G S T R A T E G I E S
Zoos can protect and conserve biodiversity in a number of ways. Directly, they can engagein captive breeding programs by participating in breeding networks with other zoos or inartificial breeding/cryopreservation efforts, though these efforts zoos play a limited role inprotecting the survival of species. In this way, zoos can act as genetic reservoirs. The WorldZoo Organization says that animals should only be removed from the wild if this actionwould benefit the long-term survival of the species; for this reason, giving space to endan-gered species and participating in breeding networks are vitally important activities.
Zoos can also conserve biodiversity indirectly, by educating visitors and encourag-ing future environmental action, such as contributing to an organization that protectsa particular habitat or ecosystem. This is best accomplished when the zoo designevokes feelings of empathy among visitors. As David Hancocks describes in A DifferentNature, people surveyed after visiting a conventional zoo where animals are keptbehind bars had only negative comments to make about the animals, describing themas dirty and aggressive. People surveyed after visiting a zoo based on landscape immer-sion, however, described the animals as beautiful, strong, and interesting. These latterindividuals also said they were more likely to contribute to an environmental causeafter visiting the zoo. Grant Jones (1982) notes that it is crucial that zoo designers donot alienate the public by making them feel as if an animal would be better off extinctthan in captivity. His article, in the American Association of Zoological Parks andAquariums 1982 annual conference proceedings, provides a list of sixteen key “do’s anddon’ts” for designing a successful biocentric zoo (Table 2.1).
As mentioned above, the exhibition theme at the Woodland Park Zoo is social bio-logy. To adhere to this theme, the zoo attempts to display natural-sized groups of socialanimals. Perhaps this results in fewer species than one might see in a conventional zoo,but also in a greater number of individuals within the species chosen so that they mayinteract with one another as they do in the wild (Jones & Jones 1976). Dennis Paulson,the project’s consulting biologist, noted that the zoo concept was to show a “wonder-ful slice” of biodiversity, from megafauna to small mammals and birds (Paulson 2002).Also unlike conventional zoos, Woodland Park does not merely focus on charismaticmegafauna, nor does it forget about the plants that contribute to the animals’ habitat.In fact, choosing the vegetation that best replicates the climatic zones occurred beforethe selection of animal species for the exhibits.
The bioclimatic concept, which forms the basis for the exhibits, is itself based onthe idea that “animals are generally confined within certain parts of the world by thecause-and-effect relations of climate and vegetation” (Jones & Jones 1976, 8). Thesehabitats occur within different parts of the world and often on more than one conti-nent. The habitat zones are classified as a function of three interacting, interdependentfactors: temperature, precipitation, and evapotranspiration (Figure 2.12). Any habitatin the world can be classified based on these three parameters and can be characterized

by a certain kind of vegetation expected in that life zone—for example, desert or tem-perate rain forest (Figure 2.13).
The bioclimatic zones at Woodland Park Zoo were determined primarily by usingthe Holdridge system, although Dennis Paulson also included some aspects of othersystems before simplifying the procedure to apply it to the zoo. This approach is illus-trated in Figure 2.14. Seattle, when placed on the Holdridge system triangle, can befound near the center, which allows a wide variety of plants to survive there (Jones &Jones 1976). By matching microclimates on site to global bioclimatic zones, the zoodesigners were able to create exhibits that needed little or no modification, such asthose found in temperate rain forest zones. This procedure also allowed the zoo to focussome attention on local habitats and species. Other exhibits needed only moderatemodification (such as the inclusion of heat coils in rocks within the lowland gorilla
30 | B I O D I V E R S I T Y P L A N N I N G A N D D E S I G N
• Viewers should not look down on the animals. Instead, animals should be at or above eyelevel.
• Animals should not be surrounded by viewers, because this does not allow “the dignityapparent when encountered in the wild.” Instead, provide small overlooks that arescreened from one another.
• Keep the animals only as close as their natural flight distances allows. Provide “alternativelocations” within the exhibit so animals may chose where they want to be.
• Do not keep social animals in solitary confinement or in too small groups. In natural-sized groups, natural behaviors will be evident.
• Do not display disfigured or deformed animals, but do provide them with good, off-exhib-it facilities.
• Do not display animals with human artifacts, which promotes anthropocentric attitudes.
• Do not allow props to “steal the show.” Instead, reproduce natural habitat as faithfully aspossible, without exaggeration or distortion.
• Use visible barriers only when absolutely necessary. Make it impossible to tell what con-tains the animals.
• Do not allow human cross viewing. Again, keep overlooks screened from one another.(“Nothing attracts human attention more than other humans.”)
• Put viewing areas on secondary paths so that primary paths are not distracting to eitherpeople or animals.
• Do not allow an entire exhibit to be seen from one overlook.
• The exhibits should replicate the animal’s natural environment.
• Do not put humans in man-made settings and animals in natural settings. Instead,immerse the viewer by extending the natural setting into human-use areas.
• Do not display animals from different habitats together in one natural habitat setting.
• Do not display animals from strikingly different habitats in adjacent spaces. Instead,relate them in habitat complexes that form transitional/ecotonal zones.
• Plan all elements of exhibits concurrently to create an integrated whole.
Table 2.1. Do’s andDon’ts of Zoo Design.Suggestions for designfor a biocentric zoo byGrant Jones: adaptedfrom the AmericanAssociation of ZoologicalParks and Aquariumsannual conference pro-ceedings, 1982.

W O O D L A N D P A R K Z O O | 31
Figure 2.12. All worldhabitats, or bioclimaticzones, can be classifiedthrough the interactionof temperature, climate,and evapotranspiration. Source: Jones & Jones, Architectsand Landscape Architects, Ltd.
Figure 2.13. Map of worldbioclimatic zones. Source: Jones & Jones Architectsand Landscape Architects, Ltd.

exhibit, or maximizing drainage to simulate desert habitats) to duplicate natural bio-climatic zones.
Once the bioclimatic zones were established and the associated vegetation chosen,animal species were selected. The ecologist’s report for the zoo (Paulson n.d.) lists fiveattributes that should be considered when selecting animal species. These criteria areas follows (not in order of importance):
• Education—four factors of which are especially important: social behavior, evo-lutionary adaptations, convergent and parallel evolution, and adaptive radiation
• Interest—similar to education, and the rationale for exhibiting social species• Representation—of diversity• Research—some species, such as those with secretive habits, can be studied
more effectively in a zoo environment• Conservation—of species considered rare or endangered.
As discussed earlier, Jones & Jones based the design of Woodland Park Zoo on theidea of landscape immersion, described in the long-range plan (Jones & Jones 1976,44) as follows:
Ideally, the viewer should move through the characteristic landscape of the bio-climatic zone, seeing its sights and savoring its moods. Only then can we becomeaware that the landscape is also inhabited by animals, separated by unseen barri-ers. The success of this landscape immersion depends entirely upon two factors:
32 | B I O D I V E R S I T Y P L A N N I N G A N D D E S I G N
Figure 2.14. The triangleillustrates the HoldridgeSystem integrated withthe bioclimatic zoneschosen for replication atWoodland Park Zoo.Seattle is located in thecenter of the triangle,making it possible formany types of vegetationto survive with little orno modification of thenatural landscape. Source: Jones & Jones, Architectsand Landscape Architects, Ltd.

1) the completeness with which the characteristic landscape is projected, and 2)the care and accuracy with which the viewpoints and views are located and com-posed, concealing barriers, enhancing perspectives, composing light and shadow,and, most importantly, visually unifying animal space and visual space.
In this way, no sense of separation between the animals and the visitors exists.Examples of specific ways to achieve concealed barriers and other aspects of landscapeimmersion are shown in Figure 2.17. This philosophy, expressed in physical form, iswhat truly moves Woodland Park Zoo away from conventional, anthropocentric design.Jon Charles Coe, a member of the Jones & Jones team, notes that immersion first appealsto the visitors’ emotions and then to their intellect (Hancocks 2001). Careful attentionto pedestrian circulation, the placement of recreation areas, and the bioclimatic sequenceall contribute to the immersion effect. Zones are positioned within the zoo so that natu-ral ecosystem transitions are evident, such as the placement of steppes exhibits next todeciduous forest and taiga exhibits. This attention to gradual transition further immers-es visitors in the natural environments of the species displayed (Figure 2.15).
Conserving biodiversity in zoos seems to rely equally on which species are chosenas well as how those species are exhibited to the public. First and foremost, the com-fort of the animals and their ability to engage in natural behavior must be achieved.Only then, through landscape immersion and the logical next step of cultural reso-nance, do visitors truly recognize animals as they exist in the wild, without bars(Figure 2.16). Cultural resonance is an idea that further shows visitors how animals andhumans can and do (or did) survive side by side. Grant Jones describes this philosophy:“We believe that by combining the ideas of landscape immersion with those of cultur-al resonance, we have allowed the visitor to explore at the gut level, to reap the bene-fits of a feeling of interconnectedness . . . and to really sense our dependency on theplanet for our humanness” (Jones 1989, 412).
One example of the use of cultural resonance is the Asian elephant exhibit atWoodland Park Zoo. Here, human artifacts that played a part in the relationship betweenthe humans and the elephants are included in the exhibit, illustrating the reliance peo-ple in Thailand had on the native elephants. The exhibit winds its way through a wood-
W O O D L A N D P A R K Z O O | 33
Figure 2.15. Two exam-ples of exhibit guidelinesdescribed in the long-range plan for WoodlandPark Zoo that illustratethe principles of land-scape immersion. Source: Jones & Jones, Architectsand Landscape Architects, Ltd.
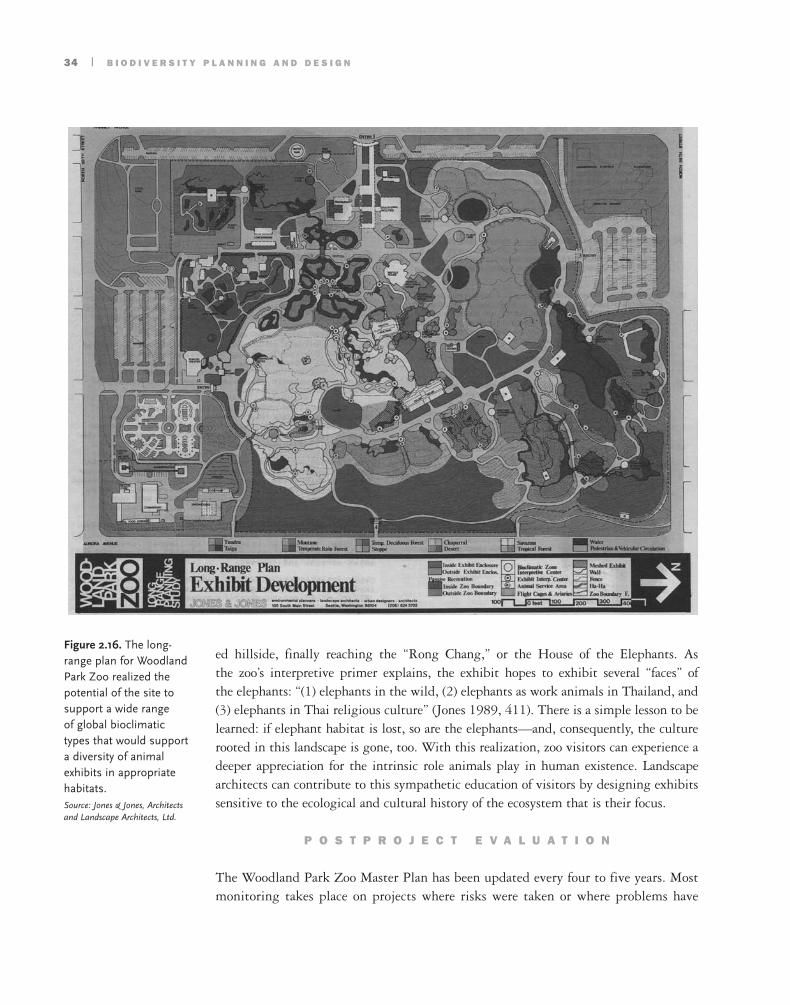
ed hillside, finally reaching the “Rong Chang,” or the House of the Elephants. As the zoo’s interpretive primer explains, the exhibit hopes to exhibit several “faces” of the elephants: “(1) elephants in the wild, (2) elephants as work animals in Thailand, and(3) elephants in Thai religious culture” (Jones 1989, 411). There is a simple lesson to belearned: if elephant habitat is lost, so are the elephants—and, consequently, the culturerooted in this landscape is gone, too. With this realization, zoo visitors can experience adeeper appreciation for the intrinsic role animals play in human existence. Landscapearchitects can contribute to this sympathetic education of visitors by designing exhibitssensitive to the ecological and cultural history of the ecosystem that is their focus.
P O S T P R O J E C T E V A L U A T I O N
The Woodland Park Zoo Master Plan has been updated every four to five years. Mostmonitoring takes place on projects where risks were taken or where problems have
34 | B I O D I V E R S I T Y P L A N N I N G A N D D E S I G N
Figure 2.16. The long-range plan for WoodlandPark Zoo realized thepotential of the site tosupport a wide range of global bioclimatictypes that would supporta diversity of animalexhibits in appropriatehabitats. Source: Jones & Jones, Architectsand Landscape Architects, Ltd.
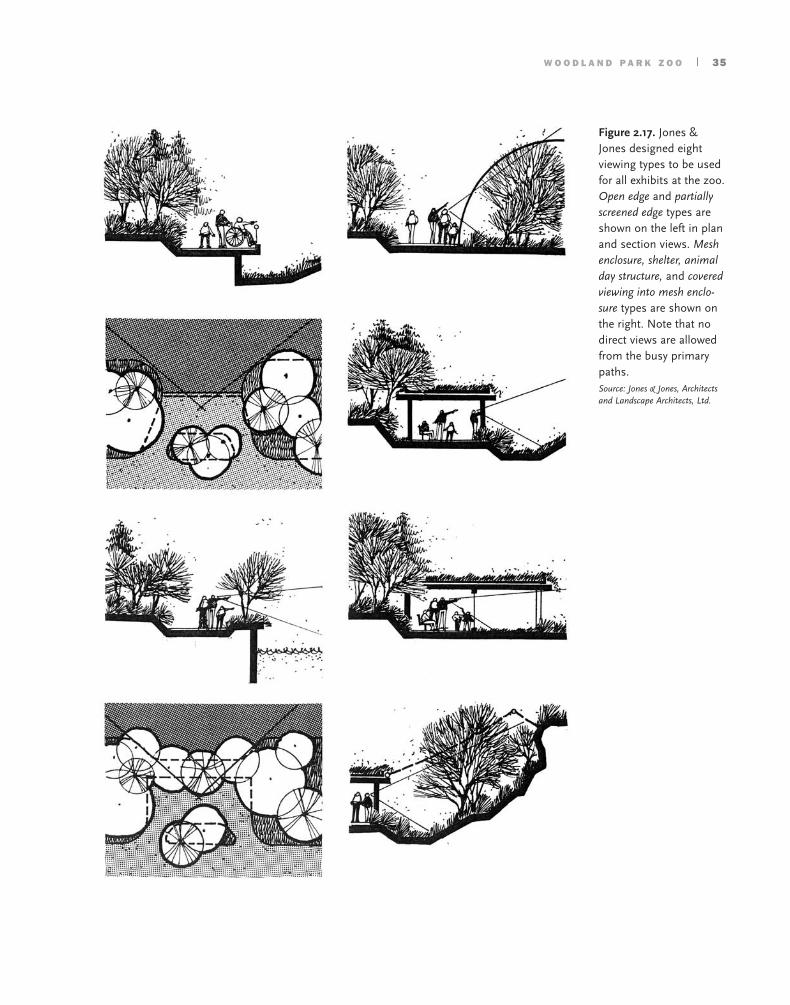
W O O D L A N D P A R K Z O O | 35
Figure 2.17. Jones &Jones designed eightviewing types to be usedfor all exhibits at the zoo.Open edge and partiallyscreened edge types areshown on the left in planand section views. Meshenclosure, shelter, animalday structure, and coveredviewing into mesh enclo-sure types are shown onthe right. Note that nodirect views are allowedfrom the busy primarypaths. Source: Jones & Jones, Architectsand Landscape Architects, Ltd.
occurred—such as when an animal has escaped or when large amounts of vegetationhave failed to thrive. Dennis Paulson explains that monitoring is the zoo’s responsibil-ity but that it usually isn’t done. Grant Jones notes that zoo monitoring is often toosimplistic and thus can reach the wrong conclusions. For example, if a tree dies in anexhibit, zoo staff may believe that it is best not to replace it. The correct response, how-ever, might be to plant more trees in order to establish a microclimate more conduciveto the tree’s needs.
All participants interviewed said that it was important for zoos to be willing totake risks and to move beyond conservative, conventional design in order to truly besuccessful in providing quality habitat for the resident animals. Monitoring mustaddress both animal and human responses. A zoo’s success has conventionally beendefined in terms of maintenance ease first, visitor appreciation second, and animalcomfort third. In the new mind-set, however, this order would be reversed. Creatingand maintaining exhibits that cater to the animals’ needs and the immersion of view-ers is not an easy task. It is, however, the only way that zoos will truly fulfill their obli-gations to the species they house.
Zoos present a new frontier for the protection of biodiversity, though their mainrole in this endeavor is often an indirect one. As David Hancocks (2001, 177) explains:
It is time for zoos to reexamine their philosophies. People no longer need to visita zoo to see what a camel or leopard looks like so much as to gain a better under-standing of the dynamic systems of Nature and the interconnections withinecosystems, and most especially how to help conserve biological diversity on theplanet. Zoos need to make the concept of biodiversity not just intelligible butwonderful to their audiences. It must be seen not just as fascinating, but asabsolutely critical to the continuing health and well-being of people.
Landscape architects and planners can play an integral role in the future evolutionof zoos as a unique application of biodiversity planning. Sensitive zoo design that suc-cessfully immerses viewers in the environment of the animals observed increases public awareness of a broad range of environmental issues, including biodiversity andhabitat protection. Therefore, while the scale of a zoo site may be relatively small, itcan have a far-reaching effect on biodiversity. It must be noted that many zoos haveattempted landscape immersion techniques since Woodland Park Zoo was designed in1976 (Clay 1980), and there is some danger in imitating only the process and not theunderlying intent.
Landscape immersion is not simply naturalistic landscaping. Although, certainly,general principles exist that may be useful to all, zoo design should be specific to thesite and to the animals that will live there. As Jones & Jones have said, the animal isthe client, and this perspective can help the designer avoid conventional solutions. Inthis design application, as well as in many others, landscape architects play an impor-tant role as synthesizers of varied scientific and cultural information.
36 | B I O D I V E R S I T Y P L A N N I N G A N D D E S I G N

Planning for biodiversity requires coordinated preservation that employs defensive, offen-sive, and opportunistic strategies. A massive amount of upland and wetland habitat hasbeen lost to urban development across the world. Some became disheartened by this lossand assumed a defensive posture and tried to stop all manner of change. Others, however,see the potential to re-create habitat opportunistically as part of the development process.The Devens, Massachusetts case is an example of the latter. It demonstrates how biodiversi-ty improvement and wetland creation can be tagged on to development projects, to buildpublic support, facilitate permitting, and produce net benefits for biodiversity as a result.
In the late 1980s, the U.S. government began closing major military bases nation-wide, including Fort Devens in Ayer, Massachusetts. Like many other communitiesacross the nation that faced base closings, local residents, merchants, and regionalpoliticians feared economic hardship (White House 1999; Washington TranscriptService 1998). The federal government’s plan for the reuse of the Devens site wasdiverse and promised 3,500 jobs for the area. The plan called for a combined federalprison and regional medical facility, an Army job training program, a business tech-nology park, and programs for homeless relief. Portions of the post were designated fordonation to the nearby Oxbow National Wildlife Refuge.
Initially, the process of redeveloping Fort Devens was fraught with obstacles. TheU.S. Environmental Protection Agency (EPA) had listed the post as a Superfund siteand began an investigation into fifty-four potential and known hazardous waste siteson the former Army post. Citing prior cases of difficult base closings, critics estimat-ed the time frame for the transition process at twenty to thirty years. In addition, anyplans had to navigate the difficult waters of town politics as the site straddled threecommunities, and special legislation and zoning changes required that plans beapproved by all three adjacent communities, each of which held different views of whatthey wanted to see in the redeveloped Devens. According to an article in the December9, 1994, Boston Globe, the working-class residents of Shirley and Ayer wanted jobopportunities and no increased tax burden, while the more affluent residents ofHarvard were more concerned about the environment.
C H A P T E R 3
D E V E N S F E D E R A L M E D I C A L C E N T E R C O M P L E X :
S T O R M W A T E RP R O J E C T
An October 2, 1993, Associated Press story in the Boston Globe described how Congresshad approved $74.6 million for a 240-acre (97.1-hectare) federal prison medical complexat the site, which was to be the first project launched on the former post. However, beforeany work could begin, the governor, the military, the surrounding communities, and theFederal Bureau of Prisons all had to approve the plan. The landscape architecture firm ofCarol R. Johnson and Associates (CRJA) of Boston provided creative stormwater mitiga-tion designs for the federal prison medical complex and was instrumental in leading thepermitting process that set the tone for the redevelopment of the entire site.
P R O J E C T D A T A
The site is located thirty-five miles west of Boston, Massachusetts, on the former FortDevens Army post, adjacent to the towns of Ayer, Harvard, and Shirley. The Devensstormwater project was developed in the context of the permitting process and envi-ronmental impact report for a federal medical prison facility. CRJA were the projectlandscape architects responsible for designing the project in 1994–95, and they super-vised project construction from 1995 to 1997 (Carol R. Johnson Associates 2002). Thetransformation of the Devens site became a new model for base redevelopment inwhich public concerns and desires were integrated with government plans.
CRJA began their work by assessing the natural history of the area. When exam-ining historical photos, they found that a stream that ran through the site was fed byan underground spring and had once been much larger. Further research revealed thatthe Army’s construction of a golf course had altered and culvertized the original streamcorridor in the 1960s and reduced the flow significantly. Because of these modifica-tions, the stream was deemed to have inadequate hydrologic capacity for stormwaterflood control for the project. It had been channelized, was heavily silted, and receiveduntreated surface discharge from both on- and off-site sources. CRJA aimed to trans-form the stream into a series of ponds that would not only provide greater flood storage capacity to accommodate estimated stormwater flows from the proposed construction but also to act like an undisturbed system would, filtering runoff andtreating stormwater prior to discharging it into nearby Mirror Lake (Figure 3.1). Inaddition, the ponds were designed to provide breeding and feeding habitat for fish andother wildlife (Carol R. Johnson Ecological Services 1995).
After receiving approval, the project was constructed in phases. The first phase wasto dechannelize the stream and relocate it to the north of the parking lot. During thenext phase, the streambed was transformed into a connected pond system with threebasins fed by runoff and a spring. The first basin was for sedimentation, the second wasfor filtration, and the third, which followed a gentle aeration cascade, was a deep, cold-water pool complete with a spawning shelf for fish and amphibians and a small islandmade by carefully excavating and grading around existing trees (Figures 3.2 and 3.3in color insert) (Carol R. Johnson Associates 2002).
The system is designed to store stormwater during ten-year-peak storm periods with
38 | B I O D I V E R S I T Y P L A N N I N G A N D D E S I G N
D E V E N S F E D E R A L M E D I C A L C E N T E R C O M P L E X : S T O R M W A T E R P R O J E C T | 39
the aid of a weir and berm at the downstream edge of the third pond (Carol R. JohnsonEcological Services 1995; Carol R. Johnson Associates 2002). During construction,cocoa fiber mats and coir rolls planted with wetland vegetation from Bestmann GreenSystems were placed along the banks of all three ponds (Figures 3.4 and 3.5 in colorinsert). This bioengineering prevented erosion during construction and helped establishpermanent, native wetland vegetation and wildlife habitat along the waterway.
While the construction eliminated wetlands in the western portion of the site toallow for parking and buildings, the eastern part was excavated for stream relocationand pond construction. When the project was completed, it increased the total amountof surface water area by nearly fifteenfold, from 1,379 square feet to 20,104 square feet(128m2, 1867m2) and added an additional 11,310 square feet (1050m2), of vegetatedwetland (Carol R. Johnson Ecological Services 1995). In addition, the landscape archi-tects took great care to preserve as many mature trees on the site as possible by relo-cating or working around them (Figure 3.6 in color insert) (Carol R. JohnsonAssociates 2002). Clearly, the project produced a net gain in wetlands.
P R O J E C T P A R T I C I P A N T S
The Federal Bureau of Prisons hired the architecture firm of Stubbins Associates of Bostonto oversee the design and construction of a federal medical center complex for medium-and low-security inmates on the 300-acre (121.4-hectare) site consisting of wooded slopes,wetlands, streams, an Army hospital, and half of an ex-military golf course, all of which islocated over a regional aquifer (Carol R. Johnson Ecological Services 1995).
The original Federal Bureau of Prisons plans showed buildings and parking areasspread throughout the site. This construction would have involved major grading ofslopes, clearing woods, and filling wetlands. In an unusual move, Stubbins Associatesappointed CRJA as the site team leaders and placed Bryant Associates Inc., the civilengineers on the project, under the direction of the landscape architects. In the leadrole, CRJA proposed a bold alternative to confine buildings and parking to an alreadycleared and level 45-acre (18.2 hectare) plateau. The new design for the prison facilitynecessitated the clearing of only fifteen additional acres (six hectares) of land and therelocation of 1,400 square feet (130m2) of a stream and part of its bordering vegetat-ed wetland. This preserved the remaining 240 acres (97.1 hectares) of the site for openspace, wetland, and woodland (Carol R. Johnson Ecological Services 1995). Workingwith representatives from the Federal Bureau of Prisons, Stubbins Associates, BryantAssociates, and Wendi Goldsmith (now of The Bioengineering Group), CRJA land-scape architects and their senior ecologist Charlotte Cogswell assessed the site andworked to minimize impacts and improve the ecological functions of the site. Theydesigned a water quality renovation system to improve groundwater recharge, floodcontrol, and wildlife habitat while preserving existing forest and transforming theexisting golf course into a natural meadow (Carol R. Johnson Associates 2002; CarolR. Johnson Ecological Services 1995).

40 | B I O D I V E R S I T Y P L A N N I N G A N D D E S I G N
CRJA landscape architects Randy Sorensen and John Amodeo were well versed inecological aspects of the project and maintained clear communication with Cogswellthroughout the process (Carol R. Johnson Associates 2000). CRJA not only worked toassess the site and design a solution but also collaborated with local governments andthe Devens Enterprise Commission Regulatory Authority (DEC) to take their needsinto consideration. Thus CRJA acted not only as designers but also as facilitators, asthey steered the controversial project through the permitting process and helped theFederal Bureau of Prisons pioneer a progressive environmental solution, one thatwould serve as a model for redeveloping the entire area of Fort Devens.
P R O J E C T G O A L S A N D O B J E C T I V E S
From the beginning, CRJA viewed the Devens project as fulfilling multiple purposes.Its primary purpose was to treat and slow down stormwater from the built areas of theprison facility while providing overflow capacity for a one-hundred-year storm.However, CRJA also aimed to restore the historical stream corridor, provide morewildlife habitat both near and in the pond series, and create an aesthetically pleasingsite for prison staff and visitors.
CRJA perceived the greater potential of this project because they understood the mul-tiple issues and opportunities related to the small stream. They understood that federaldefense base closings are typically controversial because they affect neighboring towns onmany levels. They also realized that the area was already in the spotlight for environmen-tal concerns because of its EPA Superfund listing, the presence of the nearby OxbowNational Wildlife Refuge and the Nashua River, the impacts of lighting pollution fromthe prison on bird migration routes, and the proximity of an underground aquifer.
Knowing that politicians, local governments, and the public wanted to see that aproject has more benefits than liabilities, CRJA decided to add biodiversity enhance-ment to a list of improvements in order to gain support from a wider audience and toimprove the prospects for fast-track permit approvals. Their proactive approach, cou-pling stormwater and wildlife benefits, was presented to local authorities as an improve-ment over existing conditions, which helped to ease the permitting process for theprison. Initially, the representatives at the Federal Bureau of Prisons were reluctant toadopt the more expensive design, but CRJA convinced them that the environmentallyfriendly approach would accelerate the permitting process while complying with newenvironmental regulations for federal projects mandating that work must go beyondcompliance by being environmentally progressive (Carol R. Johnson Associates 2002).
Rather than becoming mired down in local controversy over the proposed prison, theproject moved forward quickly, replacing the void left in the local economy by the closedmilitary post. Arguably, the entire process was a win for all parties because the projectboosted the local economy by creating high-quality jobs at the medical facility, improvedthe stormwater management at the site, provided more wildlife habitat than had previ-ously existed, and served as a model for future redevelopment at Devens and beyond.

P U B L I C / P R I V A T E P A R T N E R S H I P
A N D C O L L A B O R A T I O N
The Devens project represents a successful partnership between public and privateinterests; it was designed and constructed by private firms working for the FederalBureau of Prisons. The project also required CRJA staff to collaborate with nearbytowns and the DEC to understand and respond to local concerns. Surroundingtowns were interested in the economic opportunities promised by the prison facil-ity, but as stated above, many citizens were also concerned about environmentalimpacts. CRJA presented the project’s environmental benefits to the publicthrough a series of public workshops.
B I O D I V E R S I T Y D A T A I S S U E S A N D
P L A N N I N G S T R A T E G I E S
Original, site-specific biodiversity data were generated for the Devens project. Awildlife reconnaissance and assessment was conducted in May 1994 by CharlotteCogswell and an ornithologist. They performed a field census of the types and qualityof wildlife habitat at the site and looked for tracks, sounds, and other evidence of inver-tebrates, amphibians, mammals, and birds in the golf course stream, in nearby forest-ed wetlands, and in the mixed hardwood/conifer forest. They found that amphibianbreeding areas were limited along the stream due to channelization of the streamcourse. The stream also suffered from low flow and was nearly stagnant in some areasfrom silt and sediment deposited from crosswalk culverts (Carol R. Johnson EcologicalServices 1995). The forested wetland and forest were observed to contain red-backedsalamander (Plethodon cinereus), eastern chipmunk (Tamias striatus), raccoon (Procyonlotor), and several bird species. In the surrounding area, they found evidence of breed-ing habitat for many species, including but not limited to bullfrogs (Rana catesbeiana),Canada geese (Branta canadensis), killdeer (Charadrius vociferus), American robins(Turdus migratorius), red-winged blackbirds (Agelaius phoeniceus), and short-tailedshrews (Blarina brevicouda). The upland mixed hardwood and conifer forest offeredhabitat for red-tailed hawks (Buteo jamaicensis), hairy woodpeckers (Picoides villosus),warblers, jays, and other birds (Carol R. Johnson Ecological Services 1995).
A complete inventory of species found at the site is listed in Table 3.1. The assess-ment determined the limits of the bordering vegetative wetland that contained willow(Salix spp.), red maple (Acer rubrum), ash (Fraxinus spp.), and rush (Jurnas spp.). They alsonoted that the nearby Oxbow National Wildlife Refuge contains state-listed rare wet-lands wildlife habitat as shown in the 1994 Atlas of Estimated Habitats of State-listedRare Wetlands Wildlife, produced by the Massachusetts Natural Heritage andEndangered Species Program.
The Devens site was designed to restore the riparian function of the stream chan-nel, improve stormwater management, and improve wildlife habitat. This tripartite
D E V E N S F E D E R A L M E D I C A L C E N T E R C O M P L E X : S T O R M W A T E R P R O J E C T | 41
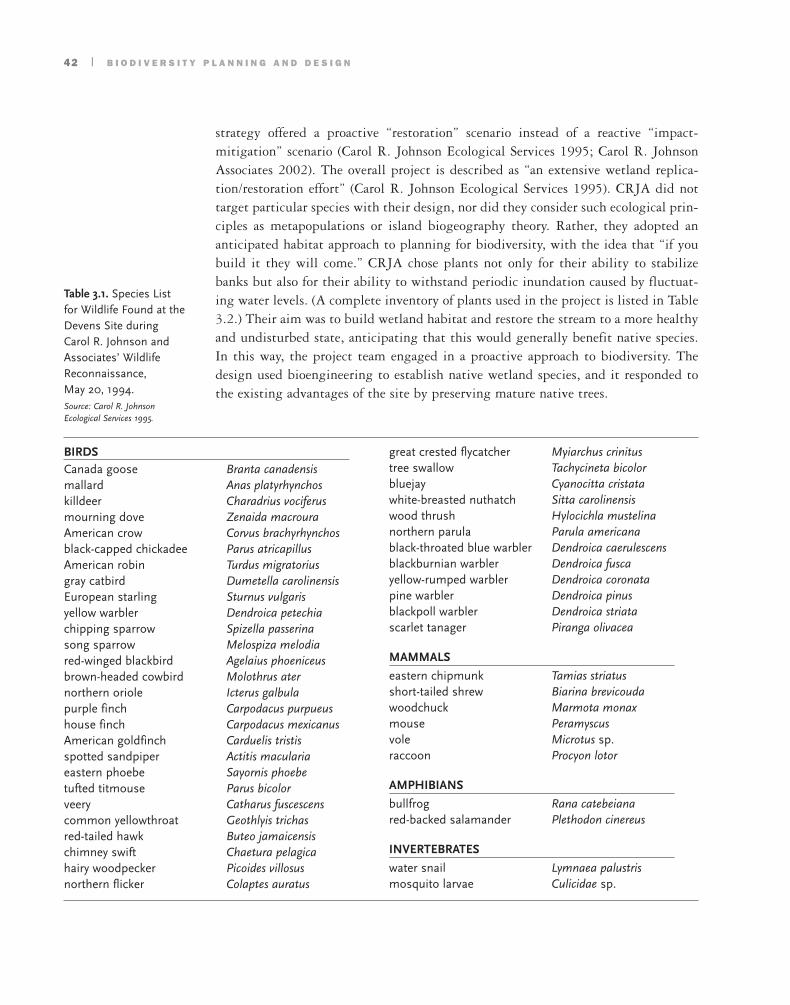
strategy offered a proactive “restoration” scenario instead of a reactive “impact-mitigation” scenario (Carol R. Johnson Ecological Services 1995; Carol R. JohnsonAssociates 2002). The overall project is described as “an extensive wetland replica-tion/restoration effort” (Carol R. Johnson Ecological Services 1995). CRJA did nottarget particular species with their design, nor did they consider such ecological prin-ciples as metapopulations or island biogeography theory. Rather, they adopted ananticipated habitat approach to planning for biodiversity, with the idea that “if youbuild it they will come.” CRJA chose plants not only for their ability to stabilizebanks but also for their ability to withstand periodic inundation caused by fluctuat-ing water levels. (A complete inventory of plants used in the project is listed in Table3.2.) Their aim was to build wetland habitat and restore the stream to a more healthyand undisturbed state, anticipating that this would generally benefit native species.In this way, the project team engaged in a proactive approach to biodiversity. Thedesign used bioengineering to establish native wetland species, and it responded tothe existing advantages of the site by preserving mature native trees.
42 | B I O D I V E R S I T Y P L A N N I N G A N D D E S I G N
BIRDSCanada goose Branta canadensismallard Anas platyrhynchoskilldeer Charadrius vociferusmourning dove Zenaida macrouraAmerican crow Corvus brachyrhynchosblack-capped chickadee Parus atricapillusAmerican robin Turdus migratoriusgray catbird Dumetella carolinensisEuropean starling Sturnus vulgarisyellow warbler Dendroica petechiachipping sparrow Spizella passerinasong sparrow Melospiza melodiared-winged blackbird Agelaius phoeniceusbrown-headed cowbird Molothrus aternorthern oriole Icterus galbulapurple finch Carpodacus purpueushouse finch Carpodacus mexicanusAmerican goldfinch Carduelis tristisspotted sandpiper Actitis maculariaeastern phoebe Sayornis phoebetufted titmouse Parus bicolorveery Catharus fuscescenscommon yellowthroat Geothlyis trichasred-tailed hawk Buteo jamaicensischimney swift Chaetura pelagicahairy woodpecker Picoides villosusnorthern flicker Colaptes auratus
great crested flycatcher Myiarchus crinitustree swallow Tachycineta bicolorbluejay Cyanocitta cristatawhite-breasted nuthatch Sitta carolinensiswood thrush Hylocichla mustelinanorthern parula Parula americanablack-throated blue warbler Dendroica caerulescensblackburnian warbler Dendroica fuscayellow-rumped warbler Dendroica coronatapine warbler Dendroica pinusblackpoll warbler Dendroica striatascarlet tanager Piranga olivacea
MAMMALS
eastern chipmunk Tamias striatusshort-tailed shrew Biarina brevicoudawoodchuck Marmota monaxmouse Peramyscusvole Microtus sp.raccoon Procyon lotor
AMPHIBIANS
bullfrog Rana catebeianared-backed salamander Plethodon cinereus
INVERTEBRATES
water snail Lymnaea palustrismosquito larvae Culicidae sp.
Table 3.1. Species List for Wildlife Found at theDevens Site during Carol R. Johnson andAssociates’ WildlifeReconnaissance, May 20, 1994. Source: Carol R. JohnsonEcological Services 1995.

D E V E N S F E D E R A L M E D I C A L C E N T E R C O M P L E X : S T O R M W A T E R P R O J E C T | 43
P O S T P R O J E C T E V A L U A T I O N
The project met the measurable objectives set out by CRJA: the permit was granted,the design was implemented, and the bioengineering aspects worked to prevent ero-sion and to jump-start the revegetation of the area with native species. The project isviewed as a model for future action by the DEC because CRJA helped the commissionwrite its wetland protection regulations. The DEC serves as the wetland protectionregulatory authority for the area and enforces the Massachusetts Wetlands ProtectionAct and the pursuant regulations (Devens Enterprise Commission RegulatoryAuthority 1999).
The Devens project has received attention from professionals who regard it as botha technical and an aesthetic success. It garnered an Environmental Achievement Awardfrom the International Erosion Control Association for its combination of multiple
ice cutgrass Leersia oryziodesfowl bluegrass Poa palustrisrattlesnake mannagrass Glyceria canadensisfowl Manna grass Glyceria striatablue flag Iris versicolorcardinal flower Lobelia cardinalismonkeyflower Mimulus ringenssweetflag Acorus calamustussock sedge Carex strictashallow sedge Carex luridafringed sedge Carex crinitastalk-grain sedge Carex stipataCanadian rush Juncus canadensiscommon rush Juncus effususbluejoint reedgrass Calamagrostis canadensisboneset herb Eupatorium perfoliumbulrush Scirpus rubrotinctusriver bulrush Scirpus fluviatilisnarrow-leaf cattail Typha angustifoliabur-reed SparaganiumAmerican waterplantain Alisma plantagoarrow arum Peltandra virginicapickerelweed Pontedoria cordatathree-square reed Scirpus americanusneedle leaf arrowhead Saggitaria latifolia
buttonbush Cephalanthus occidentalissilky dogwood Cornus amomumredosier dogwood Cornus stoliniferagoat willow Salix purpureaelderberry Sambucus canadensis
ebel tall fescue Festuca arundinaceapalmer perennial ryegrass Lolium perenneJamestown chewing fescue Festuca rubra L. subsp.
CommutataIndian grass Sorghastrum nutansblackwell switchgrass Panicum virgatumlittle bluestem Schizachyrium scopariumblue joint reedgrass Calamagrostis canadensisalpine pussy toes Antennaria roseapurple coneflower Echinacea purpureaox-eye daisy Chrysanthemum
leucanthemumblackeyed Susan Rudbeckia hirta
inkberry Ilex glabrawinterberry Ilex verticillatasquashberry Viburnum edulespicebush Lindera benzoinsweetpepperbush Clethra alnifoliadwarf witchhalder Fothergilla gardeniiswamp azalea Rhododendron viscosummountain laurel Kalmia latifoliagray birch Betula populifoliariver birch Betula nigratupelo Nyssa sylvaticared maple Acer rubrumshadbush AmelanchierAmerican larch Larix laricinaCanada hemlock Tsuga canadensiswhite pine Pinus strobes
Table 3.2. Species list for plants used at theDevens site by Carol R.Johnson and Associates(CRJA Ecological Services 1995).

features and multipurpose design goals (Goldsmith and Barret 1998; Barrent 1997),and it was featured in Landscape Architecture as an example of how detention ponds neednot be “ugly single-purpose holes dug in the earth” (Thompson 1999, 44). Similarly, inthe book Sustainable Landscape Construction, authors Thompson and Sorvig note that “thiscarefully engineered series of ponds looks as if it has always been there” (2000, 15).
The project ran into several roadblocks along the way. The government’s FederalAppearances Memo dictated conservative limits on government spending intendedsolely for aesthetic purposes, forcing the elimination of native plantings close to theprison building; however, the bioengineering and herbaceous and woody wetlandplantings within the vegetated wetland border that were associated with permits wereretained. The project also tested everyone’s faith in the design as significant waterdrawdown occurred during construction. Because of an unusually dry summer, theponds filled slowly. For a brief period, it seemed as though CRJA had designed big,ugly holes in the earth (Carol R. Johnson Associates 2002).
The project presents some limits and drawbacks. No formal water quality testinghas been done at the site, although changing the surrounding golf course into nativemeadows is expected to improve water quality by reducing contamination from turffertilizers and chemicals. Field assessments of water quality entailed walk through andextrapolation by reading the site history (Carol R. Johnson Associates 2002). In addi-tion, ecologist Charlotte Cogswell lamented the lack of monitoring. Because the clientdid not require monitoring, no funds were allocated for postconstruction analysis ofthe project. However, anecdotal evidence of wildlife at the site exists; prison staff hasreported seeing red-tailed hawks (Buteo jamaicensis), red foxes (Vulpes vulpes), and othermammals near the ponds. Such lack of monitoring is a common problem for landscaperestoration projects. Often, design projects allocate minimal funds for postconstructionactivities at a site, and what funds do exist are usually usurped by maintenance costs.As for maintenance, CRJA‚s design requires annual dredging of the sedimentationpond to prevent it from becoming a wet meadow and losing its aquatic habitat func-tionality (Carol R. Johnson Associates 2002).
The project missed a key opportunity to create stronger links with the OxbowNational Wildlife Refuge. It seems that CRJA was instructed by the Federal Bureau ofPrisons to have no contact with parties except those involved in permitting; as a result,they did not have a chance to consult with the manager of the Oxbow National WildlifeRefuge, Tim Pryor. According to Pryor, although Mass Development (the authorityresponsible for overseeing the redevelopment of the post) did pass on some of the gen-eral stormwater basin plans, he never had any direct contact with anyone from CRJA(Pryor 2002). Pryor did not express concerns about the impacts that the project mighthave on the refuge, since none of the basins discharges directly into the refuge, but hecould have been another source of biodiversity information if CRJA had looked moreclosely at landscape-scale connectivity opportunities for the habitat created at the site.
Judging from the relative speed of the permitting process and acceptance by thesurrounding towns, the project has been well received by the public. A search of the
44 | B I O D I V E R S I T Y P L A N N I N G A N D D E S I G N
media reveals no postconstruction criticism of the project, and indeed the conversionof the entire Devens site seems to have progressed smoothly. Today the Devens rede-velopment area appears to be fulfilling its goal of providing economic opportunities forthe region. As demonstrated by this project, landscape architects can lead clientsthrough the process of developing sites in a more strategic way that simultaneouslyenhances site ecology and facilitates permitting processes, particularly in states withstrict environmental regulations such as Massachusetts.
D E V E N S F E D E R A L M E D I C A L C E N T E R C O M P L E X : S T O R M W A T E R P R O J E C T | 45

Wetlands are well recognized as hotspots of biodiversity and providers of numeroushydrological, ecological, economic, and recreational functions (Table 4.1) (Pollack,Naiman, and Hanley 1998). Early environmental policy in the United States offered lit-tle protection and, in fact, enabled wetland drainage and filling on a widespread scalefor agriculture and urban development. Of the 224 million acres (90.6 million hectares)of wetlands originally found in the lower forty-eight states, 53 percent has been lost(Dahl 2000). Although wetlands loss has declined in recent years, about 1.2 millionacres (485,633 hectares) were lost in the United States from 1985 to 1995. The CleanWater Act’s goal of achieving “no net loss” of wetlands in the United States has yet tobe achieved. As noted by the Associated Press on September 17, 1997, the amount ofwetlands continues to shrink even though 78,000 acres (31,566 hectares) are restored ormitigated annually in the United States (U.S. Fish and Wildlife Service 1997).
Wetland ecosystems are estimated to be second to tropical rain forests in the num-bers of plant and animal species that depend on them for food and habitat(Environmental Defense and the Texas Center for Policy Studies 2003). Although theycover only 1 percent of the earth’s surface, freshwater wetlands are believed to holdmore than 40 percent of all species on earth, and 12 percent of animal species (RAM-SAR 2003). The biodiversity found in wetlands sustains a valuable reservoir of genet-ic material that is vital to maintaining a sufficient level of variation as a buffer againstdiseases and pests in food crops. Additionally, wetlands, as important components oflarger undisturbed ecosystems, have aesthetic values that can be quantified throughrevenues generated by ecotourism and by the amount that individuals and institutionsare willing to pay for the conservation of species and ecosystems (Table 4.1).
Wetlands in populated and coastal areas are often isolated or surrounded by inten-sive land uses. The contemporary demand for space to support agriculture, urban devel-opment, and infrastructure routinely conflicts with and isolates these relict wetlands. Inresponse to this inherent conflict of land use and space, wetland mitigation has becomea common practice in most broad-scale land development projects (Zedler 1996). Inmost mitigation projects, new wetlands are “created” or restored to compensate for the
C H A P T E R 4
C R O S S W I N D S M A R S H
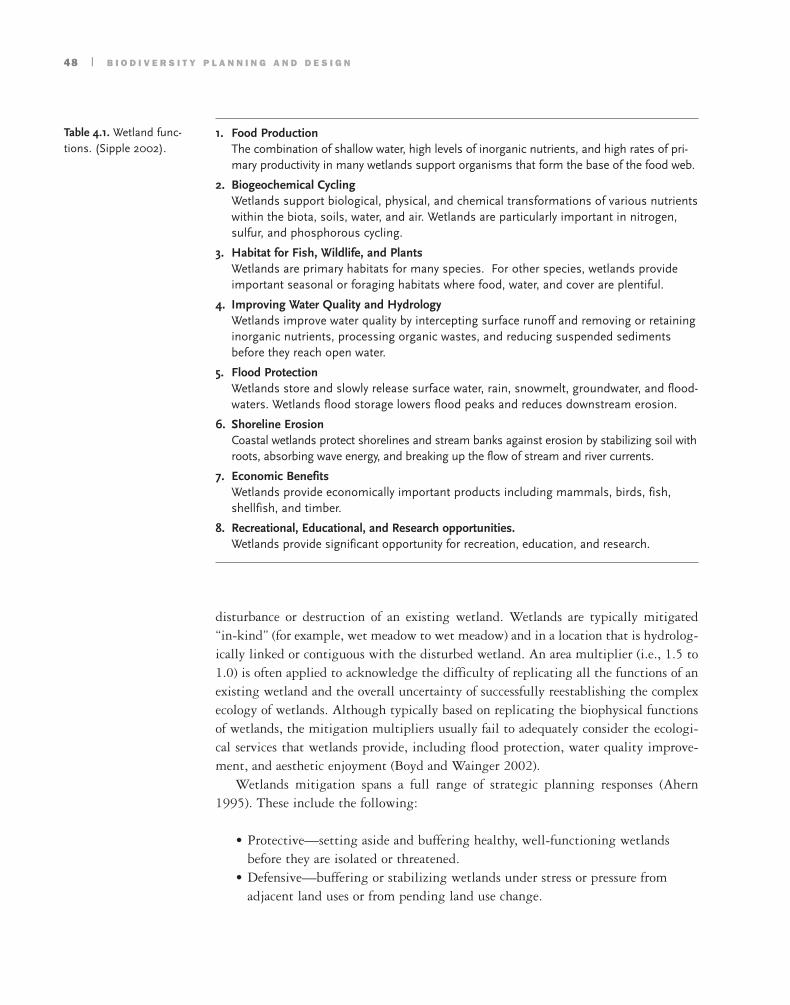
disturbance or destruction of an existing wetland. Wetlands are typically mitigated “in-kind” (for example, wet meadow to wet meadow) and in a location that is hydrolog-ically linked or contiguous with the disturbed wetland. An area multiplier (i.e., 1.5 to1.0) is often applied to acknowledge the difficulty of replicating all the functions of anexisting wetland and the overall uncertainty of successfully reestablishing the complexecology of wetlands. Although typically based on replicating the biophysical functionsof wetlands, the mitigation multipliers usually fail to adequately consider the ecologi-cal services that wetlands provide, including flood protection, water quality improve-ment, and aesthetic enjoyment (Boyd and Wainger 2002).
Wetlands mitigation spans a full range of strategic planning responses (Ahern1995). These include the following:
• Protective—setting aside and buffering healthy, well-functioning wetlandsbefore they are isolated or threatened.
• Defensive—buffering or stabilizing wetlands under stress or pressure fromadjacent land uses or from pending land use change.
48 | B I O D I V E R S I T Y P L A N N I N G A N D D E S I G N
1. Food ProductionThe combination of shallow water, high levels of inorganic nutrients, and high rates of pri-mary productivity in many wetlands support organisms that form the base of the food web.
2. Biogeochemical CyclingWetlands support biological, physical, and chemical transformations of various nutrientswithin the biota, soils, water, and air. Wetlands are particularly important in nitrogen,sulfur, and phosphorous cycling.
3. Habitat for Fish, Wildlife, and PlantsWetlands are primary habitats for many species. For other species, wetlands provideimportant seasonal or foraging habitats where food, water, and cover are plentiful.
4. Improving Water Quality and HydrologyWetlands improve water quality by intercepting surface runoff and removing or retaininginorganic nutrients, processing organic wastes, and reducing suspended sedimentsbefore they reach open water.
5. Flood ProtectionWetlands store and slowly release surface water, rain, snowmelt, groundwater, and flood-waters. Wetlands flood storage lowers flood peaks and reduces downstream erosion.
6. Shoreline ErosionCoastal wetlands protect shorelines and stream banks against erosion by stabilizing soil withroots, absorbing wave energy, and breaking up the flow of stream and river currents.
7. Economic BenefitsWetlands provide economically important products including mammals, birds, fish,shellfish, and timber.
8. Recreational, Educational, and Research opportunities.Wetlands provide significant opportunity for recreation, education, and research.
Table 4.1. Wetland func-tions. (Sipple 2002).

C R O S S W I N D S M A R S H | 49
• Offensive—creating or restoring “new” wetlands to compensate for wetlandslost previously in the local environment or elsewhere.
• Opportunistic—realizing multiple or collateral benefits through wetlands miti-gation and taking advantage of special opportunities associated with develop-ment (e.g., stormwater management, recreation, or environmental education).
Conservation planning generally follows a protective strategy that focuses onhotspots of biodiversity. In most development projects, defensive or offensive strategiesare applied to minimize impact on wetlands and to restore wetland functions, includ-ing biodiversity (Arendt 1999; Lecesse 1996).
Landscape architects and planners are regularly involved with all phases of wetlandmitigation projects, including wetland delineation, project planning and design, mit-igation planning and permitting, construction supervision, and postconstruction mon-itoring. The field of ecological restoration holds great potential for landscape architectsbut may require new pedagogical approaches, including significant and credible fieldexperience (Owens-Viani 2002).
Mitigation projects challenge practitioners to realize multiple functions that maynot have existed previously or to integrate mitigated wetlands into a broader, multi-purpose landscape project. If project planning and design can move toward an inte-grated response that combines multiple strategies, great opportunities exist to restoreecological and hydrological functions and to add value and meaning for human use andeducation. Crosswinds Marsh is a project that demonstrates the potential of oppor-tunistic, multi-objective wetlands mitigation for biodiversity restoration. It alsodemonstrates the particular roles that landscape architects can play in such projects andhow they can add value at multiple points in the process.
P R O J E C T D A T A
Crosswinds Marsh is a 1,400-acre (566 hectare) multipurpose wetland mitigation proj-ect located in southwestern Wayne County, Michigan. The project originated in 1986when the Detroit Metropolitan Wayne County Airport updated its master plan,including a major runway expansion requiring extensive wetlands disturbance andmitigation. The scale of the mitigation and space limitations at the airport site led air-port managers to seek an “off-airport” mitigation site within the same watershed.SmithGroup JJR (then known as Johnson Johnson & Roy Inc.) served as the primeconsultant for the project (Dennison 2000). A location in Sumpter Township wasselected for the mitigation site because it was sufficiently large, was located in a ruralportion of Wayne County, and had the hydrological “potential” to support the requiredarea needed for mitigation (Figure 4.1).
The property acquired from private landowners by Wayne County in SumpterTownship exceeds 1,400 acres (567 hectares); of this total, about 620 acres (250hectares) of wetlands have been created or restored at Crosswinds Marsh. In phase 1,

50 | B I O D I V E R S I T Y P L A N N I N G A N D D E S I G N
approximately 320 acres (130 hectares) of new wetlands were designed by SmithGroupJJR. Phase two, the final phase, was completed in 2000. All work was managed by theWayne County Department of Airports (Hypner 2001). During the 1990s, the projectproceeded through planning, permitting, construction, establishment, and monitor-ing. As the project was implemented, it grew well beyond a wetland mitigation proj-ect, adding significant biodiversity and public use components (Dennison 2000; Ott2001). It has since become an award-winning project, receiving the President’s Awardof Excellence from the American Society of Landscape Architects in 1999 (Martin2000). Crosswinds Marsh is now a successful Wayne County Park and EnvironmentalEducation Center. New data from monitoring has produced new knowledge for wet-land restoration elsewhere in Michigan and throughout the midwestern United States.
Crosswinds Marsh is located in an area of low relief formed on ancient Lake Erielakebed sediments, including beach ridges and a hydrological pattern composed of sev-eral meandering channels. Historically, the site supported a wet prairie, marshlands,and a wooded wetland landscape, which had been artificially drained with agricultur-al ditches and tile drains to support row crops (corn and soybeans), pasture, and hayfields. At the project’s beginning in the early 1990s, a large proportion of the sitewas still used for agriculture. The remainder was in residential use or in the process ofwoodland succession.
Project mitigation goals were developed through consultation among the U.S.Environmental Protection Agency (EPA), the U.S. Fish and Wildlife Service (USFWS),the Michigan Department of Natural Resources (now the Michigan Department ofEnvironmental Quality and referred to in the remainder of this chapter as MDEQ), var-ious Wayne County departments, a citizen’s advisory committee, and SmithGroup JJR.The resulting goals included a range of wetland types: forested, wet meadow, emergent,shallow open water, and deep water. The first three types were required as compensa-tion for impacts to forested, wet meadow, and emergent wetlands at the airport. Thedeep-water wetland was added to establish a warm-water fishery (Dennison 2001).
MDEQ was responsible for reviewing and approving the permit, which required a1.5:1 mitigation ratio for the 311 acres (125 hectares) of wetlands that were to be dis-turbed for the runway expansion and associated projects at the Detroit MetropolitanWayne County Airport. The Crosswinds site was proposed in response to consultationswith the permitting agencies (principally the MDEQ, EPA, and USFWS). At the time,several conclusions were reached regarding the location of the mitigation site. First, anoff-airport site would avoid unnecessary hazards to aircraft from waterfowl. Second, anout-of-basin location was required to provide sufficient undeveloped land and to min-imize community impacts. Finally, a larger site was considered preferable to severalsmaller sites for creating more valuable wildlife habitat (Ott 2001).
At the time it was constructed, Crosswinds Marsh was the largest single mitigationproject in the United States. The project consisted of a massive earth-moving effortinvolving more than 750,000 cubic yards (573,450 cubic meters) of earth to create awetland basin ranging from 0 to 20 feet (0 to 6 meters) deep (Figure 4.2). The total cost
of the Crosswinds Marsh project approximated $12 million, 75 percent of which waspaid with federal runway expansion funds from the Federal Aviation Administration.The project began with strong support from the airport and from Wayne County toenable the airport expansion. Its large scale garnered public attention and interest inproviding additional functions and benefits to the project, including biodiversity, pub-lic access, and recreation. SmithGroup JJR worked with all parties to integrate theseobjectives and functions within the mitigation project (Dennison 2000).
P R O J E C T P A R T I C I P A N T S
Crosswinds Marsh involved a large complement of federal, state, and county agencies.The Federal Aviation Administration provided funding through airport bonds(Hypner 2001). MDEQ was responsible for reviewing and approving all permits.Wayne County department supervisors, staff at Detroit Metropolitan Wayne CountyAirport, and Sumpter Township officials were involved in the overall review and per-mitting of the project.
SmithGroup JJR was the prime consultant for planning, design, and engineering.The project was managed within the SmithGroup JJR Environmental Studio, whichincludes landscape architects and environmental scientists working in an interdiscipli-nary setting. The professionals involved included Gary Crawford and Catherine Riseng(aquatic macro-invertebrates, fish and water quality) and William Brodowicz (plants).Subconsultants included Allen Kurta (Eastern Michigan University; reptiles, amphib-ians, mammals) and Stephen Hinshaw (University of Michigan; birds). The scientistsconducted baseline data collection and post-implementation monitoring, while thelandscape architects made the design decisions, produced the working drawings, andsupervised project construction (Dennison 2001; Ott 2001).
The SmithGroup JJR project team collaborated to establish an “ecological frame-work” for the project regarding how much mitigation flexibility was possible. Thelandscape architects’ initial role was to provide an understanding of the presettlementvegetation context and to interpret and apply rigorous science to the project.Throughout the project, landscape architects led the interdisciplinary team, research-ing habitat design methods and experimenting with alternative soil mediums andplanting methods (e.g. no topsoil, sand, planting in raised furrows, using different sizeplants). The landscape architects also led the planning of the public use component ofthe project, including boardwalks and hiking, equestrian, and canoe trails (Figure 4.3).They also successfully advocated for the inclusion of boardwalks, trails, and an arrival-educational wetland center (Figures 4.4 and 4.5).
Project engineers were involved with the hydrologic modeling to address any con-cerns for postmitigation flooding of areas adjacent to the Crosswinds Marsh site. Twodrainage channels existed at the site, the Disbrow and the Clark-Morey. The project engi-neers determined that the Disbrow Drain could continue to flow into and through themarsh to serve as the wetland’s primary hydrological source and to improve downstream
C R O S S W I N D S M A R S H | 51
water quality. The Clark-Morey Drain, which had impaired water quality, was divertedaround the perimeter of the marsh to maintain hydrological isolation. The engineers alsorecommended the use of clay cut-off walls to hydrologically isolate the marsh from itssurroundings, which include a regional landfill situated down gradient. The engineersdesigned and set the concrete outflow control structure to establish the base water eleva-tion for the entire project. The control structure reinforced the earlier decision to stopupstream fish migration because of concerns about immigration of undesirable fishspecies, including common carp (Cyprinus carpio) and gizard shad (Dorosoma cepedianum).
Several groups participated as part of the citizen’s advisory committee; among themore active participants were the Michigan United Conservation Club, the EastMichigan Environmental Action Council, and the University of Michigan, Dearborn.Their interest focused on the type and location of public use appropriate for the site inthe context of wetland mitigation—the primary goal—and associated habitat creation.
P R O J E C T G O A L S A N D O B J E C T I V E S
The Crosswinds Marsh project began solely as a compensatory wetlands mitigationproject. Thus the principal goal was to satisfy the requirements of the MDEQ permitto enable the runway expansion to be built. The permit specifically required that themitigation be “sufficient in terms of physical characteristics, water supply, and anyother pertinent ecological factors to create the desired wetland types” (MichiganDepartment of Natural Resources 1991).
As the project evolved, SmithGroup JJR, working in collaboration with WayneCounty, advocated three additional goals for the project:
1. To develop educational and passive recreational use2. To provide opportunity for public use3. To establish Crosswinds Marsh as a county-sponsored “Wetland Interpretive
Reserve”
According to the mitigation plan, these additional goals were added to provide “avariety of environmental and social functions in perpetuity” (Johnson Johnson &Roy/Inc. 1991). It was also important to the county to address local concerns that arosefrom the displacement of about thirty individuals from their homes and the loss ofnearly 1,400 acres (567 hectares) of land from the township tax base, which had pre-viously been under private ownership.
P U B L I C / P R I V A T E P A R T N E R S H I P
A N D C O L L A B O R A T I O N
The process of project permitting, design, and implementation involved multiple pub-lic and private organizations and interests. The local community was involved as vari-ous project concepts were developed. Initially, the community did not understand or
52 | B I O D I V E R S I T Y P L A N N I N G A N D D E S I G N
C R O S S W I N D S M A R S H | 53
appreciate the potential benefits of such a large-scale mitigation project. The plan wasunderstood simply as a “big swamp”—displacing farmland and local residents whileoffering little or no positive attributes (Bauer 2001). Several community hearings wereheld to raise public awareness and understanding of the project’s requirements and itspotential to become a significant asset for the county.
The Michigan United Conservation Clubs were involved during the evolution ofthe project along with the other members of the township and the county. SumpterTownship asked for hunting access to the wetland, but this was denied for safety con-cern reasons. As a direct result of the public hearings, and of the project’s successfulimplementation, Crosswinds Marsh evolved in the community’s eyes from a swampinto a successful county park for use by local residents. Perimeter upland trails wereinstalled for equestrians, and an extensive system of drains, trails (accessible per thestandards set forth in the Americans with Disabilities Act), and boardwalks were locat-ed throughout the site (Figures 4.6 and 4.7).
B I O D I V E R S I T Y D A T A I S S U E S A N D
P L A N N I N G S T R A T E G I E S
As in most mitigation and restoration projects, Crosswinds Marsh confronted a distinctlack of data regarding the specific ecosystems, plant communities, and biota involved.To overcome this lack of information, the project planners and designers conducted twocomplementary lines of research: a review of published literature and an inventory ofadjacent and reference wetlands. SmithGroup JJR researched vegetation by examiningthe only available source of this site-specific information: presettlement mapping andhistorical survey maps. An inventory was made of existing wetlands habitats in WayneCounty to identify the diversity and distribution of plants and animals surrounding theproject area. This inventory influenced the development mitigation plan by producingspecies lists and associating wetlands habitats with particular wetland species.
Botanical surveys at the mitigation site found no threatened or endangered wildlifespecies. However, threatened and endangered flora species were found at the airport;these species were documented and protected with fencing to avoid disturbing themduring runway construction. Selected occurrences of at-risk endangered plant specieswere relocated with a tree spade to a suitable location within the mitigation site. Thedesign of suitable habitat for the plant species was based largely on identifying soiltypes and hydrological conditions comparable to those present at the airport. The soilswere identified after a thorough review of existing conditions at the mitigation site,while appropriate hydrological conditions were established by using monitoring wellsat both the airport and the mitigation area and then grading the mitigation site toachieve comparable hydrological conditions.
The Disbrow Drain supported a warm-water fishery and macro-invertebrate popula-tion typically found in agricultural drains, freshwater marshes, and shallow water com-munities. Results of the initial aquatic surveys, however, indicated that large numbers of
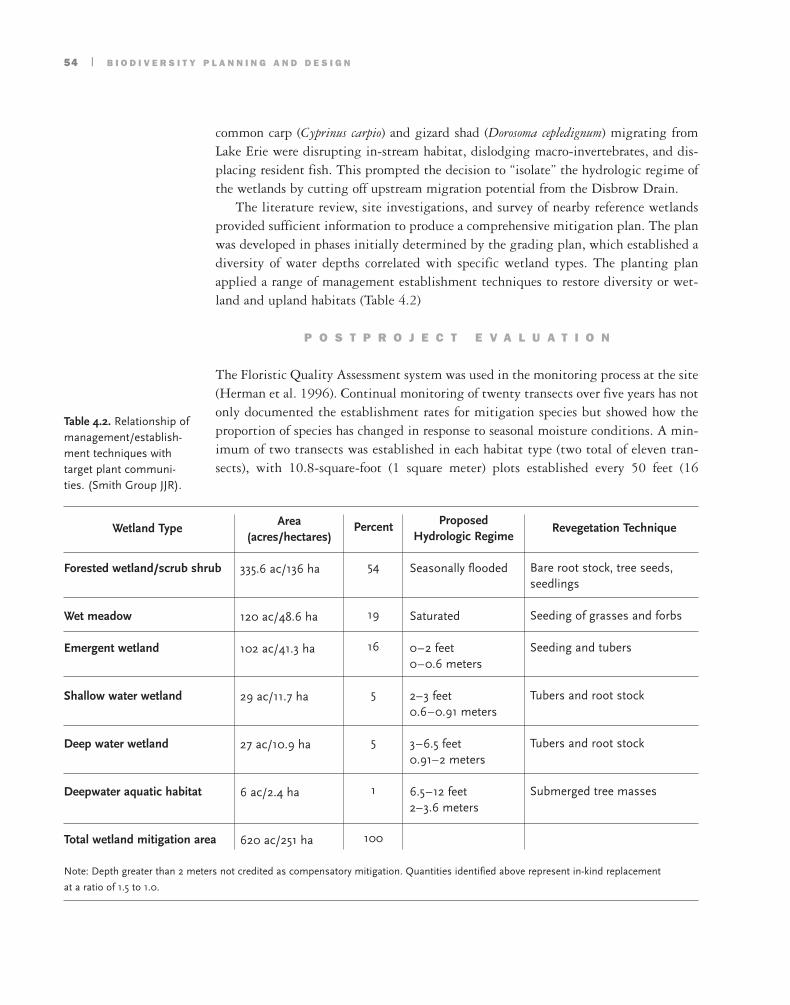
common carp (Cyprinus carpio) and gizard shad (Dorosoma cepledignum) migrating fromLake Erie were disrupting in-stream habitat, dislodging macro-invertebrates, and dis-placing resident fish. This prompted the decision to “isolate” the hydrologic regime ofthe wetlands by cutting off upstream migration potential from the Disbrow Drain.
The literature review, site investigations, and survey of nearby reference wetlandsprovided sufficient information to produce a comprehensive mitigation plan. The planwas developed in phases initially determined by the grading plan, which established adiversity of water depths correlated with specific wetland types. The planting planapplied a range of management establishment techniques to restore diversity or wet-land and upland habitats (Table 4.2)
P O S T P R O J E C T E V A L U A T I O N
The Floristic Quality Assessment system was used in the monitoring process at the site(Herman et al. 1996). Continual monitoring of twenty transects over five years has notonly documented the establishment rates for mitigation species but showed how theproportion of species has changed in response to seasonal moisture conditions. A min-imum of two transects was established in each habitat type (two total of eleven tran-sects), with 10.8-square-foot (1 square meter) plots established every 50 feet (16
54 | B I O D I V E R S I T Y P L A N N I N G A N D D E S I G N
Wetland Type
Forested wetland/scrub shrub
Wet meadow
Emergent wetland
Shallow water wetland
Deep water wetland
Deepwater aquatic habitat
Total wetland mitigation area
Area(acres/hectares)
335.6 ac/136 ha
120 ac/48.6 ha
102 ac/41.3 ha
29 ac/11.7 ha
27 ac/10.9 ha
6 ac/2.4 ha
620 ac/251 ha
Percent
54
19
16
5
5
1
100
ProposedHydrologic Regime
Seasonally flooded
Saturated
0–2 feet0–0.6 meters
2–3 feet0.6–0.91 meters
3–6.5 feet0.91–2 meters
6.5–12 feet2–3.6 meters
Revegetation Technique
Bare root stock, tree seeds,seedlings
Seeding of grasses and forbs
Seeding and tubers
Tubers and root stock
Tubers and root stock
Submerged tree masses
Note: Depth greater than 2 meters not credited as compensatory mitigation. Quantities identified above represent in-kind replacement
at a ratio of 1.5 to 1.0.
Table 4.2. Relationship ofmanagement/establish-ment techniques withtarget plant communi-ties. (Smith Group JJR).
meters) along the transect. The center of each plot was marked with stakes. Plots wereselected to represent planted and unplanted areas. Permit-required wetland monitor-ing was conducted from 1994 to 1998. Additional monitoring of a subset of plots tookplace on the county’s own initiative in 1999. In addition to photographs, the informa-tion recorded for each plot included percentage cover, frequency of indicator species,water level, and pH (Dennison 2001; Johnson Johnson & Roy 1999).
Hydrology was monitored twice a year in spring and late summer, recording readingsfrom water-depth gauges and groundwater wells. Water quality was monitored three timesa year, in late spring, summer, and fall, at permanent entering and exiting sample points.Temperature, dissolved oxygen, pH, and conductivity were also measured. The hydrologicand water quality data collection has been discontinued. Wayne County does continue tocollect water-quality data for bacteria because canoe rentals involve water contact.
Several classes of fauna were monitored: birds, herptiles, and mammals. Birds weremonitored three times each year, during the spring migration and in summer and fall.Specific stations were visited in the morning for a five-minute observation that includ-ed visual and audio observations as well as callbacks (human-initiated birdcalls). Theherptiles were monitored in conjunction with the vegetation sampling three timeseach year. Amphibians and reptiles were also monitored from March to June usingnight trapping, with drift fences and pitfall traps. Mammals were monitored with livetraps set along the permanent transects. Muskrat houses and evidence of muskrat graz-ing were also noted.
Finally, aquatic biology was monitored three times a year in spring, summer, andfall using a stratified random sample. Macro-invertebrates were analyzed in July atseven locations for tolerance rating using the Shannon-Weaver diversity index(Shannon and Weaver 1949). Fisheries were monitored using seines in shallow waterand gill nets in deeper water to note species type and size (Dennison 2001).
MDEQ required five years of monitoring overall and ten years of monitoring forthe protected plant species moved from the airport to the site adjacent to CrosswindsMarsh. This requirement was not appreciated by the airport personnel who initiallyassumed that monitoring results could “trigger” additional mitigation work. Themonitoring requirement also raised concern over project “closure” because it requireda five- to ten-year wait after the project was otherwise complete. The monitoringrequirement extended well beyond the project contractors’ two-year guarantee periodon planting. During the project, an “uneasy” relationship existed among WayneCounty, the State of Michigan, and the several federal agencies involved. Concerns alsoarose about changing personnel in the regulatory agencies, and anxiety developed overthe timing of the final project approval and sign-off.
Monitoring documented that several areas had been invaded by exotic species,including common reed (Phragmites australis) and loosestrife (Lythrum salicaria). Thesespecies were 75 to 80 percent eliminated through targeted treatments with the herbi-cide Rodeo. The sites were replanted and are now being monitored and controlled withnonchemical controls.
C R O S S W I N D S M A R S H | 55
As the wetland vegetation was becoming established, large areas of clay exposedduring construction caused high turbidity in the open-water area of the wetland. Thelong orientation of open water parallel to the prevailing westerly winds produced sig-nificant wind fetch, causing elevated rates of water movement and increased turbidity.In the early years, carp proliferated in the wetland, exacerbating the turbidity problemby continually stirring up the bottom clay during feeding. The turbidity has lessenedas aquatic vegetation has become established, stabilizing the clay substrate. The pre-dominant plants established in the open water include Eurasian water-milfoil(Myriophyllum spicatum), curly pondweed (Potamogeton crispus), and brittle waternymph(Najas minor). As the water quality has improved with project maturation, predatoryfish species (such as bass) micropterus ssp., which feed on and limit the number ofsmall carp (Cyprinus carpio), have become established.
To the surprise and delight of the project designers and the county park staff, baldeagles (Haliaeetus leucocephalus) have moved into a stand of trees adjacent to the wetland(Figure 4.7). The primary nest tree is located in a woodlot adjoining the main area ofopen water that was flooded by rising water levels. This location overlooks much of theopen-water area at Crosswinds and is the last area to freeze in winter, ensuring a nearlyconstant feeding habitat for the eagles. The eagles presence gives the project high pub-lic visibility, lending credibility to Crosswinds as a bona fide “nature preserve” and wet-land study center. Their appearance has influenced project management—for example,eliminating the possible use of rotenone to kill the carp species in the wetlands.
The issue of invasive species, as well as other aspects of the project, has taken on aneducational component under Wayne County Parks staff management. Private boatsare excluded because of the risk of importing zebra mussels (Dreissena polymorpha) tothe wetland. Instead, rental canoes meet the recreational demand. Education programsthus discuss invasive species in the broader context of biodiversity.
Lessons learned at this site have been applied to the phase two mitigation projectadjacent to Crosswinds Marsh, which was approved with certain modifications to thedesign based on the results of the phase one wetlands construction. This additionalmitigation emphasized forested wetlands and restricted any additional public access.
Monitoring human use and related conflicts is part of ongoing management by theWayne County Parks Department. The perimeter trail is used for equestrians and forsecurity patrol. In other areas, horse use is monitored, and some conflicts exist betweenhorse riders and bicycle riders who invent trails. Other, unexpected conflicts haveemerged. For example, skunks (Mephitis mephitis), raccoons (Procyon lotor), minks (Mustelavison), and opossums (Didelphis virginiana) have learned to use the project’s boardwalksto eat duck and bird eggs. No solution to this problem has been developed to date.
56 | B I O D I V E R S I T Y P L A N N I N G A N D D E S I G N

Figure 2.6. Social groupof lowland gorillas in theWoodland Park Zooexhibit.
Figure 2.7. Lowland goril-la at Woodland Park Zoo. Source for both: Jones & JonesArchitects and LandscapeArchitects, Ltd.
GORILLAEXHIBIT
Figure 2.2. The redesignof the lowland gorillaexhibit at Woodland ParkZoo was a seminal exam-ple of biocentric zoodesign. Source: Jones & Jones, Architectsand Landscape Architects, Ltd.
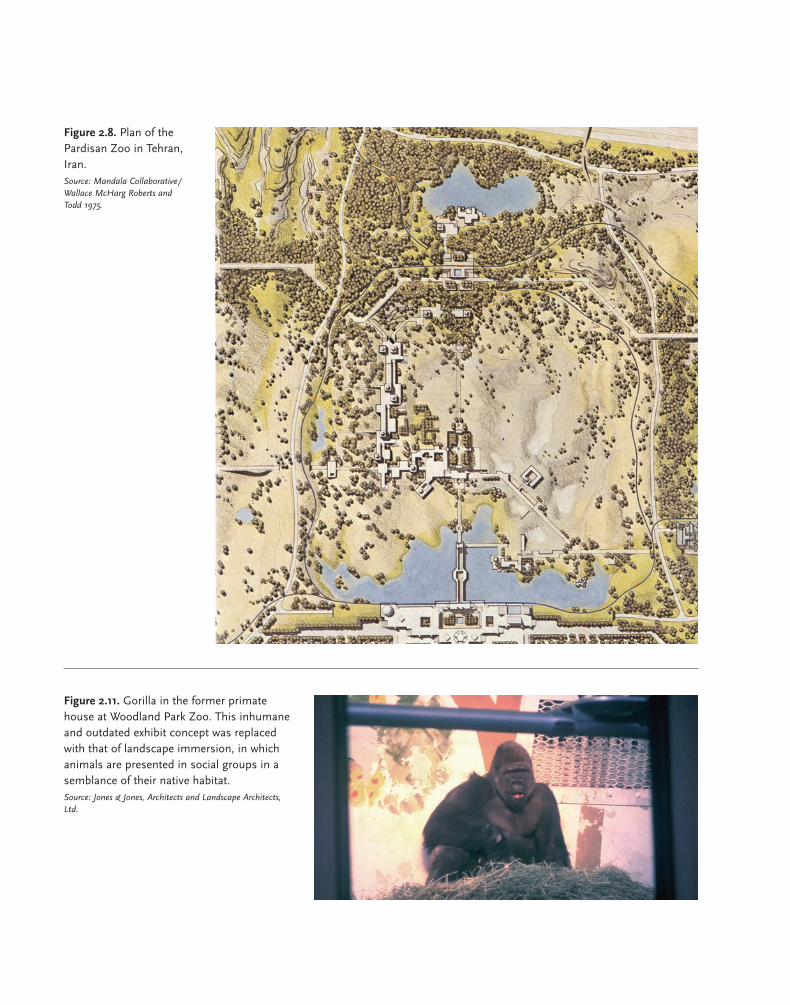
Figure 2.11. Gorilla in the former primatehouse at Woodland Park Zoo. This inhumaneand outdated exhibit concept was replacedwith that of landscape immersion, in whichanimals are presented in social groups in asemblance of their native habitat. Source: Jones & Jones, Architects and Landscape Architects,Ltd.
Figure 2.8. Plan of thePardisan Zoo in Tehran,Iran. Source: Mandala Collaborative/Wallace McHarg Roberts andTodd 1975.
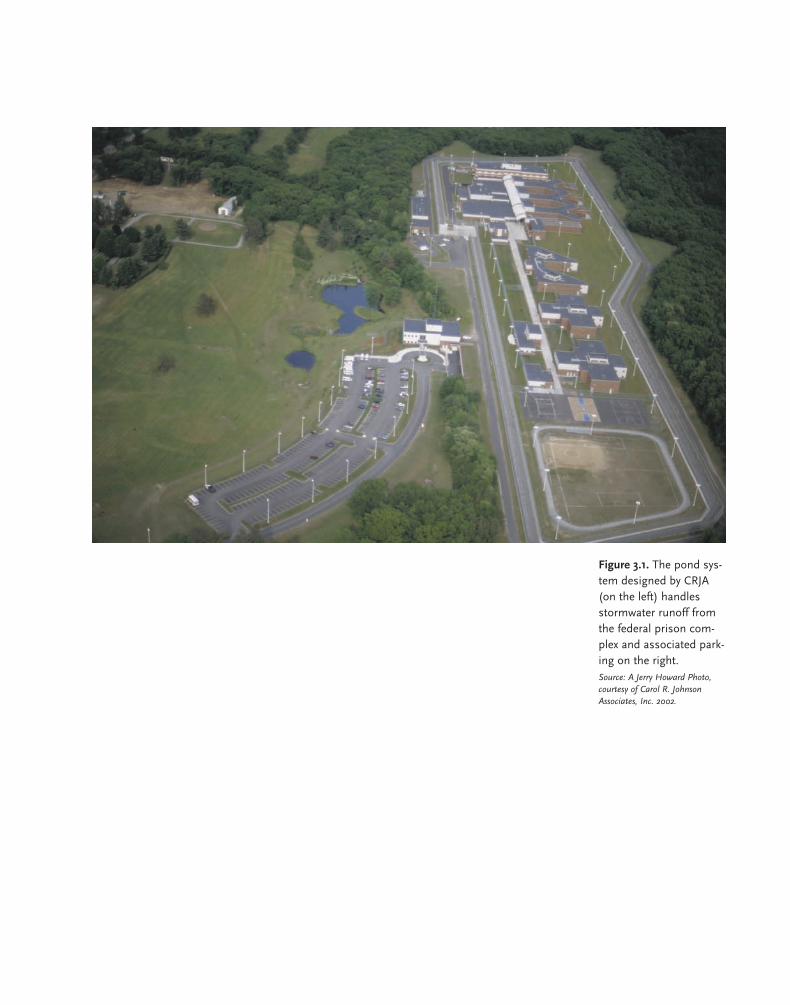
Figure 3.1. The pond sys-tem designed by CRJA(on the left) handlesstormwater runoff fromthe federal prison com-plex and associated park-ing on the right. Source: A Jerry Howard Photo,courtesy of Carol R. JohnsonAssociates, Inc. 2002.

Figure 3.2. The plan ofthe Devens FederalMedical Center Complex. Source: Carol R. JohnsonAssociates Inc. 2002.
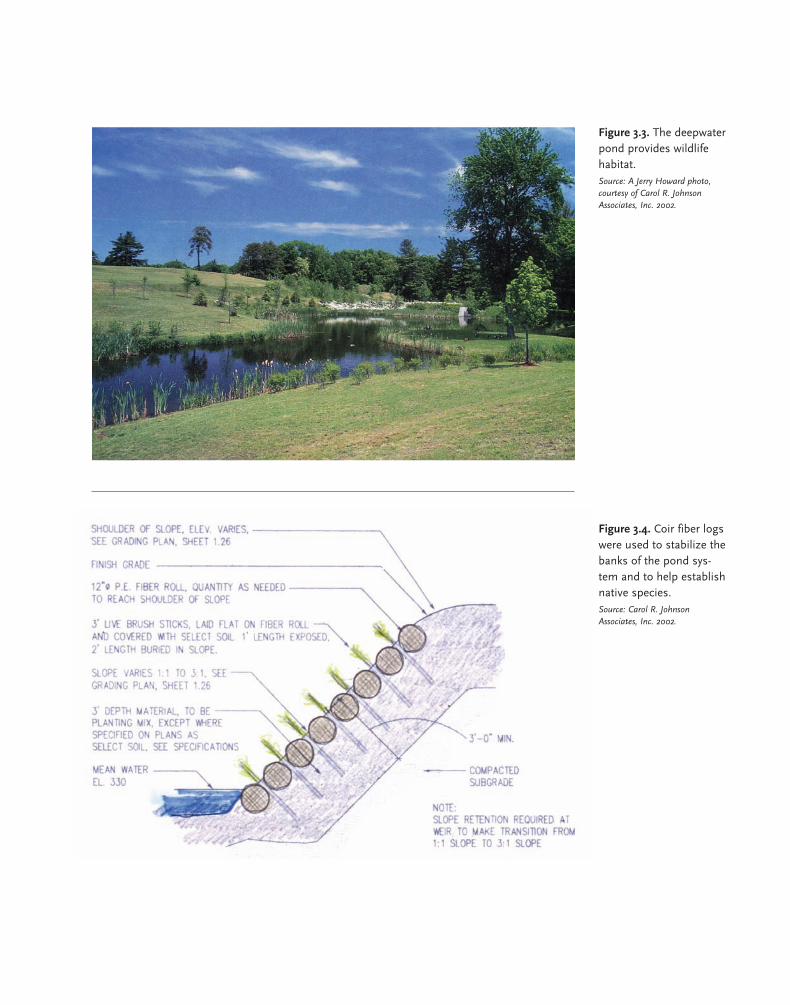
Figure 3.4. Coir fiber logswere used to stabilize thebanks of the pond sys-tem and to help establishnative species. Source: Carol R. JohnsonAssociates, Inc. 2002.
Figure 3.3. The deepwaterpond provides wildlifehabitat. Source: A Jerry Howard photo,courtesy of Carol R. JohnsonAssociates, Inc. 2002.
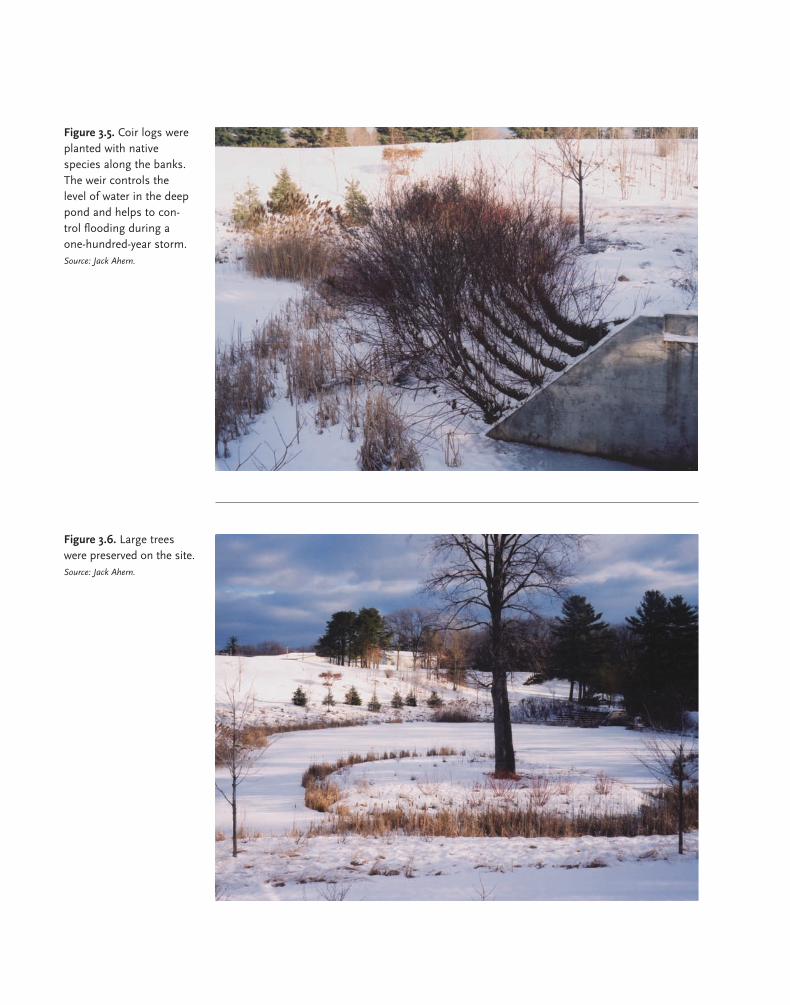
Figure 3.5. Coir logs wereplanted with nativespecies along the banks.The weir controls thelevel of water in the deeppond and helps to con-trol flooding during aone-hundred-year storm. Source: Jack Ahern.
Figure 3.6. Large treeswere preserved on the site. Source: Jack Ahern.

Figure 4.1. The projectteam and client represen-tatives at the CrosswindsMarsh Restoration Site inWayne County, Michigan(pre-construction). Source: Johnson Johnson &Roy/Inc.
Figure 4.2. The Cross-winds Marsh as built. Source: Johnson Johnson &Roy/Inc.
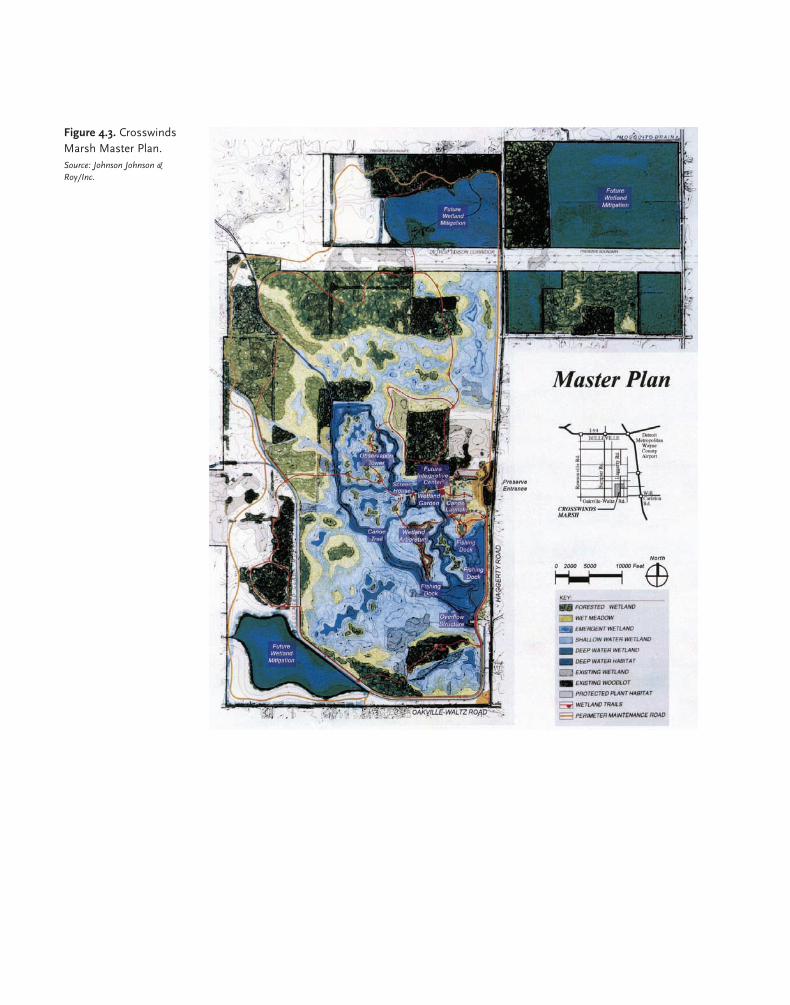
Figure 4.3. CrosswindsMarsh Master Plan. Source: Johnson Johnson &Roy/Inc.

Figure 4.4. Public accessand use at CrosswindsMarsh has been key toits success. Source: Johnson Johnson &Roy/Inc.
Figure 4.5. The Cross-winds Marsh visitor andenvironmental educationcenter. Source: Johnson Johnson &Roy/Inc.
Figure 4.6. Equestrianuse at CrosswindsMarsh. Source: Johnson Johnson &Roy/Inc..
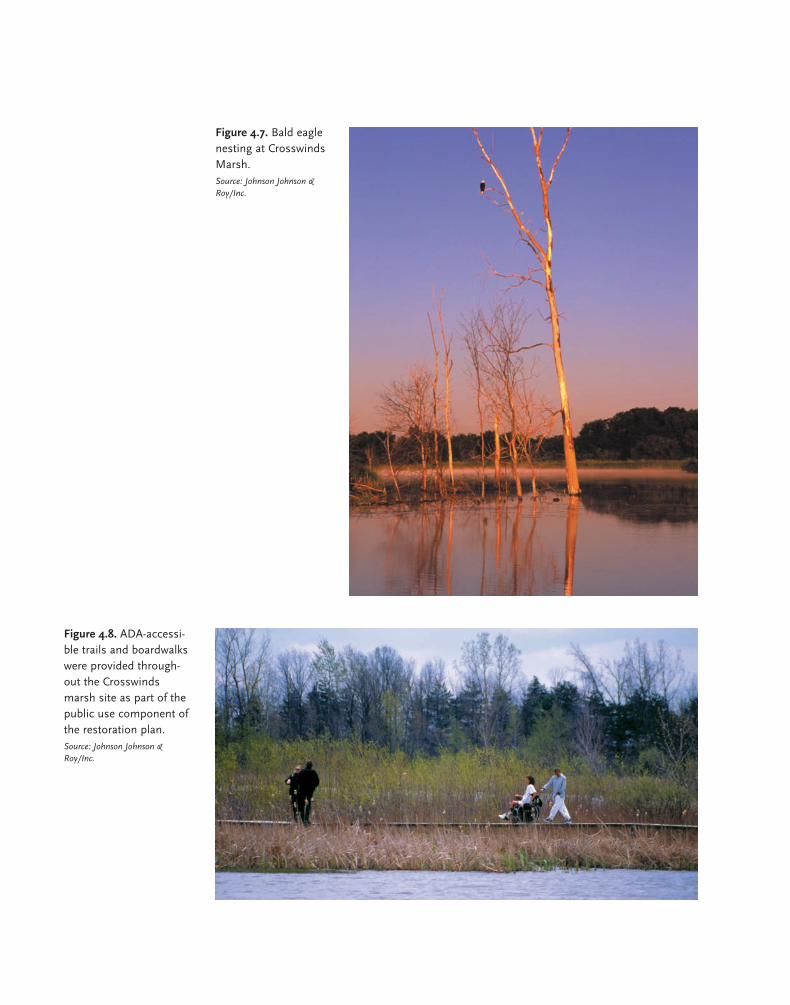
Figure 4.7. Bald eaglenesting at CrosswindsMarsh. Source: Johnson Johnson &Roy/Inc.
Figure 4.8. ADA-accessi-ble trails and boardwalkswere provided through-out the Crosswindsmarsh site as part of thepublic use component ofthe restoration plan. Source: Johnson Johnson &Roy/Inc.
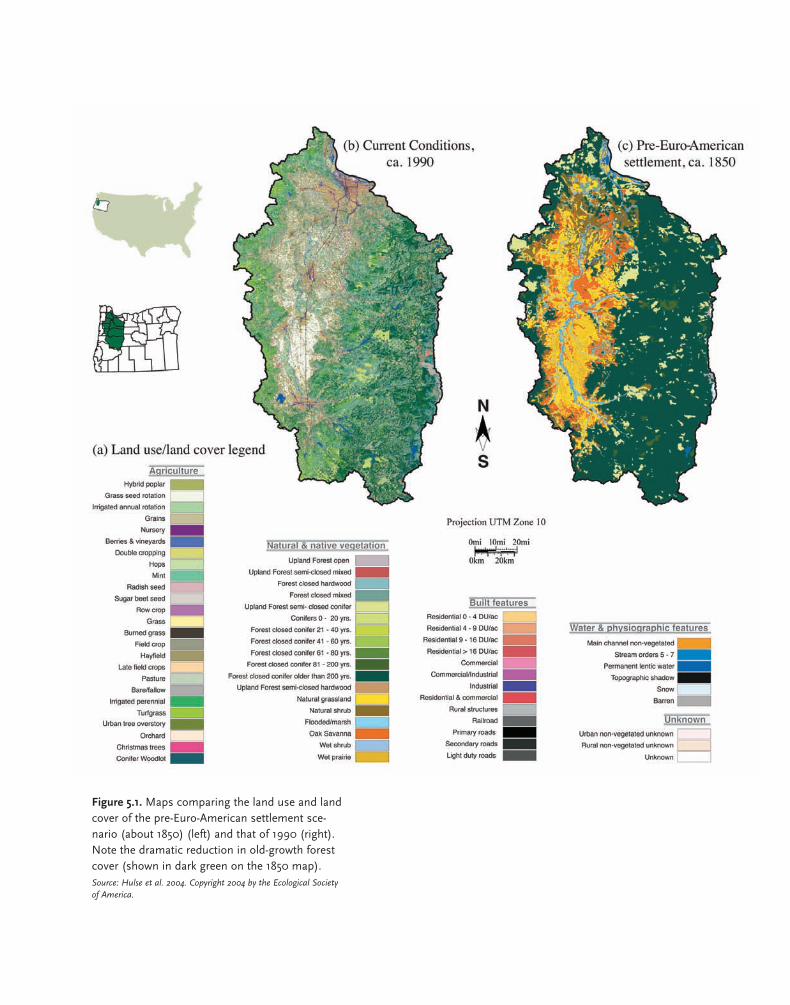
Figure 5.1. Maps comparing the land use and landcover of the pre-Euro-American settlement sce-nario (about 1850) (left) and that of 1990 (right).Note the dramatic reduction in old-growth forestcover (shown in dark green on the 1850 map). Source: Hulse et al. 2004. Copyright 2004 by the Ecological Societyof America.
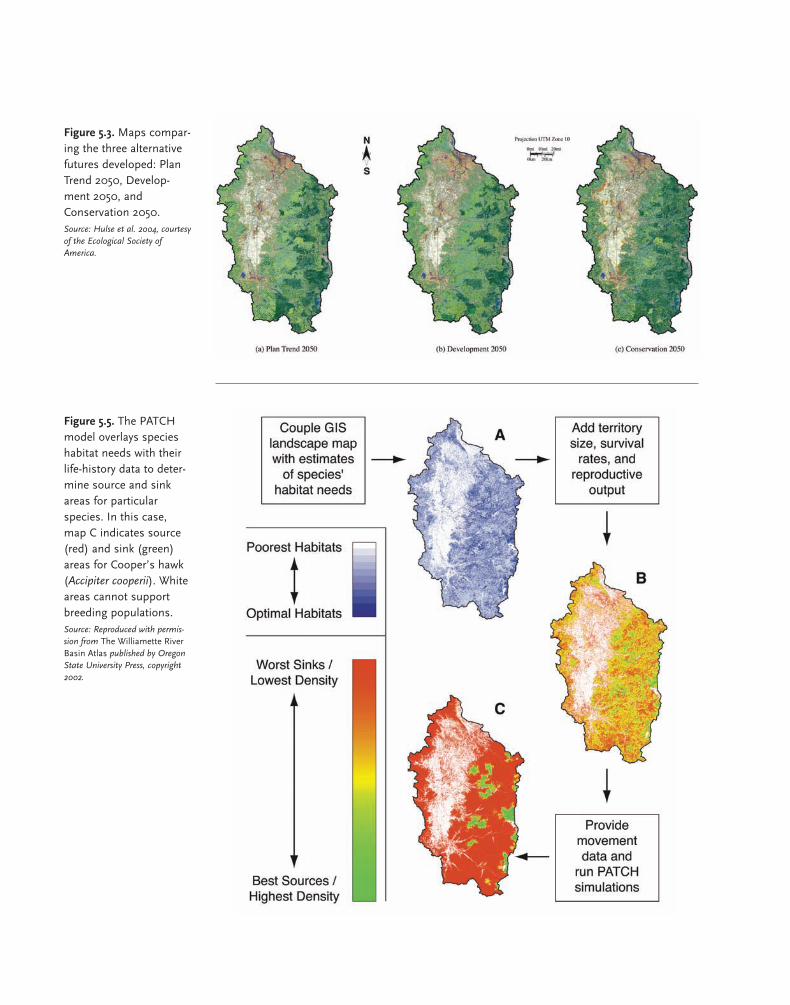
Figure 5.5. The PATCHmodel overlays specieshabitat needs with theirlife-history data to deter-mine source and sinkareas for particularspecies. In this case,map C indicates source(red) and sink (green)areas for Cooper’s hawk(Accipiter cooperii). Whiteareas cannot supportbreeding populations. Source: Reproduced with permis-sion from The Williamette RiverBasin Atlas published by OregonState University Press, copyright2002.
Figure 5.3. Maps compar-ing the three alternativefutures developed: PlanTrend 2050, Develop-ment 2050, andConservation 2050. Source: Hulse et al. 2004, courtesyof the Ecological Society ofAmerica.
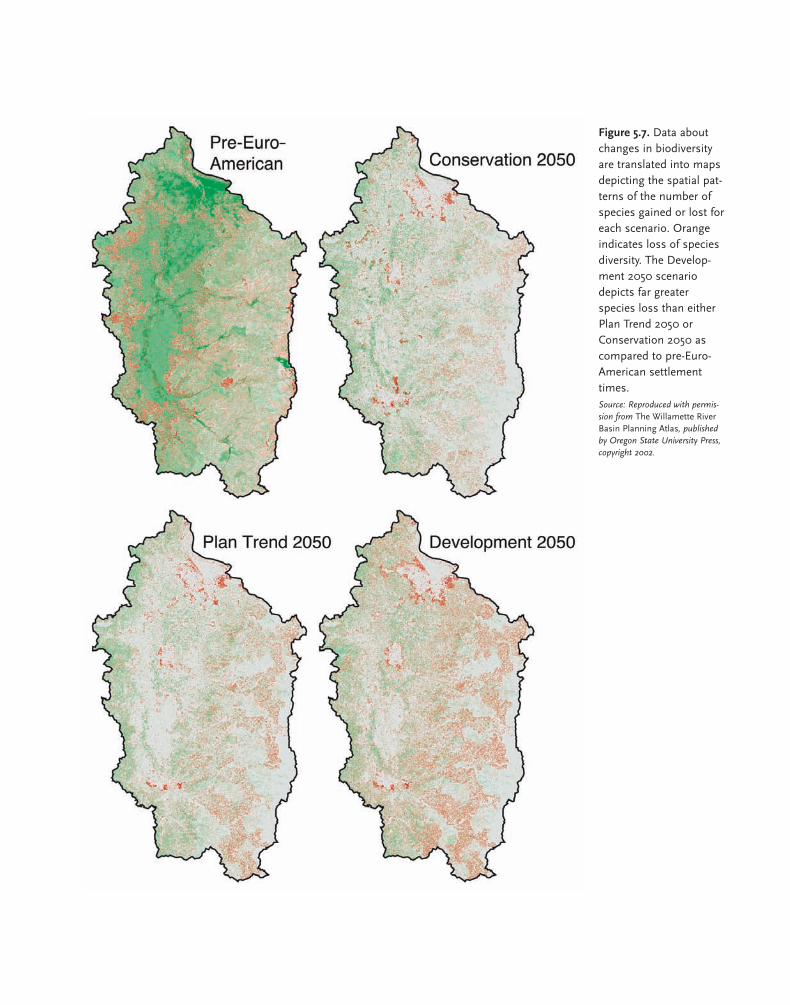
Figure 5.7. Data aboutchanges in biodiversityare translated into mapsdepicting the spatial pat-terns of the number ofspecies gained or lost foreach scenario. Orangeindicates loss of speciesdiversity. The Develop-ment 2050 scenariodepicts far greaterspecies loss than eitherPlan Trend 2050 orConservation 2050 ascompared to pre-Euro-American settlementtimes. Source: Reproduced with permis-sion from The Willamette RiverBasin Planning Atlas, publishedby Oregon State University Press,copyright 2002.

Figure 5.9. Areas of influ-ence considered in evalu-ating the effects of landuse and land cover onstream condition: water-shed (red), 393-foot (120meter) stream buffer(also known as the ripari-an network). Source: Reproduced with permis-sion from The Willamette RiverBasin Planning Atlas, publishedby Oregon State University Press,copyright 2002.
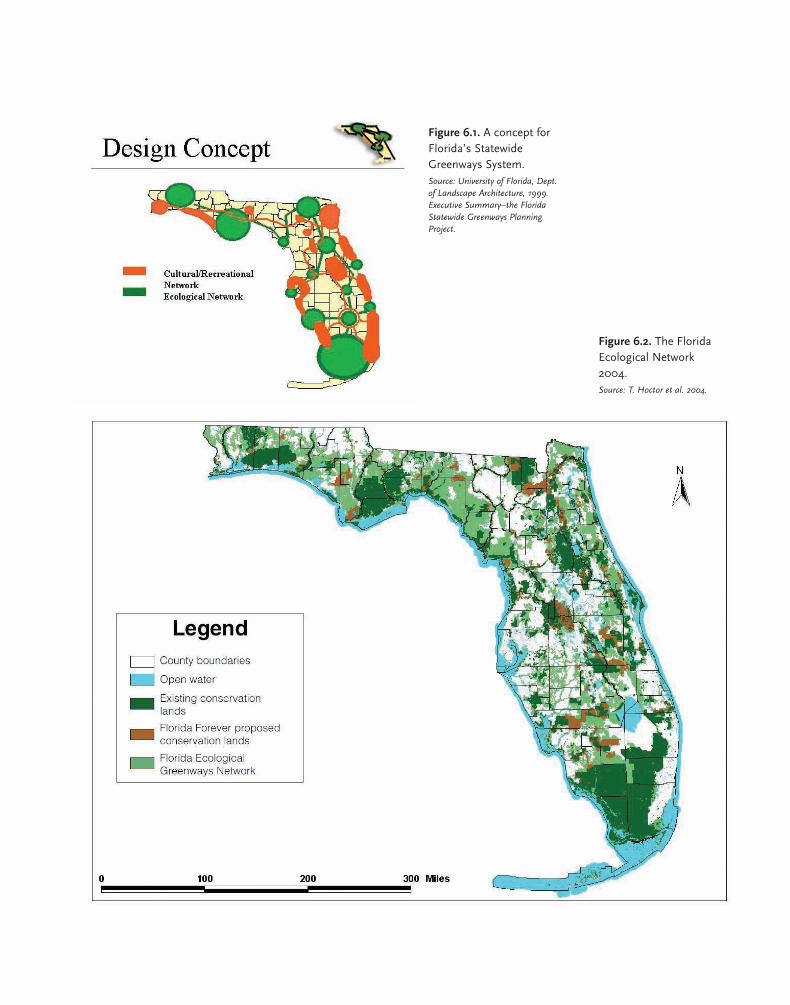
Figure 6.1. A concept forFlorida’s StatewideGreenways System. Source: University of Florida, Dept.of Landscape Architecture, 1999.Executive Summary–the FloridaStatewide Greenways PlanningProject.
Figure 6.2. The FloridaEcological Network2004. Source: T. Hoctor et al. 2004.
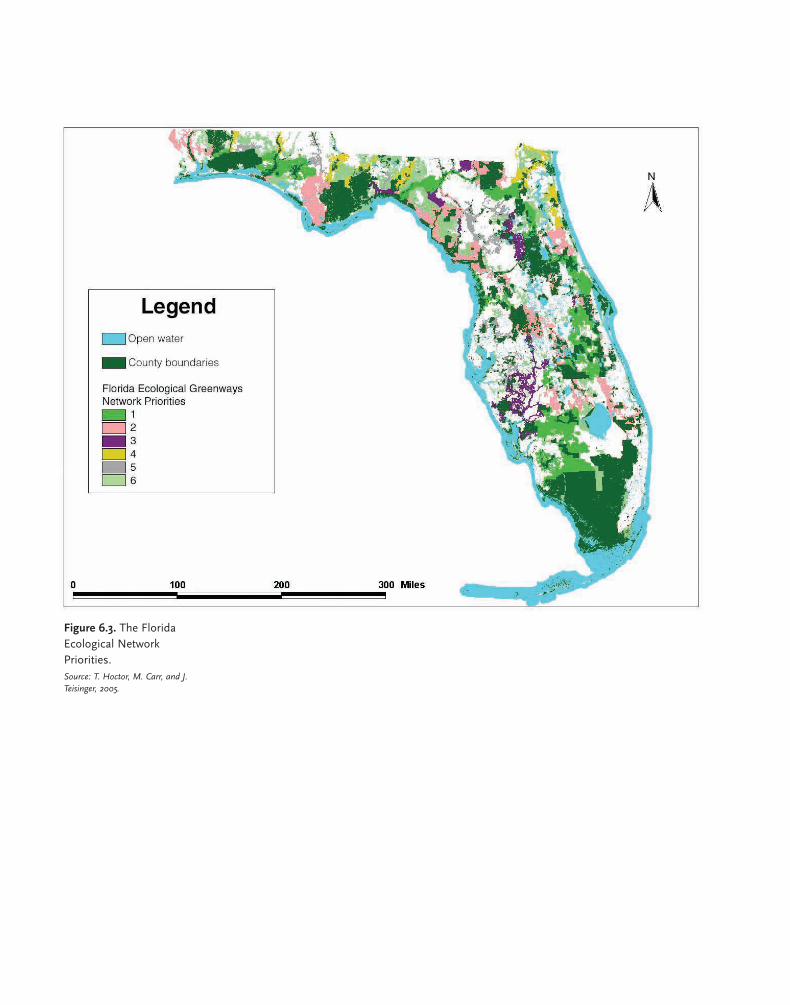
Figure 6.3. The FloridaEcological NetworkPriorities. Source: T. Hoctor, M. Carr, and J.Teisinger, 2005.

The Willamette River Basin is located in western Oregon between the Coast Rangeand the Cascade Range. The basin faces the formidable challenge of finding a way toaccommodate population growth while preserving and improving valued ecologicaland environmental resources. The basin is a hotbed for biodiversity issues; the water-shed is home to a diverse array of plant and animal species, seventeen of which are listed under the Endangered Species Act, including the northern spotted owl (Strixoccidentalis caurina), spring Chinook salmon (Oncorhynchus tshawytscha), and upperWillamette River steelhead Oncorhynchus mykiss. However, population growth in theWillamette River Basin exceeds national rates, and the region is expected to double itscurrent population by 2050 (Hulse 2002).
The Oregonian ran several articles in 2001 sponsored by the Williamette LivabilityForum documenting how the economic base of the region is changing from agricul-ture toward technology and the service sector, resulting in many rural areas losing pop-ulation while suburban and urban centers are bursting at the seams with new residents.At the same time, the region has a history of making pro-environment choices. Oregonwas the first state in the nation to pass statewide land use planning and growth man-agement legislation. This legislation grew in part from the work of landscape architectLawrence Halprin, specifically in the book The Willamette Valley: Choices for the Future(Lawrence Halprin and Associates 1972). Other examples of Oregon’s commitment topreserving the environment include the Oregon Forest Practices Act, passed in 1971,and the Northwest Forest Plan.
However, preserving biodiversity is but one goal that must be balanced with otherpressing issues, such as water availability and land use conflicts. Fortunately, formerOregon governor (Governor 1995–2003) John Kitzhaber understood that the environ-ment and biodiversity are integral parts of the entire system. As Kitzhaber said in a2001 address to the Willamette Valley Livability Forum (WVLF): “The future is nota matter of chance, it is a matter of choice. It is not a thing to be waited for, it is athing to be achieved” (Baker and Landers 2004, 311).
The Willamette Alternative Futures Project (WAFP) takes a basinwide approach to
C H A P T E R 5
W I L L A M E T T E V A L L E YA LT E R N A T I V E
F U T U R E S P R O J E C T

creating future scenarios that illustrate how different planning and policy decisions mightaffect biodiversity, water quality resources, and population over the next fifty years. PaulRisser, president of Oregon State University, thinks alternative future scenarios are “themost compelling tools to show possibilities for decision making” (Risser 2002).
P R O J E C T D A T A
The Willamette River Basin encompasses nearly 7.4 million acres (30,000 square kilo-meters) of land, ranging from the steeply ridged, conifer-covered slopes of the CascadeRange to the lush, intensely forested slopes of the Coast Ranges in western Oregon andincluding the highly productive agricultural land of the Willamette Valley in between.The watershed varies in elevation from 1 to 10,500 feet (1 to 3,200 meters) above sealevel and touches thirteen of the thirty-six counties in Oregon (Hulse 2002). The urbancenters of Portland, Salem, Eugene/Springfield, and Corvallis are all within theWillamette River Basin, and demographic data indicate that all of these urban areas aresuffering growing pains as they swell within their carefully delineated urban growthboundaries (Weitz and Moore 1998). Residents who consider the quality of the environ-ment and the extensive wildland as key factors in making the valley a special place tolive are concerned that growth will soon destroy what they love about the basin.
The region’s land cover has undergone significant change since presettlementtimes. Historically, up to 75 percent of the upland forest in the basin was composed ofold-growth conifers, while the lowlands were covered with Oregon white oak savan-nah (Querous garryana) or black cottonwood (Populus balsamifera), Oregon ash (Fraxiauslatifolia), and other riparian species along the Willamette River (Figure 5.1 in colorinsert). Development has precipitated dramatic declines of old-growth forest andOregon white oak savannah. Through losses to urbanization and farmland, only 20percent of the original riparian land remains forested today, and a mere 3 percent ofwet and dry prairie and 5 percent of presettlement wetlands remain. In addition, mod-ifications to and demands on the Willamette River and its tributaries have shortenedthe total river length by 25 percent, causing considerable habitat loss and drawdownproblems (Hulse, Gregory, and Baker 2002). Significant wildlife habitat has been lostwithin the river and its associated streams as dams, pollution, loss of channel diversi-ty, and sedimentation have taken their toll. The river is currently on the Clean WaterAct 303(d) list for water quality violations; particular reaches have been found to con-tain high levels of PCPs and dioxin, and the polluted section of the river that runsthrough Portland is listed as a Superfund site (Willamette Riverkeeper 2002).
The WAFP included three phases. The first was to assemble and analyze current(circa 1990) and historical (circa 1850) data on the landform, water resources, bioticsystems, human population, land use, and land cover aspects of the basin (Baker et al.2004). The second phase involved diagramming three alternative future scenarios forthe region that were grounded in these data, each of which worked under differentland-development assumptions (Figure 5.2 and Table 5.1). The three scenarios were
58 | B I O D I V E R S I T Y P L A N N I N G A N D D E S I G N

W I L L A M E T T E V A L L E Y A L T E R N A T I V E F U T U R E S P R O J E C T | 59
constrained to the same projected population increase of 3.9 million people by 2050,but one projected growth according to current trends (Plan Trend 2050), one(Conservation 2050) assumed that conservation measures in the valley would beincreased, and one (Development 2050) modeled what would occur if the regionrelaxed its conservation restrictions in favor of development (Figure 5.3 in color insert;see also Figure 5.4) (Hulse 2002). During the third phase, investigators modeled theeffects of these alternate futures on four core areas of concern: (1) the ecological condi-tion of the Willamette River, (2) water availability, (3) the ecological condition ofstreams associated with the river, and (4) terrestrial wildlife (Hulse 2002; Baker et al.2004; Schumaker et al. 2004; Van Sickle et al. 2004).
P R O J E C T P A R T I C I P A N T S
The WAFP is a regional venture that began in 1995. The project was triggered by then-U.S. president Bill Clinton’s Northwest Forest Plan (Willamette Valley LivabilityForum 2001). In response to the plan, the U.S. Environmental Protection Agency (EPA)initiated a research plan headed by Joan Baker, an EPA ecologist, calling for the creationof the Pacific Northwest Ecosystem Research Consortium, an assemblage of thirty-fourscientists from ten institutions, including the EPA, Oregon State University, University
Figure 5.2. The scenariodevelopment model ofthe Willamette Alterna-tive Futures Project(WAFP) illustrates howdata were incorporatedinto models and at whatpoint project partici-pants’ decisions wereused to formulate alter-native future develop-ment. Land allocationmodeling derived fromPacific Northwest Eco-system Resource Consor-tium (PNW-ERC) sce-nario assumptions wascombined with existingdata to build the threealternative scenarios. Source: Reproduced with permis-sion from The Willamette RiverBasin Planning Atlas publishedby Oregon State University Press,copyright 2002.
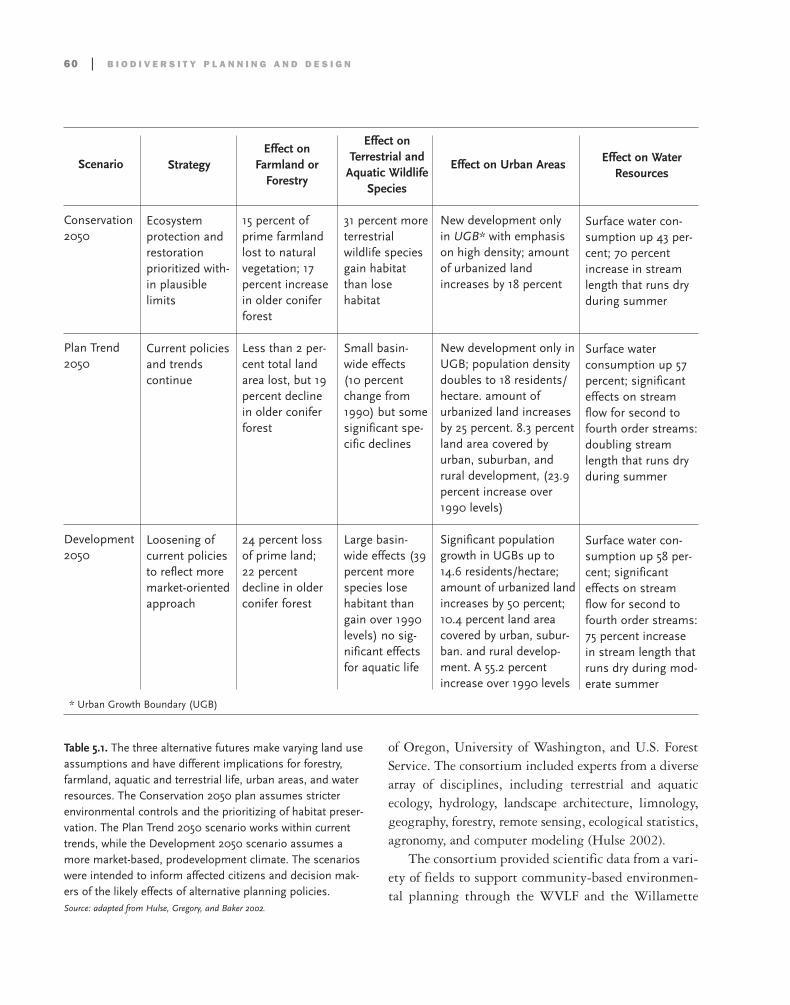
60 | B I O D I V E R S I T Y P L A N N I N G A N D D E S I G N
Scenario
Conservation2050
Plan Trend 2050
Development 2050
Strategy
Ecosystem protection andrestoration prioritized with-in plausible limits
Current policiesand trends continue
Loosening ofcurrent policiesto reflect moremarket-orientedapproach
Effect onFarmland or
Forestry
15 percent ofprime farmlandlost to naturalvegetation; 17percent increasein older coniferforest
Less than 2 per-cent total landarea lost, but 19percent declinein older coniferforest
24 percent lossof prime land;22 percentdecline in olderconifer forest
Effect onTerrestrial and
Aquatic WildlifeSpecies
31 percent more terrestrialwildlife speciesgain habitatthan lose habitat
Small basin-wide effects (10 percentchange from1990) but somesignificant spe-cific declines
Large basin-wide effects (39percent morespecies lose habitant thangain over 1990levels) no sig-nificant effectsfor aquatic life
Effect on Urban Areas
New development only in UGB* with emphasison high density; amountof urbanized landincreases by 18 percent
New development only inUGB; population densitydoubles to 18 residents/hectare. amount ofurbanized land increasesby 25 percent. 8.3 percentland area covered byurban, suburban, andrural development, (23.9percent increase over1990 levels)
Significant populationgrowth in UGBs up to14.6 residents/hectare;amount of urbanized landincreases by 50 percent;10.4 percent land areacovered by urban, subur-ban. and rural develop-ment. A 55.2 percentincrease over 1990 levels
Effect on WaterResources
Surface water con-sumption up 43 per-cent; 70 percentincrease in streamlength that runs dryduring summer
Surface water consumption up 57percent; significanteffects on streamflow for second tofourth order streams:doubling streamlength that runs dryduring summer
Surface water con-sumption up 58 per-cent; significanteffects on streamflow for second tofourth order streams:75 percent increasein stream length thatruns dry during mod-erate summer
of Oregon, University of Washington, and U.S. ForestService. The consortium included experts from a diversearray of disciplines, including terrestrial and aquaticecology, hydrology, landscape architecture, limnology,geography, forestry, remote sensing, ecological statistics,agronomy, and computer modeling (Hulse 2002).
The consortium provided scientific data from a vari-ety of fields to support community-based environmen-tal planning through the WVLF and the Willamette
Table 5.1. The three alternative futures make varying land useassumptions and have different implications for forestry,farmland, aquatic and terrestrial life, urban areas, and waterresources. The Conservation 2050 plan assumes stricterenvironmental controls and the prioritizing of habitat preser-vation. The Plan Trend 2050 scenario works within currenttrends, while the Development 2050 scenario assumes amore market-based, prodevelopment climate. The scenarioswere intended to inform affected citizens and decision mak-ers of the likely effects of alternative planning policies. Source: adapted from Hulse, Gregory, and Baker 2002.
* Urban Growth Boundary (UGB)
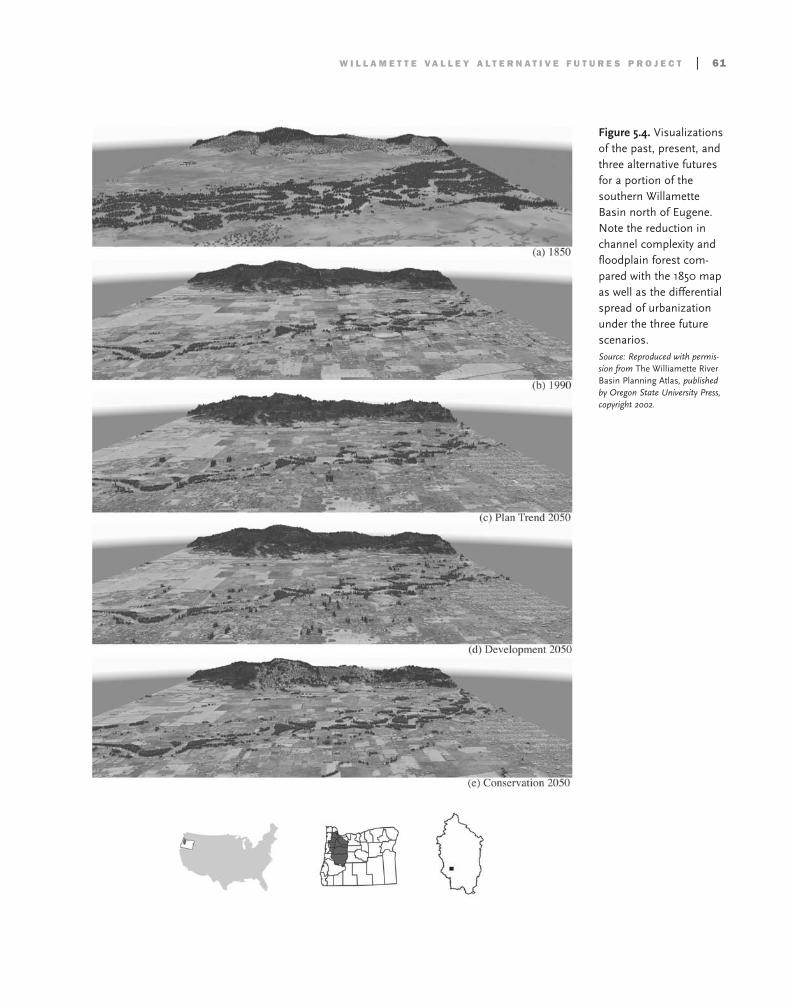
W I L L A M E T T E V A L L E Y A L T E R N A T I V E F U T U R E S P R O J E C T | 61
Figure 5.4. Visualizationsof the past, present, andthree alternative futuresfor a portion of thesouthern WillametteBasin north of Eugene.Note the reduction inchannel complexity andfloodplain forest com-pared with the 1850 mapas well as the differentialspread of urbanizationunder the three futurescenarios. Source: Reproduced with permis-sion from The Williamette RiverBasin Planning Atlas, published by Oregon State University Press,copyright 2002.
Restoration Initiative (WRI) now called the Willamette Partnership (Hulse 2002).The WVLF formed in 1996 with the goal of creating planning strategies based ondevelopment, conservation, and restoration concerns. Two years later, in 1998, theWRI was established with the task of outlining strategies to conserve and restorewildlife habitat, protect endangered species, address water quality issues, and managefloodplains while also considering human population projections. The two groups werecarefully selected to represent the diverse interests in the river basin, including triballeaders, private citizens, industry and business spokespersons, members of nongovern-mental organizations, and representatives from local, state, and federal governments(Hulse 2002). The project is funded by the EPA through a cooperative agreement withOregon State University and the Pacific Northwest Ecosystem Research Consortium.
Landscape architects have participated in Oregon’s regional planning efforts for manyyears. The WAFP is rooted in an early publication by Lawrence Halprin (1972) that wasdeemed “The Coloring Book” because it empowered groups to create their own develop-ment scenarios by completing a matrix of cross influences of land use and other uses. Thebook helped change land use policy and planning in Oregon in the 1970s as it fueled adop-tion of the statewide planning act, Senate Bill 100, in 1973, which established statewideplanning and mandatory municipal plans (Lawrence Halprin and Associates 1972).
Landscape architects and planners played a central coordinating role in the WAFP.David Hulse and his colleagues at the University of Oregon were the lead landscapearchitects on this project. According to ecologist Joan Baker, Hulse was a crucial leaderin the venture, providing a broad-scale perspective while the group was designing forthe future. Hulse acted as the integrator for the multidisciplinary team and also con-veyed project ideas and objectives to communities (Baker 2002). According to SaraVickerman, a consortium member from Defenders of Wildlife, Hulse’s experience witha breadth of disciplines helped him bridge the gap between scientific information andapplication (Bastach, Gregory, and Vickerman 2002).
To succeed, projects like the WAFP must find ways to convey data and issues to alocal audience. In the WAFP, as in similar projects, producing quality data was notenough to effect change; the data needed to be packaged in a powerful, user-friendly,visual medium in order to influence the public (Bastach, Gregory, and Vickerman2002; Hulse, Branscomb, and Payne 2004). Biologist Paul Risser believes that the keycontribution of landscape architects and planners to biodiversity planning is their prac-tical ability to bring human and social views into the discussion while simultaneouslyworking with sophisticated data analysis tools (Risser 2002). Rick Bastach, of theWillamette Restoration Initiative, describes the landscape architects of the WAFP asthe “managers” of the public participation process, while Stan Gregory, consortiumecologist from Oregon State University and the Department of Fisheries and Wildlife,credits them for their willingness to dig into the science and for allowing affected cit-izens to set the assumptions. According to Gregory, the landscape architects appliedtheir understanding of the target audience to devising graphics that placed under-standable information in front of the public (Bastach, Gregory, and Vickerman 2002).
62 | B I O D I V E R S I T Y P L A N N I N G A N D D E S I G N

W I L L A M E T T E V A L L E Y A L T E R N A T I V E F U T U R E S P R O J E C T | 63
Hulse made the pivotal decision of how best to represent the alternative futures inways that the public would understand. Understanding that the public responds wellto animated visualizations, his team used graphic techniques to distill the data somembers of the public could easily review the scenarios (Hulse, Branscomb, and Payne2004). In Hulse’s opinion, the project is more likely to succeed because it is both sci-entifically defensible and conceptually accessible to the public (Hulse 2002).
P R O J E C T G O A L S A N D O B J E C T I V E S
The three-part entity composed of the WVLF, the WRI (now the WilliamettePartnership), and the Pacific Northwest Ecosystem Research Consortium (theConsortium) worked together to fulfill its goal of developing integrated strategies fordevelopment and conservation within the Willamette Valley in the face of projectedrapid population growth. The Consortium’s specific goal was to provide scientific infor-mation to help policy makers and citizens make better choices concerning local andregional land and water use. They wanted to help shape the WVLF’s image of the basin’sfuture, aid in the WRI’s basinwide restoration strategy, and help local citizens and gov-ernments make more informed decisions.
The Consortium’s research centered on these four objectives: 1. Discovering how humans had altered the natural resources of the basin in
the last 150 years.2. Projecting how humans might change the landscape in the future given a
range of possibilities.3. Determining expected environmental effects from these changes.4. Revealing which actions in which specific locations within the basin would
have the greatest effects on natural resources (Hulse 2002; Schumaker et al.2004; Van Sickle et al. 2004).
The scientists in the Consortium also tailored their models to achieving the biodiver-sity goals of preserving and restoring functioning ecosystems rather than simply focus-ing on species. The goal of the landscape architects working within the Consortium wasto present the complex data regarding patterns and trends in the basin to the public ina clear, easily understood manner. The WVLF and the WRI worked to achieve theirobjective of including as much community participation in the process as possible. Allof these objectives combined to help move the project toward its overall goals.
P U B L I C / P R I V A T E P A R T N E R S H I P
A N D C O L L A B O R A T I O N
Politicians require a certain level of assurance that their constituents are invested in theprocess of change before they will support controversial measures, such as investing inland acquisition for restoration or conservation. The members of the Consortium, the
WVLF, and the WRI knew that involving community representatives early in theprocess would help ensure that the project results would be credible to politicians(Bastach, Gregory, and Vickerman 2002). Community participation was an integralpart of the process throughout the Willamette Alternative Futures Project. After theConsortium determined the project goals, they organized a “Possible Futures WorkingGroup,” consisting of twenty citizens from diverse backgrounds representing realestate, farming, planning, transportation, metropolitan, industry, and environmentalinterests. This group had the task of testing assumptions and formulating three real-istic future development paths for the basin (Willamette Valley Livability Forum2001). The group’s objective was to plan for multiple uses in the spirit of Oregon’sstatewide planning initiative. Thus, they considered a full suite of land uses andactions and explicitly addressed which types of land uses would be prioritized for dif-ferent locations. They met with the Consortium monthly for two years, and then theConsortium reviewed the details with the WVLF and the WRI before creating mod-els to both generate and evaluate the scenarios (Hulse 2002).
Investigators in the WAFP champion a philosophy of public involvement in the bio-diversity planning process. They understand that the United States’ population increaseand the resultant intensifying and spread of land use pose the greatest threats to ecosys-tem sustainability and biodiversity. They believe that mitigating these effects requireschanging the behavior of large numbers of people, and they contend that top-down gov-ernmental regulation approaches are ineffective because of deeply held values regardingindividual rights to property and wealth (Hulse 2000). Instead, the investigators advocatefor design solutions derived from a partnership between government agencies and com-munity residents—a process that produces greater understanding among the participantsand a higher probability that the Futures Project’s results will be used (Baker 2002).
The process of involving a public–private collaboration in the WAFP enabled thepublic to share in a vision for shaping the future that is not an all-or-nothing scenario.For example, as noted by Sara Vickerman, community members were amazed to real-ize that wildlife prospects can improve despite human population growth (Bastach,Gregory, and Vickerman 2002).
B I O D I V E R S I T Y D A T A I S S U E S
The WAFP takes a multispecies, landscape-level approach to biodiversity. The projectis unique in that it examines both terrestrial and aquatic biodiversity under theumbrella of one large study and it develops predictive models to simulate how thethree scenarios would likely affect biodiversity in the region. In developing the mod-els, investigators searched for a middle ground between pragmatism and biologicalrealism while coping with incomplete wildlife life-history data.
The project used GIS maps of pre-Euro-American settlement and 1990 conditionsto catalog habitat. The scientists also used data from the Nature Conservancy, theOregon Natural Heritage Program, and GAP analysis (Hulse 2002). The project
64 | B I O D I V E R S I T Y P L A N N I N G A N D D E S I G N
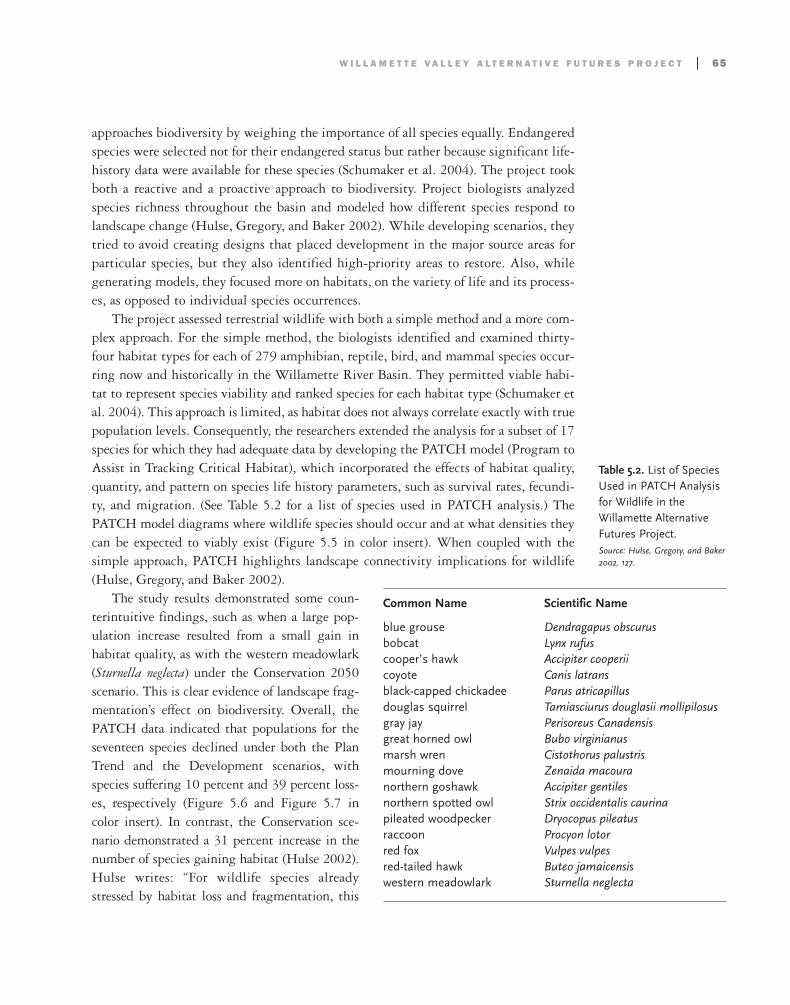
approaches biodiversity by weighing the importance of all species equally. Endangeredspecies were selected not for their endangered status but rather because significant life-history data were available for these species (Schumaker et al. 2004). The project tookboth a reactive and a proactive approach to biodiversity. Project biologists analyzedspecies richness throughout the basin and modeled how different species respond tolandscape change (Hulse, Gregory, and Baker 2002). While developing scenarios, theytried to avoid creating designs that placed development in the major source areas forparticular species, but they also identified high-priority areas to restore. Also, whilegenerating models, they focused more on habitats, on the variety of life and its process-es, as opposed to individual species occurrences.
The project assessed terrestrial wildlife with both a simple method and a more com-plex approach. For the simple method, the biologists identified and examined thirty-four habitat types for each of 279 amphibian, reptile, bird, and mammal species occur-ring now and historically in the Willamette River Basin. They permitted viable habi-tat to represent species viability and ranked species for each habitat type (Schumaker etal. 2004). This approach is limited, as habitat does not always correlate exactly with truepopulation levels. Consequently, the researchers extended the analysis for a subset of 17species for which they had adequate data by developing the PATCH model (Program toAssist in Tracking Critical Habitat), which incorporated the effects of habitat quality,quantity, and pattern on species life history parameters, such as survival rates, fecundi-ty, and migration. (See Table 5.2 for a list of species used in PATCH analysis.) ThePATCH model diagrams where wildlife species should occur and at what densities theycan be expected to viably exist (Figure 5.5 in color insert). When coupled with the simple approach, PATCH highlights landscape connectivity implications for wildlife(Hulse, Gregory, and Baker 2002).
The study results demonstrated some coun-terintuitive findings, such as when a large pop-ulation increase resulted from a small gain in habitat quality, as with the western meadowlark(Sturnella neglecta) under the Conservation 2050scenario. This is clear evidence of landscape frag-mentation’s effect on biodiversity. Overall, thePATCH data indicated that populations for theseventeen species declined under both the PlanTrend and the Development scenarios, withspecies suffering 10 percent and 39 percent loss-es, respectively (Figure 5.6 and Figure 5.7 incolor insert). In contrast, the Conservation sce-nario demonstrated a 31 percent increase in thenumber of species gaining habitat (Hulse 2002).Hulse writes: “For wildlife species alreadystressed by habitat loss and fragmentation, this
W I L L A M E T T E V A L L E Y A L T E R N A T I V E F U T U R E S P R O J E C T | 65
Common Name Scientific Name
blue grouse Dendragapus obscurusbobcat Lynx rufuscooper’s hawk Accipiter cooperiicoyote Canis latransblack-capped chickadee Parus atricapillusdouglas squirrel Tamiasciurus douglasii mollipilosusgray jay Perisoreus Canadensisgreat horned owl Bubo virginianusmarsh wren Cistothorus palustrismourning dove Zenaida macouranorthern goshawk Accipiter gentilesnorthern spotted owl Strix occidentalis caurinapileated woodpecker Dryocopus pileatusraccoon Procyon lotorred fox Vulpes vulpesred-tailed hawk Buteo jamaicensiswestern meadowlark Sturnella neglecta
Table 5.2. List of SpeciesUsed in PATCH Analysisfor Wildlife in theWillamette AlternativeFutures Project. Source: Hulse, Gregory, and Baker2002, 127.
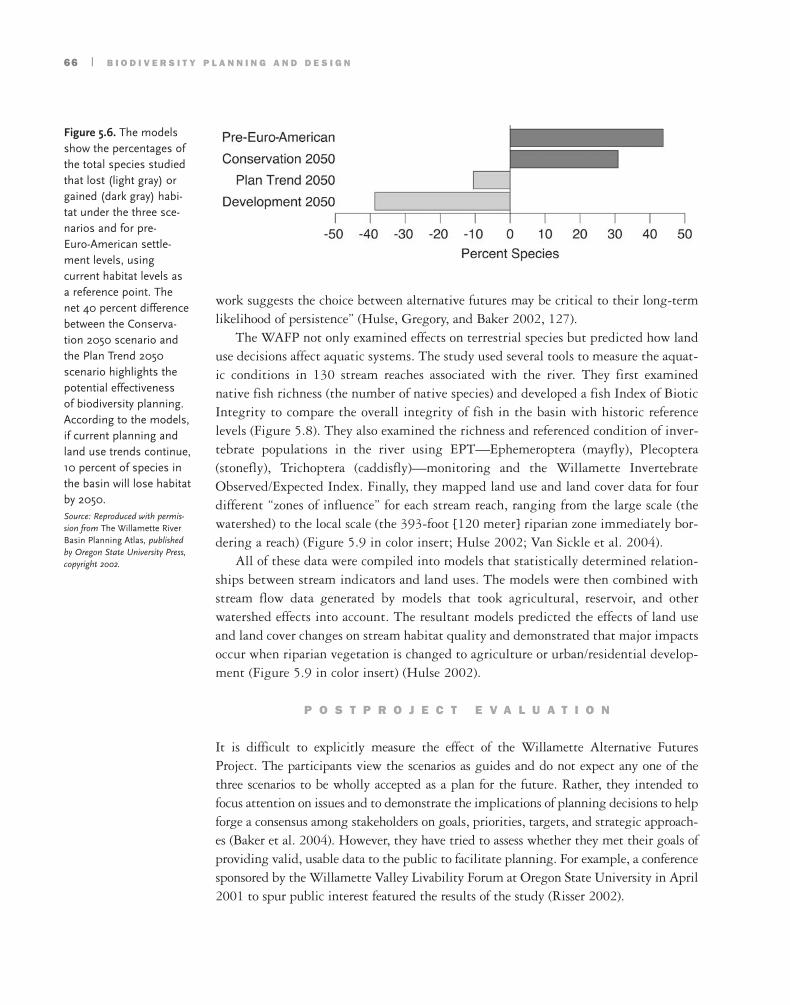
work suggests the choice between alternative futures may be critical to their long-termlikelihood of persistence” (Hulse, Gregory, and Baker 2002, 127).
The WAFP not only examined effects on terrestrial species but predicted how landuse decisions affect aquatic systems. The study used several tools to measure the aquat-ic conditions in 130 stream reaches associated with the river. They first examinednative fish richness (the number of native species) and developed a fish Index of BioticIntegrity to compare the overall integrity of fish in the basin with historic referencelevels (Figure 5.8). They also examined the richness and referenced condition of inver-tebrate populations in the river using EPT—Ephemeroptera (mayfly), Plecoptera(stonefly), Trichoptera (caddisfly)—monitoring and the Willamette InvertebrateObserved/Expected Index. Finally, they mapped land use and land cover data for fourdifferent “zones of influence” for each stream reach, ranging from the large scale (thewatershed) to the local scale (the 393-foot [120 meter] riparian zone immediately bor-dering a reach) (Figure 5.9 in color insert; Hulse 2002; Van Sickle et al. 2004).
All of these data were compiled into models that statistically determined relation-ships between stream indicators and land uses. The models were then combined withstream flow data generated by models that took agricultural, reservoir, and otherwatershed effects into account. The resultant models predicted the effects of land useand land cover changes on stream habitat quality and demonstrated that major impactsoccur when riparian vegetation is changed to agriculture or urban/residential develop-ment (Figure 5.9 in color insert) (Hulse 2002).
P O S T P R O J E C T E V A L U A T I O N
It is difficult to explicitly measure the effect of the Willamette Alternative FuturesProject. The participants view the scenarios as guides and do not expect any one of thethree scenarios to be wholly accepted as a plan for the future. Rather, they intended tofocus attention on issues and to demonstrate the implications of planning decisions to helpforge a consensus among stakeholders on goals, priorities, targets, and strategic approach-es (Baker et al. 2004). However, they have tried to assess whether they met their goals ofproviding valid, usable data to the public to facilitate planning. For example, a conferencesponsored by the Willamette Valley Livability Forum at Oregon State University in April2001 to spur public interest featured the results of the study (Risser 2002).
66 | B I O D I V E R S I T Y P L A N N I N G A N D D E S I G N
Figure 5.6. The modelsshow the percentages ofthe total species studiedthat lost (light gray) orgained (dark gray) habi-tat under the three sce-narios and for pre-Euro-American settle-ment levels, using current habitat levels asa reference point. Thenet 40 percent differencebetween the Conserva-tion 2050 scenario andthe Plan Trend 2050 scenario highlights thepotential effectiveness of biodiversity planning.According to the models,if current planning andland use trends continue,10 percent of species inthe basin will lose habitatby 2050. Source: Reproduced with permis-sion from The Willamette RiverBasin Planning Atlas, publishedby Oregon State University Press,copyright 2002.

The study results also reached 450,000 households in the basin through an eight-page feature titled “The Future Is in Our Hands,” which ran in the Willamette Chroniclenewspaper in 2001. This feature delivered the basic findings of the three alternativefutures to a large audience and rapidly educated many people about the status of devel-opment in the valley. In the insert, Paul Risser celebrates the findings of the WAFP ashe states: “With careful and deliberate efforts, we can accommodate growth while alsorecapturing 20–65 percent of the natural ecological function we have lost during thepast 150 years of intensive use of the Willamette River Basin’s natural resources.” Thepublic can also access the results of the study on the Internet and through a publishedatlas (Hulse, Gregory, and Baker 2002).
Clearly, the Willamette Alternative Futures Project met its goals of providinguseful data to a wide audience. WAFP findings and methods have also been used inthe Willamette Restoration Initiative’s restoration strategy, during 1000 Friends ofOregon’s process of examining future infrastructure costs for developing commer-cial land, and by the Alternative Transportation Futures Project, funded by theFederal Highway Administration and the Oregon Department of Transportation.The study has also catalyzed the organization of many new local watershed coun-cils; the State now recognizes more than thirty of these councils (Hulse 2002).These data have also been successfully incorporated into the planning strategies of
W I L L A M E T T E V A L L E Y A L T E R N A T I V E F U T U R E S P R O J E C T | 67
Figure 5.8. The Index ofBiotic Integrity (IBI) is ameasure of the influenceof agriculture on streamquality. The overall healthof fish populations inselected streams wascompared with historicdata from those samestreams. Higher IBInumbers indicatestreams with healthierfish populations. Thegraph shows that as theamount of land used foragriculture increases thehealth of fish popula-tions decreases in a lin-ear fashion. This inverserelationship providessound evidence thatintensive land use ispotentially harmful tobiodiversity. Source: Reproduced with permis-sion from The Willamette RiverBasin Planning Atlas, publishedby Oregon State University Press,copyright 2002.

organizations that have the power to effect change at a landscape level, such as theFederal Highway Administration.
No biological monitoring was done to validate the visual projections of the scenar-ios after they were completed. Viewing such monitoring as a future step that wouldadd credence to the work, Stan Gregory wants the Consortium to create a monitoringprogram. He envisions a regional environmental observation akin to a “Hubble tele-scope turned inward” that tracks changes in ownership and land management in thebasin to see if the trajectories are realized (Bastach, Gregory, and Vickerman 2002).Also, although the scientists involved in generating data on biodiversity were focusedon communities and ecosystems, they are now trying to bring a specific species-oriented approach back to the work by looking at species-specific issues, such as thecurrent public concern over the meadowlark (Sturnella neglecta) (Bastach, Gregory, andVickerman 2002).
The team tried to respond to public concerns about making scientific research morerelevant to real-world applications, but project participants ran into many conflicts asthey constructed their models. Under the Conservation 2050 scenario, water became ahotly debated commodity; more river water for fish meant less water for agriculture.Clashes of interest also arose over the possible location of designated restoration areas.For example, when experts selected sites to restore fire-dependent oak savannah habi-tat, they ran into problems locating a new highway (Baker 2002). In addition, as notedby Sara Vickerman, the lack of a basinwide political entity became a major obstacle inimplementing the project findings (Bastach, Gregory, and Vickerman 2002). However,the time requirement for such a process is a common drawback of community partic-ipation. The scientists also cited the public’s difficulty in brainstorming for creativeoptions and their reluctance to consider futures with far-reaching changes from exist-ing policies. Joan Baker sees this as limiting the spectrum of outcomes for the threescenarios, and she advocates bringing in expert-based designs early to inspire citizen’sideas about alternatives (Baker 2002).
68 | B I O D I V E R S I T Y P L A N N I N G A N D D E S I G N

The state of Florida loses more than 120,000 acres (50,000 hectares) of rural land todevelopment each year (Hoctor et al. 2004). In response to this trend in development,the Florida legislature supported a statewide greenways and trail system.
The role of greenways and trails in maintaining the integrity of natural landscapesand ecosystems has been explored by many, including Charles Flink, R. Searns, adn L.Schwartz, in Greenways: A Guide to Planning Design and Development (1993), and CharlesLittle, in Greenways for America (1995). Although more complex definitions exist, forthe purposes of this chapter the term greenway is defined as “a corridor of protectedopen space that is managed for conservation and/or recreation” (Executive SummaryFDEP&FGCC 1998).
The University of Florida’s Departments of Landscape Architecture and Planningwas integral in researching and designing the greenways plan. The project used an inte-grated landscape approach to “ensure that a diversity of natural and cultural resourceissues were taken into consideration,” incorporating such characteristics as applying atmultiple scales, addressing systemwide rather than site-specific features, involving mul-tiple stakeholders and disciplines, and considering context (University of Florida 1999).Many of these characteristics correspond closely to this case study’s suggestions as tohow landscape architects approach the issue of biodiversity in their work.
P R O J E C T D A T A
The Florida Statewide Greenways System Planning Project began in 1995 as a contin-uation of work undertaken by the Florida Greenways Commission in 1993–94. Theproject was prepared at the statewide scale and broken down into two subsystems: theEcological Network and the Recreational/Cultural Network (Figure 6.1) (Universityof Florida 1999). For this case study, with its emphasis on biodiversity planning, wewill focus almost exclusively on the development of the Florida Ecological Network(FEN), although the two networks are not isolated systems.
The project was developed in phases from 1995 to 1998; in 1999, an action plan
C H A P T E R 6
F L O R I D A S T A T E W I D EG R E E N W A Y S S Y S T E MP L A N N I N G P R O J E C T

called Connecting Florida’s Communities with Greenways and Trails: The Five YearImplementation Plan for the Florida Greenway and Trails System was adopted by the legislature. Implementation of the FEN has been underway ever since, including iden-tification of priority areas to strategically focus conservation efforts. The project teamat the University of Florida has been updating the FEN to reflect conservation achieve-ments and land use changes since its inception. Despite the ongoing nature of the project, this discussion focuses on the period from 1995 to 1999, when the firststatewide greenways plan was delineated.
The Florida Ecological Network was initially developed to comply with severalmandates set forth by Florida statutes. Most critically, statutory language was adopteddeclaring the legislature’s intent to establish and expand a statewide system of green-ways and trails to be designated as “Florida’s Greenways and Trail System.”Legislatively mandated steps toward that end included (1) designating the FloridaDepartment of Environmental Protection (FDEP) as the lead state agency, and (2) cre-ating the Florida Greenways Coordinating Council (FGCC) to help the FDEP.Required actions included preparing a five-year plan, adopting benchmarks to meas-ure implementation progress, and compiling management recommendations for thegreenways system (for more information, see Florida Department of EnvironmentalProtection and Florida Greenways Coordinating Council 1998).
Funding for the project—about $1.2 million from 1995 to 1999—came primari-ly from the Florida Department of Transportation’s (FDOT’s) share of U.S. federalIntermodal Surface Transportation Efficiency Act (ISTEA) funds. For the past fiftyyears, 4.8 miles (3 kilometers) of new highway have been built per day in Florida.Obviously, this level of construction strongly affects ecosystems and biodiversity, andthe FDOT was looking for ways to minimize these impacts (Hoctor et al. 2004). TheFDOT was interested in this particular project because it wanted to identify landscaperesources to be avoided when building roads and to explore the possibility of usingtrails as an alternate mode of transportation (Carr 2002). As the lead agency, the FDEPalso provided some funding.
P R O J E C T P A R T I C I P A N T S
This project was a continuation of efforts begun in 1991 by the Conservation Fund and1,000 Friends of Florida, when these groups created the Florida Greenways Project inan attempt to build a statewide constituency for greenways. They also initiated sever-al greenways and trails prototype projects at the community and regional levels. In1993, Governor Lawton Chiles created the Florida Greenways Commission (FGC) inresponse to this effort. The commission was charged with determining whether thegreenways concept had a place in public policy and, if so, what principles were criticalfor effective implementation. In their 1994 report to the governor, the FGC affirmeda belief that greenways could enhance Florida’s efforts to conserve its natural and cul-tural heritage as well as its commitment to outdoor recreation. The FGC provided
70 | B I O D I V E R S I T Y P L A N N I N G A N D D E S I G N
F L O R I D A S T A T E W I D E G R E E N W AY S S Y S T E M P L A N N I N G P R O J E C T | 71
recommendations for a greenways system to link natural areas and open space, conservenative landscapes and ecosystems, and increase recreational opportunities for citizensand visitors. In response to this report, the Florida legislature created the FGCC in 1995to continue the work of the commission and to assist the FDEP in policy implementa-tion. The FGCC was a twenty-six-member board composed of public and private representatives of business, conservation, landowner, recreation, and local and federalgovernment interests as well as state agency representatives (FDEP & FGCC 1998).
In 1995, after the greenways legislation had been adopted, the University ofFlorida was asked to prepare a recommended design/physical plan for the greenwayssystem. This plan was developed using a geographic information system (GIS) decisionsupport model (DSM) to help identify high-priority conservation areas for the FEN.By overlaying multiple data layers (representing, for example, roadless areas, land useand land cover, and species habitats) to create a map of priority conservation areas, the GIS model provided a sound scientific basis on which to identify and rank ecolog-ically sensitive areas. The project was based in the university’s Department ofLandscape Architecture, with strong involvement by individuals from many other university departments. The principal investigators were Margaret (Peggy) Carr (Professor, Department of Landscape Architecture), Mark Benedict (AssociateScientist, Department of Landscape Architecture), Thomas Hoctor (Doctoral Can-didate, Department of Wildlife Ecology and Conservation), and Paul Zwick (Professor,Department of Urban and Regional Planning).
As the only landscape architect involved, Professor Peggy Carr describes her role as“assembling the team” and determining the decision-making process by which all workwould be completed. Design principles were applied to bring the project and its partici-pants together by integrating multiple interests. The process included establishing goalsand objectives, analyzing and synthesizing the inventory, creating alternative scenarios,and measuring the project’s progress toward achieving its goals and objectives. ProfessorCarr had a particular interest in the ethical basis for the project She believes that humaninteraction should also be considered when planning a successful greenway because humanwell-being is dependent on healthy, functioning ecosystems. She considered the idealapproach as one that blended immediate human needs (e.g., for recreation opportunities)with long-term human dependency on healthy ecosystems. This, she asserts, is why theproject required the involvement of a landscape architect—because the scientists involvedwere “hard core conservationists” focusing their attention on the ecological aspects of theproject, and the recreationists were equally focused on immediate human uses of thegreenway. Including a landscape architect in the plan’s development brought these twosides together to create a greenway plan with multiple uses and functions (Carr 2002).
During the development of the DSM, a large technical advisory team was assembledto provide peer review and to test the model’s assumptions. The team included repre-sentatives of natural resource agencies and nongovernmental organizations (NGOs). Thefirst phase involved applying the model and generating maps of the FEN. The phase 1results, titled “Decision Support Model Results,” were publicly aired.
72 | B I O D I V E R S I T Y P L A N N I N G A N D D E S I G N
The second phase included citizens as well as representatives from local govern-ment, Florida’s five water management districts, timber and farming interests, andconservation and recreation NGOs. Professor Carr was particularly involved in thesemeetings, acting as “translator” to relate technical information and attempting to helpthe public visualize the results of the greenway plan. The results of this second phasewere called “Decision Support Model Results as Modified by Public Comment.”
A third, and final, phase involved review by landowners, who were allowed to havetheir lands removed from state maps of the FEN if they chose. The results of the thirdphase of review were titled “Model Results as Modified by Public Comment andPrivate Landowner Comment.” However, the phase two’s results, “Decision SupportModel Results as Modified by Public Comment,” are a more complete representationof the FEN because they identify important ecological and recreational hubs and link-ages (Carr 2002; Hoctor 2002; FDEP & FGCC 1998).
The Florida Ecological Network was originally adopted as the Florida EcologicalOpportunities Network in 1999. It was updated in 2004 with the following changes:1) inclusion of conservation acquisitions that occurred between 1999 and 2004, 2)exclusion of areas originally found to have conservation potential that were convertedto urban use between 1999 and 2004, and 3) inclusion of some areas of pastureland notoriginally included because of a change in the criteria used for determining ecologicalpotential (Figure 6.2).
Once the Florida Ecological Network 2004 was adopted by the state, it was evalu-ated and prioritized in 2005. Priority 1 lands are those found in large, intact patchescontiguous to significant existing conservation lands. Priority 2 lands are the balanceof those that if protected would provide continuous ecological connectivity from southFlorida to the western panhandle. Priority 3 lands provide redundancy or enhancementto critical corridors. Priority 4 lands mostly enhance riverine protective zones in northFlorida. Priority 5 lands are mostly altered agricultural lands that have potential toprovide ecological connectivity but with less existing ecological integrity than higherpriority area. Priority 6 lands are mostly existing working landscapes that augment orare redundant with other proposed connection (Figure 6.3).
P R O J E C T G O A L S A N D O B J E C T I V E S
The Florida Statewide Greenways System Planning Project was a broad-scale projectthat involved many participants and had a number of stated goals and objectives. Theoverall goal was to create a “green infrastructure” to “link natural areas and openspaces, conserving native landscapes and ecosystems and offering recreational opportu-nities across the state” (FDEP & FGCC 1998). After examining the goals described bythe 1994 Report to the Governor, the university team developed additional goals toclarify which direction they would take. With this in mind, the overarching goal stat-ed in the University’s “Final Report, Phase II” is “to delineate a physical plan for astatewide greenways system, combining the results of GIS modeling and public input
while following guidelines contained in the Florida Greenways Commission’sDecember 1994 Report to the Governor.”
The specific goals and objectives guiding the development of the Florida EcologicalNetwork were to use a regional landscape approach to design an ecologically function-ing statewide greenways system that
• conserves critical elements of Florida’s native ecosystems and landscapes,• restores and maintains connectivity among native ecological systems and
processes,• facilitates the ability of these ecosystems and landscapes to function as
dynamic systems, and• maintains the evolutionary potential of these ecosystems to adapt to future
environmental changes (University of Florida 1999).
Thomas Hoctor simplified the goal of the FEN to the following: “to determine howeverything fits together, thereby selecting viable areas to conserve biodiversity”(Hoctor 2002). This is a coarse filter approach that aims to protect entire ecosystemsrather than focusing on individual species. In this way, both common and threatenedspecies are protected along with their habitats. Implementing the project would main-tain connectivity across the state and would conserve flora and fauna integral toFlorida’s natural ecosystems. This is especially important given the rapid rate of urban-ization in Florida and the large number of federally listed endangered and threatenedspecies, for which Florida ranks third in the United States.
The continued existence of some of Florida’s more fragile ecosystems and speciesdepends on a lack of disturbance. Thus, human use of these areas needs to be carefullyplanned and managed. Figure 6.2 shows the FEN map that resulted from the planningprocess. As described earlier, the greenway system needed to achieve dual purposes ofconserving native landscapes and ecosystems and providing recreational opportunitiesfor both citizens and visitors. Professor Carr describes the ecological network as a foun-dation on which the other parts of the system can be supported, including linear recre-ation and cultural heritage. It was necessary to first determine what areas should bepreserved with no significant human use, and then which areas could be designated forappropriate human recreational use (Carr 2002). By following this process, particular-ly sensitive areas with high-priority status in terms of biodiversity could be identifiedand “set aside” as necessary, and other areas could be successfully used for both habitatand ecosystem protection and human recreation.
P U B L I C / P R I V A T E P A R T N E R S H I P
A N D C O L L A B O R A T I O N
The Florida Statewide Greenways System Planning Project was a collaborative efforton many levels. The overall project was a partnership between the Department ofEnvironmental Protection, the Florida Greenways Coordinating Council (which itself
F L O R I D A S T A T E W I D E G R E E N W AY S S Y S T E M P L A N N I N G P R O J E C T | 73

consisted of members from several different public and private sectors), the Universityof Florida, the Florida Department of Transportation, and many others. Public agen-cies, citizens, and public landowners all had a hand in developing the project’s visionand, later, its recommendations.
The general public and private landowners were most directly involved in morethan twenty working group sessions that followed the development of the DSM, whenthey thoroughly reviewed the model’s “products” (Hoctor et al. 2004). The DSM wasmodified very little by the general public at these meetings, although landowners wereable to choose to have their lands removed from the ecological network—and somedid. The design of the trails network, on the other hand, was highly influenced by thepublic. It seems that GIS modeling was less effective for designing a statewide trailsnetwork than an ecological network, and the personal experiences and opinions of thepublic provided the fine-grained detail needed to design trails (Carr 2002). TheNature Conservancy, the Trust for Public Land, and 1,000 Friends of Florida were alsoinvolved in the review process.
The issue of private property rights proved to be the largest stumbling block to theproject. Attorneys for some large landholders became highly involved in the reviewprocess, preventing the mapping efforts from carrying any regulatory authority. Manyindividual meetings with the landholders and their attorneys were held to address theirconcerns. The final lack of regulatory authority for the FEN did not trouble the proj-ect designers or agency representatives, because they understood from the start that theproject would go forward as a public–private partnership. The property rights issue,however, was an unanticipated inflammatory issue that consumed considerable timeand effort for everyone involved (Carr 2002).
B I O D I V E R S I T Y D A T A I S S U E S A N D
P L A N N I N G S T R A T E G I E S
As described by Hoctor et al.,: “In the state of Florida the application of integratedreserve design principles has been forwarded since the 1980s as a means to effectivelyconserve biodiversity in the face of rapid human population growth and habitat frag-mentation” (2000, 985). The university team relied largely on existing data that indi-cated important biodiversity areas for conservation when developing their DSM. In thelate 1980s, the Florida Game and Fresh Water Fish Commission (FWC) now knownas the Florida Fish and Wildlife Conservation Commission performed GAP analysisand viability assessments for a number of target or indicator species. Jim Cox andRandy Kautz conducted a study for the FWC in 1994 called “Closing the Gaps,”which examined focal species—such as those species that have a wide range or thosethat may act as indicators for particular communities (Table 1.3).
These viability studies provided a good foundation for developing the FEN. In fact,they surpass the same type of studies for other states, even today, because the amountof information available for native species in Florida far exceeds that collected for
74 | B I O D I V E R S I T Y P L A N N I N G A N D D E S I G N
F L O R I D A S T A T E W I D E G R E E N W AY S S Y S T E M P L A N N I N G P R O J E C T | 75
native species in most other states (Hoctor, Carr, and Zwick 2000; Hoctor 2002).Additional data for the DSM came from the Natural Heritage Program now known asthe Florida Natural Areas Inventory, including an analysis of aerial photos identifyingareas of conservation interest. The main problem associated with data collection wascurrency; by the time remotely sensed land cover data had been thoroughly analyzed,they were often five or ten years out of date. This is an inherent problem with data usedfor GIS applications anywhere. Although the investigators used remotely sensed datafrom the late 1980s and early 1990s, they also used SPOT imagery from 1995–96 toidentify newly developed areas and eliminate these from the study (Hoctor 2002).
The DSM included four steps: (1) identifying areas of ecological significance, (2) selecting hubs,(3) identifying linkages, and (4) creating the FEN by combining the identified hubs and linkages(Figure 6.2; Hoctor et al. 2004). A GIS process called least-cost path modeling was used to identi-fy optimum linkages by identifying cost surfaces (also called “suitability surfaces” in the reports)and applying them to the ArcInfo GRID module. As a result of this analysis, 23 million acres (9.3million hectares), or 57.5 percent of the state, are incorporated into the FEN. Of this amount, 11.8million acres (4.8 million hectares) were within public lands, private preserves, or open water.Figure 6.3 illustrates the effects the greenway plan will have on a variety of ecological communitytypes; those indicated will experience increased protection under the plan
The investigators believe that this method of protecting a majority of intact naturaland seminatural landscapes may be a good coarse filter approach, although other con-servation efforts are needed to adequately protect biodiversity within the state. Mostrare natural communities and species in Florida are now represented in the FEN andexisting conservation areas (Hoctor, Carr, and Zwick 2000). The university team notesthat the process of prioritizing significant habitats and protecting a reserve system hasbeen occurring in Florida for some time. The progress achieved through this project,however, is “the combination of a systematic landscape analysis of ecological signifi-cance and the identification of critical landscape linkages in a way that can be replicat-ed, enhanced with new data, and applied at different scales” (Hoctor et al. 2004, 197).
P O S T P R O J E C T E V A L U A T I O N
The Florida Greenways and Trails System was well received by the public largelybecause its high recreational and ecological values. The property concerns raised byprivate landowners damaged public acceptance of the project and pressured the FDEPand other state agencies to question the protection of such large tracts of land whendevelopment is so important to Florida’s economy. However, it must be noted that theproject has been fairly successful even in the face of such opposition, as shown by theprivate lands that appear on the final greenways maps. Most private property concernshave now been assuaged, and the idea of ecological connectivity and protection oflarge-scale landscape linkages has become codified as an important goal for most ofFlorida’s land conservation programs (Carr 2002; Hoctor 2002).
The development of the five-year implementation plan did not signal the end of

planning for ecological connectivity in Florida. Rather, it is an ongoing process thatwill be continually evaluated and revised. Some elements of this process include andupdate to the FEN, continued re-prioritization of lands for acquisition and protection,an annual identification of critical linkages, assessment of the process by various agen-cies, and the creation of new partnerships. The FGCC was mandated to create bench-marks by which they may measure the success of the project. These benchmarks, asdescribed in Connecting Florida’s Communities with Greenways and Trails (FDEP & FGCC1998), are as follows:
1. Establish a connected system of greenways and trails from one end of Floridato the other. This system is measured in acres and miles.
2. Maintain resources within the greenways and trails so that these remain suit-able for designation in the future.
3. Ensure that all Floridians are within a fifteen-minute commute to a greenwayor trail.
4. Ensure that 95 percent of visitors to public-access greenways or trails are sat-isfied with their experience.
Future work is needed to maintain and protect the FEN. Individual species analysisis needed for the black bear (Ursus americanus ) and Florida panther (Puma concolor coryi),two wide-ranging umbrella species that depend on large areas with high connectivityto survive and reproduce. Identification of core areas, corridors, and buffer zones is alsoneeded (note that core areas are different than hubs; cores are managed areas, and hubsare unmanaged destinations). Increasing human development will also necessitate clos-ing unnecessary roads in public areas, protecting high-priority land from conversion tointensive use, and avoiding major new road projects (Hoctor, Carr, and Zwick 2000).The team has already succeeded in proactively coordinating with the FDOT to placehigh-impact human uses in areas least disruptive to wildlife. In fact, the FDOT is work-ing with Dan Smith a PhD student from the University of Florida Department ofWildlife Ecology and Conservation to determine where roads cross important elementsof the FEN and what mitigation measures might be taken to reduce their impacts. Thepurpose of this research was to avoid critical areas and to decrease roadkill by buildingwildlife corridors and underpasses in appropriate locations (Hoctor 2002).
Several issues—primarily concerning data collection and analysis—that arose dur-ing this project are pertinent to all landscape architects who address biodiversity intheir work. For example, although GIS is gaining momentum as an integral tool inlandscape planning, it can prove to be too complex on several levels; at times, it mayprovide more detail than necessary or may fail to address the needs of the people whowill be using the space after a plan is implemented. Also, the amount of time need-ed to amass, digitize, and rectify data using GIS may mean that the land use datarelied on by a biodiversity planning project are no longer current. However, the use-fulness of GIS in landscape planning—especially as a tool to map sensitive habitatand ecosystems—makes it worth addressing these problems. In fact, according to
76 | B I O D I V E R S I T Y P L A N N I N G A N D D E S I G N
Professor Carr, projects of this type and scale should not be undertaken without theuse of GIS. This is becoming a reality for both governmental and private planningefforts, as GIS technology is quickly becoming more user friendly and data availabil-ity, accuracy, and currency are rapidly and continuously improving.
Species selection is another complicated data issue; no agreed-upon “best choice”method exists for determining which species or ecosystems require conservationefforts. Often, it is up to the landscape architect and consulting ecologist to make aneducated decision about what is most important or integral in the specific area in ques-tion. The Florida Greenways Project uses both large, wide-ranging species and speciesof specific conservation interest to help define areas of ecological significance. For aproject of this scale, this multispecies approach was appropriate.
Finally, the Florida Greenways Project shows that public involvement in projectsthat have an ecological component can provide useful insights as well as complications.For example, private landowners whose land was indicated to have high-priority sta-tus were not always willing to set this land aside for conservation purposes. On theother hand, citizen participation in the trail development process guided the team ina direction they did not expect to go—that is, they found it necessary to apply moreweight to citizen experience and opinion than to the findings of a GIS model. Thisindicates that landscape architects need to be equally sensitive to both cultural andecological values when working on projects that influence both types of systems.(Hoctor et al. 2004, 200), provide a basic solution for the difficulties that arise whenplanning for biodiversity:
It has become clear that effective conservation of biodiversity and other naturalresources will require a large scale, integrated and comprehensive approach thatdoes not tread on private property rights. Integral to such an approach will be acombination of local participation and decision making that can build a conser-vation constituency with top down planning and oversight that comprehensive-ly identifies ecological resources of statewide significance and promotes land usedecisions that meet both local needs and protect the state’s national heritage andecological services.
Further, as Hoctor et al. (2004, 189) explain, the rationale behind using a land-scape approach for a greenway project is that “a functional reserve network integral toeffectively conserving Florida’s biological diversity and other natural resources can beidentified by using a landscape approach guided by regional conservation planningprinciples combined with information on areas needed to protect viable populations oftarget species and natural communities.” It is important that the problem be addressedat multiple scales and from multiple perspectives, and that it provide for multiplefunctions, as much as is reasonably possible. This is true for large, statewide projects,such as the Florida Greenways Project, as well as for smaller projects. Often, it is thelandscape architect who must bring together the divergent views of the partiesinvolved to create a balanced, multiuse vision for the project.
F L O R I D A S T A T E W I D E G R E E N W AY S S Y S T E M P L A N N I N G P R O J E C T | 77

Understanding biodiversity should be fundamental to landscape architects and plan-ners because, by definition, most planning and design activities change spatial config-urations, ecological patterns, and associated processes, often unintentionally. Ourresearch found that biodiversity planning and design are most successful when inte-grated with other goals, including environmental education, environmental impactmitigation, and regulatory compliance. Landscape architects and planners are recog-nized for their abilities to synthesize and visualize complex information, their famil-iarity with construction processes, their skills in facilitating public participation, andtheir expertise in implementing and managing interdisciplinary projects. Our researchalso found that biodiversity is often important in broad-scale, public policy-relatedprojects and when mandated by regulatory and permitting agencies.
Project and site-specific data are often too incomplete to explicitly support plan-ning and design decisions—an inherent problem related to the site-and species-specificnature of the data required. Despite this common lack of good data for planning anddesign, monitoring has rarely been conducted, mostly because of cost and conveniencelimitations but also because of a general ignorance of the value of monitoring. This isunfortunate because it limits the ongoing involvement of landscape architects andplanners in the projects they conceive, design, and build—and limits their ability tolearn whether they achieved the intended results. This lack of monitoring causesmissed opportunities (1) to contribute new knowledge to science, (2) to allow plannersand designers to expand their interdisciplinary collaboration with scientists and deci-sion makers, and (3) to develop and refine planning strategies and design responsesthat address biodiversity more effectively across a range of contexts and project types.
To become more active players, landscape architects and planners must becomemore familiar with the issues, terminology, and methods for biodiversity planning anddesign. They need to understand the complex issue of representative species selectionand how to apply a selected method in the context of species or habitat associations andecological models. The references included in this study provide a starting point. Theremay be a need to integrate this knowledge into landscape architecture education and
C H A P T E R 7
C O N C L U S I O N S A N D D I S C U S S I O N
to add to the requirements for professional licensure, linked in part to the rationale ofprotecting public health, safety, and welfare.
Including biodiversity protection as an additional objective to a project may alsohelp landscape architects and planners garner a wider range of support and form part-nerships that aid other efforts in landscape planning, such as water resource planning,agriculture and wood production, and community and cultural adhesion.
D I S C U S S I O N O F C A S E S T U D Y
P R O P O S I T I O N S
These five case studies were organized and conducted to address four general proposi-tions related to biodiversity planning and design:
PR O P O S I T I O N 1. Biodiversity planning is in demand in rural, suburban, and urban areas.
Is biodiversity chiefly an issue in remote areas, where human occupation and activi-ties are minimized? Or is it a legitimate concern in cities and towns, where humanactivity predominates? The answer has important implications for the future role oflandscape architects and planners in biodiversity planning and design. If biodiversityplanning is in demand across the rural–urban continuum, it could represent animportant, even unprecedented professional opportunity, suggesting a new branch ofprofessional practice and an associated area of knowledge for education in landscapearchitecture and planning. In general, this study found that biodiversity planning isroutinely integral to broad-scale landscape plans and is becoming more recognized infiner-scale landscape design projects.
Woodland Park Zoo, located within the city of Seattle, takes advantage of its mis-sion to demonstrate biodiversity and educate the greater public in a highly urban con-text. The zoo is visited by more than two million visitors annually, holding a greatpotential to influence the public’s understanding of, and appreciation for, biodiversityand its relation to habitat globally.
The Devens Federal Medical Prison is located in a rural–suburban area wherestrong public concern exists for environmental impacts, including biodiversity. Theproject’s landscape architects recognized a special opportunity to introduce biodiversi-ty opportunistically as a project goal, in part to help expedite the permitting andreview process. The Devens project also demonstrated how a construction project cansurpass the objective of merely minimizing its on-site impacts by restoring andincreasing the quality and amount of habitat on site (i.e., a net gain) and also enhanc-ing the habitat value of the watershed downstream.
Crosswinds Marsh linked an urban need (airport expansion) with a suburban–ruralresource (Crosswinds Marsh site) and in the process satisfied a regional metropolitanneed (county park). The project demonstrated how ex situ mitigation sites for urbanconstruction projects can create significant opportunities in suburban and rural areas.
80 | B I O D I V E R S I T Y P L A N N I N G A N D D E S I G N
C O N C L U S I O N S A N D D I S C U S S I O N | 81
This large-scale mitigation project raises the ethical issue of the value of the wetlandscreated in comparison to those destroyed, regardless of the context of each. How is thissuccess measured and for how long? And, perhaps more importantly, how can the les-sons learned be communicated to others to benefit future projects?
The Willamette Alternative Futures Project addressed a wide range of planningissues in a major river basin that spans the urban to rural gradient. Like many regionsof the United States, the basin is undergoing a fundamental economic change from anagricultural to a service-based economy. This shift is driving land use changes that havesignificant implications for biodiversity across the basin. As future scenarios of land-scape conditions demonstrate, the region will lose biodiversity unless proactive plan-ning strategies are put in place. The Willamette study uses biodiversity as a yardstickto measure the consequences of various alternative futures and to identify the best loca-tions for protecting or restoring biodiversity aspart of alternatives future scenarios.
The Florida Greenways System spans the entire state and ranks biodiversity andrecreational resources in rural, suburban, and urban contexts. Although most high-priority lands for biodiversity in the system were required to be at least 2,470 acres(1,000 hectares) in size, smaller, isolated priority areas were also identified and desig-nated. Most of the high-priority areas for biodiversity conservation were in rural andremote locations, while the smaller priority areas were more often located in suburbanand urban contexts. Linking the smaller urban and larger rural areas was the centralinnovative concept behind the statewide plan, as it is in much of greenway planning.This linkage concept integrates resources across the urban-rural continuum.
The case studies individually and collectively support the proposition that biodiversi-ty is in demand across the urban–rural continuum. They also demonstrate the need forlandscape architects and planners to understand the hierarchical nature of biodiversityacross multiple scales, which provides the context in which biodiversity projects originate.
PR O P O S I T I O N 2. Landscape architects and planners will play a larger role in biodiversity
planning and restoration ecology as nondegraded habitat becomes scarce.
This proposition was designed to test the assumption that landscape architects cancontribute significantly to biodiversity when restoration or habitat creation is neededor mandated. In these professional contexts, landscape architects bring particularexpertise in construction and vegetation management.
Although a zoo cannot be considered a true restoration of habitat, exhibits can rep-resent a type of habitat creation for a particular species (especially if designed accord-ing to the concept of landscape immersion) and may potentially lead to, and providenew knowledge for, the restoration of natural, wild habitats elsewhere.
The Crosswinds Marsh project was essentially an ecological restoration project; atthe time it was built, it was the largest wetland mitigation project in the UnitedStates. The landscape architects led a large interdisciplinary team in developing newrestoration concepts and actions to achieve project objectives. The undertaking also
82 | B I O D I V E R S I T Y P L A N N I N G A N D D E S I G N
created an opportunity to expand the ecological mitigation requirements, adding pub-lic use and environmental education benefits.
The loss of rural land and the need to find ways to develop in a less destructivemanner led to the involvement of University of Florida landscape architects in theFlorida Greenways Plan. The landscape architects functioned as mediators betweenspecial-interest groups, including landowners, biologists, social scientists, anddevelopers—each with focused agendas.
The Devens project—located on a former golf course on an U.S. Army post thatcontained a Superfund site—was essentially a restoration effort. Research has shownthat protection, enhancement, and restoration of natural systems can provide the mostcost-effective and ecologically sound techniques for stormwater management (Barrent1997). Originally, the Federal Bureau of Prisons planned to build facilities on theentire 300-acre (121 hectare) parcel, until project designers developed a plan thatreduced sprawl and preserved open space by organizing the facilities on 45 acres (18.2hectares) of already-disturbed land.
The Willamette Alternative Futures Project demonstrated the causal links betweenalternative future possibilities and biodiversity and water quality. The models devel-oped in the research will be used explicitly in ongoing riparian restoration effortsthroughout the basin.
Overall, the case studies demonstrate how landscape architects can bring manage-ment skills to a project to integrate human needs with the needs of the environmentfor mutual benefits. The studies also show that when landscape architects becomeinvolved in projects on disturbed land, they have the capacity to solve aesthetic andenvironmental problems creatively while maximizing benefits to biodiversity. In theseways, landscape architects have important skills to contribute to the science and prac-tice of restoration ecology.
PR O P O S I T I O N 3. Biodiversity goals that are explicitly part of a project’s mission or
design process are more likely to be achieved.
This proposition addresses the relative importance of biodiversity in projects withmultiple goals. When biodiversity is a primary goal, it should influence the entireproject from conception through implementation. However, the project’s impact onbiodiversity can be assessed only through long-term monitoring.
Biodiversity was the fundamental goal of the long-range plan for Woodland ParkZoo. Zoos present a new frontier for the protection of biodiversity, although their roleis often indirect. As David Hancocks (2001, 177) explained, zoos need to review theirgoals and philosophy. Zoo visitors should see and learn about species’ interconnectionswithin ecosystems. Zoos should aspire to make visitors aware of the central importanceof biodiversity—even for human well-being.
In the Devens project, the biodiversity goal was secondary to the stormwater man-agement objective. The fact that water quality improvement and habitat creation were
primary goals from the outset ensured that the key hydrological aspects of the projectwere understood and designed in the broader context of biodiversity and restoration.However, because biodiversity was not an explicit project goal, it has not been system-atically monitored since the project’s completion, and therefore the project’s impact onbiodiversity remains speculative.
Crosswinds Marsh was a mandated wetland mitigation project with explicit biodi-versity goals. The major wetland loss at the airport site set clear goals for the off-sitewetland restoration, which structured all of the project’s phases: assessment, planning,design, construction, and monitoring. Biodiversity considerations influenced everyaspect of the project and produced much of the project’s success—as verified throughpostproject monitoring.
The Willamette Alternative Futures Project centered on understanding and mod-eling the effects of urban growth on habitat and water quality. Since biodiversity con-cerns formed the core of the project, they are more likely to be incorporated into thework of other entities that use the project’s data and recommendations. Therefore, bio-diversity has a greater chance of being protected through planning at the river basinscale. The test will be (1) to evaluate the project’s effect on public understanding andsupport for alternative planning strategies and (2) to monitor biodiversity comprehen-sively and over the long term.
Biodiversity was the tail that wagged the greenway dog in the Florida GreenwaysPlan. After the Florida Ecological Network was designed, it became the basis for inte-grating complementary goals, including hiking trails, recreation, and alternativetransportation. At the time of this study, the ecological network was being implement-ed with biodiversity as an integral component.
Collectively, these cases demonstrate that when defined as a primary project goal,biodiversity is likely to remain predominant over other aspects and goals of the proj-ect. The studies reveal this trend through a variety of project types in different regionsand contexts. The lesson is that biodiversity planning and design is a field of rapidlygrowing interest and often drives many projects that involve landscape architects andplanners. The cases also demonstrate how landscape architects and planners are able tomanage projects for multiple goals, adding value to biodiversity projects that is oftenkey to the projects’ acceptance, permitting, or funding.
PR O P O S I T I O N 4. Integrating biological and ecological information with the planning and
design process will contribute to a better balance between land use and the naturalenvironment and will increase public awareness of biodiversity’s value to humans.
This proposition seeks to learn the extent to which the case studies have influencedhuman–environment relationships and biodiversity awareness. We are asking whetherplanning and design professionals understand the magnitude and implications of bio-diversity, and if so, what are they doing about it now? And what should they do aboutit in the future?
C O N C L U S I O N S A N D D I S C U S S I O N | 83
Through landscape immersion and cultural resonance, Woodland Park Zoo direct-ly and explicitly increases human understanding and respect for the natural world andits animals. Zoos designed in this manner have been shown to increase human sympa-thy and lead to actions in support of animals in the wild.
The Devens stormwater project has caught the attention of design professionals, mak-ing them more aware of how stormwater mitigation projects can opportunisticallyenhance wildlife habitat. In addition, the project has already served as a model for otherdevelopment activities at the larger Devens site. Anecdotally, the workers encountered atthe federal medical prison facility during the case study visit seem interested in wildlifeand have learned firsthand the potential for aquatic habitat restoration at the site.
Crosswinds Marsh illustrates the distinct potential landscape architects have to cre-ate a more constructive order between land use and human environment. The marshnow functions as a viable habitat for many species and communities and enhanceshuman appreciation for wildlife through its public use component.
Through robust, data-verified modeling, the Willamette Alternative FuturesProject demonstrated that habitat loss or degradation caused by urbanization negative-ly affects population levels and species health. If the diversity and viability of animalspecies are viewed as broad indicators of environmental condition, the project impliesthat human health and welfare would suffer if current trends were to continue or ifconservation planning policies were relaxed. Since a primary focus of the project wasto provide sound, defensible data for regional and local planning authorities, it will betelling to watch how the findings will be used to guide planning within theWillamette River Basin. Already, several other planning entities, including theOregon Department of Transportation and the Federal Highway Administration, haveincorporated findings of the project into their work.
The Florida Statewide Greenways Project shows that a rapidly growing statecan make biodiversity protection a planning priority and can integrate biodiversi-ty with multipurpose statewide planning. The ultimate test of this project’s effec-tiveness will be through long-term monitoring of land use change, amount of landin conservation status, integration of recreation with conservation, and gamma-level biodiversity.
Biodiversity is profoundly important to humanity. In its broadest sense, biodiver-sity involves all forms of life and the processes and functions on which life depends.Paradoxically, although we as humans are dependent on biodiversity for our very exis-tence, we are also directly responsible for an unprecedented global decline in biodiver-sity. Clearly, important work remains to be done. The American Society of LandscapeArchitects’ habitat policy, the American Planning Association’s Code of ProfessionalEthics, and the mission statement of the Society for Ecological Restoration each artic-ulates the value and importance of integrating ecological information and knowledgeinto projects that can influence understanding and appreciation of biodiversity. Thecase studies reviewed provide strong evidence that landscape architects and plannersare already significantly involved in this important work.
84 | B I O D I V E R S I T Y P L A N N I N G A N D D E S I G N

C O N C L U S I O N S A N D D I S C U S S I O N | 85
H O W C A N L A N D S C A P E A R C H I T E C T S
A N D P L A N N E R S A D D R E S S
B I O D I V E R S I T Y I N T H E I R W O R K ?
Human actions may negatively influence biodiversity in three main ways: causinghabitat loss or fragmentation, introducing invasive species, and inducing global cli-mate changes. All can be directly or indirectly influenced by decisions made by land-scape architects and planners. In Linkages in the Landscape, a publication of the WorldConservation Programme’s Forest Conservation Programme, Bennett (1999) suggestsfour basic strategies for planning and designing for biodiversity:
1. Expanding the area of protected habitat2. Maximizing the quality of existing habitat3. Minimizing the impact from surrounding land use 4. Promoting connectivity of natural habitat to counter the effects of isolation.
While acknowledging the benefits of all four strategies, promoting connectivityas a synergistic action receives the highest priority. Bennett (1999, 156) states: “Thedistinctive role of connectivity in a conservation strategy is to ‘tie together’ habitatsinto a linked system to restore the natural flow and interchange of plants and animalsacross the landscape.” Connectivity is defined as the “degree to which landscape facil-itates or impedes movement among resource patches” (Bennett 1999, 8). Linkageshave a variety of purposes, including acting as suitable habitat and as areas of flow forboth resources (water, nutrients) and animals. Daily, migratory, dispersal, and rangeextension movements can all be aided by the presence of linkages, making them a use-ful tool for designers.
Linkages can be categorized into three types: (1) habitat corridors, which assistmovement through inhospitable environments via continuous connections; (2) step-ping stones, which are remnant patches that allow species to make short movementsthrough disturbed habitat; and (3) habitat mosaics, which are places where the differ-ent states of vegetation are not well defined and there is a blending along the edges.Corridors are most appropriate for animals that move on the ground and organismsthat cannot move through environments different from their own (e.g., reptiles andamphibians that cannot cross roadways). The different types of habitat corridorsinclude natural corridors (stream valleys), residual linkages (fencerows in agriculturalareas), regenerated corridors (abandoned railways), planted corridors (hedgerows), anddisturbance corridors (transmission lines and roadsides). Stepping stones are mostappropriate for flying organisms, particularly migratory birds. These may be a chain ofnatural patches (wetlands), small remnant patches (areas of unlogged forest within aclear-cut area), or patches that are human in origin (urban parks) (Bennett 1999;Hudson and Defenders of Wildlife 1991; Forman 1995).
Woodland Park Zoo does not provide habitat linkages in part because of its urban

location, but also because of its function as a zoological garden. The Devens stormwa-ter and wetland project could have addressed linkages by coordinating and integrat-ing its plans with the nearby Oxbow National Wildlife Refuge, however linkageswere not a part of the project scope and were not actively addressed in project plan-ning or design. Crosswinds Marsh deliberately restricted hydrological linkages to thesite to avoid invasive fish species from entering the site from downstream areas.Crosswinds has not been involved with a broader scale upland habitat linkage plan inthe project vicinity. The Willamette Alternative Future Project addressed habitatconnectivity through the coupling of the simple habitat types method with thePATCH model for a selected set of species. The Florida Greenways project addressedhabitat connectivity explicitly, as a primary goal of the project, and through multiplesteps in the planning process.
Linkages may have some negative aspects; in some cases, their connectivity maypromote the spread of invasive organisms, diseases, and fire as well as increase breed-ing between subspecies. Also, landscape architects and planners should be careful tojustify the use of linkages with their knowledge of current ecological principles as theyrelate to biodiversity. As Bennett (1999, 127) writes:
Claims such as “wildlife corridor” or “animal movement corridors” should notbe included or accepted in planning strategies unless consideration is given tothe specific biological purpose of the linkage and how its design, dimensionsand management will be directed to meet that goal. The risk of a loose accept-ance of what constitutes a “wildlife corridor” is twofold: it is wasteful of landand resources if the objectives have little chance of being achieved, and it deval-ues the concept and legitimate need for landscape connectivity in conservation.
Groves’s “Four-R Framework” provides an ecologically sound underpinning for asystem of conservation lands. According to this framework, conservation lands shouldbe representative, resilient, redundant, and restorative (Groves 2003, 30). A conserva-tion system should be representative of the diversity within a landscape or region. Tobe sustainable over time, the system must be resilient to human and natural distur-bances. As a buffer from stochastic events, a system should include redundancy. Finally,in highly fragmented landscapes, a conservation system may need to rely on restora-tion to include certain ecosystems.
Another caution is a change in focus from protecting biodiversity to providingmultipurpose space for human activity, such as recreation and scenic appreciation,which could ultimately decrease the amount of protection provided for the speciesusing the linkage(s). Designers and planners should ask such questions as:
• Where are the species—in patch edges or interior habitat?• When are they sensitive to disturbance—seasonally or related to life cycle?• What strategies exist to manage conflicts—segregating activities in space or
in time?
86 | B I O D I V E R S I T Y P L A N N I N G A N D D E S I G N

As long as these ecological considerations are addressed, true multiuse areas of pro-tection can be created. The Trails and Greenways Clearinghouse lists the following rea-sons to create multiuse trails and greenways areas (Rails to Trails Conservancy 2002):
• To preserve and create open spaces• To encourage healthy lifestyles• To increase opportunities for recreation• To increase opportunities for nonmotorized transportation• To strengthen local economies• To protect the environment• To preserve historically and culturally valuable resources.
Indirectly, greenways may further affect biodiversity by improving air quality throughan increase in the use of alternative modes of transportation (biking and walking).
Restoration represents an important opportunity for landscape architects and plan-ners. Conservation biology’s subfield of restoration ecology has grown rapidly in recentyears. Restoration ecology deals with both biodiversity conservation concerns andlandscape issues, indicating a need for well-informed landscape architects and plan-ners. Most scientists agree that it is always better to preserve intact habitats proactive-ly rather than try to restore them. According to authors James MacMahon and KarenHoll in their essay “Ecological Restoration: A Key to Conservation Biology’s Future”(2001), the future of conservation biology essentially rests on restoration techniques.MacMahon and Holl warn: “More land is being altered at an ever-increasing rate in theworld than at any time in the past. This suggests that to ‘conserve’ anything willrequire restoration at some level” (254). The authors identify and present research con-cerning several key themes beneath the umbrella heading of restoration ecology. Theylist recovery processes, species introduction, scale, monitoring, using succession as amodel for addressing restoration issues, and addressing policy as the key issues affect-ing the field. To become actively involved, landscape architects and planners mustfamiliarize themselves with these aspects of landscape ecology.
Although many overlapping activities fall under the category of restoration ecolo-gy—including rehabilitation, reclamation, re-creation, ecological recovery, anddesigner landscapes—all require modification of the landscape on some level. Whetherthrough reestablishing entire floral and faunal assemblages or through creating design-er landscapes comprising unusual combinations of elements intended to provide habi-tat for a target species, the opportunity exists for landscape architecture and planningto figure prominently in biodiversity conservation by working more directly in thefield of restoration ecology.
Currently, reliable information about the effectiveness of various restorationapproaches is lacking. We hope that the projected growth of the field in the upcom-ing decade will produce more high-quality data about successful approaches to restor-ing habitats. This should stimulate a demand for professions involved in designing and manipulating landscapes. Already, several creative methods for funding and
C O N C L U S I O N S A N D D I S C U S S I O N | 87
encouraging the use of restoration techniques have emerged. One such plan is the U.S.Fish and Wildlife Service’s Partners for Fish and Wildlife Program, which offers match-ing funds for private landowners who implement restoration projects on their land.
Although many tools are available to landscape architects and planners address-ing biodiversity in their work, it is important to understand that biodiversity can beviewed on different scales and therefore, as Sheila Peck (1998) notes, that it is impor-tant to also plan for biodiversity at a variety of scales. Generally, diversity is con-strained by attributes of the hierarchical level above it, and it exhibits properties thatcan be described by the level below it. Biological and spatial scales are related butnot necessarily equivalent. For example, levels of biological hierarchy may cover awide range of sizes—the area covered by a population of large mammals (such asbears) dwarfs the area occupied by some insect populations. Biologists recognize theimportance of understanding and planning for biodiversity at alpha, beta, andgamma scales (Groves 2003).
A link exists between spatial and temporal scales inasmuch as large areas experienceslower changes and smaller areas experience more rapid change. Human-dominatedlandscapes, however, often do not follow this space-time correlation. Practitioners needto understand both the context and spatial scale or scales of their work as well as themany timescales their work is likely to influence.
The use of landscape linkages is an example of applying spatial scales (which rangefrom project to landscape to regional levels) to planning and design. At the projectlevel, linkages can be created with hedgerows, streams, or underpasses. At the land-scape level, linkages exist as rivers or floodplain corridors or as broad reserve links.Finally, at the regional level, major rivers and mountain ranges can act as linkages(Bennett 1999).
Landscape architects and planners should specifically address biodiversity at all fourlevels of the biological hierarchy, when appropriate, because each level affects differentaspects of diversity. The landscape scale is important because it is affected by both bio-tic and abiotic factors, ecological processes, and interactions between types of habitatpatches. By focusing on the landscape scale, it is possible to protect a variety of knownand unknown communities. The community scale is important because it allows design-ers and planners to pay more attention to detail, especially the different forms in whichcommunities and ecosystems occur. It is at this scale that important species—such as keystone species, vulnerable or rare, endemic species and specialists—can be protected. Ecological processes are also important at the community scale, especiallydisturbance processes. At the population scale, landscape architecture should strive tomaintain adequate habitat area while taking into account demographic, environmen-tal, and genetic factors. Additionally, patterns such as metapopulation configurationsand the distribution of populations throughout a species range need to be explicitlyunderstood. Finally, landscape architects should acknowledge the genetic scale becausegenetic diversity increases the chances that a population will survive environmentalchanges over time (Peck 1998).
88 | B I O D I V E R S I T Y P L A N N I N G A N D D E S I G N
Landscape architects and planners should be knowledgeable about changes thatoccur in the landscape over both long and short time frames. Long-term changes gen-erally consist of geologic and climatic processes (e.g., soil development, disturbancepatterns), which can be influenced by landscape architects only over the very longterm but that should still be considered because they affect biodiversity. Short-termchanges—such as fluctuations in predator–prey relationships or occurrences of fire—affect the structure and dynamics of communities. These changes can be influencedby human disruptions, which can interrupt fire regimes, modify water or wind pat-terns, and introduce diseases, pollution, and fragmentation. Landscape architects andplanners should be aware of the effects of human disturbance and learn to employstrategies that provide extra protection to the biodiversity of communities and pop-ulations (Peck 1998).
Biodiversity not only represents an important opportunity for planning and designprofessionals but also presents great ethical and technical challenges. A professionalcrosses an ethical line when skills are used to help construct projects in rare or threat-ened ecosystems or habitats. We agree that our professional societies and associationsshould adopt more explicit ethical rules to guide professional practice. Professionalsneed to appreciate the differences among mitigation, restoration, replication, and habi-tat creation, and they need to practice accordingly, guided by an ethic based on sus-tainability and stewardship—to learn when to “just say no” to habitat destruction inthe name of mitigation.
Design and planning professionals should rise to new challenges: (1) to collaborateas equal partners with scientists not only to solve biodiversity challenges in projectsbut to contribute to policy that can influence broad regions; (2) to add critical project-based data to the knowledge base through systematic monitoring and evaluation; and(3) to turn the tide on biodiversity decline, one project and one plan at a time.
C O N C L U S I O N S A N D D I S C U S S I O N | 89


L A F A C K N O W L E D G M E N T S
Support for the Land and Community Design Case Study Series is provided by the JJR
Research Fund, which supports applied research that explores the complex interrelation-
ship of social, physical, economic and environmental forces that comprise sustainable
design and development; the CLASS Fund Ralph Hudson Environmental Fellowship,
which supports research in landscape change, preservation and stewardship, and the con-
nection between people and landscapes; and the AILA Yamagami Hope Fellowship.
The American Society of Landscape Architects, whose mission is “to lead, to educate,
and to participate in the careful stewardship, wise planning, and artful design of our
cultural and natural environments,” is a leading contributor, providing ongoing generous
support to LAF and its programs.
Major support for Landscape Architecture Foundation is provided by Landscape Forms;
Landscape Architect and Specifier News; Design Workshop; EDAW; HNTB Corporation; The
HOK Planning Group; L. M. Scofield Company; Landscape Structures; ONA; and
Peridian International.
Lead donors include Burton Landscape Architecture Studio; The Eastlake Company;
EDSA; NUVIS; Peter Walker & Partners; Scott Byron and Company; the SWA Group;
ah’be landscape architects; Robert F. Bristol, FASLA; Carol R. Johnson Associates; Gentile,
Holloway, O’Mahoney & Associates; Graham Landscape Architecture; Hughes, Good,
O’Leary & Ryan; Reed Hilderbrand Associates; and Ten Eyck Landscape Architects.
The list of additional donors who provide generous and sustained funding is too
lengthy to include, but their support is valued and essential to Landscape Architecture
Foundation’s programs.


Bioclimatic zones: world habitats that are defined by climate and vegetation. TheHoldridge system, the basis for the bioclimatic zone presentation theme at the WoodlandPark Zoo, classifies zones based on three parameters: temperature, precipitation, and evapo-transpiration. These three parameters can be visualized as the three vertices of a triangle; aparticular life zone is determined by its position in this triangle. One climax community typically exists within each life zone. Examples include tropical forest, savanna, temperatedeciduous forest, and taiga.
Biodiversity: the totality—over time—of genes, species, and ecosystems, including theecosystem structure and function that support and sustain life.
Bioengineering: an approach to stream bank and slope stabilization using native speciesplanted in rolls and mats to produce rapid establishment and soil stabilization.
Biological hierarchy—levels of biodiversity scales: landscape, community, population,and genetic. These scales represent a range based on area, but also imply more complexity,including ecosystems and people, at the broader landscape and community scales.
Charismatic species: target species that are aesthetically appealing and likely to generatepopular interest and support for conservation. Such species include butterflies (Lepidopteraspp.), gray wolves (Canis lupis), giant pandas (Ailuropoda melanoleuca), and orchids (familyOrchidae).
Coarse filter approach: an approach that focuses on the patterns of larger areas, where the differences between map size and actual size is substantial (see Forman 1995). Thisapproach generally uses habitat associations based on knowledge of species’ habitat needs and preferences and remotely sensed vegetation data classified into communities. An exampleis GAP analysis.
Connectivity: the level of actual, or functional, connectivity in a landscape to support specieshabitat and movement. A high degree of connectivity helps both resources (water and nutri-ents) and animals move through a landscape.
Cultural resonance: a zoo design concept that builds on landscape immersion to show zoovisitors how animals and humans interact. Presenting zoo visitors with integrated examplesof human and animal cultures reveals the human–natural world relationship.
G L O S S A R Y

Decision support model: a geographic information systems model based on raster dataanalysis. An example is that used by the University of Florida to delineate a physical plan forthe Florida Statewide Greenway System (see University of Florida 1999).
Ecological community: an assemblage of species that exist together in the same areas andwhose life processes are potentially interrelated.
Economically valuable species: those target species that are needed by local consumers orthat hold value in the commercial marketplace. An example is the caribou (Rangifer tarandus),which is used by native hunters for food and clothing.
Ecoregion: a broad region of land or water that includes a distinctive assemblage of natural communities containing many of the same ecological processes and species, existingunder similar environmental conditions, and depending on ecological interactions for long-term survival.
Ecosystem diversity: includes the number of species in a particular location, the ecologicalfunctions of the species, the variation in species composition within a region, the associationsof species in particular areas, and the processes within and among the ecosystems. It alsoextends to the landscape and biome level.
Edge species: species that thrive along the perimeter of habitat patches, where two differentlandscape types abut. These species tend to be generalists.
EPT monitoring: systematic observations of the richness and referenced condition of inverte-brate species of the orders Ephemeroptera (mayfly), Plecoptera (stonefly), and Trichoptera(caddisfly) in a given water body. It is a tool used to monitor the aquatic conditions instreams and rivers.
Endangered species: as defined by the Endangered Species Act of 1973, a species “in dangerof extinction within the foreseeable future throughout all or a significant portion of its range”(U.S. Fish and Wildlife Service1988). Together with threatened species, endangered speciescomprise what are commonly referred to as federally listed species.
Endemic species: those species found only in a single location in the world.
Federally listed species: both endangered species and threatened species as listed under theEndangered Species Act of 1973.
Fine filter approach: an approach focusing on a smaller area that contains greater detailthan a larger area (see Forman 1995). The term also refers to an approach of biodiversityassessment and planning focused on endangered species in which the specific habitat locationsare known and mapped. It is often used in combination with the coarse filter approach.
Fish index of biotic integrity: an index of overall integrity of fish in a given water body ascompared with historic, reference levels. It is a tool used to measure the aquatic conditions instreams and rivers.
Flagship species: those target species that are popular and charismatic. They attract popularsupport for conservation and often help to spearhead a conservation effort in a particular land-scape. Vertebrate species, such as the spotted owl (Strix occidentalis) in the Pacific Northwestor the Florida panther (Puma concolor coryi), are often considered flagship species.
Floristic quality index (FQI): a composite index used to aid quantitative comparisons, or
94 | B I O D I V E R S I T Y P L A N N I N G A N D D E S I G N

rankings, of plant communities among different sites associated with restoration, manage-ment, or long-term monitoring. The FQI is based on a species list with coefficients of conser-vatism (C) ranging from 0 to 10 assigned for plant species by local or regional experts. C val-ues of 0 or 1 are given to species adapted to severe disturbance, 2 or 3 for degraded but morestable communities, 4 to 6 for commonly occurring matrix species, 7 or 8 for moderatelydegraded natural areas, and 9 or 10 for high-quality natural areas.
Focal species: those species whose requirements for persistence include attributes that mustbe present for a landscape to meet the needs of most of the species in the given area. This isessentially an extension of the umbrella species concept. When dealing with multispeciesmanagement, biologists group species according to threats and then select the most sensitivespecies for each threat to act as the focal species. This species then determines maximumacceptable levels of threat. An example is the hooded robin (Melanodryas cucullata) inAustralia, which is sensitive to forest fragmentation.
Fragmentation: the breaking up of a habitat, ecosystem, or land use type into smallerparcels, or habitat patches.
GAP analysis: an approach (the National Gap Analysis Program, or GAP), conducted by theBiological Resource Division of the U.S. Geological Survey, used to identify how well nativeanimal species and natural communities are represented in lands that are currently conserved.Gaps are areas where species or communities, or both, are not adequately represented.Focusing on more “ordinary” species, it is essentially an offshoot of the hotspot approach; inthis case, both ecological processes and species distribution are examined to determine whichareas should receive protection before they become vulnerable. Vegetation is mapped usingsatellite images, and potential, or expected distributions of native animal species are mappedusing museum or agency specimen collection records, known general ranges, and affiliationswith the mapped vegetation. The resulting geographic information system maps are thenoverlaid with maps of land management areas in order to focus conservation efforts. Gapanalysis is a coarse filter approach to biodiversity assessment and planning.
Generalists: species that can survive in a variety of habitat types and often on a variety offood sources. In contrast to specialist species, they tend to fare well in fragmented landscapeswith a high ratio of edge habitat.
Genetic diversity: the variation of genes within species, including separate populations ofthe same species or genetic disparity within populations.
Greenway: as defined by the Florida Statewide Greenways Project, “a corridor of protectedopen space that is managed for conservation and/or recreation.” Such corridors cross a variety oflandscapes (rural to urban), are generally linear in shape, and have a many other diverse char-acteristics (public versus privately owned, wide versus narrow, green versus blue). Most impor-tantly, greenways emphasize connectivity. (See Ahern 2002 and University of Florida 1999.)
Habitat corridor: a landscape linkage that assists movement through inhospitable environ-ments using continuous connections. A habitat corridor is most appropriate for nonflying terrestrial species or species that have difficulty crossing heterogeneous landscapes. The manydifferent types of habitat corridors include natural corridors, residual linkages, regeneratedcorridors, planted corridors, and disturbance corridors.
G L O S S A R Y | 95
Habitat mosaic: a place where the different states of vegetation are not well defined and ablending occurs along the edges.
Hierarchy theory: a theory that stresses the importance of examining the landscape as a system of interconnected elements that can be viewed on a variety of scales to understandprocesses and trends at any one scale. Each element functions as a unit. Larger scales providestability, while smaller scales provide variation.
Hotspot: an area in the landscape that supports an especially high degree of biodiversity. Anexample of a hot spot would be patches of tropical rain forest with high biodiversity.
Indicator species: species used to signal changes in the health of a given ecosystem and ofother species within that system. Indicators may be positive, in that they are expected to cor-relate positively with ecological integrity or biodiversity, or negative, in that their presenceindicates degrading ecosystem health. Indicators are used as part of a proactive strategy toanticipate problems before they occur.
Island biogeography theory: a theory developed by Robert MacArthur and Edward Wilson(1967) to explain the size effect of patches on biodiversity. The theory is derived from obser-vations of populations on small oceanic islands. Following the formation of an island, a periodof colonizations and extinctions ensues until equilibrium of species diversity is reached.Island area, isolation, and age are the major limits on colonization and extinction. Islandbiography theory has been extrapolated to understand the dynamics of terrestrial landscapeswith habitat patches that may be fragmented or isolated into a spatial pattern analogous tosome oceanic islands.
Keystone species: those species whose impact on ecosystems is disproportionately large rela-tive to their abundance. They often function in close association with landscape processes anddisturbances. One example is the beaver (Castor canadensis), whose engineering effects on thelandscape are integral to shaping ecosystems.
Landscape immersion: the illusion for zoo visitors that no barriers exist between themselvesand the animals. This impression is accomplished by bringing the exhibit plantings out intothe human viewing areas, thereby extending the character of the life zone; by strategicallycontrolling viewpoints so that the animals appear to be in a large, natural environment; andby concealing barriers as much as possible. Landscape immersion makes Woodland Park Zoo,for example, different from other conventional zoos that rely on obvious barriers to separatethe captured animals from zoo visitors. This technique creates a sense of empathy to see ananimal in its “natural” environment rather than behind a high fence or concrete wall.
Linkage: an element of the landscape that provides connectivity between large habitat patch-es. Several types of linkages exist, including habitat corridors, stepping stone habitats, andmosaic habitats. They can have both positive and negative effects. Positive effects includeincreasing the mobility of organisms that might not be able to cross unfamiliar habitat andproviding an area of unimpeded flow for water. Negative effects include the spread of disease,insects, or fire. Linkages may also act as trails for human use.
Metapopulation theory: a theory first proposed by Richard Levins in 1970. Metapopulationsare populations of a species that reside in many relatively small and spatially isolated patchesof habitat that at times suffer local extinctions only to be replenished by populations in other
96 | B I O D I V E R S I T Y P L A N N I N G A N D D E S I G N

patches. Alone, these populations would be highly susceptible to permanent extinction, buttaken together, they constitute viable populations, capable of withstanding and recoveringfrom local extinctions over time.
Mosaic: a collection of landscape patches, corridors, and matrix that together form a hetero-geneous pattern (Forman 1995).
Nature Conservancy conservation status rank: a conservation status ranking system devel-oped by the Nature Conservancy and the Natural Heritage Network. It functions on a 1 to 5scale, with species in categories GX to G3 considered at risk.
• GX—presumed extinct• GH—possibly extinct• G1—critically imperiled (five or fewer occurrences or fewer than one thousand
individuals)• G2—imperiled (between six and twenty occurrences or between one and three
thousand individuals)• G3—vulnerable (twenty-one to one hundred occurrences or between three and ten
thousand individuals)• G4—apparently secure (some cause for long-term concern; more than one hundred
occurrences or more than ten thousand individuals)• G5—secure (widespread and abundant)
Patch: a nonlinear landscape area that is fairly homogeneous and is distinct from the sur-rounding landscape (Forman 1995).
PATCH model (Program to Assist in Tracking Critical Habitat): a biological modeling toolthat incorporates the effects of habitat quality, quantity, and pattern on species life historyparameters, such as survival rates, fecundity, and migration. The PATCH model diagramswhere wildlife species should occur and at what densities they can be expected to viably exist.PATCH highlights landscape connectivity implications for wildlife.
Proactive strategies: conservation and assessment efforts undertaken before a problem arisesor before a problem is beyond mitigation. An example is the National Gap Analysis Program.
Reactive strategies: conservation and assessment efforts undertaken after a problem or issuehas been identified. These are strategies of preserving biodiversity that focus on preservingspecific endangered species or that try to restore degraded or lost habitat. The endangeredspecies approach is an example.
Restoration ecology: the reestablishment or rehabilitation of entire floral and faunal assem-blages and their supporting physical infrastructure, including landform and hydrology.
Species richness: the number of species in a given area.
Species area theory: a theory (offered by MacArthur and Wilson in 1967) predicting that a90 percent reduction in habitat area results in a loss of half of the total species in that area.
Species at risk: those species categorized under The Nature Conservancy conservation statusranking system as GX (presumed extinct), GH (possibly extinct), G1 (critically imperiled),G2 (imperiled), or G3 (vulnerable).
Species diversity: the variety of species within a region. Species diversity can be measured in
G L O S S A R Y | 97

many ways; however, the number of species in an area—species richness—is often used.Species diversity is also thought of in terms of “taxonomic diversity,” which considers therelationship of one species to another.
Species guild: a group of target species that use a particular resource in similar ways. Oneexample is all the bird species that make their nests in holes in tree trunks—e.g., cavity nest-ing species, such as the American kestrel (Falco sparverius), barred owl (Strix varia), hairywoodpecker (Picoides villosus), and Eastern bluebird (Sialia sialis), among others.
Stakeholders: the people who have a concern in a particular decision, either as individuals oras members or representatives of a group. Stakeholders include people who influence a deci-sion, such as government officials, as well as those affected by the decision, such as citizensliving in a particular area involved in the issue or action being considered.
Stepping stone habitat: a type of landscape linkage made up of remnant patches that allowspecies to make short movements through disturbed habitat. This type of habitat is mostappropriate for birds and other organisms that fly.
Target species: indicator species that are chosen as targets for conservation priorities. Theseare often chosen more for their value in conservation politics than for their validity as truebiological indicators.
Threatened species: a principal status category under the Endangered Species Act of 1973,threatened species are defined as “those animals and plants likely to become endangered within the foreseeable future throughout all or a significant potion of their ranges” (U.S. Fish and Wildlife Service 1988). Together with endangered species, they comprise “federallylisted” species.
Umbrella species: target species that require large areas of habitat to maintain viable popu-lations. Protecting these species’ habitat protects the habitat and populations of numerousother species within the range, like an umbrella. Because they tend to function as coarse filters, focusing on these species is an efficient means of meeting the needs of many specieswithout having to monitor every individual species. Examples include the grizzly bear (Ursusarctos) and the American bison (Bison bison).
Urban growth boundaries (UGB): a zone around a city. Development is allowed inside theline, whereas only very limited development is allowed outside the line. Most UGBs areupdated periodically to accommodate growth pressures.
Vulnerable species: species that are in danger of going extinct. When the U.S. governmentrecognizes a species’ vulnerability because of its advanced state, that species is considered tobe threatened or endangered. An example is the bald eagle (Haliaeetus leucocephalus).
98 | B I O D I V E R S I T Y P L A N N I N G A N D D E S I G N

Ahern, J. 1995. Greenways as a planning strategy. Landscape and Urban Planning 33 (1–3): 131–55.
——— 2002. Greenways as Strategic Landscape Planning: Theory and Application. WagenrugenUniversity, Netherlands.
All Taxa Biodiversity Inventory. 2002. The role of ATBI’s in the global biodiversity crisis: Notesfrom the Great Smokies. http://www.discoverlifeinamerica.org/atbi/ (accessed July 18, 2006).
American Planning Association. 1992. Ethical principles in planning.http://www.planning.org/ethics/ethics.html (accessed July 18, 2006).
American Society of Landscape Architects. 2000. ASLA code of environmental ethics.http://www.asla.org/about/codeenv.htm (accessed July 18, 2006).
Arendt, R. 1999. Growing greener: Putting conservation into local plans and ordinances. Washington,DC: Island Press.
Askins, R. A. 2002. Restoring North America’s birds: Lessons from landscape ecology. New Haven, CT:Yale University Press.
Baker, J. (ecologist, U.S. Environmental Protection Agency). 2002. Interview by Jack Ahern.January 10. Corvallis, OR.
Baker, J. P., D. W. Hulse, S. V. Gregory, D. White, J. Van Sickle, P. A. Berger, D. Dole, and N.Schumaker. 2004. Alternative futures for the Willamette River Basin, Oregon. EcologicalApplications 14 (2): 313–24.
Baker, J. P., and D. H. Landers. 2004. Invited feature introduction. Ecological Applications 14 (2):311–12.
Barrent, K. R. 1997. Introduction to ecological engineering for water resources: The benefits ofcollaborating with nature. Paper presented at the annual conference of the New England WaterEnvironment Association.
Bastasch, R., S. Gregory, and S. Vickerman. 2002. Interview by Jack Ahern. January 10. Corvallis,OR.
Bauer, D. (wetland manager, Wayne County Parks, Crosswinds Marsh). 2001. Interview by JackAhern. December 20. New Boston, MI.
Beatley, T. 1994. Habitat conservation planning: Endangered species and urban growth. Austin:University of Texas Press.
Benfield, F. K., M. D. Raimi, and D.D.T. Chen. 1999. Once there were greenfields: How urban sprawl is undermining America’s environment, economy, and social fabric. New York: Natural ResourcesDefense Council.
B I B L I O G R A P H Y
Bennett, A. F. 1999. Linkages in the landscape: The role of corridors and connectivity in wildlifeconservation. Gland, Switzerland: IUCN–The World Conservation Union.
Berlein, J. 2002. Interview by Jack Ahern. January 8. Woodland Park Zoo, Seattle.
Bioengineering Group/W. Goldsmith. 2002. Interview by Jack Ahern, Elizabeth Leduc, and MaryLee York. January 15. Carol R. Johnson and Associates, Boston, MA.
Boyd, J., and L. Wainger. 2002. Measuring ecosystem service benefits for wetland mitigation.National Wetlands Newsletter (Environmental Law Institute) (November–December): 1, 11–15.
Bridgeman, J. 2002. Interview by Jack Ahern. January 8. Jones & Jones, Seattle.
Brown, K. S., Jr., and G. G. Brown. 1992. Habitat alteration and species loss in Brazilian forests.In Tropical deforestation and species extinction, ed. T. C. Whitmore and J. A. Sayer, 119–42.London: Chapman and Hall.
Carol R. Johnson Associates—R. Sorenson, J. Amodeo, and C. Cogswell. 2002. Interview by JackAhern, Elizabeth Leduc, and Mary Lee York. January 15. Carol R. Johnson and Associates,Boston, MA, and Devens Federal Prison site, Devens, MA.
Carol R. Johnson Ecological Services. 1995. Application for a programmatic general permit FederalMedical Center Complex, Fort Devens, Massachusetts and application for water qualitycertificate Federal Medical Center Complex, Fort Devens, Massachusetts. Boston, MA: U.S.Department of Justice, Federal Bureau of Prisons.
Carr, M. H. 2002. Telephone interview by Jack Ahern, Elizabeth Leduc, and Mary Lee York.January 17. University of Massachusetts, Amherst.
Clay, G., ed. 1980. Woodland Park Zoological Gardens: President’s Award of Excellence. LandscapeArchitecture, September.
Conservation International. 2002. Conservation strategies: Hotspots.http://www.conservation.org/xp/CIWEB/home# (accessed July 18, 2006).
Cox, J. and R. Kautz. 1994. Closing the Gap. Tallahassee, FL: U.S. Fish and Wildlife Service.
Croonquist, M. J., and R. P. Brooks. 1991. Use of avian and mammalian guilds as indicators ofcumulative impacts in riparian wetland areas. Environmental Management 15 (5): 701–14.
Dahl, T. E. 2000. National Wetlands Inventory. St. Petersburg, FL: U.S. Fish and Wildlife Service.
Dennison, D. L. 2000. Crosswinds Marsh wetland mitigation. Land and Water(November/December): 23–27.
———(vice president, SmithGroup JJR). 2001. Interview by Jack Ahern. December 19.SmithGroup JJR, Ann Arbor, MI.
Devens Enterprise Commission Regulatory Authority. 1999. Wetlands Protection.http://unixweb.choiceone.net/d/e/devensec.com/cgi-bin/showz.cgi/l/decregs406.html (accessedJuly 18, 2006).
Dinerstein, E., G. Powell, D. Olson, E. Wikramanayake, R. Abell, C. Loucks, E. Underwood, et al.2000. A workbook for conducting biological assessments and developing biodiversity visions for ecoregion-based conservation. Part I: Terrestrial ecoregions. Washington, DC: Conservation Science Program,World Wildlife Fund–USA.
Drake, J. A., H. A. Mooney, F. di Castri, R. H. Groves, F. J. Kruger, M. Rejmanek, and M.Williamson, eds. 1989. Biological invasions: A global perspective. New York: John Wiley and Sons.
Ehrlich, P. R. 1988. The loss of diversity: Causes and consequences. In Biodiversity, ed. E. O.Wilson and F. M. Peter, 3–18. Washington, DC: National Academy Press.
Ehrlich, P. R., and E. O. Wilson. 1991. Biodiversity studies: Science and policy. Science253:758–62.
Environmental Defense and the Texas Center for Policy Studies. 2003. Texas environmentalprofiles—Wetlands: Essential habitats. http://www.texasep.org/html/wld/wld_swet.html(accessed July 18, 2006).
100 | B I O D I V E R S I T Y P L A N N I N G A N D D E S I G N
Erwin, T. L. 1982. Tropical rainforests: Their richness in Coleoptera and other arthropod species.Coleoptera Bulletin 36:74–75.
Evanoff, P. (project landscape architect, SmithGroup JJR). 2001. Interview by Jack Ahern.December 19 and 20. SmithGroup JJR, Ann Arbor, MI.
Feinsinger, P. 2001. Designing field studies for biodiversity conservation. Washington, DC: Island Press.
Fleishman, E., D. Murphy, and P. F. Brussard. 2000. A new method for selection of umbrellaspecies for conservation planning. Ecological Applications 10 (2): 569–79.
Flink, C., R. Searns, and L. Schwartz. 1993. Greenways: A guide to planning, design, and development.Washington, DC: Island Press.
Florida Department of Environmental Protection and Florida Greenways Coordinating Council(FDEP & FGCC). 1998. Connecting Florida’s communities with greenways and trails: The 5-yearimplementation plan for the Florida Greenways and Trail System. Tallahassee: Florida Department of Environmental Protection.
Forman, R.T.T. 1995. Land mosaics: The ecology of landscapes and regions. Cambridge: CambridgeUniversity Press.
Forman, R.T.T., D. Speirling, J. A. Bissonette, A. P. Clevenger, C. D. Cutshall, V. H. Dale, L.Fahrig, R. France, C.R. Goldman, K. Heaure, J.A. Janes, F.J. Swanson, T. Turentine, and T.C.Winter. 2003. Road ecology: Science and solutions. Washington, DC: Island Press.
Francis, M. 2001. A case study method for landscape architecture. Landscape Journal 20 (1): 15–29.
———. 2003a. Urban open space: Designing for user needs. Land and Community Design Case StudySeries. Washington, DC: Island Press and Landscape Architecture Foundation.
———. 2003b. Village Homes: A community by design. Land and Community Design Case StudySeries. Washington, DC: Island Press and Landscape Architecture Foundation.
Freudenberger, D. 1999. Guidelines for enhancing grassy woodlands for the Vegetation Investment Project.Canberra, Australia: Commonwealth Scientific and Industrial Research Organisation (CSIRO)Wildlife and Ecology.
Gibbs, W. W. 2001. On the termination of species. Scientific American 285:40–49.
Goldsmith, W., and K. R. Barrett. 1998. Bioengineered system in existing stream channel. Paper presented at the American Society of Civil Engineers Wetlands Engineering and RiverRestoration conference, March 22–27, Denver.
Groves, C. R. 2003. Drafting a conservation blueprint: A practitioner’s guide to planning for biodiversity.Washington, DC: Island Press.
Groves, C. R., L. S. Kutner, D. M. Stoms, M. P. Murray, J. M. Scott, M. Schafale, A. S. Weakley,and R. L. Pressey. 2000. Owning up to our responsibilities: Who owns lands important forbiodiversity? In Precious heritage: The status of biodiversity in the United States, ed. B. A. Stein, L. S. Kutner, and J. S. Adams, 275–300. Oxford: Oxford University Press.
Hammond, P. M. 1995. The current magnitude of biodiversity. In Global biodiversity assessment, ed.V. H. Heywood and R. T. Watson, 113–38. Cambridge: Cambridge University Press for UnitedNations Environment Programme.
Hancocks, D. 2001. A different nature: The paradoxical world of zoos and their uncertain future.Berkeley: University of California Press.
Herman, K. D., L. A. Master, M. R. Penskar, A. A. Reznicek, G. G. Wilhelm, and W. Brodowicz.1996. Floristic quality assessment with wetland categories and computer application programs for the stateof Michigan. Lansing: Michigan Department of Natural Resources, Wildlife Division, NationalHeritage Program.
Heywood, V. H., G. M. Mace, R. M. May, and S. N. Stuart. 1994. Uncertainties about extinctionrates. Nature 368:105.
B I B L I O G R A P H Y | 101
Heywood, V. H., and R. T. Watson. eds. 1995. Global biodiversity assessment. Cambridge: CambridgeUniversity Press for the United Nations Environment Programme.
Hilty, J. A., and A. Merenlender. 2000. Faunal indicator taxa selection for monitoring ecosystemhealth. Biological Conservation 92:185–97.
Hoctor, T. S. 2002. Telephone interview by Jack Ahern, Elizabeth Leduc, and Mary Lee York.January 17, University of Massachusetts, Amherst.
Hoctor, T. S, M. H. Carr, and P. D. Zwick. 2000. Identifying a linked reserve system using a regionallandscape approach: The Florida Ecological Network. Conservation Biology 14 (4): 984–1000.
Hoctor, T. S., M. H. Carr, P. D. Zwick, and D. S. Maehr. 2004. Florida Statewide GreenwaysSystem Planning Project: its realization and political context. In Ecological networks andgreenways, ed. R. Jongman and G. Pungetti, 222–50. Cambridge: Cambridge University Press.
Hoctor, T. S., J. Teisinger, M. Carr, and P. Zwick. 2001. Ecological Greenways Network prioritizationfor the State of Florida. Tallahassee, FL: Office of Greenways and Trails.
Hudson, W. E., and Defenders of Wildlife. 1991. Landscape linkages and biodiversity. Washington,DC: Island Press.
Hulse, D. 2000. Land conversion and the production of wealth. Ecological Applications 10 (3):679–82.
———. 2002. Interview by Jack Ahern. January 11. Eugene and Corvallis, OR.
Hulse, D., J. Eilers, K. Freemark, C. Hummon, and D. White. 2000. Planning alternative futurelandscapes in Oregon: Evaluating effects on water quality and biodiversity. Landscape Journal 19(1–2): 1–19.
Hulse, D., S. Gregory, and J. Baker, eds. 2002. Willamette River Planning Basin atlas: Trajectories ofenvironmental and ecological change. 2nd ed. Corvallis: Oregon State University Press.
Hulse, D. W., A. Branscomb, and S. G. Payne. 2004. Envisioning alternatives: Using citizenguidance to map future land and water use. Ecological Applications 14 (2): 325–41.
Hypner, J. (vice president, Barton Malow Construction Services, Detroit). 2001. Interview by JackAhern. December 19. Detroit Metropolitan Airport, Detroit, MI.
Jennings, M. D. 2000. Gap analysis: Concepts, methods and recent results. Landscape Ecology15:5–20.
Johnson Johnson & Roy/Inc. 1991. Detroit Metropolitan Wayne County Airport Wetland MitigationPlan. Ann Arbor, MI: Johnson Johnson & Roy/Inc.
———. 1999. 1998 Wetland Mitigation Monitoring Report: Detroit Metropolitan Wayne County Airport.Ann Arbor, MI: Johnson Johnson & Roy/Inc.
Jones, G. 1982. Design principles for preservation of animals and nature. In the proceedings of theAmerican Association of Zoological Parks and Aquariums 1982 annual conference, Phoenix.
———. 1989. Beyond landscape immersion to cultural resonance: In the Thai elephant forest atWoodland Park Zoo. In the proceedings of the American Association of Zoological Parks andAquariums 1989 annual conference, Pittsburgh.
———. 2002. Interview by Jack Ahern. January 7. Jones & Jones, Seattle.
Jones, J. P. 2002. Interview by Jack Ahern. January 8. Jones & Jones, Seattle.
Jones & Jones. 1976. Woodland Park Zoo: Long range plan, development guidelines, and exhibit scenarios.Seattle: Department of Parks and Recreation.
Keystone Center. 1991. Final consensus report of the Keystone Policy Dialogue on BiologicalDiversity on Federal Lands 1991. http://ceres.ca.gov/ceres/calweb/biodiversity/def_KC.html(accessed July 18, 2006).
Kittredge, A. M., and T. F. O’Shea. 1999. Forestry practices on wildlife management areas.Massachusetts Wildlife 49:33–38.
102 | B I O D I V E R S I T Y P L A N N I N G A N D D E S I G N
Kitzhaber, J. 2000. Analysis: How Portland, Oregon, utilizes urban environmentalism to helpmake the city more livable. Interview by J. Williams. July 27. Live broadcast, Talk of the Nation,National Public Radio.
Lambeck, R. J. 1997. Focal species: A multi-species umbrella for nature conservation. ConservationBiology 11 (4): 849–56.
Landres, P. B. 1983. Use of the guild concept in environmental impact assessment. EnvironmentalManagement 7:393–98.
Landre, P. B., Verner J., J.W. Thomas. Ecological Uses of Vertebrate Indicator Species: A Critique.Conservation Biology. 1988. (2) 1-13.
Lawrence Halprin and Associates. 1972. The Willamette Valley: Choices for the future. ExecutiveDepartment, State of Oregon. Available at: http://willametteexplorersinfo/publication/ (accessed August 28, 2006).
Lecesse, M. 1996. Little marsh on the prairie. Landscape Architecture 86 (7): 50, 52–55.
Leopold, A. 1949. A Sand County almanac and sketches here and there. New York: Oxford UniversityPress.
Levins, R. 1970. Extinction: Some mathematical questions in biology. Vol. 2. Providence, RI: AmericanMathematical Society.
Little, C. 1995. Greenways for America. Baltimore, MD: Johns Hopkins University Press.
Lomborg, Bjørn. 2001. The Skeptical Environmentalist: Measuring the Real State of the World.Cambridge: Cambridge University Press.
Lovejoy, T. E. 1980. A projection of species extinctions. In Council on Environmental Quality (CEQ):The Global 2000 Report to the President, vol. 2, 328–31. Washington, DC: U.S. GovernmentPrinting Office.
Mac, M. J., P. A. Opler, C.E.P. Haecker, and P. D. Doran. 1998. Status and trends of the nation’sbiological resources. 2 vols. Reston, VA: U.S. Department of the Interior, U.S. Geological Survey.
MacArthur, R. H., and E. O. Wilson. 1967. The theory of island biogeography. Princeton, NJ:Princeton University Press.
MacMahon, J. A., and K. D. Holl. 2001. Ecological restoration: A key to conservation biology’sfuture. In Research priorities in conservation biology, ed. M. E. Soulé and G. Orians, 245–69.Washington, DC: Island Press.
Mandala Collaborative/Wallace McHarg Roberts and Todd (WMRT). 1975. Pardisan. Philadelphia:WMRT.
Martin, F. E. 2000. Where the runway ends: Crosswinds Marsh heals the land while raisingenvironmental awareness. Landscape Architecture 90 (7): 26–31, 82–83.
Massachusetts Executive Office of Environmental Affairs, Division of Fisheries and WildlifeNatural Heritage and Endangered Species Program. 2001. BioMap: Guiding land conservation forbiodiversity in Massachusetts. Boston: Executive Office of Environmental Affairs.
Massachusetts Nature Heritage and Endangered Species Program. 1994. Atlas of Estimated Habitatsof State-listed Rare Wetlands Wildlife. Massachusettes Division of Fisheries and Wildlife, Boston.
Master, L. L., B. A. Stein, L. S. Kutner, and G. A. Hammerson. 2000. Vanishing assets:Conservation status of U.S. species. In Precious heritage: The status of biodiversity in the UnitedStates, ed. B. A. Stein, L. S. Kutner, and J. S. Adams. Oxford: Oxford University Press.
Mawdsley, N. A., and N. E. Stork. 1995. Species extinctions in insects: Ecological andbiogeographical considerations. In Insects in a changing environment, ed. R. Harrington and N. E.Stork, 322–69. London: Academic Press.
May, R. M. 1988. How many species are there on Earth? Science 241:1441–49.
McHarg, I. L. 1996. Quest for life. New York: John Wiley.
B I B L I O G R A P H Y | 103
McPeek, M. A., and T. E. Miller. 1996. Evolutionary biology and community ecology. Ecology77:1319–20.
Michigan Department of Natural Resources. 1991. Permit 90-14-1320. Issued to Wayne CountyDivision of Airports. August 8.
Miller, K. R., J. Fortado, C. De Klemm, J. A. McNeely, N. Myers, M. E. Soulé, and M. C. Trexler.1985. Issues on the preservation of biological diversity. In The global possible, ed. R. Repetto,337–62. New Haven, CT: Yale University Press.
National Biological Information Infrastructure (NBII). 2003. Biodiversity definitions.http://www.nbii.gov/issues/biodiversity (accessed September 6, 2004).
Noss, R. F. 1991. Indicators for monitoring biodiversity: A hierarchical approach. ConservationBiology 4 (4): 355–64.
Noss, R. F., and A. Y. Cooperrider. 1994. Saving nature’s legacy: Protecting and restoring biodiversity.Washington, DC: Island Press.
Organisation for Economic Co-operation and Development (OECD). 2002. Handbook of biodiversityvaluation: A guide for policymakers. Paris: OECD.
Ott, S. A. (vice president, SmithGroup JJR). 2001. Interview by Jack Ahern. December 19 and 20.SmithGroup JJR, Ann Arbor, MI.
Owens-Viani, L. 2002. Ripple effect. Landscape Architecture 92 (8): 88–89.
Pacific Northwest Ecosystem Management Consortium [ now called the Pacific NorthwestEcosystem Research Consortium]. 2002. Home page. http://www.orst.edu/dept/pnw-erc/(accessed July 18, 2006).
Paulson, D. R. 2002. Interview by Jack Ahern. January 9. Slater Museum of Natural History,Tacoma, WA.
———. N.d. Woodland Park Zoo ecologist’s report: World bioclimatic zones. Seattle.
Peck, S. 1998. Planning for biodiversity: Issues and examples. Washington, DC: Island Press.
Pollock, M. M., R. J. Naiman, and T. A. Hanley. 1998. Plant species richness in riparian wetlands:A test of biodiversity theory. Ecology 79 (1): 94–105.
Power, M. E., D. Tilman, J. A. Estes, B. A. Menge, W. J. Bond, L. I. Millis, G. Daily, J. C. Castilla,J. Lubchenco, and R. T. Paine. 1996. Challenges in the quest for keystones. Bioscience 46:609–20.
Pryor, T. (manager, Oxbow National Wildlife Refuge). 2002. Telephone interview by Mary LeeYork. January 14. University of Massachusetts, Amherst.
Rails to Trails Conservancy. 2002. Trails and Greenways Clearinghouse.http://www.trailsandgreenways.org/ (accessed July 18, 2006).
RAMSAR. 2003. The Ramsar Convention on Wetlands: Wetlands and Biodiversity. Available from World Wide Web: http://www.ramsar.org/about/about_biodiversity.htm (accessed July 18, 2006).
Raven, P. H. 1988. Our diminishing tropical forests. In Biodiversity, ed. E. O. Wilson and F. M.Peter, 119–22. Washington, DC: National Academy Press.
Risser, P. 2002. Interview by Jack Ahern. January 11, 2002. Corvallis, OR.
Schneider, K. 2003. The Paris–Lexington road: Community-based planning and context sensitive highwaydesign. Land and Community Design Case Study Series. Washington, DC: Island Press andLandscape Architecture Foundation.
Schrader-Frechette, K. S., and E. D. McCoy. 1993. Method in ecology: Strategies for conservation.Cambridge: Cambridge University Press.
Schumaker, N. H., T. Ernst, D. White, J. Baker, and P. Haggerty. 2004. Projecting wildliferesponses to alternative future landscapes in Oregon’s Willamette Basin. Ecological Applications14 (2): 381–400.
104 | B I O D I V E R S I T Y P L A N N I N G A N D D E S I G N

Scott, J. M., F. Davis, B. Csuti, R. Noss, B. Butterfield, C. Groves, H. Anderson, S. Caicco, F.Derchia, T. C. Edwards, et al. 1993. Gap analysis: A geographic approach to protection ofbiological diversity. Wildlife Monographs 123:1–41.
Shannon, C. E., and W. Weaver. 1949. The mathematical theory of communication. Urbana: Universityof Illinois Press.
Simberloff, D. 1998. Flagships, umbrellas, and keystones: Is single-species management passé inthe landscape era? Biological Conservation 83 (3): 247–57.
Sipple, W. S. 2002. Wetland functions and values. http://www.epa.gov/watertrain/wetlands/index.htm (accessed July 18, 2006).
Smith, F. D. M., R. M. May, R. Pellew, T. H. Johnson, and K. S. Walter. 1993. Estimatingextinction rates. Nature 364:494–96.
Society for Ecological Restoration International. 2004. Mission statement. http://www.ser.org/about.asp (accessed July 18, 2006).
Species 2000. 2002. Home page. http://www.sp2000.org/ (accessed July 18, 2006).
Stein, B. A., L. S. Kutner, and J. S. Adams, eds. 2000. Precious heritage: The status of biodiversity in theUnited States. Oxford: Oxford University Press.
Storch, I., and J. A. Bissonette. 2003. Landscape ecology and resource management: Linking theory withpractice. Washington, DC: Island Press.
Stork, N. E. 1999. The magnitude of global biodiversity and its decline in the living planet. InCrisis biodiversity science and policy, ed. J. Cracraft and F. T. Grifo, 3–32. New York: ColumbiaUniversity Press.
Thompson, J. W. 1999. Stormwater unchained: outside a Massachusetts prison, bioengineereddetention ponds turn runoff into an asset. Landscape Architecture 89 (8): 44–51.
Thompson, J. W., and K. Sorvig. 2000. Sustainable landscape construction: A guide to green buildingoutdoors. Washington, DC: Island Press.
University of Florida, Department of Landscape Architecture. 1999. Phase II: University of FloridaStatewide Greenways System Planning Project recommendations for the physical design of a statewidegreenway system. Final report. Gainesville: University of Florida, Department of LandscapeArchitecture.
U.S. Department of Agriculture. 1997. Agricultural resources and environmental indicators, 1996–1997.Agricultural handbook no. 712. Washington, DC: U.S. Government Printing Office.
U.S. Department of Fish and Wildlife, Endangered Species Program. 2002. EnvironmentalConservation Online System (ECOS). http://ecos.fws.gov/ecos/index.do (accessed July 18, 2006).
U.S. Environmental Protection Agency. 2000. Applicability of biodiversity indices to FKCCS species andecosystems region 5, USEPA, Chicago United States Army Corps of Engineers, Jacksonville District,2000. http://www.saj.usace.army.mil/projects/biodivind2ndrev.htm (accessed July 18, 2006).
U.S. Fish and Wildlife Service (USFWS). 1988. Endangered Species Act of 1973, as Amendedthrough the 100th Congress. Washington, DC: U.S. Department of the Interior, USFWS.
———. 1997. Status and trends of wetlands in the conterminous United States 1986–1997.http://training.fws.gov/library/Pubs9/wetlands86-97_lowres.pdf (accessed July 18, 2006).
Van Sickle, J., J. Baker, A. Herlihy, P. Bayley, S. Gregory, P. Haggerty, L. Ashkenas, and J. Li.2004. Projecting the biological condition of streams under alternative scenarios of human landuse. Ecological Applications14 (2): 368–80.
Vitousek, P. M. 1988. Diversity and biological invasions of oceanic islands. In Biodiversity, ed. E. O.Wilson and F. M. Peter, 181–89. Washington, DC: National Academy Press.
Washington Transcript Service. 1998. William Cohen, secretary of defense holds news conferenceon base closings. April. Washington Transcript Service.
B I B L I O G R A P H Y | 105
106 | B I O D I V E R S I T Y P L A N N I N G A N D D E S I G N
Weitz, J., and T. Moore. 1998. Development inside urban growth boundaries: Oregon’s empiricalevidence of contiguous urban form. Journal of the American Planning Association 64 (4): 424–40.
White House, Office of the Press Secretary. 1999. Economic renewal: community reuse of formermilitary bases. Press release, April 21. http://clinton6.nara.gov/1999/04/1999-04-21-report-on-community-reuse-of-former-military-bases.html (accessed June 4, 2006).
Whittaker, R. H. 1975. Communities and ecosystems. 2nd ed. New York: Macmillan.
Wilcove, D. 1993. Getting ahead of the extinction curve. Ecological Applications 3:218–20.
Wilcove, D. S., D. Rothsein, J. Dubow, A. Phillips, and E. Losos. 2000. Leading threats tobiodiversity: What’s imperiling U.S. species? In Precious heritage: The status of biodiversity in theUnited States, ed. B. A. Stein, L. S. Kutner, and J. S. Adams, 275–300. Oxford: OxfordUniversity Press.
Wilcox, B. A. 1982. In situ conservation of genetic resources: Determinants of minimum arearequirements. In National parks, conservation and development: The role of protected areas in sustainingsociety, ed. J. A. McNeely and K. R. Miller, 639–47. Proceeding of the World Congress onNational Parks, Bali, Indonesia, October 11–12, 1982. Washington, DC: SmithsonianInstitution Press.
Willamette Partnership. 2005. Home page. http://clev17.com/~willamet/?q= (accessed August 22,2006).
Willamette Riverkeeper. 2002. Home page. http://www.willamette-riverkeeper.org (accessed July18, 2006).
Willamette Valley Livability Forum. 2001. Home page. http://www.lcog.org/wvlf/ (accessed July18, 2006).
Wilson, E. O. 1988. The current state of biological diversity. In Biodiversity, ed. E. O. Wilson andF. M. Peter, 3–18. Washington, DC: National Academy Press.
World Conservation Union–IUCN. 2000. News: Confirming the global extinction crisis, a call for international action as the most authoritative global assessment of species loss is released.IUCN-World Conservation Red list Program. http://www.iucn.org/en/news/archive/archive2000.htm (accessed July 18, 2006).
World Conservation Union–IUCN, Species Survival Commission. 2001. The SSC Red ListProgramme. Home page. http://www.redlist.org/info/programme.html (accessed July 18, 2006).
World Resources Institute (WRI). 1992. Global Biodiversity Strategy: Guidelines for action to save,study, and use Earth’s biotic wealth sustainably and equitably. World Resources Institute,Washington, IUCN and UNEP.
World Zoo Organization. 1993. The World Zoo conservation strategy executive summary. Chicago:Chicago Zoological Society.
Yin, R. K. 1994. Case study research: Design and methods. Thousand Oaks, CA: Sage.
Zedler, J. B. 1996. Ecological issues in wetland mitigation: An introduction to the forum (inwetland mitigation). Ecological Applications 6 (1): 33–37.
I N D E X
AAdy, John, 26All Taxa Biodiversity Inventory
(ATBI), 9American Planning Association,
4American Society of Landscape
Architects (ASLA), 4Amodeo, John, 40Association for Biodiversity
Information, 6, 9
BBailey, Robert, 13Baker, Joan, 59, 62, 68Bald eagles (Haliaeetus
leucocephalus), 56Bartholick, G. R., 26Bastach, Rick, 62Benedict, Mark, 71Bennett, A. F., 85–86Bioclimatic zones, 29–32Biodiversity
assessment and conservation strategies,11–14
background, 3–5case study propositions,
80–84definitions of, 5–6importance to landscape
designers and planners,3, 15–18, 76
organizations, agencies,
and conventions, 19–22species diversity and
decline, 7–11value placed on, 14–16zoos and, 23, 29, 36
Biological Resources Discipline(BRD), USGS, 19
Brighton, Jim, 26Brodowicz, William, 51Brown, G. G., 10Brown, K. S., Jr., 10Bryant Associates, Inc., 39
CCarol R. Johnson and Associates
(CRJA). See Devens FederalMedical Center stormwaterproject
Carr, Margaret (Peggy), 71, 72,73, 76–77
Changes, short-term and long-term, 88–89
Charismatic species, 15Chen, D. D. T., 16Chiles, Lawton, 70Clark-Morey Drain, 51–52Clean Water Act, 47, 58Clinton, Bill, 59Coarse filter approach, 13, 73Coe, Jon Charles, 26, 33Cogswell, Charlotte, 39, 40, 41,
44Community scale, 88Connectivity, 85–86Conservation International, 12
Convention on BiologicalDiversity (CBD), 20
Convention on InternationalTrade in Endangered Species(CITES), 21
Convention on the Conservationof Migratory Species (CMS), 21
Convention on Wetlands(Ramsar), 21–22
Cooperrider, A. Y., 5Corridors, 85, 86Cox, Jim, 74Crawford, Gary, 51Crosswinds Marsh (Michigan)
background, 47–49biodiversity data and
planning, 53–54biodiversity propositions
and, 80–84connectivity and, 86goals and objectives, 52participants, 51–52postproject evaluation,
54–56project data, 49–51public/private partnership,
52–53Cultural resonance, 24, 33–34
DDecision-support model (DSM),
71–72, 74, 75Defensive strategies, 48, 49Detroit Metropolitan Wayne
County Airport, 49, 50–51

Devens Enterprise Commission(DEC), 40, 41, 43
Devens Federal Medical Center stormwater project(Massachusetts)
background, 37–38biodiversity data and plan-
ning, 41–42biodiversity propositions
and, 80–84connectivity and, 85–86goals and objectives, 40participants, 39–40postproject evaluation,
43–45project data, 38–39public/private partnership,
41Disbrow Drain, 51, 53–54
EEconomically valuable species, 15Ecoregion approach, 13Ecosystem (gamma) diversity,
5–6Ehrenfeld, David, 16Endangered Species Act of 1973
(ESA), 8, 11–12Endangered species approach,
11–12Environmental Protection
Agency, U.S. (U.S.EPA), 19, 37, 50, 59Erwin, Terry L., 7Ethics, 4–5, 18, 89Evolutionary aspects of biodi-
versity, 6Exotic invasives, 17–18Extinction rates, 8–11
FFederal Appearances Memo, 44Federal Aviation
Administration, 51Federal Bureau of Prisons, 39,
40, 41, 44Fish and Wildlife Service, U.S.
(U.S.FWS), 19, 50, 87Fish richness, 66, 67Flagship species, 15Florida Department of
Transportation (FDOT), 70
Florida Ecological Network(FEN). See Florida StatewideGreenways System PlanningProject
Florida Greenways CoordinatingCouncil (FGCC), 70, 71
Florida Natural Areas Inventory,75
Florida Statewide GreenwaysSystem Planning Project
background, 69biodiversity data and
planning, 74–75biodiversity propositions
and, 81–84connectivity and, 86goals and objectives,
72–73participants, 70–72postproject evaluation,
75–77project data, 69–70public/private partnership,
73–74Floristic Quality Assessment, 54Focal species, 15Fort Devens, 37Four-R Framework, 86Fragmentation of habitat, 17“The Future I in Our Hands,”
67
GGAP analysis, 12–13Genetic (alpha) diversity, 5–6Genetic scale, 88GIS (geographic information
systems) Florida Greenwaysproject, 71, 74, 75, 76–77
GAP analysis and, 13Willamette Valley project, 64Global Biodiversity Strategy
(WRI), 5–6, 20–21Goals and objectives
biodiversity among multiple goals, 82–83
Crosswinds Marsh, 52Devens stormwater
project, 40Florida Greenways Project,
72–73Willamette Valley
Alternative FuturesProject (Oregon), 63
Woodland Park Zoo,26–28
Goldsmith, Wendi, 39Greenway, defined, 69Gregory, Stan, 62, 68Groves, C. R., 86
HHabitat composition, 17–18Habitat conservation plans, 12Habitat corridors, 85, 86Habitat destruction, effects
of, 17Habitat mosaics, 85Habitat zones, bioclimatic,
29–32Halprin, Lawrence, 57, 62Hancocks, David, 23, 26, 27,
28, 29, 36, 82Harvard, Peter, 26Hinshaw, Stephen, 51Hoctor, Thomas, 71, 73, 74, 77Hogan, Donald, 26Holdridge system, 30, 32Holl, Karen, 87Hotspot approach, 12, 49Hulse, David, 62, 65–66Human-environment relation-
ships and balance, 83–84
IIndex of Biotic Integrity (IBI),
66, 67Indicator species, 13–14Insect species, number of, 7International Erosion Control
Association, 43–44International Union for
Conservation of Nature andNatural Resources (WorldConservation Union–IUCN),5–6, 7–8, 21
Invasive species, 17–18
JJennings, M. D., 13Jones, Grant, 23, 24, 26, 28,
29, 30, 33, 36Jones, Johnpaul, 26
108 | B I O D I V E R S I T Y P L A N N I N G A N D D E S I G N
I N D E X | 109
Jones & Jones. See WoodlandPark Zoo (Seattle)
KKautz, Randy, 74Keystone Center, 5Keystone species, 15Kitzhaber, John, 57Kurta, Allen, 51
LLandscape Architecture
Foundation (LAF), 3Landscape immersion, 23–24,
29, 30, 32–33, 36Landscape scale, 88Larson, Keith, 26Leopold, Aldo, 18Linkages in the Landscape
(Bennett), 85–86Lomborg, Bjørn, 10–11
MMacArthur, R. H., 10MacMahon, James, 87Massachusetts Biological and
Conservation Database, 9May, Robert M., 7, 10McHarg, Ian, 26Michigan Department of
Environmental Quality(MDEQ), 50, 52, 55
Michigan United ConservationClub, 52, 53
Minimum area requirements, 17Mittermeier, Russell, A., 12Monitoring
on biodiversity, lack of, 4Crosswinds Marsh, 54–56Devens stormwater proj-
ect, 44Woodland Park Zoo,
34–36Multipurpose space, 43–44,
86–87Multi-species indicators, 14
NNational Biological Information
Infrastructure, U.S. (NBII),5, 19
National Gap Analysis Program(GAP), 12–13
National Wetlands InformationCenter, USGS, 19
Natural Heritage Network, 9,13, 75
Natural Resources ConservationServices (NRCS), USDA,19–20
The Nature Conservancy(TNC), 6, 9, 13, 20
Negative indicators, 14Noah principle, 16Noss, Reed F., 5, 14
OOffensive strategies, 48–49Omernick, James, 13Oregon land use planning, 57Osborn, Phillip, 26Oxbow National Wildlife
Refuge, 37, 41, 44
PPacific Northwest Ecosystem
Research Consortium, 59–60,63–64, 68
Pardisan Zoo, 27–28Partners for Fish and Wildlife
Program, 87PATCH model (Program to
Assist in Tracking CriticalHabitat), 65, 86
Paulson, Dennis, 26, 29, 30, 36Peck, Sheila, 6, 88Population scale, 88Precious Heritage, 6Proactive strategies, 11, 13, 42,
65Protective strategies, 48, 49Pryor, Tim, 44Public awareness, 83–84Public/private partnership
Crosswinds Marsh, 52–53Devens stormwater proj-
ect, 41Florida Greenways Project,
73–74Willamette Valley
Alternative Futures Project (Oregon), 63–64Woodland Park Zoo, 28
RRaimi, M. D., 16Reactive strategies, 11, 65Red Book program, 7–8Restoration ecology, 81–82, 87Riseng, Catherine, 51Risser, Paul, 58, 62, 67Rural-urban continuum, 80–81
SScales, 5–6, 88Schmidt, Eric, 26Seattle, Washington. See
Woodland Park Zoo (Seattle)Sierra Club, 20Smith, F. D. M., 10SmithGroup JJR. See
Crosswinds MarshSociety of Ecological
Restoration International,4–5
Sorensen, Randy, 40Sorvig, K., 44Species-area theories, 17Species (beta) diversity, 5–6Species guilds, 15Species richness and decline,
7–11Species selection approaches,
13–14, 15Stepping stones, 85Stork, Nigel, 7Stubbins Associates, 39Swanson, John, 26
TTarget species, 13–14Temporal aspects of biodiversity,
6Thompson, J. W., 44Threatened and Endangered
Species System (TESS), 8Trails and Greenways
Clearinghouse, 86–87
UUmbrella species, 15, 76United National Environment
Programme (UNEP), 5–6United States, biodiversity
status in, 8–10
University of Florida. SeeFlorida Statewide GreenwaysSystem Planning Project
VVickerman, Sara, 62, 64, 68Vulnerable species approach, 15
WWallace McHarg Roberts and
Todd (WMRT), 27–28Walters, David, 26Wayne County, Michigan. See
Crosswinds MarshWetlands ecosystems and
mitigation, 47–49. See alsoCrosswinds Marsh; DevensFederal Medical Centerstormwater project
Whittaker, Robert, 6Wilcox, B. A., 5Willamette Restoration
Initiative (WRI), 60–62,63–64
Willamette Valley AlternativeFutures Project (Oregon)
background, 57–58biodiversity data issues,
64–66biodiversity propositions
and, 81–84connectivity and, 86goals and objectives, 63participants, 59–63postproject evaluation,
66–68project data, 58–59public/private partnership,
63–64Willamette Valley Livability
Forum (WVLF), 57, 60–62,63–64, 66–67
Wilson, E. O., 3, 7, 10Woodland Park Zoo (Seattle)
background on zoos, 23–24biodiversity data and
planning, 29–34biodiversity propositions
and, 80–84
connectivity and, 85goals and objectives, 26–28participants, 26postproject evaluation,
34–36project data, 24–26public/private partnership,
28World Conservation
Union–IUCN (InternationalUnion for Conservation of Nature and NaturalResources), 5–6, 7–8, 21
World Heritage Convention(WHC), 22
World Resources Institute(WRI), 5–6, 20
World Wildlife Fund (WWF), 13
World Zoo Organization, 28, 29
ZZoos, evolution of, 23, 25Zwick, Paul, 71
110 | B I O D I V E R S I T Y P L A N N I N G A N D D E S I G N
Victor M. Sher, Esq. (Chair)Sher & LeffSan Francisco, CA
Dane A. Nichols (Vice-Chair)Washington, DC
Carolyn Peachey (Secretary)Campbell, Peachey & AssociatesWashington, DC
Drummond Pike (Treasurer)PresidentThe Tides FoundationSan Francisco, CA
Robert BaenschDirector, Center for PublishingNew York UniversityNew York, NY
William H. MeadowsPresidentThe Wilderness SocietyWashington, DC
Merloyd Ludington LawrenceMerloyd Lawrence Inc.Boston, MA
Henry ReathPrinceton, NJ
Will RogersPresidentThe Trust for Public LandSan Francisco, CA
Alexis G. SantTrustee and TreasurerSummit FoundationWashington, DC
Charles C. SavittPresidentIsland PressWashington, DC
Susan E. SechlerSenior AdvisorThe German Marshall FundWashington, DC
Nancy Sidamon-EristoffWashington, DC
Peter R. SteinGeneral PartnerLTC Conservation Advisory ServicesThe Lyme Timber CompanyHanover, NH
Diana Wall, Ph.D.Director and ProfessorNatural Resource Ecology LaboratoryColorado State UniversityFort Collins, CO
Wren WirthWashington, DC
I S L A N D P R E S S B O A R D O F D I R E C T O R S
