bioenergy program. this paper reports on this cooperative...
TRANSCRIPT

Emissions Tests with an On-Road Vehicle Fueled with Methyl and Ethyl Esters of Rapeseed Oil
bY Charles L. Peterson and Daryl L. Reece’
Introduction
University of Idaho personnel have been researching the use of vegetable oil as a fuel since 1979. The first tests were with raw vegetable oils of various types and then with methyl and ethyl esters of rapeseed oil. Vegetable oil esters, sometimes called Biodiesel, have been shown to be very good fuels for compression ignition engines. Many tests have shown these fuels to have characteristics as good as, or superior to, common diesel fuel. In spite of these excellent fuel characteristics many hurdles remain before these tieIs will be available for general use.
This research has shown that transesterification is necessary before oils and fats can be used in most diesel engines. Transesterification is the process of using an alcohol, usually methanol, in the presence of a catalyst, such as sodium hydroxide or potassium hydroxide, to chemically break the molecule of the oil or fat into an ester and glycerol. Recently, recipes for using ethanol as the reacting agent with the rapeseed oil to form ethyl ester have been successfUlly carried out. Fuel characterization and short and long term engine tests have shown the ethyl ester of rapeseed oil (REE) to be equivalent, or superior to, the methyl ester of rapeseed oil @ME).
The Clean Air Act (CAA) forms the legislative base for fLe1, engine, and emissions standards. The Environmental Protection Agency (EPA) has set emissions standards. This has resulted in engine manufacturers and refinery operations spending billions of dollars each year to meet the stringent requirements. Electronic engine control, advanced fuel systems, engine oil control methods, and combustion chamber design are making engines more sensitive to changes in physical and chemical properties of &el. Biodiesel presents an attractive solution to environmental problems for many circumstances.
Vegetable oil esters have been reported to be cleaner burning than diesel fuel in a typical compression ignition (CI) engine. Feldman (1991) repotted smoke opacities reduced as much as 70 percent for methyl ester of rapeseed oil compared to commercial diesel fuel.
Two limitations of the University of Idaho test program are the lack of suitable facilities for measurement of exhaust emissions (other than through use of an opacity meter), and a dynamometer capable of transient cycles. In the spring of 1994 a unique opportunity to conduct these tests was made possible through a grant from the Pacific Northwest and Alaska Regional Bioenergy Program. This paper reports on this cooperative test of gaseous emissions from vegetable oil fuels using the Emissions Test Facility (ETF) of the Los Angeles Metropolitan Transit Authority and vegetable oil ester fuels produced by the Agricultural Engineering Department at the University of Idaho.
* The authors are Professor of Agricultural Engineering and Engineering Technician, respectively, both at the University of Idaho, Moscow, Idaho 838442040.
1

Objectives The objectives of this experiment were:
1) to compare regulated emissions data including total hydrocarbons (IX), carbon monoxide (CO), carbon dioxide (CO,), nitrogen oxides (NCk), and particulate matter (PM), for ethyl ester of rapeseed oil, methyl ester of rapeseed oil, and diesel control fuel;
2) to obtain emissions data for 100 percent REE, 100 percent RME, and 20 percent and 50 percent blends of both REE and RME with diesel control fuel.
A Review of Literature One of the critical issues to be resolved for vegetable oil tiels as they seek status as
replacements for petroleum diesel fuel is how they affect emissions from a standard diesel engine. This literature review examines many of the tests that have been conducted in the past several years related to emissions of vegetable oil fuels. Test procedures, engines, and instrumentation vary widely from one report to another. Standard EPA procedures are rarely followed. Emissions testing on the official level requires more human, capital, and equipment resources than most engine test facilities have available.
The EPA procedures for measuring exhaust emissions from diesel engines require the monitoring of both gaseous and particulate emissions. Diesel testing utilizes the constant volume sampling concept of measuring emissions, it requires a positive displacement pump-constant volume sampler (PDP-CVS) or critical flow venturi (CFV) with heat exchanger, and must be connected to a dilution tunnel for sampling particulate emissions. The PDP-CVS consists of a dilution air filter and mixing assembly, heat exchanger, positive displacement pump, sampling system, and associated valves, pressure and temperature sensors. The CFV consists of a dilution air filter and mixing assembly, a cyclone particulate separator, a sampling venturi, a critical flow venturi, sampling system, and assorted valves, pressure and temperature sensors. Specific operating requirements are detailed by the EPA for both systems. CI engines require a heated flame ionization detection sampler for hydrocarbon analysis. The HFID must be taken directly from the diluted exhaust stream through a heated probe in the dilution tunnel. Other analyzers are required for carbon monoxide, carbon dioxide, and oxides of nitrogen. One such facility is described in detail by Dunlap et al. (1993).
Emissions testing is a case where the protocol is so restrictive as to limit testing to only a very few laboratories. To counteract the official level, many scientists use techniques of their own to give “relative” data. As the data is examined, it is easy to see that these many different local procedures shed more dark on the question than light. Acceptable research protocols should be suggested within the reach of the average engine test cell that would bring uniformity to this maze of tests.
The reports reviewed can be broken into a range of sophistication. Many labs have only an opacity or smoke meter available and report this as emissions testing. Some have maintenance shop type instruments for the regulated emissions total hydrocarbons (HC), carbon monoxide (CO), carbon dioxide (CO,), oxides of nitrogen (NO-x), and particulate matter (PM). These instruments are usually operated with little or no calibration and offer, in many cases, too little precision and/or sensitivity to give real “relative” data. The validity of most of those tests should always be suspect. The literature clearly shows that smoke meter or opacity data indicate only visible smoke and are not necessarily related to the regulated quantity called particulate matter (PM).
Particulates are defined by the EPA as any diesel exhaust effluent collected on a binderless
2

glass fiber filter in a dilution tunnel at temperatures below 125 degrees F. Hence, particulates include not only solid carbon , but sulfate emissions and soluble organic fractions (SOF). The SOF found in diesel particulates are comprised of unburned fuel and lube oil, and partially oxidized fuel and lubeoil (Hunter et al., 1989).
Holmberg and Peeples (1994) reports “There is an inverse correlation between emissions of NOx and PM. If an engine is optimized to reduce NOx emissions, each unit of NOx reduction will routinely result in a unit increase of PM. Similarly, a reduction in PM will result in an increase in NOx. Although the inverse correlation holds true for biodiesel as well, the severity of the trade-off is not as significant as in petrodiesel.”
The next level of sophistication is from tests which have good quality analyzers with heated lines and, hopefully, good calibration procedures for HC, CO, CO,, and NOx. In every case, these test cells did not have access to a dilution tunnel for measuring PM. In most cases they still use opacity or smoke for PM. These test cells also do not have capability for transient cycles. They report some sort of steady state data. In some cases they use the 13 mode test, in most cases they use a protocol of their own. This is most generally a constant speed, variable load test. If this data can be translated as being “relative” to the transit cycle required by EPA it leaves one wondering why the transient EPA cycles are the only certifiable cycle.
The third level of sophistication is a testing lab with a transient capable dynamometer, a dilution tunnel, calibration and all the required sophistication to be cahed “EPA Certified” for emissions testing. Even in these labs, however, there is not uniformity of data because cycles differ, reference fuels differ, engines differ, methods of changing fuels difher and there is a wide selection of vegetable oil ester fuels from different origins. Another problem is the need for “cold start” and “hot start” tests. These requirements are probably reasonable for certifying an engine if the lab is available. However, when one does a comparison of many different fuels, additives, engine adjustments, or blends it becomes an impossible task to create any type of reasonable scientific experiment given a normal budget and time to use the dynamometer facility.
The last level of emission testing involves laboratories that also measure the unregulated aldehydes, ketones, and polycyclic aromatic hydrocarbons (PAH) that are possibly potential health problems. Only a few reports relate to these constituents; however, most show that vegetable oil esters produce PAH’s lower than those from diesel fuel.
Having discussed all of this, it will be evident that emissions data can be found to prove about any point one might want to prove. However, the overriding conclusion that one must reach is that ethyl and methyl esters of vegetable oils are essentially similar to diesel fuel in their emissions characteristics. Minor engine adjustments can bring about minor changes in results. One difference often brought up is that NOx is increased. That may or may not be relevant because minimahy, at best, 10 or 15 percent of a very small number in the worst cases is then usually accompanied by an equally important benefit such as reduced HC, CO, or PM. It must be remembered that the combustion process requires emissions. Hydrocarbons are transformed into carbon dioxide and water accompanied by the nitrogen in the air passing through. Incomplete combustion results in HC, CO, and NOx. We can’t reduce every thing to nothing; reductions in
HC and CO must be accompanied by increases in CO,. Nitrous oxides result from the characteristics of combustion. Sales of diesel fuel in the U. S. are nearly 50 billion gallons per year, 53.4 percent goes to transportation according to the Energy Information Administration (1989). Diesel engines were designed over many years to operate on petroleum diesel. It is amazing that they perform as well as they do on methyl and ethyl esters of vegetable oils and that the emissions are so low.

In the U.S., the regulations that take effect in 1994 and 1998 will push the design limitations of heavy-duty diesel engines. The Federal heavy-duty diesel engine emission regulations for 199 1 and 1994 have prompted a comprehensive re-examination of the diesel combustion process. These regulations require major reductions in the NOx and particulate emissions of diesel engines used in trucks over 8500 lb gross vehicle weight (GVW).
According to EPA 86.094-l 1 exhaust emissions from new 1994 and later model year diesel heavy-duty engines shall not exceed the following: HC 1.3 grn&hp-hr; CO 15.5 gm/bhp-hr; Oxides ofNitrogen 5.0 gm/bhp-hr; PM for diesel engines to be used in urban buses 0.07 gm/bhp- hr; PM for all other diesel engines 0.10 gm!bhp-hr. The opacity of smoke emissions shall not exceed the following: 20 percent during the acceleration mode; 15 percent during the lugging mode; 50 percent during the peaks in either mode.
Zhang et al. (1988) in two replicates of 200 hour tests reported “based on evaluations of engine performance, wear and combustion chamber component condition as indicators of engine durability, winter rape methyl ester appears to be equivalent to number 2 diesel.”
Schumaker et al. (1994) reported on tests with two 5.9 L Cummins engines in on-road vehicles that the black exhaust smoke normally observed when a diesel engine accelerates was reduced as much as 86 percent when the diesel engine was fueled with 100 percent soydiesel.
Humlce and Barsic (1981) in tests with degummed crude soybean oil and crude soybean oil found that nozzle deposit formation after 10 hours caused engine performance to decrease and emissions to increase.
Schumaker et al. (1993) studied engine exhaust from four farm tractors using portable exhaust emission testing equipment. As fuel changed from diesel to methyl soyate, CO dropped from 0.667 to 0.04 percent, CO, exhibited no clear trends, NOx increased from 843 ppm to 1006 ppm, while opacity decreased from 15.6 to 8.0 percent. NOx exhaust emissions tended to be lower when the engines were fueled with lo-40 percent soydieseVdiese1 blends as compared to 100 percent diesel or 100 percent soydiesel.
Zubik et al. (1984) used a Case 188D, 4 cylinder, naturally aspirated, 4-stroke diesel engine to study exhaust emissions of diesel fuel, a blend of 25 percent sunflower oil in diesel fuel and 100 percent sunflower oil methyl ester. Emissions were measured with continuous flow, heated line analyzing instruments. Particulates were measured with a smoke meter. At a constant speed of 1800 r-pm, CO and NOx emissions were essentially the same for all three fuels. Smoke was the lowest for the methyl ester and highest for pure diesel fuel. Throughout the operating range the pure diesel fuel gave the lowest HC values, however at the lightest loads HC from diesel was above the methyl ester and blend values.
Ishii and Takeuchi (1987) used a one cylinder, Yanrnar indirect injection engine to compare emissions for diesel and transesterified curcas oils. Measurements were steady state 2400 rpm at different load settings. HC and CO were higher at light loads and lower at full load for the ester compared to diesel fuel. NOx was essentially unchanged. There was a slight reduction in black smoke concentration when operating on the transesterified curcas oils compared to diesel.
Muryama et al. (1985) compared rapeseed and palm oils and their methyl esters with diesel fuel for performance, emissions, and carbon deposits in a one cylinder, DI diesel engine. It was found that shortening the combustion duration is effective in reducing smoke regardless of fuel.
Reece and Peterson (1993) measured smoke opacity using the snap idle test with a 1992 Dodge with a Cummins 5.9 L, DI, turbocharged and intercooled engine comparing methyl ester of rapeseed oil and diesel fuel. They found a decrease in opacity of 63 percent, and 9 percent reduction in hp for the Rh4E compared with diesel.
4

Geyer et al. (1984) operated a single cylinder, 0.36 L, DI Diesel engine on certified no. 2 diesel, cottonseed oil, sunflower seed oil, methyl ester of cottonseed oil, and methyl ester of sunflower seed oil to compare performance and emission data. A primary objective was to assess aldehyde emissions and the potential health effects of particulate emissions when operating a diesel engine with vegetable oils. The engine was operated at 2400 rpm and load conditions of l/3,2/3 and full rack. They collected data for CO, HC, NOx, and total aldehydes, as well as individual aldehyde concentrations from fomaldehyde through heptaldehyde.
They found that the gas phase emissions were slightly higher for the vegetable oils. NOx was significantly higher for the methyl esters at all rack settings. They found that total aldehydes increased dramatically with the vegetable oil when compared to diesel; the averages for the methyl esters were slightly higher than the neat oils. The amount of formaldehyde increased with rack setting and was consistently higher for the methyl esters than for diesel. The diesel had a large increase in aldehydes with rack settings while the vegetable oils did not. Overall the aldehydes averaged 12 percent for diesel and 3 1 percent for the vegetable oils. They indicate significant variability in data “this may indicate some problem in the collection or extraction methods”.
Goering et al. (1984) tested diesel oil, a blend of 25 percent sunfIower oil in diesel, and sunflower methyl ester. They report that “all behaved similarly in terms of brake thermal efficiency, ignition delay, exhaust temperatures and exhaust emissions of carbon monoxide and nitrous oxide.” Methyl ester produced lower smoke than the blend and considerably less than diesel.
Wagner et al. (1985) reported that all emission levels except NOx for the ester fuels were similar to diesel fuel. Nitrous oxide, on the other hand, was significantly greater for all of the ester fuels, with the butyl ester giving the highest readings, followed by the methyl ester. “Smoke was definitely less visible under till rack conditions for the methyl and ethyl esters compared to diesel fuel, but the butyl ester was greater . . . . ” Esters tested were purchased from Emery industries. An additive package purchased from Ethyl Corporation was added to the ester fuels. The test engine was a John Deere 4239TF. Emissions measurements were steady state and no PM equipment was available.
Carbon dioxide, carbon monoxide, and oxygen emissions were very similar for all four fuels at both the 2200 and 1500 rpm speed settings. The esters NOx emissions measured 2 to 5 times that of the diesel f%el. The methyl ester produced the highest levels, the butyl esters the next highest, with the ethyl ester producing the lowest levels of NOx emissions at both engine speed settings. Visible smoke was less for the methyl and ethyl esters at firlI rack compared to diesel fuel.
Clark et al. (1984) used a 3.9 L, John Deere 4239TF, 4-cylinder, direct injected @I), turbocharged, CI diesel engine on a stationary dynamometer equipped with a constant speed or constant load mode of automatic control to study emissions from both methyl and ethyl esters. Exhaust gas measurements for HC, CO, CO,, NOx, and 0, were made according to SAE J1003. They found that CO was very low, with no differences between fuels; however, the CO data was too low to be reliable on their instrumentation. Soyates had slightly lower HC levels than the
reference diesel fuel. Methyl and ethyl soyates had consistently higher levels of NOx than the reference fuel. Ethyl esters were lower in NOx than methyl esters.
Alfiso et al. (1993) used a DI, IC diesel engine for emissions tests with the ECE 15, a non- standard STOP and GO test cycle, and for the European 13 mode test procedure. Fuel tested was rapeseed methyl ester (RME). Tests indicated that RME promotes a rise in N&r, a decrease in HC and CO, as well as a strong reduction in smoke. PM produced by RME in transient cycles is

higher than that obtained with diesel fuel. They also measured Polycylic Aromatic Hydrocarbons (PAHJ by taking a sample of diluted exhaust through a glass-fiber filter and then two cold traps in series that were respectively at 0 degrees C and 20 degrees C. The PAH measured with three or four rings that at ambient temperature are still in gas phase are collected into the cold traps. PAH with 5 rings or more are mainly collected on the filter. The volume of extract from the titer and the condensed phase were reduced by rotary evaporation and then analyzed by GC-MS equipment. This technique allows for the analysis of more than 20 compounds. They observed that Nox is increased, smoke is lower for the RME, and in effect increases with load. It is well known that PM emissions may not follow the trend of smoke because of the contribution of SOF. Particulate matter is composed of dry soot and a condensed phase. At low loads the contribution of SOF is higher. At light loads RME produces more SOF and particulate matter than the diesel fuel, while in proximity of fill load the trend becomes opposite. HC for diesel is higher at light loads and less at high loads. CO is about the same for light and high loads with diesel, but is reduced with RME.
NOx production is generally higher for the biofuel, but this effect is more important for the 13-mode cycle than for the transient one. It can be observed that dangerous PAHs do not show significant differences in ECE 15 tests, while they are lower for biofbel on the STOP and GO tests.
Vander G-iend et al. (1988) used a laboratory and modeling study with the KIVA combustion model to study combustion of vegetable oil fuels. They reported “The RME appeared to be an ideal fuel under the conditions tested; it displays short ignition delay, sufficient charge for an extensive premixed bum, and a smooth dif%sion bum stage. Therefore, there exists an opportunity for the optimization of parameters such as injector timing and swirl. Advanced timing should result in a slightly earlier and more vigorous premixed bum. Since RME shows signs of a vapor rich core dutig injection, increased swirl should result in some increase in the amount of premixed bum and in an enhanced rate of diffusion bum.”
Sholl and Sorenson (1993), in tests with SME, found that HC emissions were 50 percent less than those of the reference diesel fUe1; smoke for SME was generally lower than for the diesel reference &el. They used a 4-cylinder, 4-stroke, normally aspirated, direct injection diesel engine. They only had 3.8 L ( 1 gallon of each fuel available) and took their data over 100 consecutive engine cycles at 1800 rpms and 50, 150,300,450, and 600 kPa BMEP.
At all loads the HC emissions from SME were about one-half of those from diesel Abel. CO emissions were slightly lower than for SME except for the very lightest loads, where they were slightly higher. NOx was essentially unchanged. Conditions which have the highest peak pressures and rate of pressure rise at a given load and timing tended to have the highest NOx. Scholl and Sorenson show that the differences in NOx emissions are attributable to changes in ignition delay and burning rate only. This study showed reduced NOx at equal BMEP, and more reduction at 5 degrees retarded timing with SME compared to diesel.
Bosch smoke numbers were lower for SME, but when using a small injector nozzle at retarded timing, the two fuels give equal results. They state that ” the correlation between smoke
number and particulate emissions is tenuous at best... .‘I Their conclusions were “In terms of combustion behavior and exhaust emission
characteristics, soybean oil methyl ester can basically be regarded as interchangeable with diesel tieI.”
NOx emissions for the two fiels are comparable (but slightly lower for SME) and are related to the peak rate of pressure rise which occurs during the initial portion of the combustion process.
6

Smoke numbers for the soybean oil methyl esters were lower than those for the diesel &el. Xiao (1993) tested emissions in a Detroit Diesel 6V-92 engine rated at 277 BHP at 2 100
‘pm. Fuels used were house number 1 diesel @F#l) and number 2 diesel @F#2), both low sulk fuels. They found that 100 percent SME reduced baseline DF#l and DF#2 total particulates by 35 percent, linear with percentage of SME in the &el. Volatile particulate portions remained at a constant level so particulate reduction was mainly due to the reduction in soot (up to 65 percent with 100 percent SME). NOx was increased by up to 8.5 percent for DF#2 blend and 19 percent for DF#l blends. The emission effects of 20 percent SME blends were small.
Mittelbach and T&hart (1988), in tests with methyl esters of used f?ying oil, reported slightly lower HC and CO emissions, but increased NOx. Particulate emissions were significantly reduced, especially the insoluble portion. These two researchers say that the reduction of particulate emissions can be explained by the oxygen content of the used f?ying oil fuel.
Mittelbach and T&hart (1988) measured emissions of polycyclic aromatic hydrocarbons (PAH). They reported that PAH emissions are, in general, slightly higher than those from number 2 diesel tieI, but that the differences are within tolerance limits.
Hammerlein et al. (1991), in tests with neat rapeseed oil, reported increased HC (up to 290 percent), increased carbon monoxide (up to 100 percent), lower nitrogen oxides (up to 25 percent), lower soot emissions (reduced Bosch number of 0.1 to 0.4 depending on engine type), and particulate emissions reduced 30 to 50 percent with “divided” chamber and increased 90 to 140 percent with a DI engine. The soluble organic fraction of particulate emissions increased by up to 15 percent when rapeseed oil was used. They found that total emissions of aldehyde and ketones were 30 to 330 percent higher with rapeseed oil; emissions of aromatic hydrocarbons were signifxantly higher with rapeseed oil. Emission proties of particulate bound polycyclic hydrocarbon emissions (PAH) showed anthracene and phenanthrene had the highest concentrations followed by pyrene, chrysene, and fluoranthene. PAH emissions “were reduced to about one-third with big pre-combustion and swirl chamber engines. They increased with rapeseed oil in DI engines and the small swirl chamber engines by 10 to 140 percent compared with diesel fuel.
Marshall (1993) reported on usiig methyl esters in a stationary Cummins L- 10 engine and a Cummins 5.9 L in a Dodge pickup tested on a Chassis dynamometer. The L-10 engine was tested with the 13-mode emissions test and the pickup with a transient Federal Test Procedure test. They reported “Emission trends were very similar to those reported for other heavy duty diesel engines. That is, emission levels of HC, CO, and particulates decreased significantly for the SoyDiesel blends compared to the diesel f5el. The decrease from the base tieI for these three components was about 5% per 10% incremental addition of methyl soyate to the fUe1. NOx emissions tended to increase linearly with the level of methyl soyate in the fuel-- approximately 1.4% per 10% incremental addition of methyl soyate.” They hypothesized that the increase in NOx was associated with cetane number or ignition delay characteristics. They report that fuels with very high cetane numbers are associated with very high NOx emissions. They tirther comment that there is much information in the technical literature associating increased NOx
emissions with lower cetane fuels. However, they say the low cetane number was created by increasing the aromatics content, which was not done in their study.
Marshall (1993) found the following for the pickup truck. There was no regular, systematic effect of soyate level on HC and NOx , particulates increased with the content of methyl soyate and reached 70% above the low sufir diesel, and CO decreased with increasing soyate level. They reported quite high NOx -- 6 grams per mile (g-pm) whereas the EPA standard for vehicles
7

of this weight class is 1.7 gpm. Emission levels of HC, CO, and particulates were at or below the EPA standards. In this study, 5 percent by volume methyl soyate resulted in a 1 percent increase in BSFC, 18 percent reduction in HC, 8 percent reduction in CO, 0.7 percent reduction in NOx, and a 4.5 percent decrease in PM.
Marshall (1993) reported that there did not appear to be any fire1 effect on aldehyde emissions. The levels with the 5.9 L Cummins engine were quite high for all three fuels - approximately 90 milligrams per mile compared to levels of 3 to 10 mgpm for spark ignition vehicles. One possible reason is the difference in the test procedures for light and heavy duty vehicles.
Mittelbach et al. (1985) used a 2.3 L turbocharged, four cylinder, four stroke, DI prototype diesel engine with exhaust gas recirculation (EGR) under transient operating conditions on a chassis dynamometer for emissions tests with methyl ester of refined @ME) and unrefined (URME) rapeseed oil. Two U.S. diesel fuels and an Austrian diesel fuel were used for checks. “It is common knowledge that by heating fats and oils various volatile compounds like aldehydes and ketones are produced.” When using rape oil and RME as diesel fuels, the typical smell of burnt fat can be detected, which could originate from unsaturated aldehyde like acrolein. They determined 10 polycyclic aromatic hydrocarbon compounds. For all fuels the tests showed high formaldehyde (40 %)and acetaldehyde very low and similar in magnitude. For the sum of C-3 aldehydes, URME was highest and RME was similar to US fuel B, whereas US fuel A and Austrian diesel fuel were lowest. The transformation of rapeseed oil into the methyl ester at least reduces the emissions of C-3 aldehydes significantly. In these tests, HC was reduced, CO unchanged, and NOx increased. NOx of the ester fuels was 0.56-0.62 gm/km while NOx of the diesel fuels was 0.47 -0.5 gm/mile. They conclude “rapeseed oil methyl esters do not lead to irregular PAHemissions.”
Schumaker et al. (1994) reported that transient tests conducted by Cummings Engine Company at Columbia, Indiana were run on the 1991,6BTAA diesel engine. They found HC reduced by 48 percent, CO reduced by 1 percent, and NOx reduced by 20 percent for soydiesel compared with a diesel control fuel.
Recently completed tests by ORTECH (Goetz, 1993) using a 20 percent blend of Biodiesel and 80 percent diesel fuel showed that a 3-degree timing change decreased NOx by 4.6 percent, HC by 14.5 percent, CO by 9.8 percent, and PM by 17.2 percent compared to diesel with no timing changes.
Humphrey and Schumaker (1994) reported on emissions testing conducted by Cummins Engine Company in an EPA certified testing laboratory. Cummins tested a 5.9 liter, turbocharged, intercooled, direct injected diesel engine. The engine was fueled on biodiesel and reference diesel fuel. The tests revealed the following significant results: 1) reduction in smoke up to 83 percent; 2) reduction in hydrocarbons by 48 percent; 3) a decrease of CO by one percent; 4) an increase in oxides of nitrogen by 14 percent; and 5) a reduction in particulate emissions by 20 percent. Additional emissions testing by the University of Missouri with automobile inspection emissions analysis equipment on a 1991 Dodge pickup equipped with a 5.9 liter turbocharged, intercooled direct injection Cummins diesel engine revealed slightly lower CO, CO,, and HC emission levels. There are very little sulfur emissions due to the absence of sulfur in plant oils.
Manicom et al. (1993) reports that tests were conducted on a 1991, DDC 6V-92 TA engine using the EPA Heavy-Duty Transient Test Cycle. They tested blends of 10,20,30, and 40 percent methyl soyate in comparison with a diesel control fuel. FMD subcontracted ORTECH International to carry out the testing. The diesel control fuel used was ESSO Diesel # 1. The
8

MS/diesel blends were made up in 50 gallon drums and the engines were fueled directly from the individual drums. One cold start transient test and four hot start transient tests were completed on each fuel. The results showed nearly linear changes with percent fuel. The 40 percent blend of methyl soyate had the following results: HC down 39.5%; CO down 29.1%; NOx up 15.0%; PM down 17.8 %.
Increased blend levels increased NOx while reducing PM. Proportionately, PM reductions were slightly more than the increase in NOx. The reduction in PM was attributed to the oxygen in the tiel. Total particulates for a 20 percent blend are reduced by 11.1 percent, but the soluble fraction increases from 40 percent to 5 1 percent.
Manicom et al. (1993) reported that “the addition of methyl soyate to diesel fuel had the effect of lowering particulates, hydrocarbons, and carbon monoxide emissions while increasing NOx emissions. The optimum blend of methyl soyate and diesel based on the trade-off of particulates decrease with NOx increase was 20 percent methyl soyate in diesel. Due to the increase in NOx emissions in parallel with decreased exhaust temperatures, it is postulated that the methyl soyate is acting as a fuel cetane improver. This improvement in cetane is resulting in a reduced ignition delay time and thus an effective advance in injector timing.”
Mills and Howard (1983) conducted an investigation of polynuclear aromatic hydrocarbon emissions with unmodified sunflower, rapeseed and soybean oils and modified ethyl ester of sunflower vegetable oils. Three engine load/speed conditions were assessed for each fuel and emission levels for 20 PAH compounds. Samples were generated using a probe in the exhaust pipe. The side stream of exhaust was first filtered to collect particulate bound PAH. Following filtration, the exhaust was transferred to two identical condensation traps for the removal of the vapor phase PAH. PAH profiles were strongly influenced by combustion conditions for all fuels tested.
PAH profiles from the ethyl ester of sunflower oil exhaust extracts showed similarities with diesel but were lower in total quantity. At 1500 rpm and no load total PAH emissions (microgram/m3) for SEE were 289 ug/m3 compared to 3344 ug/m3 for “gas oil” and at 2350 rpm and fi.111 load 560 udm3 for SEE and 2405 q/m3 for “gas oil”. This work was conducted on a Petter BA2, DI diesel engine. Facilities were available for CO, CO,, and Bosch smoke number. Only 1 gallon of each fuel was available which restricted the number of test conditions. Test conditions used were 1500 rpm, no load; 2350 rpm, half load;, 2350 r-pm, full load.
Liotta and Montalvo (1992) used a 199 1 prototype Detroit Diesel series 60 engine installed on a transient capable test cell to study the effect of 8 oxygenates, one of which was methyl soyate. They showed that PM emissions are directly related to the concentration of oxygen in the fuel; higher oxygen results in lower PM. PM reductions are accompanied by small increases in NOx emissions. Addition of the oxygenate to the fuel reduces CO and HC emissions; non- regulated aldehyde and ketone emissions are also reduced with the addition of an oxygenate.
The composition of the PM from the 11 oxygenated fuels was compared with the reference fuel. The composition remained essentially unchanged. The amounts of several volatile aldehydes and ketones contained in the engine emissions were measured for each of the fuels. The aldehydes that were speciated and measured include formaldehyde, acctaldehyde, accolein, propionaldehyde, crontonaldehyde, hexanolaldehyde, isobutyraldehyde, and benzaldehyde. Two ketones, acetone, and methyl ethyl ketone were also measured. All of the oxygenated fuels, except for the fuel containing the aliphatic alcohol, had lower aldehyde and ketone emissions. Typically, total aldehydes and ketones were decreased 10 to 25 percent. However, in this study no data were taken for the methyl soyate.

The study of these papers dealing with emissions tests with vegetable oil fuels brings one to the conclusion that ethyl and methyl esters of vegetable oils are essentially similar to de&l fuel in their emissions characteristics. HC is reduced in some studies as much as 50 percent; CO is reduced by as much as 10 percent; NOx and PM are related and tend to change inversely with each other, differing from diesel by at most lo-15 percent. Generally, NOx was found to be slightly higher than diesel and PM slightly lower than diesel, although this differs with particular conditions. Even in this worst case, NOx was about 0.56 gm/miIe for Biodiesel and 0.48 gm/mile for diesel. The last note on the literature review is that of the approximately 20 papers reviewed, no two used the same protocol so as to be directly comparable.
Materials and Methods The emissions tests were conducted at the Los Angeles Metropolitan Transit Authority
(MTA) Emissions Testing Facility (ETF) located in Los Angeles, California. This facility has instrumentation to measure all regulated emissions: total hydrocarbons (HC), carbon monoxide (CO), carbon dioxide (CO,), nitrogen oxides (NOx), and particulate matter (I’M). The ETF provides quality assurance test results and calibrations in accordance with California Air Resources Board (GARB) quality assurance recommendations. (Dunlap, 1994). Chassis Dynamometer
The ETF is equipped with a Schenck Pegasus chassis dynamometer driven by a 600 horsepower (hp) direct current (DC) motor, a computerized control room, sophisticated emissions recovery capability, measurement and recording equipment, and various testing stations. The chassis dynamometer comprises a 72-inch diameter roller assembly connected to a DC motor and planetary gear box assembly. The complete assembly is suspended on flexible supports, facilitating measurement of the torque on the rollers. Test Cycles
Two test cycles were utilized for this test program. The first was a modified arterial cycle (arterial). The standard form event cycle was doubled, creating a 758 second, 8 event cycle. The arterial cycle, as used, has eight repetitions of accelerating to 40 mph and decelerating to 0 mph, Figure 1. The second was the EPA Dynamometer Driving Schedule for Heavy-Duty Vehicles (Code of Federal Regulations 40, Part 86, Appendix I, Cycle D), Figure 2. The EPA cycle has a total time of 1080 seconds. Road Load Simulation
In order to measure the emissions of a vehicle during operation, the actual driving conditions of the vehicle on the road must be simulated on the dynamometer. The dynamometer control system must simulate the force that would act on the vehicle if the vehicle were travelling on the road. This force, or Road Load (RL), is defined by the equation below. (Dunlap, 1994.)
RL = Fe + F, V + F2V” + Id”/& + mg sin (grad) where:
RL = Road Load (force at roller surface) Fo = CoefGient of friction force - independent of velocity
Fl = Coefficient of friction force - dependent on velocity
F2 = Coefficient of windage force (Drag coefficient) n = Velocity exponent V = Velocity at the roller surface I = Vehicle Inertia @yno inertia plus appropriate amount of inertia as simulated by
the control system)
10

dv/ dt = Acceleration m = Vehicle Mass
g = Acceleration due to gravity grad = Gradient in percent (%)
The EPA and Arterial test cycles do not include any gradients (uphill or downhill) therefore, the Road Load equation becomes:
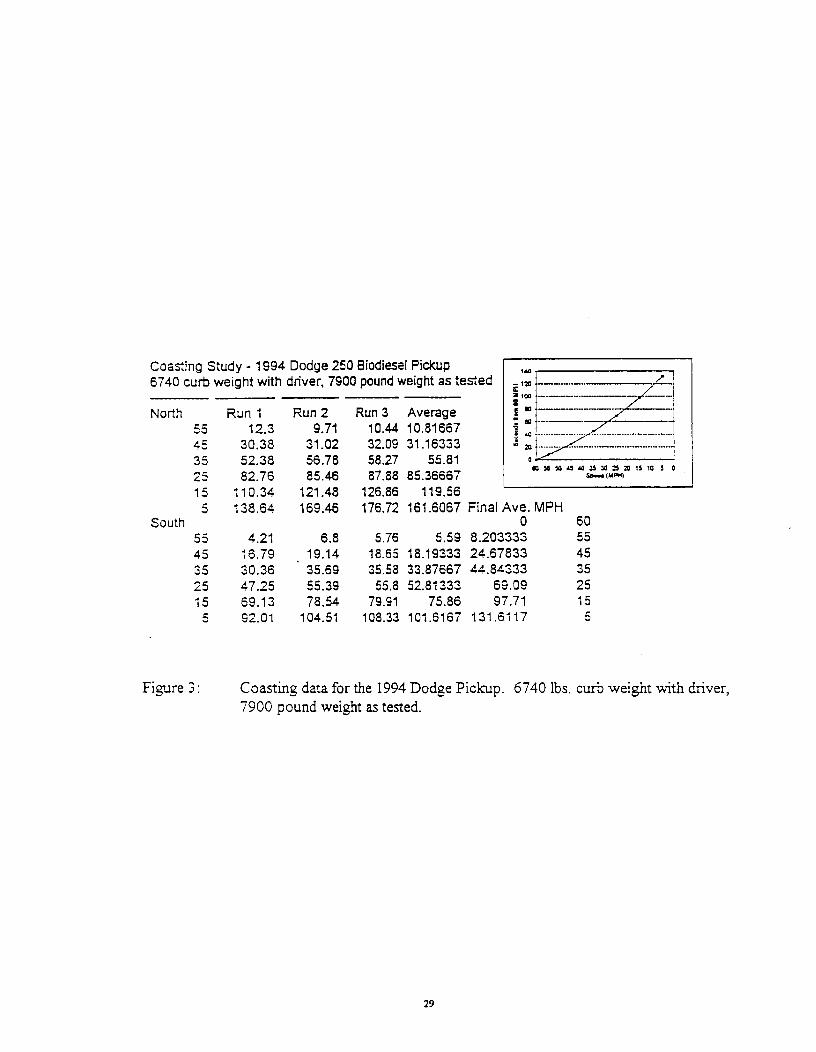
RL = F, + F,V + F,V” + p/d* To aid in the development of a set of coefficients, University of Idaho personnel conducted
a coast down evaluation of the test vehicle in Idaho prior to the scheduled ETF test date, Figure 3. Based on the coast down data, LA-MTA personnel developed a set of coefficients as a starting point for road load model development. Once the vehicle was installed on the dynamometer, coast downs were conducted and the model was refined to match the average on- road data. This refinement process was necessary to “factor out” the internal dynamometer resistance. The coefficients developed for this program are Fe = 50 lbs., F, = 0.84 lbs/mph, F, = 0.00009 lbs/mph* and I = 7,900 lbs. Fuels Tested
Fuels tested included: (1) Phillips D2 low-sulfur diesel control fuel (DIESEL); (2) 100 percent rape methyl ester (1OORME); (3) 100 percent rape ethyl ester (100REE); (4) 50 percent RME - 50 percent diesel (SORME); (5) 50% REE - 50% diesel (SOREE); (6) 20 percent RME - 80 percent diesel (20RME); (7) 20 percent REE - 80 % diesel (20REE); (8) an ester of waste hydrogenated soybean oil (HySee); (9) a blend of 80 percent diesel, 10 percent REE and 10 percent ethanol (3-CEE); (10) a blend of 90 percent REE and 10 percent ARC0 DTBG additive.
The RME and REE were produced in the Agricultural Engineering Laboratory at the University of Idaho. A complete set of fuel characterization data for each fuel tested is given in Table 1. Emissions Analyzers
Dunlap (1993) gives the following description of the test facility. The ETF’s analytical system is composed of seven emissions analyzers. The hydrocarbon (HC) analyzer uses the principle of hydrogen flame ionization to measure hydrocarbons, and includes a complete Heated Flame Ionization Detector (HFID). This analyzer offers proven reliability for diesel testing where high-boiling hydrocarbons are present.
Nitrogen oxides (NOx) are measured using a chemiluminescent analyzer which monitors the chemiluminescent reaction of ozone (0,) with nitric oxide (NO). This analyzer measures a wide range of NO and nitrogen dioxide (NO,) concentrations with negligible interference from other gas components. The analyzer is equipped with an ozone generator, which produces ozone for the reactions (0,) from oxygen, or air using an ultraviolet ozone generating method.
Carbon monoxide (CO) and Carbon dioxide (CO,) are measured using non-dispersive infrared (NDIR) detection. The ETF analytical bench is equipped with a total of four NDIR analyzers and is therefore able to measure both low and high concentrations of CO and CO,. The
11

analyzer that measures low CO concentrations incorporates a unique dual-detector optical bent to obtain high sensitivity and accuracy, even in the presence of water vapor, carbon dioxide, and other interfering gases, eliminating the need for chemical reagents and gas dryers to remove water vapor and CO, from the sample to analysis.
Oxygen (0,) concentrations are measured during raw, or non-dilute, testing using a magnetopneumatic sensing method. The analyzer provides an accurate and continuous determination of 0, with negligible interference from other gaseous components. Since current CARB testing protocol emphasizes dilute bag results, no raw testing was done on this test vehicle. (Dunlop, 1994) Test Vehicle
The vehicle tested was a 1994 Dodge pickup with a direct injected, turbocharged and intercooled, 5.9 liter Cummins diesel engine. The vehicle had accumulated 1500 miles on diesel and 2400 miles on rape ethyl ester at the time of this test. The vehicle was driven f?om Moscow, Idaho to Los Angeles, California on 100 percent REE fuel for testing. Weight used during the test and for coast down was 3590kg (7,900 pounds).
The engine was not modified in any way for use with the vegetable oil fuels. The fuel delivery system was modified for convenience of changing tiels between test runs. Fuel delivery and fuel return lines were broken and 3-way, manually operated valves were installed so that stub lines with quick couplers could be installed on one part of the 3-way valves. Individual 19 liter (5 gallon) fuel tanks were modified with fuel filter and flexible lines which could be connected to the 3-way valves. During normal operation, fuel is delivered and returned to the vehicle tank. During testing the valves were switched to the external lines to which the correct test fuel was connected. For the tests, the fuel filter assembly mounted on the engine was removed and replaced with an aluminum block with internal connecting ports. This change was necessary to minimize the amount of fuel in the system when a fuel switch was required.
Timed practice sessions with fuels of different colors showed that a minimum of 20 seconds was required for the return lines to be clear of the previous fuel. During actual testing, the return line was directed to a waste fuel tank while the engine was operated for 50 seconds at which time the return line was directed back into the test tie1 tank. The low standard deviations in emissions data between tests of the same fuel is indicative of the success of the procedure for changing fuels. Vehicle Installation
The test vehicle was installed on the chassis dynamometer in accordance with typical ETF practice. A total of seven sensors were installed but the fbel pressure sensor was not utilized due to a problem which occurred with the sensor fitting. The test sensor locations were at the oil filter adapter housing, boost pressure at manifold, exhaust temperature at tailpipe adapter, fuel pressure at pump inlet, coolant temperature, and inlet air temperature. Fuel Mass Flow Rate
Fuel use was determined by direct weighing. The fuel containers were placed on an electric scale accurate to the nearest .O 1 pound. Weight of fuel was read at the start and end of each test. In practice, this method had considerable error due to vibrations set up by running the truck because of the direct connection between the fuel tank on the scales , the fuel delivery and return lines and engine connections. Test Design
Two problems had to be overcome in developing a test design. The first was that the number of potential test runs was unpredictable. The test facility was scheduled for one week
12

during which time all testing had to be completed. The second hurdle was a tendency for emissions to vary with ambient conditions. A randomized block design with unequal sample numbers was developed. In this design the main fuels were randomized and tested first and tests of fuel blends were included in later tests in each block. The fuel test procedure is shown in Table 2. As it turned, out sufficient time was available to test each fuel and desired blend.
A Fisher’s Protected LSD analysis using SAS (Statistical Analysis System) was carried out on the data. Test Procedure
The test procedure was as follows: 1. The test fuel delivery tube was connected to the input lines and the return line was
connected to the waste tank. The engine was started and run for 50 seconds. 2. The engine was stopped and the return line was connected to the test fuel tank. 3. The engine was restarted and idled for approximately 10 minutes until the MTA
technicians were ready to run the test. 4. The vehicle was operated under load until the operating temperatures stabilized. 5. The test was started and the cycle completed. 6. While the technicians were taking data, weighing particulate filters, etc., the fuel was
switched to the next fuel to be tested. Tests were conducted on March 14-18, 1994. Twenty-six mod&xl arterial cycles and 13
EPA test cycles were completed. On one day, a shortage of gas for the flame ionization detector caused some delay and a need to replicate one run. Otherwise, the tests proceeded very smoothly and with very good reproducibility.
Presentation and Discussion of Results The summary data for each of the 26 Arterial tests, and 13 EPA tests are shown in Table 3.
Since a large amount of data was collected, only summary data is reported in this paper. It is anticipated that additional papers will be presented as more in-depth analysis, modal
summaries or correlations between test variables are completed. Modal data were archived every 1 second during the test. Average and total values were calculated for cycles, phases and overall. Thus the potential exists for additional analysis of test data. The data presented in Table 3 includes test number, cycle, fuel, HC, CO, CO,, NOx, PM and weight of fuel used.
Summaries of these data are shown in three ways. First, averages by arterial and EPA cycle for each fuel and for each of the regulated emissions are computed by Fisher’s Protected LSD. This technique makes adjustments for the unequal sample numbers.
Table 4 shows averages and standard deviations for each parameter and fuel for the arterial cycle. Table 5 shows the averages and standard deviations for the EPA cycle. Table 6 is the same data for both cycles combined. These tables show the Fisher’s Protected LSD for each parameter. The numbers shown in the right hand side of the table are probabilities. A number less than 0.10 would indicate significance at the 90 percent probability level, and a number less than 0.05 would indicate significant difference at the 95 percent probability level. A significance test for days of test shows that the EPA cycle is significantly different from the arterial cycle for all parameters measured (not shown). All of the regulated emissions were higher for the EPA cycle than for the arterial cycle. This is probably due tothe increased idling time and non- repetative nature of the EPA cycle.
A second presentation of the data is graphical. Figures 4-13 show the data for each test parameter. The data shows 100 percent diesel to 100 percent vegetable oil as the ordinate and
13

emissions parameter reported in g&mile as the abscissa. Figures 14-16 show a summary of the data with CO and CO, plotted together on one graph, and HC and NOx on a second graph and PM on a third graph.
These data show similar trends for all fuels with a slight reduction in CO and NOx for ethyl ester compared to methyl ester. They also show a significant reduction in HC, CO, and NOx as percent of vegetable oil is increased and a non-signifkant increase in PM. The PM data had the most variability of the data and an e xamination of the raw data shows that there is scatter sufficient to neutralize differences.
The third presentation of the data are tables 7-12, showing the percent change in the emissions compared to the diesel control fuel for ethyl and methyl ester of rapeseed oil for arterial and EPA cycles and over-all averages. Tables 13- 15 compare REE and RME for both cycles and overall averages. These tables show that HC and CO were reduced approximately 50 percent by using rapeseed esters. CO, increased by an amount indicative of the reduction in CO while no significant change in PM was detected although the trend was lowered PM at the 20 percent vegetable oil ester and increased PM at the 100 percent fuel mixture.
Other researchers have indicated that NOx and PM are inversely related, and that may explain the apparent difference in results Tom these tests. It has more generally been found that the esters increase NOx and decrease PM, however in these tests, generally speaking, the reverse was true. One might speculate that this trend is due to the fatty acid constituents of rapeseed esters tested or that it is a characteristic of this particular engine. In either case, the result was consistent for both methyl and ethyl ester and for both cycles tested. Ethyl ester at the 100 percent and 50 percent level were lower in NOx than methyl ester.
Repeatability for HC, CO, CO, and NOx was very good. When one experiments with a number of fuels on a limited budget, setting ip a test procedure is extremely critical. It would have been more desirable to have replicated each Abel two or three times in succession and to have replicated each fuel in time in random fashion as well. However, time did not allow this luxury. As a compromise, each fuel was tested in random fashion in time and then during one block, fuels were tested in succession. The data show that the test procedure was successfkl in preventing mixing of fuels and that the previous fuel did not effect the outcome of the succeeding fUe1.
Conclusions Specific conclusions of this study are: 1. HC was reduced by 52.4 percent when 100 percent vegetable oil fiel was compared
to low sulfbr diesel control Abel. 2. CO was reduced by 47.6 percent when 100 percent vegetable oil fuel was compared
to low sulfk diesel control fuel. 3. CO, increased by 0.9 percent when 100 percent vegetable oil tie1 was compared to
low sufir diesel control fkel. 4. NOx was reduced by 10.0 percent when 100 percent vegetable oil fuel was
compared to low sulfk diesel control fuel. 5. PM increased by 9.9 percent when 100 percent vegetable oil fuel was compared to
low sulfk diesel control fiel; however, this difference was statistically non- significant. PM was the lone parameter that had variations sufficient to make differences non-significant. The result is in harmony with the literature, which reports a trade-off between PM and NOx.
6. In these tests, 100 percent REE reduced HC (8.7 percent), CO (4.3 percent) and
14

7. NOx (3.4 percent) compared to 100 percent RME. Absolute value of emissions data were higher for the EPA Cycle than for the arterial cycle. HC increased from 0.57 to 0.87 gm/mile; CO from 2.34 to 2.865 gm/mile; CO, from 657.8 to 703.8 gm/mile; NOx from 5.88 to 6.41 gm/mile and PM from 0.305 to 0.44 gm/mile.
Acknowledgements The authors wish to acknowledge the cooperation of Lauren Dunlap, Ray Wilson and
Harvey Porter at the LA-MTA who actually conducted the emissions tests, Dale Everson, Professor of Statistics at the University of Idaho for his assistance with the statistical design and analysis, and Craig Chase, a consultant to DOE and the PNW and Alaska Regional Bioenergy Program for his encouragement during this work and for finding the financial support. Work on this project was supported in part by the PNW and Alaska Regional Bioenergy Project, Project Number DE-B179-93BP09233, The Idaho Department of Water Resources, Energy Division, Project No. DWR92-03-81-102-6, and USDA-CSRS Specific Cooperative Agreement 58-6602- 2-014.
15

References
AK&o, %&atone, Maddalena Auriemman, Giuseppe Police and Maria Vittoria. 1993. The Effect of Methyl-Ester of Rapeseed Oil on Combustion and Emissions of DI Diesel Engines. SAE Technical Paper Series 932801. SAE, Warrendale, PA 15096-0001.
Cho, H. K., Smith, R J., and Marley, S. J. 1988. System Identification of a Diesel Engine: Throttle- Smoke Response. ASAE paper no. 88-1563, ASAE, St. Joseph, MI.
Clark, S. J., L. Wagner, M. D. S&rock and P. G. Piennar. 1984. Methyl and Ethyl Soybean Esters and Renewable Fuels for Diesel Engines. JAOCS 61(10):1632-1638.
Dunlap, Lauren S., Vice Pellegrin, Randal Ikeda, Ray Wilson, Sylvia Stanley and Harvey Porter. 1993. Chassis Dynamometer Emissions Testing Results for Diesel and Alternative-Fueled Transit Buses. SAE Technical Paper Series 93 1783. SAE, Warrendale, PA 15096-0001.
Dunlap, Lauren. 1994. Final Report to University of Idaho for Emissions Testing Conducted on Biodiesel Fueled Pickup Truck. Los Angeles County Metropolitan Transit Authority Emissions Testing Facility, Los Angeles CA.
Energy Information Administration. 1989. Sales of Fuel Oil and Kerosene in 1989. EDOE/EIA, Washington, D.C.
Feldman, M. 1991. Optimization of a Direct Injection Diesel Engine for Operation on Wmter Rape Methyl Ester. Unpublished M.S. thesis, University of Idaho, Moscow, ID 83844
Geyer, S. M., M. J. Jacobus and S. S. Lestz. 1984. Comparison of Diesel Engine Performance and Emissions from Neat and Transesterified Vegetable Oils. Transactions of the ASAE 27(2):375- 381.
Goetz, Wendel. 1993. Evaluation of Methyl Soyate/Diesel Blend in a DDC 6V-92TA Engine: Optimization of NOx Emissions. Addendum to Final Report 93-E14-21. Ortech International, Mississaga, Ontario.
Holmberg, William C. and James E. Peeples. 1994. Biodiesel, A Technology, Performance and Regulatory Overview. National Soydiesel Development Board, Jefferson City, MO.
Huehn, W., and Sauerteig, J. E. 1989. The New Deutz Particulate Trap System for Trucks and Buses. SAE Technical Paper series no. 902075.
Humke, A. L. and N. J. Barsic. 198 1. Performance and Emissions Characteristics of a Naturally Aspirated Diesel Engine with Vegetable Oil Fuels - Part 2. SAE Technical Paper 810955, SAE Warrendale, PA 15096-000 I.

Humphrey, J. Kevin and Leon G. Schumacher. 1994. Review of Literature Related to Fueling Used Engines with Methyl Ester of Soybean Oil. Project Report for the American Soybean Association, St. Louis, MO.
Ishii, Yukitsugu and Ryuzo Takeuchi. 1987. Transesterified Curcas Oil Blends for Farm Diesel Engines. Transactions of ASAE 30(3):605-609.
Liotta, Frank J. jr. and Daniel M. Montalvo. 1992. The Effect of Oxygenated Fuels on Emissions from a Modem Heavy-Duty Diesel Engine. SAE Technical Paper 932734, SAE, Warrendale, PA 15096-0001.
Manicom, Brian, Chris Green and Wendel Goetz. 1993. Methyl Soyate Evaluation of Various Diesel Blends in a DDC 6V-92 TA Engine. Final Report No. 93-E14-21 to Fosseen Manufacturing and Development, Ortech International, Mississaiga. Ontario.
Marshall, William F. 1993. Biodiesel, Commercialization of a Renewable Fuel. Technical Report No. 1 prepared for the U.S. D.O. E. and NSDB. National Institute for Petroleum and Energy Research, Bartlesvihe, OK.
Marshall, W. F. 1993. Biodiesel, Commercialization of a Renewable Fuel. IIT Research Institute, National Institute for Petroleum and Energy Research, Bartlesville, OK. (Report prepared for U.S. Department of Energy, Energy Efficiency and Renewable Fuels, Washington, DC.)
Mills, G. A. and Howard, A. G. 1983. Preliminary Investigation of Polynuclear Aromatic Hydrocarbon Emissions from a Diesel Engine Operating on Vegetable Oil-based Alternative Fuels.
Mittelbach, Martin, Peter T&hart and Hans Junek. 1985. Diesel Fuel Derived from Vegetable Oils, ILEmission Tests Using Rape Oil Methyl Ester. Energy in Agriculture 4:207-215. Elsevier Science Publisher, Amsterdam.
Mittelbach, Martin and Peter Tritthart. 1988. Diesel Fuel Derived from Vegetable Oils, II. Emission Tests Using Methyl Esters of Used Frying Oil. JAOCS 65(7):1185-l 187.
Muryama, Tadashi, Young-taig Oh, Noboru Miyamoto, Takemi Chikahisa, Nobukazu Takagi and Koichiro Itow. 1984. Low Carbon Flower Buildup, Low Smoke and Efficient Diesel Operation with Vegetable Oils by Conversion to Mono-Esters and Blending with Diesel Oil or Alcohols. SAE Technical Paper 84 116 1. SAE, Warrendale, PA 1096-000 1.
Reece, Dar-y1 L. and Charles L. Peterson. 1993. A Report on the Idaho On-Road Vehicle Test with RME and Neat Rapeseed Oil as an Alternative to Diesel Fuel. ASAE paper no. 93-5018.
ASAE, St. Joseph, MI.
Shall, Kyle W. and Spencer C. Sorenson. 1993. Combustion of Soybean Oil Methyl Ester in a Direct Injection Diesel Engine. SAE Technical Paper 930934, SAE, Warrendale, PA 15096-0001.
17

Schumacher, L. G., Borgelt, S. C., Hires, W. G., and Humphrey, J. K. 1993. Biodiesel on the Road - A Report from Missouri. ASAE paper No. 93-5017. ASAE, St. Joseph, MI
Schumacher, L. G., S. C. Borgelt, W. G. Hines, C. Spurling, J. K. Humphrey and J. Fink. 1993. Fueling Diesel Engines with Esterified Soybean Oil - Project Update. ASAE Paper No. MC93-101, ASAE, St. Joseph, MI 490859659.
Schumaker, Leon G., Wiiiarn G. Hires, Steven C. Borgelt. Fueling Diesel Engine with Methyl-Ester of Soybean Oil. Department of Agricultural Engineering, University of Missouri, Columbia, MO.
S tansvaag, John-Mark, Oren C. N. 1993. Clean Air Act: Law and Practice
Vander Griend, L., M. Feldman and C. L. Peterson. 1988. Modeling Combustion of Alternate Fuels in a DI Diesel Engine using KJVA. Transactions of the ASAE, ASAE, St. Joseph, MI.
Wagner, Larry E., Stanley J. Clark and Mark D. S&rock. 1985. Effects of Soybean Oil Ester on the Performance, Lubricating Oil and Wear of Diesel Engines. SAE Technical Paper 841385. SAE, Warrendale, PA 15096-0001.
Xiao, Yun. 1993. Report to the National SoyDiesel Development Board, Jefferson City, Missouri 65110.
Zhang, Q., M. Feldman and C. L. Peterson. 1988. Diesel Engine Durability when fueled with Methyl Ester of Winter Rapeseed Oil. ASAE paper 88-1562. ASAE, St. Joseph, MJ.
Zubik, J., SC. Sorenson and C. E. Goering. 1984. Diesel Engine Combustion of Sunflower Oil Fuels. Transactions of the ASAE, ASAE, St. Joseph, MI.
Zubik, J. S. C. Sorenson and C. E. Goering. 1984. Diesel Engine Combustion of Sunflower Oil Fuels. Transactions of ASAE 27:1252-1256.
18

Table 1 - Fuel Characterization Data
1 1 D2 1 RME 150% RMEj20% RMEl REE 150% REE~O”h REE
F hei SDecific ProDerties Specific Gravity, 60160 1 0.8495 1 0.8802 1 0.8632 1 0.854 1 0.876 1 0.862 1 0.8535 viscosity CS@4O"C 2.98 5.65 3.9 3.1 1 6.17 4.06 3.2 Cloud Point “C -12 0 -7 -12 -2 -9 -12 Pour Point “C -16 -15 -15 -15 -10 -13 -15
IFlash Point. PMCC. “C I 74 I 179 85 82 124 79 79 -Ire romr -c, I ( nn 00 I 1 -Y.,l LIU 1 *4c II0 I ( At-t-7 I”L , 491 IWL ( 127 99 >-:I:-” r¶#s:-+ OP I 101 i 7A7 1 7130 1 1QA 1 771 1 qnA 311
Al” LULt L 13
--- -.--- -.;;5 <0.005 co.005 co.005 08 1 0.07 0.08 0.1 0.07 0.12 102 1 0.002 0 0 0 0 117 1 0076 0.035 ( 0.012 0.024 0.033
I -- 51.4 1 59.7 54.2 50.7
( IJI ( v-r, ( L"Q ,
Waterand Sediment % Vol. 1<0.005 1 <O.nnf; 1 <n f1c-15 1 <d Carbon Residue % wi Ash %ti
Sulfur %wt ICetane Number
0.16 0.1 0.002 0.c 0.036 O.L., , _.__-
I !=l!i I 49.2 I 61.8 Combustion MJ/kg
L
Gross 1 45.42 1 40.54 1 42.1 Net ) 42~~- ---- .-
Corrosion ‘cher Water, ppm I
38 44.54 40.51 42.94 44.64, 37.77 40.18 41.81 37.82 40.08 41.94
1A 1A 1A 1A 1A 1A 757 288 153 ( 757 308 200
Patiiculate Matter, mg/L Total 0.9 ( 1 ( 1.1 1 1 1 1.4 1 1.1 Non-Combustible co.1 co.1 co. 1 co. 1 eo.1 co. 1 co. 1
Elemental Analysis Nitroaen. oom 16 I I 11 I Carbon, ‘% 86.67 78.7 82.75 ) 84.76 1 78.11 ( 82.07 84.73 Hydrogen, % 12.98 12.66 12.75 12.89 1 12.66 13.49 12.73 Oxygen % (by difference) 0.33 9.22 4.47 2.35 ( 9.22 4.42 2.51
Iodine Number 8.6 91.9 54.2 24.5 ) 91.9 52.6 24.3
IEster SDecific Properties) RME 1 REE 1 IPercent Esterified 1 98.02 1 94.75 t Acid Value
Total Glvcerine %wt I 0.86 0.93 tFree Fattv Acids %wt 0.57 1 0.58 t
-..- .-.- -.-
--- c (l&l\ 1 12.6 1 12.8 1
Nervonic (24:l) ) 0.9 ) 0.9 1
19

Table 2
Test Plan for Emissions Tests
Arterial Cycle
Block 1:
Block 2:
Block 3:
Block 4:
Block 5:
EPA Cycle
Block 6:
Block 7:
100% REE
100% Diesel
20% REE
50% REE
100% Diesel
100% Diesel
100% REE
20% REE
Fuel B
50% RME
100% REE
100% REE
100% RME
20% RME
100% Diesel
100% Diesel
100% REE
20% RME
Fuel A
100% RME
100% REE
100% Diesel
Fuel B
100% Diesel
100% Diesel
100% RME
20% REE
Fuel C
100% RME
100% RME
50% RME
Fuel A
100% RME
20% RME
50% REE
100% RME
100% Diesel
100% REE
50% REE
20

Table 3 SUMMARY DATA
Air Tern
Date Cycle Test # Fuel HC co NOx cot PM Distance Astart **MM**** AA--* AA-A** AA M-A *-AA* AAAAAAAAAA ****-Au AIIAAIIIU - --
March 16 Arterial 941 100REE 0.279 1.74
Arterial 942 lOOD2 0.823 3.33
Arterial 943 100RME 0.326 1.83
Arterial 944 lOOD2 0.757 3.2
Arlerial 945 IOOREE 0.311 1.64
Anerial 946 IOORME 0.309 1.73
Arferial 947 ZOREE 0.643 2.34 Arterial 948 ZORME 0.649 2.35
Arterial 949 SORME 0.512 2.01 Arterial 950 SOREE 0.542 1.79
X Arterial 951 HySee 0.36 1.69 X Arterial 952 HySee 0.373 1.73
Arterial 953 lOOD2 0.751 2.9 March17 Arterial 954 100DZ 0.961 3.8
Arterial 955 1OORMk 0.413 2.03
ARerial 956 100RME 0.43 1.99
Arterial 957 1OOREE 0.366 1.6 Arterial 958 1OOREE 0.375 1.76
Arterial 959 20REE 0.694 2.41
Arterial 960 lOOD2 0.649 3.2 Arterial 961 20RME 0.581 2.55
X Aaerial 962 3CEE 1.268 5.06 x A;terial 963 3CEE 1.341 5.12
Arterial 964 50REC 0.54 1.9 Arterial 965 SORME 0.534 1.96
Arterial 966 10002 0.837 3.24
March ;a E.?A 967 100REE E.?A 966 10002 E?A 969 1OORME E'A 970 1OOREE E?A 971 100RME
E=A 972 10002
ETA 973 1OORME March 19 974 TRACE
E.?A 975 ZORME -Z,?A 976 ZOREE
:='A 977 100REE :>'A 978 1OODZ
x E=A 979 90/10 :=A 980 SORE:
0.601 2.22 6.06 716.38 0 4742 5.562 ai 98.9 80.1 101.2 1.316 4.69 6.75 693.56 0.4467 5.562 86.7 102.2 90.5 105.2
0.689 2.11 6.22 697.72 0.5609 5.556 92.2 109 93.6 113.1
0.596 1.97 5.95 69782 0.5046 5.556 96.6 110.9 1044 121.1
0.631 2.06 6 Cl 710.79 O.C637 5.553 99.7 1098 96.2 1?5.6
1.228 4.37 6.9 702.79 O.&l16 5.547 95.6 110.7 100.6 li6.9
0.529 2.08 6.31 703.16 0.5064 5.5541 96 110 104 118
l.OCZ 3 07
1 r21 2.92
0.576 2.13
1.215 4.43
0.624 2.32
0.634 2.23
5.61
6.27 5.78
6.21
5.53
5.73
6.03 6.11
59 5.72
5.35
5.26
6.19 6.2
5.59 5.54
5.49 5.46
5.92
6.25
6.02 6.06
6.06
5.71
5.9 6.25
6.6 709.13 0 353 5.544
6.44 706.18 0.3856 5.551 6.03 70492 0.4622 5.562
6.9 699.39 0.3747 5.553 6.08 704.09 0.4659 5.552
665.76 0.2913
654.91 0.305
655.32 0.323
646.75 0.2364
652.53 0.1709
655.59 0.1553
654.41 0.2742
654.16 0.2476
656.86 0.2957
659.5 0.3215
655.9 0.3364
652.44 0.32
651.32 0.2636
657.91 0.3666
656.47 0.3886
657.38 0.4181
658.1 0.3624
656.03 0.3749
652.45 0.2974
649.23 0.3124
649.11 0.2917 653.13 0.3666
652.21 0 3779
655.43 0.3529
653.6 0.3522
650.16 0.3213
4.946 76.6 97.2 60.1 97.3 4.943 87.3 loo.8 65.2 99.8 4.925 90.4 103.7 al.4 99.4 4.925 93.3 106 98.3 111.5 4.929 94.3 107.2 95.8 114.2 4.921 96.5 107.7 96.6 11.2
4.921 94.6 111.3 90.5 110.8 4.916 100.2 113.8 66.8 110.2 4.916 100.3 114.3 66.5 111 4.936 102.7 119.8 100.1 117.9 4.936 106 118.6 104.2 125 4.932 106.5 117.2 122 133.1
4.897 106.2 116.8 109.8 125.1 4.919 62.8 95.6 94.5 108.5
4.915 86.5 97.9 64.5 103.1
4.922 85.6 98.4 101 li1.9
4.904 66 101.3 85.5 105
4.911 90 102.9 105.4 117
4.916 91.9 104.7 93.7 111.9
4.91 93.6 108.4 87.9 106.9
4.909 96.3 107.4 85.2 108.2
4.926 92.4 106.6 69.7 i07.4
4.916 97.7 111.3 109.1 120.1
4.927 100 111.3 93 114.2
4.91 102.7 112.9 96.3 116.1 4.913 99.2 109.4 105.7 116.4
90.5 102.7 91.4 109 91.0 112.2 91.4 104.5
94.6 115.4 91.5 104.7
94.3 116.5 94.2 106.3
104 125.1 93.6 111.1
97.6 116.8 98.9 113.6 6.31 698.32 0.4275 5.552
21

FUEL
FUEL
FUEL
10002 IOOREE 1OORHE ZOREE
:g:EE 5mnE
FUEL
1ooclt 1OOREE 1OORHE ZOR EE
Zg;;;g so&
FUEL
FUEL
10002 1OOREE 1OORME ZOREE ZURflE
EZ
Table 4 Arterial Cycle Summary with Statistics from Fisher’s Protected LSD.
LS& so
0.83300000 0.08339704 0.33275000 0.04565355 0.37000000 0.06037107 0.66850000 0.03606245 0.66500000 C.02262742 0.54100000 0.0014142I 0~52300000 0.01555635
L&NO so
3 -27833333 0.29383102 1.735oaooo o.Obao6a59 1.89500000 2.37500000 0.13988090 2.45000000 0.04949747 1.84500000 0.14142136 1.99500000 0.07778175
0.d.2121320
NOX LSHEAN so
O-03250641 g:::;;:;:: 0.05909c33 5.66000000 0.11343133 5.97500000 0.07771175 6.06500000 5.715oooaa
0.06363961 0.00707107
5.9uooooou c.~uoooouo
CO2 LSHEAN SO
651.713333 658.105000 656.190000
4.04935880 5.59718084
653.430000 651 .b35000
0.93298803 I.38592929 657r465000 3.57088924 b5b-24~~oo 2.871924&~
3.7335~~~1:
LSME:; so
0.30091667 0.30487500
C. 04564727
0.32125000 0.09839929 0.11755624
0.28580000 U.0164C488 0.26975000 U.03104199 0.33720000 'J.02220215 0.32395000 O.Oj995153
WEIGHT LSMAN SO
1.86666667 2.14500000
O.OS316641
1.93500000 0.05259911
1.79000000 o.33oooouo 0.6363961C
L.86000000 O.U8485281 2.01000000 1.96UOOOOO
0.01414214 0.08485281
MPG L SHEAN so
L8.6651633 lb.7685775
0.56502791 0.35241446
19.1692950 20.075UUUO
3.94049681
18.8250000 7.403408UU
17.6515650 0.84145707
18.0600000 0.11535033 0.76367532
.WJ> ITILHO: LSflsANLI I=L~MANlJJ 4 5 6 7
“0:;;;: 0: ooc3
K%: 0:0001
4 5 6
E%: o.ouo1 ;- “ogy:
o.oout
u:oi)49 a:6504
xl: a:0065
0:0027 O.UO.27
0.01s9 013816
;yJ> lTIIHO: LSHSANI I J=L;HEAN(J) 4 5 6
: 0:0001 O.OJOI 0. coo1 U.COCl 0.0c.22 u.0001
a O.OCtl 0:0336 U.OOCl G.OOC1
C:JGUl O.UOCl
c. UG@L 0: 063Y
‘;TJ> lTl*~o: LSH;AN(I)=L;MEANIJI 4 7 5 6
1 . f 0.0221 00:005::
0:4933
“,-z,‘:f 0.1718
:
“o%z
;-:::4” 014216
13. E7
c: 0.6482 1534
izE2 al4775
a:7079
0: 648:
3.50a2 0.?123 ;:l522 0.25LY
0.4775 C-2515
0: 7555
0.1550 .
;yJ> ITl*HO: LSH$AN( I I=L;FIEANLJ i 4 5 6 7
: 0:YLlb 0.9116 a.57c5 ; 0.7378 0.5705 016750 0.6753
5 0.4930 a.6957
6 0.4668
u:4t2:
0.4262 0.5025 7 0.611J C.bYC7
x:: -. d.5550
;yJ’ tTilHO: LSH;ANllJ=L$HEAN(JJ 4 5 6
: o:oa51 0.0851 O.CSbZ 0.b927 0.9725
‘4 0.6562 0.6927 5
012227 0. 0.9725 LJGO
c.71s4 0.1792 “o+;$ c:7154
6 7
U.4632 0".::;; 0.7680 C-3605
0.5256 C.63C9 03374d
;::h:$ WE
. o:e33u
‘;TJ’ iTtlHO: LSC~ANW=L~HEANIJ) 4 5 b
7
0.6309 0.3742 0.9030 0.4771 0.6740 0.8330
.
22

FUEL
10002 1OOREE LOOAHE
%E SOAiL
FUEL
10002 AOOREE lOORP!E ZOREE
%;EE
FUEL
FUEL
10002 lOORE E 1OORflE
%RRf$ SOREE
FUEL
10002 1OOREE 1OORHE
ZZOOK~ SOREE
FUEL
FUEL
10002 1OOREE 1OORHE ZOREE
x!EE
Table 5 EPA Cycle Summary with Statistics from Fisher’s Protected LSD
L WEAHNC so ;R/J> ITIIHO: LSH;AhtlI=L;HEAN[JI
4 5
1.2468 7500 0.58487500 0.0560921q 0.03407834 0.01365040 0.0001 0.0001 0.0075 0.0052 0.62929167 i.04L37500 . 4
1.02237500 . U.85437500 5 O.OC52 . 6 o.ouo4
LSHE% SO
4.49125000 0.17UO98OL 2.10125000 0.1266226O 2.Ub708333 U.0251bbLl 2.93625000 . 3.08625000 . 2.24625000 .
NOX LSMEAN SO
6.85833333 6.02166667
0.08660254 0.05686241
b-33833333 0 .OY504385 6.41500000 . 6.57500000 - 6.20500000
co2 LSMEAN SD
699.416250 706.076250
4.6680081
703.398750 700.671250
lo.4426625 6.5655004 .
709 -621250 . 698.811250
L SHEi:: SO
o-45419533 0.03600375 O-47352917 0.021~5528 0.48992083 0.048725L3 0.40601250 . O-37341250 0.44791250 :
WEIGHT LSHEAH SO
2.36250000 0.011547OL 2.52250000 0.33605555 2.70083333 o-06110101 2.3725OOO0 . 2.29250000 2.31250000 :
HPG LSHEAN so
0.06377361 2.35155041 0.37074076
.
.
.
‘;;J’ iT IIHO: LSH~AKIIl=L~MEAN(Jl 4 5
li- :::z o:oc33 0.4645
0:0068
‘;FJ> ITIIHo: LSM$ANf I I=L~MEAN(JI - 4
: 0:0001 C.OOCL 0. coo9
3 0.0009 o.tu77 [email protected]
; ;-gt;t c:5590 o:55da
b 010034 U-0618 u. 1115 o-t022
012411 0.3253
t/RJ> ITIIHO: LSM’$ANI I I=L$HEA&IJI 4
t 0:2bE5 0.2685 0.5203
0.6500 0.3839 0.0739
;yJ> ITI1~O: LS~~ANII)=L;PEAN(JI 4
PR > illlHO l/J
: LSMSANI II=L;MEAhlJI 4
c-3390 0.089U 0.9683 0.3174 ;.jm~
012746 : 0.1877 0.7726 0 -2066 0.8281
lJJJ> ITIIHO: LSfl~AtW=L$MEANIJ) - 4
i 0:755a 0.7550
: - 5oa% t.5000 O-8548
3 0.2089 0:3093 : 0.4336 4 0.9880 0.8548 0.4336
5
u-0495 C.OO4J
;-;;:y .
C:O609
5
0.5243 0.6766
13%01: .
c:r910
5
Y!- x 0: Ld77 0.7726
c:s4.?2
5
0.7835 z-m 0:7913
c:f3a34
6
6
C-Y721 0.4860 0.7183 c-4405 0.4507
.
6
0.3758 0.5937
:-x o:r91o
.
6
23

Table 6 Combined Cycie Summary with Statistics from Fisher’s Protected LSD
FUEL
10002 1OOKEE 1OORHE 2OREE
g;:: 5mni
FUEL
.FUEL
10002 IOOREE lOOKHE 2017 EE ZORHE 50REE 50RUE
FUEL
FUEL
FUEL
10002 1OOREE
:Ew
:“,;:: 50RH;
FUEL
.WfAN(I I=L:PEANIJI 4 5 6 7
L&Et: ‘;YJ’ lTIIHO: LSHSANi
0. COCI 0.5489
o:co34
:-x O:i279
c. 0001 o.oco2
“0. :“4t: .
c: 003’9 C-0736
0.0001 0.0001 u-4985 0.1112
tx::: 3:0(139
i-:::z 0:0736 0.3606 C:j6tib .
;“/” irl HO: LSM~Ahlll=L~MEANlJI 1 - 4
NOX LSIIEAN 5
O.OOCb “o-“oyq
U,:JS;iS
c:u001 6.0252
8%: 0:00c1
co2 LSMAN
;TJ’ ITilHO: LSH~ANIIl=L~HEANLJl 4
675.513450 682.631004 680.333054 679.629024 670.749024 67Y.032350 680.602050 a: 1534
WJ> :Tl HO: 1
LSf’:AN(l )=L$HEAN (‘I 4 5
:- 2;: u: 0601 i. 5803
0:ou 1Y 0.1777
6 7
x:: u:Ybts
Etg’ .
0:83aO
0.3627
fmf: 3:37>2 u. 1777 o.a3do
0.35650744 0.38518455 O-)9844271 13.35189467 U.33032800 0.40012aUO 0.39108774
0:2397
28089% 0:42X 0.1872 0.3627 .
HEIGHT LSHEAN 5
c. 9 75 7 0.1404 C-2842 0.9092
c: 5444 0.5895
2.11092573 2.33563902 2.21700333 2.08645804 2.10645804 2.21312471 2.21442643
c. EC74
“cm:::: .
.C:9072
x3: .
HPC L SHEAN
pJ’ lTllHO : LSH;ANW=L;!4EANIJ) 4
4 0.3096 0.309t fp~ p-‘,3 3 pm: fp; : a:33i6
2 a:9219 0:4Lo9 0.334t 0.7805 0: 5339
6 0.7019 0.7164 O-Et57 0.3c57 7 0.7139 0.7802 0. E531 0.3549
5
XIigY c:-recs c. 5339
c:b87Y c. rtija
19.0207631 Il. 82 73QQU 17.05t)t565 16.9907192
24

Tables 7-10
Percent changes in emissions compared to die& control fuel for ethyl and methyl ester of rapeseed oil for Arterial and EPA cycles.
Table 7
* Numbers foUowed by an * are signihntiy ditkezt from diesel @-0.05).
Table 8
hterial Emissions Percent Increase(+) Cycle or Decrease (-) Compared to
Diesel Control Fuel
Dicwl
Cmml Fuel
HC 1 -20.2* ( -37.2* 1 -55.6*
co -25.3* I -39.1* -42.2’
NOx 1 -2.6* I -5.3* I -9.1’
co2 I 0 I to.7 1 +0.7*
I PM ( -10.4 1 +7.6 1 c6.8
* Numbers followed by an l are significantly diETered hm diesel (p4.05).
Table 9
EPA Cycle
Emissions Percent Increase(+) or Decrease (-) Compared to diesel Control Fuel
P- of RMEin Diexl CamI Fd
20% 50% 100% REE REE REE
1 HC I -16.5* I -31.5* I -53.1*
* Numbers followed by an * are significantly different from diesel (p-+0.05).
EPA Cycle
HC
co
NOx
co2
PM
Table 10
Emissions Percent Increase(+) or Decrease (-) Compared to
Diesel Control Fuel
20% 50% 100% FWE RME KME
-18.0 -49.5
-31.3 -54.0
4.1 -7.6
+1.6 +0.7
+7.6 +21.2
a Numbers followed by an * are siguihntly diEsrent from diesel (p4.05).
25

Tables 1 l-12
Percent changes in emissions compared to diesel control fuel for ethyl and methyl ester of rapeseed oil combined for both Arterial and EPA cycles.
Table 1 I
Emissions Percent Increase(+) Combind
Cycles or Decreze (-) Compared to
Diesel Control Fuel
HC -18.0’ -32.3* -54.6*
co -3o.o* -45.5* -48.8*
NOX -4.6* -7.9* -11.6*
COT to.5 +0.6 +1.1
PM -1.3 I +1.2 I +8.0 I
l Numbers followed by an * are si~giiican~Iy dEerent from diesel (pc=O.O5).
Table 12
Emissions Percent Increase(+) Cornbind
Cycles or Decrease (-) Compared so
Diesel Control Fuel
HC -18.8* -33.2* -50.3 *
co -27.4* -39.4* 16.5*
NOX -2.9* -5.3* -8.5*
co, +0.5 +0.7 +0.7
PM -7.3 i9.7 1 t11.8 (
* Numbers followed bg an l are sipificanrly d.Serent kom diesel @+O.Oj).
26

Tabies 13-15
Percent changes in emissions of REE compared to RME
Table 13 Table 15
Arterial Cycle
Emissions Percent Increase(+) or Decrease (-) Compared to
RME of the same blend
( NOx ( -1.5 [ -;.I+ 1 -2.3* 1
l Numbers followed by an l are signScantly dSerent @+O.OS).
Table 14
E3.4 Cycle
Emissions Percent Increase(+) or Decrease (-) Compared to
RME of the same blend
Voiume ?z?cc?r d
20% 50% 100%
Em RJZE REE REE DlcwI Lnmi Fuel
I HC I +1.9 I 1 -7.1 1
I co I 1.9 I I +1.7 I
* Numbers foilowed by an * are significantly
diEerent (p-0.05).
Emissions Percent Increase(+) Combiid
Cycles or Decrease (-) Compared to RME of the same blend
co
NOx
(32
I PM
-3.6 -9.9 -4.3
-1.7 -2.s* -3.4*
-0.1 -0.2 “0.3
~6.5 +2.j -3.3
* Numbers followed by an * are significantly diEerent (p-0.05).
27

40
35
T3Q ii I z2q
-
160 zoo 300 400 500 600 Time (SEC)
Figure 1 Modified Arterial Phase
760
--
b” I
10
0 d 200 400 600 -
Time (SEC)
800
1
I, I 1000 1200
Figure 2 EPA Cycie
28
Coasking Study - 1994 Dodge 250 Biodiesel Pickup
6740 curb weight with driver, 7900 pound weight as tested
m
North 55
45
3.5
25 15
5 South
55 45
35
25
15 5
Run 1 12.3
30.38
52.38 82.76
110.34
138.64
Run2
9.71
31.02 56.78
85.46
121.48
169.46
Run3 Average
10.44 10.81667 32.09 31.16333
58.27
558,
87.88 85.36$67
Figure 3:
4.21 6.8 16.79 , 19.14
30.36 35.69
47.25 55.39
69.13 78.54 92.01 104.51
126.86 119.56 I
176.72 161.6067 Final Ave. MPH 0 60
5.76 5.59 8.203333 55
18.65 18.19333 24.67833 45
35.58 33.87667 44.84333 35
55.8 52.81333 69.09 25
79.91 75.86 97.71 15 108.33 101.6167 131.6117 5
Coasting data for the 1994 Dodge Pickup. 6740 lbs. curb weight with driver, 7900 pound weight as tested.
29

gdmile
0.8 h I RME
DEE 0.7
0.6
0.5
0.4
0.3; I I 1
20 40 60 80 100
Percent Vegetable Oil Fuel
Fiqre 4 Total Hydrocarbons in gnhn.iIe from -March, 1994 LA--WA Emissions study for the Arterial cycle.
gm/mile 1.4
1.2
I
0.8
0.6
1 I I I 20 40 60 80 100
Percent Vegetable Oil Fuel
Figure 5 Total Hydrocarbons in gm/m.ile from Marc4 1994 LA-MTA Emissions study for the EPA cycle.
RME
RZ
30

gmlmiie 3.5
2.5
- 3
2
1.5 0 20 40 60 80 100
Percent Vegetable Oil Fuel
Figure 6 Carbon Monoxide in gm/mile from March., 1994 LA-MTAQ Emissions stidy for the Arterial Cycle
gmlmile
Percent Vegetable Oil Fuel
Figure 7 Carbon Monoxide in gm/mile f?om March, 1994 LA-MTA Emissions study for the EPA cycle.
31

gm/mile
660 [
658
656
654
652
650 0 20 40 60 80 100
Percent Vegetable Oil Fuel
Figure 8 Carbon Dioxide in gmknile from March, 1994 LA-MTA Emissions study for the Arterial Cycie
gmimile
708
7nfi
704
702
700
CQQ
20 40 60 80 100
Percent Vegetable Oil Fuel
Figure 9 Carbon Dioxide in gmknile from March, 1994 LA-MTA Emissions study for the EPA cycle.
31

gmlmile
6.4
6.2
6
5.8
5.6
5.4 0 40 60
Percent Vegetable Oil Fuel
80 100
Fi,oure 10 Oxides of Nitrosen in gm/mile &om March, 1994 LA-MTA Emissions study for the Arterial Cycle
gm/mile
RME
REE
6.4
6.2
6
20 40 60 80 100 Percent Vegetable Oil Fuel
Figure 11 Oxides of Nitrogen in gm/mi.Ie &om March, 1994 LA-MTA Emissions study for the EPA Cycle
33

gm/miie
0.32
0.3
0.28
0.36
I I , I I 1 20 40 60 80 100
Percent Vegetable Oil Fuel
Figure 12 Particulate Matter in gm/mile from March, 1994 LA-MTA Emissions study for the Arterial Cycle. Differences are non-significant according to Fishers protected LSD comparison.
gm/mile
0.55
0.5
0.45
0.4
0.35
0.3
RME
Rz
0 20 40 60 80 100
Percent Vegetable Oil Fuel
Figure 13 Particulate Matter in gm/mile from March, 1994 LA-hITA Emissions study for the EPA CycIe
34

HC
1.1
1
0.9
0.8
0.7
0.6
0.5
(gm/miie) NOX (gmlmile)
6.4
6.2
6
0.4 I ! I I I
’ .8 0 20 40 60 80 10 8
Percent Vegetable Oil Fuel
Figure 14 Summary of HC and NOx data from LA-MTA Emissions tests March, 1994 avera,oed for both REE and RME
CO (gmlmile) CO2 (gm/mile)
7
L
- 680
- 678
Percent Vegetable Oil Fuel
co
cz
+-
Figure 15 Summary of CO and CO, data from LA-MTA Emissions test March , 1994 averaged for both REE and RME.
35

gmimile
0.38
0.37
0.36
0.35
0.34
0.33
PM ++
W.-w
0 20 40 60 80 100 Percent Vegetable Oil Fuel
Figure 16 Surmnary of PM data from LA-MTA Emissions tests March, 1994 averqed for both REE and RME. Differences are non-si&fkmt according to Fischer’s protected LSD comparison.
36