bioengineering design process: patterns that lead to ... · initial conception to prototype to...
TRANSCRIPT
AC 2010-1200: BIOENGINEERING DESIGN PROCESS: PATTERNS THAT LEADTO QUALITY OUTCOMES
Nur Ozaltin, University of PittsburghNur Özge Özaltin is a graduate student in the Industrial Engineering department at the Universityof Pittsburgh. She received her B.S. in Industrial Engineering at Bosphorus University in Turkey,and her Masters degree in Industrial Engineering at the University of Pittsburgh respectively. Herresearch interest involves improving innovation through modeling the design process.
Mary Besterfield-Sacre, University of PittsburghMary Besterfield-Sacre, Associate Professor and Fulton C. Noss Faculty Fellow in theDepartment of Industrial Engineering and Center Associate for the Learning Research andDevelopment Center at the University of Pittsburgh. Dr. Sacre’s principal research interests are inengineering education assessment and evaluation methods. She has served as an associate editorfor the Journal of Engineering Education and is currently associate editor for the Applications inEngineering Education Journal. She received her B.S. in Engineering Management from theUniversity of Missouri - Rolla, her M.S. in Industrial Engineering from Purdue University, and aPh.D. in Industrial Engineering at the University of Pittsburgh.
Larry Shuman, University of PittsburghLarry J. Shuman is Senior Associate Dean for Academics and Professor of Industrial Engineeringat the University of Pittsburgh. His research focuses on improving the engineering educationalexperience with an emphasis on assessment of design and problem solving, and the study of theethical behavior of engineers and engineering managers. A former senior editor of the Journal ofEngineering Education, Dr. Shuman is the founding editor of Advances in EngineeringEducation. He has published widely in the engineering education literature, and is co-author ofEngineering Ethics: Balancing Cost, Schedule and Risk - Lessons Learned from the Space Shuttle(Cambridge University Press). He received his Ph.D. from The Johns Hopkins University inOperations Research and the BSEE from the University of Cincinnati. He is an ASEE Fellow.
© American Society for Engineering Education, 2010
Page 15.232.1

Bioengineering Design Process: Patterns That Lead To Quality Outcomes
Abstract
To improve design education, engineering instructors need to better understand how student teams navigate that process from concept to prototype. In this research, we examined the bioengineering design process and empirically modeled how engineering teams progressed from initial conception to prototype to determine the extent to which resultant design artifacts are a function of the process used. To do this we collected data from 26 two-term senior capstone engineering projects. The data consisted of twice weekly reflections of the activities that student teams engaged in during their design process, as well as open-ended comments about their design progression. This data was then collapsed into Dym’s model from which empirical associations were made between the various stages. Coupled with the teams’ open-ended weekly reflections, we were able to identify educational patterns that potentially lead to higher or lower quality designs. Based on their final artifact, teams were judged to be innovative or non-innovative. We found that differences exist between those teams innovative non-innovative teams. This paper reports these findings. Introduction
Innovation is highly important as competition between companies and countries continues to increase. The design process is at the heart of innovation; and according to Smith and Tjandra1, in order to improve design, one needs to understand it; and one possible way to achieve this is modeling the process. Hence, it is our assertion that increasing innovation begins with improving the design process and specifically understanding and improving engineering design education. The overall objective is to improve the effectiveness and innovativeness of design processes. In doing so, we have developed a conceptual model based on Dym’s model2 to investigate the relationships between the design activities conducted over time and their corresponding outcomes. Associations among the various design activities were then empirically analyzed; and from this we identified patterns of “good” and “poor” innovation in designs. Specifically, the following research questions have been investigated while developing this conceptual model. 1. Do relationships exist between the various sequences of design activities and do these
sequences relate to the innovation of the design outcome? 2. Given that some design activities are crucial to the process, is there a relationship between
when these “most important activities” occur and the innovation of the design outcome? 3. Do exogenous factors affect the overall innovation of the design (i.e., mentor, advisor, prior
internships, work experience, team contribution, etc.)? We addressed each of these questions utilizing data obtained from 26 bioengineering students at two institutions as they progressed from concept to working prototype for their senior capstone design projects. Through this research, we have identified potential patterns and factors that lead to innovation (as evaluated by their instructors) in senior bioengineering designs.
Page 15.232.2
Overview of the Engineering Design Process Literature
From the engineering education perspective, among the eleven learning outcomes enunciated by ABET, design is certainly one of the more complex outcomes. The criterion states that graduating engineers should have acquired: “an ability to design a system, component, or process to meet desired needs within realistic constraints such as economic, environmental, social, political, ethical, health and safety, manufacturability, and sustainability” (ABET, Inc.3). McDonald et al.4 stated and others have reiterated that engineering educators are concerned about rapidly changing industrial environment and educators need to focus not only on teaching the fundamentals, but to develop team, communication, and leadership skills and provide a multidisciplinary perspective. To design a product, graduating engineers require a combination of science, mathematics and domain specific knowledge, experience, ability to work within constraints, assess trade-offs, and conform to the demands of the customer. Given these expectations, engineering design education has drawn substantial attention (Atman et al.5, Okudan and Mohammed6). Although not specified by ABET, we conjecture that innovation also lies at the heart of good design. Because of its importance to engineering education, researchers have approached engineering design from different perspectives. This background section provides a concise overview of the recent literature regarding the design process and its relationship to the resulting artifact or prototype. This prior work has helped us to frame this research. Simon7 states that design is a central and distinguishing engineering activity. Okudan and Mohammed6 argue that design is a complex and inherently social process that is claimed to have a collectivist nature. Dym and Little2 emphasize the process of engineering design indicating that it is a constrained process. In analyzing the design process, a common approach is to divide design activities into sub-activities. Many authors (Ha and Porteus8, Krishnan, Eppinger and Whitney9) state that a source of difficulty in analyzing a design process is its dependency on the information about the design activities and the fact that these activities often occur in cycles or iterations. Such complexity requires successful design management. Yassine, Falkenburg, and Chelst10 identified four steps to manage the design process: (1) modeling the information and dependency structure of the design process, (2) providing a design plan showing the order of execution for the design activities, (3) reducing the risk and magnitude of iteration between design activities, and (4) exploring opportunities to reduce the project cycle time. In this study, we have delineated the order of execution for the design activities for both innovative and non-innovative teams. Moreover, we investigated the relation between the design process and the outcome. The impact of the design process on project outcomes has also been investigated by several researchers, including Costa and Sobek11. The focus of this literature is primary to reduce the time of the design process. For modeling the design process, Krishnan, Eppinger and Whitney9 created a model to minimize the expected duration of the product development time. Moreover, Ha and Porteus8 modeled the design process in order show the benefits of using concurrent engineering
Page 15.232.3

(i.e., shortening product development times). However, to date, none of the researchers have mentioned improving innovation. The extent of most design studies in engineering education remains limited to the analysis of relatively short term (e.g., a few hours or a few days) design projects. For example, Atman et al.5 studied the comparison of freshman and senior engineering design processes for short (roughly three hour) projects and analyzed the students’ documentation protocols. Unfortunately, the design process is complex and often longer than a few hours or days; and hence analyses addressing the complexity of the process are required. In this research, we consider a two-term project from idea conception to working prototype to model the complexity of the process. In our research, we have concentrated on the underlying factors in the process of design that potentially influence innovation. At present, much of the research has center around factors that influence successful design; such as appropriate design selection (Diaz12, Georgiopoulos13), actors that lead to the failure of new designs (Wagner and Durr14), and the importance of good design (Macmillan15). Unfortunately, there has been little literature on determining important “factors” such as mentors, appropriate classes, work experience, etc. that influence engineering students’ design; and to date, very little work has focused on the process variables and factors that potentially influence innovation. This work attempts to investigate such influencers. Data Collection
We collected data from both senior bioengineering students in their capstone courses, as well as data about their final prototypes from the faculty instructors. Further, we collected information from experts and practitioners in bioengineering design as input to this study. 1. Data Collection From Students
We collected data from bioengineering students’ senior capstone projects during the 2007-08 and 2008-09 academic years. For this research, we had 26 teams from two institutions that participated in our study. The teams varied from three to five students. For their participation; students were paid a small amount to participate. Each student from each team took a web-based reflection survey twice per week, which asked them to indicate the activities they worked on over the past few days. Specifically, on Tuesdays, students would receive an email to take a design stage reflection survey and were provided a URL link, as shown in Figure 1. The screen provided the four main stages of the product realization process (Stage 1 - Opportunity Identification, Stage 2 – Design and Development, Stage 3 – Testing and Preproduction, Stage 4 – Introduction and Production). The student selected the stage that he/she believed that the team was working on. If the student had not worked on their capstone project since the last email, he/she could select “I have not worked on the design”. Within each stage, the student could select up to three activities they worked on since the last reflection. The entire set of activities was determined by Golish, Besterfield-Sacre, and Shuman16 and are based on the literature and input from design experts. Upon review and revision by the capstone instructors, the final set used by the students contained 89 activities. Note that the students were trained in the meaning of each activity and were provided a
Page 15.232.4
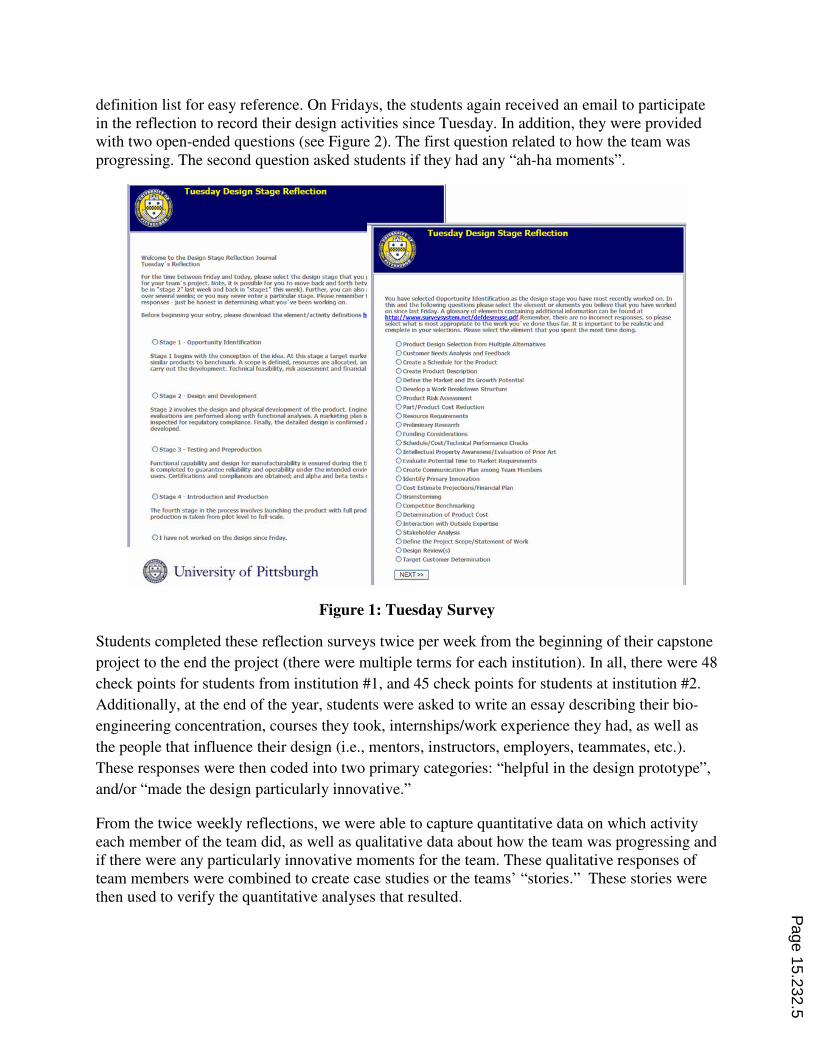
definition list for easy reference. On Fridays, the students again received an email to participate in the reflection to record their design activities since Tuesday. In addition, they were provided with two open-ended questions (see Figure 2). The first question related to how the team was progressing. The second question asked students if they had any “ah-ha moments”.
Figure 1: Tuesday Survey
Students completed these reflection surveys twice per week from the beginning of their capstone
project to the end the project (there were multiple terms for each institution). In all, there were 48
check points for students from institution #1, and 45 check points for students at institution #2.
Additionally, at the end of the year, students were asked to write an essay describing their bio-
engineering concentration, courses they took, internships/work experience they had, as well as
the people that influence their design (i.e., mentors, instructors, employers, teammates, etc.).
These responses were then coded into two primary categories: “helpful in the design prototype”,
and/or “made the design particularly innovative.”
From the twice weekly reflections, we were able to capture quantitative data on which activity each member of the team did, as well as qualitative data about how the team was progressing and if there were any particularly innovative moments for the team. These qualitative responses of team members were combined to create case studies or the teams’ “stories.” These stories were then used to verify the quantitative analyses that resulted. P
age 15.232.5
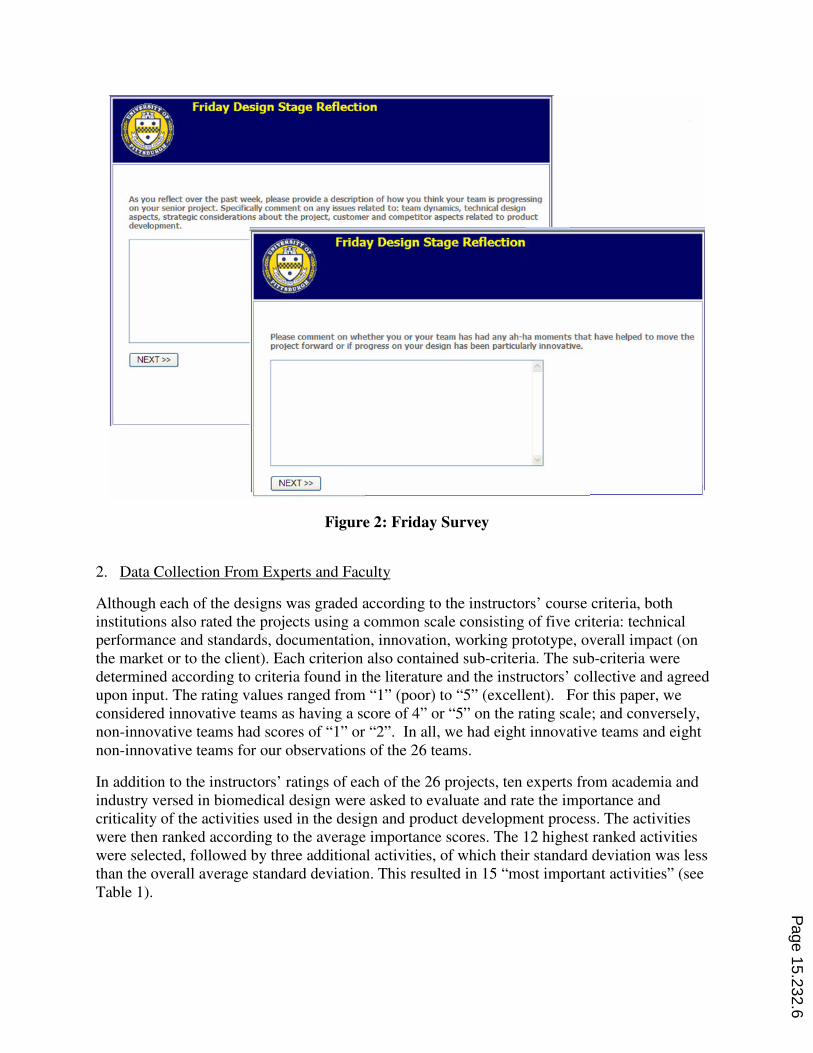
Figure 2: Friday Survey
2. Data Collection From Experts and Faculty
Although each of the designs was graded according to the instructors’ course criteria, both institutions also rated the projects using a common scale consisting of five criteria: technical performance and standards, documentation, innovation, working prototype, overall impact (on the market or to the client). Each criterion also contained sub-criteria. The sub-criteria were determined according to criteria found in the literature and the instructors’ collective and agreed upon input. The rating values ranged from “1” (poor) to “5” (excellent). For this paper, we considered innovative teams as having a score of 4” or “5” on the rating scale; and conversely, non-innovative teams had scores of “1” or “2”. In all, we had eight innovative teams and eight non-innovative teams for our observations of the 26 teams.
In addition to the instructors’ ratings of each of the 26 projects, ten experts from academia and industry versed in biomedical design were asked to evaluate and rate the importance and criticality of the activities used in the design and product development process. The activities were then ranked according to the average importance scores. The 12 highest ranked activities were selected, followed by three additional activities, of which their standard deviation was less than the overall average standard deviation. This resulted in 15 “most important activities” (see Table 1).
Page 15.232.6

Table 1: Most Important Activities
1 Customer Needs Analysis and Feedback 2 Brainstorming 3 Analysis, Evaluation and Reporting of Test Data 4 Alpha/In-house Testing 5 Prototype Testing 6 Design Review(s) 7 Design/Prototype Review(s) 8 Product Design Selection from Multiple Alternatives 9 Reliability Testing, Test to Failure, Limit Testing 10 Test Method Definition 11 Customer Feedback Evaluation 12 Refine Tests and Models 13 Documentation of Design Work 14 Modeling, Simulation and Optimization of Design 15 Optimization of Design
Data Analysis
Engineering design and product realization is multifaceted. The teams of students that completed the twice weekly reflections had the opportunity to select from a variety of activities that encompassed the entire design and product realization process. Hence, we needed a more simplified version of the design process to collapse the many activities students used. For this we turned to Dym and Little2 who had analyzed the engineering design process under six primary categories, and identified feedbacks and iterations among these activities (see Figure 3). The arrows indicate the sequence among steps. Dym and Little2 noted that they were not presenting a recipe for completing a design; but rather, they were describing the design process.
Students completed these reflection surveys twice per week from the beginning of their capstone
project to the end the project (there were multiple terms for each institution). In all, there were 48
check points for students from institution #1, and 45 check points for students at institution #2.
Additionally, at the end of the year, students were asked to write an essay describing their bio-
engineering concentration, courses they took, internships/work experience they had, as well as
the people that influence their design (i.e., mentors, instructors, employers, teammates, etc.).
These responses were then coded into two primary categories: “helpful in the design prototype”,
and/or “made the design particularly innovative.”
From the twice weekly reflections, we were able to capture quantitative data on which activity each member of the team did, as well as qualitative data about how the team was progressing and if there were any particularly innovative moments for the team. These qualitative responses of
Page 15.232.7

team members were combined to create case studies or the teams’ “stories.” These stories were then used to verify the quantitative analyses that resulted.
Figure 3: Feedback and Iteration in the Design Process
Problem definition phase consists of clarifying objectives, establishing user requirements, identifying constraints, and establishing design functions. Conceptual design includes establishing design specification and generating design alternatives. Modeling, analyzing, testing and evaluating conceptual designs constitute preliminary design. Refining and optimizing the chosen design compose detailed design. Design communication phase comprises documenting the completed design.
In addition, we added marketing and management categories to Dym’s five-stage prescriptive model as many of the product realization activities incorporate aspects of marketing and management. As we focused on not only design but also product realization, marketing aspects became essential. For example, defining the market and its growth potential, determination of product cost, determination of target customer and market can be considered as part of the engineering design process. Furthermore, management aspects were crucial since the projects were carried out by teams. Interestingly, Dym and Little2 had explained the importance of marketing and management in their book, but did not include these two categories in their core five-stage, prescriptive model.
Utilizing a team of faculty and graduate students, the activities were collapsed into the various categories. Note that some particular activities could belong to more than one category depending on when they occurred in the process.
For this paper, two data analysis techniques were employed: (1) association mining analysis and (2) stepwise regression. In association mining analysis the data relationships between each stage
Page 15.232.8

are examined for each team. This results in two types of probabilities for the various stages of Dym’s model: Support and Confidence. Support is the probability that two distinct categories appear consecutively throughout the design process; and confidence is the conditional probability that a particular category occurs after a given category. We calculated support and confidence measures among the eight main categories for each of the 26 teams. Based on the confidence measure, denoted by p, we classified the relationships among the categories as either weak (0.3≤ p≤ 0.5), moderate (0.5< p ≤ 0.75), or strong (0.75 < p). Relationship less than 0.3 wer not considered. Once completed for each team, association maps were drawn (See Figure 4 in the next section). Table 2 is an example of how support and confidence probabilities are calculated for our data.
Table 2: Support and Confidence Example
As an example, “Conceptual Design” appeared twice after “Problem Definition”, and “Problem Definition” appeared 14 times during the timeline for this particular team. So, the confidence probability is found by 2/14. Since the probability is less than 0.3, it is not considered in the map. Stepwise regression analysis was conducted to measure the significance of the “most important activities” to the final product ratings for innovation (our dependent variable).
Responses in the final, more comprehensive survey were entered and analyzed in NVivo, a qualitative data analysis software. Utilizing a coded framework we developed, NVivo translated the qualitative responses to quantitative data. These two data pieces provided the independent variables to our regression.
Results Page 15.232.9
The results are presented according to our three research questions posed at the beginning of the paper.
Research Question 1: Do relationships exist between the various sequences of design activities
and do these sequences relate to the innovation of the design outcome?
For this question, we utilize the results of our association mining analysis (see Table 2 in the prior section).
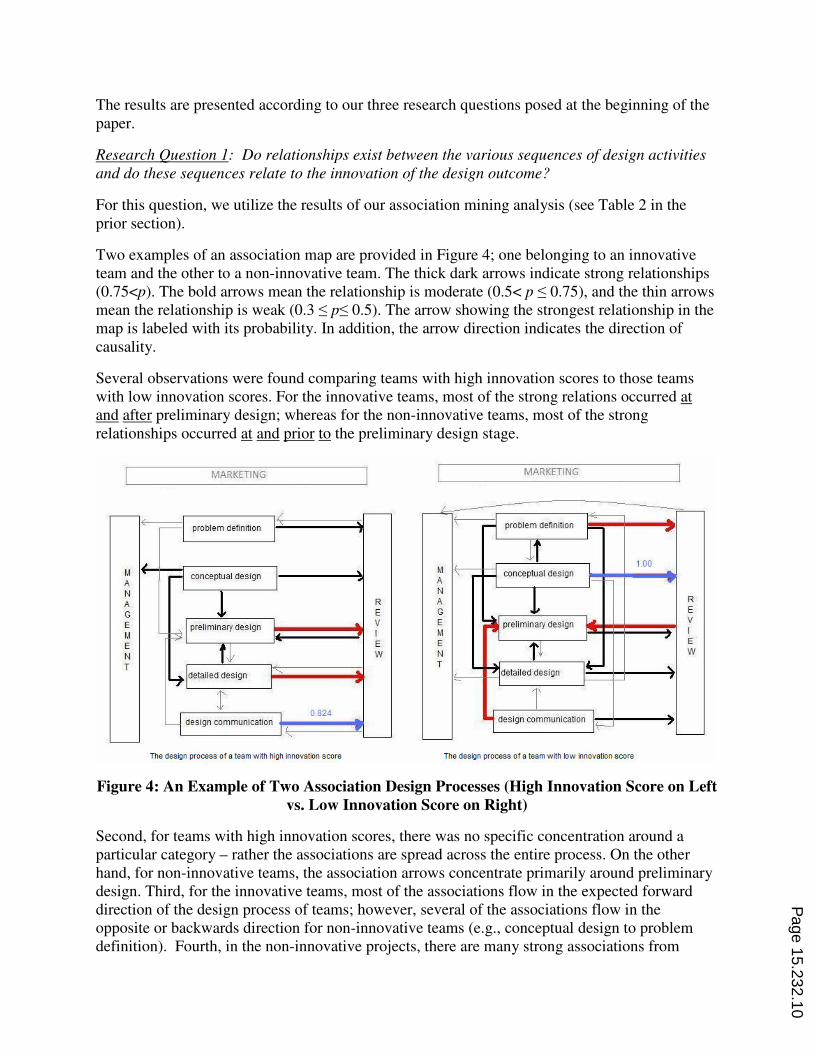
Two examples of an association map are provided in Figure 4; one belonging to an innovative team and the other to a non-innovative team. The thick dark arrows indicate strong relationships (0.75<p). The bold arrows mean the relationship is moderate (0.5< p ≤ 0.75), and the thin arrows mean the relationship is weak (0.3 ≤ p≤ 0.5). The arrow showing the strongest relationship in the map is labeled with its probability. In addition, the arrow direction indicates the direction of causality.
Several observations were found comparing teams with high innovation scores to those teams with low innovation scores. For the innovative teams, most of the strong relations occurred at and after preliminary design; whereas for the non-innovative teams, most of the strong relationships occurred at and prior to the preliminary design stage.
Figure 4: An Example of Two Association Design Processes (High Innovation Score on Left
vs. Low Innovation Score on Right)
Second, for teams with high innovation scores, there was no specific concentration around a particular category – rather the associations are spread across the entire process. On the other hand, for non-innovative teams, the association arrows concentrate primarily around preliminary design. Third, for the innovative teams, most of the associations flow in the expected forward direction of the design process of teams; however, several of the associations flow in the opposite or backwards direction for non-innovative teams (e.g., conceptual design to problem definition). Fourth, in the non-innovative projects, there are many strong associations from
Page 15.232.10
“review” activity to other categories; however, these “review” of associations are not as common for the innovative teams.
Our “stories” for each of the teams helped to confirm these observations. According to these stories, innovative teams often talked about their progress both positive and negative; however, non-innovative teams spent much time complaining about other team members. Members of the innovative teams appeared to be problem solvers, whereas members of the non-innovative projects spent much time “realizing what the problem is” instead of trying to solve it. Moreover, the innovative projects had time to revise their designs, but non-innovative teams in general could only finish their first prototype prior to the deadline. Furthermore, when the innovative teams realized their progress was moving slowly, they tried to resolve the issues; this was not the case with non-innovative teams as they continued to complain about being slowed when they faced stressful critical problems (e.g., changing materials in the middle of the semester, failing in their prototype, changing the design, etc.).
Research Question 2: Given that some design activities are crucial to the process, is there a
relationship between when these “most important activities” occur and the innovation of the
design outcome?
To address this question we used stepwise regression to identify the important activities (as identified by our bioengineering design experts) that contributed to innovation. For this, we considered when a category occurs (i.e., time) as essential to innovation as the frequency of the category occurring. To define the time of an activity, we divided the project timeline according to Özaltın, Besterfield-Sacre, Shuman17. There were three main project phases: early phase, mid-phase, and late phase, and two transition periods with five check points (2.5 weeks) between consecutive phases. Early, mid, and late phases had 13, 12, and 13 check points, respectively. However, since there was a difference in the number of check points from year to year (i.e., the two institutions participating has different calendars – one institution was on semesters and the other was on quarters – thus the total number of weeks were slightly different); and as a result, the timelines were normalized to make the data consistent across the academic years.
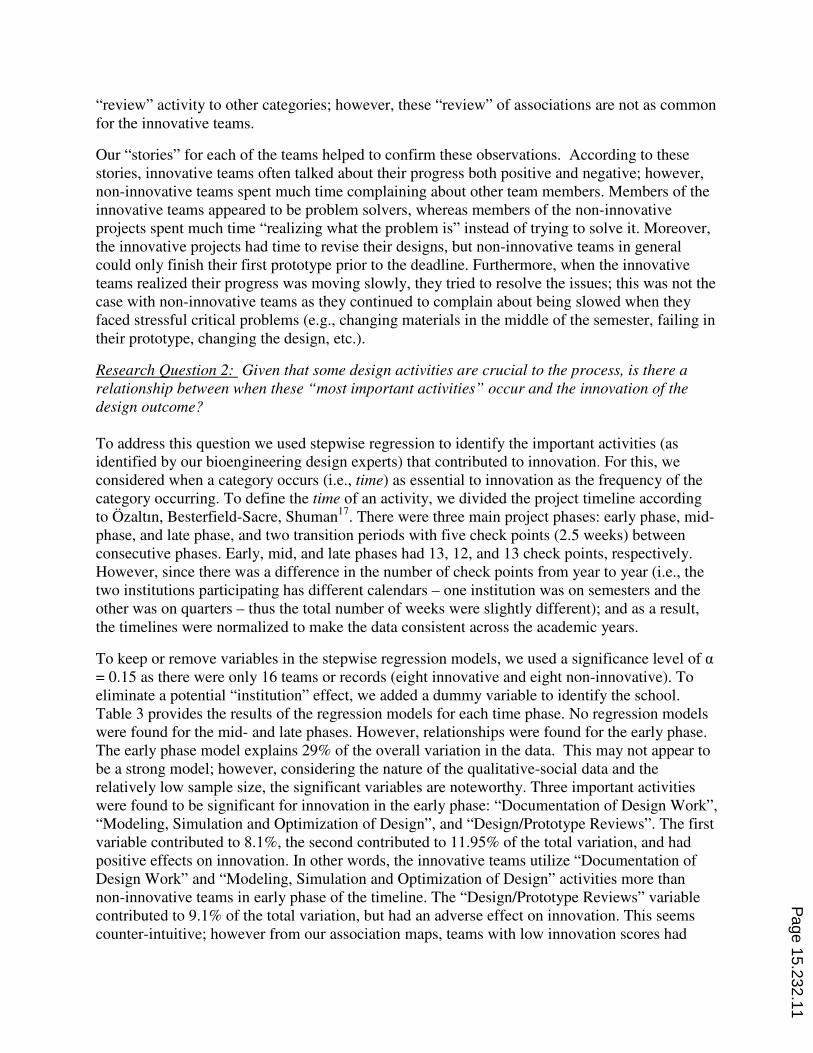
To keep or remove variables in the stepwise regression models, we used a significance level of α = 0.15 as there were only 16 teams or records (eight innovative and eight non-innovative). To eliminate a potential “institution” effect, we added a dummy variable to identify the school. Table 3 provides the results of the regression models for each time phase. No regression models were found for the mid- and late phases. However, relationships were found for the early phase. The early phase model explains 29% of the overall variation in the data. This may not appear to be a strong model; however, considering the nature of the qualitative-social data and the relatively low sample size, the significant variables are noteworthy. Three important activities were found to be significant for innovation in the early phase: “Documentation of Design Work”, “Modeling, Simulation and Optimization of Design”, and “Design/Prototype Reviews”. The first variable contributed to 8.1%, the second contributed to 11.95% of the total variation, and had positive effects on innovation. In other words, the innovative teams utilize “Documentation of Design Work” and “Modeling, Simulation and Optimization of Design” activities more than non-innovative teams in early phase of the timeline. The “Design/Prototype Reviews” variable contributed to 9.1% of the total variation, but had an adverse effect on innovation. This seems counter-intuitive; however from our association maps, teams with low innovation scores had
Page 15.232.11
many associations between review and the design process, particularly early in the design process. This may indicate that the teams were insecure with their design thoughts and constantly needed verification from mentors and the instructor in the early phase.
Table 3: Regression of the Most Important Variables
“Refine Tests and Models” and “Brainstorming” were significant variables in the first transition phase. This model explains 21.6% of the variability. The first activity contributed to 11%, and the second variable contributed to 10.6% of the total variation.
In the second transition phase, one variable was found to be significant: “Documentation of
Design Work”. This variable explains 11.6% of the variation.
Research Question 3: Do exogenous factors affect the overall innovation of the design (i.e.,
mentor, advisor, prior internships, work experience, team contribution, etc.)?
Page 15.232.12
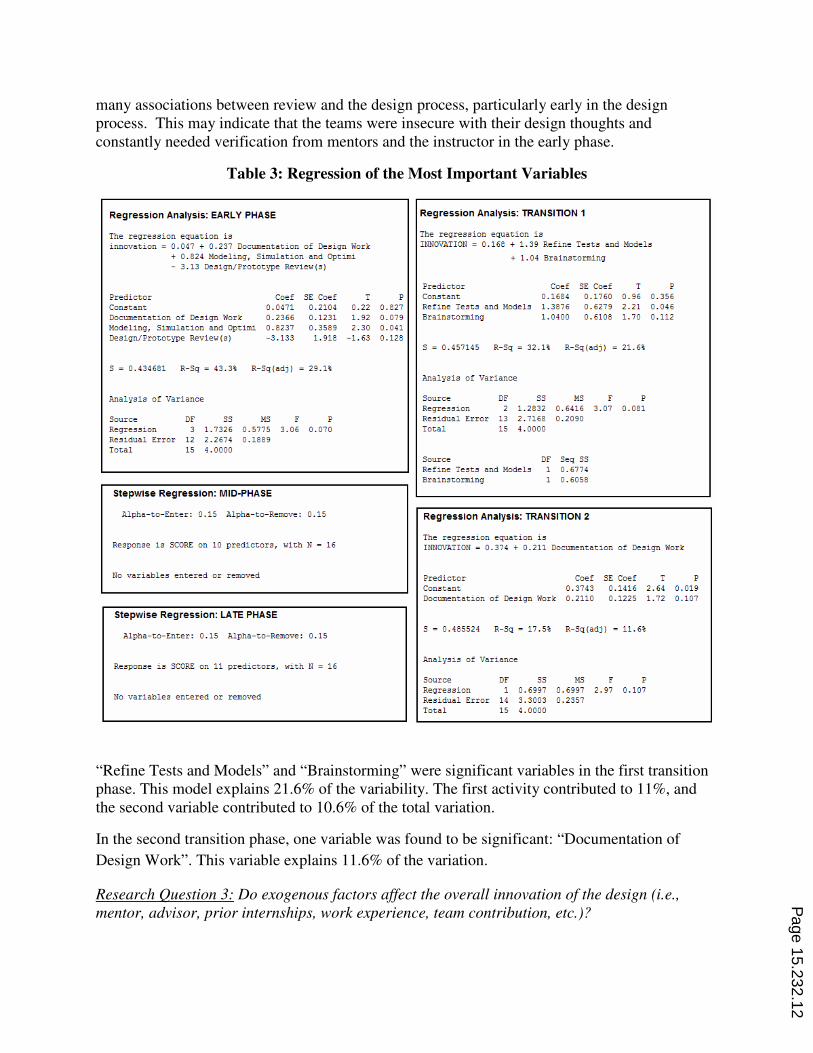
For this research question, we again employed stepwise regression. Table 4 shows the linear regression results of the final survey. In this model, “Ability for Working in a Group”, “Work Experience”, and “Mentor” had a positive and significant effect on the innovation score. On the other hand, the effect of “Bioengineering Courses” is negative. In other words, the students believed that their ability for working in a group, work experience, and their mentor were helpful for their design, but bioengineering courses were surprisingly not helpful. Note that there was no school effect, meaning that this was consistent across the two institutions. The model explains 71.2% of the variability in the data. Furthermore, the overall p-value is 0.001.
Table 4: Results of Final Survey Analysis
Summary and Discussion
Design in engineering education is an involved process for both students and faculty. There are many activities that can potentially affect the progress of the project as well as the quality of the final product. In our work we took both a qualitative and quantitative perspective to begin to analyze our rich data set to identify areas that potentially impact innovation. We used data from bioengineering student capstone design projects, so our design approach and findings are limited to this field; however, our findings might be the same if applied to other engineering fields. We identified relationships between the various sequences of design activities and the outcome. Strong relationships took place at and after preliminary design for innovative teams, whereas they appeared at and prior to preliminary design for non-innovative teams. We observed that the non-innovative teams usually had problems in problem definition and conceptual design steps. Therefore their preliminary designs were problematic, and they had to spend more time at and prior to the preliminary design step.
Page 15.232.13
On the other hand, progression of the innovative teams was smoother, and they were able to focus on detailed design. We observed that the innovative teams usually finished their prototype one or two weeks before deadline, whereas, the non-innovative teams were still working on their prototype up to the project deadline.
In addition, the associations in innovative teams were spread across the entire process, and there was not a concentration around a particular stage. On the other hand, for the non-innovative teams, the associations were concentrated primarily around preliminary design step and there were many strong associations from review to other categories. This might indicate that the non-innovative teams had problems in the preliminary design step. Also, since their process was problematic, they needed the additional check/review to fix problems; so many strong associations appeared from review to other categories. We note that strong associations did appeared from review to other activities for some of the innovative teams, too; however, the frequency of occurrences was substantially lower compared to non-innovative teams.
The associations of non-innovative teams often flowed in the opposite or in a backwards direction than expected. For innovative teams, the majority of the associations flowed in the expected forward direction of the design process. This again indicates that the non-innovative teams had problems, as they had to go back and fixed their problems.
In general there was not a significant relationship between the time and the frequency of the “most important activities” and the innovation score of the design outcome for the middle and late phases – only in the early phase and transition periods. In the early phase, the “Design/Prototype review(s)” activity had a negative effect on the outcome meaning that non-innovative teams utilized this activity more than innovative teams. Again, verifying that they experienced problems in the beginning of the design. Finally, from the third research question, we found that “Ability for Working in a Group”, “Work Experience”, “Mentor”, and “Bioengineering Courses” affected the overall innovation of the design. The first three variables had positive effects; and the fourth one had a negative effect. The educators shall consider these variables, and focus on improving students’ ability to work in a group. Moreover, the students believe that work experience helped them; in other words, they had an opportunity to apply the theory at work. By considering this finding, the curriculums might investigate ways to allow students apply their theoretical knowledge prior to their capstone experience. Mentors helped teams be more innovative. We conjecture two possible explanations: (1) students were more capable of articulating their questions to mentors, which resulted in mentor’s ability to help, and/or (2) non-innovative team’s problems were so serious, mentors’ help was insufficient. It is also interesting that the innovative team members believe that their bioengineering courses were not “practical,” as some students mentioned. Note, one explanation for this overriding comment from students was that one of the institution’s program is oriented for students going on to graduate school rather than working in companies where design experiences may be more prevalent. In summary, in facilitating capstone design engineering educators should recognize that the early stages of the design process are critical for innovation. Innovative teams move forward the process, utilize review a “proper” amount, and draw upon their work experiences and mentor’s expertise in creating their designs.
Page 15.232.14

Bibliography
1. Smith, R. P. and Tjandra, P. (1998) Experimental observation of iteration in engineering design, Research in
Engineering Design Vol 10 No 2 pp 107-117 2. Dym C. I, Little, P. Engineering Design: a project based introduction, 2nd edition, John Wiley & Sons, Inc,
2004
3. http://www.abet.org/
4. McDonald, D, Devaprasad, J, Duesing, P, Mahajan, A, Qatu, M and Walworth, M Reengineering the senior design experience with industry-sponsored multidisciplinary team projects, FIE'96 Proceedings, pp 1313-1316, (1996)
5. Atman, C. J, Chimka, J. R, Bursic, K. M. and Nachtmann H. L. (1999) A comparison of freshman and senior engineering design processes, Design Studies Vol 20 No 2 pp 131-152
6. Okudan, G and Mohammed, S (2006) Task gender orientation perceptions by novice designers: implications for engineering design research, teaching and practice, Design Studies Vol 27 No 6 pp 723-740
7. Simon, H A (1996) The Sciences of the Artificial, MIT Press, Cambridge, MA 8. Ha, A. Y, Porteus, E, L. Optimal Timing of Reviews In Concurrent Design For Manufacturability. Management
Science Vol 41 No 9 pp 1431-1447 (1995) 9. Krishnan, V, Eppinger, S. D, Whitney, D. E. A Predictive Model of Sequential Iteration in Engineering Design.
Management Science Vol 43 No 4 pp 1104-1120 (1997) 10. Yassine, A, Falkenburg, D, and Chelst, K (1999) Engineering design managament: an information structure
approach, International Journal of Production Research Vol 37 No 13 pp 2957-2975 11. Costa, R, Sobek II, D, K (2004) How Process Affects Performance: An Analysis of Student Design
Productivity, Proceedings of DETC’04 12. Diaz, A. (1987) Interactive solution to multiobjective optimization problems, International Journal for
Numerical Methods in Engineering Vol 24 No 12 pp 1865-1877 13. Georgiopoulos, P. (2003) Enterprise-Wide Product Design: Linking Optimal Design Decisions to the Theory of
the Firm D. Eng. Thesis, University of Michigan, Ann Arbor, MI 14. Wagner, KW and Durr, W (2005) Design failure cost as a measure of a process measurement system (a method
for building the system and evaluating the measure, Software Engineering and Advanced Applications 31st Euromicro Conference pp 214-221, Portugal
15. Macmillan, S. (2006) Added value of good design, Building Research Information Vol 34 No 3 pp 257- 271 16. Golish, B., Besterfield-Sacre, M., Shuman, L. “Comparing the Innovation Processes in Academic and Corporate
Settings,” Journal of Product Innovation Management, 25 (1), 2008, pp. 47-62 17. Özaltın, N. Ö., Besterfield-Sacre, M., Shuman, L., 2010 “A Conceptual Model to Understand Innovation in the
Design Process,” Technical Report
Page 15.232.15