biofilter odor control system performance...
TRANSCRIPT
Wooldridge Road Lift Station 24” Force Main Tie‐In and Odor Control System
City of Corpus Christi, Texas
BIOFILTER ODOR CONTROL SYSTEM
PERFORMANCE TESTING
Prepared by:
BOHN BIOFILTER CORPORATION TUCSON, ARIZONA
520.624.4644 bohnbiofilter.com
October 2011
1
October 2011
Wooldridge Road Lift Station 24” Force Main Tie‐In and Odor Control System Biofilter Performance Testing PREPARED FOR: Harold Shearer / Coym, Rehmet & Gutierrez John Roughneen / Gin‐Spen, Inc.
PREPARED BY: Rob Johnson / Bohn Biofilter DATE: 10 October 2011
Objective
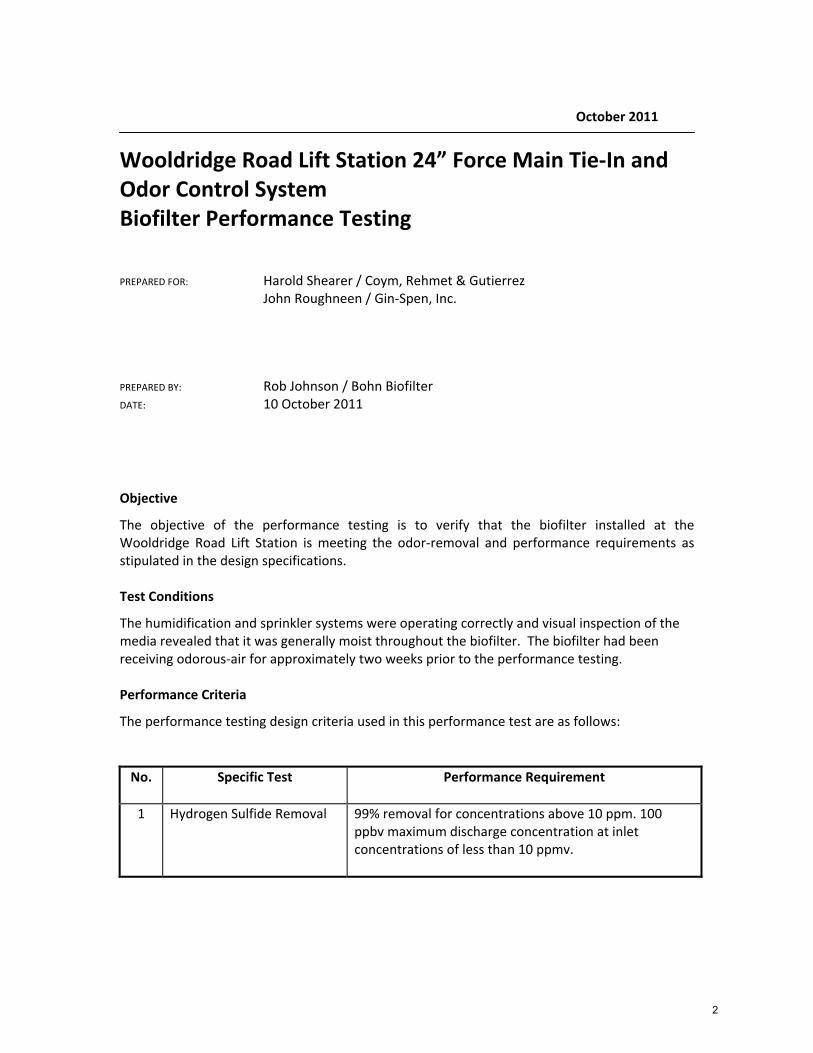
The objective of the performance testing is to verify that the biofilter installed at the Wooldridge Road Lift Station is meeting the odor‐removal and performance requirements as stipulated in the design specifications. Test Conditions
The humidification and sprinkler systems were operating correctly and visual inspection of the media revealed that it was generally moist throughout the biofilter. The biofilter had been receiving odorous‐air for approximately two weeks prior to the performance testing. Performance Criteria
The performance testing design criteria used in this performance test are as follows: No.
Specific Test
Performance Requirement
1 Hydrogen Sulfide Removal 99% removal for concentrations above 10 ppm. 100 ppbv maximum discharge concentration at inlet concentrations of less than 10 ppmv.
2
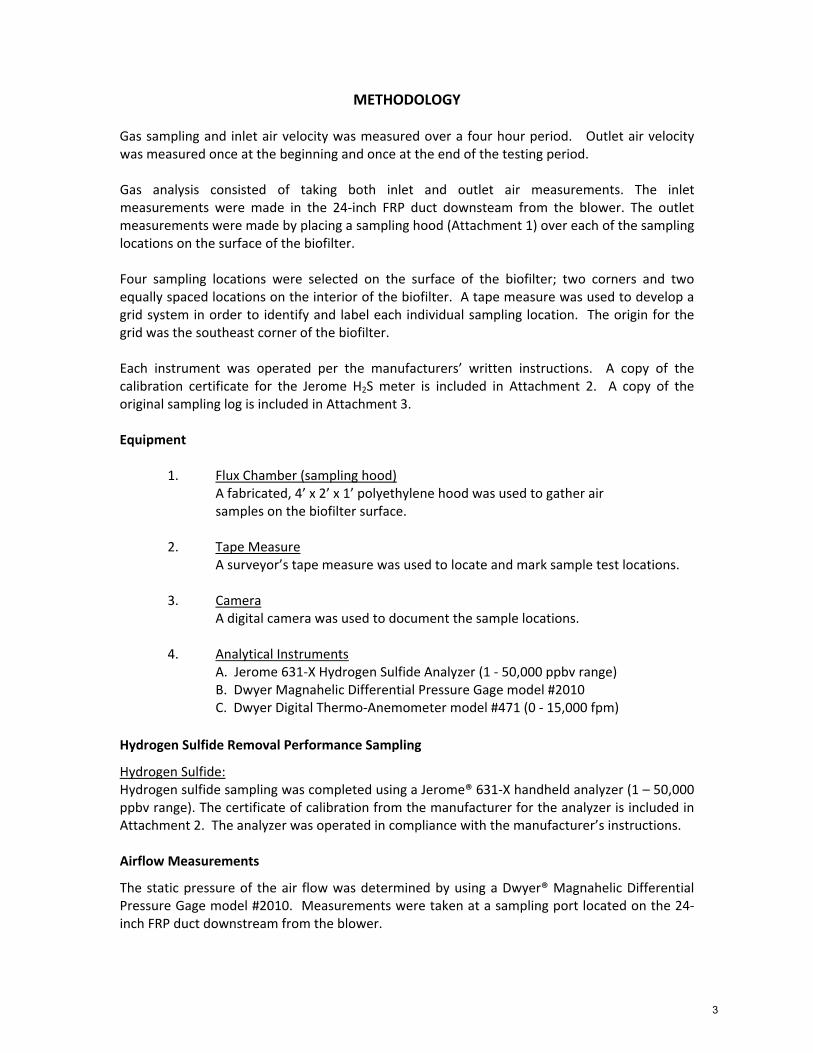
METHODOLOGY Gas sampling and inlet air velocity was measured over a four hour period. Outlet air velocity was measured once at the beginning and once at the end of the testing period. Gas analysis consisted of taking both inlet and outlet air measurements. The inlet measurements were made in the 24‐inch FRP duct downsteam from the blower. The outlet measurements were made by placing a sampling hood (Attachment 1) over each of the sampling locations on the surface of the biofilter. Four sampling locations were selected on the surface of the biofilter; two corners and two equally spaced locations on the interior of the biofilter. A tape measure was used to develop a grid system in order to identify and label each individual sampling location. The origin for the grid was the southeast corner of the biofilter. Each instrument was operated per the manufacturers’ written instructions. A copy of the calibration certificate for the Jerome H2S meter is included in Attachment 2. A copy of the original sampling log is included in Attachment 3. Equipment 1. Flux Chamber (sampling hood) A fabricated, 4’ x 2’ x 1’ polyethylene hood was used to gather air samples on the biofilter surface.
2. Tape Measure A surveyor’s tape measure was used to locate and mark sample test locations.
3. Camera A digital camera was used to document the sample locations.
4. Analytical Instruments A. Jerome 631‐X Hydrogen Sulfide Analyzer (1 ‐ 50,000 ppbv range) B. Dwyer Magnahelic Differential Pressure Gage model #2010 C. Dwyer Digital Thermo‐Anemometer model #471 (0 ‐ 15,000 fpm)
Hydrogen Sulfide Removal Performance Sampling
Hydrogen Sulfide: Hydrogen sulfide sampling was completed using a Jerome® 631‐X handheld analyzer (1 – 50,000 ppbv range). The certificate of calibration from the manufacturer for the analyzer is included in Attachment 2. The analyzer was operated in compliance with the manufacturer’s instructions. Airflow Measurements
The static pressure of the air flow was determined by using a Dwyer® Magnahelic Differential Pressure Gage model #2010. Measurements were taken at a sampling port located on the 24‐inch FRP duct downstream from the blower.
3
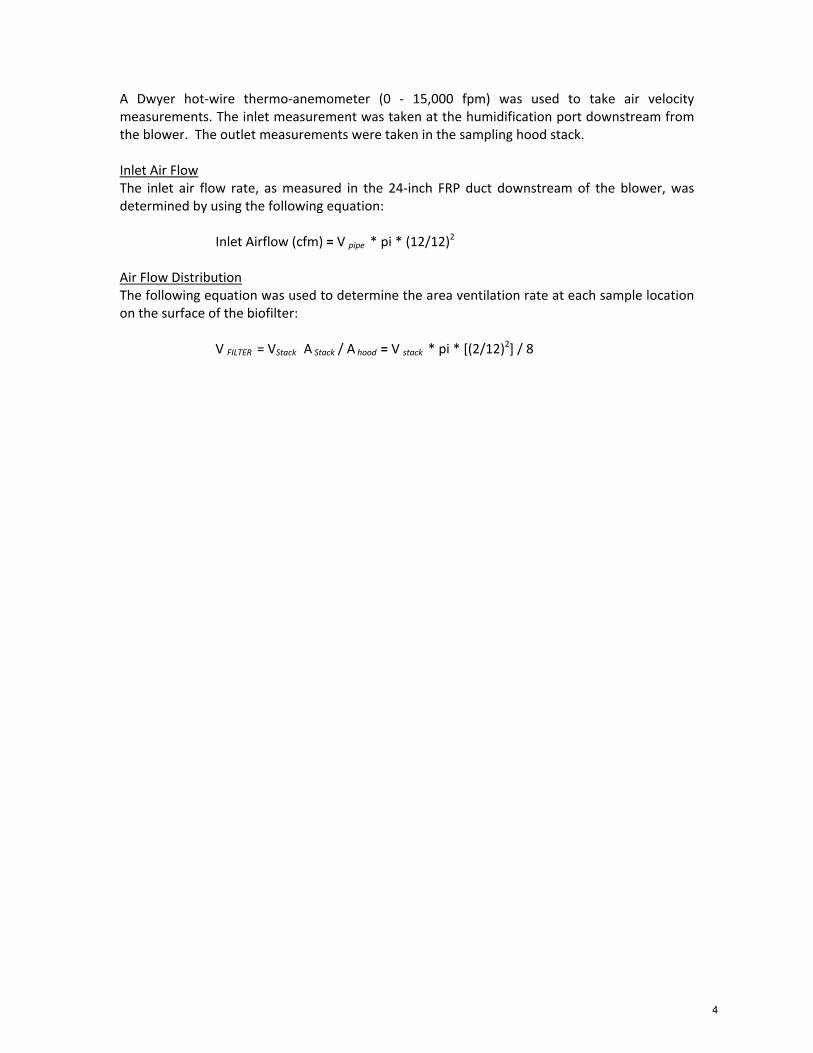
A Dwyer hot‐wire thermo‐anemometer (0 ‐ 15,000 fpm) was used to take air velocity measurements. The inlet measurement was taken at the humidification port downstream from the blower. The outlet measurements were taken in the sampling hood stack. Inlet Air Flow The inlet air flow rate, as measured in the 24‐inch FRP duct downstream of the blower, was determined by using the following equation:
Inlet Airflow (cfm) = V pipe * pi * (12/12)2
Air Flow Distribution The following equation was used to determine the area ventilation rate at each sample location on the surface of the biofilter:
V FILTER = VStack A Stack / A hood = V stack * pi * [(2/12)2] / 8
4
PERFORMANCE TESTING RESULTS
Operating Conditions Performance testing of the biofilter was conducted on October 6, 2011. The weather conditions were partly cloudy skies with an ambient temperature ranging from 88° F at 10:00 am to 91° F at 2:00 pm. The suction side of the air collection system was balanced prior to conducting the performance test. The average air flow rates for the three odor sources are as shown in Table 2.
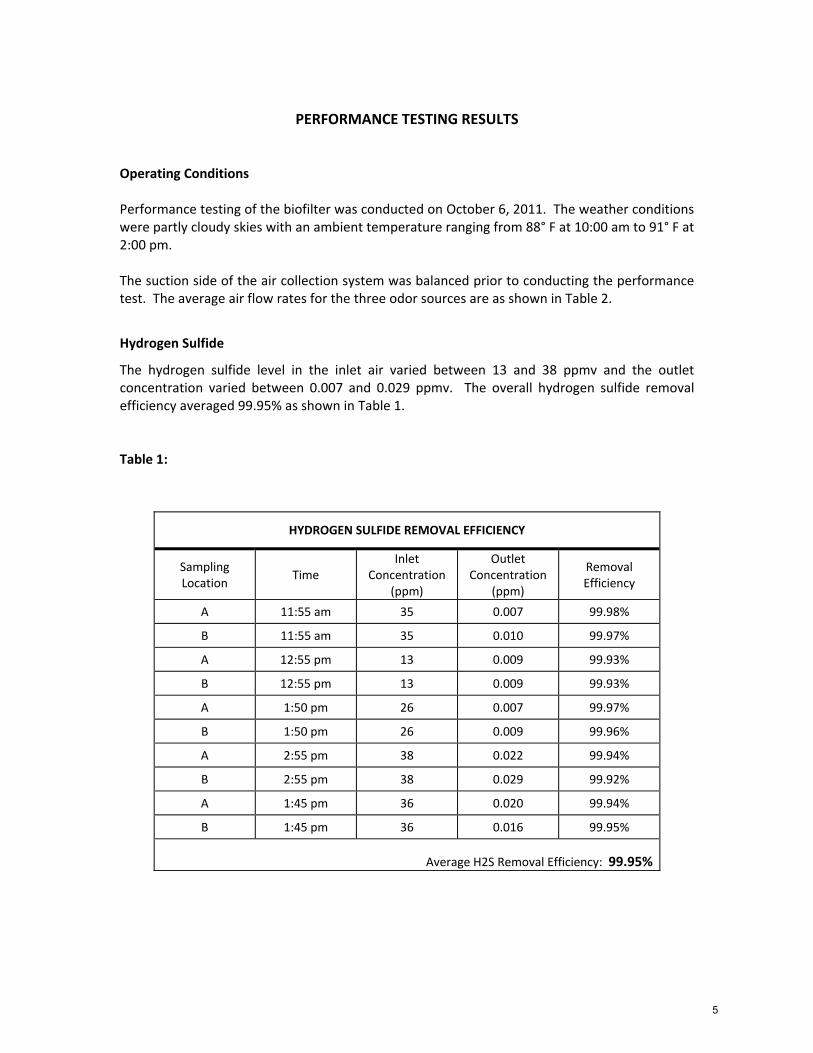
Hydrogen Sulfide
The hydrogen sulfide level in the inlet air varied between 13 and 38 ppmv and the outlet concentration varied between 0.007 and 0.029 ppmv. The overall hydrogen sulfide removal efficiency averaged 99.95% as shown in Table 1. Table 1:
HYDROGEN SULFIDE REMOVAL EFFICIENCY
Sampling Location
Time Inlet
Concentration (ppm)
Outlet Concentration
(ppm)
Removal Efficiency
A 11:55 am 35 0.007 99.98%
B 11:55 am 35 0.010 99.97%
A 12:55 pm 13 0.009 99.93%
B 12:55 pm 13 0.009 99.93%
A 1:50 pm 26 0.007 99.97%
B 1:50 pm 26 0.009 99.96%
A 2:55 pm 38 0.022 99.94%
B 2:55 pm 38 0.029 99.92%
A 1:45 pm 36 0.020 99.94%
B 1:45 pm 36 0.016 99.95%
Average H2S Removal Efficiency: 99.95%
5
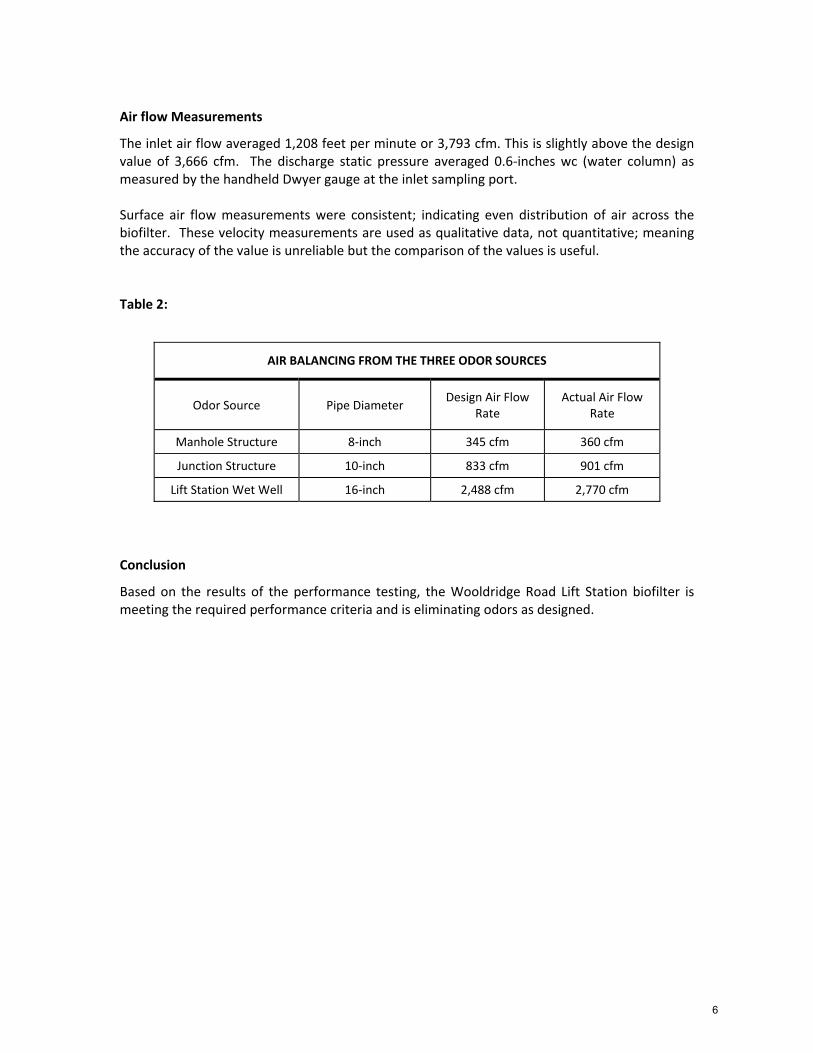
Air flow Measurements
The inlet air flow averaged 1,208 feet per minute or 3,793 cfm. This is slightly above the design value of 3,666 cfm. The discharge static pressure averaged 0.6‐inches wc (water column) as measured by the handheld Dwyer gauge at the inlet sampling port. Surface air flow measurements were consistent; indicating even distribution of air across the biofilter. These velocity measurements are used as qualitative data, not quantitative; meaning the accuracy of the value is unreliable but the comparison of the values is useful. Table 2:
Conclusion
Based on the results of the performance testing, the Wooldridge Road Lift Station biofilter is meeting the required performance criteria and is eliminating odors as designed.
AIR BALANCING FROM THE THREE ODOR SOURCES
Odor Source Pipe Diameter Design Air Flow
Rate Actual Air Flow
Rate
Manhole Structure 8‐inch 345 cfm 360 cfm
Junction Structure 10‐inch 833 cfm 901 cfm
Lift Station Wet Well 16‐inch 2,488 cfm 2,770 cfm
6
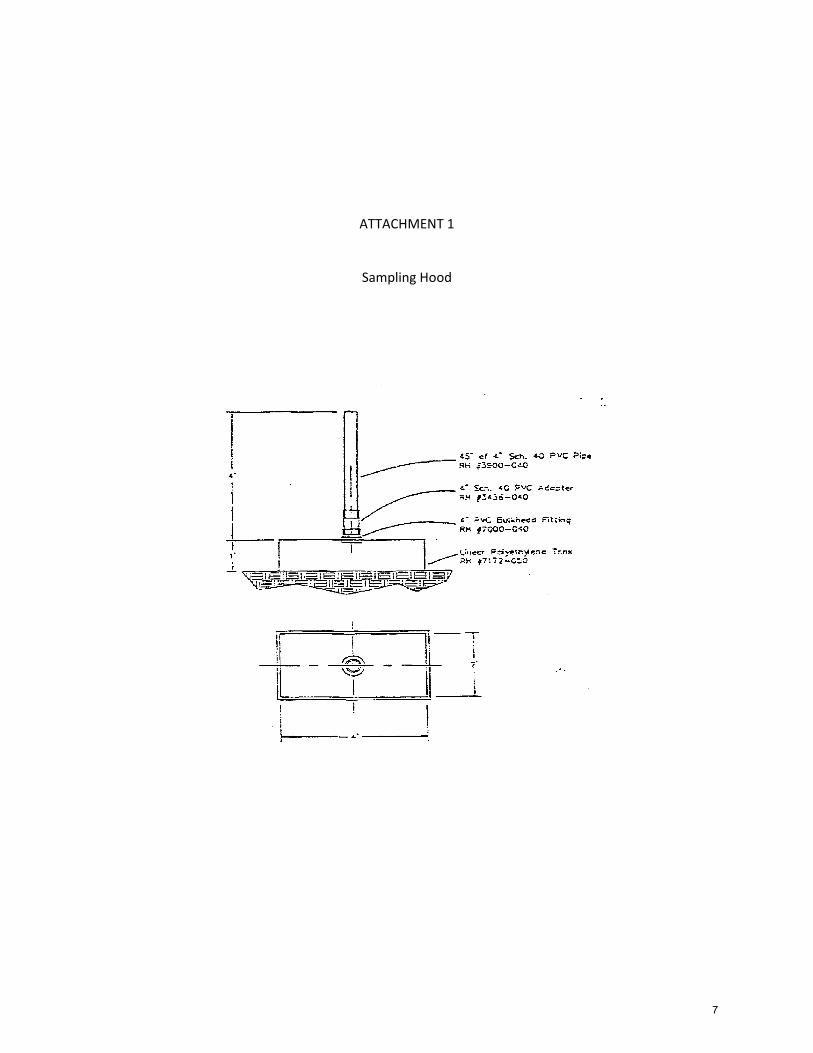
ATTACHMENT 1
Sampling Hood
7
ATTACHMENT 2
Calibration Certificate
8
I®~~!~~e~h~e,IAZ~~r2~~4~O~2~!~!:-EExclusive Manufacturer of Computrac@Moisture Analyzers and Jerome= Toxic GasAnalyzers
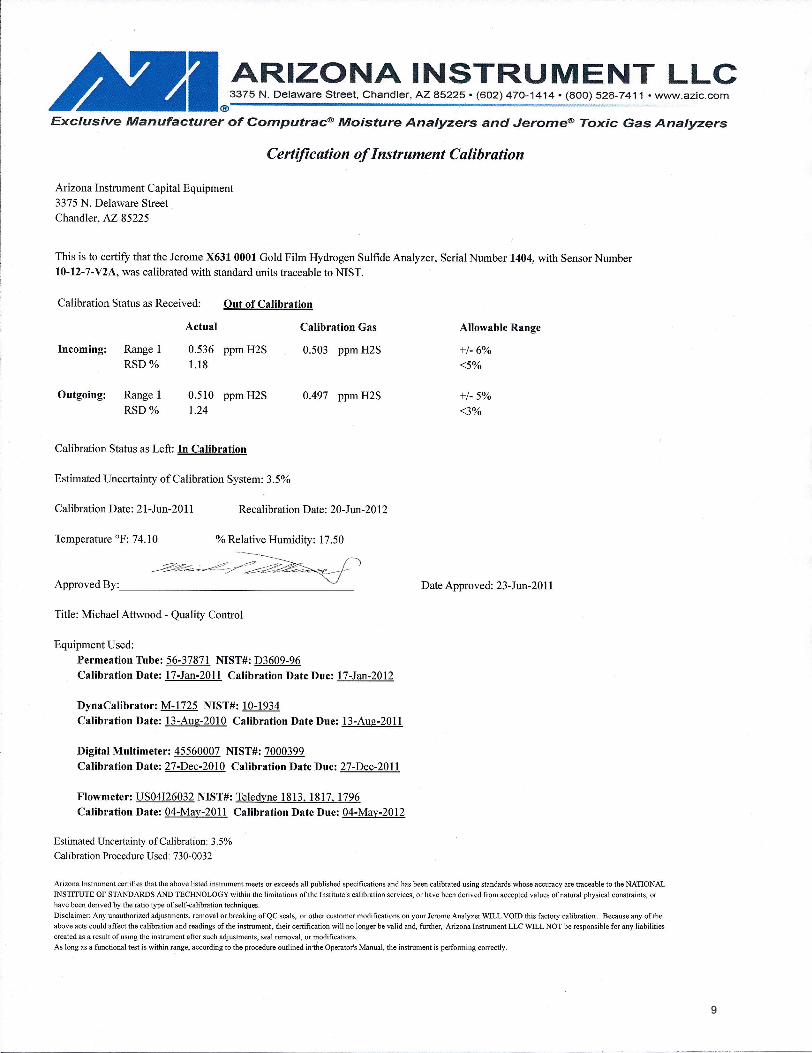
Certification of Instrument Calibration
Arizona Instrument Capital Equipment3375 N. Delaware StreetChandler, AZ 85225
This is to certify that the Jerome X631 0001 Gold Film Hydrogen Sulfide Analyzer, Serial Number 1404, with Sensor Number10-12-7-V2A, was calibrated with standard units traceable to NIST.
Calibration Status as Received: Out of Calibration
Actual Calibration Gas
Incoming: Range 1 0.536 ppmH2S 0.503 ppmH2SRSD% 1.18
Outgoing: Range 1 0.510 ppmH2S 0.497 ppmH2SRSD% 1.24
Allowable Range
+/- 6%<5%
+/- 5%<3%
Calibration Status as Left: In Calibration
Date Approved: 23-Jun-2011
Estimated Uncertainty of Calibration System: 3.5%
Calibration Date: 21-Jun-2011 Recalibration Date: 20-Jun-2012
Temperature OF:74.10 % Relative Humidity: 17.50
Title: Michael Attwood - Quality Control
Equipment Used:Permeation Tube: 56-37871 NIST#: D3609-96Calibration Date: 17-Jan-2011 Calibration Date Due: 17-Jan-2012
DynaCalibrator: M-I725 NIST#: 10-1934Calibration Date: 13-Aug-2010 Calibration Date Due: 13-Aug-2011
Digital Multimeter: 45560007 NIST#: 7000399Calibration Date: 27-Dec-201O Calibration Date Due: 27-Dec-2011
Flowmeter: US04126032 NIST#: Teledyne 1813, 1817, 1796Calibration Date: 04-May-2011 Calibration Date Due: 04-May-2012
Estimated Uncertainty of Calibration: 3.5%Calibration Procedure Used: 730-0032
Arizona Instrument certifies that the above listed instrument meets or exceeds all published specifications and has been calibrated using standards whose accuracy are traceable to the NATIONALINSTITUTE OF STANDARDS AND TECHNOLOGY within the limitations of the Institute's calibration services, or have been derived from accepted values of natural physical constraints, orhave been derived by the ratio type of self-calibration techniques.
Disclaimer: Any unauthorized adjustments, removal or breaking of QC seals, or other customer modifications on your Jerome Analyzer WILL VOID this factory calibration. Because any of theabove acts could affect the calibration and readings of the instrument, their certification will no longer be valid and, further, Arizona Instrument LLC WILL NOT be responsible for any liabilitiescreated as a result of using the instrument after such adjustments, seal removal, or modifications.As long as a functional test is within range, according to the procedure outlined in'the Operator's Manual, the instrument is performing correctly.
9
ATTACHMENT 3
Original Sampling Log
10
•..
_. _ .. -_ ..._--_._----------------------
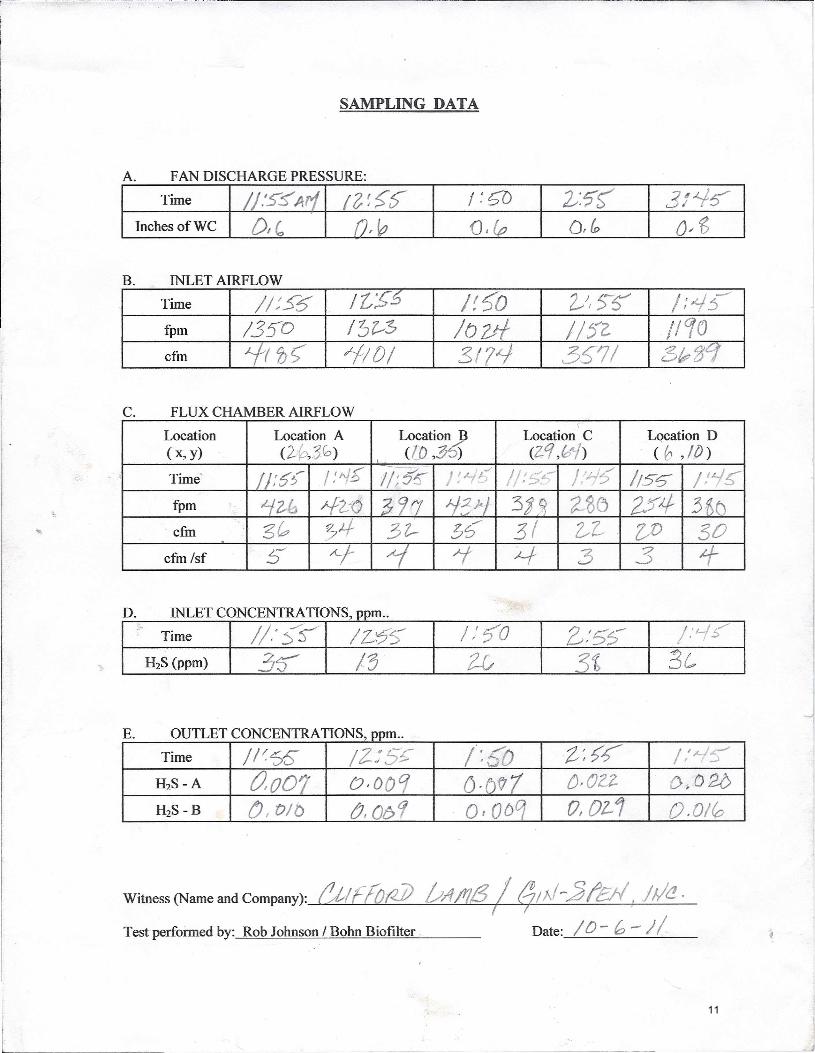
SAMPLING DATA
A. FAN DISCHARGE PRESSURE:
Time .'S'SAr1 I~~>:;- f :0D b:?~ 3f~~-Inches ofWC D" ,~ 0,& 0, fo O;~
B. INLET AIRFLOW
Time //:.5'6' It;~ J~5'o ~)I;>~ /:~j-fpm /3:;-0 15~3 10m 1/5'2, 111()cfm 1 fit; ~/O/ 3171- 351/ DI?3CJ
C FLUX CHAMBER AIRFLOW ,Location Location A Location )3 Location C Location D(x, y) (;U~,3~ )
\([0 ,3~) (zq,rolLj) (0,10)
Time" /):~:;- / :,,/6 / /: 5"5' J f 'J--./ 1/:5,40- //.1-1-5' 115~ /,'~s.;...; -'
fpm "-jZ,b /f2:0 397 if~J.-j 3j~ zse 254 3~()cfm 30 74 3'?- !;S 31 ~l- ~D 30
cfm Isf 5' Aj -Y ~ 4- 3 3 1-
D. INLET CONCENTRATIONS, pm ..I;' ;)'0
E. OUTLET CONCENTRATIONS, m ..
Time /1~'55 /2;55: /.~ Z;5'~ /,'~~'0H2S-A 0,007 (J,ooCf (j -of; 1 {),O22. 0,020H2S-B CJ I 0/ b (;,ob9 0,00 0,02-1 0.010
Witness (Name and Company): CtIFfofij) UAJIlt5 IIfIAf-.5IEN; JI/C!..
Test performed by: Rob Johnson I Bohn Biofilter. Date: / () - b - )1
11
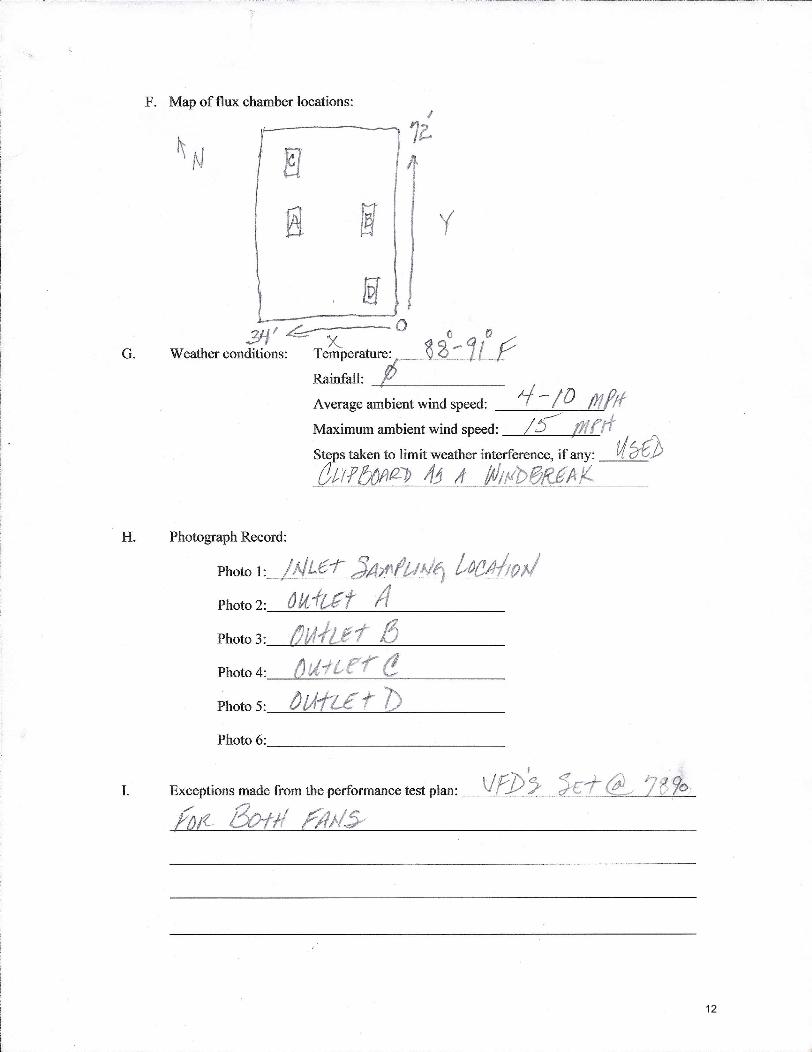
F. Map of flux chamber locations:
rI
Ie..
2I/1k- -0 0 0
G. Weather conditions: Te~erature: ~ 8 -11 fRainfall: --11'--------Average ambient wind speed: ;f -ID fJ1lffMaximum ambient wind speed: /5 fllrtfSteps taken to limit weather interference, if :y: 1;/fyf})etlfb()PI(2) I/j A /Al1t/Def(£Ar...
y
H. Photograph Record:
jivLe7- dAJf1flUNf.. lfJ{!ll!Jo'/Photo 2:_'--=:~~U~ft¥~·=----cyt~' ~fI~__v __
Photo 3:--4.L()-l!...!..IA~/L~e~t---=.:I3=-. _
Photo 4:_.!.L.().::..::U~.i;~t_e_r~e=-. _Photo 5:.----=~'___"IA'__''12L...::U::....::'---.., f~b"--- _
Photo 1:
Photo 6: ---'- _
I. Exceptions made from the performance test plan:
f/J1f- 130111 fA JI~
12
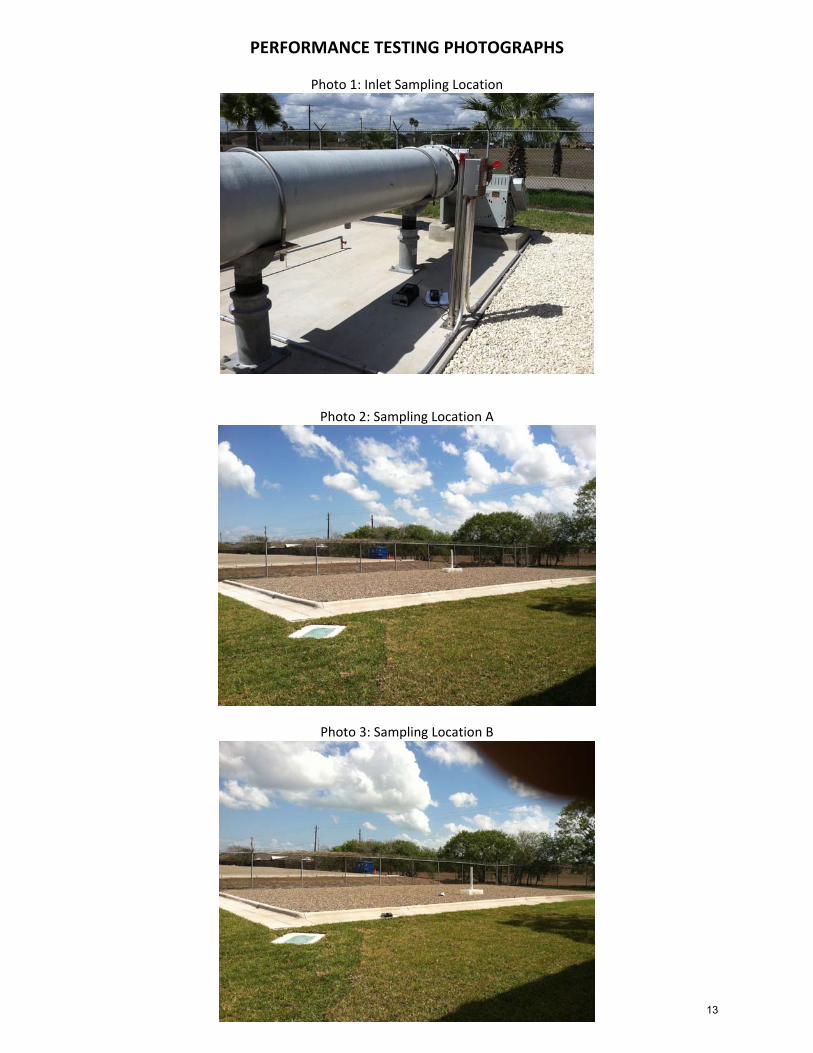
PERFORMANCE TESTING PHOTOGRAPHS
Photo 1: Inlet Sampling Location
Photo 2: Sampling Location A
Photo 3: Sampling Location B
13
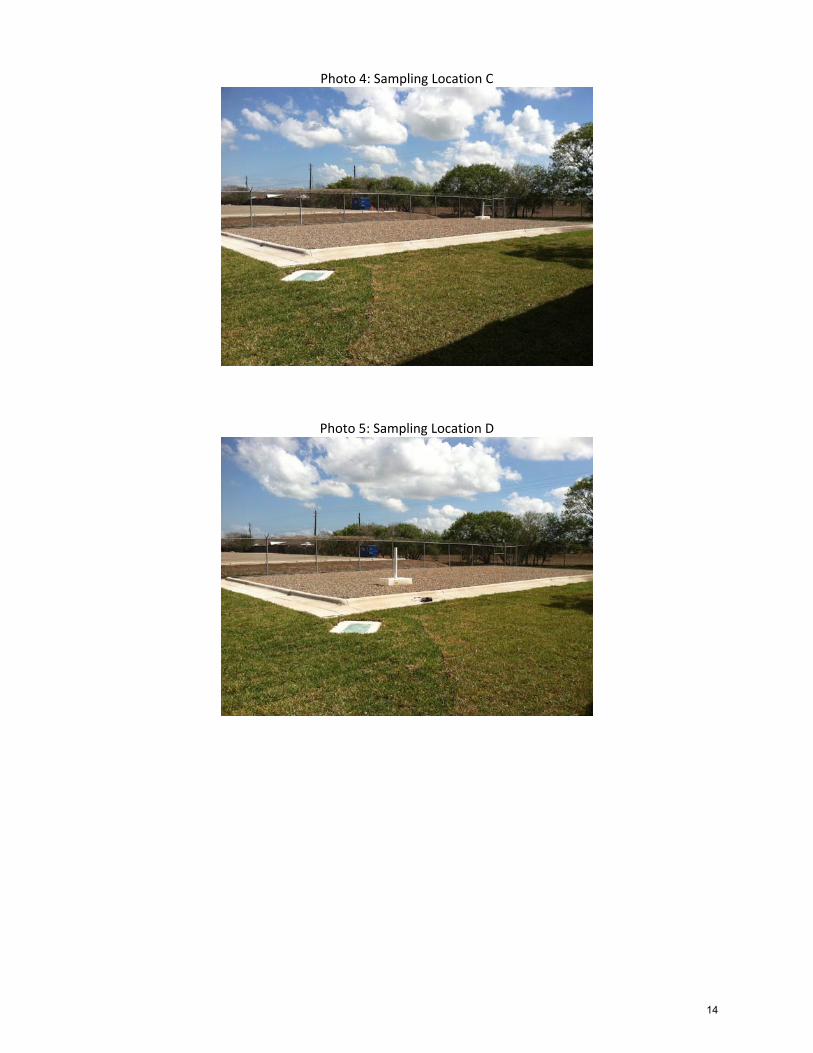
Photo 4: Sampling Location C
Photo 5: Sampling Location D
14