biofuel carbon capture & storage, - fapesp · biofuel carbon capture & storage, the...
TRANSCRIPT


Biofuel Carbon Capture & Storage, the Brazilian experience
Plinio NastariDATAGRO
FAPESP-NERC WORKSHOP ON SUSTAINABLE GAS FUTURE
February, 25th 2015FAPESP - Rua Pio XI, 1500 – Alto da LapaSão Paulo Brazil

Energy Consumption – Transport Sector2013 in Brazil
3
Source million tep %
Diesel 38,433 46.2%
Biodiesel 2,005 2.4%
Gasoline (pure) 24,393 29.3%
Ethanol 11,889 14.3%
Anhydrous 5,172 6.2%
Hydrous 6,717 8.1%
Kerosene 3,608 4.3%
Fuel Oil 957 1.2%
Electricity 162 0.2%
CNG 1,647 2.0%
Others 59 0.1%
Total 83,153 100.0%
Energy Consumption - Transport Sector
Source: BEN/MME

4
Source: DATAGRO
ETHANOL SHARE IN OTTO CYCLE FUEL DEMAND (in gasoline equivalent)
44.3%
41.8%
38.9%
37.0%
39.2%
38.1%
37.7% 37.3%
40.2%39.7%
39.4%
35.2%
40.7%
44.7%45.4%
44.6%
37.1%
31.8%
33.7%
36.2%
25%
30%
35%
40%
45%
50%
19
95
19
96
19
97
19
98
19
99
20
00
20
01
20
02
20
03
20
04
20
05
20
06
20
07
20
08
20
09
20
10
20
11
20
12
20
13
20
14
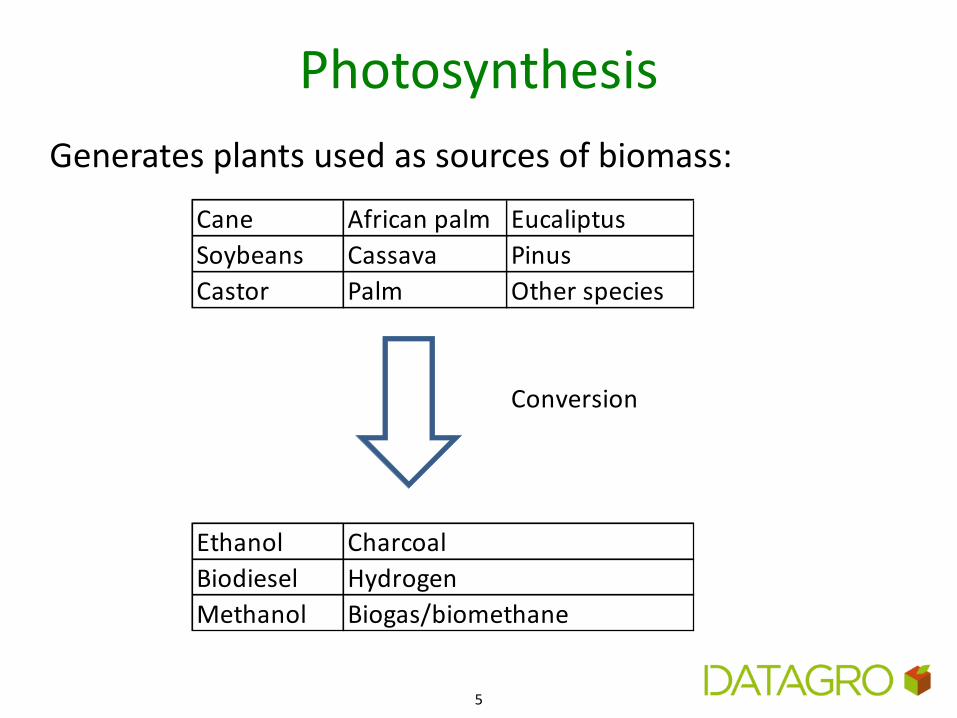
Photosynthesis
5
Generates plants used as sources of biomass:
Cane African palm Eucaliptus
Soybeans Cassava Pinus
Castor Palm Other species
Conversion
Ethanol
Biodiesel
Methanol
Charcoal
Hydrogen
Biogas/biomethane
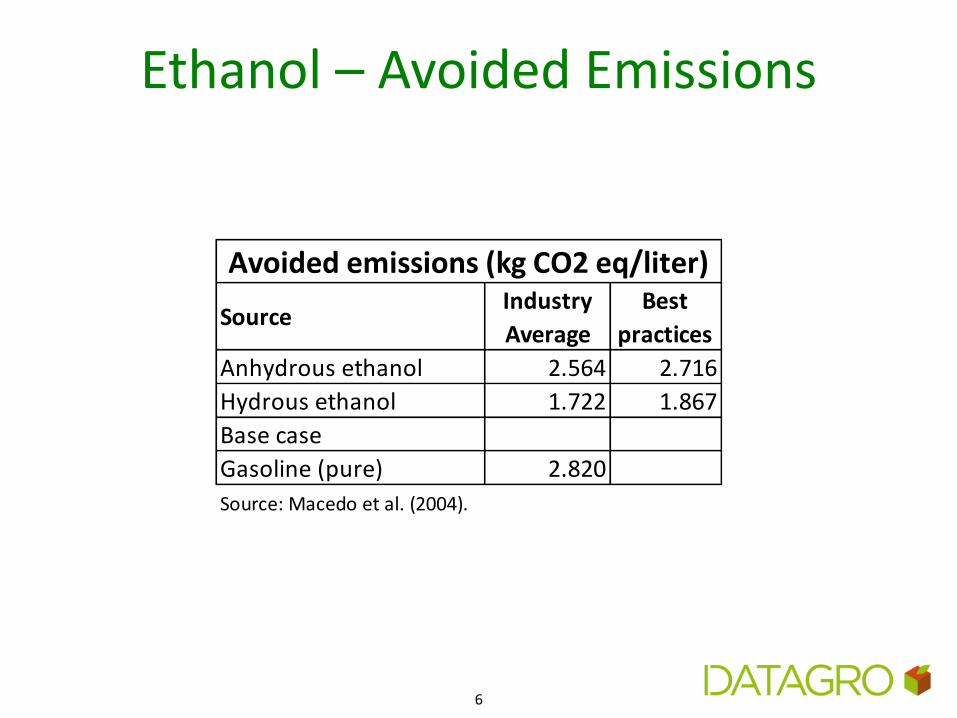
Ethanol – Avoided Emissions
6
SourceIndustry
Average
Best
practices
Anhydrous ethanol 2.564 2.716
Hydrous ethanol 1.722 1.867
Base case
Gasoline (pure) 2.820
Source: Macedo et al. (2004).
Avoided emissions (kg CO2 eq/liter)

Biodiesel – Avoided Emissions
7
SourceIndustry
Average
Biodiesel (B100)
Palm 2.760
Soy 2.530
Castor 1.760
Fossil Diesel 2.930
Source: EPE (2005).
Avoided emissions (kg CO2 eq/liter)

-
15,0
30,0
45,0
60,0
75,0
90,0
Mill
ion
ton
s o
f T
RS
eq
uiv
ale
nt
Sugar Anhydrous Hydrous
Brazilian Supply of Sugar+Ethanol (in TRS equivalent): with intense growth 2003-2010 period
Source: DATAGRONote: TRS is Total Reducing Sugars, a common denominator for sugar and ethanol.
31.3%
25.1%
43.6%
14/15eCS+N/NE

Gasoline30.77%
Flex Fuel67.00%
Ethanol2.23%
9
SIZE OF THE DOMESTIC FLEET (OTTO CYCLE)
Flex-Fuel Vehicle Fleet Vehicle Fleet by Type of Fuel (2014)
Flex cars were responsible for 67.0% of total light vehicle fleet. This proportionis rising every year:
2013: 63.12%
2012: 58.02%
2011: 52.07%
Source: DATAGRO Source: DATAGRO
0.05 0.381.19
2.61
4.59
6.88
9.47
12.23
14.92
17.96
20.85
23.12
-
5
10
15
20
25
20
03
20
04
20
05
20
06
20
07
20
08
20
09
20
10
20
11
20
12
20
13
20
14
MIllion units

32,9
38,0
35,9
38,2 37,6
35,5
30,0
32,0
34,0
36,0
38,0
40,0
09/10 10/11 11/12 12/13 13/14 14/15e
mill
ion
to
ns
Brazil: production of sugar has fallen since 2012
Source: Elaborated by DATAGRO, from data obtained with Sindicates of Producers.

25,7
27,4
22,6 23,2
27,5
28,2
20,0
22,0
24,0
26,0
28,0
30,0
09/10 10/11 11/12 12/13 13/14 14/15e
bill
ion
lit
ers
Brazil: a new record production of ethanol achieved in 2014/15
Source: Elaborated by DATAGRO, from data obtained with Sindicates of Producers.

Ethanol Production in Brazil(000 m3)
12
5,621.3 6,465.1 6,994.4
8,914.9 8,316.1 8,112.4 8,387.5 8,125.5 9,336.0
7,060.0 8,323.0 8,942.1
9,949.0
12,172.0 12,260.0
4,971.6
5,071.2 5,596.6
5,896.7 7,103.8 7,820.6
9,460.1
14,272.0
18,188.0
18,645.0
19,048.0
13,758.1 13,304.0
15,280.0 15,931.0
-
5,000.0
10,000.0
15,000.0
20,000.0
25,000.0
30,000.0
00/01 01/02 02/03 03/04 04/05 05/06 06/07 07/08 08/09 09/10 10/11 11/12 12/13 13/14 14/15e
Anhydrous ethanol Hydrous ethanol
Source: DATAGRO.

0,0%
10,0%
20,0%
30,0%
40,0%
50,0%
60,0%
70,0%
80,0%
90,0%
100,0%
Sugar Anhydrous Hydrous
A large shift in production mix since 2012/13
Fonte: DATAGRO
27.9% 31.3%
21.8% 25.1%
12/13 14/15
50.3% 43.6%

Consumption as Fuel(Gasoline, Anhydrous & Hydrous Ethanol, in billion liters/mo)
14
0.0
0.5
1.0
1.5
2.0
2.5
3.0
3.5
Bil
lio
n li
ters
/mo
nth
Gasoline A (pure) Anhydrous Hydrous Ethanol Total
Source: DATAGRO.

Biodiesel Production in Brazil(million liters)
15
1,608
2,386
2,673 2,717 2,917
3,414
1,000
1,500
2,000
2,500
3,000
3,500
4,000
2009 2010 2011 2012 2013 2014
Source: ANP/MME.

Avoided Emissions from Biofuels(used as fuel only) in Brazil- 2014
16
SourceIndustry
Average
Best
practices
Industry
AverageBest practices
Anhydrous ethanol 2.564 2.716 28,437.48 30,123.32
Hydrous ethanol 1.722 1.867 22,375.87 24,260.01
Biodiesel (soy) 2.530 8,637.65
59,451.00
Source: DATAGRO.
Avoided Emissions
(kg CO2 eq/liter) (2014 total in 000 tons CO2 eq)
Biofuels total

Total Volume of Ethanol Used as Fuel (1975-2014) in Gasoline Equivalent (in million liters)
17
0
5,000
10,000
15,000
20,000
25,000
Anhydrous Hydrous Total Ethanol in Gasoline equivalent383.7
283.8
167.2
Total (bi liters)
Source: Datagro
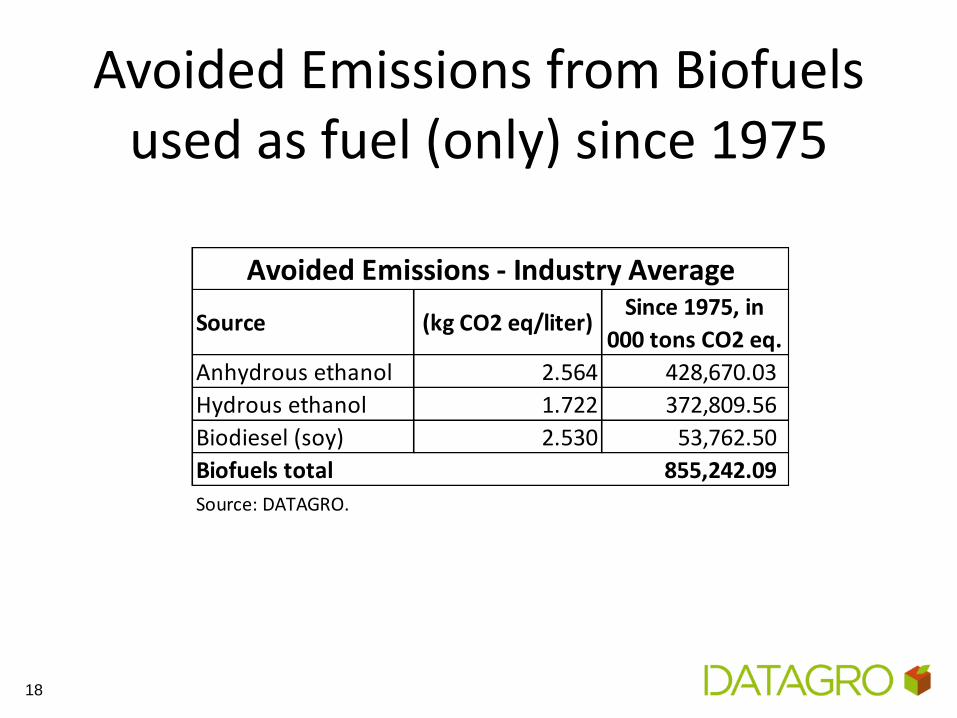
Avoided Emissions from Biofuelsused as fuel (only) since 1975
18
Source (kg CO2 eq/liter)Since 1975, in
000 tons CO2 eq.
Anhydrous ethanol 2.564 428,670.03
Hydrous ethanol 1.722 372,809.56
Biodiesel (soy) 2.530 53,762.50
855,242.09
Source: DATAGRO.
Avoided Emissions - Industry Average
Biofuels total

Ethanol substituted between 1975-2014 2.41 billion barrels of gasoline
Proved reserves of oil & condensates(including Pre-Salt) in 2014:
13.13 billion barrels (SEC),or 16.61 billion barrels (SPE/WPC).
Between 1975 & 2014, volume de gasoline substituted by ethanol:
2.41 billion barrels
At current pace, every year another 127 million barrelsare substituted without the need of new investmentsbecause it is renewable!
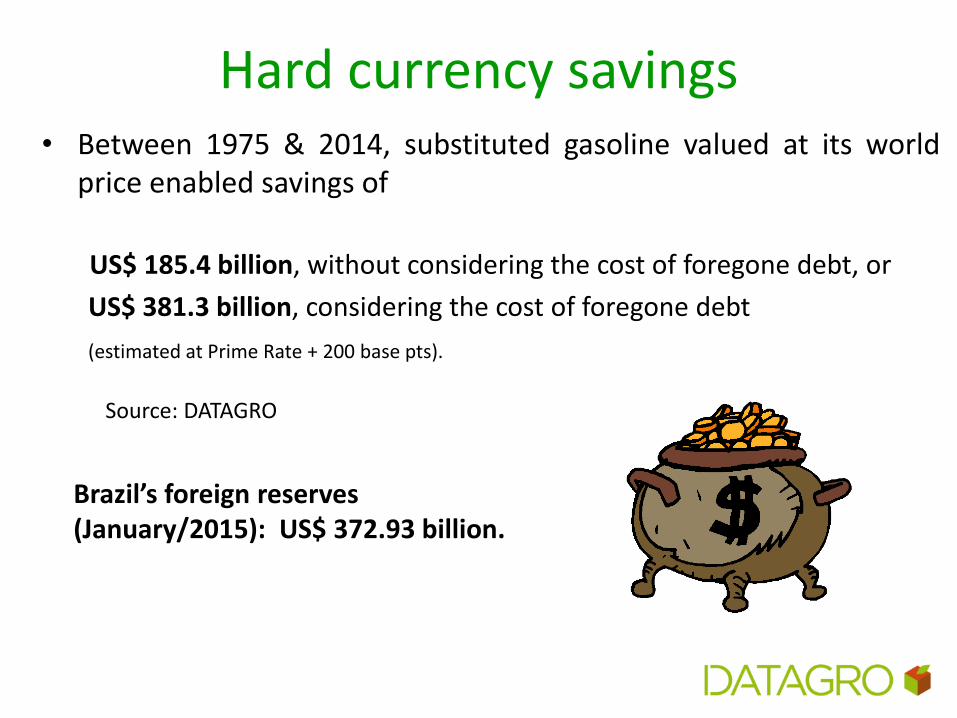
Hard currency savings• Between 1975 & 2014, substituted gasoline valued at its world
price enabled savings of
US$ 185.4 billion, without considering the cost of foregone debt, or
US$ 381.3 billion, considering the cost of foregone debt
(estimated at Prime Rate + 200 base pts).
Brazil’s foreign reserves(January/2015): US$ 372.93 billion.
Source: DATAGRO

Additional Potential
• Brazil has great potential for large scale biogas & biomethane use using organic residues from agrindustrial activity and urban waste.
• Large potential for substitution of fossil diesel (biomethane) and power (biogas) in distributed generation.
21

TODOS OS DIREITOS RESERVADOS22
Biomethane, Renewable Substitute to Diesel
Substituição de Diesel a partir do Resíduo de Cana
Produção descentralizada
• 43% da área total do território brasileiro;
• 81% da população brasileira; e
• As principais capitais brasileiras estão a menos de 200km de uma usina sucroenergética.
Eficiência logística
Redução das importações
• Possibilidade de aumentar em U$ 6,1 bilhões o saldo positivo da Balança Comercial, ao substituir o diesel importado por biometano renovável.
Desenvolvimento das regiões rurais
• Possibilidade de gerar aproximadamente 25 empregos diretos por usina em áreas rurais.
23
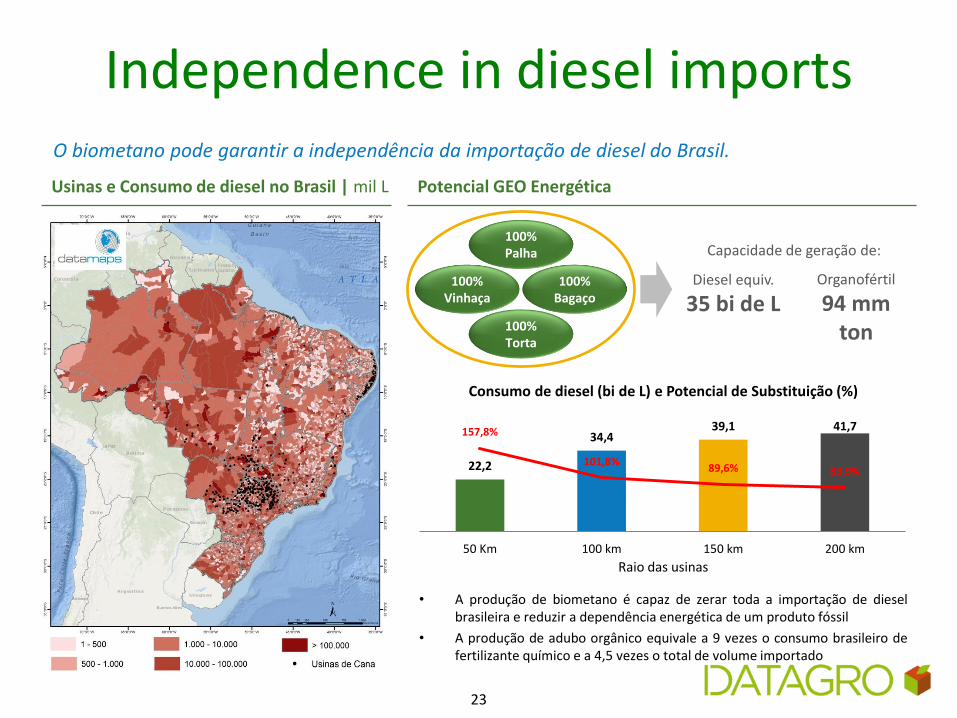
Independence in diesel imports
• A produção de biometano é capaz de zerar toda a importação de dieselbrasileira e reduzir a dependência energética de um produto fóssil
• A produção de adubo orgânico equivale a 9 vezes o consumo brasileiro defertilizante químico e a 4,5 vezes o total de volume importado
O biometano pode garantir a independência da importação de diesel do Brasil.
Usinas e Consumo de diesel no Brasil | mil L Potencial GEO Energética
Capacidade de geração de:
Diesel equiv.
35 bi de LOrganofértil
94 mm ton100%
Torta
100% Bagaço
100% Palha
100% Vinhaça
22,2
34,439,1 41,7157,8%
101,8%89,6% 83,9%
0,0 %
20, 0%
40, 0%
60, 0%
80, 0%
100 ,0%
120 ,0%
140 ,0%
160 ,0%
180 ,0%
200 ,0%
0,0
5,0
10, 0
15, 0
20, 0
25, 0
30, 0
35, 0
40, 0
45, 0
50 Km 100 km 150 km 200 km
Consumo de diesel (bi de L) e Potencial de Substituição (%)
Raio das usinas

24
Organic Residues
24
Complementariedade com o modelo de cana
• As terras destinadas às plantações de cana e à pecuária não ficam localizadas na mesma região garantindo assim uma melhor distribuição pelo território nacional.
Alta produtividade na biodigestão
• Comparado à biodigestão de cana, os resíduos animais apresentaram um produtividade 35% maior.
Solução para o problema de resíduos
• Diferentemente do mercado sucroenergético, os resíduos animais são considerados um problema. A biodigestão é uma solução operacional e economicamente interessante para o mercado.
Substituição de Diesel a partir de Resíduos Animais

PLANTING DATAHARVESTING SOLUTIONS
www.datagro.com+55 11 4133 3944
FUTURE EVENTS CALENDAR
13 May 2015 (New York Sugar Dinner)
9th ISO DATAGRO New York Sugar & Ethanol Conference
Waldorf=Astoria Hotel, New York
10 July 2015
4th Sugar & Ethanol Summit – Brazil Day
IoD – Institute of Directors, London
25 August 2015
4th DATAGRO Ceise Br Fenasucro Conference
Sertaozinho, Brazil
21-22 September 2015 (Sao Paulo Sugar Dinner)
15th DATAGRO International Conference on Sugar & Ethanol
Grand Hyatt São Paulo, Brazil
25

PLANTING DATAHARVESTING SOLUTIONS