biofuel opportunities for solid waste management...
TRANSCRIPT
Biofuel Opportunities for Solid Waste Management Systems
11/13/2013
Gershman, Brickner & Bratton, Inc. 1
Biofuel Opportunities for Solid Waste Management Systems
Harvey W. Gershman
Gershman, Brickner & Bratton, Inc.
Fairfax, VA USA
November 13, 2013
GBB – Quality – Value – Ethics – Results
• Established in 1980
• Solid Waste Management and Technology Consultants
• Helping Clients Turn Problems into Opportunities
2
Biofuel Opportunities for Solid Waste Management Systems
11/13/2013
Gershman, Brickner & Bratton, Inc. 2
GBB Waste Technology Services
• Economic, technical, and environmental reviews
• Markets development • Process planning and design • Waste characterization and
sourcing• Procurement and negotiation
assistance• Independent feasibility
consultant• Technology due diligence• Acceptance testing and
operations monitoring
3
4
www.rewmag.com

Biofuel Opportunities for Solid Waste Management Systems
11/13/2013
Gershman, Brickner & Bratton, Inc. 3
SOLID WASTE MANAGEMENTIN THE U.S.
5
EPA Significant Changes to the Waste Management Policy, 2005EPA Waste Hierarchies
6

Biofuel Opportunities for Solid Waste Management Systems
11/13/2013
Gershman, Brickner & Bratton, Inc. 4
• Costs and revenues affected by:– community size
– government structure
– politics
– facilities used
– waste supply agreements
– Revenue sharing back to customer
• Collection – Residential solid waste : $10 ‐ $40 USD$ per month per household
– Residential recycling $2 ‐ $4 per month per household
• Commercial waste– charged on a per month per box basis, and may include a separate pass‐through cost for
disposal charges.
– 2 cubic yard box serviced once per week = $60 ‐ $140 per month
– 6 cubic yard box serviced once per week = $130 ‐ $280 per month
• WTE tipping fee = $68/ton (2010)
• Landfill tipping fee = $45/ton (2012)
7
Cost of Collection and Disposal
Collection‐MSW41%
Collection‐Recyclables
20%
Recycling Processing
8%
Disposal31%
Historical Waste Generation & Management, 1960 ‐ 2011
Source: US EPA, Municipal Solid Waste in the United States, 2011 Facts and Figures
8
0
50
100
150
200
250
300
1960 1970 1980 1990 2000 2005 2007 2008 2009 2010 2011
MSW Generation
Discards toLandfill, otherDisposalRecovery forRecycling
Combustion withEnergy Recovery
Recovery forComposting

Biofuel Opportunities for Solid Waste Management Systems
11/13/2013
Gershman, Brickner & Bratton, Inc. 5
Disposition of MSW in the U.S.
EPA Estimate: 250 million tons (2011)
Discarded53.60%Recovery
34.70%
Combustion with Energy Recovery11.70%
Biocycle Estimate: 389 million tons (2008)
9
Discarded69.30%
Recovered24.10%
Combustion with Energy Recovery6.70%
Generation and Recovery of Material Types (EPA, 2011)
10
MaterialWeight Generated
(million tons)
Weight Recovered
(million tons)
Recovery as Percent
of Generation
Paper and paperboard 71.31 44.57 62.5%
Glass 11.53 3.13 27.1%
Metals 22.41 7.87 35.1%
Plastics 31.04 2.55 8.2%
Rubber and leather 7.78 1.17 15.0%
Textiles 13.12 1.97 15.0%
Wood 15.88 2.30 14.5%
Food 34.76 0.97 2.8%
Yard trimmings 33.40 19.20 57.5%
Total other wastes 80.63 21.58 26.8%
Total MSW 249.86 85.14 34.1%

Biofuel Opportunities for Solid Waste Management Systems
11/13/2013
Gershman, Brickner & Bratton, Inc. 6
Recycling and Material Recovery Facilities
• In 1970, US relied on local scrap yards and waste paper dealers to receive and prepare materials for recycling
• Now, US also has MRFs:
11
MRF Type Number of MRFs
Year: 2006 2012
Single Stream 144 263
Dual Stream 227 228
Source Separated,
Other Programs127 95
All MRFS 437 586
Materials Recycling and Processing
in the United States (BERENYI, 2012)
TechnologyOperating Plants
Daily Design Capacity (TPD)
Annual Capacity (1)
(Million Tons)
Mass Burn (see note) 65 71,354 22.1
Modular 9 1,342 0.4
RDF ‐Processing & Combustion
10 15,428 4.8
RDF ‐Processing Only 5 6,075 1.9
RDF ‐Combustion Only 5 4,592 1.4
Total U.S. Plants (2) 94 98,791 30.6
WTE Facilities 89 92,716 28.7
12
U.S. WTE Plants, by Technology
Note: A few of these WTE (mass-burning) plants have recently announced closings, typically at end-of-term of initial 20-year debt financings and/or due to other local economic reasons
Biofuel Opportunities for Solid Waste Management Systems
11/13/2013
Gershman, Brickner & Bratton, Inc. 7
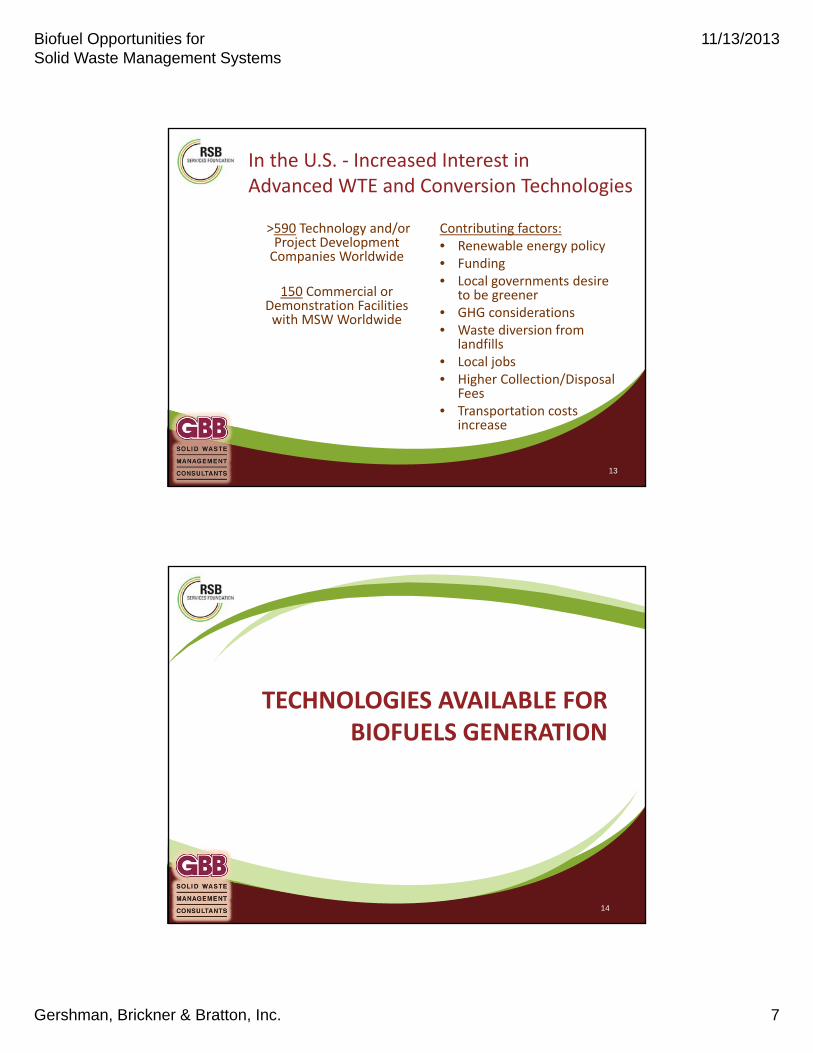
In the U.S. ‐ Increased Interest in Advanced WTE and Conversion Technologies
>590 Technology and/or Project Development Companies Worldwide
150 Commercial or Demonstration Facilities with MSW Worldwide
Contributing factors:• Renewable energy policy • Funding• Local governments desire
to be greener• GHG considerations• Waste diversion from
landfills• Local jobs• Higher Collection/Disposal
Fees• Transportation costs
increase
13
TECHNOLOGIES AVAILABLE FOR BIOFUELS GENERATION
14
Biofuel Opportunities for Solid Waste Management Systems
11/13/2013
Gershman, Brickner & Bratton, Inc. 8
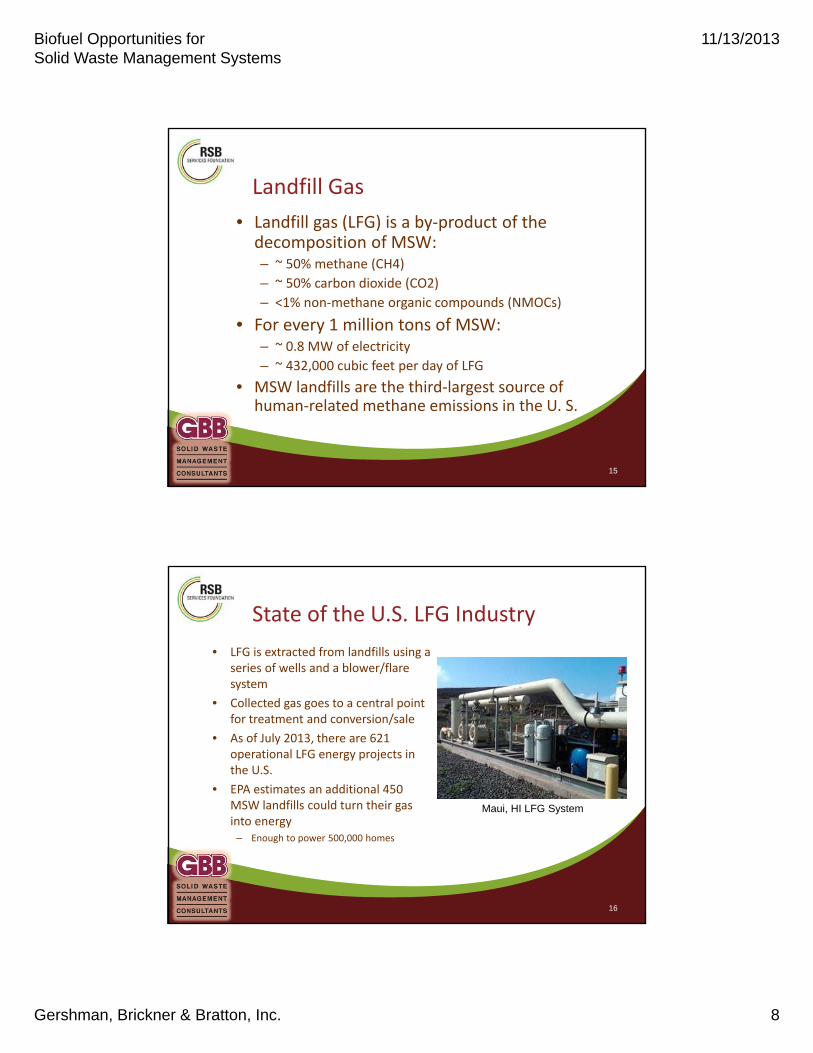
• Landfill gas (LFG) is a by‐product of the decomposition of MSW:– ~ 50% methane (CH4)
– ~ 50% carbon dioxide (CO2)
– <1% non‐methane organic compounds (NMOCs)
• For every 1 million tons of MSW:– ~ 0.8 MW of electricity
– ~ 432,000 cubic feet per day of LFG
• MSW landfills are the third‐largest source of human‐related methane emissions in the U. S.
Landfill Gas
15
• LFG is extracted from landfills using a series of wells and a blower/flare system
• Collected gas goes to a central point for treatment and conversion/sale
• As of July 2013, there are 621 operational LFG energy projects in the U.S.
• EPA estimates an additional 450 MSW landfills could turn their gas into energy
– Enough to power 500,000 homes
State of the U.S. LFG Industry
16
Maui, HI LFG System

Biofuel Opportunities for Solid Waste Management Systems
11/13/2013
Gershman, Brickner & Bratton, Inc. 9
• Partial combustion in an air‐controlled environment
• Product: Syngas for production of electricity, chemicals/ fuels (ethanol)
• Feedstocks: biomass, medical waste, demonstration‐scale MSW
• Plasma gasification: a plasma arc is used as a heat source
17
Gasification
• Thermal conversion in the absence of oxygen
• Non‐recyclable plastics to oils, fuels
18
Pyrolysis
Biofuel Opportunities for Solid Waste Management Systems
11/13/2013
Gershman, Brickner & Bratton, Inc. 10
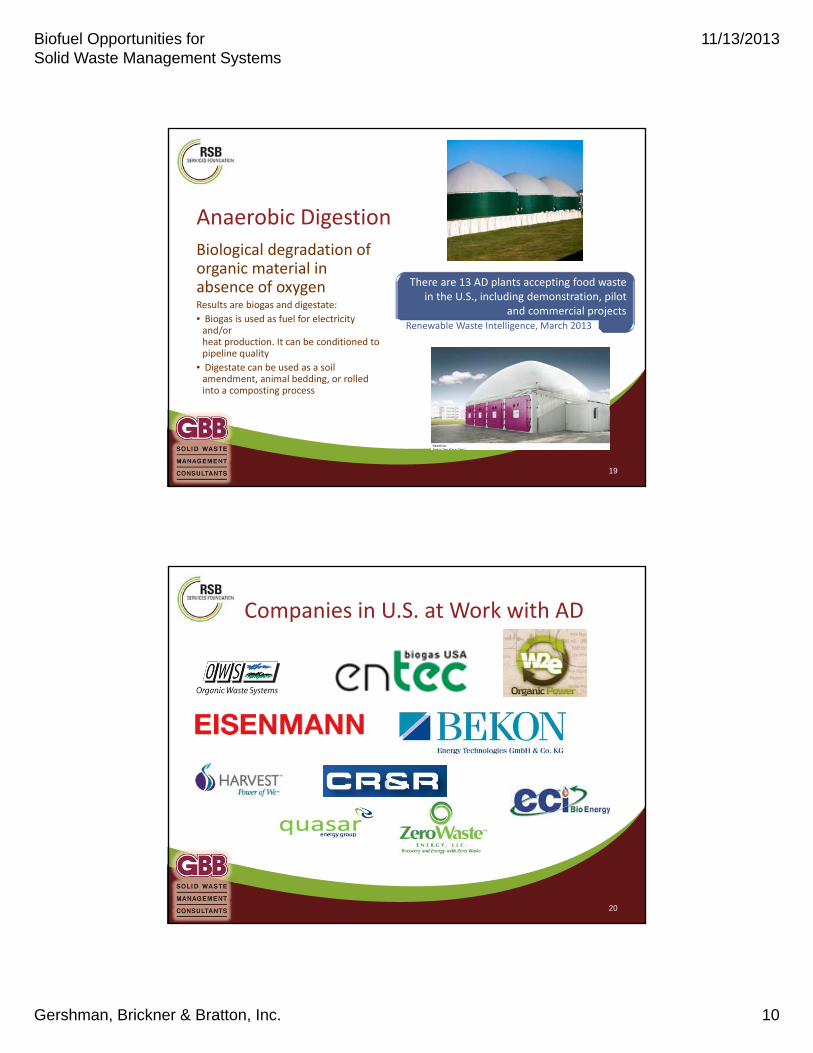
Anaerobic Digestion
Biological degradation of organic material in absence of oxygenResults are biogas and digestate:
• Biogas is used as fuel for electricity and/or heat production. It can be conditioned to pipeline quality
• Digestate can be used as a soil amendment, animal bedding, or rolled into a composting process
19
There are 13 AD plants accepting food waste in the U.S., including demonstration, pilot
and commercial projectsRenewable Waste Intelligence, March 2013
Companies in U.S. at Work with AD
20

Biofuel Opportunities for Solid Waste Management Systems
11/13/2013
Gershman, Brickner & Bratton, Inc. 11
Alternative Risks/Liability Risk Summary
Landfill Gas to Energy
Proven technology; widespread U.S. commercial experience
Low
Anaerobic Digestion
Proven technology; limited U.S. commercial experience
Moderate to Low
PyrolysisPrevious failures at scale, uncertain commercial potential; no operating experience with large ‐scale operations
High
GasificationLimited operating experience at only small scale; subject to scale‐up issues
High
Chemical Decomposition
Technology under development; not a commercial option at this time
High
21
Technologies and Risk
Source: GBB, 2013
Technology Commercialization Examples
LocationEdmonton, Alberta, CA
Vero Beach, FL Storey, NV Monterey, CA Sacramento, CA
Technology
Gasification/
Catal.Conv. of Syngas
Gasification/
Ferment. ofSyngas
Gasification/
Catalytic Conv. of Syngas
AnaerobicDigestion
AnaerobicDigestion
Developer Enerkem INEOS BioFulcrum Bioenergy
Zero Waste Energy
Clean World Partners
FeedstockNon‐recycled
MSWYard, vegetative,residential waste
Post‐sorted MSW
SSO (food and yard waste)
Commercial food waste
Throughput (TPD)
300 450 400 15 100
Energy Products
Methanol; Ethanol
EthanolEthanol; Propanol
Biogas; Electricity
Biogas; Electricity
Cost $80M $130M $120M $1.6M $12M
Federal Grants/Loan Guarantees
$23.5M $125M ‐‐ ‐‐ $1.8M
Start Date 2014 June 2012 2015 Jan 2013 2014
22

Biofuel Opportunities for Solid Waste Management Systems
11/13/2013
Gershman, Brickner & Bratton, Inc. 12
• Example of Locations advancing new facilities with thermal technologies:
– Edmonton, Alberta and Pontotoc, MS – Enerkem
– City of Los Angeles, CA – Green Conversion Systems
• Anaerobic digestion specific RFPs issued:
– Humboldt Waste Management Authority, Eureka, CA
– Montgomery, AL‐ under construction w/Zero Waste Energy
• Anaerobic Digestion plants under development :
– City of Newport News, VA‐ quasar
– Town of Bourne, MA‐ Harvest Power
– Town of Brunswick, ME‐quasar and Village Green Ventures
– City of Columbia, SC‐ w/W2E
– City of Portland, OR‐ w/Columbia Biogas
– Monticello, IN‐ w/ Waste No Energy LLC
– City of Charlotte, NC‐ w/Blue Sphere
Locations Advancing Technologies
23
• City of Denton, TX uses LFG to fuel a 3 million gal/year biodiesel production facility
• Los Angeles, CA converts LFG into CNG to fuel landfill equipment (Puente Hills LF)
• Orange Co, CA – first commercial LFG‐to‐LNG facility online Jan. ‘07 – used in county waste trucks (Frank R. Bowerman LF)
• Central LF, CA plans to convert LFG to CNG to fuel Sonoma County school buses
• Franklin Co, OH uses LFG to produce methanol as a feedstock for biodiesel and a separate CNG plant
• Waste Management, Inc. in CA produces 10‐20K gal LNG per day for garbage trucks
24
Locations Advancing LFG to Fuels Projects
Biofuel Opportunities for Solid Waste Management Systems
11/13/2013
Gershman, Brickner & Bratton, Inc. 13
BIOFUEL USE IN FLEETS
25
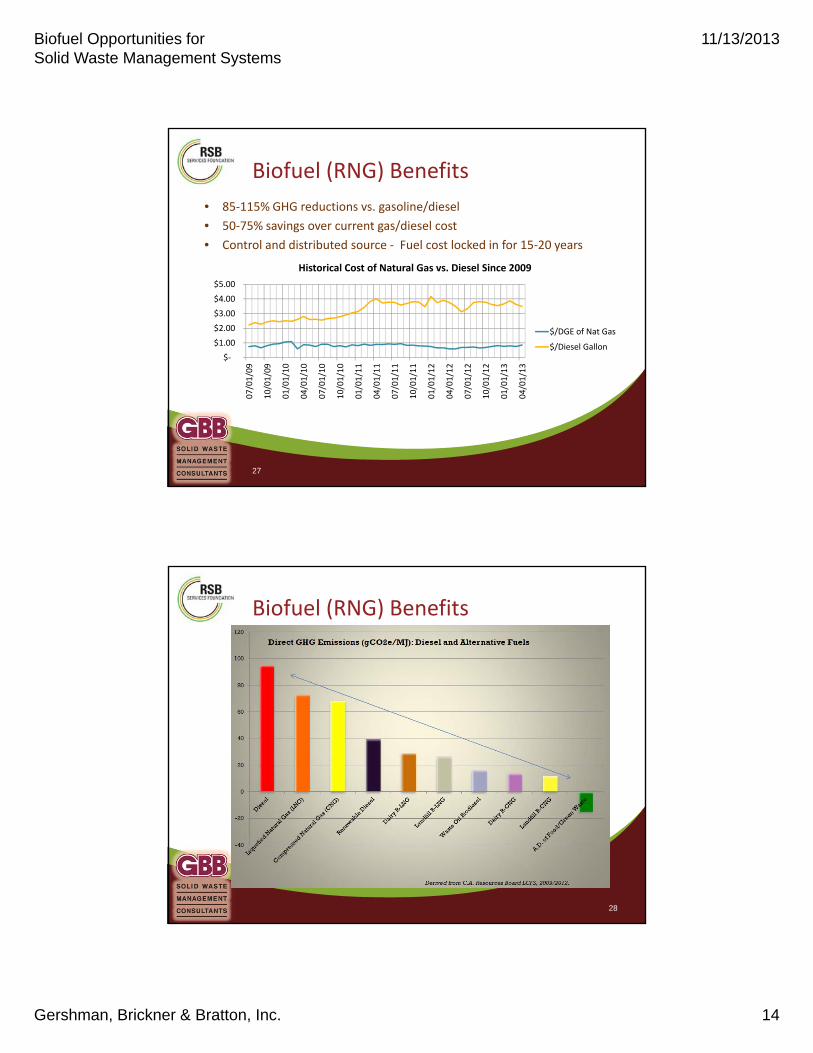
Pathway from Waste to RNG
26
Source: BioCNG
Biofuel Opportunities for Solid Waste Management Systems
11/13/2013
Gershman, Brickner & Bratton, Inc. 14
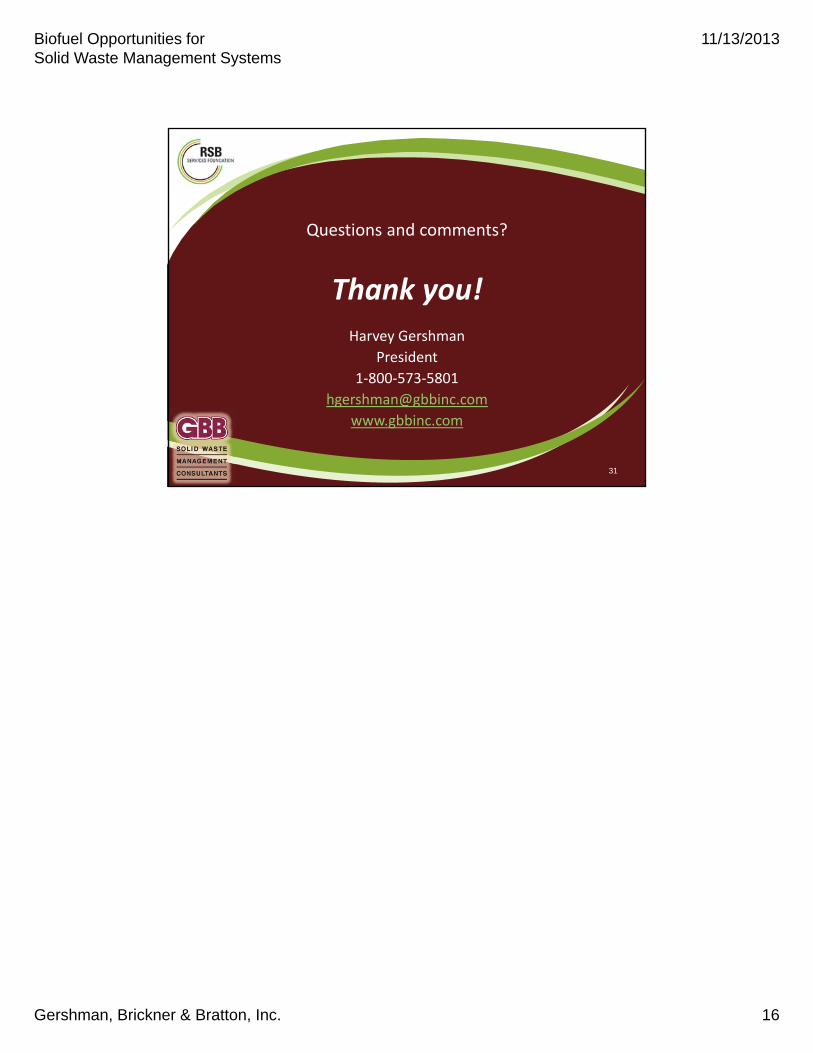
Biofuel (RNG) Benefits
• 85‐115% GHG reductions vs. gasoline/diesel
• 50‐75% savings over current gas/diesel cost
• Control and distributed source ‐ Fuel cost locked in for 15‐20 years
27
$‐
$1.00
$2.00
$3.00
$4.00
$5.00
07/01/09
10/01/09
01/01/10
04/01/10
07/01/10
10/01/10
01/01/11
04/01/11
07/01/11
10/01/11
01/01/12
04/01/12
07/01/12
10/01/12
01/01/13
04/01/13
Historical Cost of Natural Gas vs. Diesel Since 2009
$/DGE of Nat Gas
$/Diesel Gallon
28
Biofuel (RNG) Benefits

Biofuel Opportunities for Solid Waste Management Systems
11/13/2013
Gershman, Brickner & Bratton, Inc. 15
Waste Site State Vehicles fueled with RNG
Altamont Landfill CA 300‐400 refuse trucks
Fair Oaks Dairy IN 42 milk delivery trucks
Rodefeld Landfill WI 25‐30 vehicles
Sauk Trail Hills Landfill MI RNG leaves site via pipeline
Columbus bio‐Energy Digester OH 25+ vehicles
Janesville Wastewater Plant WI 40+ vehicles by 2022
St. Landry Parish Landfill LA 15+ vehicles
Rumpke Landfill OH 10‐15 refuse trucks
Selected RNG Projects
29
Source: “RENEWABLE NATURAL GAS (RNG): The Solution to a Major Transportation Challenge,” Energy Vision, New York, September 2012
Opinion: Trends for the Future
30
• Many conversion projects advancing
• AD development moving quickly
• AD developments coming in 2‐3 years; thermal technologies will need 4‐6 years to learn what works and all need to clarify their economics
• Continuation of public sector taking “Low Risk” attitude until “proven”
• Demand for more recyclables expected to continue at attractive pricing
• RNG is a fantastic opportunity to coordinate between integrated solid waste management systems and transportation demands
Biofuel Opportunities for Solid Waste Management Systems
11/13/2013
Gershman, Brickner & Bratton, Inc. 16
Thank you!
Questions and comments?
Harvey Gershman
President
1‐800‐573‐5801
www.gbbinc.com
31