biofuels vs fossil fuels teacher guide vs... · wisconsin energy institute – 3 tableof)contents)...
TRANSCRIPT

Wisconsin Energy Institute – www.energy.wisc.edu/education 1
Biofuels vs Fossil Fuels
The Biofuels vs Fossil Fuels unit has students explore the similarities and differences
between fossil fuels and biofuels. In the process, students investigate the carbon-‐transforming processes of combustion, photosynthesis, fermentation and respiration. They apply their knowledge of these processes to the global carbon cycle to examine how use of fossil fuels and biofuels have different effects on atmospheric carbon dioxide levels and consequently global climate change. Students use their understanding of the global carbon cycle to study the claim that biofuels such as ethanol made from plant material, can help reduce the rate of increase of atmospheric carbon dioxide. In addition, students examine the environmental impact of biofuels agriculture. Overall, this unit has three important goals. These focus on:
1. Matter and energy changes associated with the carbon-‐transforming processes. 2. The effects of the use of fossil fuels and biofuels on the global carbon cycle and global
climate change. 3. A cost/benefit analysis of the production and use of biofuels.
This is meant to be a stand-‐alone unit, however we strongly recommend that teachers use the Biofuels Supplement, a shorter version, along with the entire suite of Carbon TIME units. Our research shows that students need this type of sustained instruction to master systematic thinking about matter and energy in biological and geological systems. Principal Authors Joyce Parker, Great Lakes Bioenergy Research Center and Department of Geological Sciences, Michigan State University Charles “Andy” Anderson, Department of Teacher Education, Michigan State University Editors Contributing Authors: Elizabeth Xeng de los Santos Illustrations by Craig Douglas

Wisconsin Energy Institute – www.energy.wisc.edu/education 2
Acknowledgments This unit is derived from the six units developed by the Carbon TIME project, a
partnership including Michigan State University, National Geographic Educational Programs, Seattle Public Schools, and the Natural Resources Ecology Laboratory. Development is supported by the Great Lakes Bioenergy Research Center and the Wisconsin Energy Institute at University of Wisconsin.
This research is supported in part by grants from the National Science Foundation: Learning Progression on Carbon-‐Transforming Processes in Socio-‐Ecological Systems (NSF 0815993), and Targeted Partnership: Culturally relevant ecology, learning progressions and environmental literacy (NSF-‐0832173), and CCE: A Learning Progression-‐based System for Promoting Understanding of Carbon-‐transforming Processes (DRL 1020187). Additional support comes from the DOE Great Lakes Bioenergy Research Center (DOE BER Office of Science DE-‐FC02-‐07ER64494).
Any opinions, findings, and conclusions or recommendations expressed in this material are those of the author(s) and do not necessarily reflect the views of the National Science Foundation or the United States Department of Energy. Questions? Let us know if you have any questions or concerns regarding this biofuels unit. Send us an email at [email protected]. We’d love to hear from you!

Wisconsin Energy Institute – www.energy.wisc.edu/education 3
Table of Contents Unit at a Glance .......................................................................................................................... 4 Unit Goals ................................................................................................................................... 5 Table 1: Next Generation Science Standards .......................................................................... 5
Using crosscutting concepts as lenses for biology ...................................................................... 6 Scientific and engineering practices ........................................................................................... 6 Students’ conceptions of matter and energy ............................................................................. 7 Table 2. Developmental stages of students’ reasoning about matter and energy ................. 7
Lesson 1: Introduction to Fuels .............................................................................................. 8
Lesson 1 Activity 1: Biofuels Pretest ........................................................................................... 8 Lesson 1 Activity 2: Which substances burn? .......................................................................... 11 Lesson 1 Activity 3: Investigating Burning/Combustion ........................................................... 13 Lesson 1 Activity 4: Investigating Plant Growth ....................................................................... 17 Lesson 1 Activity 5: Photosynthesis .......................................................................................... 21 Lesson 1 Activity 6: What do plants do with sugar? ................................................................ 23
Lesson 2: Making the Biofuel, Ethanol .................................................................................. 27
Lesson 2 Activity 1: Yeast Fermentation – Initial Predictions ................................................... 27 Lesson 2 Activity 2: Yeast Fermentation – Observations and Explanations ............................. 31 Lesson 2 Activity 3: Tracing Matter and Energy Through Fermentation .................................. 34
Lesson 3: Fuels and the Global Carbon Cycle ........................................................................ 40
Lesson 3 Activity 1: Finding the Carbon .................................................................................... 40 Lesson 3 Activity 2: The Global Carbon Cycle .......................................................................... 44 Lesson 3 Activity 3: Biofuels vs Fossil Fuels .............................................................................. 47
Lesson 4: A Closer Look at Biofuels ...................................................................................... 51
Lesson 4 Activity 1: Alternative Sources of Sugar for Ethanol Production ............................... 51 Lesson 4 Activity 2: Do biofuels help? A closer look ................................................................ 55 Lesson 4 Activity 3: Biofuels Agriculture .................................................................................. 56

Wisconsin Energy Institute – www.energy.wisc.edu/education 4
Unit at a Glance Lesson 1 – Introduction to Fuels
• Activity 1.1 Biofuels Pretest • Activity 1.2 Which substances burn? • Activity 1.3 Investigating burning/combustion • Activity 1.4 Investigating plant growth • Activity 1.5 Photosynthesis • Activity 1.6 How can plants make more plants (respiration, digestion, biosynthesis)
Lesson 2 – Introduction to Biofuels and Fermentation • Activity 2.1 Yeast Fermentation – Initial Predictions • Activity 2.2 Yeast Fermentation – Observations and Explanations • Activity 2.3 Tracing Matter and Energy Through Fermentation.
Lesson 3 – Fuels and the Global Carbon Cycle • Activity 3.1 Finding the Carbon • Activity 3.2 The Global Carbon Cycle • Activity 3.3 Biofuels vs Fossil Fuels
Lesson 4 – A Closer Look at Biofuels • Activity 4.1 Alternative sources of sugar for ethanol fermentation • Activity 4.2 Can biofuels help? A closer look • Activity 4.3 Biofuels Agriculture

Wisconsin Energy Institute – www.energy.wisc.edu/education 5
Unit Goals Table 1 shows the Next Generation Science Standards (NGSS) addressed by this unit.
Table 1: Next Generation Science Standards Lesson NGSS Performance Standards 1 Introduction to fuels
MS-‐PS1-‐5. Develop and use a model to describe how the total number of atoms does not change in a chemical reaction and thus mass is conserved. HS-‐PS1-‐4. Develop a model to illustrate that the release or absorption of energy from a chemical reaction system depends upon the changes in total bond energy. HS-‐LS1-‐5. Use a model to illustrate how photosynthesis transforms light energy into stored chemical energy. HS-‐LS1-‐7. Use a model to illustrate that cellular respiration is a chemical process whereby the bonds of food molecules and oxygen molecules are broken and the bonds in new compounds are formed resulting in a net transfer of energy. HS-‐LS1-‐6. Construct and revise an explanation based on evidence for how carbon, hydrogen, and oxygen from sugar molecules may combine with other elements to form amino acids and/or other large carbon-‐based molecules.
2 Biofuels & Fermentation
HS-‐LS2-‐3. Construct and revise an explanation based on evidence for the cycling of matter and flow of energy in aerobic and anaerobic conditions. MS-‐PS1-‐5. Develop and use a model to describe how the total number of atoms does not change in a chemical reaction and thus mass is conserved. HS-‐PS1-‐4. Develop a model to illustrate that the release or absorption of energy from a chemical reaction system depends upon the changes in total bond energy.
3 Global Carbon Cycle
5-‐LS2-‐1. Develop a model to describe the movement of matter among plants, animals, decomposers, and the environment. MS-‐LS2-‐3. Develop a model to describe the cycling of matter [carbon] and flow of energy among living and nonliving parts of an ecosystem. HS-‐LS2-‐5. Develop a model to illustrate the role of photosynthesis and cellular respiration in the cycling of carbon among the biosphere, atmosphere, hydrosphere, and geosphere. HS-‐LS2-‐7. Design, evaluate, and refine a solution for reducing the impacts of human activities on the environment and biodiversity. MS-‐ESS3-‐5. Ask questions to clarify evidence of the factors that have caused the rise in global temperatures over the past century.
4 Biofuels Agriculture
5-‐LS2-‐1. Develop a model to describe the movement of matter among plants, animals, decomposers, and the environment. MS-‐LS2-‐1. Analyze and interpret data to provide evidence for the effects of resource availability on organisms and populations of organisms in an ecosystem. MS-‐LS2-‐3. Develop a model to describe the cycling of matter and flow of energy among living and nonliving parts of an ecosystem. MS-‐LS2-‐4. Construct an argument supported by empirical evidence that changes to physical or biological components of an ecosystem affect populations. HS-‐LS2-‐5. Develop a model to illustrate the role of photosynthesis and cellular respiration in the cycling of carbon among the biosphere, atmosphere, hydrosphere, and geosphere.

Wisconsin Energy Institute – www.energy.wisc.edu/education 6
Using crosscutting concepts as lenses for biology The Framework for K12 Science Education (NRC, 2012) and The Next Generation Science
Standards (NRC, 2013) advocate the use of crosscutting concepts as “an organizational framework” (NRC, 2012. p. 83). Crosscutting concepts are powerful and broadly applicable ideas that students can use to frame their thinking about multiple topics. Because of their usefulness in understanding multiple phenomena, crosscutting concepts provide themes that can unite large pieces of curriculum making them more coherent. In turn, this gives students more time and opportunities to develop their understanding of the crosscutting concepts as they work through the various topics.
However, research shows that students don’t develop an ability to use crosscutting concepts in the way that scientists do unless their instruction explicitly and consistently incorporates the crosscutting concepts (Rice et al., 2012). This unit explicitly uses “Energy and matter: flows, cycles, and conservation” as a lens for understanding the processes of combustion, photosynthesis, respiration, fermentation, the global carbon cycle and its effects on global climate. When studying each of these processes, students are asked to answer three questions: How are atoms moving? What happens to the carbon atoms? What happens to the energy? The understanding of matter and energy conservation that students develop through this systematic approach can be applied to ecosystem food webs and organization of biodiversity of living things around the basic ways that they get and use food.
The other crosscutting concept that is explicitly used in this unit is scale. Students are introduced to concepts at the familiar human scale. Cars need fuel. Animals eat. Plants don’t. Students are guided to molecular explanations of their investigations of these events in the form of the matter and energy transformations of combustion, respiration, fermentation and photosynthesis. Finally, students examine the global carbon cycle where all organic carbon in living or decomposing organisms is seen as a single pool or reservoir that is distinguished from fossil fuels where the transformation from inorganic carbon dioxide to biomass happened millions of years ago. Again, students often do not make the connection between individual organisms and global reservoirs without explicit instruction.
Scientific and engineering practices The Framework for K12 Science Education (NRC, 2012) and The Next Generation Science Standards (NRC, 2013) identify eight scientific and engineering practices that students should engage in. This unit regularly has students use five of these (numbers are from The Framework):
1. Asking questions (for science) and defining problems (for engineering) 2. Developing and using models 3. Planning and carrying out investigations 4. Analyzing and interpreting data 6. Constructing explanations (for science) and designing solutions (for engineering)
In all Lessons, students are explicitly encouraged to ask questions. In Lesson 4, they experience agriculture engineering problems. All Lessons have students develop and use models of the matter and energy transformations of the processes they focus on. In Lessons 1 and 2, students

Wisconsin Energy Institute – www.energy.wisc.edu/education 7
carry out investigations and analyze and interpret data. Guidelines are provided for teachers who would like their students to design the investigations rather than using fixed protocols. Lessons 3 and 4 provide students with data to interpret and explain.
Students’ conceptions of matter and energy The Biofuels vs Fossil Fuels unit focuses on the crosscutting concepts of matter and energy conservation, however research shows that students have difficulty developing the ability and inclination to apply these concepts. Their understanding develops through well-‐documented stages shown in Table 2. Level 4 is defined as reasonably attainable, scientifically accurate use of the conservation laws. Level 2 and 3 thinking are common among middle and high school students (Level 3 thinking is still common among college students). Level 2 students tend not to seek molecular explanations of processes. Instead they give macroscopic accounts of substances. Level 3 students do tend to give molecular accounts, but cannot consistently keep track of matter and energy. Unit worksheets and assessment guides describe Level 2 and 3 thinking, as well as target responses where appropriate. For more information, see What learning progressions tell us about students' ability to participate in the global climate change and biofuels debates at https://www.glbrc.org/news/reports/what-‐learning-‐progressions-‐tell-‐us-‐about-‐students-‐ability-‐participate-‐global-‐climate.
Table 2. Developmental stages of students’ reasoning about matter and energy
Learning Objective Challenges for Level 2 Students Challenges for Level 3 Students
Locate organic and inorganic carbon pools near the Earth’s surface (atmosphere, biosphere, soil organic carbon, fossil fuels, oceanic carbon.) Describe pools as changing in size over time.
Level 2 students will think of carbon as a kind of material rather than as an atom in many carbon-‐containing molecules.
Level 3 students may not think of the same carbon atoms in the atmosphere, biomass, soil, and fossil fuels
Explain changes in atmospheric CO2 in terms of fluxes associated with carbon-‐transforming processes: combustion, respiration, photosynthesis, fermentation. Identify carbon fluxes associated with biofuel production and use.
Level 2 students will explain carbon-‐transforming processes as series of causally connected events (yeast make ethanol, humans burn coal; plants take in CO2; oceans absorb CO2, etc.)
Level 3 students will recognize fluxes as involving movements of matter, but not that fluxes BOTH make one pool larger AND make another pool smaller.
Identify energy transformations involved in carbon fluxes. Trace energy associated with biofuel production and use.
Level 2 students will describe energy as a cause of events rather than a conserved entity that can be traced through systems.
Level 3 students are likely to be partially aware of connections between human activities, energy use, and combustion of fossil fuels and biofuels.
Explain the consequences of lifestyle and energy system choices for changes in atmospheric CO2 concentration.
Level 2 students evaluate strategies as generically “good” or “bad” for the environment.
Level 3 students identify specific processes as affecting CO2 in the atmosphere, but not in terms of movement among carbon pools

Wisconsin Energy Institute – www.energy.wisc.edu/education 8
Lesson 1: Introduction to Fuels Guiding Questions What are fuels? What are fossil fuels? Where do they come from? What happens to them when they are burned in a vehicle? Lesson Description Students trace matter and energy through the process of combustion. Background Information Gasoline, diesel fuel, and jet fuel are made from crude oil or petroleum. Petroleum, along with coal and natural gas, are what we call fossil fuels. They are the fossilized remains of living organisms. Under special conditions, over millions of years, the remains decomposed and were transformed so that much of the oxygen in the original molecules was removed, leaving molecules with many C-‐C and C-‐H bonds. Thus the fossil fuels have a lot of chemical energy which can be harnessed when they are burned.
Lesson 1 Activity 1: Biofuels Pretest Activity Description Students are introduced to fossil and biofuels. They complete a unit pre-‐assessment to document their thinking about both types of fuels at the beginning of the unit. Objectives
• The students will express their own ideas about fuels by completing a pretest. Materials
• Presentation 1.1 Biofuels Introduction and Pretest • Copies of pretest for students (Lesson 1.1 Biofuels Pretest) • Lesson 1.1 Biofuels Pretest Guide -‐ below
Directions 1. Introduction to fuels. Show Presentation 1.1 Biofuels vs Fossil Fuels Pretest. Use Slides 2 & 3
to give students a brief introduction to biofuels. 2. Pretest. Give students the biofuels pretest (Lesson 1.1 Biofuels Pretest) and have them
complete it individually. 3. Discussion. Use Slides 5 -‐ 9 to collect students’ ideas about fuels for further reference.
When discussing questions 1 and 2, you can assess the extent of students’ understanding by asking them to trace the materials as far back as they can.

Wisconsin Energy Institute – www.energy.wisc.edu/education 9
Tips N/A Modifications N/A Extending the Learning N/A Assessment Use the unit pretest to assess students' understanding of biofuels and their influence on global carbon dioxide concentrations in terms of learning progression levels. You should not grade the pretest or expect your students to know the correct answers. The document, Lesson 1.1 Biofuels Pretest Guide (below), has assessment guidelines identifying correct responses and explaining how students’ responses reveal their learning progression levels.
Lesson 1.1 Fuels Pretest Guide We recommend that you NOT grade the pretest. Encourage your students to express their ideas, then look at their tests to assess what they understand about biofuels. Level 4 (correct) responses to the questions are in blue bold italics below. There are also comments about likely responses from students in blue italics. Biofuels are fuels made from materials produced by living things, most often plants. The biofuel most commonly used in the US is ethanol. It can be mixed with gasoline and used in cars.
1. Let’s think about gasoline first. a. What is gasoline made from?
Gasoline is made from crude oil. It is a fossil fuel meaning it was originally living organisms. Level 1-‐ Gasoline comes from gas stations or tanker trucks.
b. What happens to gasoline when it is burned in a car? Gasoline combines with oxygen in the engine of a car producing carbon dioxide and water. Level 2 or 3 – Gasoline is turned into energy and used up.
c. Explain where the energy in the gasoline came from? Gasoline and other fossil fuels are the transformed remains of living things, so the energy in them came originally from sunlight. Plants transformed carbon dioxide into organic carbon with chemical potential energy in the C-‐C and C-‐H bonds. Level 2 or 3 – The energy in gasoline came from the ground.

Wisconsin Energy Institute – www.energy.wisc.edu/education 10
2. Now let’s think about ethanol. a. What is ethanol made from?
Ethanol is made from corn grain by the process of fermentation. Students familiar with the process of making alcoholic drinks may say that ethanol is made by yeast through the process of fermentation.
b. What happens to ethanol when it is burned in a car? Ethanol combines with oxygen in the engine of a car producing carbon dioxide and water. Level 2 or 3 – Ethanol is turned into energy and used up.
c. Explain where the energy in the ethanol came from? The plants that the ethanol is made from transformed carbon dioxide into organic carbon with chemical potential energy in the C-‐C and C-‐H bonds. Level 2 – The plant material has energy because it is from a living thing.
3. Why do people think that substituting ethanol for gasoline may help with the global climate
change problem? Production and combustion of biofuels cycle carbon from the atmosphere into and out of the biomass. Plants use atmospheric carbon dioxide during photosynthesis and produce molecules with organic carbon. Biofuels are molecules with organic carbon made from plant material (or material from other organisms). When biofuels are used in the process of combustion, the carbon dioxide produced is released into the atmosphere. In this way, biofuels are not adding new carbon to the atmosphere. Plants take carbon dioxide out of the atmosphere and combustion of plant material returns it. In contrast, use of fossil fuels (in combustion) shifts carbon from the pool of fossil fuels organic carbon to the atmosphere. Level 2 or 3 students may think that biofuels are better for the environment because they don’t produce carbon dioxide when used or because they are a “natural” product.
4. How would you determine if the production and use of a particular biofuel would actually
help with the global climate change problem? You would need to look at carbon fluxes associated with each step of production of the biofuel. This would need to include the carbon fluxes associated with energy transformations of each stage. Level 2 or 3 students may talk about measuring pollution from both types of fuel.
5. What other biofuels have you heard about? Where do they come from and what are they
used for? Students may have heard of cars that run on used vegetable oil from restaurants, biodiesel made from vegetable oils or algae, or methane from decomposing manure or compost used to produce electricity or heat.

Wisconsin Energy Institute – www.energy.wisc.edu/education 11
Lesson 1 Activity 2: Which substances burn? Activity Description Students will use their personal experience to predict which substances burn. They will look for similarities across the combustible substances. Objectives
• The students will investigate the combustion of different substances. • The students will use conservation rules and molecular models to explain the matter
and energy changes associated with combustion. Materials
• Presentation 1.2 Which substance burn? • Copies for students: Lesson 1 Activity 2: Worksheet -‐ Which substances burn?
Directions 1. Show Presentation 1.2. Use Slide 2 to get students’ ideas about what a fuel is. Students
may answer this question by naming particular substances or defining fuel. 2. Slide 3 gives a standard definition of which includes two important pieces of the story –
energy and burning. 3. Handout Lesson 1 Activity 2: Worksheet – Which substances burn? Have students complete
the table individually. Use the remaining slides to guide development of students’ initial ideas.
4. Use Slides 4 and 5 to introduce students to fossil fuels. 5. Use Slides 6 and 7 to direct students’ predictions of which substances burn, what happens
to them when they burn, and why those that burn have chemical potential energy. Help students draw on personal experiences such as burning candles, wood fires, and fueling vehicles to justify their claims about which substances have chemical potential energy. All of the substances in the pictures, except water, have chemical potential energy because of the C-‐C and C-‐H bonds in them. Water has no carbon and therefore no high energy bonds. Students will find this out in the next investigation. Students may confuse the refreshing qualities of water with having energy. Some evidence that water doesn’t have energy is that animals can’t survive on water alone and that water doesn’t burn. The next investigation will give them direct experience with the latter.
6. Have students watch as you try to burn water and ethanol (ethyl alcohol). Take two Petri dishes and pour a small amount of water in one and a small amount of alcohol in the other. Use a lighter to attempt to burn each sample. Only ethanol (ethyl alcohol) will burn. Put out the ethanol flame by covering it with the top of the Petri dish.
7. By this point, most students will have figured out that all of the substances burn except water. Even if they haven’t, have them fill out the last question on the worksheet. Ideally they will notice that all of the substances that burn have carbon and hydrogen in them. However, it is okay if they don’t. They will get a chance to revisit this question after the investigation.

Wisconsin Energy Institute – www.energy.wisc.edu/education 12
Tips N/A Modifications N/A Extending the Learning Ask students what other substances burn. Have them look up the formulas for molecules in those substances to see if the patterns they see in combustible substances hold. Assessment Use the worksheet as a formative assessment task to see if students are thinking at the atomic level and are comparing formulae. The worksheet will also reveal what personal experiences students are drawing on that you can connect to in future lessons.
Lesson 1.2 Which substances burn? Worksheet Guide Some substances are suitable for use as fuels. Others aren’t. Which of the following substances will burn? Explain the reasoning behind your prediction.
Students’ responses will vary. High level responses are shown in bold italics.
Substance Will burn
Yes/No
Your reasoning
Water No We use water to put out fires.
Wood Yes We burn wood in fireplaces or bon fires.
Ethanol Yes
No
Ethanol is the alcohol in alcoholic drinks. On fancy desserts, you can light it and it will burn. It looks like water
Gasoline Yes We burn it in cars. It is dangerous because it is so flammable.
Jet Fuel Yes We burn it in airplanes.
Diesel Fuel Yes We burn it in trucks and some cars.
Paraffin Yes It is a kind of wax that we burn in candles.
What is similar about all of the substances that burn? They all contain carbon and hydrogen.

Wisconsin Energy Institute – www.energy.wisc.edu/education 13
Lesson 1 Activity 3: Investigating Burning/Combustion Activity Description Students investigate changes in mass and CO2 concentration for burning ethanol, paraffin, and wood. They explain their results using molecular models and chemical equations to answer the Three Questions about changes in matter and energy. Objectives
• Explain the matter and energy changes associated with combustion.
Materials • Presentation 1.3 Investigating Combustion/Burning • Copies for students of Worksheet 1.3 Investigating Combustion/Burning • Worksheet 1.3 Investigating Combustion/Burning Guide -‐ below • For each working group
o 1 digital balance o 1 glass Petri dish for burning substance o 1 plastic Petri dish for BTB o 1 large 29 cup container (no lid, inverted) o 2 sheets aluminum foil (taped to the inside of the plastic container) o 1 lighter or 1 match (or something to light the fuel with)
• Bromthymol blue (BTB) solution to detect CO2 in the air inside the container • Molecular modeling kits, 1 per group • Lesson 1.3 Molecular Modeling Poster (11 x17”) – 1 per group • A molecular model of paraffin
Directions 1. Show Presentation 1.3 Investigating Combustion/Burning. 2. Slides 1 and 2. Use these slides to introduce the investigation. We have decided that all of
these substances except water will burn. We saw that all of the substances that burn contain carbon and hydrogen. Now we are going to look more closely at the process of burning or combustion. Because they are dangerous, we aren’t going to burn gasoline, jet fuel, or diesel fuel. But we will burn paraffin, another petroleum product which is the main ingredient in candles. We will also look at wood and ethanol.
3. Slide 3 -‐ show students the setup and tools they will be using to study combustion and explain how the scales and BTB (Slide 4) will help determine what is happening to the atoms. They will make direct observations to determine what happens to the energy.
4. Show Slide 5 and handout Worksheet 1.3 Investigating Combustion/Burning and have students setup their investigations. Assign each group of 4 students one of the 3 fuels (ethanol, wood, paraffin). Have them setup their investigations following the instructions on the worksheet. They should take initial readings of the mass and BTB color and record these on the worksheet. When they have done this, you can ignite their fuel using a lighter and then carefully cover up the reaction. The reaction will go out fairly quickly, but

Wisconsin Energy Institute – www.energy.wisc.edu/education 14
students should let it sit covered for at least 20 minutes. This will allow time for the carbon dioxide produced during the reaction to absorb into the BTB.
5. While students are waiting, have them make predictions of they think will happen to the matter and energy during the reaction. They should record these in Section C of the worksheet.
6. Show Slide 6 and explain how the laws of conservation of matter and energy apply. 7. Allow students to revise their predictions. 8. Have students record on the worksheet their observations of changes that occurred
during the combustion process. 9. Show Slide 7 and compile the class data by fuel. 10. Use Slides 8, 9, and 10 to guide a discussion of the patterns in the class findings. 11. Use Slides 11, 12, and 13 to guide students in building molecular models of the
combustion of paraffin and gasoline. 12. Have students use Slide 14 and their molecular models of gasoline combustion to revisit
the 3 Qs. Background Combustion or burning is the reaction of a fuel, usually carbon-‐based, with an oxidant, usually oxygen. The products are usually carbon dioxide and water. This is an exothermic reaction, because the high energy bonds, C-‐C, C-‐H, and O-‐O are broken and reform as much more stable bonds, C-‐O and H-‐O. For the purposes of simplicity, in this unit we focus on the bonds involving carbon and ignore O-‐O and O-‐H bonds. However, in a chemistry class it would be important to bring oxygen into the picture. Tips When using molecular models with the class to understand the reaction of paraffin, have the initial paraffin molecule already constructed. This will save time. It is helpful to position a document camera so that it can project an image of this molecule. You can have students count the number of each type of atom to confirm that it matches the formula. Modifications The molecular modeling session can be shortened by giving students the balanced reactions, rather than having them discovering the ratios through modeling. Extending the Learning Students can use what they learned here to predict whether different classes of biomolecules such as sugars, fats, and proteins have chemical energy and which has the most calories per gram. Sugars and proteins have roughly the same number of calories per gram because they have roughly the same ration of high energy C-‐C and C-‐H bonds to lower energy C-‐O and O-‐H bonds. Fat has approximately twice as many calories per gram as sugar and fat, because it consists almost entirely of C-‐C and C-‐H bonds. In this way it is similar to gasoline.
Paraffin C13H28

Wisconsin Energy Institute – www.energy.wisc.edu/education 15
Assessment This is students’ first time in this unit tracing matter and energy. Lower level students may not focus on combustion at the molecular level. Their accounts of matter changes will focus on visible substances and perhaps oxygen and carbon dioxide. Their accounts of energy changes will focus on visible manifestations of energy such as the flame and heat. Somewhat more sophisticated students will think at the molecular level, but may at points say that some matter is converted into energy.
Lesson 1.3 Investigating Combustion Worksheet Guide Level 4 (correct) responses to the questions are in bold blue italics below. Other typical responses are shown in blue italics In this investigation, we are going to study what happens to matter and energy when fuels are burned. We will compare wood, ethanol, and paraffin. Wood is, of course, a fuel which is part of a plant. Ethanol is also made from plants. Paraffin is a fossil fuel made from petroleum/crude oil. You will be assigned one of these 3 fuels.
Procedure 1. Add the substance you are investigating to an open glass Petri dish. 2. Turn on a digital scale so that it reads “0” g. Place the Petri dish containing the substance on
the scale. Record the mass in the “Measurements” section. 3. Fill a plastic Petri dish with fresh BTB. On the worksheet. Fill in your observation of the
color of the BTB. 4. Place the Petri dish with BTB next to the Petri dish with the substance you will burn so that
the large container lined with aluminum foil fits on top of the two dishes. 5. Light the fuel with the lighter and then immediately put the inverted large container lined
with aluminum foil on top of both the glass Petri dish with burning fuel and the Petri dish of BTB. The flame will go out quickly inside the container.
6. Wait about 20 minutes before taking the lid off the container. While you are waiting, write your predictions about what you think will happen and why in section C.
7. After 20 minutes, remove the glass petri dish with the burned fuel from underneath the container. Place it on the digital scale and record the mass of the burned substance and Petri dish.
8. Fill in your observation of the color of the BTB after the experiment.

Wisconsin Energy Institute – www.energy.wisc.edu/education 16
B. Measurements The fuel you are investigating:
Measurements Before Measurements After Mass of Petri dish with fuel before Time: _____________________ Mass: ________________ grams
Mass of Petri dish with fuel after Time: _____________________ Mass: ________________ grams Change in mass: ________________ grams
Color of BTB before
Color of BTB: _________________________
Color of BTB after
Color of BTB: ___________
C. Predictions
• Will any matter move when the fuel is burned? The fuel (paraffin, ethanol, or wood) will disappear, because the molecules in it combine with oxygen in the air and form gases/carbon dioxide. The fuel turns into energy and is burned/used up. The fuel turns into ash or drips.
• Explain why you think this will happen. I think it will disappear, because I’ve seen candles/wood burn before. The only thing left usually is some small amount of ash or wax drips. The atoms had to go somewhere, so I think they’re in the air. I know things need air/oxygen to burn. You can see that there’s nothing left after something burns. The atoms have to go somewhere, so they must be in the drips, ash, or soot.
• Where will carbon atoms move when the fuel when it is burned? Carbon atoms will move from the fuel to the carbon dioxide/air. Carbon atoms will move to the drips, soot, or ash.
• Explain why you think this will happen. The carbon atoms have to go somewhere. You can’t see them, so they are probably an invisible gas. The carbon atoms have to go somewhere, so they must be in the drips, soot, or ash.
• What will happen to the energy of the fuel when it is burned? The chemical energy is converted into light and heat. The energy is used up.
• Explain why you think this will happen. You see light and you can feel the heat when something is burned. There’s nothing left after the substance is burned.

Wisconsin Energy Institute – www.energy.wisc.edu/education 17
Lesson 1 Activity 4: Investigating Plant Growth Activity Description Students interpret data on plant growth. Objectives
• Explain the matter and energy changes associated with photosynthesis.
Materials Presentation 1.4 Investigating Plant Growth Copies for students of Worksheet 1.4 Investigating Plant Growth Worksheet 1.4 Investigating Plant Growth Guide -‐ below Carbon TIME plants video -‐ https://www.youtube.com/watch?v=UMQZFT1vyjs Directions 1. Setup the problem of “What happens when plants grow?” Show Presentation 1.4
Investigating Plant Growth, Slide 2. 2. Explain the BTB experiment with plants growing in the light and in the dark. Show Slide 3
and then the first part of the Carbon TIME plants video. Have students predict and explain what they think will happen by filling out the Predictions section of Part A on Worksheet 1.4 Investigating Plant Growth. Pool students’ ideas and explanations.
3. Show students the results of the BTB experiment. Show Slide 4 and then the next section of the Carbon TIME plants video. Have students record their observations in the Observations section of Part A on the worksheet. Discuss the results and have students try to answer the 3 Qs. The BTB experiment results tell students that, when growing in the light, carbon dioxide goes into the plants. Ask them what they think happens to the carbon dioxide in the plant.
4. Explain the plant mass investigation. Show Slide 5 and then the next section of the Carbon TIME plant video. Have students record their predictions of what will happen in Section B of the worksheet. Pool their ideas. Show the remainder of the video.
5. Have students answer the 3 questions. Have students work individually to answer the 3 questions in Section C of the worksheet. Then discuss their ideas. Slide 6 has useful discussion Qs in the notes.
Background Information Plants make sugars through the process of photosynthesis. They take in carbon dioxide from the air and water from the ground. They use sunlight to transform these low-‐energy substances into sugars which have chemical potential energy. Another product of photosynthesis is oxygen gas which the plants release into the air.
Wisconsin Energy Institute – www.energy.wisc.edu/education 18
Tips To organize the many discussions in this lesson, it is useful to keep track of students’ evolving ideas on a whiteboard or large sheets of paper. Record students’ predictions AND explanations. Revisit these each time new results are added. The explanations can be edited by the class based on their new results. Modifications Instead of watching the video, students can do their own investigations. This requires starting the plants 4 weeks in advance. Protocols are available in the Supplemental Material. Extending the Learning If students do their own investigations, they can keep track of the amount of water they add to the plants. They will find that the mass of the water that they add to the system far exceeds the mass gain of the plants. Much of the water evaporates directly from the vermiculite. Some is taken up by the plants and released again in the process of transpiration. A more complete investigation, Exploring Energy Transformations in Plants, using Wisconsin Fast Plants is available at https://www.glbrc.org/education/classroom-‐materials/exploring-‐energy-‐transformations-‐plants-‐0

Wisconsin Energy Institute – www.energy.wisc.edu/education 19
Lesson 1.4 Investigating Plant Growth Worksheet Guide Level 4 (correct) responses to the questions are in bold blue italics below. Other typical responses are shown in blue italics A. BTB changes for plants in the light and dark Plants in the light Plants in the dark Predictions What will happen to the blue BTB? Students’ predictions will vary. Some will know little about plants. Some will know that plants in the light take in carbon dioxide. Some will say that plants give off oxygen, not CO2. Why do you think that will happen? What will happen to the yellow BTB? Why do you think that will happen?
Predictions What will happen to the blue BTB? Students’ predictions will vary. Some students may think that plants do the same thing in the dark as in the light or that they do nothing in the dark. It is not likely that students will know that plants respire (burn some of their molecules) in order to get the energy they need for life functions. Why do you think that will happen? What will happen to the yellow BTB? Why do you think that will happen?
Observations What did happen to the blue BTB? The blue BTB remained blue. What did happen to the yellow BTB? The yellow BTB turned blue. What does this imply about where carbon dioxide is moving? Carbon dioxide is moving out of the air, into the plant.
Observations What did happen to the blue BTB? The blue BTB turned yellow. What did happen to the yellow BTB? The yellow BTB remained yellow. What does this imply about where carbon dioxide is moving? Carbon dioxide is moving into the air, from the plant.
B. Investigating mass changes during plant growth -‐ Predictions When plants grow, where does their mass come from? Students’ predictions will vary. Common responses include air, soil, water, plant food/fertilizer. Explain your answer. Students may cite experience with gardens or protocols for growing plants
Wisconsin Energy Institute – www.energy.wisc.edu/education 20
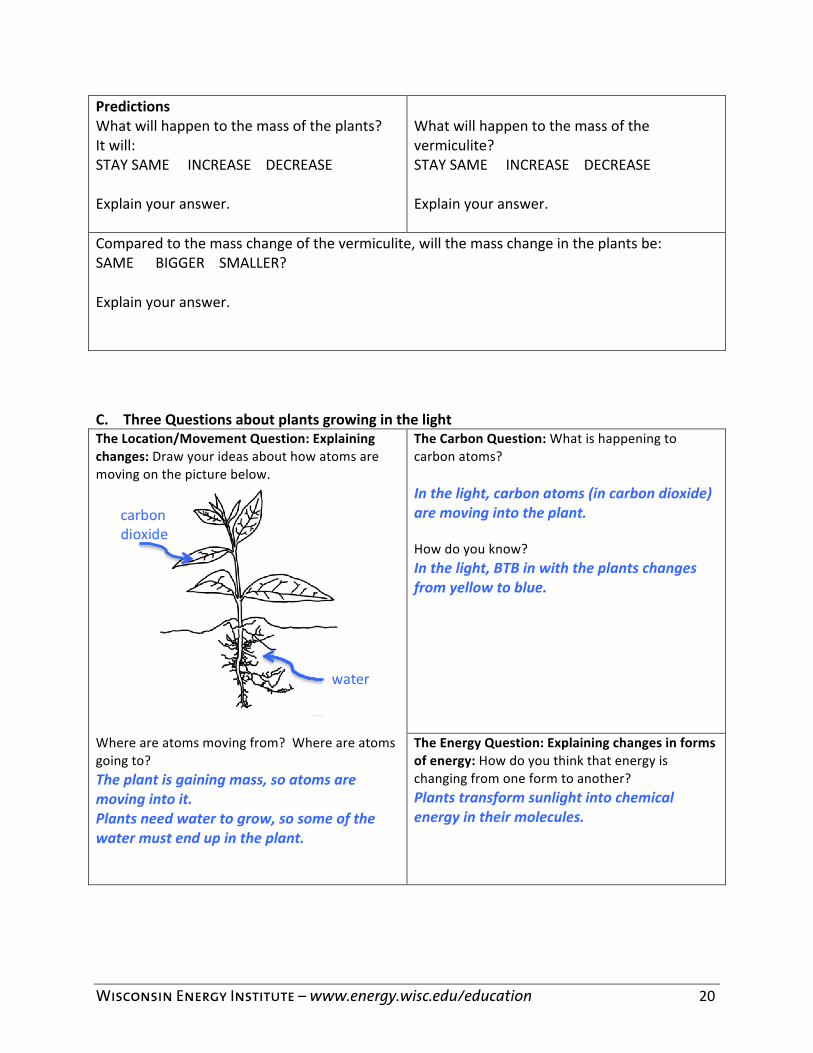
Predictions What will happen to the mass of the plants? It will: STAY SAME INCREASE DECREASE Explain your answer.
What will happen to the mass of the vermiculite? STAY SAME INCREASE DECREASE Explain your answer.
Compared to the mass change of the vermiculite, will the mass change in the plants be: SAME BIGGER SMALLER? Explain your answer. C. Three Questions about plants growing in the light The Location/Movement Question: Explaining changes: Draw your ideas about how atoms are moving on the picture below.
The Carbon Question: What is happening to carbon atoms? In the light, carbon atoms (in carbon dioxide) are moving into the plant. How do you know? In the light, BTB in with the plants changes from yellow to blue.
Where are atoms moving from? Where are atoms going to? The plant is gaining mass, so atoms are moving into it. Plants need water to grow, so some of the water must end up in the plant.
The Energy Question: Explaining changes in forms of energy: How do you think that energy is changing from one form to another? Plants transform sunlight into chemical energy in their molecules.
water
carbon dioxide
water
Wisconsin Energy Institute – www.energy.wisc.edu/education 21
Lesson 1 Activity 5: Photosynthesis Activity Description Students are given the equation for photosynthesis. They revisit their answers to the three questions and model photosynthesis. Objectives
• Explain the matter and energy changes associated with photosynthesis. Materials
• Lesson 1.5 Photosynthesis Presentation • Copies for students of Lesson 1.5 Photosynthesis – 3 Questions Worksheet • Lesson 1.5 Photosynthesis – 3 Questions Worksheet Guide -‐ below • Molecular modeling kits that include C, H, and O atoms plus twist ties • Copies for students of Process Tool for Molecular Modeling Poster
Directions 1. Developing the equation for photosynthesis
Use Lesson 1.5 Photosynthesis Presentation to help the class develop a balanced equation and molecular model for the energy and matter changes in photosynthesis. • Students will need molecular modeling kits and the Process Tool in order to follow
along. 2. 3 Qs
Have students summarize this lesson by answering the 3 Questions as completely as they can.
Background information Plants make sugars through the process of photosynthesis. Carbon dioxide diffuses into the leaf from the air. Water is drawn up from the ground through the roots and stem. (A lot of water travels through the plant without being used in photosynthesis. It evaporates out of the leaves. Each molecule that evaporates pulls on the molecule below because of the unique ways in which molecules are attracted to each other.) Leaf cells use sunlight to transform these low-‐energy substances into sugars which have chemical potential energy in their C-‐C and C-‐H bonds. Another product of photosynthesis is oxygen gas which diffuses out of the cell into the air. Tips To make sure that students are developing a sound understanding of these concepts, it may be helpful to ask them some questions where they apply these ideas. For example, root cells do not get light and usually are not green, indicating that they can’t do photosynthesis. How do they get the molecules they need? Modifications N/A

Wisconsin Energy Institute – www.energy.wisc.edu/education 22
Extending the Learning Transpiration arises in this lesson. Rather than just telling students about it, you can have students explore it by putting celery stalks (preferably with leaves) in water with food coloring. Students can see the xylem stained with food coloring. They can also measure the rate of transpiration by watching how quickly the stalks can lower the water level. Transpiration is part of the water cycle. According to Wikipedia, a large oak tree can transpire 40,000 gallons (151,000 liters) per year.
Lesson 1.5 Assessing Photosynthesis Worksheet Guide The Location/Movement Question: Explaining changes: Draw how atoms are moving on the picture below.
The Carbon Question: What is happening to carbon atoms? Carbon atoms that are originally in carbon dioxide end up in sugar.
Where are atoms moving from? Where are atoms going to? Carbon dioxide moves from the air into the leaf. Water comes up from the soil through the roots and stem to the leaf. Sugar travels to the rest of the plant through the stem (and roots). Oxygen leaves the leaf and goes into the air.
The Energy Question: Explaining changes in forms of energy: How is energy changing from one form to another? Sunlight is transformed into chemical energy in the C-‐C and C-‐H bonds in the sugar.
O2 CO2
sugar
water
Wisconsin Energy Institute – www.energy.wisc.edu/education 23
Lesson 1 Activity 6: What do plants do with sugar? Activity Description Students explore the two ways in which plants use the food they make: as building blocks for growth and repair and for energy. They answer the 3 Qs for the process of cellular respiration. Finally they explore the relationship between photosynthesis and respiration. Objectives
• Explain the matter and energy changes associated with biosynthesis and respiration. Materials
• Presentation Lesson 1.6 What do plants do with sugar? • Copies for students of Lesson 1.6 Worksheet – What do plants do with sugar? • Optional -‐ Carbon TIME plants video -‐
https://www.youtube.com/watch?v=UMQZFT1vyjs • Optional respiration video -‐ https://www.youtube.com/watch?v=F7_1eFbAfpo • Optional mealworm investigation – each setup needs: 15 g mealworms, 10 g potatoes,
scale, BTB, closed container Directions 1. Exploring biosynthesis
Use Presentation Lesson 1.6 What do plants do with sugar?, Slides 1 – 7 to walk students through the process of biosynthesis – the process whereby plants turn the sugar they make into the other molecules that they need. Have students fill out Section A of Worksheet Lesson 1.6 What do plants do with sugar? Start by discussing the starch example provided and then have students finish the section. Discuss their answers.
2. Exploring cellular respiration Use Slides 8 and 9 to start students thinking about the fate of food molecules in plants or animals that is used for energy.
3. Introduction to cellular respiration Show Slide 10 to hypothesize about the fate of food atoms that undergo respiration. Before showing them the answers to the Q, use the suggest discussion Qs to get students’ ideas.
4. Use Slide 11 to introduce students to the equations for cellular respiration and point out its similarities to the equation for combustion. Have students fill out the 3 Qs in Section B. Discuss their answers.
5. Use Slide 12 to explore the relationship between photosynthesis and respiration. You might want to reshow the first part of the video on the experiment mentioned to refresh students. Discuss their answers.
Background information
Wisconsin Energy Institute – www.energy.wisc.edu/education 24
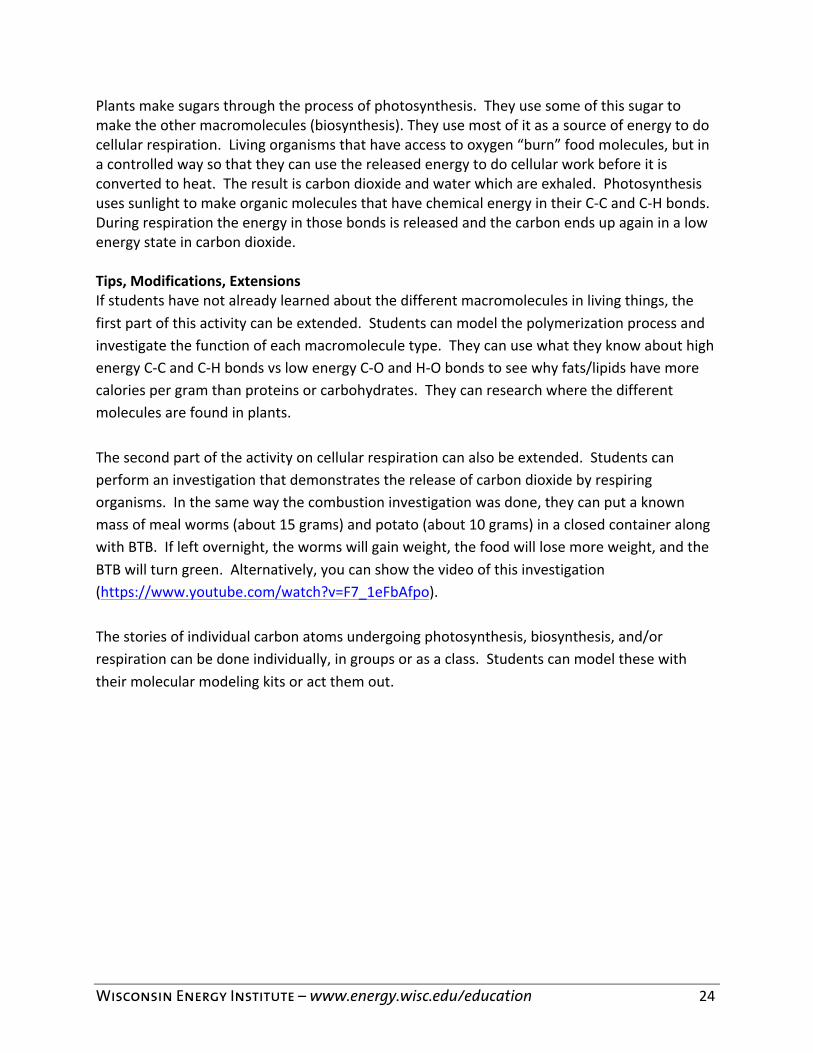
Plants make sugars through the process of photosynthesis. They use some of this sugar to make the other macromolecules (biosynthesis). They use most of it as a source of energy to do cellular respiration. Living organisms that have access to oxygen “burn” food molecules, but in a controlled way so that they can use the released energy to do cellular work before it is converted to heat. The result is carbon dioxide and water which are exhaled. Photosynthesis uses sunlight to make organic molecules that have chemical energy in their C-‐C and C-‐H bonds. During respiration the energy in those bonds is released and the carbon ends up again in a low energy state in carbon dioxide. Tips, Modifications, Extensions If students have not already learned about the different macromolecules in living things, the first part of this activity can be extended. Students can model the polymerization process and investigate the function of each macromolecule type. They can use what they know about high energy C-‐C and C-‐H bonds vs low energy C-‐O and H-‐O bonds to see why fats/lipids have more calories per gram than proteins or carbohydrates. They can research where the different molecules are found in plants. The second part of the activity on cellular respiration can also be extended. Students can perform an investigation that demonstrates the release of carbon dioxide by respiring organisms. In the same way the combustion investigation was done, they can put a known mass of meal worms (about 15 grams) and potato (about 10 grams) in a closed container along with BTB. If left overnight, the worms will gain weight, the food will lose more weight, and the BTB will turn green. Alternatively, you can show the video of this investigation (https://www.youtube.com/watch?v=F7_1eFbAfpo). The stories of individual carbon atoms undergoing photosynthesis, biosynthesis, and/or respiration can be done individually, in groups or as a class. Students can model these with their molecular modeling kits or act them out.

Wisconsin Energy Institute – www.energy.wisc.edu/education 25
Lesson 1.6 What do plants do with sugar? Worksheet Guide
A. Biosynthesis For each polymer in the table below, show where all the atoms came from. Indicate which reactions are photosynthesis (PS) and which are biosynthesis (biosyn).
Starch CO2 (air) + water (roots) à sugar (leaf) sugar (leaf) à sugar (potato) Multiple Sugar (potato) à starch
Cellulose CO2 (air) + water (roots) à sugar (leaf) sugar (leaf) à sugar (potato) Multiple Sugar (potato) à starch
Protein CO2 (air) + water (roots) à sugar (leaf) sugar (leaf) à sugar (potato) N (soil) à N (potato) Sugar (potato) + N (potato) à amino acids (potato) Multiple amino acids (potato) à protein
Fat CO2 (air) + water (roots) à sugar (leaf) sugar (leaf) à sugar (potato) Sugar (potato) à fatty acids (potato) Sugar (potato) à glycerol (potato) Fatty acids + glycerol à fat
B. Cellular respiration -‐ Energy to make things happen Cells need energy to move things and make particular reactions happen. They get that energy from food/sugar molecules and oxygen. Answer the 3 Qs for respiration.
C6H12O6 + 6O2 à 6CO2 + 6H20
The Location/Movement Question: Explaining changes: Draw how atoms are moving on the picture below.
Where are atoms moving from? Where are atoms going to? Gases are going into and out of the leaves. Oxygen gas is entering the leaves from the air. Carbon dioxide and water gas are leaving the leaves to the air.
PS
biosyn biosyn
PS
PS
biosyn biosyn
PS
oxygen
carbon dioxide
water

Wisconsin Energy Institute – www.energy.wisc.edu/education 26
The Carbon Question: What is happening to carbon atoms? Carbon atoms in organic molecules like sugar end up in carbon dioxide which leaves the plant.
The Energy Question: Explaining changes in forms of energy: How do you think that energy is changing from one form to another? Chemical energy in the organic molecules is transformed into work and eventually heat.
C. Plants do both photosynthesis and respiration Photosynthesis: 6CO2 + 6H20 à C6H12O6 + 6O2 Respiration: C6H12O6 + 6O2 à 6CO2 + 6H20 How are these two processes related? Any of the following statements is accurate. The two processes are opposites. The reactants of one are the products of the other. Photosynthesis converts inorganic, low-‐energy carbon in carbon dioxide into organic, high-‐energy carbon in sugar. Respiration does the opposite.
Why does the plant do both processes? Plants do synthesis in order to have organic molecules which as usable sources of energy for cellular work and as sources of biomolecules. Plants do respiration when they need to access the energy in the organic molecules. Think back to the video of the plants in the light and in the dark. In the light, the lettuce plants produced carbon dioxide. In the dark, they took in carbon dioxide. Explain these results. In the video, the plants in the dark produced carbon dioxide. In the dark, they can’t do photosynthesis. However, they are always doing respiration to have the energy for necessary functions. The process of respiration produces carbon dioxide. The plants in the light took in carbon dioxide. They are doing both photosynthesis and respiration, but they are doing more photosynthesis. Therefore the net effect is that they are using carbon dioxide to make sugars.
What will happen to the mass of a plant that is left in the dark for a long time? It will: INCREASE DECREASE STAY THE SAME Explain your answer. In the dark, plants can only do respiration. They will take in O2 and give off CO2 and water, thus there is a net loss of atoms.

Wisconsin Energy Institute – www.energy.wisc.edu/education 27
Lesson 2: Making the Biofuel, Ethanol Guiding Question How can we make the biofuel, ethanol? Lesson Description Students trace matter and energy through the process of fermentation. Background Information Plant matter needs to be processed before it can be used in vehicles. Currently, people are using vegetable oil, biodiesel and ethanol made by processing plant materials in cars and trucks. Cars and trucks can be modified to burn used vegetable oil from restaurants. However, there is only a very limited supply of used vegetable oil. Biodiesel is made from vegetable oil, often soy bean oil. The oil is processed so that the resulting fuel can be used in diesel vehicles without modifying the vehicles. Biodiesel is the most widely used biofuel in Europe. In the United States, ethanol is the most widely used fuel made from plants. Blends of gasoline containing 5, 7, or 10% ethanol are available throughout the Midwest. Most of the ethanol is made by fermenting corn. In this unit, we will focus on ethanol.
Lesson 2 Activity 1: Yeast Fermentation – Initial Predictions Activity Description Students predict what will happen to the matter and energy when yeast ferments sugar. The students will develop a protocol for identifying gas (CO2) released during the reaction and checking for corresponding mass changes. Objectives
• Explain the matter and energy changes associated with fermentation. • Develop (optional) and implement an investigation of yeast fermentation.
Materials
• Presentation 2.1 Yeast Fermentation – Initial Predictions • Copies for students of Worksheet 2.1 Yeast Fermentation – Initial Predictions and
Explanations • Worksheet Guide 1.2 Yeast Fermentation – Initial Predictions and Explanations -‐ below • One Fermentation setup
o One digital balance o A large, clear air-‐tight container – this can be a plastic storage container with a
lid (which does not need to be clear as long as the balance is placed in such way that it can be read without opening the lid). Alternatively, set up the experiment on a table and invert the storage container over it. An aquarium is another possibility, though it should not be too much bigger than the experimental setup.

Wisconsin Energy Institute – www.energy.wisc.edu/education 28
o Bromothymol blue (BTB) solution to detect CO2 in the air inside the container o One plastic Petri dish for BTB o A 100 mL beaker containing 1 tsp baker’s yeast and 1 tsp sugar to which you will
add 40 -‐ 50 mL of warm water Directions 1. Introduce students to fermentation by showing Presentation 2.1 Yeast Fermentation –
Initial Predictions. 2. Show students the setup and tools they will be using to study fermentation. At this stage,
the most important part is the beaker with yeast and sugar. 3. Have students predict what they will see in terms of matter and energy changes during
fermentation by having them complete Worksheet 1.2 Yeast Fermentation – Initial Predictions. Slides 7 – 9 will help them with this. You may need to remind students that they know what sugar and ethanol are and that they have looked at the oxidation of each (respiration and combustion).
4. Class discussion. Use Slide 9 to collect students’ predictions. 5. Optional. Have students determine the experimental protocol. You can choose to have
the students plan their own investigation (with your guidance – see Slide 10) or have them follow the procedures in the Lesson 2.2 Yeast Fermentation Observations and Explanations Worksheet. They should agree to weigh their reaction mixture by putting the beaker with yeast, sugar, and water on the digital scale. They may choose to put in petri dishes of blue BTB and yellow BTB or just blue BTB. In either case, they need to cover the system.
Background Yeast and other microbes use the process of fermentation to transform chemical energy in sugar to do cellular work under anaerobic conditions. During the process, carbon dioxide and ethanol are produced. In bread making, the carbon dioxide inflates the dough. The ethanol evaporates during baking. In beer and wine making, the ethanol and carbon dioxide are both parts of the product. Tips Reviewing the processes they have already studied, combustion, respiration, and photosynthesis, may help students make better predictions. Modifications An alternative way to gather students’ predictions is to have them write them on sticky notes and put them on the board. If students predict that oxygen is a product of fermentation, they can put yellow or green BTB (made by blowing through a straw into blue BTB) to test for oxygen. If produced, the oxygen would slowly replace the carbon dioxide in the BTB turning it back to blue. Caution: remind students not to drink BTB. If students choose to modify the protocol, you can edit Worksheet 2.2 Yeast Fermentation – Observations and Explanations to match their protocol.

Wisconsin Energy Institute – www.energy.wisc.edu/education 29
A simpler fermentation protocol, Fermentation in a Bag, without the scales and BTB is available at https://www.glbrc.org/education/classroom-‐materials. Students can use this simpler protocol to get firsthand experience with fermentation, while the teacher does the full protocol of this activity as a demonstration. Extending the Learning N/A Assessment Use students’ predictions to see their level of thinking, that is how well they trace matter and energy, and how much they can draw from previous units to make reasonable (though not necessarily accurate) predictions. Lesson 2.1 Assessing Yeast Fermentation -‐ Initial Predictions and Explanations Worksheet Guide Level 4 (correct) responses to the questions are in blue italics below. You will be doing an investigation of yeast fermenting sugar. Here are the tools you will have:
• One digital balance • A large air-‐tight container • Bromothymol blue (BTB) solution to detect CO2 in the air inside the container • One plastic Petri dish for BTB • A 100 mL beaker containing 1 tsp baker’s yeast and 1 tsp sugar to which you will add 40
-‐ 50 mL of warm water

Wisconsin Energy Institute – www.energy.wisc.edu/education 30
Make predictions that will help you answer the Location/Movement Question, the Carbon Question, and the Energy Question. Predictions about mass changes: What are your predictions about the yeast solution gaining or losing mass? What will gain mass? The surrounding air will gain mass. What will lose mass? The beaker with the reaction in it will lose mass.
Predictions about changes in BTB: Do you think that BTB will change color if it is in a sealed container with the fermenting yeast? YES NO What color change do you predict? The BTB will turn from blue to green or yellow.
The Location/Movement Question: Explaining your predictions about mass changes: Draw your ideas about how atoms are moving on the picture below.
The Carbon Question: Explaining your predictions about BTB color changes: What do you think is happening to molecules that have carbon atoms in them? The molecules with carbon atoms (sugar) are breaking apart and the atoms are being rearranged to form ethanol and carbon dioxide. At this point, it would be reasonable for students to predict the ethanol, but not that a gas is produced. Since sugar contains C, H, and O, it would be reasonable for students who do predict gas formation to predict that the gas is hydrogen, oxygen, or carbon dioxide. However in past situations that they examined, carbon dioxide production was accompanied by oxygen consumption.
Where are atoms moving from? Where are atoms going to? Some of the atoms are moving from the reaction mix to the air. Some of the atoms in the sugar are rearranged to form ethanol (and carbon dioxide).
The Energy Question: Explaining changes in forms of energy: How do you think that energy is changing from one form to another? Some chemical energy associated with the sugar is changed to movement and heat.

Wisconsin Energy Institute – www.energy.wisc.edu/education 31
Lesson 2 Activity 2: Yeast Fermentation – Observations and Explanations Activity Description Students observe the fermentation reaction and compare the results to their predictions. Objectives
• Explain the matter and energy changes associated with fermentation.
Materials Presentation 2.2 Yeast Fermentation – Observations and Explanations Copies for students of Worksheet 2.2 Yeast Fermentation – Observations and Explanations Worksheet Guide 2.2 Yeast Fermentation – Observations and Explanations -‐ below One Fermentation setup for each group
• One digital balance • A large, clear air-‐tight container • Bromothymol blue (BTB) solution to detect CO2 in the air inside the container • One plastic Petri dish for BTB • A 100 mL beaker containing 1 tsp baker’s yeast and 1 tsp sugar to which you will add 40
-‐ 50 mL of warm water • Optional for identifying the presence of ethanol – breathalyzer (inexpensive (~$35)
personal breathalyzers are available online); 5 – 10 cc syringe (no needle); or an ethanol probe (see for example, Vernier).
Directions 1. Have students setup the fermentation reaction. Handout Worksheet 2.2 Yeast
Fermentation – Observations and Explanations. You may choose to adjust the instructions for the setup to match what the class decided on. Show Presentation 2.2 Yeast Fermentation – Observations and Explanations. Show Slide 2 to help students setup the reaction.
2. Have students observe the fermentation reaction. Once students have gathered all they need, have them put the yeast and sugar in the beaker, add the warm water, and stir briefly. They should put the beaker on the scales, record the mass, and cover the setup. Caution students that they need to arrange things in the container so that they can read the scales every 5 minutes without opening the system. Have them record their data in Part B of the worksheet.
6. Pool students’ data. Show Slide 3. Have students look for patterns in their data and record these in Part C.
7. Have students explain the class results. Have the students (individually, and then in groups) complete Parts D and E, explaining their results and noting remaining questions. Use Slide 4 to lead a discussion of their explanations. Students’ explanations may not yet be

Wisconsin Energy Institute – www.energy.wisc.edu/education 32
accurate, but they should be backed by their observations and they should explain their observations.
Background Information Baker’s yeast, dry active yeast, and quick rising yeast are all dehydrated, dormant forms of live yeast. Some forms may contain a carbon source such as ascorbic acid so that the yeast can get started as soon it is moistened. This explains why a control with yeast and water without sugar may show some activity. Tips A 100 ml beaker is usually large enough to accommodate the foam that is produced by the fermentation, but light enough for the digital scales. Because the reaction is done at room temperature and the warm water cools fairly rapidly, it takes approximately 20 minutes to see a reasonable mass change (0.2 – 0.3 g). Keeping the beakers in warm water and setting up the reaction quickly will speed the reaction, but is not a necessity. Modifications If the yeast reaction is allowed to run for an hour or more, students will be able to smell the alcohol, though they may not be familiar with its smell. The presence of ethanol can be more clearly confirmed using a Breathalyzer or an ethanol probe. In either case, setup the same reaction in a snack-‐size sealable bag. To use the Breathalyzer, use a 5 or 10 cc syringe to withdraw some of the air in the bag. Following the manufacturer’s instructions, use the syringe to push the air into the Breathalyzer. (You will need to push several syringes worth of fresh air through the Breathalyzer to flush out the ethanol if you want to take a second reading immediately.) To use an ethanol probe, open one corner of the bag and insert the probe following the manufacturer’s instructions. You might want to set up a control without yeast to verify that mass loss is not due to water evaporation. Extending the Learning Students can graph mass changes and ethanol levels, if they are following them. Have students research different fermentation processes such as bread or pizza making, pickling, and production of cheese, vinegar, soy sauce, citric acid, or the location of the nearest ethanol plant. Lesson 2.2 Yeast Fermentation Observations and Explanations Worksheet Guide A. Procedures to follow: 1. Pour some BTB solution into the top of petri dish and place it in the sealable container.
Place your digital scale next to the BTB petri dish, turn it on, and wait until it reads 0.00g.
Wisconsin Energy Institute – www.energy.wisc.edu/education 33
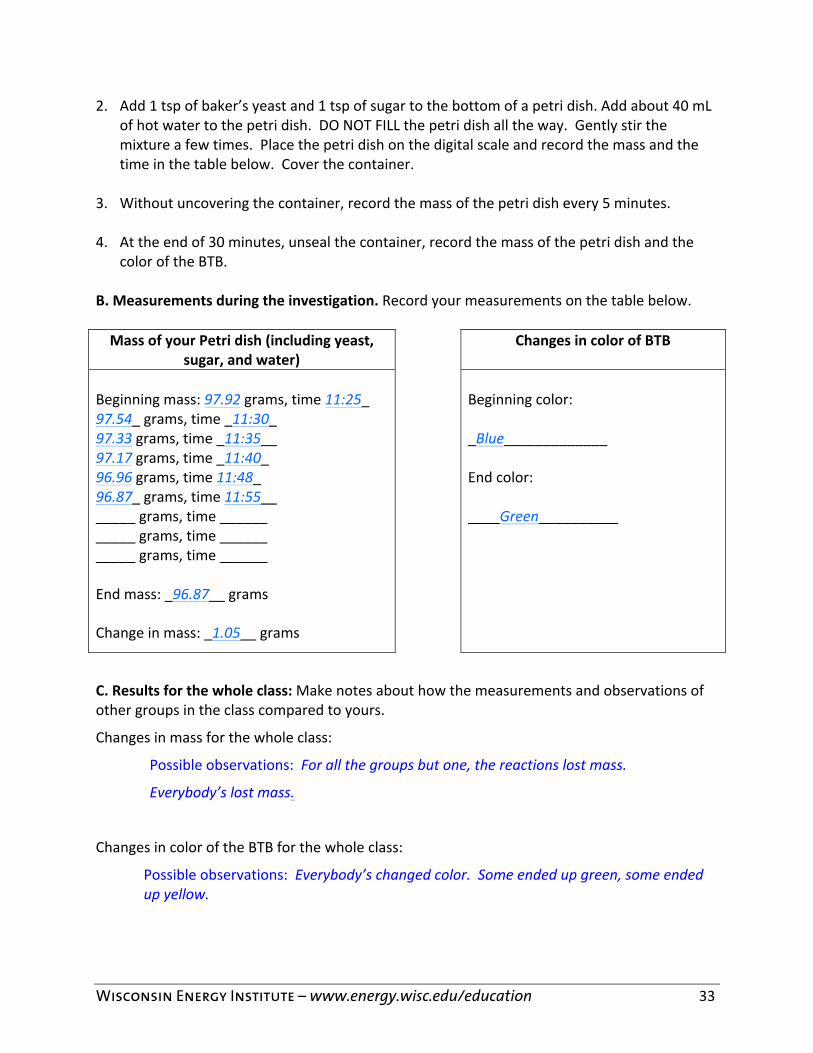
2. Add 1 tsp of baker’s yeast and 1 tsp of sugar to the bottom of a petri dish. Add about 40 mL of hot water to the petri dish. DO NOT FILL the petri dish all the way. Gently stir the mixture a few times. Place the petri dish on the digital scale and record the mass and the time in the table below. Cover the container.
3. Without uncovering the container, record the mass of the petri dish every 5 minutes. 4. At the end of 30 minutes, unseal the container, record the mass of the petri dish and the
color of the BTB. B. Measurements during the investigation. Record your measurements on the table below. Mass of your Petri dish (including yeast,
sugar, and water) Changes in color of BTB
Beginning mass: 97.92 grams, time 11:25_ 97.54_ grams, time _11:30_ 97.33 grams, time _11:35__ 97.17 grams, time _11:40_ 96.96 grams, time 11:48_ 96.87_ grams, time 11:55__ _____ grams, time ______ _____ grams, time ______ _____ grams, time ______ End mass: _96.87__ grams Change in mass: _1.05__ grams
Beginning color: _Blue_____________ End color: ____Green__________
C. Results for the whole class: Make notes about how the measurements and observations of other groups in the class compared to yours.
Changes in mass for the whole class:
Possible observations: For all the groups but one, the reactions lost mass.
Everybody’s lost mass.
Changes in color of the BTB for the whole class:
Possible observations: Everybody’s changed color. Some ended up green, some ended up yellow.

Wisconsin Energy Institute – www.energy.wisc.edu/education 34
D. Explaining your results: Try to write an explanation of your class results that includes answers to all Three Questions: the Location/Movement Question, the Carbon Question, and the Energy Question
The molecules with carbon atoms (sugar) are breaking apart and the atoms are being rearranged to form ethanol and carbon dioxide. The atoms in the carbon dioxide are leaving the reaction mix as a gas. That’s why the reaction mix loses weight. Maybe the yeast are using the sugar as an energy source.
E. UNANSWERED QUESTIONS: What questions about movement of atoms, about molecules with carbon atoms, or about changes in forms of energy can you NOT answer based on evidence from the investigation? Write your ideas below.
Some possible student questions: We don’t really know what the energy is doing. Why are yeast doing this? Why aren’t the yeast just making carbon dioxide like the mold did? Why don’t the yeast do this without water? Why is the reaction foamy?
Lesson 2 Activity 3: Tracing Matter and Energy Through Fermentation Activity Description Students summarize what they know about fermentation and model the matter and energy changes. Objectives
• Explain the matter and energy changes associated with fermentation. Materials
• Lesson 2.3 Tracing Matter and Energy Through Fermentation Presentation • Copies for students of Lesson 2.3 Tracing Matter and Energy Through Fermentation
Worksheet – pages 1 and 2 separate from pages 3 and 4. • Lesson 2.3 Assessing Tracing Matter and Energy Through Fermentation Worksheet
Guide -‐ below • Molecular modeling kits that include C, H, and O atoms plus twist ties • Copies for students of Process Tool for Molecular Modeling Poster
Directions 1. Synthesis of information on ethanol and yeast
Use Lesson 2.3 Tracing Matter and Energy Through Fermentation Presentation, Slides 2 -‐ 5 to help students gather what they already know about ethanol and fungi and to introduce them to yeast’s anaerobic capabilities. Based on this and previous units, what we know about ethanol From Lesson 1

Wisconsin Energy Institute – www.energy.wisc.edu/education 35
• Ethanol = CH3CH2OH • When ethanol is burned with oxygen, carbon dioxide and water are produced and
energy is released. • Ethanol can be mixed with gasoline to make a fuel that can be used in cars. From latest investigation • During fermentation, yeast makes ethanol along with carbon dioxide from sugar.
2. Molecular modeling • Handout pages 1 and 2, but not 3 and 4 of Lesson 2.3 Tracing Matter and Energy
Through Fermentation Worksheet, Molecular Modeling Poster, and Molecular Modeling kits.
• Show Slide 6 and have students work in pairs to build two molecules of sugar with the C-‐C and C-‐H bonds flagged with twist ties. Have them check their models against Slide 7.
• Have the pairs take one of the sugar molecule models and rearrange the atoms into ethanol molecules and carbon dioxide molecules. They may need to try several possibilities before discovering that they can make 2 ethanol and 2 carbon dioxide molecules with no leftover atoms. Have them check their results against Slides 8 and 9.
• Have students complete parts A, B, and C of the worksheet. 3. The energy conundrum
Students will find that all of the twist ties originally in the sugar are associated with the ethanol molecules. This implies that no chemical energy is transformed during fermentation. • Use Slide 10 to introduce students to a more sophisticated model of chemical energy in
organic molecules where C-‐H and C-‐C bonds are not seen as having equivalent energies.
• Have students complete section D of the worksheet. The goal of the worksheet is to have students apply what they know about fermentation to determine the energy transformations associated with fermentation. This explains why yeast undergoes fermentation (to release energy) and why ethanol can be used as a fuel.
Background information This model-‐building activity will show that some of the chemical potential energy in sugar is transformed during fermentation. This means that the resulting ethanol has less chemical potential energy than the sugar. The yeast uses the released energy to do cellular work. However there are still high-‐energy bonds (C-‐C and C-‐H) in ethanol, therefore ethanol can act as a fuel. Energy is released when ethanol undergoes combustion. Tips It may help students when counting different types of bonds, to differentiate the C-‐C and C-‐H bonds in some way such as different colored twist ties. When students get to question 7, it may be useful for them to write all of the equations in one place and to indicate whether energy is released from or incorporated into the products.

Wisconsin Energy Institute – www.energy.wisc.edu/education 36
Modifications N/A Extending the Learning Use the same molecular modeling exercise to have students determine whether other liquid biomolecules such as vinegar have chemical potential energy in the form of C-‐C and C-‐H bonds and therefore could be used as fuels. Lesson 2.3 Tracing Matter and Energy in Fermentation Worksheet Guide A. Using molecular models to show why yeast use fermentation. In order for yeast to survive and grow, they need energy. Yeast get energy from chemical energy in their food (organic carbon molecules like sugar), just like we do. Food molecules like sugar have C-‐C and C-‐H bonds which have more chemical potential energy in them than C-‐O and H-‐O bonds.
Yeast have two options for transforming the energy in sugar. If oxygen is available, they can do cellular respiration. This produces carbon dioxide (CO2) and water (H2O). Since carbon dioxide and water have only low-‐energy bonds (C-‐O and H-‐O), the chemical energy is released. Use the molecular models to show how this happens. If oxygen is not available, yeast do fermentation. This produces carbon dioxide (CO2) and ethanol (CH3CH2OH).
1. Work with your partner to make models of two reactant molecules of sugar (C6H12O6). Using twist ties, show how chemical energy is stored in the high-‐energy bonds of sugar.
a. Put these molecules on the reactant side of the Process Tool for Molecular Models poster.
b. Put the “Chemical Energy” card under the sugar molecule to label the energy in the C-‐C and C-‐H bonds. Note how many energy units (twisty ties) there are in the sugar molecule.
2. Show how the atoms of one of the reactant molecules can recombine into product molecules—carbon dioxide and ethanol.
a. Take one of the sugar molecules apart and recombine them into carbon dioxide (CO2) and ethanol (CH3CH2OH) molecules. Put twist ties around each C-‐C and C-‐H bonds. Put these molecules on the product side of the Process Tool for Molecular Models poster. Some things to notice:
i. How many carbon dioxide molecules were produced? 2___ ii. How many ethanol molecules were produced? 2___
b. Energy lasts forever. How many twist ties are not in the ethanol, that is how many twist ties are left over?_0___

Wisconsin Energy Institute – www.energy.wisc.edu/education 37
B. Atoms last forever!! Check yourself: did your number and type of atoms stay the same at the beginning and end of the chemical change? Use the table below to account for all the atoms and bonds in your models. Energy lasts forever! Write the type of energy for reactants and products in the chemical change. Matter Energy
How many carbon atoms
How many oxygen atoms
How many hydrogen atoms
How many twisty ties?
What forms of energy?
Began with… Sugar
6
6
12
12
Chemical energy
Total in reactants
6
6
12
12
End with… Carbon Dioxide
2
4
0
0
Chemical energy
Ethanol
4
2
12
12
Total in products
6
6
12
12
C. Writing the chemical equation. Use the molecular formulas (C6H12O6, CO2, CH3CH2OH) and the yield sign (à) to write a balanced chemical equation for the reaction:
C6H12O6 à2 CO2 +2 CH3CH2OH
D. The fermentation energy puzzle. We said that fermentation was an alternative to cellular respiration that yeast could use when no oxygen was available. But fermentation does not appear to release energy. We started with 12 twist ties (high energy bonds) in the sugar molecule and we ended up with 12 in the two ethanol molecules. The problem is that we have not been entirely accurate in our energy accounting. We have counted C-‐C and C-‐H bonds as being equal. In fact, C-‐H bonds don’t have quite as much energy in them as C-‐C bonds. Breaking a C-‐C bond and forming a C-‐H bond yields some energy. Let’s use this information to re-‐evaluate the energy transformations associated with fermentation.

Wisconsin Energy Institute – www.energy.wisc.edu/education 38
Use your molecular models to answer the following questions. Reactant Products How many C-‐C bonds are in the initial sugar molecule?__5____
How many C-‐C bonds are in the resulting ethanol molecules?_2______
How many C-‐H bonds are in the initial sugar molecule?__7_____
How many C-‐H bonds are in the resulting ethanol molecules?_10_______
How many C-‐C bonds were broken and reformed as C-‐H bonds?__3_____ E. Summarizing what we know about fermentation. We have learned that yeast have two options for how they use molecules like sugar for energy.
• In the presence of oxygen, they can do cellular respiration resulting in the production of carbon dioxide and water.
• When no oxygen is present, they can do fermentation resulting in the production of carbon dioxide and ethanol.
• We also learned that ethanol can be burned (undergo combustion) resulting in the production of carbon dioxide and water.
Place these substances on the chemical energy diagram below. Placing a substance higher on the diagram means that it has more chemical energy. • Sugar • Ethanol • Carbon dioxide and water
Chemical Energy
Sugar
Ethanol
Carbon dioxide Water
Note: It would be more accurate to include oxygen gas high up on this chart, because the O-‐O bond is unstable (has a lot of chemical energy) compared to the C-‐O and H-‐O bonds formed during combustion. However, we have chosen to simplify the picture for students.
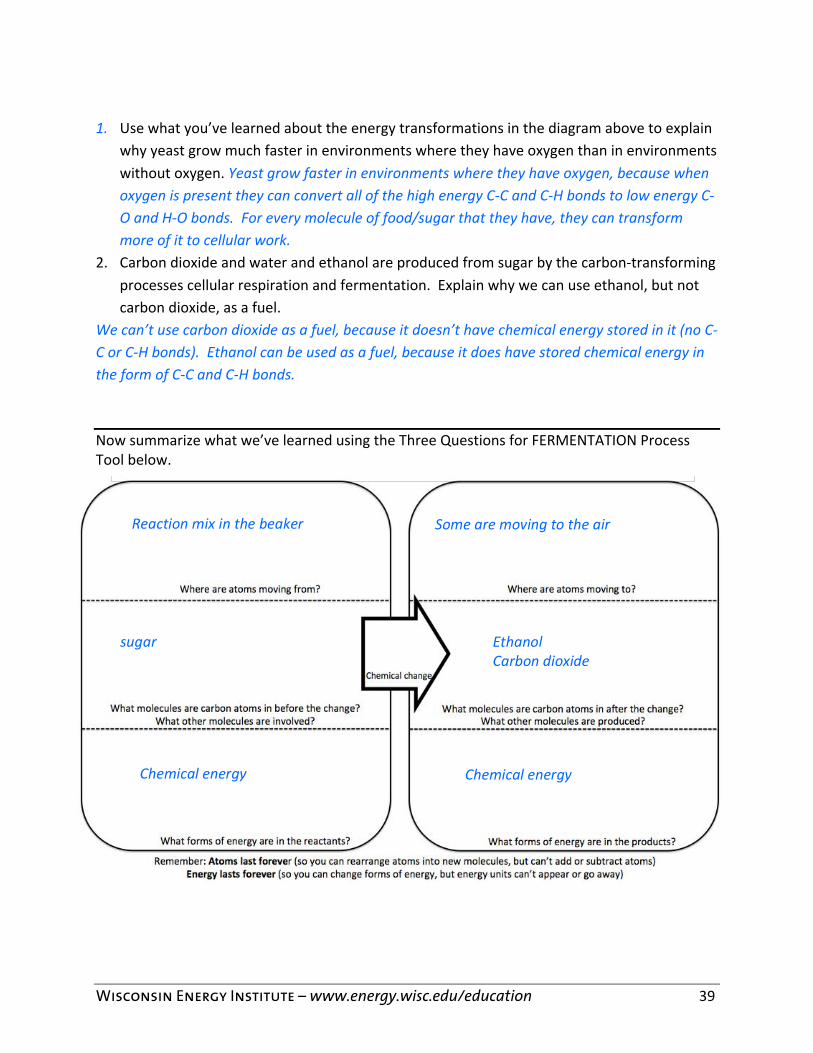
Wisconsin Energy Institute – www.energy.wisc.edu/education 39
1. Use what you’ve learned about the energy transformations in the diagram above to explain
why yeast grow much faster in environments where they have oxygen than in environments without oxygen. Yeast grow faster in environments where they have oxygen, because when oxygen is present they can convert all of the high energy C-‐C and C-‐H bonds to low energy C-‐O and H-‐O bonds. For every molecule of food/sugar that they have, they can transform more of it to cellular work.
2. Carbon dioxide and water and ethanol are produced from sugar by the carbon-‐transforming processes cellular respiration and fermentation. Explain why we can use ethanol, but not carbon dioxide, as a fuel.
We can’t use carbon dioxide as a fuel, because it doesn’t have chemical energy stored in it (no C-‐C or C-‐H bonds). Ethanol can be used as a fuel, because it does have stored chemical energy in the form of C-‐C and C-‐H bonds.
Now summarize what we’ve learned using the Three Questions for FERMENTATION Process Tool below.
sugar Ethanol Carbon dioxide
Reaction mix in the beaker Some are moving to the air
Chemical energy Chemical energy

Wisconsin Energy Institute – www.energy.wisc.edu/education 40
Lesson 3: Fuels and the Global Carbon Cycle
Guiding Question Why are fossil fuels associated with global climate change? Can biofuels help? Lesson Description Students study the effects of using fossil fuels and biofuels on the amount of carbon dioxide in the atmosphere Background Information Burning or combustion of fossil fuels produces carbon dioxide which enters the atmosphere. Because of this, whenever we use fossil fuels, the net effect is to transfer carbon from underground reservoirs to the atmosphere. In the atmosphere, carbon dioxide acts as a greenhouse gas. Sunlight travels through the atmosphere, is absorbed by the earth’s surface, and reradiated as infrared light. The greenhouse gases absorb and re-‐emit the infrared in all direction, some of it back to earth. This slows the earth’s cooling process contributing to global climate change. Combustion of biofuels, like combustion of fossil fuels, produces carbon dioxide. However biofuels are made from plant material. Therefore the carbon in the biofuels was recently in atmospheric carbon dioxide. Production and use of biofuels moves carbon from the atmosphere into plants and then biofuels and back into the atmosphere. It doesn’t add carbon from another pool into the atmosphere.
Lesson 3 Activity 1: Finding the Carbon Activity Description Students learn about the greenhouse effect and identify pools of carbon that might contribute to carbon dioxide in the atmosphere. Objectives
• Identify pools of carbon on the global scale. Materials
• Lesson 3.1 The Greenhouse Effect Presentation • Lesson 3.1 Finding the Carbon Presentation • Copies for students of Lesson 3.1 Finding the Carbon Worksheet • Lesson 3.1 Finding the Carbon Worksheet Guide – below

Wisconsin Energy Institute – www.energy.wisc.edu/education 41
Directions 1. Use Lesson 3.1 The Greenhouse Effect Presentation to introduce students to the greenhouse
effect. 2. Show Lesson 3.1 Finding the Carbon Presentation, Slides 1 and 2 and handout Lesson 3.1
Finding the Carbon Worksheet. Have students answer questions 1 and 2. 3. Call on individual students to share one specific place where there is carbon and have that
student write the place and type of carbon (organic vs inorganic) on a sticky note that is posted on the board.
4. As a class, group the sticky notes by carbon pool. The four pools we focus on in this unit are: atmosphere, soil, fossil fuels, and biomass, but let students experiment with groupings before talking about this particular arrangement. If students mention the ocean, tell them Yes! This is a big pool (the biggest), but this pool doesn’t play a big role in the fossil fuel story.
5. Show Slide 4 and tell students that during this unit we will divide all of the carbon in the world into 4 pools. Discuss how these pools compare with the ones they identified. Ask students for examples of carbon-‐containing things in each pool (i.e., soil has worms and decaying dead things, biomass has living and once-‐living things, fossil fuels have coal, oil, gas, and atmosphere has CO2 and other carbon containing greenhouse gases). Point out that: • The atmosphere pool contains many greenhouse gases that contain carbon, but in this
unit we just focus on CO2, which is the most prevalent greenhouse gas. • The biomass pool contains carbon found in the form of animals and plants and
decomposers, but most of the biomass is stored in the wood of trees. • The soil carbon pool is larger than the atmosphere and biomass pools combined! This
pool contains carbon in the form of dead plants, animals, and decomposers. 6. Use Slide 4 to summarize the activity. Tips This lesson requires students to shift from thinking about carbon-‐transforming processes at the human scale to the global scale. Students may have difficulty understanding that a tree here and a kangaroo in Australia are both considered part of the same carbon pool that we call biomass. To help students with this, it is important to take the time to listen to students’ examples of what they think belongs in each pool and to question them if all of their examples are local. Modifications/Extensions In this lesson we are focusing only on the greenhouse gas, carbon dioxide. However, there are many greenhouse gases that affect global temperatures and the levels of many of these are also affected by human activity. This includes the nitrogen cycle. Students can research these. For more information, see Global Climate Goings-‐on: A Guide to Greenhouse Gases for Teachers in the Supplementary Materials
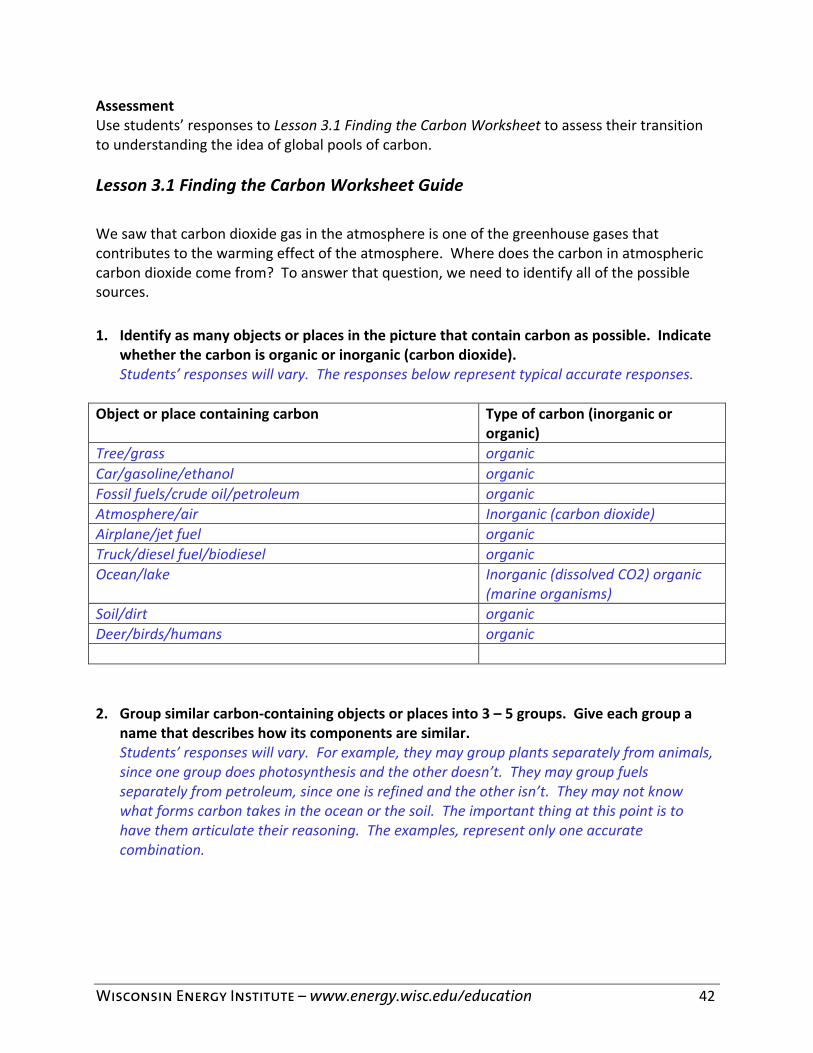
Wisconsin Energy Institute – www.energy.wisc.edu/education 42
Assessment Use students’ responses to Lesson 3.1 Finding the Carbon Worksheet to assess their transition to understanding the idea of global pools of carbon. Lesson 3.1 Finding the Carbon Worksheet Guide
We saw that carbon dioxide gas in the atmosphere is one of the greenhouse gases that contributes to the warming effect of the atmosphere. Where does the carbon in atmospheric carbon dioxide come from? To answer that question, we need to identify all of the possible sources. 1. Identify as many objects or places in the picture that contain carbon as possible. Indicate
whether the carbon is organic or inorganic (carbon dioxide). Students’ responses will vary. The responses below represent typical accurate responses.
Object or place containing carbon Type of carbon (inorganic or organic)
Tree/grass organic Car/gasoline/ethanol organic Fossil fuels/crude oil/petroleum organic Atmosphere/air Inorganic (carbon dioxide) Airplane/jet fuel organic Truck/diesel fuel/biodiesel organic Ocean/lake Inorganic (dissolved CO2) organic
(marine organisms) Soil/dirt organic Deer/birds/humans organic 2. Group similar carbon-‐containing objects or places into 3 – 5 groups. Give each group a
name that describes how its components are similar. Students’ responses will vary. For example, they may group plants separately from animals, since one group does photosynthesis and the other doesn’t. They may group fuels separately from petroleum, since one is refined and the other isn’t. They may not know what forms carbon takes in the ocean or the soil. The important thing at this point is to have them articulate their reasoning. The examples, represent only one accurate combination.

Wisconsin Energy Institute – www.energy.wisc.edu/education 43
Group name Carbon-‐containing objects or places Living things & remains of living things
Deer, humans, birds, trees, grass
Soil/dirt Microbes, remains of living things, worms
Atmosphere, air
Carbon dioxide, (methane)
Fossil fuels Petroleum, crude oil, fuels, natural gas, coal

Wisconsin Energy Institute – www.energy.wisc.edu/education 44
Lesson 3 Activity 2: The Global Carbon Cycle Activity Description Students learn about the global carbon cycle and explore how the use of fossil fuels moves carbon into the atmosphere. Objectives
1. Explain how the combustion of fossil fuels moves carbon from underground pools into the atmosphere contributing to global climate change
Materials
• Lesson 3.2 The Global Carbon Cycle Presentation • Copies for students of Lesson 3.2 The Global Carbon Cycle Worksheet • Lesson 3.2 The Global Carbon Cycle Worksheet Guide -‐ below
Directions 1. Show students Slides 1 and 2 of Lesson 3.2 The Global Carbon Cycle Presentation and tell
students that they will be exploring why fossil fuel use is associated with global climate change.
2. Handout Lesson 3.2 The Global Carbon Cycle Worksheet and have students answer question 1. Discuss students’ responses and compare them to those on the next slide.
3. Show Slide 4. Explain to students that now that they understand how carbon/matter moves between the pools, they are now going focus on energy. They are answering the same 3 questions they answered in their investigations of processes at the human scale for the global scale. The same forms of energy apply at both scales. Have students give some examples of each type of energy (radiation – sunlight, candle flame; chemical energy – food, molecules in living or dead things, fuels; work or motion – moving objects or molecules, moving car or organism, contracting muscles).
4. Have students answer question 2, then discuss. 5. Have students answer questions 3 and 4. 6. Use Slides 5 – 9 to confirm students’ responses to Qs 3 and 4. Extensions Students can research the rates of movement between carbon pools at the global level or at the human scale. For example, the flux between the atmosphere and biomass is about 122 Gt/yr (from IPCC report 2007). Information for building a scale model is available at The Poker Chip Carbon Flux Simulation at https://energy.wisc.edu/education/educational-‐materials/poker-‐chip-‐model-‐global-‐carbon-‐pools-‐and-‐fluxes. Assessment Use students’ responses to Lesson 3.2 The Global Carbon Cycle Worksheet to assess students’ understanding of how combustion of fossil fuels contributes to global climate change. See Lesson 3.2 The Global Carbon Cycle Worksheet Guide below.

Wisconsin Energy Institute – www.energy.wisc.edu/education 45
Lesson 3.2 The Global Carbon Cycle Worksheet Guide 1. On the diagram below, label each arrow that represents a process that we have studied.
Note that not all of the arrows will be labeled.
PS – photosynthesis; CR – cellular respiration; F – fermentation; D – decomposition = cellular respiration and fermentation
2. For each of the processes in the carbon cycle diagram in question 1, identify what form(s) the energy is in before and after the process.
PS CR, F, D
Fossilization
CR, F, D
Combustion

Wisconsin Energy Institute – www.energy.wisc.edu/education 46
Process Form of energy BEFORE Form of energy AFTER Photosynthesis
Sunlight/radiation Chemical energy in the molecules of living things
cellular respiration
Chemical energy in the molecules of living things
Chemical energy in ATP à cellular work à heat
fermentation
Chemical energy in the molecules of living things
Chemical energy in ATP à cellular work à heat
fossilization
Chemical energy in the molecules of living things
Chemical energy in crude oil
combustion
Chemical energy in fuels Work/motion of vehicle, light, heat
3. Which part of the carbon cycle is connected to the formation and use of fossil fuels? • Circle the processes associated with formation of fossil fuels in green. These are
processes that happened millions of years ago. Shown in answer to question 1. • Circle the processes associated with use of fossil fuels in red. These are processes are
happening today at an ever-‐increasing rate. Shown in answer to question 1. 4. Explain how use of fossil fuels is increasing the amount of carbon dioxide in the atmosphere
and therefore contributing to global warming. Combustion of fossil fuels moves carbon from underground pools to the atmosphere. Crude oil is pumped out of the ground and refined into fuels. When the fuels are burned, carbon dioxide is produced and released into the air. Carbon dioxide is a greenhouse gas, so the more carbon dioxide in the air, the warmer the earth and the higher the global temperature. Note: this does not mean that all places will experience higher temperatures, because sunlight is not absorbed uniformly around the earth and air and ocean currents distribute it unevenly. Students with low level understanding of global climate change may say simply that burning fossil fuels produces pollution which is bad for the earth and causes global warming. Other students may confuse the greenhouse effect with the polar holes in the ozone, saying that carbon dioxide worsens the hole in the ozone letting in more light and thus causing warming. In fact, these are two unrelated phenomena. The hole in the ozone is a case where world action halted a dangerous outcome of human action. Ozone in the upper layers of the atmosphere prevents dangerous uv radiation from reaching earth. In 1999, many countries agreed to reduce the production and use of chemicals in aerosols and refrigerants that reacted with and destroyed ozone.

Wisconsin Energy Institute – www.energy.wisc.edu/education 47
Lesson 3 Activity 3: Biofuels vs Fossil Fuels Activity Description Students use a diagram of the global carbon cycle to determine the effects of substituting biofuels for fossil fuels on atmospheric carbon. Objectives
• Explain how the substitution of biofuels for fossil fuels has the potential to help with the problem of global climate change caused by increasing levels of atmospheric CO2.
Materials
• Presentation 3.3 -‐ Can Biofuels Help with the Global Climate Change Problem? • Copies for students of Lesson 3.3 Worksheet -‐ Can Biofuels Help with the Global Climate
Change Problem? • Lesson 3.3 Can Biofuels Help with the Global Climate Change Problem? Worksheet
Guide – below Directions 1. Show Presentation 3.3 -‐ Can Biofuels Help with the Global Climate Change Problem? Use
Slides 2, 3, and 4 as a segue from the previous activity. When we use fossil fuels as an energy source for any of the activities shown in Slide 2, carbon in the form of carbon dioxide moves from the fossil fuel pool to the atmosphere (Slides 3 and 4). Because carbon dioxide is a greenhouse gas, this results in global climate change. (The exception is electricity made from wind, solar, or water energy.)
2. Handout Lesson 3.3 Can Biofuels Help with the Global Climate Change Problem? Worksheet. Show Slide 5 which has versions of the three questions and rules that are appropriate for the global scale. Have students answer question 1, then discuss their answers.
3. Then have students complete the diagram in question 2. Have students compare their diagrams and compile a consensus picture.
4. Show Slide 6 after students build a consensus model. Smaller arrows btw fossil fuels and the atmosphere represent the movement of carbon associated with the production of gasoline (blue) and ethanol (green). Continue to show Slide 6 as students complete and discuss questions 3 and 4.
Extending the Learning A more quantitative look at the global carbon cycle, the Poker Chip Model, is available at https://energy.wisc.edu/education/educational-‐materials/poker-‐chip-‐model-‐global-‐carbon-‐pools-‐and-‐fluxes. Students can look more closely at the financial and environmental costs of oil at http://www.ted.com/talks/garth_lenz_images_of_beauty_and_devastation.

Wisconsin Energy Institute – www.energy.wisc.edu/education 48
Assessment Use Worksheet Lesson 3.3 Can biofuels help? to assess students understanding of the potential of biofuels in helping with the global climate change problem. Lesson 3.3 -‐ Can biofuels help with the global climate change problem? Worksheet Guide
A first approximation Can substituting ethanol made from plant material instead of gasoline slow the increase in atmospheric carbon dioxide? 1. We will use the global scale 3 questions to help answer this critical question. We will
compare the production and combustion of fossil fuels to the production and combustion of biofuels. More specifically, we will compare the use of gasoline to the production and use of ethanol.
What carbon pools are involved?
How are carbon atoms moving btw pools?
How is energy flowing?
Extraction of crude oil & gasoline production
Fossil fuels/gasoline
C in crude oil in the fossil fuel pool is moved to the earth’s surface & gasoline is extracted from it.
Chemical energy in fossil fuels/gasoline is moved to the surface Extraction & production of gasoline requires energy
Combustion of gasoline in a vehicle
Fossil fuels/gasoline Atmosphere
C is moved from gasoline in vehicle engines to carbon dioxide in the atmosphere
Chemical energy in gasoline is converted to heat and mechanical energy
Growth of corn (photosynthesis)
Atmosphere Biomass
C in carbon dioxide in the atmosphere moves into biomolecules in corn.
Energy in sunlight is converted to chemical energy in sugar (and heat)
Production of ethanol from corn
Biomass Ethanol Atmosphere
C in sugar from the sugar moves into ethanol and carbon dioxide in the atmos.
Some of the chemical energy in sugar is transformed to heat and mechanical energy. Some remains in the ethanol.
Combustion of ethanol
Ethanol Atmosphere
C in ethanol moves into carbon dioxide in the atmosphere
Chemical energy in ethanol is converted to heat and mechanical energy

Wisconsin Energy Institute – www.energy.wisc.edu/education 49
2. On the diagram below, draw and label arrow for each process in the chart above showing where the carbon moves during that process. Draw all of the arrows associated with gasoline in one color. Draw all of the arrows associated with ethanol in a different color
Growing corn
Combustion of ethanol
Fossil Fuels organic carbon
Soil Organic carbon
Combustion of
gasoline Energy of fuel production

Wisconsin Energy Institute – www.energy.wisc.edu/education 50
3. Explain why you think substituting ethanol made from plant material will or will not help slow the increase in atmospheric carbon dioxide. Support your conclusion with information from questions 1 and 2.
Substituting ethanol for gasoline will help slow the increase in atmospheric carbon dioxide. Instead of adding new carbon from the fossil fuel pool to the atmosphere, growing corn and producing and burning ethanol recycles carbon that was already in the atmosphere. 4. Combustion of biofuels such as ethanol produces carbon dioxide in the same way that
combustion of fossil fuels like gasoline does. Why is it that people think that biofuels will be helpful in slowing the increase in atmospheric carbon dioxide?
Even though combustion of biofuels produces carbon dioxide just like combustion of gasoline, it’s not new additional carbon. It’s carbon that was in that pool recently. Note that some students may still think that biofuels are beneficial because they produce less carbon dioxide than fossil fuels when burned. It may be useful for those students to revisit the equations for combustion of gasoline and ethanol from Lesson 1.
Wisconsin Energy Institute – www.energy.wisc.edu/education 51
Lesson 4: A Closer Look at Biofuels
Guiding Questions What problems do we need to solve to make biofuels a viable alternative to fossil fuels? Lesson Description Students investigate alternative sources for production of ethanol and analyze some of the costs and benefits of different biofuels crops. Background Information Currently, most of the ethanol in the US is made from corn. However, corn is also used to feed most of the livestock we eat, so there are competing demands on our corn supply. Because of this, organizations like the Great Lakes Bioenergy Research Center (https://www.glbrc.org/) are developing ways of making ethanol from other plant materials such as corn stalks and cobs, grasses, and wood. The primary molecule in these materials is cellulose. Because most fermenters can’t use cellulose unless it is broken down into sugars, this is not as simple as process as ethanol production from starch or sugar. A lot of research is going into modifying the production of ethanol from cellulose so that it is cost effective. This means adjusting every step in the process.
Lesson 4 Activity 1: Alternative Sources of Sugar for Ethanol Production Activity Description Students learn about the competing uses of corn. They investigate the sugar polymers, starch and cellulose as inputs to fermentation. Objectives
• Describe the limitations of the fermentation process. Materials
• Lesson 4.1 Sources Of Sugar For Ethanol Production Presentation • Copies for students of Lesson 4.1 Sources Of Sugar For Ethanol Production Worksheet • Lesson 4.1 Sources Of Sugar For Ethanol Production Worksheet Guide – below
Each lab group will need: • 1 snack-‐sized sealable bag – labeled with their names • 1 teaspoon sugar source (e.g. sugar, sawdust, corn starch, dry grass, cardboard, tapioca
starch, flour) • 1 teaspoon baker’s yeast • 50 mL warm water

Wisconsin Energy Institute – www.energy.wisc.edu/education 52
Warm water baths -‐ The water bath need not be continuously heated. Warm water in a styrofoam container is fine. The reaction will work at room temperature. However, rather than seeing a significant change in 10 minutes with the sugar, it will take half an hour or longer. Directions 1. Alternative sources of sugar for ethanol production
Use Lesson 4.1 Sources of Sugar for Ethanol Production Presentation, Slides 1 -‐ 4 to one of the issues with corn as a source for the biofuel, ethanol – that there are many competing uses for corn and we cannot grow enough corn to meet all of the demand.
2. Use Slides 5 – 10 to introduce students to the idea of making ethanol from the sugar polymers, starch and cellulose.
3. Lab preparation and predictions. Show Slide 11 of the presentation and have the class discuss starch and sugar sources that they would like to test. Handout Lesson 4.2 Sources Of Sugar For Ethanol Production Worksheet. Give different groups different sugar sources. Have each group setup their fermentation in a bag and put it in the warm water bath. While their reactions are going, they can enter their predictions into the worksheet.
4. Observations, pooling class data and explanations After 20 – 30 minutes, have students fill in the appropriate observations in their data table. Collect students’ observations on Slide 12 and have students fill in their tables including explanations of the class observations.
Background Information Most yeast produce some amylase, the enzyme that breaks down starch into two-‐sugar units. However their amylase activity is slower than the fermentation process, so students will see less fermentation with starch than with sugar. Yeast do not produce a cellulase, the enzyme that breaks down cellulose into sugar units. Some fungi and bacteria, such as the bacteria in the digestive tracks of ruminants and termites, do produce cellulases. Tips Reactions can be left overnight at room temperature. To see a clear difference, reactions should be left for at least a half hour and all should use the same temperature water. You should also have the class agree on how they are going to measure the extent of their reactions. One way is to have them seal the bags with as little air in them as possible. Then as the bag inflates, they can use its height when laid flat on a table as a measure. Modifications • You can restrict students to a list of starch and cellulose sources or allow them to bring in
their own. • You can have the class determine what controls they think are important or you can direct
them to use particular controls, such as sugar (to make sure the yeast are active), no sugar source (to make sure there is no contaminating sugar source – much yeast is packaged with some sugar), or sugar and starch or cellulose (to make sure there is nothing mixed with the alternative sugar source that is contaminating the yeast).

Wisconsin Energy Institute – www.energy.wisc.edu/education 53
Extending the Learning • Students can experiment with sources of enzymes that break down cellulose so that the
yeast can do fermentation. See for example, Bioprospecting for Cellulose-‐Degrading Microbes (https://www.glbrc.org/education/classroom-‐materials)
• If you have a way of measuring the amount of ethanol produced such as an ethanol probe, students can experiment with different conditions such as temperature, amount of enzyme, or pH to try to optimize the ethanol yield. See for example, https://www.glbrc.org/education/classroom-‐materials/cb2e-‐converting-‐cellulosic-‐biomass-‐ethanol and https://www.glbrc.org/education/classroom-‐materials/fermentation-‐challenge-‐making-‐ethanol-‐cellulose
• You can introduce the idea of enzymes (amylases) that break starch into sugars and have students try starch and amylase.
Assessment The last column of the worksheet will give assessment data on how students are interpreting their observations. It is not necessary that students know about different types of sugar-‐sugar bonds, just that more organisms have enzymes that can break down starch than cellulose.
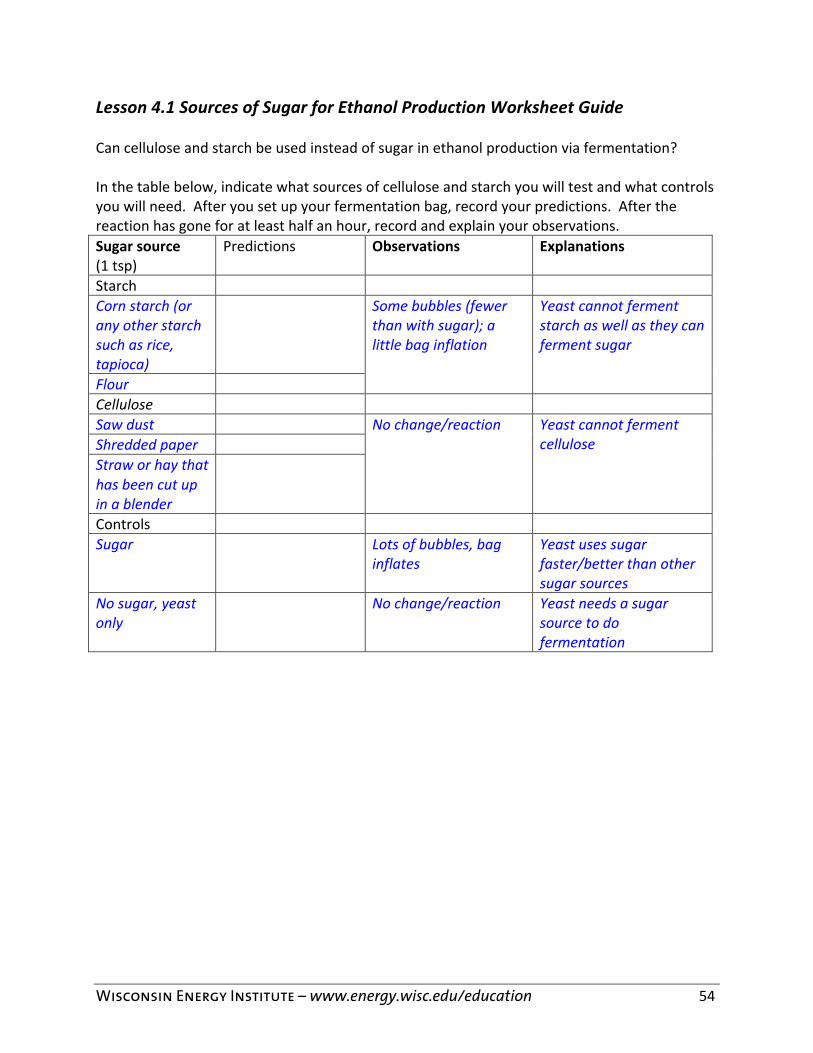
Wisconsin Energy Institute – www.energy.wisc.edu/education 54
Lesson 4.1 Sources of Sugar for Ethanol Production Worksheet Guide Can cellulose and starch be used instead of sugar in ethanol production via fermentation? In the table below, indicate what sources of cellulose and starch you will test and what controls you will need. After you set up your fermentation bag, record your predictions. After the reaction has gone for at least half an hour, record and explain your observations. Sugar source (1 tsp)
Predictions Observations
Explanations
Starch Corn starch (or any other starch such as rice, tapioca)
Some bubbles (fewer than with sugar); a little bag inflation
Yeast cannot ferment starch as well as they can ferment sugar
Flour Cellulose Saw dust No change/reaction Yeast cannot ferment
cellulose Shredded paper Straw or hay that has been cut up in a blender
Controls Sugar Lots of bubbles, bag
inflates Yeast uses sugar faster/better than other sugar sources
No sugar, yeast only
No change/reaction Yeast needs a sugar source to do fermentation

Wisconsin Energy Institute – www.energy.wisc.edu/education 55
Lesson 4 Activity 2: Do biofuels help? A closer look Activity Description Students are introduced to the process of making ethanol from cellulosic plant material. They do a partial cost/benefit analysis of the process from an environmental perspective. Objectives
• Trace matter and energy as part of a cost/benefit analysis of ethanol production. Materials
• Lesson 4.2 Ethanol from Cellulose Presentation
Directions 1. Introduce the process of making ethanol from cellulose (plant material).
Use Slides 1 – 6 of Lesson 4.2 Ethanol from Cellulose Presentation to introduce students to the process of making ethanol from cellulose (plant material).
2. Introduce Cost/Benefit Analysis of Biofuels. Use Slide 7 of the presentation to introduce students to the idea of a cost/benefit analysis. Note: this analysis is done from an environmental perspective with the goal of seeing whether cellulosic ethanol is a viable substitute for gasoline and can help slow the increase of atmospheric carbon dioxide. Individuals may have different perspectives. For example, a farmer will focus on his costs and what he can earn raising biofuel crops. A person who drives a lot may focus on the price at the pump.
3. Students’ ideas about costs of ethanol production. Focus students on the first step of ethanol production – growing and harvesting the biofuel crop. Show the first part of Slide 8 and have students suggest ways of minimizing the cost, that is producing cheap plant material. Ethanol plants will want to buy biomass for as little as possible. Farmers will want as much plant material as possible for every dollar they spend planting and harvesting. Record students’ ideas, then show the rest of the slide to suggest more ideas.
4. Students’ ideas about benefits of ethanol production. Substituting ethanol for gasoline will benefit the environment only if the production of ethanol does not move a lot of carbon into the atmosphere through fuel use. Show the first part of Slide 9 and have students suggest ways of minimizing the carbon footprint of biofuel agriculture. Record students’ ideas, then show the rest of the slide to suggest more ideas.
5. Connecting the cost/benefit analysis to the carbon cycle. Show Slide 10 and ask students which arrows are associated with the costs of biofuels agriculture and which are associated with the benefits. See Slide for more details.
Background Information Cost/benefit analyses need to be done from a particular perspective. What may be a cost to one person may be a benefit to another. In this analysis, we are taking an environmental perspective. Our goal is inexpensive ethanol that can be substituted for gasoline thus slowing

Wisconsin Energy Institute – www.energy.wisc.edu/education 56
the increase in atmospheric carbon dioxide. We are defining the cost as costs associated with ethanol production, thus we want cheap plant material. We are defining the benefit as a small carbon footprint so that we don’t undo what we gain by substituting a biofuel for a fossil fuel. Tips Students may struggle with the idea of a cost/benefit analysis, because there are multiple perspectives, some of which may be closer to their own perspective than the environmental one. Also, they may not be familiar with agricultural processes. If students are unable to respond to Slides 8 and 9, it may useful to first have them describe the processes involved in growing corn. Modifications You may have students do a cost/benefit analysis on something more familiar before doing this one. Extending the Learning Have students predict variables for each of the steps in ethanol production. In this activity they looked at the source of the biomass. In the next activity students will look at how the biomass is grown. Temperature, time, pH, enzyme amounts are all variables that can be adjusted and may affect yield. Students can take a more in-‐depth look at the carbon footprints of fuel production and use in the following activities: Life Cycle Assessment of Biofuels 101 and Quantitative Modeling of Biofuels Life Cycles available at https://www.glbrc.org/education/classroom-‐materials.
Lesson 4 Activity 3: Biofuels Agriculture Activity Description Students interpret data on biofuels agriculture to support claims about beneficial agricultural practices. Objectives
• Interpret data on biofuels agriculture and use it to support claims about beneficial agricultural practices.
Materials
• Lesson 4.3 – Biofuels Agriculture Presentation • Copies for students of Lesson 4.3 – Biofuels Agriculture Worksheet • Lesson 4.3 –Biofuels Agriculture Worksheet Guide

Wisconsin Energy Institute – www.energy.wisc.edu/education 57
Directions 1. Understanding the data.
Show Lesson 4.3 – Biofuels Agriculture Presentation to help students understand the data.
2. Using the data Hand out Lesson 4.3 – Biofuels Agriculture Worksheet. Have students work in pairs or small groups to complete questions 1 – 3 on the worksheet. Discuss the class’s answers.
3. Using data to support decisions After the class discussion, have students complete question 4 on the worksheet.
Background Information The data presented here are taken from agricultural studies done in the upper Midwest. These studies report yields in Mg hectare-‐1 yr-‐1 . Mg or megagrams are metric tonnes. A hectare is an area equal to 100 m by 100 m or 104 m2. Because these units are not ones that are familiar to students, we have converted them to people football field-‐1 yr-‐1 . This means that the plant material harvested from a field the size of a football field would weigh the same as that many people. We are assuming the people weigh ~150 lbs.
Tips/Modifications You may want to have pairs or groups work on question 1 and then discuss their answers before having them work on questions 2 and 3. If students struggle to understand the data, you could have them draw a picture to represent each number. For example for the first row of data, they could draw 227 people standing on a football field (representing the yield) and 9 people dressed in black walking off of the field (representing the soil carbon that is lost). Extending the Learning Have students ask questions about other agricultural factors such as fertilizer or fuel used to harvest. They can pursue these questions by doing online research or communicating with the extension office of a public university. Students can research how crops in their area may be affected by global climate change. See for example, http://www.epa.gov/climatechange/impacts-‐adaptation/agriculture.html Students can explore the variables associated with biofuel crop production by playing a board game, The Bioenergy Farm Game, available at https://www.glbrc.org/education/classroom-‐materials or a computer game, Fields of Fuel, available at fieldsoffuel.org. Assessment Students’ responses to the worksheet and class discussion will provide data on students’ ability to identify and interpret the pertinent data to answer questions and make claims.

Wisconsin Energy Institute – www.energy.wisc.edu/education 58
Lesson 4.4 Assessing Biofuels Agriculture Worksheet Guide Below is a table with data on some of the factors that need to be considered in a cost/benefit analysis of the production of biofuels crops. Crop type Perennial
verses annual
Annual Biomass Yield people fbf-‐1 yr-‐1
Change in soil carbon people fbf-‐1 yr-‐1
Conventional corn
A 227 -‐8.9
No till corn A 227 -‐2.5
Switchgrass P 180 +2.4 Prairie grass P 81 +1.8 People = the mass of an average person (~150 lbs) Fbf = are the size of a football field
1. Type of agriculture. Compare corn that is grown in the conventional way where furrows are plowed in the ground and seeds dropped into them with no-‐till corn where the corn seeds are drilled into the ground without plowing.
a. Which planting method produces more biomass? Conventional till No till Same b. Which planting method is more helpful in keeping carbon in the soil?
Conventional till No till c. Which data did you use to determine your answer to part b? I compared change in soil
carbon for conventional and not till corn. They are negative numbers, because every year some carbon is lost from the soil. With conventional till more carbon (~9 units) are lost each year vs 2.5 units for no till corn.
2. Annual vs perennial. d. Which type of crop produces more biomass? Annual Perennial e. Which data did you use to determine your answer to part a? I compared the annual for
corn to the annual yield for the grasses. Both types of grass yield less biomass (180 & 81 vs 227 units).
c. Which type of crop is more helpful in keeping carbon in the soil? Annual Perennial d. Which data did you use to determine your answer to part c? I compared the change in
soil carbon for the grasses to the change in soil carbon for corn. For corn, it’s negative. That means that carbon is lost from the soil each year. For the grasses, it’s positive. That means that the carbon is building up in the soil.
e. Which type of crop is likely to require more energy for planting, tending, and harvesting? Annual Perennial Explain your answer. The perennial grasses don’t need to be planted every year, just harvested. The annual corn needs to be planted
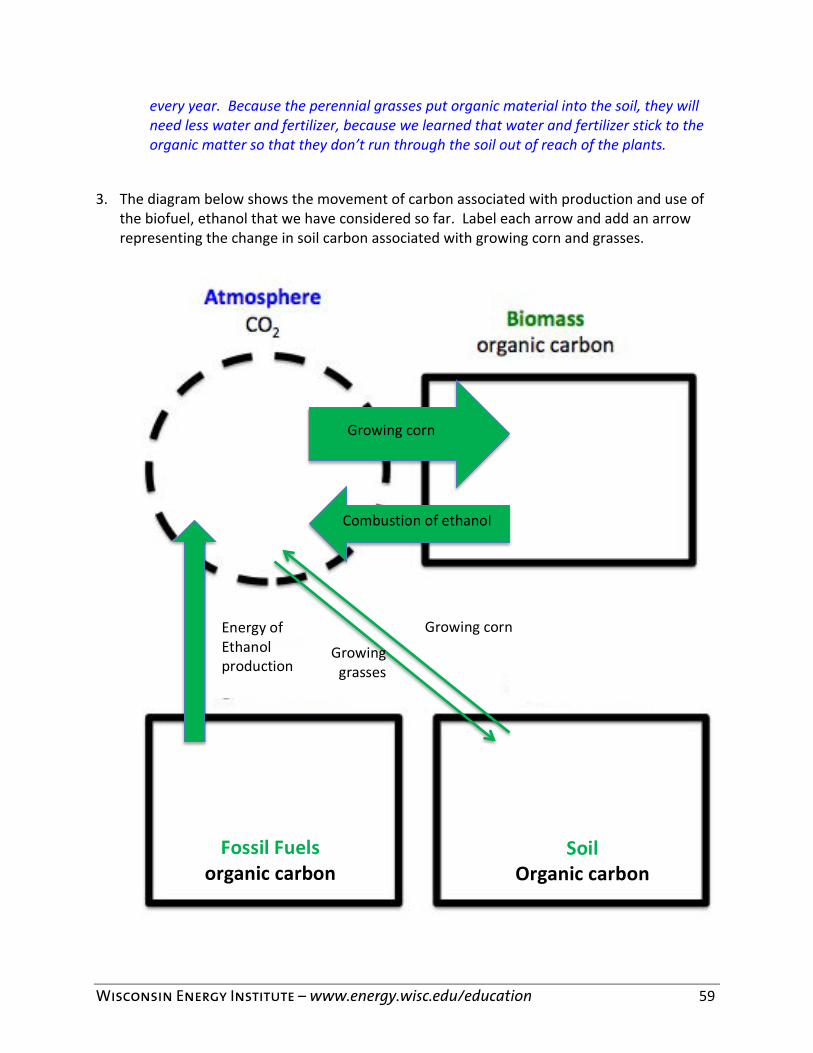
Wisconsin Energy Institute – www.energy.wisc.edu/education 59
every year. Because the perennial grasses put organic material into the soil, they will need less water and fertilizer, because we learned that water and fertilizer stick to the organic matter so that they don’t run through the soil out of reach of the plants.
3. The diagram below shows the movement of carbon associated with production and use of
the biofuel, ethanol that we have considered so far. Label each arrow and add an arrow representing the change in soil carbon associated with growing corn and grasses.
Growing corn
Combustion of ethanol
Soil Organic carbon
Fossil Fuels organic carbon
Growing corn
Growing grasses
Energy of Ethanol production

Wisconsin Energy Institute – www.energy.wisc.edu/education 60
In diagrams like this, we often use the width of the arrow to represent the amount of material that is moving. Compared to the arrow that represents the amount of carbon that moves from the atmosphere into biomass, how wide should the arrow representing the change in soil carbon be? For no till corn: 2.5/227 the arrow for organic matter lost from the soil would be approximately one hundredth the width of the arrow for growing the crop For switch grass: 2.4/180 = 0.13 the arrow for organic matter accumulating in the soil would be slightly wider than one hundredth the arrow for growing the crop 4. Cost/benefit analysis. Remember that in order to have biofuels help with the global
warming problem, we want to maximize the amount of plant biomass produced and minimize the amount of energy needed to produce it. If you were a congressman thinking about environmental policy, which option would you support? a. Conventional corn No till corn Switchgrass Prairie grass b. Explain your answer including which data you used to make your decision. There is no right answer here, because there are pros and cons to each option and more information is really needed. We are looking for well-‐supported answers. Example 1: I would support farming corn using the no till method. This would maximize the biomass produced (227 units vs 180 units) while doing less harm to the soil than conventional methods. It would deplete the carbon at a rate 2.5 units per year rather than 8.9 units per year. Example 2: I would support farming switch grass. The yield is somewhat less (~80%), but not having to plant every year and not needing as much fertilizer because of the increasing soil carbon might make up for this. I think the grass might be more drought-‐tolerant, too, so farmers wouldn’t have to worry so much about weather.
c. What other data might you need to consider to determine if this is a good choice? I need to know about the amount of fuel associated with planting, tending, and harvesting each crop and I need to know how much money farmers would make growing each crop.

Copyright © 2015. All rights reserved. This document may be reproduced for individual classroom use, or the equivalent, only. All other uses are prohibited without written permission from the Great Lakes Bioenergy
Research Center.
www.glbrc.org/[email protected]