biogas resources characterization (presentation) · pdf file3 develop a cost-analysis tool for...
TRANSCRIPT
Ali Jalalzadeh-AzarGenevieve SaurAnthony Lopez
National Renewable Energy Laboratory
2010 Hydrogen Program Annual Merit Review
June 8, 2010
Project ID: AN005NREL/PR-560-48057
Biogas Resources Characterization
This presentation does not contain any proprietary, confidential, or otherwise restricted informationNREL is a national laboratory of the U.S. Department of Energy, Office of Energy Efficiency and Renewable Energy, operated by the Alliance for Sustainable Energy, LLC
Overview
Project start: August 2009 Project finish: September 2010 Percent complete: ~ 80%
2
Stove-piped/Siloed Analytical Capability (4.5.B)
Inconsistent Data, Assumptions and Guidelines (4.5.C)
Suite of Models and Tools (4.5.D)
Total project funding: $326K(100% DOE-funded)
Funding in FY2009: $326K Funding in FY2010: None
None
Timeline
Budget
Barriers
Partners
National Renewable Energy Laboratory Innovation for Our Energy Future
3
Develop a cost-analysis tool for bio-methane production from biogas based on the H2A Production model.
Gather GIS data on biogas resources in California and cost data on biogas purification systems.
Perform techno-economic analyses for various scenarios involving production and utilization of bio-methane.
Relevance
Objectives
Drivers / Benefits
Fuel cells operating on bio-methane or on hydrogen derived from bio-methane can mitigate energy and environmental issues and provide an opportunity for their commercialization.
The availability of incentives and requirements for renewables such as: California RPS requirements: 20% by 2010 and 33% by 2020 SB1505 renewable content requirement: 33% by 2020 (under review). SGIP (self-generation incentive program.)
The project can provide valuable insights and information to the stakeholders—utilities, municipalities, and policy makers (at a macro-level) and producers of biogas (at a micro-level).
National Renewable Energy Laboratory Innovation for Our Energy Future
4
Approach Develop a cost-analysis tool based on the H2A Production model that is
transparent and vetted. The model focuses on biogas upgrading process with optional post compression.
Collect, qualify, and analyze GIS and cost data: Selected sources of biogas—landfills, dairy farms, and sewage treatment
plants. GIS data—biogas potential in California, energy consumption, distances of
biogas sites from the load centers and utility grids. Cost data—purification systems, pipeline extension, and fuel cells.
Perform techno-economic analyses focusing on: Bio-methane production via biogas purification / upgrading. Bio-methane utilization via on-site fuel cell technologies and/or injection into
natural gas pipeline for expanded market.
Evaluate impact of federal and state incentives on the cost of bio-methane.
National Renewable Energy Laboratory Innovation for Our Energy Future
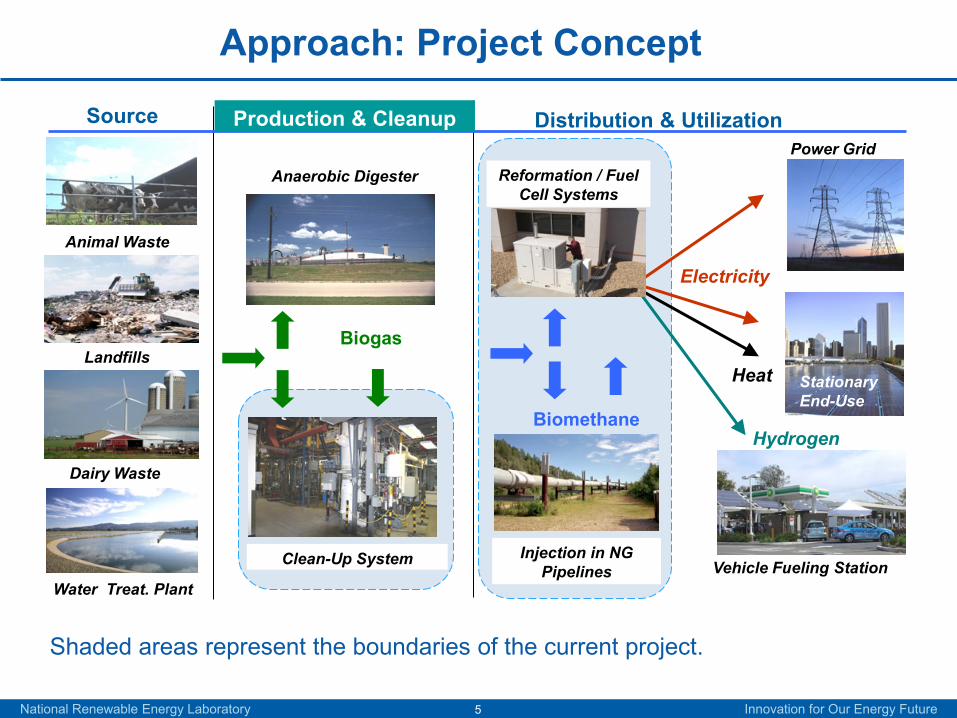
Approach: Project Concept
5
Water Treat. Plant
Animal Waste
Landfills
Dairy Waste
Anaerobic Digester
Clean-Up System Injection in NG Pipelines
Source Distribution & UtilizationPower Grid
Vehicle Fueling Station
Hydrogen
Electricity
Heat Stationary End-Use
Biomethane
Biogas
Production & Cleanup
Reformation / Fuel Cell Systems
Shaded areas represent the boundaries of the current project.
National Renewable Energy Laboratory Innovation for Our Energy Future

6
Approach: Milestones
Milestone Title Date Status
2.11.1
Provide update on the collection of GIS, cost and technical biogas data and information.
2/26/2010 Complete
2.11.2 Complete Upstream H2A biogas model. May 2010 Complete
2.11.3 Hold Stakeholder workshop on biogas systems. Sept 2010 In Progress
National Renewable Energy Laboratory Innovation for Our Energy Future
7
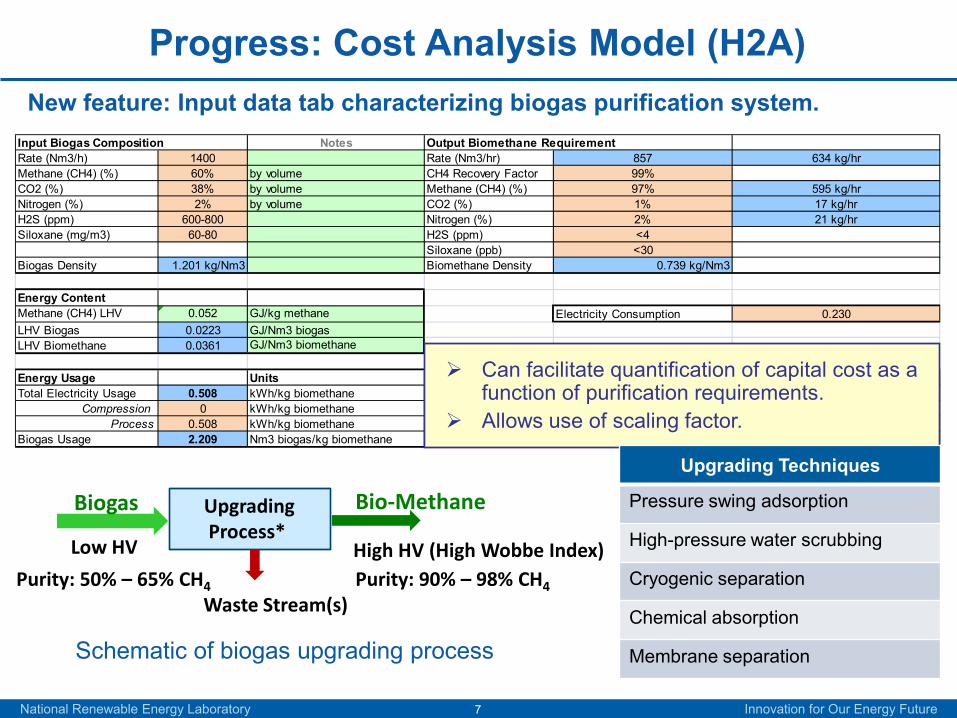
Progress: Cost Analysis Model (H2A) New feature: Input data tab characterizing biogas purification system.
Input Biogas Composition Notes Output Biomethane RequirementRate (Nm3/h) 1400 Rate (Nm3/hr) 857 634 kg/hrMethane (CH4) (%) 60% by volume CH4 Recovery Factor 99%CO2 (%) 38% by volume Methane (CH4) (%) 97% 595 kg/hrNitrogen (%) 2% by volume CO2 (%) 1% 17 kg/hrH2S (ppm) 600-800 Nitrogen (%) 2% 21 kg/hrSiloxane (mg/m3) 60-80 H2S (ppm) <4
Siloxane (ppb) <30Biogas Density 1.201 kg/Nm3 Biomethane Density 0.739 kg/Nm3
Energy ContentMethane (CH4) LHV 0.052 GJ/kg methane Electricity Consumption 0.230LHV Biogas 0.0223 GJ/Nm3 biogasLHV Biomethane 0.0361 GJ/Nm3 biomethane
Energy Usage Units NotesTotal Electricity Usage 0.508 kWh/kg biomethane
Compression 0 kWh/kg biomethaneProcess 0.508 kWh/kg biomethane
Biogas Usage 2.209 Nm3 biogas/kg biomethane
Can facilitate quantification of capital cost as a function of purification requirements.
Allows use of scaling factor.
UpgradingProcess*
Low HV High HV (High Wobbe Index)
Waste Stream(s)Purity: 90% – 98% CH4
Biogas Bio-Methane
Purity: 50% – 65% CH4
Upgrading Techniques
Pressure swing adsorption
High-pressure water scrubbing
Cryogenic separation
Chemical absorption
Membrane separation
National Renewable Energy Laboratory Innovation for Our Energy Future
Schematic of biogas upgrading process

8
Progress: Sample Results of Model
Specific Item Cost Calculation $0.53/kg $10.86/GJ
Cost ComponentBiomethane
Production Cost Contribution ($/kg)
Percentage of CostBiomethane
Production Cost Contribution ($/GJ)
Capital Costs $0.11 21.22% $2.30Decommissioning Costs $0.00 0.24% $0.03Fixed O&M $0.05 9.13% $0.99Feedstock Costs $0.34 64.03% $6.95Other Raw Material Costs $0.00 0.00% $0.00
Byproduct Credits $0.00 0.00% $0.00Other Variable Costs (including utilities) $0.03 5.37% $0.58
Total $0.53 $10.86
Key Results
Costs
Cost components and relative values
Total unit cost of bio-methane
Energy
Process energy usage
Upstream energy usage
Process energy efficiency
EmissionsProcess emissions
Upstream emissions
SensitivityTornado chart depicting sensitivity of bio-methane cost to key variables.
Emissions Summary CO2 CH4 N2O Total GHG (CO2 eq)
Total upstream emissions(kg/kg biomethane) -1.96 2.27E-03 2.47E-05 -1.898
Total process emissions(kg/kg biomethane) 1.62 0.01 0.00 1.84
$6.00 $7.00 $8.00 $9.00 $10.00 $11.00 $12.00 $13.00 $14.00 $15.00
Electricity Usage (-/+ 5%)
Electricity Price (-/+ 10%)
Operating Capacity Factor (95%,90%,85%)
Total Direct Capital Cost (-/+ 10%)
Biogas Usage (-/+ 5%)
Biogas Price ($2.9/GJ,$7.6/GJ,$11/GJ)
Biomethane Cost ($/GJ)
Biomethane Cost Sensitivity
National Renewable Energy Laboratory Innovation for Our Energy Future

9
Progress: Qualification of Cost Data
0
1
2
3
4
5
6
0
2
4
6
8
10
12
0 500 1,000 1,500 2,000
Rel
ativ
e C
ost o
f Bio
met
hane
Pro
duct
ion
Rel
ativ
e C
apita
l Cos
t
Feed Biogas Capacity, Nm3/h
Vender A, Total Capital
Project I, Total Capital
Vender A, Biomethane Cost (calc.)
Project I, Biomethane Cost (calc.)
Bio-Methane Cost,“Biomethane from Dairy Waste,”Krich et al, July 2005
Assumptions:
Effective CF = 90%Inflation rate = 1.9%ROR = 10%Life span = 20 yrs. Salvage value = 0.
Feed CH4 = 50% - 60%Input pressure= 1 bar (abs.)Output pressure = ~ 7 - 8 bar
National Renewable Energy Laboratory Innovation for Our Energy Future
Note: Project “I” represents an actual installation in California.
The differences are in part due to the uncertainty in the estimated biogas capacity and in underlying assumptions of other sources of data.
10
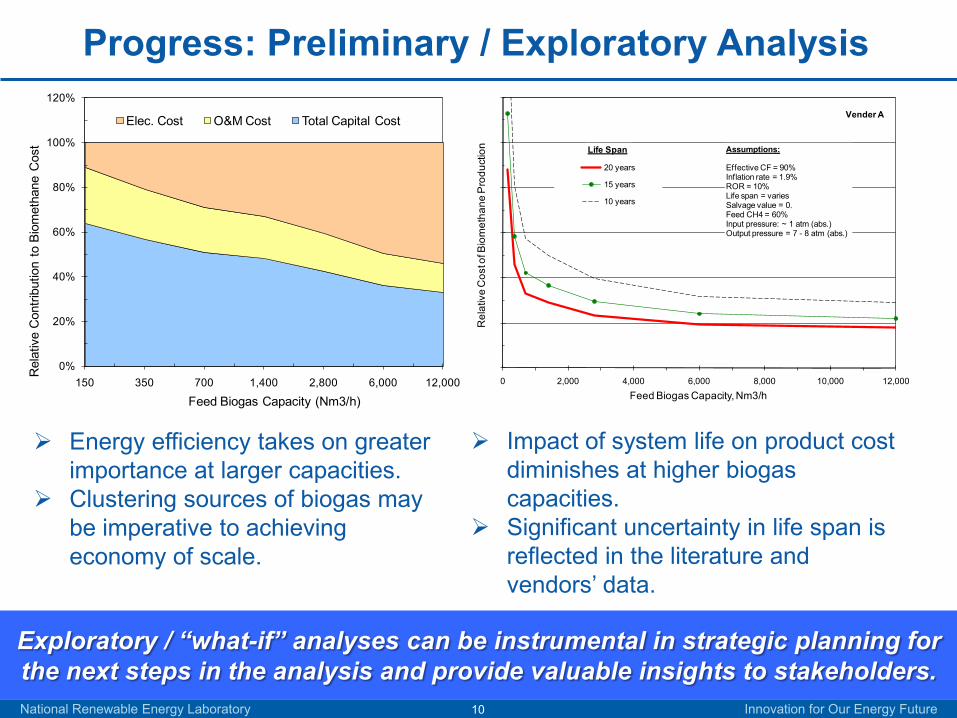
Progress: Preliminary / Exploratory Analysis
Energy efficiency takes on greater importance at larger capacities.
Clustering sources of biogas may be imperative to achieving economy of scale.
Impact of system life on product cost diminishes at higher biogas capacities.
Significant uncertainty in life span is reflected in the literature and vendors’ data.
National Renewable Energy Laboratory Innovation for Our Energy Future
0%
20%
40%
60%
80%
100%
120%
150 350 700 1,400 2,800 6,000 12,000
Rel
ativ
e C
ontri
butio
n to
Bio
met
hane
Cos
t
Feed Biogas Capacity (Nm3/h)
Elec. Cost O&M Cost Total Capital Cost
0
1
2
3
4
5
6
0 2,000 4,000 6,000 8,000 10,000 12,000
Rel
ativ
e C
ost o
f Bio
met
hane
Pro
duct
ion
Feed Biogas Capacity, Nm3/h
20 years
15 years
10 years
Assumptions:
Effective CF = 90%Inflation rate = 1.9%ROR = 10%Life span = variesSalvage value = 0.Feed CH4 = 60%Input pressure: ~ 1 atm (abs.) Output pressure = 7 - 8 atm (abs.)
Life Span
Vender A
Exploratory / “what-if” analyses can be instrumental in strategic planning for the next steps in the analysis and provide valuable insights to stakeholders.

11
Progress: Preliminary Cost Estimates
Select AD Type
Reported elec. gen. costs*,$ / GJ of elec.
Estimated biogas*,cost, $/GJ
Approx. Biometh. Cost = AD + Upgrad. Cost, $/GJ
Remarks / AssumptionsThe reported values are compilation of data from number of AD case studies with a wide range of biogas output capacities.
Estimates are in 2010 USD. The reported cost data were adjusted for inflation.
Upgrading cost of ~$1.5 per GJ of bio-methane was used for relatively large biogas capacities.
Estimates for total cost of bio-methane neglect cost of AD/upgrading system integration and other indirect costs.
Covered AD—Dairy
$12.59 $2.9 $4.4
Plug-flow—Dairy
$34.82 $7.6 $9.1
Mixed—Dairy $52.39 $11.0 $12.5
* Source: “An Analysis of Energy Production Costs from Anaerobic Digestion Systems on U.S. Livestock Production Facilities,” Technical Note No. 1, Natural Resources Conservation Service, USDA, October 2007.
Upgrading biogas from dairy-farm anaerobic digesters.
Price of natural gas (residential) is approx. $9.5/GJ for CA and $11.7 for U.S. based on EIA data: http://tonto.eia.doe.gov/state/state_energy_profiles.cfm?sid=CA
National Renewable Energy Laboratory Innovation for Our Energy Future
1212
Progress: GIS Map for California
National Renewable Energy Laboratory Innovation for Our Energy Future
Select categories of biogas resources: Landfills, sewage treatment plants, and dairy farms.
Landfills offer greater biogas potential.
Transmission lines are reasonably accessible to most of biogas sources in select categories.
Majority of GIS data are for the central valley due to systematic tracking.
GIS data for a number of counties, including Sacramento, San Joaquin, and Solano, have been verified. Data validation continues.
Data may be unavailable for a number of dairy farms in California.
1313National Renewable Energy Laboratory Innovation for Our Energy Future
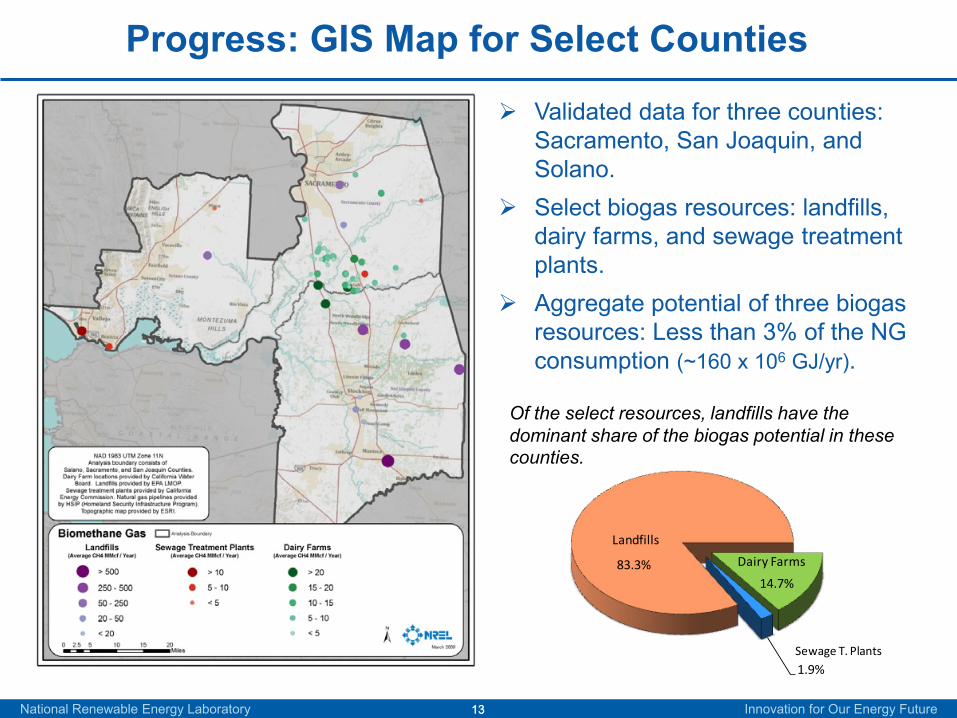
Progress: GIS Map for Select Counties
Validated data for three counties: Sacramento, San Joaquin, and Solano.
Select biogas resources: landfills, dairy farms, and sewage treatment plants.
Aggregate potential of three biogas resources: Less than 3% of the NG consumption (~160 x 106 GJ/yr).
83.3%14.7%
1.9%
Dairy Farms
Sewage T. Plants
Landfills
Of the select resources, landfills have the dominant share of the biogas potential in these counties.
1414
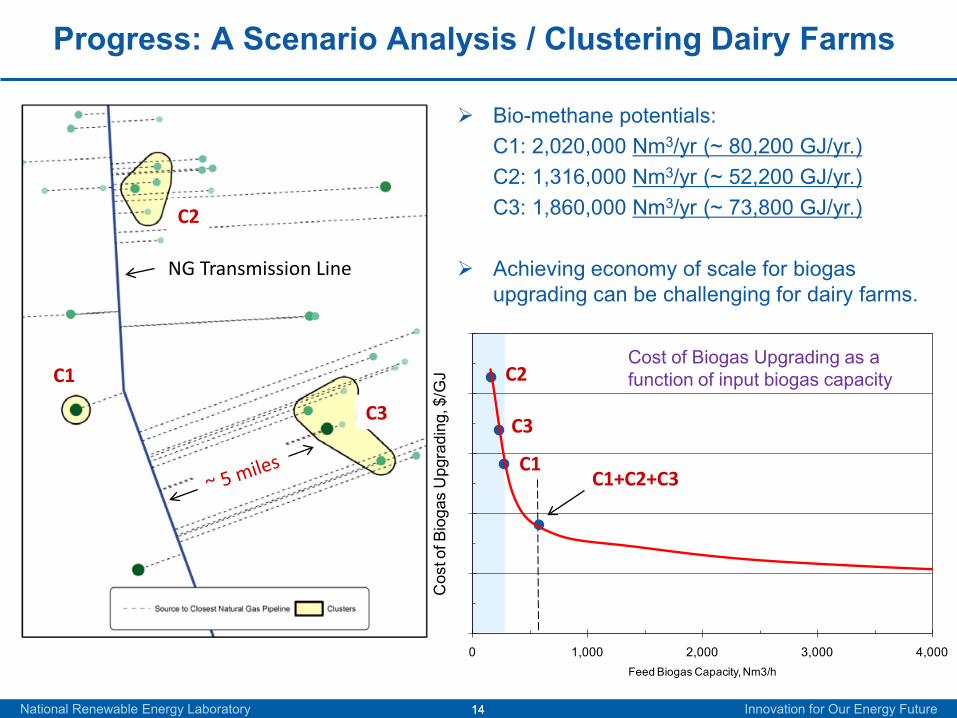
Progress: A Scenario Analysis / Clustering Dairy Farms
National Renewable Energy Laboratory Innovation for Our Energy Future
Bio-methane potentials: C1: 2,020,000 Nm3/yr (~ 80,200 GJ/yr.)C2: 1,316,000 Nm3/yr (~ 52,200 GJ/yr.)C3: 1,860,000 Nm3/yr (~ 73,800 GJ/yr.)
Achieving economy of scale for biogas upgrading can be challenging for dairy farms.
C1C1+C2+C3
C3
C2Cost of Biogas Upgrading as a function of input biogas capacity
C3
C1
C2
NG Transmission Line
0
1
2
3
4
5
0 1,000 2,000 3,000 4,000
Cos
t of B
ioga
s U
pgra
ding
, $/G
J
Feed Biogas Capacity, Nm3/h
1515National Renewable Energy Laboratory Innovation for Our Energy Future
0
200,000
400,000
600,000
800,000
1,000,000
1,200,000
1,400,000
0 5 10 15 20 25
Tota
l Con
stru
ctio
n Co
st, $
/ m
ile
Pipe Diameter, in.
Mean Total Construction Costs
NG pipeline cost
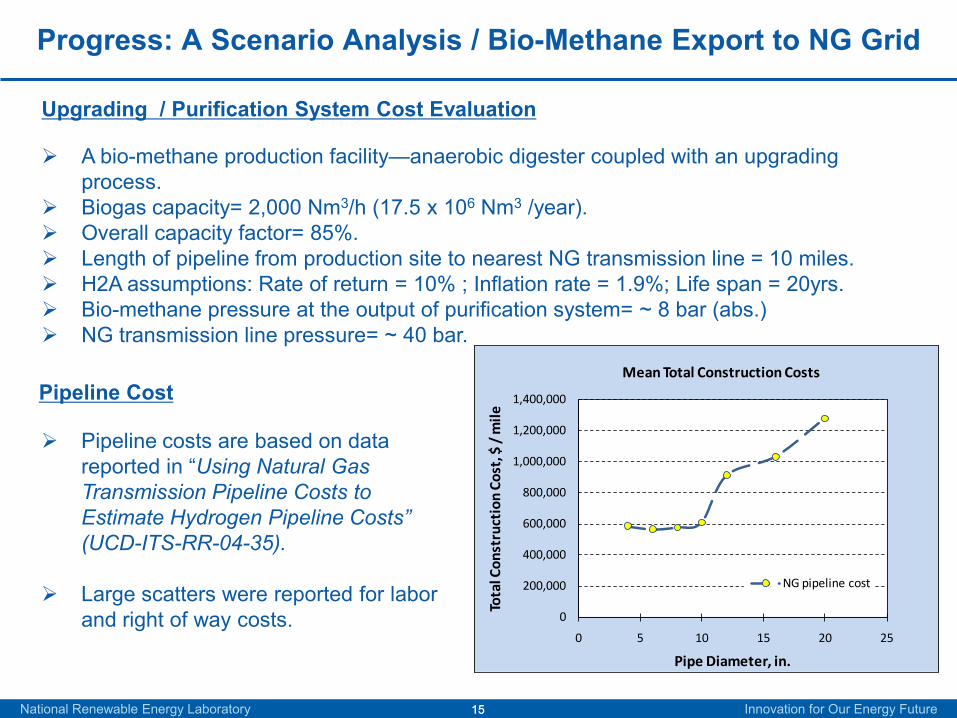
Pipeline costs are based on data reported in “Using Natural Gas Transmission Pipeline Costs to Estimate Hydrogen Pipeline Costs” (UCD-ITS-RR-04-35).
Large scatters were reported for labor and right of way costs.
Upgrading / Purification System Cost Evaluation
A bio-methane production facility—anaerobic digester coupled with an upgrading process.
Biogas capacity= 2,000 Nm3/h (17.5 x 10⁶ Nm3 /year). Overall capacity factor= 85%. Length of pipeline from production site to nearest NG transmission line = 10 miles. H2A assumptions: Rate of return = 10% ; Inflation rate = 1.9%; Life span = 20yrs. Bio-methane pressure at the output of purification system= ~ 8 bar (abs.) NG transmission line pressure= ~ 40 bar.
Pipeline Cost
Progress: A Scenario Analysis / Bio-Methane Export to NG Grid

1616National Renewable Energy Laboratory Innovation for Our Energy Future
Cost Items Cost Relative Capital Cost
Bio-methaneCost, $/GJ
Biogas Feedstock 3 – 11 $/GJ of CH4 ------- 5.0
Upgrading System $4.0 M 40% 3.5
Pipeline—10 miles $5.8 M 58% -------
Compression $0.2 M 2% -------
Pipeline + Compression ------- ------- 4.6
Balance of Plant ------- ------- N/A
Total: ------- ------- ~ 13 $/GJNotes: 1) The new cost-analysis model (H2A) was used in the scenario analysis.2) Storage for 2-day worth bio-methane production will increase the cost by about $2/GJ—
based on estimates from “Bio-methane from Dairy Waste,” Krich et al, July 2005.
Cost of biogas can play a critical role in the economics of bio-methane. If permissible, injection of bio-methane into a distribution pipeline can reduce the
transport cost (due to likely shorter pipeline and lower pressure). Incentives and policies, such as SGIP, RPS and SB1505 can render renewable
biogas economically more attractive.
Progress: Bio-Methane Export to NG Grid (cont.)
1717
Collaboration
As a strategy to acquire realistic data and to generate results that are beneficial to the stakeholders, efforts in communicating with equipment vendors, manufacturers, and municipalities are ongoing.
Held a panel discussion, “Renewable Biogas: A Commercialization Opportunity for Fuel Cells,” at the 2009 Fuel Cell Seminar and Exposition. The event aimed to get feedbacks from the stakeholders on the objectives and facets of this project and to facilitate data collection for the analysis.
A workshop for dissemination of the results and feedbacks from the industry and stakeholders may also be arranged prior to the conclusion of the current project.
National Renewable Energy Laboratory Innovation for Our Energy Future

18
This project intends to develop a vetted cost-analysis tool based on the H2A Production model, collect GIS / cost data, and perform techno-economic analyses of upgrading biogas and utilizing the resulting bio-methane.
To facilitate realistic analyses and improve the usefulness of the results, inputs from industry and stakeholders are sought. The objectives and approach of this project lend themselves to overcoming the identified barriers (4.5.B, 4.5.C, and 4.5.D).
The preliminary analysis indicates that, by taking advantage of economy of scale, bio-methane production via purification of biogas from dairy farms can be cost-effective .
Focusing on large dairy farms and/or clustered farms to facilitate use of a central AD/upgrading system is a key for realizing economy of scale, albeit it can be challenging.
Landfills can offer a greater potential due to the potentially lower cost of biogas, favorable economy of scale, and significance in emissions control. However, constant supply of biogas from landfills may not be sustainable.
The economics of producing and exporting bio-methane to natural gas grid is subject to variations in the costs of biogas and transport of bio-methane.
Summary / Conclusions
National Renewable Energy Laboratory Innovation for Our Energy Future
1919
Future Work
National Renewable Energy Laboratory Innovation for Our Energy Future
Continue collection and validation of GIS and cost data.
Perform additional techno-economic analyses to encompass on-site utilization of bio-methane in conjunction with fuel cell technologies.
Planned Work:
Purging / sequestration of the waste stream(s) with high concentrations of impurities should also be addressed from the economic and environmental standpoints.
An in-depth evaluation of the correlation between the cost of the biogas upgrading system and the purification requirements is recommended. The currently available cost data do not readily lend themselves to formulating such relationship.
Recommended Work: