biogas upgrading - heim | skemman project...biogas upgrading using amine absorption jónas Þór...
TRANSCRIPT

Biogas Upgrading
Using amine absorption
Jónas Þór Þórisson
Final thesis for B.Sc. degree in
Energy- and Environmental Engineering
Faculty of Electrical and Computer Engineering
School of Engineering and Natural Sciences
University of Iceland


Biogas upgrading Using amine absorption
Jónas Þór Þórisson
24 ECTS thesis submitted in partial fulfillment of a Baccalaureus Scientiarum degree in Energy- and Environmental Engineering
Advisors
Egill Þórir Einarsson Krista Hannesdóttir
Nicolas Marino Proietti
Final thesis for B.Sc. degree in Environmental- and Energy Engineering Faculty of Electrical and Computer Engineering
School of Engineering and Natural Sciences University of Iceland
Reykjanesbær, May 2015

Biogas upgrading 24 ECTU thesis submitted in partial fulfillment of a Baccalaureus Scientiarum degree in Energy- and Environmental Engineering Copyright © 2015 Jónas Þór Þórisson All rights reserved Final thesis for B.Sc. degree in Environmental- and Energy Engineering Faculty of Electrical and Computer Engineering School of Engineering and Natural Sciences University of Iceland Grænásbraut 910 235 Reykjanesbær Phone number: 578 4000 Bibliographic information: Jónas Þór Þórisson, 2015, Biogas Upgrading, B.Sc. thesis, Faculty of Electrical and Computer Engineering, University of Iceland, 91 bls. Prentun: Háskólaprent ehf., Fálkagata 2, 107 Reykjavík Reykjavík, Iceland, may 2015

Útdráttur
Hreinsun á lífgasi er nauðsynlegt skref til að auðga lífgas í metan. Þetta ferli eykur
orkuinnihald gassins miðað við rúmmál. Metanið er svo notað annaðhvort sem eldsneyti á
bifvélar eða dælt í gas kerfi.
Markmið þessarar skýrslu er að hanna einfalda hreinsunarstöð sem tekur einnig lítið pláss
með notkun á monoethanolamine (MEA). Þessu kerfi er svo ætlað að þjóna sem hagkvæmur
kostur fyrir minni metanframleiðslur á Íslandi, líkt og bóndabýli eða lítil samfélög. Mikilvæg
atriði í hönnuninni eru að hún sé lítil um sig, er einföld og hagkvæm.
Í þessari skýrslu mun koma fram hönnun á hreinsunarsúlu fyrir kerfið. Hönnunin verður svo
staðfest með því að byggja frumútgáfu af kerfinu og það svo prófað á ruslahaugunum hjá
Sorpu í Álfsnesi. Öll gögn við tilraunina verða skráð svo hægt sé að áætla færni kerfissins
við að hreinsa metan og meta hvort breytinga á hönnuninni sé þörf.
Abstract
Upgrading of biogas is a necessary step to upgrade biogas to bio methane. This procedure
increases the energy content of the gas per volume. Bio methane is then used as vehicle fuel
or injected into a gas grid in other countries.
The main goal of this report is to design a simple and compact upgrading unit using
monoethanolamine (MEA). This unit is then intended as a cost effective solution to methane
production for smaller methane producers in Iceland, such as farms and smaller
communities. Important aspects are, simplicity, size and cost.
This report will describe the design of an absorption column. The design will be validated
by building a prototype and then tested in the methane production facility at Sorpa in Álfsnes.
All test data will be documented to estimate the efficiency of the equipment and to account
for necessary adjustments.


v
Dedication
To my wife Valgerður Lindberg and my sons,
For their unquestioned understanding, patience and support.

vii
Table of Contents
Figures ................................................................................................................................. ix
Tables ................................................................................................................................... xi
Acknowledgements ........................................................................................................... xiii
1 Introduction ..................................................................................................................... 1 1.1 The problem ............................................................................................................ 1
2 Background ..................................................................................................................... 3 2.1 Biogas production.................................................................................................... 3 2.2 Current status in Iceland .......................................................................................... 4
2.3 Prospects for Icelandic methane production ........................................................... 4
3 Biogas cleaning ................................................................................................................ 5 3.1 Water ....................................................................................................................... 5
3.2 Hydrogen sulphide .................................................................................................. 5
4 Upgrading technologies .................................................................................................. 7 4.1 Pressure Swing Absorption ..................................................................................... 7
4.2 Absorption ............................................................................................................... 7 4.2.1 Water scrubbing ............................................................................................. 7 4.2.2 Amine scrubbing ............................................................................................ 7
4.2.3 Organic physical scrubbing............................................................................ 8 4.3 Membranes .............................................................................................................. 9
4.4 Cryogenic ................................................................................................................ 9 4.5 Summary ................................................................................................................. 9
4.6 Upgrading for small scale project ......................................................................... 11
5 Design of an upgrading system. ................................................................................... 13 5.1 Design parameters ................................................................................................. 13 5.2 Schematic diagram ................................................................................................ 14 5.3 Flow rate ................................................................................................................ 15 5.4 Packing material .................................................................................................... 16
5.5 Column diameter ................................................................................................... 18 5.6 Column height ....................................................................................................... 20 5.7 Thermodynamics ................................................................................................... 21 5.8 Pumps .................................................................................................................... 23
5.9 Design conclusions ................................................................................................ 25
6 Full size absorption test ................................................................................................ 27 6.1 Test column design. ............................................................................................... 28
6.1.1 Build of test equipment. ............................................................................... 28 6.1.2 Frame. .......................................................................................................... 28 6.1.3 Fasteners. ..................................................................................................... 29 6.1.4 Test column .................................................................................................. 30 6.1.5 Sieve ............................................................................................................. 30 6.1.6 Pumps ........................................................................................................... 31

viii
6.1.7 Control ......................................................................................................... 31
6.2 Test equipment ....................................................................................................... 31 6.3 Test procedures ...................................................................................................... 32
7 Test Results .................................................................................................................... 33 7.1 Test one .................................................................................................................. 33 7.2 Second Test ............................................................................................................ 34
8 Test Analysis .................................................................................................................. 37 8.1 Test 1 ...................................................................................................................... 37 8.2 Test 2 ...................................................................................................................... 37
9 Discussions ...................................................................................................................... 39
10 Conclusions .................................................................................................................... 41
References ........................................................................................................................... 43
Appendix A – Data sheet for pump .................................................................................. 47
Appendix B – Data for hoses ............................................................................................. 49
Appendix C Part list for test equipment .......................................................................... 51
Appendix D – Work diagram 1 ......................................................................................... 53
Appendix E – Work diagram 2 ......................................................................................... 55
Appendix F – Work diagram 3 ......................................................................................... 57
Appendix G – Work diagram 4 ......................................................................................... 59
Appendix H – Work diagram 5 ......................................................................................... 61
Appendix E – Calculations of column diameter .............................................................. 63
Appendix J – Raw data from test 2 .................................................................................. 65
Appendix K – Raw data from test 1 ................................................................................. 67
Appendix L – Original work schedule.............................................................................. 69
Appendix M – Refined Work Schedule ............................................................................ 71
Appendix N – Calculations from previous version ......................................................... 73
Appendix O - Calculations for temperature calculations ............................................... 75

ix
Figures
Figure 2-1 - Simple illustration of methane process.............................................................. 3
Figure 4-1 - Simple process diagram of amine scrubbing process. ....................................... 8
Figure 4-2 - Explanation of membrane workings [38] .......................................................... 9
Figure 5-1 – Schematic diagram of an amine upgrading system. ....................................... 14
Figure 5-2 - CO2 removal efficiency (ηCO2) as function of Qr [14] .................................... 15
Figure 5-3 - Sample of different types of packing material [37]. ........................................ 16
Figure 5-4 - Pressure-drop, Coulson's & Richardson's chemical engineering [22] ............. 18
Figure 5-5 - Heat of absorption for 30% MEA [28] ............................................................ 21
Figure 5-6 - Absorption column with heat estimates. ......................................................... 22
Figure 5-7 - Inner workings of peristaltic pump [36] .......................................................... 24
Figure 5-8 – Verderflex Dura 25 peristaltic pump [39] ...................................................... 24
Figure 6-1 - Diagram of test system .................................................................................... 28
Figure 6-2 - Diagram of frame ............................................................................................ 29
Figure 6-3 - Clamping for columns ..................................................................................... 29
Figure 6-4 - Endcap of test column with fittings ................................................................. 30
Figure 6-5 - Sieve for holding packing material.................................................................. 30
Figure 6-6 - Flow chart for the control of the test system ................................................... 31
Figure 6-7 - Photo from test site of equipment .................................................................... 32
Figure 7-1 - Graph of gas measurements taken from gas analyzer from test 1. .................. 33
Figure 7-2 - Graph of H2S absorbance in relations to amine pH during test 1. .................. 34
Figure 7-3 - Graph of CH4 and CO2 concentration in and out with amine pH.. .................. 35
Figure 7-4 - N2+CH4 concentration in and out of the system in relations to amine pH. ..... 35
Figure 7-5 - H2S concentration in and out of the system in relations to amine pH. ........... 36
Figure 7-6 - CO2 absorbance efficiency in relations to amine pH. ..................................... 36

x

xi
Tables
Table 2-1 - Composition of different gases. .......................................................................... 4
Table 3-1 - Data from the Swedish standard for CH4 upgrading [5] ..................................... 5
Table 4-1 - Comparison of different upgrading techniques from [3] .................................. 10
Table 5-1 - Sample of suppliers for PE pall ring packing material. .................................... 17
Table 5-2 - Table of variables for diameter calculations, see appendix i. ........................... 20
Table 5-3 - Parameters for pump ......................................................................................... 23
Table 6-1 - List of design parameters. ................................................................................. 27


xiii
Acknowledgements
This project would never have gone far without the help and funding from my instructor
Nicolas Marino Proietti at ReSource international.
I would also like to take this opportunity and give my sincere regards to the two other
instructors involved in this project, Egill Þórir Einarsson and Krista Hannesdóttir, for their
unmatched dedication and support to their students.
And last but not least, I want to thank my wife for her patience with me through this whole
process.


1
1 Introduction
Energy usage has been growing steadily since 1971 according to the International Energy
Agency [1]. This growing demand for energy as well as the possible imminent oil depletion
is a cause to start developing more suitable and preferably reusable energy sources. One of
the sources that has not been fully utilized is bio-, landfill and sewage gas. This energy has
been harvested in some extent all over the globe and can be a cheap and sustainable energy
source. For example, biogas production has been used for a long time in rural communities
and farms, especially in India and China. The first methane (CH4) reactor was built in the
1890s by an English man named Cameron [2].
All these gases have the potential to be upgraded to bio methane. Biogas upgrading is a
process where a mixture of gases are filtered, using various methods described in this text,
to the point when a desired concentration of one or more gases have been achieved.
Specifically biogas is usually upgraded for its CH4 content and either used as vehicle fuel or
injected into a gas grid.
Although biogas has become common in many countries it has not been fully utilized in
Iceland. Even though these gases are generated naturally in various landfills, manure pits
and where natural waste lies undisturbed under oxygen deprived circumstances. It should be
beneficial to try to harvest as much of this energy source as possible, and not to mention the
negative effect that CH4 has as a greenhouse gas.
1.1 The problem
Iceland is a bit unique when it comes to utilization of biogas. Farms are generally small in
size compared to farms in larger countries. This makes it proportionally costly to construct
a CH4 reactor and upgrading equipment for an individual farm. This paper will be focused
on addressing this problem by looking at decreased size and complexity and is thus likely to
reduce cost in investment and operation.
A pilot scale upgrading plant that could serve as an inexpensive solution to the upgrading
process of biogas is proposed. The design will focus on upgrading biogas utilizing amine
absorption with monoethanolamine (MEA). It is less costly than many other methods,
requires no sophisticated control instruments to run and returns CO2 for further use if needed
[3].
Absorption of biogas with MEA is a two stage process. The first stage is the actual CO2
absorption with MEA and the second where CO2 is stripped from the liquid. This paper will
focus on the absorption process.


3
2 Background
Upgrading biogas to bio- methane has become a widely known technique. Methane gas is
upgraded from landfill, sewage, and natural or bio gas [4] [5]. Methane reactors operate by
turning natural waste, often livestock excrements to bio methane. Today many methane
reactors are operational. The gas created by these reactors is then upgraded using a variety
of techniques. So far, most methane upgrading plants are in Sweden and Germany but other
mentionable countries include Switzerland, USA and the Netherlands amongst others [5].
The upgraded gas is then utilized either as vehicle fuel or more commonly for gas grid
systems in various countries.
2.1 Biogas production
Biogas is produced naturally with the breakdown of biological material such as vegetation,
animal remains or excrement. This is due to a symbiotic relationship between bacteria under
oxygen deprived circumstances. All the bacteria in the process serve a specific purpose and
thrive in accordance to that. The main stages in the process are called hydrolysis,
acidogenesis and methanogenesis, the basic process is illustrated in figure 2-1 [4].
Figure 2-1 - Simple illustration of methane process
The first stage, hydrolysis, is the result of a facultative bacteria. These bacteria can use
oxygen in their digestion process but can also turn to alternative methods if there is no
oxygen present [4]. They start the process by using oxygen from the tank and in the slurry
to break down complex molecules. When all free oxygen is depleted in the system they revert
to oxygen in the water to continue their breakdown. Thus the name hydrolysis [4].
Second stage of the process, or as mentioned by David Fulford [4] in his works the second
half of the first stage, is acydogenesis. In this stage the bacteria in the slurry start forming
volatile acids such as acetic acid. If in this part of the process any air gets to the slurry, the
process can go no further and no CH4 gets produced [4].
The third and last stage of the process, is methanogenesis. This process is where methanogen
bacteria start breaking down the fatty acids into smaller molecules, mainly H2O, CO2 and
CH4 [4].
This natural process is used for our benefits today in methane reactors, sewage plants and
landfills. The biogas produced by these plants vary a little with the feed used but all have in
common a high CH4 content as seen in table 2-1.

4
Table 2-1 - Composition of different gases.
Unit Landfill Biogas Sewage Plant Natural Gas Source
Methane (CH4) % 35-65 60-70 - 89 [5]
47-57 55-58 57-65 - [6]
Carbon Dioxide (CO2) % 30-40 30-40 - 0,67 [5]
37-41 37-38 33-39 - [6]
Hydrogen Sulphide (H2S) ppm 0-100 0-4000 - 2,9 [5]
36-115 35-169 <24-62 - [6]
Ammonia ppm ca. 5 ca. 100 - 0 [5]
- - 1 - [6]
Nitrogen (N2) % ca. 0.2 5-40 1 0,28 [5]
<1-17 <1-2 <8-13 - [6]
Oxigen % 0-5 0 - 0 [5]
<1 <1 <1 1 [6]
2.2 Current status in Iceland
Currently there are only records of two places in Iceland that produce methane [7] [8]. The
only publicly available source is from SORPA. They produce their gas from landfills on
Álfsnes in Reykjavík and is upgraded using water scrubbing. In the year 2012 the production
reached two million Nm3 which according to Sorpa is around 60% of their current capacity
[7].
The second methane producer currently known in Iceland is at the farm Hraungerði [8].
2.3 Prospects for Icelandic methane production
At the moment the biogas production in Iceland can be considered at a minimum. As stated
in the previous section there is only one known farm that produces biogas, which means that
all over the country there are potentially unused resources for methane production. Other
sources that could be promising are landfills in various communities that hold some
prospects. Sewage treatment in Iceland does not utilize any methane production to the
writer’s knowledge and animal excrements are mostly used straight as fertilizer. All this has
a potential to produce CH4 gas.

5
3 Biogas cleaning
In order to utilize biogas as vehicle fuel or for injection into a gas power grid it has to meet
standards set in each country or region. These standards vary between countries. No
legislation is active in Iceland for quality of biogas, likely because methane usage is just in
its early stages. If and when any legislations are implemented in Iceland they are likely to be
similar to the Swedish standards, the highlights of the Swedish standard can be seen in see
table 3-1.
According to the Swedish standard the CH4 content needs to be no less than 95%. Too reach
this purity the raw biogas needs to be cleaned of contaminants such as particles, hydrogen
sulphide (H2S), water (H2O) and carbon dioxide (CO2). Other contaminants can include
ammonia, nitrogen and oxygen, although nitrogen is more common in landfill gases from
oxygen that seeps in to the system through the soil [5].
The biggest reasons for upgrading biogas is to increase its energy content and to protect
machinery from corrosion. Untreated H2S can cause significant corrosion in the upgrading
machinery as well as any vehicle it is intended for [5].
3.1 Water
During the digestion process the biogas becomes saturated with water vapors. These water
vapors can condensate inside different parts of the upgrading system causing corrosion on
metal surfaces. Water is easily removed from the gas. Methods for doing so are mainly
pressure, cooling and absorption. By increasing the pressure of the biogas the dew point of
the water vapors is lowered causing the water to condensate and fall, making it easy to
remove. Lowering the temperature also causes the water vapors to condensate. The
absorption technique works by making the biogas run through a chemical such as SiO2 or
activated carbon. The water is absorbed by these chemicals and the chemicals can then be
renewed by heating [5].
3.2 Hydrogen sulphide
Although H2S composition in biogas is usually very low it can cause problems in various
stages in both the upgrading system and in any engine or system it is intended for. When
H2S contacts water sulfuric acid is generated causing corrosion. There are countless ways to
remove hydrogen sulphide from gas stream. The simplest one is probably adsorption on
activated carbon, but others include precipitation and chemical absorption. Precipitation is
Table 3-1 - Data from the Swedish standard for CH4 upgrading [5]
1 Ambient temperature

6
accomplished by adding Fe ions into the digester slurry creating insoluble iron sulfate that
is flushed with the digester slurry [5].
7
4 Upgrading technologies
There are a few different upgrading methods available for CH4 production. Many of them
work on the unique properties CH4 has. Solubility of CH4 is comparatively low and it
remains in gaseous form under high pressure. The boiling point for CH4 is -161.5°C
compared to -57°C for CO2 and solubility is only 0.022 g/L at 25°C compared to carbon
dioxide with 1.501 g/L solubility in water at 25°C [9]. This makes absorption ideal for
removing many unwanted gases from the biogas stream.
4.1 Pressure Swing Absorption
In Pressure swing absorption (PSA) the ability CH4 has to stay in liquid state under pressure
is utilized. The gas stream is fed through a series of columns containing absorbing material
such as activated carbon. The number of columns vary between systems. Each column is
subjected to high pressure causing carbon dioxide to be absorbed. When each column has
been saturated with carbon dioxide the system switches to the next column while the
saturated column is de-saturated. In the de-saturation process the pressure is dropped in
stages. In the first stage the gasified carbon dioxide is fed back into the biogas stream in
order to reduce CH4 loss. Later stages the CO2 is usually let into the atmosphere depending
on CH4 content [10].
4.2 Absorption
There are at least three different types of absorption techniques available. All of them work
on the principle that CH4 is quite insoluble in water as described above. They all use a liquid
medium as an absorbing agent. The choice depends on the size of the system and availability
of water and energy.
4.2.1 Water scrubbing
Water scrubbing is widely used method for upgrading biogas. This method is based on the
significant difference in solubility of CH4 and CO2 in water. Gas flow is fed through the
bottom of an absorption column and a counter flow of pressurized water is fed through the
top. The column is filled with packing material like stainless ratchet rings or plastic filling
material. Under pressure the carbon dioxide will dissolve into the water stream and highly
concentrated CH4 will carry on to the top of the column where it is removed. The saturated
water is then carried on to a flash tank where the pressure is dropped and carbon dioxide is
removed from the water [5]. The used water can be recycled to some extent but according to
Nicolas Proietti [11], a former specialist at Sorpa, reuse of water has been troublesome.
4.2.2 Amine scrubbing
Amine scrubbing works like water scrubbing except for the addition of amine solution in the
water. Carbon dioxide reacts with the amine which increases the solubility compared to
water [5]. The most frequently used amines are mono-ethanolamine (MEA) and di-
ethanolamine (DEA), and the former is the subject of this paper. Other amines have also

8
been tried such as methyl-di-ethanolamine (MDEA), tri-ethanolamine (TEA) and mixtures
of these and various amines [12] [13].
Biogas is fed into the bottom of the absorption column and a counter current of amine liquid
is fed into the column at the top, see figure 4-1.
After the liquid has reached the bottom of the column it has become saturated with CO2 and
needs to be replaced or regenerated. Regeneration occurs in a separate column, referred to
as the stripping column. The stripping column is similar to the absorption column and is
filled with packing material, often stainless steel ratchet rings due to heat. There the amine
liquid is fed to the top of the column through a spray nozzle, steam is generated at the bottom.
As the steam heats up the amine it carries with it CO2 and exits at the top of the column. The
steam is then cooled down in a flash tank where the CO2 separates from the steam and is fed
out of the system. Water from the steam can then be reused [5].
With chemical scrubbing CH4 purity of up to 99% can be reached with low CH4 slip and the
system is simple in operation. The main drawbacks are that the initial investment costs can
be substantial and chemicals that are used can be hazardous to personnel and environment
[3].
4.2.3 Organic physical scrubbing
Organic physical scrubbing works just like water and amine scrubbing, only difference is
the absorbance agent used. Commonly polyethylene glycol solution is used as absorbing
agent. The major benefits of this method over regular water scrubbing is that less liquid flow
is needed since CO2 and H2S is more soluble in polyethylene glycol than in water [10]. This
also reduces the required size of the system. Same method is then used for regeneration as
in amine scrubbing, the absorbing agent is heated to release the CO2 [1].
Figure 4-1 - Simple process diagram of amine scrubbing process.
9
4.3 Membranes
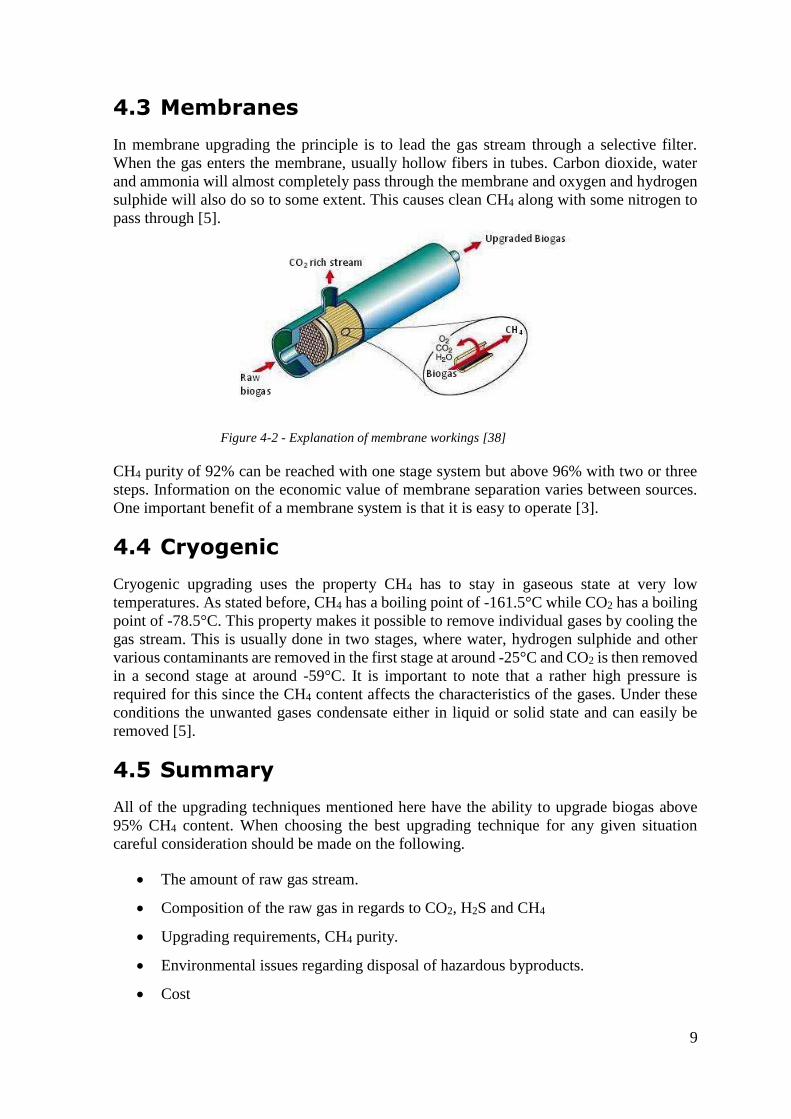
In membrane upgrading the principle is to lead the gas stream through a selective filter.
When the gas enters the membrane, usually hollow fibers in tubes. Carbon dioxide, water
and ammonia will almost completely pass through the membrane and oxygen and hydrogen
sulphide will also do so to some extent. This causes clean CH4 along with some nitrogen to
pass through [5].
CH4 purity of 92% can be reached with one stage system but above 96% with two or three
steps. Information on the economic value of membrane separation varies between sources.
One important benefit of a membrane system is that it is easy to operate [3].
4.4 Cryogenic
Cryogenic upgrading uses the property CH4 has to stay in gaseous state at very low
temperatures. As stated before, CH4 has a boiling point of -161.5°C while CO2 has a boiling
point of -78.5°C. This property makes it possible to remove individual gases by cooling the
gas stream. This is usually done in two stages, where water, hydrogen sulphide and other
various contaminants are removed in the first stage at around -25°C and CO2 is then removed
in a second stage at around -59°C. It is important to note that a rather high pressure is
required for this since the CH4 content affects the characteristics of the gases. Under these
conditions the unwanted gases condensate either in liquid or solid state and can easily be
removed [5].
4.5 Summary
All of the upgrading techniques mentioned here have the ability to upgrade biogas above
95% CH4 content. When choosing the best upgrading technique for any given situation
careful consideration should be made on the following.
The amount of raw gas stream.
Composition of the raw gas in regards to CO2, H2S and CH4
Upgrading requirements, CH4 purity.
Environmental issues regarding disposal of hazardous byproducts.
Cost
Figure 4-2 - Explanation of membrane workings [38]

10
In table 4-1, extracted from the works of E. Ryckebosch [3], a clear comparison is made on
the different techniques.
Table 4-1 - Comparison of different upgrading techniques from [3]

11
4.6 Upgrading for small scale project
Chemical absorption was selected as the subject of this study. This decision was taken on
basis of the following: a) the high purity of CH4 that is expected, b) regenerative process and
c) low operational cost of the system seen in table 4-1. Other benefits of this type of system
are that the system operates under no significant pressure and only a simple process control
is required. Dissadvantages of this system are, as listed in table 4-1, mainly corrosion caused
by the amines and the amount of heat required to strip the amines of CO2 [3].


13
5 Design of an upgrading system.
In the design of an absorption column for biogas scrubbing several factors have to be
considered.
1. Diameter
The columns have to be able to handle raw gas stream and the concentration of
contaminants. The diameter of the column has to be wide enough to prevent flooding but
at the same time as small as possible to limit the amount of liquid necessary to wet all
the packing material for scrubbing.
2. Height
Height of the column depends on the necessary contact time between the gas and liquid
for optimal removal of CO2 and H2S.
3. Packing material
Packing material increases the surface area and thus increases contact time between the
gas and the liquid.
4. Flow rate
The liquid flow rate controls the maximum removal of CO2. It is a function of the raw
gas flow rate and the CO2 concentration.
5.1 Design parameters
The system has some predefined parameters. It should be capable of scrubbing raw gas flow
between 10 Nm3/hour and 25 Nm3/hour, the expected production from smaller CH4 reactors
of farms and small communities. The whole column should fit inside a 20 foot container
except for the top. The CH4 purity should be at least vehicle standard, >95% or in accordance
to the Swedish standard. Building material should be selected with attention to cost. It is
positive if the system can be run by personnel with minimal training such as farmers.
Maintenance is expected to be done by more experienced technicians. Future upgrades might
include usage of waste CO2.
14
5.2 Schematic diagram
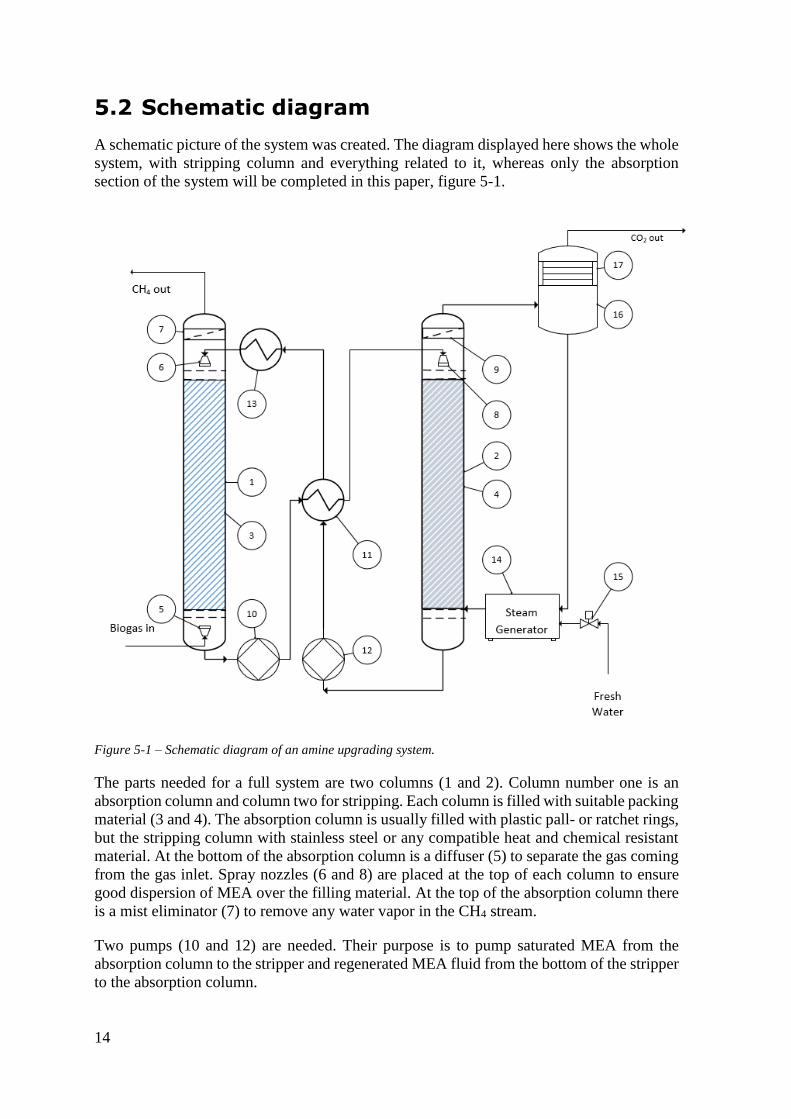
A schematic picture of the system was created. The diagram displayed here shows the whole
system, with stripping column and everything related to it, whereas only the absorption
section of the system will be completed in this paper, figure 5-1.
Figure 5-1 – Schematic diagram of an amine upgrading system.
The parts needed for a full system are two columns (1 and 2). Column number one is an
absorption column and column two for stripping. Each column is filled with suitable packing
material (3 and 4). The absorption column is usually filled with plastic pall- or ratchet rings,
but the stripping column with stainless steel or any compatible heat and chemical resistant
material. At the bottom of the absorption column is a diffuser (5) to separate the gas coming
from the gas inlet. Spray nozzles (6 and 8) are placed at the top of each column to ensure
good dispersion of MEA over the filling material. At the top of the absorption column there
is a mist eliminator (7) to remove any water vapor in the CH4 stream.
Two pumps (10 and 12) are needed. Their purpose is to pump saturated MEA from the
absorption column to the stripper and regenerated MEA fluid from the bottom of the stripper
to the absorption column.

15
It is important to maintain correct temperatur flow in the MEA liquid throughout the process.
Therefore a heat exchanger (11) is placed between the columns. The use of a heat exchanger
reduces energy requirement in the system by using the colder saturated MEA from the
absorption column to remove heat from the hot MEA leaving the stripper.
In order to ensure good absorption the MEA needs to be cooled after the stripper. In order
to do this a cooler (13) is placed before the MEA enters the absorption column.
To strip the MEA solution of CO2 a steam generator is needed (14). The inlet of the steam
is placed at the bottom at the stripping column. Into the steam generator a solenoid valve
(15) supplies the steam generator with additional water when needed.
At the outlet of the stripping column a flash tank (16) is placed in order to separate the CO2
from the steam. In the flash tank is also a condenser to both dry out the CO2 and reuse the
water from the steam.
5.3 Flow rate
In the work of J. I. Huertas it is described that the flow rate can be determined by the liquid
to gas flow ratio (Qr) [14]. According to his findings optimal Qr ratio for this project is
between 200-220, for 35% MEA with <95% CO2 removal efficiency as seen in figure 5-2
[14].
According to Huertas the flow ratio for the system can be found with equation 5-1:
𝑄𝑟 =𝑌𝑔
𝑋𝑙
Equation 5-1 - For calculating Qr in terms of gas in to liquid in.
Where,
Yg is the raw gas stream (L/min)
Xl is the liquid stream (L/min)
Figure 5-2 - CO2 removal efficiency (ηCO2) as function of Qr [14]

16
For the system in this paper, with 25 Nm3/hour raw gas stream and a Qr ratio of 230, liquid
flow rate is 2.0 L/min.
5.4 Packing material
Choosing the right packing material is one of the key thing that to the absorption capabilities
of the system. The function of the packing material is to provide surface area inside the
column. Increased surface area also increases the time gases inside the column are in contact
with the liquid. On the down side, if the surface area of the packing material is too much it
will also increase pressure drop along the column and thus increasing risk of flooding.
Material for the packing material is dependent on the liquids inside the column, or if it needs
to be chemical-, heat- or corrosion resistant. There is a large variety of packing material
available on the market. In figure 5-3 there is a sample of different types of material.
Common materials are polyethylene plastic, ceramics and stainless steel. All packing
material have different properties. These properties are unique and are specified in datasheets
provided from the manufacturer. The choice of shape is dependent on the designer’s
experience [15].
For this project PE plastic Pall Rings were chosen. This decision is based on the experience
from Sorpa municipal waste company (Nicolas Marino Proietti, personal communication)
already has with this kind of filling material for their upgrading facility. According to various
sources PE plastic is a suitable choice for any material that comes in contact with MEA [16]
[17]. The advised column diameter to packing size ratio is 10 [15]. This ratio needs to be
validated after column diameter has been determined but smallest size available will be
expected in regards to the size of the design.
Figure 5-3 - Sample of different types of packing material [37].

17
There are many suppliers to choose from. In table 5-1 below, is a comparison between few
suppliers of packing material. The choice has to be in regards to price, although with the
table in mind Vereinigte’s pall rings look promising for their big surface area and big void,
and their web site supplies all necessary documentation [18].
Table 5-1 - Sample of suppliers for PE pall ring packing material.
ITEM size
Package
Density
(kg/m3)
Surface
Area
m2/m3
Voidance
(%)
Packing
Factor Supplier
16mm 344.2 93.1 275 [19]
16×16×1 mm 85 188 0.91 275 [20]
25 mm 90 220 90 - [21]
15mm 80 350 91 - [18]

18
5.5 Column diameter
A method for finding the pressure drop in a column can be used to find the diameter in
regards to predetermined pressure drop, using a generalized pressure drop-graph, Figure 5-4,
and solving for FLV and choosing an appropriate K4, both are dimensionless [22]. The
recommended pressure drop for absoption column is found to be 15 to 50 (mm
water/meter of packed column height) [22]. K4 is a number descriping column and packing
material properties and liquid and vapor flow rates.
Figure 5-4 - Pressure-drop, Coulson's & Richardson's chemical engineering [22]

19
FLV can be found using equation 5-2 [22]:
𝐹𝐿𝑉 =𝐿ẇ
𝑉ẇ∗ √
𝜌𝑉
𝜌𝐿
Equation 5-2 - Equation for vapor and liquid mass flow ratios
Where:
FLV is the liquid to vapor mas flow ratio (unit less)
Lẇ is the liquid mass flow (kg/s)
Vẇ is the vapor mass flow (kg/s)
ρv and ρL is the liquid and vapor densities (kg/m3)
For this project the FLV ratio was found to be 0.39. List of variables are listed in table 5-2.
Further calculations can be seen in appendix i.
By selecting an apropriate pressure drop for the project in this paper and thus determining
K4 the diameter of the column can be found by isolating Vw from equation 5-3 [22]:
𝐾4 =13.1(𝑉𝑤
∗)2𝐹𝑝(𝜇𝐿
𝜌𝐿)0.1
𝜌𝑣(𝜌𝐿 − 𝜌𝑣 )=> 𝑉𝑤 = √
𝐾4 ∗ 𝜌𝑣(𝜌𝑙 − 𝜌𝑣)
13.1 ∗ 𝐹𝑝 ∗ (𝜇𝜌𝑙
)0.1
Equation 5-3 - Equation for finding K4 for pressure drop plot and isolation of Vw
Where:
K4 is a variable for equipment properties, packing properties and liquid and vapor flow rates
(unit less):
Vẇ is gas mass flow rate over the cross section of the column [kg/m2s]
Fp is the packing material factor, see table 5-1.
μL is the liquid viscosity [Ns/m2]
ρL and ρv are the liquid and vapor densities [Kg/m2]
For this project the selected K4 factor was 1. This gives a pressure drop of approximately 30
(mm water /meter packed column) which is acceptable for this type of project [22].
20
And since Vẇ is the gas mass flow over area then equation 4, detailed calculations can be
seen in appendix i:
𝑉ẇ =𝑉𝑤
𝐴=> 𝐴 =
𝑉𝑤
𝑉ẇ=> 𝑑 = √
4
𝜋∗ 𝐴
Equation 4 - For finding diameter from Vw.
Where:
VW is the gas flow (kg/s)
Vẇ is the gas flow rate over a cross sectional area (kg/m2s)
A is the area of the column (m2)
d is the diameter of the column (mm)
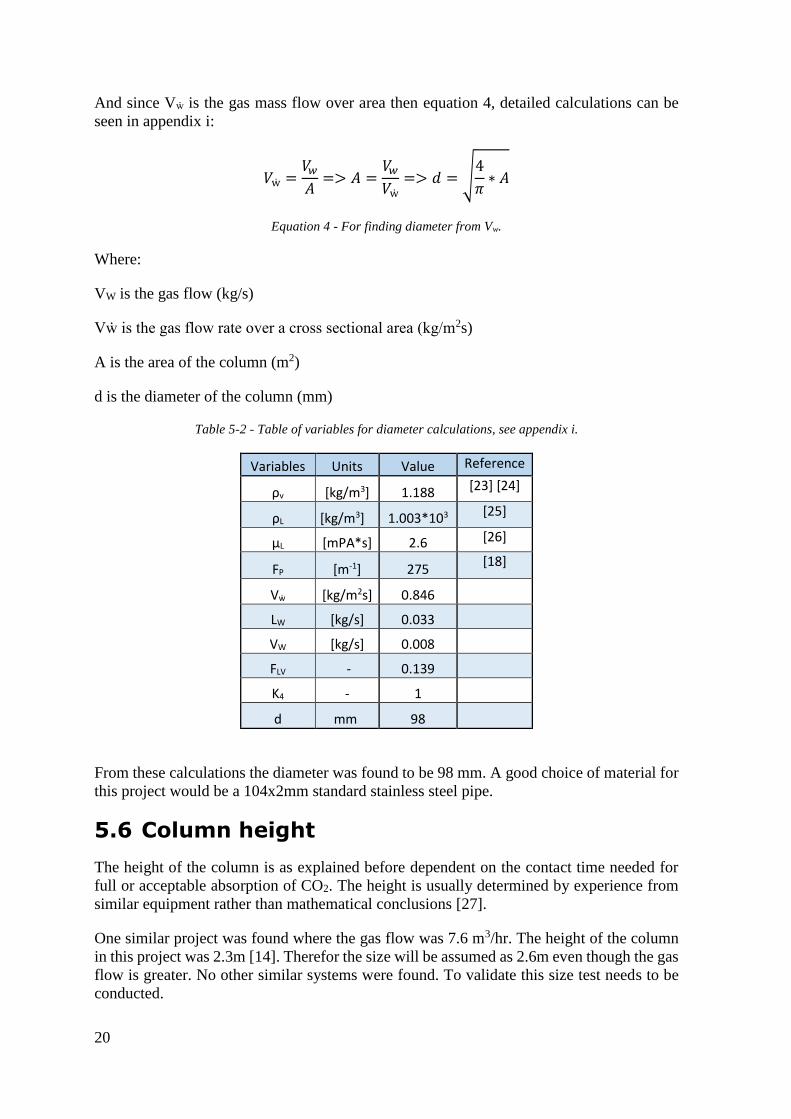
Table 5-2 - Table of variables for diameter calculations, see appendix i.
Variables Units Value Reference
ρv [kg/m3] 1.188 [23] [24]
ρL [kg/m3] 1.003*103 [25]
μL [mPA*s] 2.6 [26]
FP [m-1] 275 [18]
Vẇ [kg/m2s] 0.846
LW [kg/s] 0.033
VW [kg/s] 0.008
FLV - 0.139
K4 - 1
d mm 98
From these calculations the diameter was found to be 98 mm. A good choice of material for
this project would be a 104x2mm standard stainless steel pipe.
5.6 Column height
The height of the column is as explained before dependent on the contact time needed for
full or acceptable absorption of CO2. The height is usually determined by experience from
similar equipment rather than mathematical conclusions [27].
One similar project was found where the gas flow was 7.6 m3/hr. The height of the column
in this project was 2.3m [14]. Therefor the size will be assumed as 2.6m even though the gas
flow is greater. No other similar systems were found. To validate this size test needs to be
conducted.

21
5.7 Thermodynamics
One concern of the design is the energy generated by exothermic reaction of the absorption
process. The energy created in the process can be found in the works of Inna Kim [28].
There, experiments were made that conclude that with 30% MEA concentration at 40°C the
heat of absorption, for this projects mol-CO2/mol-amine ratio calculated with equation 5-5
and equation 5-6, is 87 kJ/mol-CO2, this can be seen in figure 5-5 [28].
With this informaiton the total heat generated by the absoption is 9.1 kJ/s when the gas flow
is at 25 m3/hour and liquid flow rate at 2 L/s. The ar ratio described in figure 5-5 for the
system in this project would be 0.68.
𝑉𝐶𝑂2 = 559 𝐿𝑘𝑔 𝐶𝑂2⁄ 𝑀𝐶𝑂2 = 44,01
𝑔𝑀𝑂𝐿⁄
𝑛𝑀𝑂𝐿,𝐶𝑂2 =𝐺𝑖 [𝑚3/ℎ𝑜𝑢𝑟] ∗ 106 ∗ 𝑦𝐶𝑂2
3600 ∗ 𝑉𝐶𝑂2 [𝐿/𝑘𝑔] ∗ 𝑀𝐶𝑂2= [𝑀𝑂𝐿
𝑠𝑒𝑘⁄ ]
Equation 5-5 - For calculating CO2 MOL.
𝜌𝑀𝐸𝐴 = 1016𝑔
𝐿 𝑀𝑀𝐸𝐴 = 61.08
𝑔𝑀𝑂𝐿⁄
𝑛𝑀𝑂𝐿,𝑀𝐸𝐴 =𝑋𝑖[𝑙/𝑚𝑖𝑛] ∗ 𝑦𝑀𝐸𝐴 ∗ 𝜌𝑀𝐸𝐴
60𝑠𝑒𝑘 ∗ 𝑀𝑀𝐸𝐴= [𝑀𝑂𝐿
𝑠𝑒𝑘⁄ ]
Equation 5-6 - For calculating MEA MOL.
Figure 5-5 - Heat of absorption for 30% MEA [28]

22
According to this the energy released in the absorbance process is 9.8 kW. With all this heat
generated in the column it is necessary to account for any heat buildup that might occur.
With that in mind the system was modeled in regards to heat. The operation temperature is
estimated to be 30°C at the top of the tower and 50°C at the bottom. Gases working on the
system are considered negligible in regards to energy transferred in and out of the system as
they have very little heat capacity. CO2 has, for example, heat capacity of 0.846kJ/kgK
whereas water has 4.22kJ/kgK [29].
By building the column out of stainless steel the heat conduction from the tower is enough
to keep it from heating up. According to the results from equation 5-7, where λ is the heat
transfer coefficient, l is the length of the column, D is the outer diameter of the column, d is
the inner diameter and t1 and t2 is the heat difference.
𝑄 =2𝜋𝜆𝑙
𝑙𝑛𝐷𝑑
(𝑡1 − 𝑡2)
Equation 5-7 - Heat transfer formula through a pipe [30].
For this project the parameters are as follows:
λ stainless steel = 16 W/m°C
l = 2.6m
D=104mm
d=100mm
t1=50°C
t2=20°C (ambient temperature)
Thus Q is approximately 270 kW.
Figure 5-6 - Absorption column with heat estimates.
23
Which means that the heat transfer from the inner to outer column can be 133.3 kW. This
heat flow is dependent on a variety of factors such as air ventilation, vapor inside the column
and more. The possible heat flow from the column should be more than sufficient to keep it
within any desired operating temperatures.
While it is good to see the heat flow from the tank it is more practical to look at the energy
removed by the water and MEA exiting the column, as the heat transfers into the liquid more
readily. The energy transferred with the liquid flow can be calculated with equation 5-8.
𝐸 = (𝑦𝑀𝐸𝐴 ∗ 𝑐𝑀𝐸𝐴 + 𝑦𝑤𝑎𝑡𝑒𝑟 ∗ 𝑐𝑤𝑎𝑡𝑒𝑟) ∗ 𝑋𝑜𝑢𝑡 ∗ (𝛥𝑡) = 𝑊
Equation 5-8 - Energy transferred from system with liquid flow.
Where:
E is the total energy transferred with the liquid [W].
yMEA is the MEA concentration [%].
ywater is the water concentration [%].
Cmea is the specific heat of MEA [J/kg]
Cwater is the specific heat of water [J/kg]
Xout is the liquid flow out [kg/s].
t1 and t2 is the temperature difference between the liquid coming in and liquid going out [°C].
The results from equation 5-8 and equation 5-7 show that the energy moved out of the system
with the liquid flow is 2.26 kW and with the additional heat transfer rate of the stainless steel
the system is expected to run within the maximum 50°C that is expected. To validate this
the heat buildup will be monitored in testing. Calculations can be seen in appendix o.
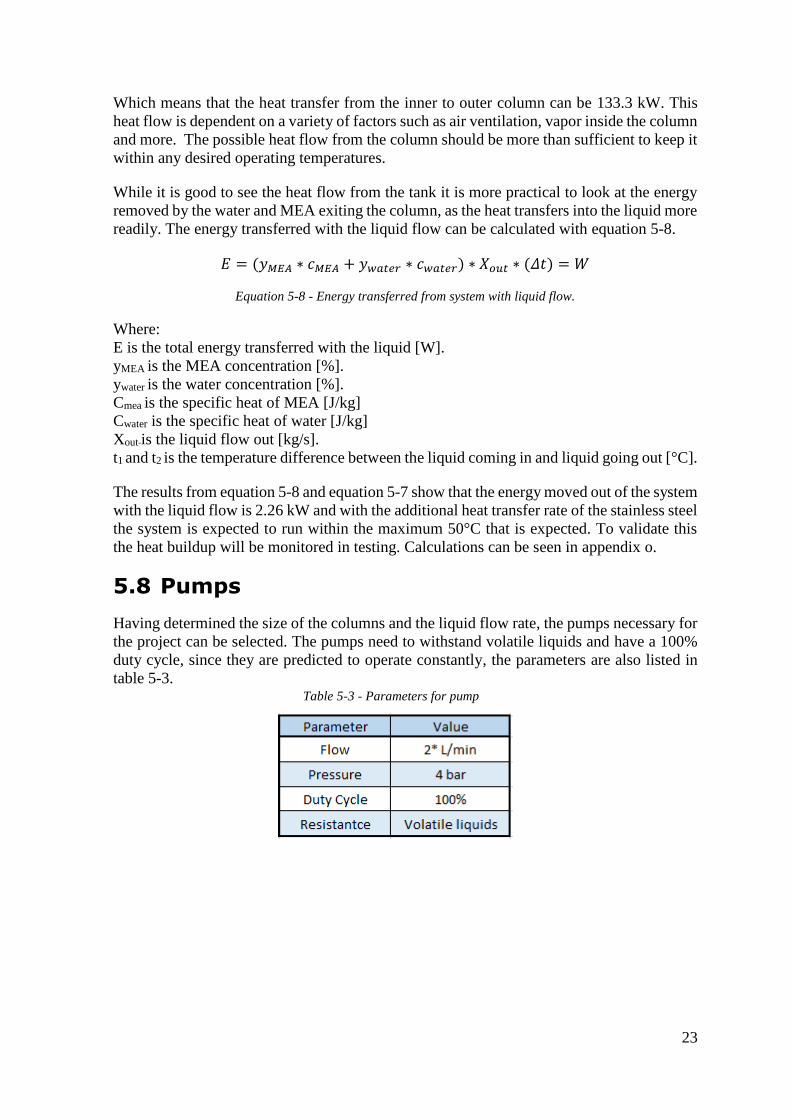
5.8 Pumps
Having determined the size of the columns and the liquid flow rate, the pumps necessary for
the project can be selected. The pumps need to withstand volatile liquids and have a 100%
duty cycle, since they are predicted to operate constantly, the parameters are also listed in
table 5-3. Table 5-3 - Parameters for pump
24
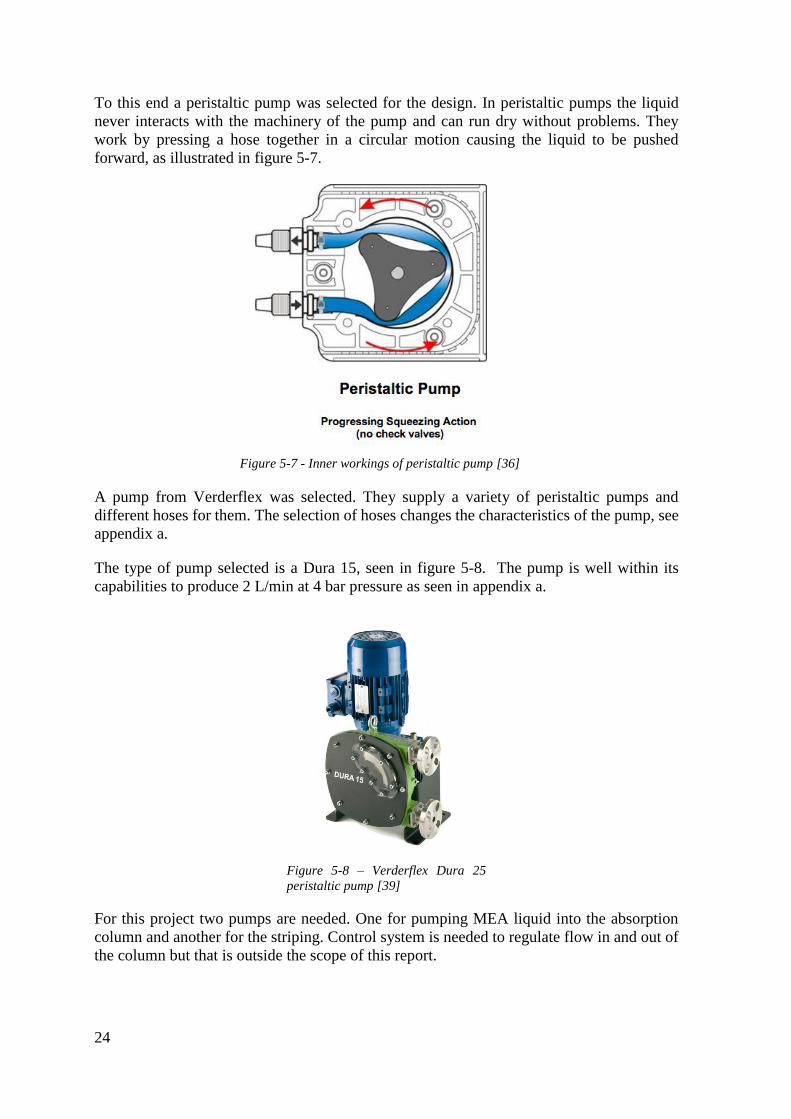
To this end a peristaltic pump was selected for the design. In peristaltic pumps the liquid
never interacts with the machinery of the pump and can run dry without problems. They
work by pressing a hose together in a circular motion causing the liquid to be pushed
forward, as illustrated in figure 5-7.
A pump from Verderflex was selected. They supply a variety of peristaltic pumps and
different hoses for them. The selection of hoses changes the characteristics of the pump, see
appendix a.
The type of pump selected is a Dura 15, seen in figure 5-8. The pump is well within its
capabilities to produce 2 L/min at 4 bar pressure as seen in appendix a.
For this project two pumps are needed. One for pumping MEA liquid into the absorption
column and another for the striping. Control system is needed to regulate flow in and out of
the column but that is outside the scope of this report.
Figure 5-8 – Verderflex Dura 25
peristaltic pump [39]
Figure 5-7 - Inner workings of peristaltic pump [36]

25
Tubing for the pump is an important factor. Tubing available from Verderflex do not meet
the required chemical resistance needed for the project so tubing from another manufacturer
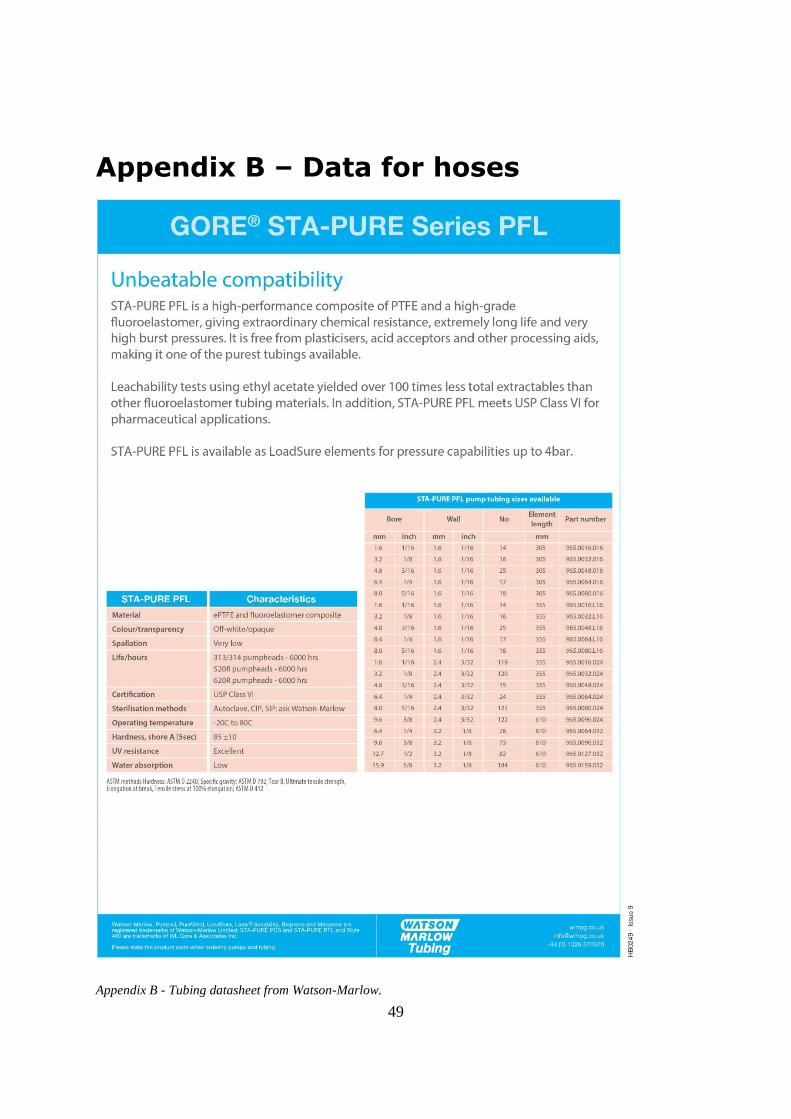
was chosen. The StaPure tubing from Watson-Marlow has a lifetime of 6000 hours, or
approximately eight months according to data sheet in appendix b [31]. Regular maintenance
is expected every six months which should be sufficient to prevent failing. Although, in the
case of failure the tubing can easily be replaced by untrained personnel, although it is not
recommended due to chemicals involved [32].
5.9 Design conclusions
The design process was not completed for an entire system. Emphasis was put on completing
a test model of the absorption portion of the system so a test could be made to validate the
current design.
For further designs the stripping column needs to be configured as the rest of the equipment
is dependent on it. The heat exchanger needs to be calculated in regards to the temperature
of the liquid coming from the striping column and the cooling system as well. A steam
generator needs to be chosen in regards to the heat and vapor quantity needed to extract CO2
from the MEA and finally the flash tank also is designed in regards to the steam from the
steam generator.


27
6 Full size absorption test
To validate the design results it was decided to build a full scale absorption test. The
absorption test system will be conducted according to the parameters listed in table 6-1.
Table 6-1 - List of design parameters.
Parameters Value
Gas flow rate (Nm3/hr) 25
Liquid Flow rate (L/min) 2
Column Diameter (cm) 161
Column Height (cm) 290
Packing material PE Pall rings
Pump Pressure (Bar) 4
MEA concentration 30%
Gas type Landfill
1The diameter size is a result of previous findings, better information in discussions in chapter 9
These test results will determine the functionality of the design but most importantly if the
column height is sufficient for full absorption.
MEA will be circulated through a stream of landfill gas. With each circulation the
concentration of CO2 will rise in the liquid. Temperature, PH and gas concentration
measurements will be taken on a regular basis until the MEA has become saturated with
CO2. At that point absorption will have dropped considerably.
28
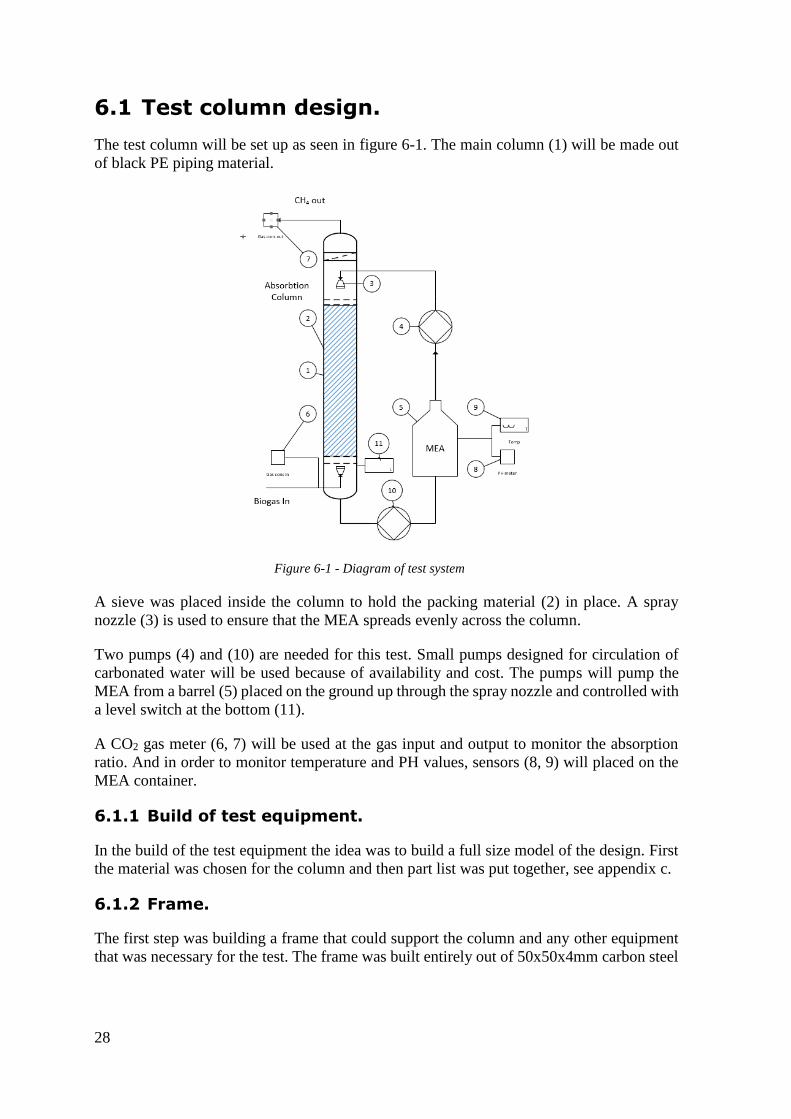
6.1 Test column design.
The test column will be set up as seen in figure 6-1. The main column (1) will be made out
of black PE piping material.
A sieve was placed inside the column to hold the packing material (2) in place. A spray
nozzle (3) is used to ensure that the MEA spreads evenly across the column.
Two pumps (4) and (10) are needed for this test. Small pumps designed for circulation of
carbonated water will be used because of availability and cost. The pumps will pump the
MEA from a barrel (5) placed on the ground up through the spray nozzle and controlled with
a level switch at the bottom (11).
A CO2 gas meter (6, 7) will be used at the gas input and output to monitor the absorption
ratio. And in order to monitor temperature and PH values, sensors (8, 9) will placed on the
MEA container.
6.1.1 Build of test equipment.
In the build of the test equipment the idea was to build a full size model of the design. First
the material was chosen for the column and then part list was put together, see appendix c.
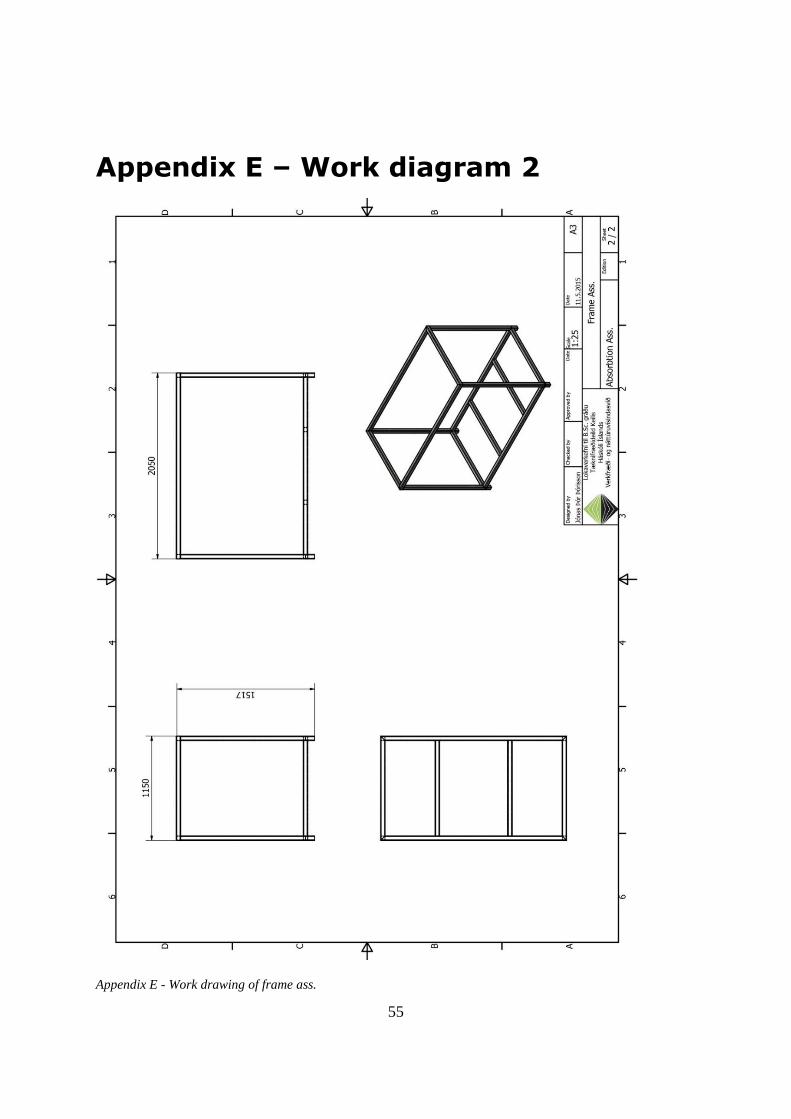
6.1.2 Frame.
The first step was building a frame that could support the column and any other equipment
that was necessary for the test. The frame was built entirely out of 50x50x4mm carbon steel
Figure 6-1 - Diagram of test system
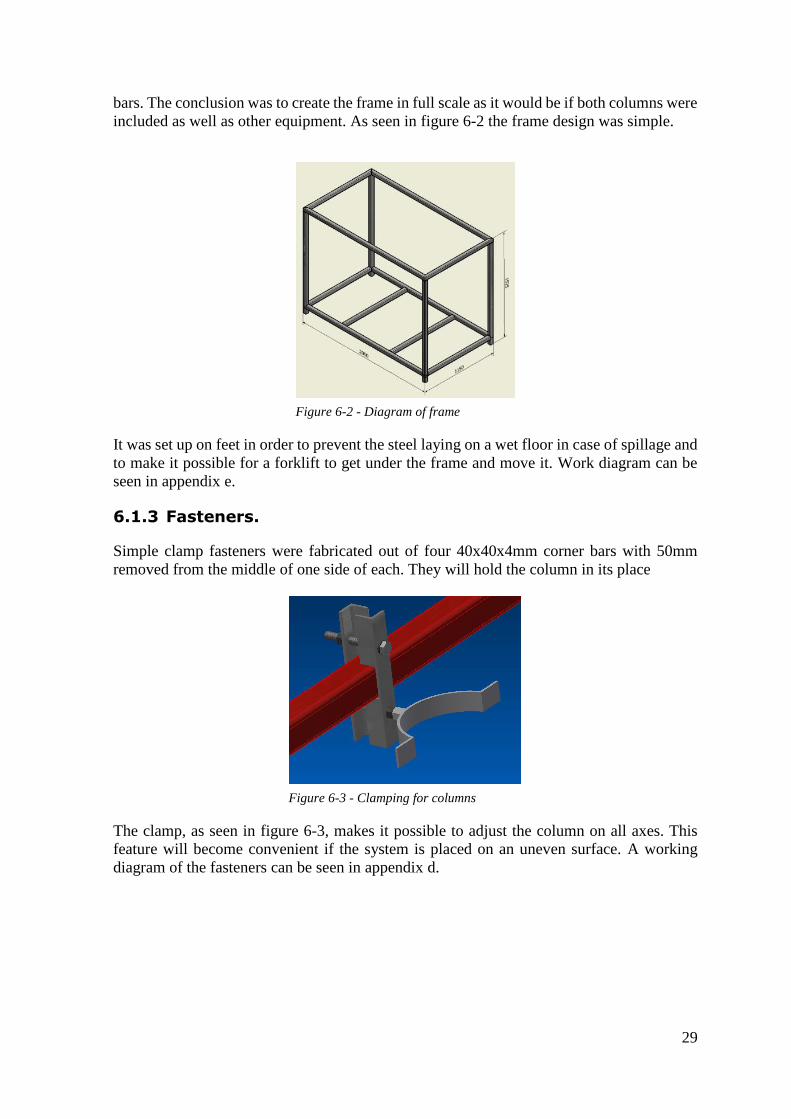
29
bars. The conclusion was to create the frame in full scale as it would be if both columns were
included as well as other equipment. As seen in figure 6-2 the frame design was simple.
It was set up on feet in order to prevent the steel laying on a wet floor in case of spillage and
to make it possible for a forklift to get under the frame and move it. Work diagram can be
seen in appendix e.
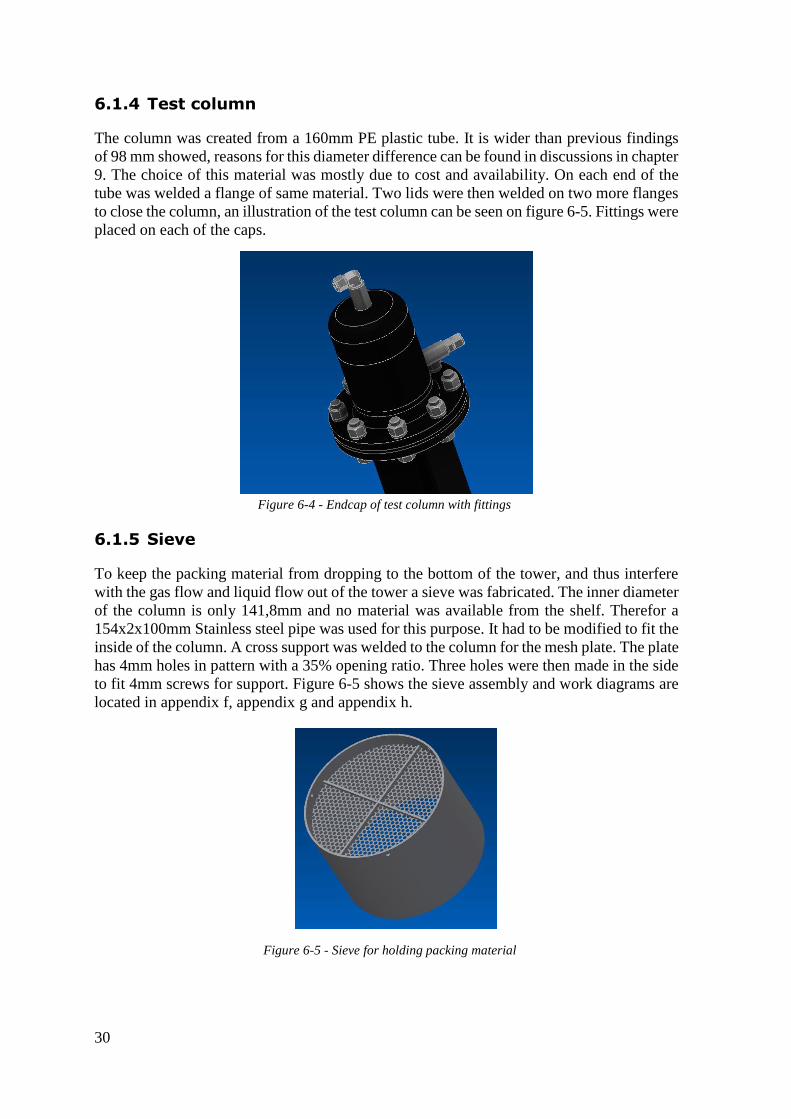
6.1.3 Fasteners.
Simple clamp fasteners were fabricated out of four 40x40x4mm corner bars with 50mm
removed from the middle of one side of each. They will hold the column in its place
The clamp, as seen in figure 6-3, makes it possible to adjust the column on all axes. This
feature will become convenient if the system is placed on an uneven surface. A working
diagram of the fasteners can be seen in appendix d.
Figure 6-3 - Clamping for columns
Figure 6-2 - Diagram of frame
30
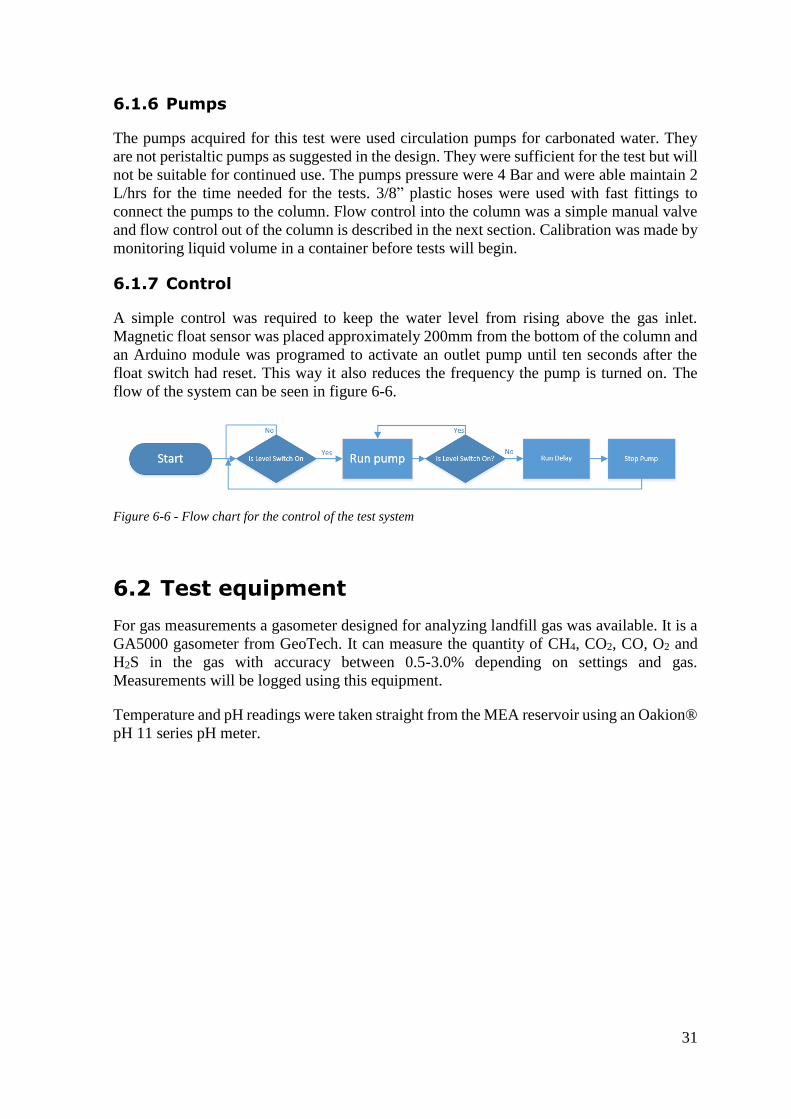
6.1.4 Test column
The column was created from a 160mm PE plastic tube. It is wider than previous findings
of 98 mm showed, reasons for this diameter difference can be found in discussions in chapter
9. The choice of this material was mostly due to cost and availability. On each end of the
tube was welded a flange of same material. Two lids were then welded on two more flanges
to close the column, an illustration of the test column can be seen on figure 6-5. Fittings were
placed on each of the caps.
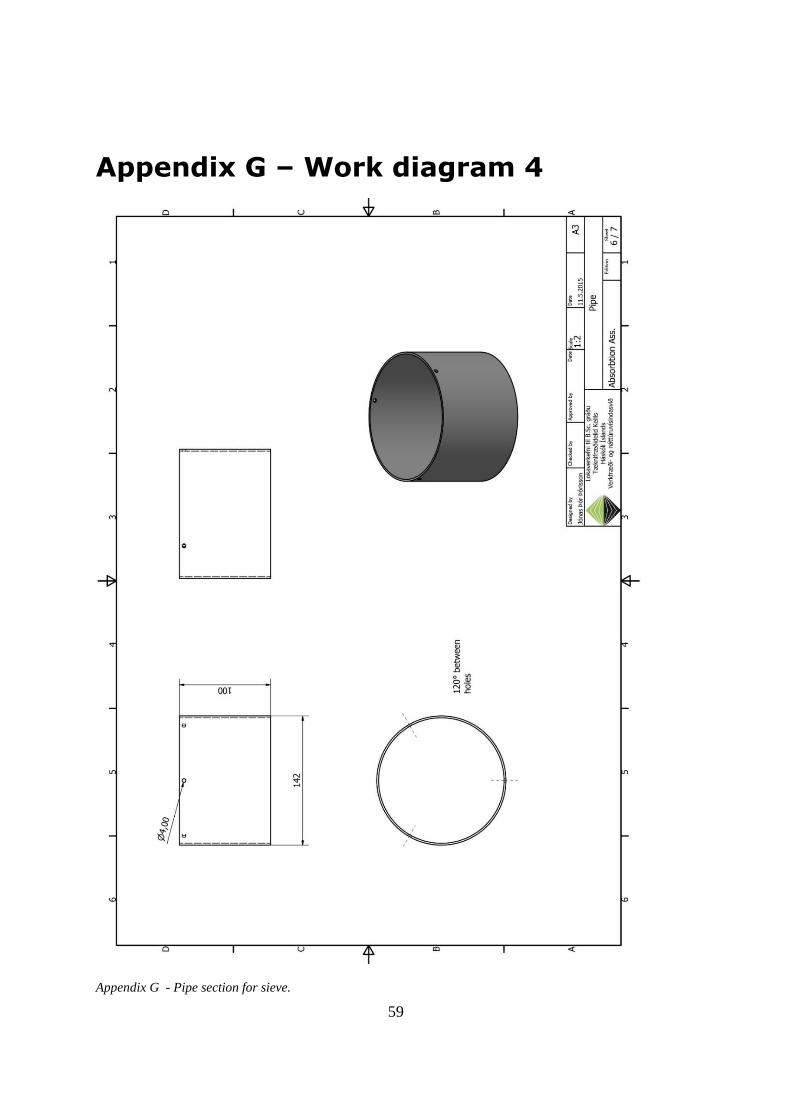
6.1.5 Sieve
To keep the packing material from dropping to the bottom of the tower, and thus interfere
with the gas flow and liquid flow out of the tower a sieve was fabricated. The inner diameter
of the column is only 141,8mm and no material was available from the shelf. Therefor a
154x2x100mm Stainless steel pipe was used for this purpose. It had to be modified to fit the
inside of the column. A cross support was welded to the column for the mesh plate. The plate
has 4mm holes in pattern with a 35% opening ratio. Three holes were then made in the side
to fit 4mm screws for support. Figure 6-5 shows the sieve assembly and work diagrams are
located in appendix f, appendix g and appendix h.
Figure 6-4 - Endcap of test column with fittings
Figure 6-5 - Sieve for holding packing material
31
6.1.6 Pumps
The pumps acquired for this test were used circulation pumps for carbonated water. They
are not peristaltic pumps as suggested in the design. They were sufficient for the test but will
not be suitable for continued use. The pumps pressure were 4 Bar and were able maintain 2
L/hrs for the time needed for the tests. 3/8” plastic hoses were used with fast fittings to
connect the pumps to the column. Flow control into the column was a simple manual valve
and flow control out of the column is described in the next section. Calibration was made by
monitoring liquid volume in a container before tests will begin.
6.1.7 Control
A simple control was required to keep the water level from rising above the gas inlet.
Magnetic float sensor was placed approximately 200mm from the bottom of the column and
an Arduino module was programed to activate an outlet pump until ten seconds after the
float switch had reset. This way it also reduces the frequency the pump is turned on. The
flow of the system can be seen in figure 6-6.
Figure 6-6 - Flow chart for the control of the test system
6.2 Test equipment
For gas measurements a gasometer designed for analyzing landfill gas was available. It is a
GA5000 gasometer from GeoTech. It can measure the quantity of CH4, CO2, CO, O2 and
H2S in the gas with accuracy between 0.5-3.0% depending on settings and gas.
Measurements will be logged using this equipment.
Temperature and pH readings were taken straight from the MEA reservoir using an Oakion®
pH 11 series pH meter.

32
6.3 Test procedures
First the equipment was set up as seen in figure 6-7. The equipment was set up on a small
trailer for convenience. The fasteners where adjusted so the tower was vertical and pumps
and control system fit into place. MEA mixture is then prepared where 30L of 99.7% MEA
is mixed with 70 L of water in a barrel.
After set up a gas pump was set up with a diesel generator. Gas stream from the landfill at
Álfsnes was be pumped to the bottom of the column at maximum capacity.
Measurements from the gas were taken with the GA5000 gasometer and logged. Data was
taken on three minute interval to observe the absorbance efficiency. Temperature and PH
temperature were be taken from the MEA reservoir on the same five minute interval and also
documented.
Figure 6-7 - Photo from test site of equipment
33
7 Test Results
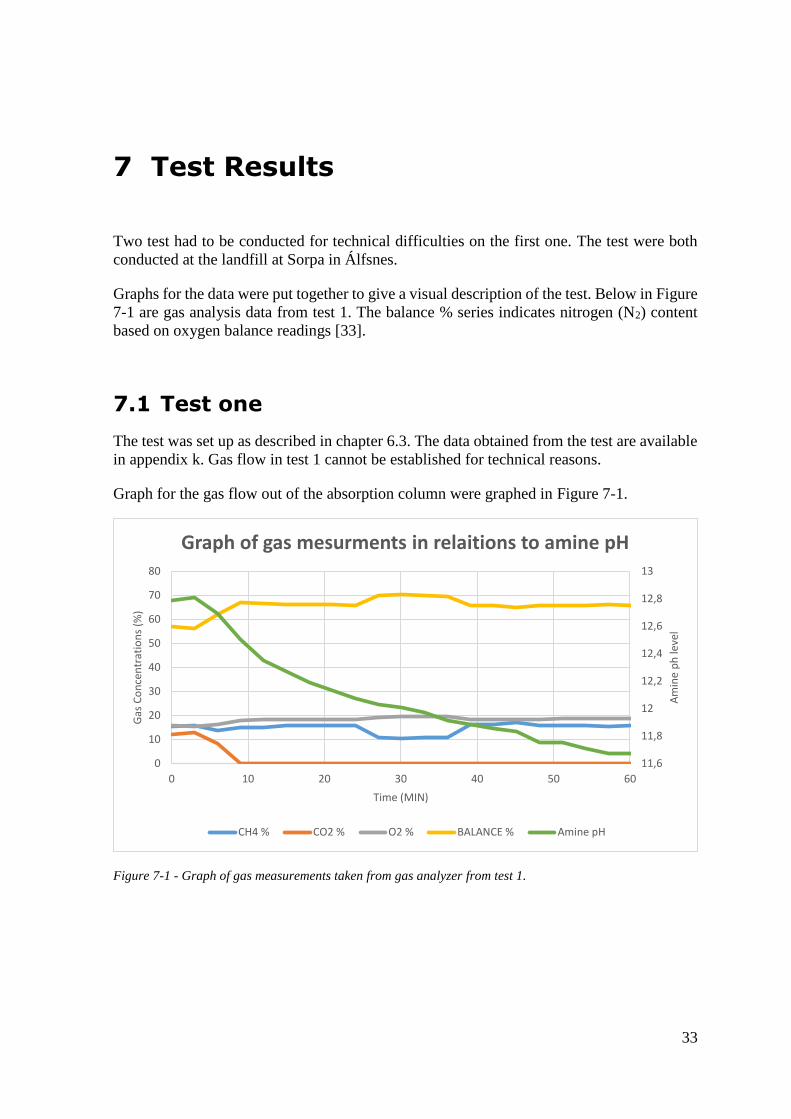
Two test had to be conducted for technical difficulties on the first one. The test were both
conducted at the landfill at Sorpa in Álfsnes.
Graphs for the data were put together to give a visual description of the test. Below in Figure
7-1 are gas analysis data from test 1. The balance % series indicates nitrogen (N2) content
based on oxygen balance readings [33].
7.1 Test one
The test was set up as described in chapter 6.3. The data obtained from the test are available
in appendix k. Gas flow in test 1 cannot be established for technical reasons.
Graph for the gas flow out of the absorption column were graphed in Figure 7-1.
Figure 7-1 - Graph of gas measurements taken from gas analyzer from test 1.
11,6
11,8
12
12,2
12,4
12,6
12,8
13
0
10
20
30
40
50
60
70
80
0 10 20 30 40 50 60
Am
ine
ph
leve
l
Gas
Co
nce
ntr
atio
ns
(%)
Time (MIN)
Graph of gas mesurments in relaitions to amine pH
CH4 % CO2 % O2 % BALANCE % Amine pH

34
In figure 7-2 the data from the pH and temperature readings can be seen.
Figure 7-2 - Graph of H2S absorbance in relations to amine pH during test 1.
Because of technical difficulties data from test 1 it was decided to conduct another test.
These difficulties were that the pump used to pump gas out from the landfill leaked. At first
the gas content was deemed plausible since the hole in question had never been tested before.
Later a severe leakage was discovered on the pump causing it to suck in atmosphere and thus
distorting the data.
7.2 Second Test
The second test was continued from where test one ended so the MEA had already some
concentration of CO2 in it and thus a lower pH. The initial pH value was 12.11 as apposed
12.79 in test 1. Temperature and pH reading were monitored and noted at the same interval
as the gas measurements.
First the pump had to be repaired so a viable test could be completed.
Graphs of the test results can be seen here bellow, all data is displayed in appendix j.
0 10 20 30 40 50 60 70
0
10
20
30
40
50
60
11,6
11,8
12
12,2
12,4
12,6
12,8
13
0 10 20 30 40 50 60
Am
ine
pH
leve
l
H2
S C
on
cen
trat
ion
(%
)
Time (MIN)
Graph of H2S mesurments in relaitions to amine pH
Amine pH H2S

35
First the CH4 concentration in and out of the system was plotted in comparison with the CO2,
see figure 7-3, in relations to the amine pH levels.
Figure 7-3 - Graph of CH4 and CO2 concentration in and out with amine pH..
N2 and CH4 concentration in and out were added together and plotted together in relation to
the amine pH values, see figure 7-4.
Figure 7-4 - N2+CH4 concentration in and out of the system in relations to amine pH.
11
11,2
11,4
11,6
11,8
12
12,2
0
10
20
30
40
50
60
70
80
0 10 20 30 40 50 60 70 80 90
Am
ine
pH
val
ue
CH
4 c
on
cen
trat
ion
in g
as (
%)
Time (min)
CH4 and CO2 concentration in and out in relations to amine pH
CH4 out CH4 in CO2 out CO2 in Amine pH
11
11,2
11,4
11,6
11,8
12
12,2
0
10
20
30
40
50
60
70
80
90
100
0 10 20 30 40 50 60 70 80 90
Am
ine
pH
Val
ue
N2+
CH
4co
nce
ntr
atio
n (
%)
Time (min)
N2+CH4 concentration in relations to amine pH
N2+CH4 out N2+CH4 in Amine pH

36
H2S concentrations were plotted in and out of the system in relations to the amine pH value,
see figure 7-5.
Figure 7-5 - H2S concentration in and out of the system in relations to amine pH.
Finally the total absorbance efficiency was plotted in relations to the amine pH levels, see
figure 7-6.
Figure 7-6 - CO2 absorbance efficiency in relations to amine pH.
11
11,2
11,4
11,6
11,8
12
12,2
0
20
40
60
80
100
120
140
0 10 20 30 40 50 60 70 80 90
Am
ine
pH
val
ue
H2
Sva
lue
(pp
m)
Time (min)
H2S concentration in relations to pH
H2S out H2S in Amine pH
11
11,2
11,4
11,6
11,8
12
12,2
0%
10%
20%
30%
40%
50%
60%
70%
80%
90%
100%
0 10 20 30 40 50 60 70 80 90
Am
ine
Ph
val
ue
ηC
O2
(%
)
Time (min)
Absorbance efficiency in relations to pH
CO2 out / CO2 in Amine pH
37
8 Test Analysis
Two test were conducted with very different results. Both were conducted on the same
borehole at the Landfill in Álfsnes. The second test did show some promising results.
8.1 Test 1
Because of leakage in the pump in test one this test has to be counted as inconclusive. The
leakage in the pump caused atmosphere to enter the gas stream in great amount. This can be
seen in figure 7-1. For landfill gas there can be some trace of O2 and even N2 but never in
such a great quantity as in this test unless.
Data from test 1 show that CO2 and H2S are completely absorbed with no observable loss to
CH4. For this test, that is in no way conclusive to that the system is working as it should. But
only shows that the MEA is absorbing the little quantity of CO2 an H2S there was in the gas
stream. Since the pump for the gas extraction from the landfill was leaking, and that the test
equipment itself is working properly.
8.2 Test 2
The second test worked out much better than the previous one. There was some leakage in
the pump but not so that the test data was completely corrupt. The biggest problem is that
the leakage interrupts with the flow of gas from the borehole thus making it complicated to
determine the flow correctly. Estimation of the flow, set it only at around 150-200 L/min
which is well below the max 416 L/min (25 m3/hour) the system was designed for although
the lower design flow was only at 160 m3/hour (10 m3/hour).
Heat measurements where intended to use to see the temperature build up in the amines
because of absorption. That is also very difficult to do since the pump heated the gas stream
to approximately 60°C, this temperature is only an estimate since it was measured by touch.
There was buildup of heat in the MEA reservoir as can be seen in the data in appendix j but
again, the affect absorption had on it is unknown, besides wind cooling is impossible to
determine since no wind and ambient temperature data was acquired.
In figure 7-3 the CH4 concentration in and out of the system was plotted. There it can be
seen that the CH4 concentration slowly falls as the CO2 concentration rises. This happens as
the absorption efficiency of the MEA is falling with the pH level.
Nitrogen (N2) acts similarly as CH4 in the MEA system. The solubility is very low and
therefore it can be assumed that the summed up concentration of CH4 and N2 in figure 7-4
closely represent what can be expected if only CH4, CO2 and H2S where present.
While the pH of the amine was still high, above 12, the H2S absorbance is efficient as seen
in figure 7-5. The concentration is well below the 16ppm listed in the Swedish standard and
is no cause for concern.

38
The ratio between the CO2 in and out falls fast with a rising pH of the amines as seen in
figure 7-6. It only reaches 90% absorbance at the beginning while the MEA is at a high pH
of 12.2.

39
9 Discussions
The first test conducted showed, as seen on graphs in chapter 7, that it was severely flawed.
It turned out that a glass flow tube was broken letting in excessive amount of atmosphere.
Experience was gathered with that test which made the second one a bit more conclusive.
The second test showed some promising results. The absorbance ratio of the MEA was good
while the liquid was fresh but quickly fell as expected. This shows that a stripper is essential
for this kind of system as 100 L of 30% MEA is not capable of absorbing much CO2. The
H2S absorption was very good though and shows that as long as the system is designed for
absorbing CO2 it will have no problem absorbing the little H2S that is expected in biogas.
Errors were made in the initial design calculations. The column diameter was initially too
large and later turned out to need only be 98 mm, the removed design chapter can be seen in
appendix n. The test column was designed with the flawed dimensions. This means that the
liquid to gas ratio was also not appropriate for the size chosen for the test.
The previous method worked by comparing designs in the work of Huertas [14]. This method
turned out at later stages in the design to inaccurate estimation and was therefore discarded
from the formal report but can be seen in appendix n.
What helped the results in the test was probably the fact that the gas flow from the pump
was only approximately ¼ of the max designed gas flow of 25 m3/hour. It does though
closely match the lower value of 10 m3/hour, see chapter 5.1 which would mean that the
results from the test are in fact promising. They show that with a stripper keeping the MEA
free of CO2 and proper adjustments of packing material and flow ratio it should work.


41
10 Conclusions
The design initially proposed has been completed. It will need some adjustments though if
it is to work properly at 25 m3/hour as the diameter was designed originally in excess (see
ch. 9).
Tests of the equipment shows that it is only capable of upgrading the minimum design
amount of 10 m3/hour at a 90% CO2 absorbance efficiency. Increased liquid flow should
raise the efficiency to 95%.
The test conducted showed that the column is mechanically working. Modifications on the
flow system should be modified to account for the increased liquid flow needed or the
column tightened to fit the flow rate already established. Both the increased liquid flow and
column diameter can serve as a solution. Continued work should focus on designing the
stripping column. The design of it will ultimately determine whether it is more economically
feasible to decrease the absorption column width or increase the liquid flow.
Time management was conducted by first making a gantt chart as seen in appendix l. It
turned out that it was difficult to keep up with this schedule. In later stages of the project it
was decided to break the schedule up in smaller tasks to increase oversight of the project,
see appendix m.

43
References
[1] International energy agency, "Key world energy statistics," IEA, Paris, 2014.
[2] T. Abbasi, S. M. Tuseef and S. A. Abbasi, "Biogas Energy," Berlin, Springer, 2012,
pp. 11-23.
[3] E. Ryckebosch, M. Drouillon and H. Vervaeren, "Techniques for transformation of
biogas to biobethane," Biomass And Bioenergy 35, pp. 1633-1645, 2011.
[4] D. Fulford, Running a biogas programme: A handbook, London: Intermediate
Technology Publications, 1988.
[5] A. Petersson and A. Wellinger, "Biogas upgrading technologies – developments and
innovations," IEA Bioenergy, 2009.
[6] S. Rasi, A. Veijanen and J. Rintala, "Trace compounds of biogas from different biogas
production plants," ScienceDirect, Energy 32, 2007, pp. 1375-1380, 2006.
[7] SORPA bs., "Ársskýrsla SORPU 2012," SORPA bs., Reykjavík, 2012.
[8] S. M. Harðarson, "Bændablaðið," 7 10 2010. [Online]. Available:
http://www.bondi.is/lisalib/getfile.aspx?itemid=5402. [Accessed 18 05 2015].
[9] National Center for Biotechnology Information, "Compound Summary for CID 297,"
10 april 2015. [Online]. Available: http://pubchem.ncbi.nlm.nih.gov/compound/297 .
[10] M. Persson and A. Wellinger, "Biogas Upgrading And Utilisation," IEA Bioenergy,
2006.
[11] N. M. Proietti, Interviewee, Subject of water recycling at Sorpa. [Interview]. 12 02
2015.
[12] L. Dubois and D. Thomas, "Carbon diocide absorption into aquenous amine based
solvents: modeling and absorption tests.," ScienceDirect, energy procedia, pp. 1353-
1360, 2011.
[13] L. Dubois and D. Thomas, "Comparison of Various Alkaline Solutions for H2S/CO2
Absorption Applied to Biogas Purification," Chemical Engineering Technology, pp.
1601-1609, 2010.
44
[14] J. I. Huertas, N. Giraldo and S. Izquierdo, "Removal of H2S and CO2 from Biogas
by Amine Absorption," InTech, Mexico, 2011.
[15] AceChemPack Tower Packing Co., Ltd, "Column Packings," 10 05 2015. [Online].
Available: http://www.tower-packing.com/Dir_column_packing.htm.
[16] Cole Parmer fluid handling and analysis, "Chemical resistance," ColeParmer,
[Online]. Available: http://www.coleparmer.com/Chemical-Resistance. [Accessed 11
05 2015].
[17] Orion Fittings, Inc, "Watts Water Technologies," 24 01 2006. [Online]. Available:
http://media.wattswater.com/Orion-AW-Chem_Resistance.pdf. [Accessed 11 05
2015].
[18] Vereinigte Füllkörper-Fabriken GMBH & Co. KG, "Downloads," 06 11 2012.
[Online]. Available: http://www.vff.de/en/download?download=2:full-brochure-uk.
[Accessed 11 05 2015].
[19] Ningbo TianYi Chemical Industrial(T.C.I.) Co.,, "Plastic pall ring - Pall ring, Pall
rings,Raschig ring,PVC,CPVC PALL R:," 18 05 2015. [Online]. Available:
http://www.rubbersealing.com/TCI/goods-73--Random+Tower+packing-
Pall+ringHiflow+ring-Plastic+pall+ring.html. [Accessed 18 05 2015].
[20] Jianxi Kelley Chemical Packing Co., Ltd, "Plastic Pall Ring," 29 06 2014. [Online].
Available: http://www.jxkelley.net/product/Plasticpallrings.html#.VVqBBkYbjtJ.
[Accessed 18 05 2015].
[21] RVT Process equipment GMBH, "Uploads," 26 02 2015. [Online]. Available:
http://www.rvtpe.de/wp-content/uploads/2013/01/RR-25-0-PP1.pdf. [Accessed 18
05 2015].
[22] J. M. Coulson and J. F. Richardson, "Coulson's & Richardson's Chemical
Engineering," in Chemical Engineering Vol.6 Fourth edition, Oxford, Elsevier
Butterworth-Heinemann, 2005, pp. 602-604.
[23] Mathesongas, "Pure Gases/Methane," 17 04 2014. [Online]. Available:
https://www.mathesongas.com/pdfs/products/Methane-Pure-Gas.pdf. [Accessed 18
05 2015].
[24] The Engineering Toolbox, "Gases - Densities," The Engineering Toolbox, 18 05
2015. [Online]. Available: http://www.engineeringtoolbox.com/gas-density-
d_158.html. [Accessed 18 05 2015].
[25] AksoNobel, "Monoethanolamine - MEA," 01 2009. [Online]. Available:
https://www.akzonobel.com/ea/system/images/AkzoNobel_MEA_PIS_tcm53-
24552.pdf. [Accessed 18 05 2015].

45
[26] T. G. Amundsen, "CO2 Absorption in Alkaline Solution," Telemark University
College, Porsgrunn, 2008.
[27] J. M. Coulson and J. F. Richardson, "Coulsons's & Richardson's Chemical
Engineering," in Chemical Engineering Vol. 6 Fourth edition, Oxford, Elsevier, 2005,
pp. 597-598.
[28] I. Kim, K. A. Hoff and T. Mejdell, "Heat of absorption of CO2 with aqueous solutions
of MEA: new experimental data," Science Direct, vol. Energy Procedia, no. 63, pp.
1446-1455, 2014.
[29] Y. A. Cengel, R. H. Turner and J. M. Cimbala, "Thermal-Fluid Sciences," in
Fundementals of Thermal-Fluid Sciences, New York, McGraw Hill, 2008, p. 990.
[30] NYT TEKNISK FORLAG, Maskin såbi, Valby: NYT TEKNISK FORLAG, 2011.
[31] Watson-Marlow, "Datasheets," 14 04 2001. [Online]. Available:
http://wmbpumps.co.za/pdfs-global/wd-621fxre-gb-01.pdf. [Accessed 11 05 2015].
[32] The Dow chemical company, "Material Safety Data Sheet - Monoethanolamine," 17
06 2003. [Online]. Available:
http://msdssearch.dow.com/PublishedLiteratureDOWCOM/dh_0044/0901b8038004
4789.pdf?filepath=amines/pdfs/noreg/111-01388.pdf&fromPage=GetDoc.
[Accessed 11 05 2015].
[33] GeoTech, "Downloads," 15 05 2015. [Online]. Available:
http://www.geotechuk.com/media/180633/ga2000_datasheet.pdf. [Accessed 15 05
2015].
[34] Ningbo T.C.I Co, Ltd, "polypropylene pall rings > Pall ring > Random tower packing
> NINGBO T.C.I CO.,LTD. - - NINGBO T.C.I CO.,LTD.:," 25 04 2015. [Online].
Available: http://www.mist-eliminator-demister.com/mist-eliminator-
demister/goods-811--Random+tower+packing-Pall+ring-
polypropylene+pall+rings.html.
[35] Watson-Marlow Fluid Technology Group (WMFTG), "Watson-Marlow," 25 01
2012. [Online]. Available: http://watson-marlow.com/Documents/knowledge-
hub/Datasheets/us%20-%20USA/wd-621cc-us-01.pdf. [Accessed 11 05 2015].
[36] Blue White industries, "Confessions of a Chemical feed pump manufacturer - Robin
Gledhil," 19 06 2015. [Online]. Available: http://blue-white.com/wp-
content/uploads/2013/08/Screen-Shot-2013-08-15-at-1.21.11-AM.png. [Accessed 15
05 2015].
[37] ENCYCLOPEDIA OF CHEMICAL ENGINEERING EQUIPMENT, "Index of
/Images/SeparationsChemical/DistillationColumns," 90 01 2012. [Online].
Available:

46
http://encyclopedia.che.engin.umich.edu/Images/SeparationsChemical/DistillationC
olumns/pac-equ0.jpg. [Accessed 15 05 2015].
[38] DMT environmental technology, "The DMT Carborex® MS biogas upgrading
system," 15 05 2015. [Online]. Available: http://www.dirkse-
milieutechniek.com/dmt/do/webPages/202356/The_DMT_Carborex_MS_biogas_up
grading_system.html. [Accessed 15 05 2015].
[39] Verderflex®, "Direct Industries," 18 12 2014. [Online]. Available:
http://www.directindustry.com/prod/verderflex-peristaltic-pumps/peristaltic-pumps-
compact-14215-437922.html. [Accessed 17 05 2015].
[40] GeoTech, "GA5000 portable landfill gas analyser," 19 05 2015. [Online]. Available:
http://www.geotechuk.com/products/landfill-and-biogas/portable-gas-
analysers/ga5000.aspx. [Accessed 19 05 2015].

47
Appendix A – Data sheet for pump
Appendix A - Data sheet for Watson Marlow 621 duplex pump properties with different hoses.

49
Appendix B – Data for hoses
Appendix B - Tubing datasheet from Watson-Marlow.

51
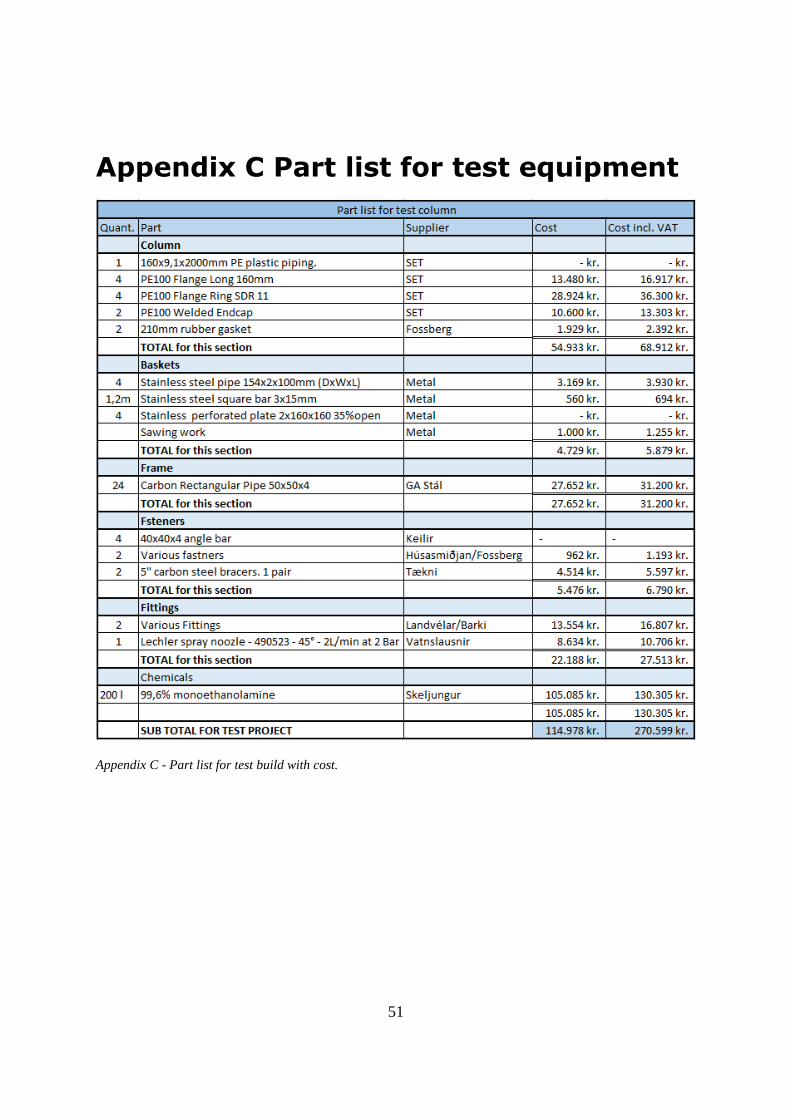
Appendix C Part list for test equipment
Appendix C - Part list for test build with cost.


53
Appendix D – Work diagram 1
Appendix D - Work diagram of fastener piece.

55
Appendix E – Work diagram 2
Appendix E - Work drawing of frame ass.


57
Appendix F – Work diagram 3
Appendix F - Sieve assembly.

59
Appendix G – Work diagram 4
Appendix G - Pipe section for sieve.


61
Appendix H – Work diagram 5
Appendix H - Cross section of sieve ass.


63
Appendix E – Calculations of column
diameter
Appendix I - Calculation of K4 and FLV diameter

64

65
Appendix J – Raw data from test 2
Minutes CH4 out
CH4 in
CO2 out
CO2 in
CO2 out / CO2 in
O2 out O2 in
BALANCE out
BALANCE in
N2+CH4 out
N2+CH4 in
Amine pH
Temp. H2S out
H2S in
(min) (%) (%) (%) (%) (%) (%) (%) (%) (%) (%) (%) - °C (ppm) (ppm)
0 74 39,1 2,5 32 92% 5 6,1 18,5 22,8 92,5 61,9 12,11 8,5 1 94
3 74,8 39,1 5,2 32 84% 3,7 6,1 16,3 22,8 91,1 61,9 12,09 8,7 1 94
6 73,2 39,1 5,4 32 83% 3,8 6,1 17,6 22,8 90,8 61,9 12,01 9,5 1 94
9 72,5 41,8 5,8 33,9 83% 3,8 5,2 17,9 19,1 90,4 60,9 11,95 10,2 0 96
12 72 41,8 6,4 33,9 81% 3,7 5,2 17,9 19,1 89,9 60,9 11,88 10,8 1 96
15 70,9 41,8 7 33,9 79% 3,8 5,2 18,3 19,1 89,2 60,9 11,83 11,2 1 96
18 70,9 41,8 8 33,9 76% 3,6 5,2 17,5 19,1 88,4 60,9 11,73 11,8 1 96
21 69,8 41,8 9 33,9 73% 3,7 5,2 17,5 19,1 87,3 60,9 11,7 12,3 1 96
24 70,5 41,8 9 33,9 73% 3,6 5,2 16,9 19,1 87,4 60,9 11,68 12,9 1 96
27 70,2 41,8 9,2 33,9 73% 3,7 5,2 16,9 19,1 87,1 60,9 11,63 13,6 1 96
30 70,1 41,8 9,9 33,9 71% 3,6 5,2 16,4 19,1 86,5 60,9 11,58 14,1 1 96
33 69,3 41,8 10,5 33,9 69% 3,6 5,2 16,6 19,1 85,9 60,9 11,54 14,6 2 96
36 69,3 41,8 10,8 33,9 68% 3,6 5,2 16,3 19,1 85,6 60,9 11,49 15,3 2 96
42 68,5 41,8 12,4 33,9 63% 3,5 5,2 15,6 19,1 84,1 60,9 11,45 15,7 4 96
45 67,7 41,8 14,3 33,9 58% 3,5 5,2 14,5 19,1 82,2 60,9 11,39 16,3 4 96
48 67,7 41,8 14,1 33,9 58% 3,6 5,2 14,6 19,1 82,3 60,9 11,37 16,6 4 96
51 66,7 42,5 15,5 35 56% 3,5 4,5 14,3 18 81 60,5 11,35 16,8 6 115
54 66 42,5 16,4 35 53% 3,5 4,5 14,1 18 80,1 60,5 11,32 17 7 115
57 65,8 42,5 16,6 35 53% 3,5 4,5 14,1 18 79,9 60,5 11,3 17,2 8 115
60 65,5 42,5 17,2 35 51% 3,5 4,5 13,8 18 79,3 60,5 11,29 17,4 9 115

66
63 65,1 42,5 18 35 49% 3,4 4,5 13,5 18 78,6 60,5 11,27 17,6 10 115
69 63,7 42,5 20 35 43% 3,2 4,5 13,1 18 76,8 60,5 11,23 18,1 14 115
72 63,7 42,5 20,5 35 41% 3,2 4,5 12,6 18 76,3 60,5 11,21 18,2 16 115
75 62,6 42,5 21,1 35 40% 3,3 4,5 13 18 75,6 60,5 11,19 18,4 17 115
78 62,5 44,4 22,2 35,7 38% 3 4,1 12,3 15,8 74,8 60,2 11,16 18,6 19 121
81 62,1 44,4 21,9 35,7 39% 3,1 4,1 12,9 15,8 75 60,2 11,14 18,8 19 121
84 61,7 44,4 23 35,7 36% 3 4,1 12,3 15,8 74 60,2 11,13 18,9 22 121
87 60,9 44,4 23,3 35,7 35% 3,1 4,1 12,7 15,8 73,6 60,2 11,12 18,9 23 121
90 61,1 44,4 23,1 35,7 35% 3,1 4,1 12,7 15,8 73,8 60,2 11,11 19 23 121
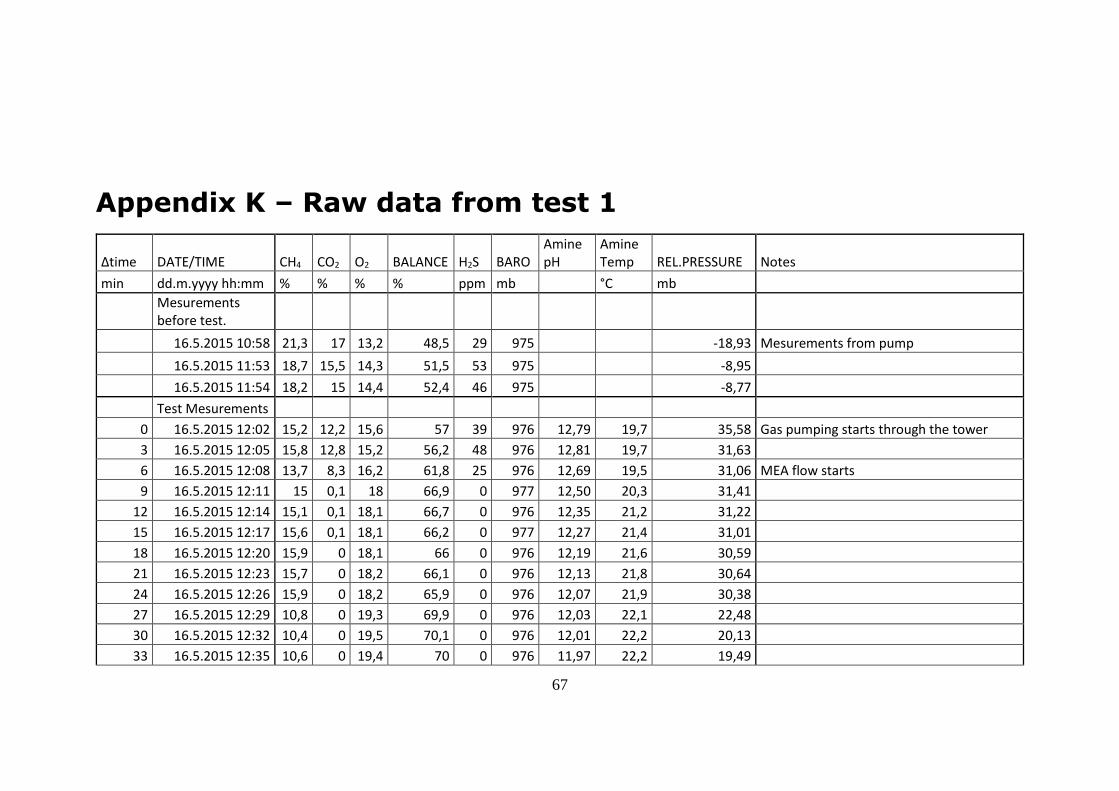
67
Appendix K – Raw data from test 1
Δtime DATE/TIME CH4 CO2 O2 BALANCE H2S BARO Amine pH
Amine Temp REL.PRESSURE Notes
min dd.m.yyyy hh:mm % % % % ppm mb °C mb
Mesurements before test.
16.5.2015 10:58 21,3 17 13,2 48,5 29 975 -18,93 Mesurements from pump
16.5.2015 11:53 18,7 15,5 14,3 51,5 53 975 -8,95
16.5.2015 11:54 18,2 15 14,4 52,4 46 975 -8,77
Test Mesurements
0 16.5.2015 12:02 15,2 12,2 15,6 57 39 976 12,79 19,7 35,58 Gas pumping starts through the tower
3 16.5.2015 12:05 15,8 12,8 15,2 56,2 48 976 12,81 19,7 31,63
6 16.5.2015 12:08 13,7 8,3 16,2 61,8 25 976 12,69 19,5 31,06 MEA flow starts
9 16.5.2015 12:11 15 0,1 18 66,9 0 977 12,50 20,3 31,41
12 16.5.2015 12:14 15,1 0,1 18,1 66,7 0 976 12,35 21,2 31,22
15 16.5.2015 12:17 15,6 0,1 18,1 66,2 0 977 12,27 21,4 31,01
18 16.5.2015 12:20 15,9 0 18,1 66 0 976 12,19 21,6 30,59
21 16.5.2015 12:23 15,7 0 18,2 66,1 0 976 12,13 21,8 30,64
24 16.5.2015 12:26 15,9 0 18,2 65,9 0 976 12,07 21,9 30,38
27 16.5.2015 12:29 10,8 0 19,3 69,9 0 976 12,03 22,1 22,48
30 16.5.2015 12:32 10,4 0 19,5 70,1 0 976 12,01 22,2 20,13
33 16.5.2015 12:35 10,6 0 19,4 70 0 976 11,97 22,2 19,49

68
36 16.5.2015 12:38 10,8 0 19,6 69,6 0 976 11,91 22,4 -2,55 Water build up in test hose
39 16.5.2015 12:41 16,1 0 18,2 65,7 0 976 11,88 22,5 33,98
42 16.5.2015 12:44 16,2 0 18,2 65,6 0 977 11,86 22,6 33,09
45 16.5.2015 12:47 16,9 0 18,2 64,9 0 977 11,83 22,7 32,28
48 16.5.2015 12:50 15,9 0 18,4 65,7 0 977 11,75 22,9 32,41
51 16.5.2015 12:53 15,7 0 18,5 65,8 0 977 11,75 23,0 32,62
54 16.5.2015 12:56 15,8 0 18,5 65,7 0 977 11,71 23,2 32,43
57 16.5.2015 12:59 15,4 0 18,6 66 0 977 11,67 23,3 32,62
60 16.5.2015 13:02 15,7 0 18,6 65,7 0 977 11,67 23,3 32,52 Test ends
Post test mesurments
16.5.2015 13:07 13,5 10,5 16,9 59,1 0 978 -3,75 Mesurment from pump after test
16.5.2015 13:10 56,9 44,9 0,2 0 124 979 -0,35 Mesurment from borehole after test
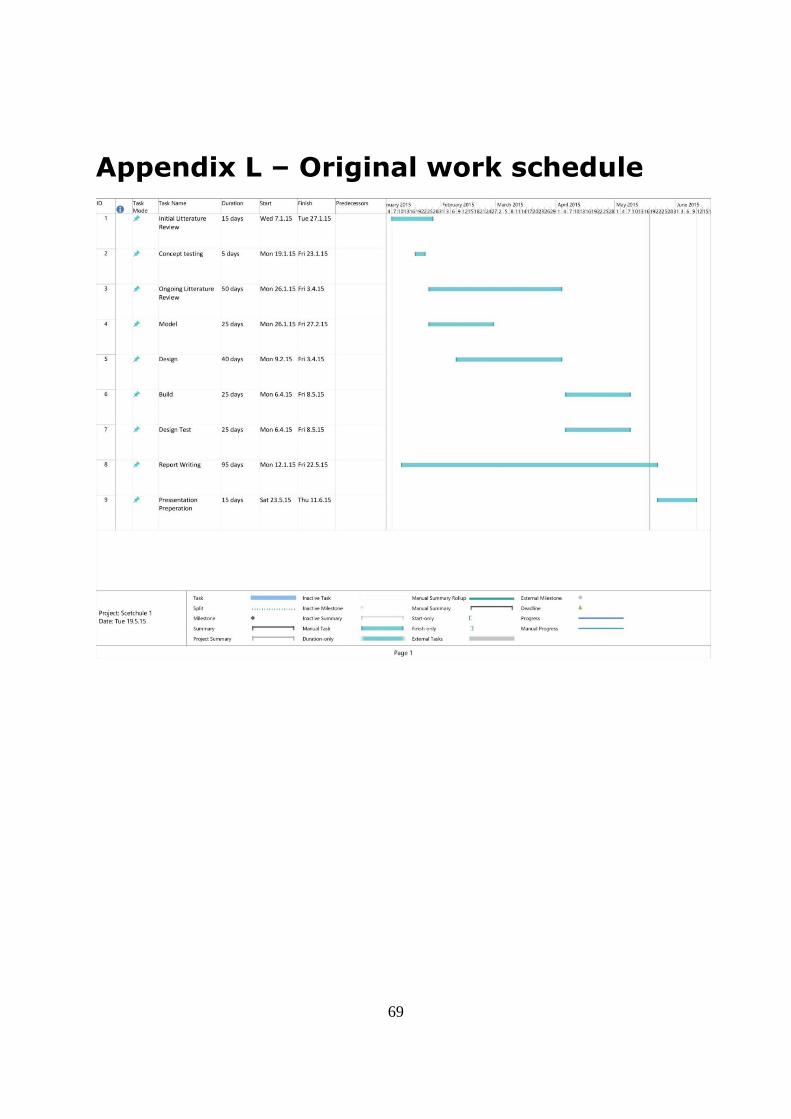
69
Appendix L – Original work schedule

70

71
Appendix M – Refined Work Schedule


73
Appendix N – Calculations from
previous version


75
Appendix O - Calculations for
temperature calculations