biogeosciences nutrient dynamics in tropical rivers
TRANSCRIPT

Biogeosciences, 11, 481–506, 2014www.biogeosciences.net/11/481/2014/doi:10.5194/bg-11-481-2014© Author(s) 2014. CC Attribution 3.0 License.
Biogeosciences
Open A
ccess
Nutrient dynamics in tropical rivers, lagoons, and coastalecosystems of eastern Hainan Island, South China Sea
R. H. Li 1, S. M. Liu1, Y. W. Li 1,3, G. L. Zhang1, J. L. Ren1, and J. Zhang2
1Key Laboratory of Marine Chemistry Theory and Technology, Ministry of Education, Ocean University of China, Qingdaocolobrative innovation center of marine science and technology, Qingdao 266100, China2State Key Laboratory of Estuarine and Coastal Research, East China Normal University, Shanghai 200062, China3now at: College of Chemistry and Chemical Engineering, Taishan University, Tai’an 271000, China
Correspondence to:S. M. Liu ([email protected])
Received: 10 April 2013 – Published in Biogeosciences Discuss.: 5 June 2013Revised: 8 December 2013 – Accepted: 10 December 2013 – Published: 30 January 2014
Abstract. Nutrient dynamics based on field observationsmade along the eastern Hainan Island during the period2006–2009 were investigated to understand nutrient biogeo-chemical processes, and to provide an overview of humanperturbations of coastal ecosystems in this tropical region.The rivers showed seasonal variations in nutrient concen-trations, with enrichment of dissolved inorganic nitrogenand dissolved silicate, and depletion of PO3−
4 . High riverineconcentrations of nitrate mainly originated from agriculturalfertilizer inputs. The DIN : PO3−
4 ratios ranged from 37 to1063, suggesting preferential depletion of PO3−
4 relative tonitrogen in rivers. Chemical weathering in the drainage areamight explain the high levels of dissolved silicate. Aquacul-ture ponds contained high concentrations of NH+
4 and dis-solved organic nitrogen. The particulate phosphorus concen-trations in the study area were lower than those reported forestuaries worldwide. The particulate silicate levels in riversand lagoons were lower than the global average level. Nu-trient biogeochemistry in coastal areas was affected by hu-man activities (e.g., aquaculture, agriculture), and by nat-ural phenomena including typhoons. The nutrient concen-trations in coastal waters were low because of dispersionof land-derived nutrients in the sea. Nutrient budgets werebuilt based on a steady-state box model, which showed thatriverine fluxes are magnified by estuarine processes (e.g., re-generation, desorption) in estuaries and Laoyehai Lagoon,but not in Xiaohai Lagoon. Riverine and groundwater inputswere the major sources of nutrients to Xiaohai and Laoye-hai lagoons, respectively, and riverine inputs and aquacul-ture effluents were the major sources for the eastern coast
of Hainan Island. Nutrient inputs to the coastal ecosystemincreased with typhoon-induced runoff of rainwater, eluci-dating the important influence of typhoons on small tropicalrivers.
1 Introduction
Estuaries and coastal areas are regions of high populationdensity and intense human activities. The comprise approx-imately 7 % of the surface area of the world’s ocean, whileaccounting for 30 % of the total net oceanic primary produc-tion (Alongi, 1998; Gattuso et al., 1998; Dürr et al., 2011).The rapid increase of human activities has increased nutri-ent transport from land to sea in the past decades, resultingin environmental deterioration and changes to biogeochem-ical processes (Seitzing et al., 2005; Halpern et al., 2008;Qu and Kroeze, 2010). Tropical estuaries are the most bio-geochemically active zones, and are more easily affected byanthropogenic nutrient loading than estuaries at higher lati-tudes (Yule et al., 2010; Smith et al., 2012). This is particu-larly the case for the tropical South and Southeast Asia riversand coastal region, which have been extensively modified byhuman activities, and for catchments, which have been de-graded as a consequence of rapid economic development andpopulation growth (Jennerjahn et al., 2008; Yule et al., 2010).These systems are highly sensitive to natural environmentalchanges and human activities, including land use, geomor-phologic evolution (Jia et al., 2012) and deforestation (Me-unier et al., 2011). However, the nutrient characteristics and
Published by Copernicus Publications on behalf of the European Geosciences Union.

482 R. H. Li et al.: Nutrient dynamics in tropical rivers, lagoons, and coastal ecosystems
Table 1. Length, drainage area and annual average freshwater dis-charge of rivers of the eastern Hainan Island. Wenchanghe (WC)and Wenjiaohe (WJ), in the city of Wenchang; Wanquanhe (WQ),Jiuqujiang (JQJ) and Longgunhe (LG), in the city of Qionghai;Longtouhe (LT), Longweihe (LW) and Taiyanghe (TY), in the cityof Wanning (Wang, 2002; Zhang et al., 2006).
Source Length Drainage Area Discharge(km) (km2) (m3 s−1)
WC Douniu (town) 37.1 380.9 9.1WJ Pokou (village) 56.0 522.0 11.6WQ Wuzhi Mountains 163.0 3693.0 163.9JQJ Wangtianlang 50.0 279.8 10.2LG Xianggen Ridge 38.6 145.7 6.0LT Huangzhu Ridge 42.2 140.1 6.1LW Liulian Ridge 61.6 197.0 7.5TY Changsha Ridge 82.5 576.3 23.8
the processing of nutrients in tropical rivers and estuaries arepoorly studied relative to those in temperate zones (Thomaset al., 2004; Smith et al., 2012).
The South China Sea (SCS) is an oligotrophic ocean lo-cated in the tropical to subtropical western Pacific Ocean.It has a total area of approximately 3.5× 10⁶ km2, and isone of the largest marginal seas in the world (Xu et al.,2008). The SCS is dominated by the East Asian monsoon(Su, 2004), with southwesterly winds prevailing in summerand autumn, and northeasterly winds in winter and spring(Chen and Chen, 2006). Summer upwelling and cyclonic ed-dies driven by the southwest monsoon are among the mostimportant physical processes in the coastal waters of thenorthern SCS (Li et al., 2010). With a water discharge of482.1× 109 m3 yr−1, Pearl River, is the largest river that dis-charges directly into the northern SCS (Liu et al., 2009).Harmful algal blooms have frequently occurred off PearlRiver and enormous economic losses in aquaculture havebeen caused because of the increasing load of nutrients inrecent decades as a result of economic growth and urban de-velopment (Wang et al., 2008). Many estuary eutrophicationstudies have focused on this large estuary system (Yin, 2002;Xu et al., 2008; Qiu et al., 2010), but nutrient conditions insmaller rivers and well-flushed estuaries are less well known,particularly along the eastern coast of Hainan Island (Fig. 1).
Our study focused on the eastern coast of Hainan Is-land, which is a tropical coastal environment affected bynatural processes (e.g., monsoons, upwelling and river dis-charge) and human activities (e.g., agriculture, aquacultureand tourism) (Chai et al., 2001; Jing et al., 2009; Su et al.,2011a). The study area represents a diverse range of geo-morphological settings and biological habitat types. It has anumber of small mountainous rivers (Table 1), dense man-grove vegetation, and a shallow shelf with coral reefs andseagrass beds (Roder et al., 2013). Agriculture is the majorland use on the island. Terrigenous materials are transported
Other corrections as follow:
The symbols could not show in colour, hence, we modified the station map and
the caption. The new map and caption showed below. Please take the place of
the old map in the proof.
Fig. 1. Location map of the study area and stations for the sampling cruises along the eastern
Hainan Island during 2006–2009. (a): Sampling stations for the cruises in rivers and estuaries, and
for shrimp ponds, groundwater and lagoons of the South China Sea in December 2006 (△), August
2007 (○), June–August 2008 (◇), March–April 2009 (□), and June–August 2009 (▽). Anchor
stations sampled in August 2007 (T2-3) and June 2008 (T2-2). The inset at the lower right (a) is
the location map. (b): Sampling stations in coastal waters of the northern South China Sea (SCS)
in August 2007 (○), June–August 2008 (◇), August 2008 (◄), March–April 2009 (□) and
June–August 2009 (▽) (16: anchor station).
Fig. 1. Location map of the study area and stations for the sam-pling cruises along the eastern Hainan Island during 2006–2009.(a): Sampling stations for the cruises in rivers and estuaries, andfor shrimp ponds, groundwater and lagoons of the South China Seain December 2006 (M), August 2007 (◦), June–August 2008 (�),March–April 2009 (�), and June–August 2009 (O). Anchor stationssampled in August 2007 (T2-3) and June 2008 (T2-2). The inset atthe lower right(a) is the location map.(b): Sampling stations incoastal waters of the northern South China Sea (SCS) in August2007 (◦), June–August 2008 (�), August 2008 (J), March–April2009 (�) and June–August 2009 (O) (16: anchor station).
from freshwater to brackish water, and disperse in mangroveecotone and the shallow estuary. Economic development hasincreased nutrient loads and influenced nutrient cycling incoastal region, resulting in accelerated degeneration of thecoastal ecosystems and the occurrence of eutrophication (Panet al., 2007). Over recent decades many coastal mangrove ar-eas have been lost because of aquaculture, tourism, residen-tial and golf course developments. The mangrove forests ofHainan Island covered approximately 10 000 ha in 1972, butby 2003 approximately 57 % of these forests had been lostthrough deforestation and reclamation for aquaculture ponds(Zhou, 2004). The study coastal lagoons are subject to in-tense human impacts that have caused significant changesin hydrology, increased anthropogenic nutrient delivery, andchanged the coral reef ecosystems (Roder et al., 2013; Zhang
Biogeosciences, 11, 481–506, 2014 www.biogeosciences.net/11/481/2014/

R. H. Li et al.: Nutrient dynamics in tropical rivers, lagoons, and coastal ecosystems 483
Fig. 1. continued
I agree with other editing changes that made by editor in our manuscript.
Fig. 1.Continued.
et al., 2013). Rivers discharging into the SCS along the east-ern Hainan Island are all relatively small (Table 1), and aremore readily affected by human activities and environmen-tal change than large river systems. In addition, Hainan Is-land is frequently affected by tropical storms and typhoonsbetween August and September (Zhang et al., 2010); whichbring large amounts of rainfall and lead to a rapid hydro-logical response (Mao et al., 2006). Nutrient loads and phy-toplankton biomass can increase in response to typhoon-related floods. Typhoons play an important role in enhanc-ing oceanic primary productivity in oligotrophic ocean wa-ters (Ning et al., 2004), especially in typhoon-dominated seas(Zheng and Tang, 2007; Zhao et al., 2009). Under the com-bined effects of human activities and natural events, coastalecosystems of tropical region are vulnerable to these effects,which can accelerate their degradation. Hence, it is essen-tial to understand sources of nutrients and biogeochemicalcycling processes in tropical coastal region.
Six cruises were carried out along the eastern Hainan Is-land during the period 2006–2009. Here we present the re-sults of studies of nutrient dynamics in water and suspendedmatter from tropical rivers, their associated lagoons, and ad-jacent coast of the eastern Hainan Island. The aim of thisstudy was to characterize spatiotemporal variations in thedistribution of nutrients in this tropical shallow coastal regionin order to delineate nutrient dynamics and biogeochemistryunder the influence of natural and anthropogenic factors, and
to assess the impact of human activities on the ecosystems ofthe receiving coastal waters.
2 Materials and methods
2.1 Study area
Hainan Island is located at the southernmost tip of China; itis the largest island in the SCS, and is separated from main-land China by Qiongzhou Strait. It has a coastline lengthof 1550 km, covers a land area of 35.4× 10³ km2, and in2011 had a population of nearly 9.08 million (Hainan Statis-tical Yearbook, 2012). The area is characterized by a tropicalmonsoonal climate (Zeng and Zeng, 1989), with northerlywinds prevailing in winter and southerly winds dominatingin summer (Wang, 2002). Annual rainfall is 1600–1800 mm,and approximately 80 % of this falls during the wet season,i.e., from May to October (Mao et al., 2006). The coast issubject to mixed semidiurnal microtides with typical tidalranges< 1 m, and approximately 1.6 m during neap andspring tides (Krumme et al., 2012). Coastal upwelling occursalong the eastern coast of Hainan Island, driven by strongsouthwest monsoon and topography (Jing et al., 2009; Suand Pohlmann, 2009). The upwelling commences in Apriland ends in October, and extends from 30 m water depth to10 km offshore (Li et al., 2011a).
The study area, along the eastern Hainan Island fromTongguling to Laoyehai (LYH) Lagoon (Fig. 1), has a narrow
www.biogeosciences.net/11/481/2014/ Biogeosciences, 11, 481–506, 2014

484 R. H. Li et al.: Nutrient dynamics in tropical rivers, lagoons, and coastal ecosystems
continental shelf from water depth 0 to 100 m (Tang et al.,2003), and is open to the sea. Four lagoons along the coastwere formed in a transgression process during the Quater-nary period (Wang et al., 2006). These shallow lagoons aresubject to freshwater and marine interactions; they are con-nected to the open sea via narrow channels, and are semi-closed by sand barriers. Base on tidal amplitude, Bamen Bayis considered to be a lagoonal inlet. The Wenchanghe (WC)and Wenjiaohe (WJ) rivers empty into the kidney-shapedBamen Bay, which connects to the sea through an approx-imately 9.0 km long narrow natural channel (Wang et al.,2006). An outer semi-closed bay, named Gaolong Bay, wasformed through local hydrodynamics and sediment transport.The Wenchanghe/Wenjiaohe Estuary (WWE) is character-ized by mixed semi-diurnal microtides, having a mean tidalamplitude< 2 m (Unger et al., 2013). Riverine input, ground-water discharge and aquaculture effluents have been shownto be the major source of nutrients entering the estuary (Liuet al., 2011).
The Wanquanhe (WQ) is the third largest river on HainanIsland. It empties directly into the SCS, where a dynamic typ-ical lagoon–tidal-inlet–barrier system has formed (Zhu et al.,2005). Approximately 3.9× 10⁶ t yr−1 sediment is loaded tothe estuary (Wang et al., 2006). The estuary is comprised oftwo semi-closed parts: the WQ tidal inlet and Shamei La-goon. The Tayanghe (Ty) and Lunyanghe (LY) rivers flowthrough cultivated land and enter the WQ from the north. TheJiuqujiang (JQJ) and Longgunhe (LG) empty into ShameiLagoon from the west and south, respectively (Wang, 2002).The Wanquanhe Estuary (WQE) has an irregular diurnal mi-crotidal regime with a mean range of approximately 0.7–0.8 m (Zhu et al., 2005). The water residence time is esti-mated to be 0.2–4.7 days. Riverine input is the major sourceof nutrients to the estuary (Li et al., 2013). The salinity ofShamei Lagoon has been reduced to< 1 because of aquacul-ture activities, which have reduced the tidal hydrodynamics(Ge et al., 2004; Jia et al., 2012).
Xiaohai (XH) Lagoon is a typical well-developed tidal-inlet–lagoon system, and is the largest lagoon on HainanIsland. The approximate surface area of the gourd-shapedlagoon was 49 km2 in 1960, and has decreased to 44 km2
(Wang et al., 2006); it now has a mean water depth of 1.5 mbecause of land reclamation and aquaculture activities (Gonget al., 2008). Eight small rivers empty into XH Lagoon withannual mean total discharge of 26.5 m3 s−1. The lagoon con-nects to the sea through a narrow tidal channel, in whichapproximately 5000 fishing cages have been installed since1986 (Gong et al., 2008). The lagoon is a significant fishingport on the eastern coast of Hainan Island. Aquaculture activ-ities have expanded enormously in recent decades, and thesehave resulted in deterioration of the tidal flushing efficiency.The water residence time in the lagoon has increased from45 to 71 days (Gong et al., 2008).
LYH Lagoon has a surface area of approximately 26 km2
(Ji et al., 2013) and is comprised of two parts: (i) the inner
bay, which is little affected by the tide and contains manyfish ponds; and (ii) the approximately 8 km tidal channel thatconnects to the sea and contains a large number of fish farm-ing cages. The width of the tidal channel has narrowed from425 m , which it was in the 1960s, to 75 m at present (Wanget al., 2006). Three rivers contribute a very small discharge(approximately 0.4 m s−1) directly into LYH Lagoon (Ji etal., 2013).
2.2 Sampling
Six sampling cruises were carried out along the coast of east-ern Hainan Island: on 7–15 December 2006 (winter), 12–28 August 2007 (summer), 23 July–13 August 2008 (sum-mer), 25 August–6 September 2008 (summer), 27 March–14 April 2009 (spring), and 23 July–8 August 2009 (sum-mer). A broad range of water bodies were included in thevarious sampling stations (Fig. 1). We considered the cruisesin August 2007, July–August 2008 and July–August 2009to have occurred in the wet season, and those in Decem-ber 2006 and March–April 2009 to have occurred in dryseason. Anchor stations were established off Gaolong Bay,and were monitored for 25 h in August 2007, in July 2008,and in July 2009. During sampling cruises in July 2008and April 2009, water samples were collected from ChangqiBay, which is the second-largest aquaculture production areaon Hainan Island. To assess human impacts on coral reefs,coastal water samples within the coral reef region were col-lected from a small boat. Water samples were also collectedfrom shrimp ponds and from wells (groundwater) locatedwithin the study area.
Water samples from rivers and shrimp ponds were col-lected from the river/pond bank or from a small boat, us-ing 1l acid-cleaned polyethylene bottles attached to the endof a fiberglass reinforced plastic pole. For the estuaries andlagoons, water sampling was based on the salinity gradi-ent. Surface water samples were collected in acid-cleanedpolyethylene bottles during spring tides. Seawater sampleswere collected from various depths in 10 L Niskin bottles,with sampling based on CTD (SBE® 25, Seabird, USA)readings. A WTM Multiline F/Set3 multiparameter probewas used to measure water temperature and salinity in bothrivers and estuaries. Coastal water temperature and salin-ity were measured using the CTD profiler. Samples fordissolved nutrients-testing were filtered through acid pre-cleaned 0.45 µm pore size cellulose acetate filters. The fil-trates were immediately fixed by the addition of saturatedHgCl2 solution and taken back to laboratory for analysis.The filters were dried at 45◦C and weighed to determine themass of suspended particulate matter (SPM), particulate inor-ganic phosphorus (PIP), and particulate organic phosphorus(POP). Samples for particulate biogenic silicon (PBSi) andlithogenic silicon (LSi) were filtered through 47 mm poly-carbonate membrane filters (0.4 µm pore size) that had beendried at 45◦C.
Biogeosciences, 11, 481–506, 2014 www.biogeosciences.net/11/481/2014/

R. H. Li et al.: Nutrient dynamics in tropical rivers, lagoons, and coastal ecosystems 485
2.3 Chemical analysis
Dissolved nutrient concentrations were determined using aSkalar SANplus AutoAnalyzer (Liu et al., 2011). Total dis-solved nitrogen (TDN) and phosphorus (TDP) were mea-sured according to the methods of Grasshoff et al. (1999).The analytical precision for NO−3 , NO−
2 , NH+
4 , PO3−
4 , dis-solved silicate (DSi), TDN and TDP was< 5 %. The con-centration of dissolved inorganic nitrogen (DIN) is thesum of NO−
3 , NO−
2 and NH+
4 . The concentrations of dis-solved organic nitrogen (DON) and phosphorus (DOP)were estimated by subtracting DIN from TDN and PO3−
4from TDP, respectively.
Particulate phosphorus (PP) in SPM was measured usingthe methods of Aspila et al. (1976). The extracted PO3−
4 wasmeasured by spectrophotometry. The analytical precision ofPP, PIP, and POP was< 5 % (Li et al., 2011b). The concen-tration of POP was estimated by subtracting PIP from PP.The concentration of total phosphorus (TP) was calculatedas the sum of PP and TDP. PBSi and LSi in SPM were mea-sured based on the methods of Ragueneau et al. (2005). Theextracted DSi was measured by spectrophotometry. The an-alytical precision of PBSi and LSi measurements was 7 %(n = 7) and 8 % (n = 7), respectively (Li et al., 2011b).
2.4 Lagoon nutrient budgets
Dissolved and particulate nutrient budgets for the coastal la-goon systems in our study were constructed based on a boxmodel designed by Land–Ocean Interactions in the CoastalZone (LOICZ) (Gordon et al., 1996). This model has beenwidely used to construct dissolved and particulate nutrientbudgets in estuarine and coastal ecosystems in order to un-derstand the internal biogeochemical processes and exter-nal nutrient inputs of the system being studied (Fang, 2004;Savchuk, 2005; Liu et al., 2009). Hence, both dissolved andparticulate nutrient budgets in our study area were estimatedbased on the box model. In our model, we assumed that thestudy systems were in a steady state, and each estuary/lagoonwas treated as a single box that mixed well, except that a two-box model was used as a function of different water residencetime between Shamei Lagoon and the WQ tidal inlet in theWQE.
Briefly, the water mass balance (Eq. 1), salinity balance(Eq. 2), and the non-conservative fluxes of nutrient elements(Eq. 3) based on nutrient concentrations and water budgetswere estimated as follows:
VR = Vin − Vout = −VQ − VP− VG − VW + VE. (1)
VX(S1 − S2) = SRVR. (2)
1Y =
∑outflux−
∑influx = VRCR + VXCX − VQCQ − VPCP. (3)
whereVR is the residual flow, andVQ, VP, VG, VW, VE, Vin,Vout andVX are the river discharge, precipitation, groundwa-ter, wastewater, evaporation, inflow of water to the systemof interest, outflow of water from the system of interest, andthe mixing flow between the two systems, respectively. Thevolume of aquaculture effluents directly discharged into thesystem of interest is not considered, as data is limited. Weassumed that the salinity of fresh water (VQ, VP andVE) was0. In addition,SR = (S1 +S2)/2. S1 andS2 in Eq. (2) refer tothe average salinity of the system of interest and the adjacentsystem, respectively. Hence, the total water exchange time(τ ) of the system of interest was estimated from the ratio ofVS to (VR + VX), whereVS is the volume of the system.In Eq. (3),CQ, CP,CR andCX are the the average concentra-tions of nutrients in the river discharge, the precipitation, theresidual flow and the mixing flow, respectively.CR andCXequate to (C1+C2)/2 and (C1−C2), respectively.C1 andC2are the average concentrations of nutrients in the system ofinterest and the adjacent system, respectively. A negative orpositive sign for1Y indicates that the system of interest wasa sink or a source, respectively.
3 Results
3.1 Hydrographic conditions
Surface water temperature was lower in the dry season (23.3–28.7◦C) than in the wet season (27.0–33.6◦C), reflectingthe seasonality of this tropical system. For XH Lagoon, thesalinity varied from 1.8 to 10.6 during the study period. Thesalinity varied greatly in LYH Lagoon (9.1–33.2) with salin-ity gradients increasing towards the mouth of the lagoon(Fig. 2b). The low salinity in the inner part of LYH Lagoon(9.1–16) and XH Lagoon indicate that these carried a mixtureof fish-farming and freshwater discharge.
SPM concentrations also showed clear seasonal variation.SPM concentration ranged from 7.85 mg L−1 to 46.3 mg L−1
in the WC (mean 20.7 mg L−1), and a peak (46.3 mg L−1)
was observed following the typhoon event in 2008. SPMconcentrations in the WQ were generally similar except dur-ing the 2009 spring cruise, when SPM concentrations rangedfrom 7.47 mg L−1 to 71.1 mg L−1 due to large river discharge(maximum 278 m3 s−1) associated with the first rain eventin spring 2009. SPM concentrations in XH Lagoon werehigher during the wet season than during the dry season, withmeans of 23.6± 15.2 mg L−1 and 9.94± 3.23 mg L−1, re-spectively. In LYH Lagoon SPM concentrations ranged from2.08 to 20.6 mg L−1 (mean 8.64 mg L−1), and were lowerthan in XH Lagoon. The SPM levels in coastal water (mean3.47 mg L−1) were lower than in rivers and the lagoons, indi-cating effective removal from the lagoons and coastal region.
A number of different water masses were observable incoastal water. The surface water temperature in coastal in-creased from south to north in August 2007 and 2008, and
www.biogeosciences.net/11/481/2014/ Biogeosciences, 11, 481–506, 2014

486 R. H. Li et al.: Nutrient dynamics in tropical rivers, lagoons, and coastal ecosystems
43
Figure 2 Spatial distributions of salinity and nutrients (μM) as a function of salinity in surface
water of Xiaohai (a) and Laoyehai (b) lagoons during the study period.
a
Fig. 2. Spatial distributions of salinity and nutrients (µM) as a function of salinity in surface waters of the Xiaohai(a) and Laoyehai(b)lagoons during the study period.
increased from north to south in April 2009 (Fig. 3). Thecruise in August 2007 took place following a typhoon event,which may account for the lower temperatures found relativeto those in July–August 2008, and may have led to low salin-ity outside the lagoons. Surface salinity ranged from 22.0 to34.2 in summer and 29.7–32.9 in spring. In addition, sur-face salinity gradually increased from nearshore to offshoreregions, and the salinity isohalines were parallel to the coast-line (Fig. 3). A cyclonic eddy appeared at 18.5◦ N with a coldcenter near Bamen Bay (Su et al., 2011a), which may haveled to the high temperature/low salinity center observed dur-
ing the August–September 2008 cruise (Fig. 3d). Thermoha-line stratification was found near the surface at all stationsduring the 2007 and 2008 summer cruises. The temperatureisopleth in summer gradually increased from the bottom wa-ters to the surface (Fig. S1 a, b).
3.2 Nutrients in rivers
The nutrient concentrations in rivers along the eastern coastof Hainan Island varied greatly during the study period (Ta-ble 2). Rivers were generally enriched with DIN relative toPO3−
4 , with the DIN : PO3−
4 ratios ranging between 37 and
Biogeosciences, 11, 481–506, 2014 www.biogeosciences.net/11/481/2014/

R. H. Li et al.: Nutrient dynamics in tropical rivers, lagoons, and coastal ecosystems 487
44
b
Fig. 2.Continued.
1063 (Table 2). DIN was dominated by NO−
3 , which ac-counted for 56–98 % of DIN during the wet and dry seasons.The concentrations of NO−2 in rivers (generally> 2.0 µM) atWenchang were higher than those at Qionghai city, with theexception of the JQJ in August 2009 (Table 2). The PO3−
4concentrations were< 1.0 µM during all cruises except forthe JQJ in August 2009. The concentrations of DOP in riversduring the wet season represented 52–97 % of TDP, and werehigher than in the dry season, while the DON concentrations
in the dry season were higher than in the wet season (Ta-ble 2). The average concentration of DSi (mean 191 µM) washigh in rivers in our study area, especially in the WQ (mean322 µM).
Particulate nutrient investigations were only carried outin the WC, WJ and WQ rivers. The PP concentrations var-ied from 0.43 µM to 4.50 µM, and the mean concentrations(1.48 µM) accounted for 35, 59 and 31 % of TP in theWC, WJ and WQ rivers, respectively. In addition, the PIP
www.biogeosciences.net/11/481/2014/ Biogeosciences, 11, 481–506, 2014

488 R. H. Li et al.: Nutrient dynamics in tropical rivers, lagoons, and coastal ecosystems
Table 2. Mean± SD for nutrient concentrations (µmol L−1) and molar ratios in surface water of the Wenchanghe (WC), Wenjiaohe (WJ),Wanquanhe (WQ), shrimp ponds and groundwater (GW), and nutrient concentration (µmol L−1) in other small rivers along the easternHainan Island in different seasons during the investigation periods (wet season: May to October; dry season: November to April). LY:Lunyanghe; YD: Yanduihe; SL: Shanlonghe; Ty: Tayanghe; TY: Taiyanghe. n.a.: no data.
season NO−3 NO−
2 NH+
4 DON PO3−
4 DOP PIP POP Si(OH)4 PBSi LSi DIN/DIP Si/DIN
WC dry 69.5± 29.4 2.22± 0.93 10.4± 5.79 40.9± 29.1 0.55± 0.48 0.34± 0.20 1.22± 0.37 0.99± 0.53 167± 18.4 4.28± 3.77 69.8± 44.4 232± 160 2.3± 0.9WC wet 65.4± 2.61 2.79± 1.25 31.9± 22.3 18.7± 5.56 0.66± 0.36 2.14± 2.39 1.34± 0.21 0.93± 0.17 151± 25.6 3.28± 3.03 159± 178 171± 67 1.6± 0.3WJ dry 90.2± 1.53 2.86± 0.10 3.92± 0.77 59.3± 1.78 1.00± 0.09 0.50± 0.26 2.31± 0.81 1.38± 0.21 97.8± 1.92 20.4± 4.52 269± 50.0 97± 7.9 1.0± 0.04WJ wet 23.8± 3.10 2.18± 0.13 7.72± 0.56 52.9± 14.5 0.35± 0.13 2.42± 1.23 1.25± 0.10 1.60± 0.87 118± 6.43 6.20± 3.66 89.3± 37.9 99± 27 4.7± 2.2WQ dry 52.4± 16.5 1.02± 0.42 4.80± 2.22 13.5± 11.6 0.80± 0.21 0.77± 0.41 0.51± 0.27 0.54± 0.26 327± 69.1 7.64± 3.16 156± 155 79± 30 6.0± 1.7WQ wet 39.3± 13.7 0.91± 0.64 5.81± 3.97 11.9± 5.34 0.57± 0.34 2.41± 1.75 0.47± 0.29 0.45± 0.15 317± 29.0 4.88± 1.61 61.7± 30.1 95± 41 7.9± 3.1Shrimp dry 6.85± 11.1 32.2± 95.4 4.84± 6.84 39.4± 21.7 1.18± 1.56 0.61± 0.40 n.a. n.a. 48.1± 56.5 n.a. n.a. 40± 70 45± 86Shrimp wet 9.67± 4.91 103± 92.7 93.7± 77.6 103± 39.0 6.17± 5.43 0.70± 0.49 n.a. n.a. 54.6± 29.4 n.a. n.a. 36± 14 2.2± 3.6GW dry 592± 434 0.57± 1.06 3.63± 4.42 75.5± 81.3 13.1± 31.4 2.22± 4.95 n.a. n.a. 330 ±157 n.a. n.a. 8430± 15767 6.6± 19GW wet 446± 490 1.02± 1.87 7.07± 13.4 37.3± 38.0 2.09± 5.84 0.34± 0.47 n.a. n.a. 333 ±164 n.a. n.a. 3277± 8736 9.0± 19
date NO−
3 NO−
2 NH+
4 DON PO3−
4 DOP Si(OH)4 DIN/DIP Si/DIN
SL Mar, 2009 97.2 5.39 4.14 33.3 0.28 0.26 237 381 2.2YD Mar, 2009 144 2.63 2.28 30.9 0.14 0.38 210 1063 1.4LY Mar, 2009 122 5.42 5.55 35.6 0.60 0.33 214 218 1.6Ty Aug, 2009 57.3 1.20 9.77 54.6 0.75 0.81 195 91 2.9JQJ Aug, 2008 35.6 0.95 7.44 20.9 0.55 1.67 101 143 1.3JQJ Mar, 2009 96.6 1.71 5.09 38.7 0.10 0.68 101 1034 1.0JQJ Aug, 2009 70.2 2.89 6.89 50.4 2.16 n.a. 148 37 1.9LG Aug, 2008 55.7 0.62 8.30 20.3 0.38 2.66 195 170 3.0LT Aug, 2008 32.9 0.62 9.16 10.8 0.24 2.76 246 178 5.8LW Aug, 2008 35.1 0.98 8.01 6.25 0.11 2.34 180 401 4.1TY Mar, 2009 97.2 5.39 4.14 33.3 0.28 0.26 237 381 2.2
concentrations accounted for 58, 53 and 49 % of PP in theWC, WJ and WQ rivers, respectively. The mean PIP and POPconcentrations in the WJ and WQ rivers were comparableduring the dry and wet seasons, and the average PIP concen-tration in the WC was higher in the dry season than in the wetseason (Table 2). The PIP and POP concentrations in the WCand WJ rivers were a factor of 1.9–4.6 higher than in the WQ.The PBSi and LSi concentrations were highly variable dur-ing the dry season, and higher than in the wet season exceptfor the WC (Table 2). The concentrations of PBSi in riversranged from 0.91 to 25.2 µM (mean 6.71 µM). The PBSi con-centrations accounted for 2, 10 and 2 % of PBSi plus silicicacid concentration in the WC, WJ and WQ rivers, respec-tively. The DSi concentrations in the WQ were higher thanin the WC and WJ rivers, while, the mean concentrations ofPBSi and LSi in the WJ were higher than in other two rivers(Table 2).
Molar DIN : PO3−
4 in rivers (Table 2) were significantlyhigher than the Redfield ratio, indicating that P may limitprimary production despite high nitrate values. DSi to DINmolar ratios were higher than or comparable to 1, which istypical of tropical rivers generally enriched with dissolvedsilicate.
3.3 Nutrients in shrimp ponds and groundwater
The nutrient concentrations in shrimp ponds varied consider-ably, as indicated by the large standard deviation (Table 2).The mean nutrient concentrations, particularly those of NH+
4and DON, were higher in the wet season than in the dry sea-son (Table 2). Average NH+4 concentrations were high, rang-ing 4.8 µM in the dry season to 93.7 µM in the wet season,and accounted for 48–54 % of DIN. The NO−
2 concentrations
in shrimp ponds ranged from 0.06 to 287 µM, but were typ-ically < 0.5 µM; the exception was one site in Changqi Bay,where the concentration reached 287 µM. The concentrationsof PO3−
4 in shrimp ponds ranged from 0.18 to 11.1 µM (mean6.17 µM; Table 2). The DIN : PO3−
4 ratios ranged from 0.6–216. DON represented 21–98 % of TDN, and DOP was 8–69 % of TDP during the study. In the wet season all nutrientconcentrations (with the exceptions of NO−
3 , DOP, and DSi)were higher in ponds than in rivers, while in the dry season,ponds had lower concentrations than rivers except PO3−
4 andDSi (Table 2) prior to the grow-out period.
The concentrations of nutrients in groundwater (GW)ranged over two orders of magnitude during the investiga-tion, and the DIN : PO3−
4 molar ratios were very high (Ta-ble 2). The mean nutrient concentrations were higher in GWthan other water bodies (rivers and ponds). In particular, themean concentrations of NO−3 ranged from 446 µM in the wetseason to 592 µM in the dry season, and accounted for 90 %of DIN, related to population density and chemical N fertil-izer application. TDN was also dominated by NO−
3 (81 %,80 %) both in the wet and dry seasons, DON contributed11.5 % and 18.5 % of TDN, respectively.
3.4 Nutrients distribution in the lagoons andcoastal waters
During the 2009 spring cruise the nutrient concentrations(with the exception of DON, DOP and PBSi) in XH Lagoonreflected linear dilution of freshwater by seawater (Fig. 2a).Nonlinear correlations with salinity were observed duringApril 2009 and August 2009. All nutrient concentrationswere higher in summer than in spring except for the concen-tration NO−
3 and that of NO−2 . DON represented 76± 15 %
Biogeosciences, 11, 481–506, 2014 www.biogeosciences.net/11/481/2014/

R. H. Li et al.: Nutrient dynamics in tropical rivers, lagoons, and coastal ecosystems 489
45
Figure 3 Horizontal distributions of surface temperature (°C), salinity and nutrients (μM) along
the eastern coast of Hainan Island. (a) 18–22 August 2007; (b) 27 July–2 August 2008; (c) 6–12
April 2009; (d) 29 August–1 September 2008; (e) 29 July–3 August 2009.
a
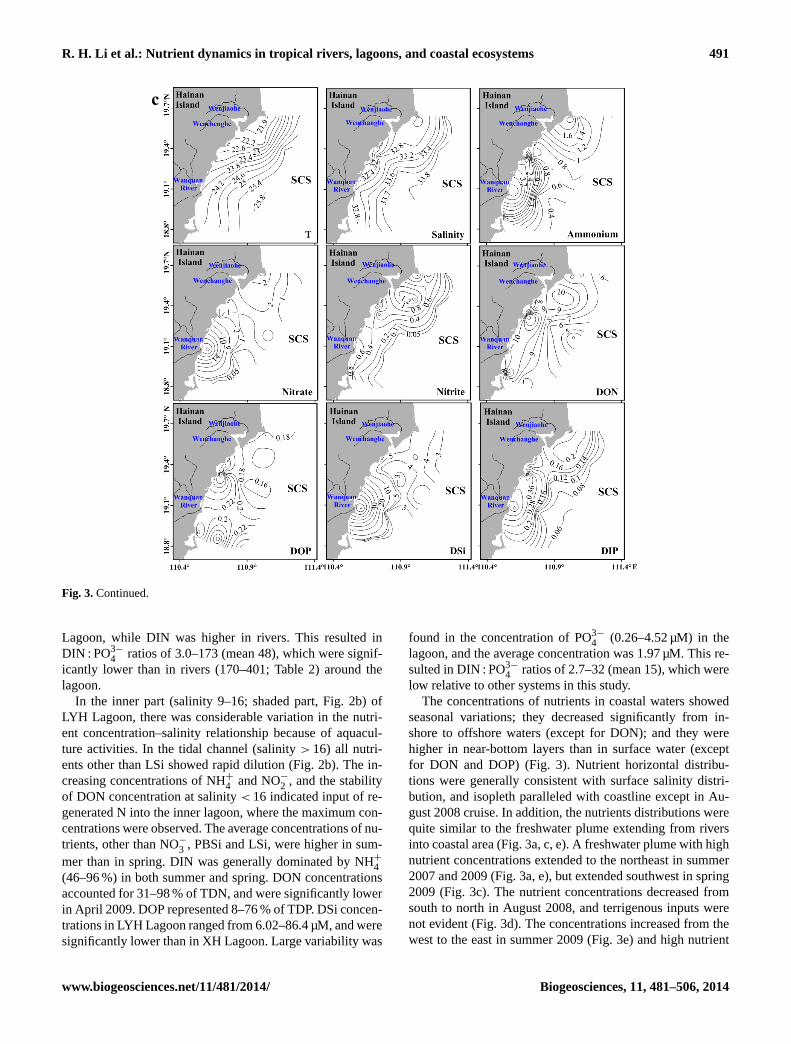
Fig. 3. Horizontal distributions of surface temperature (◦C), salinity, and nutrients (µM) along the eastern coast of Hainan Island.(a) 18–22 August 2007;(b) 27 July–2 August 2008;(c) 6–12 April 2009;(d) 29 August–1 September 2008;(e)29 July–3 August 2009.
of TDN in summer, and was 36± 15 % in April 2009.DOP represented 50± 20 % and 47± 20 % of TDP in springand summer, respectively. Low-salinity (1.8) water con-taining high nutrient concentrations (NO−
3 : 45.0 µM; DON:
23.8 µM) was present in the west of the inner lagoon (stationXH5); this was related to input of terrigenous materials viariver runoff. The average concentrations of PO3−
4 (0.7 µM)were a factor of 2.0–6.9 higher than in rivers entering XH
www.biogeosciences.net/11/481/2014/ Biogeosciences, 11, 481–506, 2014

490 R. H. Li et al.: Nutrient dynamics in tropical rivers, lagoons, and coastal ecosystems
46
b
Fig. 3.Continued.
Biogeosciences, 11, 481–506, 2014 www.biogeosciences.net/11/481/2014/
R. H. Li et al.: Nutrient dynamics in tropical rivers, lagoons, and coastal ecosystems 491
47
c
Fig. 3.Continued.
Lagoon, while DIN was higher in rivers. This resulted inDIN : PO3−
4 ratios of 3.0–173 (mean 48), which were signif-icantly lower than in rivers (170–401; Table 2) around thelagoon.
In the inner part (salinity 9–16; shaded part, Fig. 2b) ofLYH Lagoon, there was considerable variation in the nutri-ent concentration–salinity relationship because of aquacul-ture activities. In the tidal channel (salinity> 16) all nutri-ents other than LSi showed rapid dilution (Fig. 2b). The in-creasing concentrations of NH+
4 and NO−
2 , and the stabilityof DON concentration at salinity< 16 indicated input of re-generated N into the inner lagoon, where the maximum con-centrations were observed. The average concentrations of nu-trients, other than NO−3 , PBSi and LSi, were higher in sum-mer than in spring. DIN was generally dominated by NH+
4(46–96 %) in both summer and spring. DON concentrationsaccounted for 31–98 % of TDN, and were significantly lowerin April 2009. DOP represented 8–76 % of TDP. DSi concen-trations in LYH Lagoon ranged from 6.02–86.4 µM, and weresignificantly lower than in XH Lagoon. Large variability was
found in the concentration of PO3−
4 (0.26–4.52 µM) in thelagoon, and the average concentration was 1.97 µM. This re-sulted in DIN : PO3−
4 ratios of 2.7–32 (mean 15), which werelow relative to other systems in this study.
The concentrations of nutrients in coastal waters showedseasonal variations; they decreased significantly from in-shore to offshore waters (except for DON); and they werehigher in near-bottom layers than in surface water (exceptfor DON and DOP) (Fig. 3). Nutrient horizontal distribu-tions were generally consistent with surface salinity distri-bution, and isopleth paralleled with coastline except in Au-gust 2008 cruise. In addition, the nutrients distributions werequite similar to the freshwater plume extending from riversinto coastal area (Fig. 3a, c, e). A freshwater plume with highnutrient concentrations extended to the northeast in summer2007 and 2009 (Fig. 3a, e), but extended southwest in spring2009 (Fig. 3c). The nutrient concentrations decreased fromsouth to north in August 2008, and terrigenous inputs werenot evident (Fig. 3d). The concentrations increased from thewest to the east in summer 2009 (Fig. 3e) and high nutrient
www.biogeosciences.net/11/481/2014/ Biogeosciences, 11, 481–506, 2014

492 R. H. Li et al.: Nutrient dynamics in tropical rivers, lagoons, and coastal ecosystems
48
d
Fig. 3.Continued.
concentrations were present in Qiongzhou Strait, and nutri-ent isopleths in Qiongzhou Strait, which can be affected byNandu River, were at 90°to the coastline. DON represented47–97, 47–98, 14–97 and 22–95 % of TDN in surface waterin August 2007, July–August 2008, August 2008 and April2009, respectively. During the study period, DOP accountedfor 27–91, 32–95, 3.7–92 and 27–87 % of TDP, respectively.
DON and DOP were the main components of TDN and TDPin offshore surface waters in our study region. DON and DOPconcentrations were slightly higher in surface waters than inthe near-bottom layer. In summer 2007 and 2008, the meanconcentrations of PP in coastal water accounted for 52 and37 % of TP, and PIP accounted for 16 and 26 % of TP, respec-tively. PP is an important factor in our study environments.
Biogeosciences, 11, 481–506, 2014 www.biogeosciences.net/11/481/2014/

R. H. Li et al.: Nutrient dynamics in tropical rivers, lagoons, and coastal ecosystems 493
49
e
Fig. 3.Continued.
Molar ratios of DIN : PO3−
4 and DSi : DIN in August 2007,July–August 2008 and July–August 2009 were higher thanthe Redfield ratio. The DIN : PO3−
4 molar ratios ranged from1.0 to 25 (average 11± 11) in August–September 2008, ex-cept for one site where the ratio was 51. The DSi : DIN ra-tio was higher than or comparable to the Redfield ratio inboth April 2009 and August 2008 (Table 2, S1) and de-creased from nearshore to offshore waters. This indicates thatN would be the limiting element for phytoplankton growthin shelf region, while P was the most limiting nutrient innearshore region for phytoplankton growth because of exces-sive terrigenous N input. The PBSi : POC ratio was approx-imately 0.05, based on POC measured in the neritic regionin August 2007 (Tian, 2009). This value is within the 0.05–
1 range reported worldwide (Liu et al., 2007), although itis lower than the Si : C ratio (0.13) for diatom growth undernutrient-sufficient conditions (Brzezinski, 1985).
3.5 Nutrients variability at anchor stations
Stations T2-2, T2-3 and 16 were located off Gaolong Bay.At station T2-3 in August 2007, the NO−3 , NO−
2 , PO3−
4 andDSi concentrations were higher in near-bottom waters thanin surface and sub-surface waters (Fig. 4a). The NH+
4 , DONand DOP concentrations had a well-mixed vertical profilethroughout the water column (Fig. 4a). High DON concentra-tions (6.58–18.3 µM) were observed and comprised 72–90 %of TDN. The DOP concentrations were 0.04–0.20 µM. TheDIN : PO3−
4 ratio in August 2007 decreased from 12–61 in
www.biogeosciences.net/11/481/2014/ Biogeosciences, 11, 481–506, 2014

494 R. H. Li et al.: Nutrient dynamics in tropical rivers, lagoons, and coastal ecosystems
50
Figure 4 The concentrations of nutrients (μM) at anchor station (a) T2-3 in August 2007, (b)
station T2-2 in July 2008 and (c) station 15# in July 2009. The tide heights (cm) during July 2008
and July 2009 are provided and the red circle represents the sampling time. No data on tidal
variation were available during August 2007, and consequently the tide height is not showed.
a
Fig. 4. Concentrations of nutrients (µM) at(a) anchor station T2-3 in August 2007,(b) station T2-2 in July 2008 and(c) station 15 in July2009. The tide heights (cm) during July 2008 and July 2009 are provided, and the red circle represents the sampling time. No data regardingtidal variations were available for August 2007, and consequently the tide height is not show.
surface water to 14–20 in near-bottom water. The DSi : DINratio ranged from 0.50 to 0.95 in surface water and 0.64–0.98in near-bottom water.
Sampling at station T2–2 commenced in 29–30 July 2008.The concentrations of all nutrients suggested a well-mixedwater column (Fig. 4b). The nutrient concentrations var-ied by a factor of 1–3 for Si(OH)4, TDN, DON, TDP andDOP, and by 3–11 times for NO−2 , NO−
3 , PO3−
4 and NH+
4 .The DIN : PO3−
4 ratio decreased from 19–138 in surface wa-ter to 17–48 in near-bottom water. The DSi : DIN ratio in-creased from 0.5–1.3 in surface water to 0.8–3.0 in near-
bottom water. High concentrations of DON were observed(5.1–9.6 µM), and comprised up to 60 % of TDN through-out the water column. The DOP concentrations were 0.09–0.24 µM, represented 41–91 % of TDP, and showed a well-mixed profile (Fig. 4b).
At station 16 in August 2009 the nutrient concentrationsshowed strong vertical mixing at depths< 30 m (Fig. 4c),and the vertical distribution of nutrients was similar to that atstation T2-3. The NH+4 concentrations (0.24–7.47 µM) werevariable throughout the water column. The NO−
3 concen-trations were 0.07–0.57 µM for depths< 30 m, and reached
Biogeosciences, 11, 481–506, 2014 www.biogeosciences.net/11/481/2014/

R. H. Li et al.: Nutrient dynamics in tropical rivers, lagoons, and coastal ecosystems 495
51
b
Fig. 4.Continued.
3.88–9.02 µM in bottom waters. The concentrations of DSiincreased steadily from 2.82–4.26 µM at depths< 30 m to7.64–13.0 µM in bottom waters. For depths< 30 m theDIN : PO3−
4 ratio was 3.6–21 (average 11), and in bottom wa-ter was 10–17 (average 14). The DSi : DIN ratio decreasedfrom 0.4–12 (average: 2.1) at depths< 30 m to 1.0–1.4 (av-erage: 1.1) in bottom waters.
3.6 Water and nutrient budgets in the lagoons
Liu et al. (2011) and Li et al. (2013) have provided detaileddescriptions of the dissolved nutrient budgets in the WWEand WQE, respectively. Here we describe nutrient budgets
for XH and LYH lagoons in Table 4, and particulate nutrientbudgets for the WWE and WQE.
For the water budget, wastewater from domestic, in-dustrial and aquaculture effluents discharge directly intothe lagoons has been ignored as no data were available.The mean submarine groundwater discharge into LYH La-goon was calculated to be 4.11× 10⁶ m3 day−1, based onthe excess radium isotopes and the water age in the la-goon in April 2010 (Ji et al., 2013). The total freshwa-ter discharge from rivers into XH and LYH lagoons was26.5 m3 s−1 and 0.4 m3 s−1, respectively. Precipitation lev-els of 65.3× 10⁶ m3 yr−1 and 14.2× 10⁶ m3 yr−1 (VP) were
www.biogeosciences.net/11/481/2014/ Biogeosciences, 11, 481–506, 2014

496 R. H. Li et al.: Nutrient dynamics in tropical rivers, lagoons, and coastal ecosystems
52
c
Fig. 4.Continued.
reduced by 35.4× 10⁶ m3 yr−1 and 7.80× 10⁶ m3 yr−1 ofevaporation (VE) in XH and LYH lagoons, respectively.Based on water balance, the net water exchanges (VR)
from XH and LYH lagoons to the SCS were calculated tobe 864× 106 m3 yr−1 and 1519× 106 m3 yr−1, respectively.The water exchange flow (VX) from the SCS to XH and LYHlagoons was 717× 106 m3 yr−1 and 2660× 106 m3 yr−1, re-spectively. The volumes (VS) of XH and LYH lagoons were6.6× 107 m3 and 5.0× 10⁷ m3, respectively. The total waterexchange times (τ) for XH and LYH lagoons, estimated fromtheVS/(VX +VR) ratio, were 15.2 days and 4.4 days, respec-tively.
Nutrient transport fluxes from river, rainwater and sub-marine groundwater into the study systems were determinedfrom surveys undertaken in the period 2006–2009. The nu-trient concentrations in rainwater were based on measure-ments made during 2006–2009 at Wenchang, Qinglan (Liu
et al., 2011). Submarine groundwater discharge (SGD) wasignored as no data were available for XH Lagoon. Atmo-spheric deposition as a source of nutrient input was verylimited because of the small surface area involved. Nutri-ent budget results showed that nutrient loads in XH Lagoonare mainly derived from riverine inputs, and the lagoon be-haves as a sink for all nutrients except PO3−
4 and DON. Asone nutrient source, river discharge into LYH Lagoon is verylimited (0.4 m s−1; Ji et al., 2013) and contains low con-centrations of dissolved inorganic nutrients (mean values in-clude NO−
2 : 0.67 µM, NO−
3 : 1.63 µM, NH+
4 : 3.40 µM, PO3−
4 :1.30 µM, DSi: 25.2 µM). Additionally, the amounts of dis-solved organic and particulate nutrients were based on mea-surements for rivers around XH Lagoon. The results showedthat LYH Lagoon behaved as a source of NO−
2 , NH+
4 , PIP,POP, PBSi, and LSi, and as a sink for NO−
3 , PO3−
4 , DSi,TDN, DON, TDP and DOP. Groundwater was the major
Biogeosciences, 11, 481–506, 2014 www.biogeosciences.net/11/481/2014/

R. H. Li et al.: Nutrient dynamics in tropical rivers, lagoons, and coastal ecosystems 497
Table 3. (A) Observed nutrient yields (Obs.) (× 103 molkm−2 yr−1) in rivers of the eastern Hainan Island. (B) Areal nu-trients yields (×103 mol km−2 yr−1) for tropical and nontropicalrivers Data sources:a, Jennerjahn (2012);b, Liu et al. (2009).
Panel A: observed nutrient yields (× 103 mol km−2 yr−1)
of rivers along the eastern Hainan Island
DIN PO3−
4 DSi
WC 51 0.5 120WJ 37 0.4 76WQ 62 0.9 448JQJ 78 1.1 134LG 43 0.2 160LT 77 0.5 268LW 43 0.3 319TY 46 0.1 234
Panel B: the areal yields (× 103 mol km−2 yr−1)
of nutrients in the tropical and nontropical rivers
DIN DSi PO3−
4
Large tropical riversa 13 81 0.9Large nontropical riversa 23 36 1.6Daguhe, Chinab 16 5.4 0.03Keum, Koreab 110 50 0.8Yongjiang, Chinab 104 147 2.6Pearl River, Chinab 67 91 0.6Kallada, Indiaa 10 81 6.0Brantas, Indonesiaa 91 149 2.9Citanduy, Indonesiaa 51 284 2.0
source of nutrients entering LYH Lagoon. In addition, thenutrient budgets indicated that the WWE behaved as a sinkof LSi, and as a source of PIP, POP and PBSi. Both ShameiLagoon and the WQ tidal inlet behaved as a source of par-ticulate P and silicon, without considering wastewater andaquaculture effluents.
4 Discussion
4.1 Nutrient dynamics in rivers
The observed spatiotemporal variations of dissolved nutri-ents in rivers were probably the result of the systems andseasonally varying interaction of natural and anthropogenicfactors. Compared with other small to medium-sized riversof temperate China (Liu et al., 2009), the DIN concentra-tions (16.0–144 µM) in our study rivers were lower, and werecomparable to subtropical rivers of China (Liu et al., 2009).The DIN levels were lower than in some tropical rivers thatare significantly affected by human activities, such as NaliuRiver (55–220 µM; Kaiser et al., 2013) and Tamsui River(Wen et al., 2008) in China, Wonokromo River (123 µM)(Jennerjahn et al., 2004) and Brantas River (142–169 µM) in
Indonesia (Jennerjahn, 2012). However, DIN concentrationswere much higher than in other large and less disturbed riversworldwide, such as the Amazon and Zaire (Cai et al., 2004).Anthropogenic activities (e.g., agriculture, aquaculture anddeforestation) may be major sources of DIN in our studyrivers. In these rivers, the mean concentrations of PO3−
4 werewithin the range of pristine (0.5 µM) to clean water (1.4 µM),and higher than in other Chinese rivers, including the Yanglu-jiang, Daguhe and Oujiang (Liu et al., 2009). Population hasbeen growing in recent decades in the cities of Wenchang,Qionghai, and Wanning (Fig. 5; Hainan Statistical Yearbook,2010). Cultivated areas for crop production decreased inthose cities in the past decades, while crop yield per unit areaincreased from 1095 kg ha−1 in 1952, 4083 kg ha−1 in 1999.Hence, more fertilizer was used to increase crop productionfrom 1987–2011, especially in Qionghai, and more than 50 %of the applied N may have been transported to rivers be-cause of the low fertilizer uptake efficiency (approximately30–50 % in tropical regions; Han et al., 2010). Wastewatercan increase nutrient levels, as shown for Tamsui River inTaiwan (Wen et al., 2008). Thus, the influence of human ac-tivities is very important in this tropical region, and must beconsidered.
Because of their geological and climatic settings, tropi-cal river basins play a major role in chemical weatheringand transfer of DSi to rivers and oceans (Bouwman et al.,2013). The concentrations of DSi (range 96.2–396 µM, mean252 µM) in study rivers were high for tropical river systems(global average level in tropical systems approximately 180–190 µM; Jennerjahn, 2012), and also higher than the meanconcentration for Asian freshwater systems (196 µM; Cor-nelis et al., 2011). DSi is mainly derived from natural sources(e.g., chemical weathering), and is little affected by humanactivities (Jennerjahn et al., 2009). The combination of lithol-ogy, climate and tectonic activity are frequently cited to ex-plain high DSi values (Liu et al., 2009). Additionally, defor-estation is also well-known for enhancing erosion and trans-porting nutrients to rivers. Silicate and carbonate rocks arethe main rock types of Hainan Island, and chemical weather-ing rate (42 t km−2 yr−1; Li, 2009) in the eastern Hainan Is-land is higher than the average global level (36 t km−2 yr−1).Rivers in the study area are all dominated by precipitation,and forest and mangroves have been deforested for agricul-ture and aquaculture. These factors may explain the high DSilevels found in the freshwater systems in this study.
It is known that riverine transport of phosphorus mainlyexists in the solid phase; DIP load is increased by as muchas five times because of release of phosphate from parti-cles entering the sea. Average SPM concentrations in theWC, WJ and WQ rivers (19.2 mg L−1) were low comparedto other Chinese rivers (7–44 mg L−1; Liu et al., 2009),and PP levels were lower than the Daguhe (2.86 µM), Jiu-longjiang (2.47 µM) and Changjiang (2.87 µM) (Liu et al.,2009). As a good proxy for diatom abundance, the averageconcentrations of PBSi in the Amazon, Connecticut, Danube,
www.biogeosciences.net/11/481/2014/ Biogeosciences, 11, 481–506, 2014

498 R. H. Li et al.: Nutrient dynamics in tropical rivers, lagoons, and coastal ecosystems
Table 4.Nutrient budgets (106 mol yr−1) in Xiaohai (XH) and Laoyehai (LYH) lagoons.C1 andC2 are the average nutrient concentrationsin the system of interest and the adjacent system, respectively.VRCR,VXCX and1 are the residual nutrient transport out of the system ofinterest, the mixing exchange flux of nutrients, and the non-conservative flux of nutrients, respectively. Negative and positive signs of1
indicate that the system is a sink or a source, respectively.
NO−
3 NO−
2 NH+
4 PO3−
4 Si(OH)4 TDN DON TDP DOP PIP POP PBSi LSi
Freshwater discharge (= VQCQ)
XH 40.0 0.52 7.28 0.26 184 60.3 13.0 2.52 2.26 2.15 1.56 18.6 163LYH 0.03 0.007 0.04 0.02 0.32 0.91 0.20 0.04 0.03 0.03 0.02 0.28 2.47Atmospheric deposition (= VPCP)
XH 1.10 0.01 1.40 0.02 0.07 3.37 0.85 0.04 0.02 n.a. n.a. n.a. n.a.LYH 0.24 0.003 0.31 0.004 0.01 0.74 0.17 0.009 0.005 n.a. n.a. n.a. n.a.Groundwater discharge (= VGCG)
LYH 318 1.11 8.04 18.2 256 510 176 30.5 12.3 n.a. n.a. n.a. n.a.Residual flow (= VRCR, CR = (C1 + C2)/2)XH −4.85 −0.42 −3.35 −0.32 −62.5 −22.3 −13.7 −0.62 −0.29 −0.48 −0.61 −6.01 −45.4LYH −5.22 −1.57 −19.8 −1.56 −37.8 −63.6 −37.1 −2.19 −0.64 −0.60 −0.69 −5.52 −26.0Mixing exchange (= VXCX , CX = (C2–C1))
XH −5.24 0.012 −3.30 −0.35 −91.6 −18.8 −10.2 −0.52 −0.16 −0.75 −0.87 −6.58 −74.0LYH −7.85 −2.85 −60.8 −4.79 −87.2 −155 −83.8 −5.78 −1.01 −1.94 −1.91 −6.70 −85.6Sink/source (1Y = 6outflux–6influx)XH −28.0 −0.12 −2.04 0.40 −30.0 −22.6 10.1 −1.42 −1.83 −0.92 −0.078 −5.96 −43.8LYH −306 3.30 72.1 −11.8 −131 −293 −55.5 −22.5 −10.7 2.51 2.57 11.9 109
Rhine, Mississippi, Lena and Congo rivers (28 µM, rangefrom 2.68± 0.52 µM to 73.9± 17.6 µM; Conley, 1997) washigher than the average PBSi levels (6.71 µM) in rivers alongthe eastern coast of Hainan Island. The PBSi levels in theserivers were also lower than those in other Chinese rivers inthe vicinity of Jiaozhou Bay (2.16–50.5 µM; Liu et al., 2008).The contribution of PBSi to total silicon (silicic acid plusPBSi) in rivers in this study was lower than in other riversworldwide (16 %; Conley, 1997).
We estimated the areal yields of nutrients as the prod-uct of nutrient concentration with average freshwater dis-charge divided by the drainage area (Table 3). Both DIN andPO3−
4 areal yields in study rivers were higher than the aver-age yields of large tropical and nontropical rivers which esti-mated based on the formulas of Smith et al. (2003). In addi-tion, the areal yields of DIN in rivers were higher than in thetropical Kallada River (Table 3). The areal yields of PO3−
4 inrivers were significantly lower than those in the Kallada andCitanduy rivers (Table 3). While both DIN and PO3−
4 arealyields were lower than those in the tropical Brantas River(Table 3), which is located in the most favorable region onthe Earth with regard to weathering and erosion conditions(Jennerjahn, 2012), and were also lower than in small tem-perate rivers, such as the Keum and Yongjiang rivers whichare significantly affected by anthropogenic (Liu et al., 2009;Table 3). On a global scale the DIN and DIP yields showedsignificantly relationships with population density and runoffper unit area (Smith et al., 2003). Population density was244 inhabitants per km−2 in 2010 (Hainan Statistical Year-book, 2011) and runoff per area was low compared with other
rivers. High anthropogenic N and P inputs can lead to highareal yields of DIN and DIP. Anthropogenic activities maybe the main reason for high N areal yields in the study area.The use of fertilizer in Wenchang (2600 kg ha−1), Qiong-hai (5700 kg ha−1), and Wanning (2100 kg ha−1) in 2009(Hainan Statistical Yearbook, 2010) were much higher thanthe global average (90 kg ha−1; Jennerjahn, 2012). The up-take efficiency of nitrogen fertilizer was only 30–50 % in thetropical region of China (Han et al., 2010). Under such con-ditions nitrogen could easily be washed into the rivers, re-sulting in high nitrogen yields. While P yields were low thetropical rivers systems in our study, which might be relatedto adsorptions onto particulates as in the other Chinese rivers(Liu et al., 2009). P emission was 3–4 % from soils in Jake-nan in Indonesia (Jennerjahn et al., 2009). P emission in ourstudy area might be significantly lower than N and that mightbe one reason for the low P yield in those rivers.
The areal yields of DSi from the study rivers (particularlythe WQ) were significantly higher than the average yieldsreported for large tropical and nontropical rivers. The averageareal yield of DSi from the WQ (448× 103 mol km−2 yr−1)
was much higher than from the tropical Citanduy River inIndonesia, which has a drainage area comparable to that ofthe WQ. DSi areal yields were also significantly higher thanfor other Chinese rivers (Table 3). High chemical weatheringrates may be responsible for high DSi areal yields.
4.2 Nutrient dynamics in lagoons and coastal waters
The nutrient-rich Longtouhe (LT) and Longweihe (LW)rivers (Table 2) empty directly into the northern lagoon,
Biogeosciences, 11, 481–506, 2014 www.biogeosciences.net/11/481/2014/

R. H. Li et al.: Nutrient dynamics in tropical rivers, lagoons, and coastal ecosystems 499
53
Figure 5 Changes in population (× 104), cultivated area (× 103 ha), fertilizer application (× 104
tons), crop production (kg ha–1), aquaculture area (× 102 ha) and wastewater discharge (tons) for
the Hainan Island (1952–2011), and Wenchang, Qionghai and Wanning Cities from 1987 to 2011.
The left ordinate represents changes for the entire island, and the right ordinate represents changes
for each city. The data are from the Hainan Statistical Yearbook for 1988, 1989, 1993, 1997, 2000,
2001, 2005, 2007, 2009, 2010, 2011 and 2012.
Fig. 5.Changes in population (× 104), cultivated area (× 103 ha), fertilizer application (× 104 tons), crop production (kg ha−1), aquaculturearea (× 102 ha) and wastewater discharge (tons) for the Hainan Island from 1952–2011, and the cities of Wenchang, Qionghai, and Wanning,1987–2011. The left ordinate represents changes for the entire island, and the right ordinate represents changes for each city. The data arefrom theHainanStatisticalY earbook for 1988, 1989, 1993, 1997, 2000, 2001, 2005, 2007, 2009, 2010, 2011 and 2012.
which may explain the high nutrient concentrations foundat station XH2. We found that DON was the dominant dis-solved N component in the lagoons. The reason for that couldbe the many fish cages in the lagoons. Most of the dissolvednitrogen leaching from the feed, and shrimp feces was in or-ganic rather than in organic forms (Burford and Williams,2001). In addition, studies on total organic carbon and Ncontents in Shamei and XH lagoons indicated that in recentdecades organic matter sources and nitrate loading were in-creasingly affected by human activities, and eutrophicationwas observed (Jia et al., 2012; Liu and Ge, 2012). Isotopeanalysis also indicated that sedimentation rate in XH Lagoonafter 1988 was approximately twofold that in the previousdecade because of anthropogenic activities, which has led toa significant increase in input of authigenic organic matter(Liu et al., 2007). Moreover, the aquaculture area has also in-
creased, especially in Wenchang, where it has increased bya factor of 8.8 (Fig. 5). N and P fluxes can be enhanced byorganic matter recycling in sediment introduced from aqua-culture activities. Terrestrial inputs and aquaculture activitiesare important sources of nutrients in XH Lagoon. The in-put of large quantities of nutrients into a small lagoon (suchas LYH Lagoon) through SGD could significantly affect itsecosystem. Hypoxia conditions were found in the inner partof LYH Lagoon in August 2009 (Sun, 2011).
The average concentrations of PP (0.5–1.4 µM) in theWWE and WQE, and in XH and LYH lagoons were lowerthan in other estuaries worldwide, including the Delaware es-tuary (PP 1–2 µM; Lebo and Sharp, 1993), the Humber estu-ary (PIP 14.3 µM, POP 4.8 µM; Prastka and Malcolm, 1994),and the Changjiang estuary (PIP 2.00 µM, POP 1.02 µM;Wang et al., 2009). The lower concentrations found in this
www.biogeosciences.net/11/481/2014/ Biogeosciences, 11, 481–506, 2014

500 R. H. Li et al.: Nutrient dynamics in tropical rivers, lagoons, and coastal ecosystems
study may be related to low SPM content in the estuar-ine/lagoon systems. The PBSi concentrations in these sys-tems (Table 2, Fig. 2) were comparable to those in the Aulneestuary (5.6–52 µM; Ragueneau et al., 2005) and Drake Pas-sage estuary (4.24 µM; Turner et al., 2003), but higher thanthose in the Changjiang estuary (0.2–2.8 µM; Liu et al., 2005)and Jiaozhou Bay (2.19 µM; Luo et al., 2008). LSi levelsalong the eastern Hainan Island varied widely, and the av-erage concentrations were approximately 1.1–13 times thosein the Changjiang (21.1± 12.1 µM; Liu et al., 2009). In theWWE and WQE the PBSi and LSi concentrations were posi-tively correlated with SPM, suggesting that the high concen-trations of these nutrients in the lagoons may be related to ahigh weathering rate.
The relatively high nutrient concentrations in coastal wa-ters close to the shore reflect considerable input from land,and suggest the effects of anthropogenic perturbation in theadjacent terrestrial areas. In addition, high nutrient concen-trations associated with low salinity were apparent underhigh river discharge conditions (278 m3 s−1 in spring 2009and 100 m3 s−1 summer 2007, Fig. 3a, e) indicating thatriver discharge might control the distribution of nutrients incoastal waters close to the shore. Several reports have sug-gested that river discharge is the main factor controlling mat-ter transfer from land to sea, especially for small rivers (Lud-wig et al., 2009; Han et al., 2012). Moreover, the seasonalvariation of salinity, temperature and nutrients appeared tobe closely coupled to monsoons. In summer, a plume of lowsalinity water with high nutrient levels extended northeast(Fig. 3a), may be under the combined effects of large riverdischarges and the Hainan Coastal Current, which travelsfrom south to north (Chu et al., 1999). However, in spring,a nutrient-rich plume extended southwest under the effectsof the WQ diluted water and northerly winds (Fig. 3c). Inthe long run, coastal ecosystems will be changed because offreshwater input with high nutrient levels, as has happened inother Chinese seas (Liu et al., 2009). Red tides have occurredalong the east coastal of Hainan Island because of human ac-tivities (Pan et al., 2007).
Mangroves act as filters for river-derived nutrient pol-lutants in tropical and subtropical areas, protecting sea-grass beds and coral reef ecosystems, and offering a poten-tial means of reducing the export of pollutants from aqua-culture (nutrients, pesticides, organic matter) (Jennerjahn,2012). Mangrove sediments act as sinks for N and P in theWWE (Liu et al., 2011). Material temporarily trapped atlow tide in the lagoon and the filtering effect of Bamen Baycould considerably reduce nutrient export to coastal waters(Zhang et al., 2013). However, 73 % of the fringing river-ine mangrove in the WWE has been lost since the 1960sand has been replaced by aquaculture ponds (Krumme et al.,2012). 6151 t yr−1 total organic carbon, 1292 t yr−1 total N,and 51 t yr−1 dissolved phosphate are exported from pondaquaculture to coastal and back-reef waters of the northeastHainan Island (Herbeck et al., 2013). In addition, the WWE
is a shallow water body with a short water residence time(approximately 7.8 days; Liu et al., 2011), and consequentlyheavy rainfall leading to high levels of river discharge can re-duce the filtering effect of the estuary, leading to the releaseof material to the coastal environment. Because of typhoons,high SPM levels (42 mg L−1) and nutrients were found onthe Dongjiao, Yelin and Tanmen reef flats (Herbeck et al.,2013; Roder et al., 2013), resulting in reduced light availabil-ity and increased sedimentation stress for reef-flat communi-ties (Roder et al., 2013). In recent decades there has beenincreased anthropogenic organic matter transport from theWWE to the coastal sea, because of the degradation of man-grove forests and the expansion of aquaculture (Bao et al.,2013). Untreated municipal sewage from Wenchang is an-other potential source of dissolved nutrients and particulateorganic matter entering the estuary (Herbeck et al., 2011).Thus, more nutrients would be transported to the ocean, con-tributing to the degradation of the coastal ecosystems.
Freshwater containing high nutrient concentrations di-rectly enters the SCS through the narrow tidal inlet in theWQE (Fig. 1), especially when large quantities of river runoffoccur in connection with heavy rain. Water residence time isonly 0.2 days in the tidal inlet, and estuarine filtering canbe readily disrupted. Approximately 60 % of Shamei Lagoon(which is in the southern part of the WQE) is used for fish andshrimp ponds, and is connected to the sea through the tidalinlet. Isotope analysis has indicated that large inputs of N andP stimulate the growth of phytoplankton in the lagoon (Jia etal., 2012), and suggest that nutrient accumulation in the la-goon has led to eutrophication and changes to the ecologicalstructure. Large quantities of nutrients will be input to coastalregion through the tidal inlet. High nutrients plume appearedoff the WQE (Fig. 3a, c) in our study. Nutrient enrichmentin coastal waters often results in increased algal biomass, re-ducing water clarity and causing a loss of submerged macro-phytes (Spivak et al., 2009). Hence, the coastal ecosystem offthe WQE may be more significantly affected.
The morphology of XH Lagoon has been changed since1972 through human interventions and total river dischargeinto the lagoon was reduced following the diversion of theTaiyanghe (TY) in 1972. In addition, the sand barrier hasbeen continuously extended and the tidal inlet narrowed, andthe tidal influence barely reaches the middle and southernparts of the lagoon. The northern part of the lagoon is morereadily affected by tidal current and river runoff comparedto the inner lagoon. Hence, the southern part of the lagoonhas become a dead zone, where the water residence time islonger than 150 days (Gong et al., 2008). Total organic car-bon and total N levels in sediment indicate that authigenic or-ganic matter significantly increased in the lagoon after 1988because of aquaculture activities, and that large nutrient in-puts have deteriorated the water quality of XH Lagoon (Liu etal., 2007). High nutrient levels are maintained in XH Lagoon,resulting in algal or phytoplankton blooms and depleted oxy-gen; this has been confirmed by isotope analysis (Liu and Ge,
Biogeosciences, 11, 481–506, 2014 www.biogeosciences.net/11/481/2014/

R. H. Li et al.: Nutrient dynamics in tropical rivers, lagoons, and coastal ecosystems 501
2012). Furthermore, the lagoon entrance mouth has narrowedfrom 140 m to less than 30 m in the last 30 yr because of landreclamation and cage culture in the tidal inlet (Wang et al.,2003). The lagoon formed a deposit and was shallow. Thiscaused serious inundation in October 2000, when a violenttyphoon hit the island (Yu et al., 2002; Wang et al., 2003).Large quantities of materials from the lagoon transport tothe ocean company with rainfall. Additionally, the TY emp-ties directly into the SCS following the diversion. A studyin August 2008 showed that 7.7× 10⁴ mol day−1 of DIN,0.2× 103 mol day−1 of PO3−
4 , and 31.5× 10⁴ mol day−1 ofdissolved silicate transported directly to the SCS in the TY,affecting coastal ecosystems.
Coastal erosion may be another source of materials en-tering coastal waters and transported by longshore drift andcoastal currents. The coastline is receding by approximately10 m per year (Wang, 1998), and this may be a consequenceof sea level rise, which, based on data for 1977–1978 and1980–1993, has been estimated to be of 0.92 mm yr−1 alongthe eastern coast (Wang, 2002). Furthermore, the coral reef(approximately 500–1000 m wide) has been subject to seri-ous degradation because of human activities in the past 20 yr,resulting in shoreline erosion. The coastal barrier in our studyregion is still growing, and the lagoons may be closed to thesea in the future. Nutrient dynamics will be affected by theseterrain changes.
Studies of SGD along the eastern coast of Hainan Islandare very limited. Nutrient budgets based on box models indi-cated that SGD is important source of nutrient to the WWEand WQE (Liu et al., 2011; Li et al., 2013). Horizontal eddydiffusion fluxes of nutrients from coast to offshore area wereestimated based on nutrient gradients and horizontal eddydiffusion coefficient values, were estimated in August 2007using 228Ra (Su et al., 2011b). This analysis showed thatover 6 months 2.3× 10⁸ mol of N, 1.5× 10⁷ mol of P and5.1× 108 mol of Si were transported from the study area tothe SCS, 100 km off the coastline. Li et al. (2012) reportedthat spatially discrete and temporally episodic nutrient fluxes,caused by physical phenomena such as eddies, fronts and fil-aments, could have an important effect in regions where phy-toplankton growth is nutrient limited.
Moreover, the WQE, and XH and LYH lagoons were allseparated from the ocean by sand barriers, which continue toexpand under the action of southeasterly winds that transportsediment from south to north (Wang and Li, 2006). Due tothe combined effects of human activities and natural factors,the lagoons can be transformed into closed water bodies, re-sulting in eutrophication because of high nutrient levels andalterations to these small, dynamic and fragile ecosystems.Such changes could result in changes to the coastal systemassociated with changed riverine fluxes, activities such asmariculture, aeolian input (dust), and potentially circulationpatterns (Kress et al., 2005).
4.3 Nutrient fluxes from the lagoons to the SCS
Nutrient fluxes from the lagoons to the SCS were estimatedas the sum of the net residual flux (VRCR) and the mixingflux (VXCX). Nutrient fluxes were a factor of 392–1878 ofthe riverine input (Fmodel= V CQ) to LYH Lagoon due to theinfluence of SGD. With the exception of PO3−
4 and DON,nutrient fluxes to the SCS were lower than riverine inputto XH Lagoon. This might be related to aquaculture activi-ties, which decreased the tidal flushing efficiency. As a result,large quantities of nutrients were retained in XH Lagoon.
Total nutrient fluxes from the estuaries and lagoons tocoastal region were calculated based on nutrient budgets. Theresults showed that DON represented 29 % of TDN, DOPwas 40 % of TDP, and PP accounted for 48 % of TP. Thepotential for DON and DOP to act as nutrient sources forprimary producers when phytoplankton growth was limitedhas long been recognized (Engeland et al., 2010; Huang etal., 2005). This suggests that the transport of large quanti-ties of both dissolved organic nitrogen and phosphate fromthe lagoons to the SCS is important, and might determine theimpact on receiving coastal ecosystems, especially within thecoral reef region.
The flux ratios of DIN : PO3−
4 and DSi : DIN were ap-proximately 40 and 3.0, respectively. The loading ratio ex-ceeded the Redfield ratio, demonstrating that the ecosystemin the coastal zone of the SCS would be affected by nutrienttransport. Total N and dissolved phosphate transported to thecoastal region through effluent from shrimp ponds accountedfor 22 % of nitrogen fluxes and 15 % of phosphorus fluxes.Primary production in the continental shelf region (< 200 m)of the SCS would be 602.3× 10⁶ t C yr−1 based on data fortwo seasons (summer and winter) (Ning et al., 2004). Basedon the Redfield stoichiometric ratio (C : N : P= 106 : 16 : 1),10.7× 107 t yr−1 of N and 6.6× 10⁶ t yr−1 of phosphatewould be assimilated by primary producers. The lagoonscontributions to the continental shelf region (< 200 m) of theSCS could account for 0.005 % of nitrogen and 0.005 % ofphosphate. The contribution of terrigenous nutrient input toprimary production of the SCS is limited.
SGD, which is the major source of nutrients entering LYHLagoon, was not included in water budgets for XH Lagoon.An estimate of SGD in XH Lagoon based on SGD obser-vations in the WWE (3.4± 5.0 m s−1; Su et al., 2011) sug-gests it accounts for approximately 13 % of the freshwaterdischarge into the lagoon. Hence, if SGD is considered, XHLagoon would be a sink of all nutrients. Estimation of SGDfor XH Lagoon based on SGD in LYH Lagoon suggests it ac-counts for a factor of approximately 1.8 that of the freshwaterdischarge into the lagoon. SGD would be the major sourceof nutrients in XH Lagoon. Furthermore, XH Lagoon is animportant site for aquatic products and is the fishing port ofWanning (Gong et al., 2008), but aquaculture effluents werenot included in the water budgets for this lagoon or LYHLagoon. The area of Wanning used for marine aquaculture
www.biogeosciences.net/11/481/2014/ Biogeosciences, 11, 481–506, 2014

502 R. H. Li et al.: Nutrient dynamics in tropical rivers, lagoons, and coastal ecosystems
increased from 233 ha in 1989 to 1495 ha in 2008 (HainanStatistical Yearbook, 1992, 2009). Uncertainties in the es-timation of the water budgets in XH Lagoon could be upto 25 % if aquaculture effluents were considered as in theWWE (210× 106 m3 yr−1; Liu et al., 2011), and could beup to 14 % for LYH Lagoon. Hence, PO3−
4 and DON bud-gets in XH Lagoon would reverse a source to a sink if SGDand aquaculture effluents were considered, while the NO−
2budget would switch from a source to a sink if aquacultureeffluents were considered in LYH Lagoon. More nutrientswould be found to be stored in XH and LYH lagoons if SGDand aquaculture effluents were taken into account. In addi-tion, domestic sewage and agriculture pollutants (e.g., pesti-cides and fertilizers) were not included in the water budgets.Sewage is an important source of nutrients for freshwater andcoastal marine ecosystems (Bouwman et al., 2013). There-fore, more studies on nutrient transport related to submarinegroundwater, wastewater and aquaculture are needed.
4.4 Role of typhoon in biogeochemistry of nutrients
Typhoons are an important natural phenomenon that can af-fect the biogeochemistry of nutrients in coastal zones. Nu-trient biogeochemistry would be changed in a short time,especially in small rivers during storm events. The easternHainan Island has the highest precipitation on the island withincreasing rate at 2.228 mm yr−1 (Wang et al., 2006), andtyphoon–induced rainfall can account for 36 % of total an-nual rainfall (Wang, 1985). The effect of land-derived anthro-pogenic nutrients can be reinforced by typhoon-related rain-fall (Jennerjahn, 2012). Increased N and P loading in riverscan enhance rates of photosynthetic and heterotrophic pro-ductivity, resulting in fundamental changes to aquatic foodwebs (Bouwman et al., 2013).
Typhoon Damrey made landfall on the eastern Hainan Is-land on 25 September 2005, with> 300 mm of rainfall oc-curring on 26 September (Zheng and Tang, 2007). The dailywater discharge from the WQ increased from 64.4 m3 s−1
to 278 m3 s−1 following the first rainfall event (approxi-mately 118 mm) in April 2009. Typhoon Kammuri madelandfall along the south coast of China in the western partof the Guangdong province on 6 August 2008. On 7 August2008 it passed the study area in a distance of approximately200 km. The daily water discharge of Nandu River, whichempties into Qiongzhou Strait, increased from 249 m3 s−1
on 6 August 2008 to 1615 m3 s−1 on 7 August. The WQdischarge gradually increased over the following few daysand peaked at 220 m3 s−1 five days after the typhoon. Fresh-water (salinity= 0) reached the estuary mouth following thetyphoon, where, prior to the typhoon, salinity was approxi-mately 31 in the WQE. SPM concentrations increased from3.05–21.5 mg L−1 to 12.0–23.3 mg L−1 in the estuary. Nutri-ent fluxes from the WQE to the SCS following the typhoonin August 2008 exceeded the pre-typhoon fluxes by a fac-tor of 2.6–4.7. River discharges, SPM and nutrients derived
from agriculture, aquaculture and urban effluents exportedinto coastal water also increased in the WWE following thetyphoon (Herbeck et al., 2011; Liu et al., 2011), and the coralreef was affected by the large nutrient and SPM loads (Roderet al., 2013). A violent typhoon made landfall at Wanning inOctober 2000. Terrigenous material from towns, cultivatedareas and fish ponds adjacent to XH Lagoon was transportedto the sea, accompanied by typhoon-induced rainfall (Tianand Li, 2007). These results show that the influence of hu-man activities is strengthened by typhoon phenomena. If ty-phoons, which, like Damrey and Kammuri, are often accom-panied by heavy rainfall directly made landfall in the studyarea, large fluvial discharge is caused. Large quantities of dis-solved and particulate materials must be exported to coastalwaters as a result. Observations in August 2007 took placefollowing a typhoon event; low salinity (22.0) with high nu-trients (NO−
3 : 25.0 µM) appeared in coastal waters off theWQE (Fig. 3a). In addition, atmospheric deposition duringnormal typhoon events (rainfall 300 mm; Liu et al., 2011) inthe study coastal region could represent approximately 11,17 and 10 % of the annual atmospheric deposition of DIN,PO3−
4 and DSi, respectively. The offshore waters are moreeasily affected by typhoon rainfall than by normal rainfalldischarge, which tends to be confined to the coastal shelf.
Upwelling is a significant source of the nutrients (particu-larly PO3−
4 ) that enter the shelf ecosystem and affect phy-toplankton succession (Liu et al., 2000; Ou et al., 2008).Upwelling events occur frequently during the summer mon-soon period along the eastern Hainan shelf (Su et al., 2011a).Additionally, typhoons potentially affecting Hainan Islandmainly occur from May to November (Ren et al., 2002; Liuet al., 2011). The combination of a typhoon and upwellingcould enhance phytoplankton biomass production by caus-ing transport of nutrient-rich water from estuaries to offshoreand bringing deep waters to surface along the eastern Hainancoast. Zheng and Tang (2007) reported that two phytoplank-ton blooms were triggered by Typhoon Damrey which passedthrough the Hainan Island during September 2005 due to nu-trients transport from land and below to the surface water viaupwelling.
Tropical storms are likely to increase in strength, duration,destructiveness and frequency in response to global climatechange (Knutson et al., 2010; Kaiser et al., 2013). For coastalwaters this will result in more frequent short-term changes tofreshwater and nutrient inputs, especially in the study areawhere the water residence time is so short and easily in-terrupted. Increased hurricane/typhoon activity may enhancesilicate weathering rates and exacerbate current sediment de-livery loads, thereby increasing POC delivery and burial inmountainous rivers (Goldsmith et al., 2008). Hence, more re-search on the influence of typhoons is needed.
Biogeosciences, 11, 481–506, 2014 www.biogeosciences.net/11/481/2014/
R. H. Li et al.: Nutrient dynamics in tropical rivers, lagoons, and coastal ecosystems 503
5 Conclusions
This study has provided data for dissolved and particulatenutrient concentrations along the eastern Hainan Island dur-ing both the wet and the dry season. Under the combinedeffects of natural processes and human activities (includ-ing agriculture, aquaculture and urban wastewater), largequantities of nutrients are transported to, and affect, thecoastal ecosystems.
All nutrients showed seasonal variation and decreasedfrom rivers towards the coast. The nutrients in rivers weremainly affected by agriculture; they were enriched with DINand DSi, and depleted in PO3−
4 . As a result of human ac-tivities the DIN areal yields were apparently higher thanthe average yields reported for large tropical and nontropi-cal rivers. The PO3−
4 concentrations and areal yields in riverswere lower than those reported for other tropical rivers. Thedissolved silicate levels and areal yields were higher than inother tropical river systems worldwide because of rock typeand the high rate of chemical weathering. TDP was domi-nated by DOP, and the PP contribution to TP was significant.
Nutrient processes in the lagoons were significantly af-fected by riverine inputs, aquaculture activities and ground-water. The estuaries and lagoons have short response timesto flood events, and large quantities of nutrients were trans-ported to the eastern coast of Hainan Island. A simple steady-state box model was used to construct nutrient budgets toinvestigate nutrient biogeochemical process along the east-ern coast of Hainan Island. The model’s results indicate thatriverine input is the major source of nutrients to the WWE,WQE and XH Lagoon, and GW is the major source of nu-trient input to LYH Lagoon. Particularly riverine nitrogenand phosphorus export into coastal areas from anthropogenicland-based sources. Most nutrients would be buried in thesediment or transformed into other forms in the lagoons. Nu-trient ratios showed that the potential limiting nutrient forphytoplankton growth within the coral reef region was P be-cause of large quantities of nitrogen inputs from terrestrial,while N was the limiting nutrient for phytoplankton growthin the coastal waters of the northern South China Sea. Nutri-ent inputs to the coastal ecosystem increased with typhoon-induced runoff of rainwater, elucidating the important impactof typhoons on small tropical rivers.
Supplementary material related to this article isavailable online athttp://www.biogeosciences.net/11/481/2014/bg-11-481-2014-supplement.pdf.
Acknowledgements.This study was supported by the LANCET(Land-Sea Interactions along Coastal Ecosystems of TropicalChina: Hainan) and was funded by the Ministry of Science andTechnology of the People’s Republic of China (2007DFB20380,2014CB441502) within the framework of a Chinese–German joint
study and the Chinese Natural Sciences Foundation (40925017,41376086). The authors thank their colleagues at the Centerfor Tropical Marine Ecology, the Hainan Provincial MarineDevelopment Plan and Design Research Institute, Second Instituteof Oceanography, East China Normal University, and the OceanUniversity of China for their help with field investigations.
Edited by: H. Liu
References
Alongi, D. M. (Eds): Coastal Ecosystem Processes, CRC Press, 419pp., 1998.
Aspila, K. I., Agemian, H., and Chau, A. S. Y.: A semiautomaticmethod for the determination of inorganic, organic and totalPhosphorus in sediment, Analyst, 101, 187–197, 1976.
Bao, H. Y., Wu, Y., Unger, D., Du, J. Z., Herbeck, L. S., and Zhang,J.: Impact of the conversion of mangroves into aquaculture pondson the sedimentary organic matter composition in a tidal flat es-tuary (Hainan Island, China), Cont. Shelf Res., 57, 82–91, 2013.
Bouwman, A. F., Bierkens, M. F. P., Griffioen, J., Hefting, M. M.,Middelburg, J. J., Middelkoop, H., and Slomp, C. P.: Nutrientdynamics, transfer and retention along the aquatic continuumfrom land to ocean: towards integration of ecological and bio-geochemical models, Biogeosciences, 10, 1–22, doi:10.5194/bg-10-1-2013, 2013.
Brzezinski, M. A.: The Si/C/N ratios of marine diatoms: interspe-cific variability and the effect of some environmental variables,J. Phycol., 21, 345–357, 1985.
Burford, M. A. and Williams, K. C.: The fate of nitrogenous wastefrom shrimp feeding, Aquaculture, 198, 79–93, 2001.
Cai, W. J., Dai, M. H.,Wang, Y. S., Zhai, W. D., Huang, T., Chen, S.T., Zhang, F., Chen, Z. Z., and Wang, Z. H.: The biogeochemistryof inorganic carbon and nutrients in the Pearl River estuary andadjacent Northern South China Sea, Cont. Shelf Res., 24, 1301–1319, 2004.
Chai, F., Xue, H. J., and Shi, M. C.: Upwelling east of Hainan Is-land. Oceanography in China (13), Ocean Press, Beijing, 105–116, 2001 (in Chinese with English abstract).
Chen, Y. L. L. and Chen, H. Y.: Seasonal dynamics of primary andnew production in the northern South China Sea: The signifi-cance of river discharge and nutrient advection, Deep-Sea Res.Pt. I, 53, 971–986, 2006.
Chu, P. C., Edmons, N. L., and Fan, C.: Dynamical mechanisms forthe South China Sea seasonal circulation and thermohaline vari-abilitie, J. Phys. Oceanogr., 29, 2971–2989, 1999.
Conley, D. J.: River contribution of biogenic silica to the oceanicsilica budget, Limnol. Oceanogr., 42, 774–777, 1997.
Cornelis, J.-T., Delvaux, B., Georg, R. B., Lucas, Y., Ranger, J., andOpfergelt, S.: Tracing the origin of dissolved silicon transferredfrom various soil-plant systems towards rivers: a review, Biogeo-sciences, 8, 89–112, doi:10.5194/bg-8-89-2011, 2011.
Dürr, H. H., Laruelle, G. G., van Kempen, C. M., Slomp, C. P., Mey-beck, M., and Middelkoop, H.: Worldwide typology of nearshorecoastal systems: defining the estuarine filter of river inputs to theoceans, Estuar. Coast., 34, 441–458, 2011.
Engeland, T. V., Soetaert, K., Knuijt, A., Laane, R. W. P. M., andMiddelburg, J. J.: Dissolved organic nitrogen dynamics in the
www.biogeosciences.net/11/481/2014/ Biogeosciences, 11, 481–506, 2014

504 R. H. Li et al.: Nutrient dynamics in tropical rivers, lagoons, and coastal ecosystems
North Sea: A time series analysis (1995–2005), Estuar. Coast.Shelf S., 89, 31–42, 2010.
Fang, T. H.: Phosphorus speciation and budget of the East ChinaSea, Cont. Shelf Res., 24, 1285–1299, 2004.
Gattuso, J. P., Frankignoulle, M., and Wollast, R.: Carbon and car-bonate metabolism in coastal aquatic ecosystems, Annu. Rev.Ecol. Syst., 29, 405–434, 1998.
Ge, C. D., Slaymaker, O., and Pedersen, T. F.: Change in the sed-imentary environment of Wanquan river Estuary, Hainan Island,China, Chinese Sci. Bull., 48, 2357–2361, 2004 (in Chinese withEnglish abstract).
Goldsmith, S. T., Carey, A. E., Lyons, W. B., Kao, S. J., Lee, T. Y.,and Chen, J.: Extreme storm events, landscape denudation, andcarbon sequestration: Typhoon Mindulle, Choshui River, Taiwan,Geology, 36, 483–486, 2008.
Gong, W. P., Shen, J., and Jia, J. J.: The impact of human activitieson the flushing properties of a semi-enclosed lagoon: Xiaohai,Hainan, China, Mar. Environ. Res., 65, 62–76, 2008.
Gordon, D. C., Boudreau, P. R., Mann, K. H., Ong, J.-E., Silvert,W. L., Smith, S. V., Wattayakorn, G., Wulff, F., and Yanagi, T.:LOICZ Biogeochemical Modeling Guidelines. LOICZ Reportsand Studies (5), LOICZ, Texel, The Netherlands, 96 pp., 1996.
Halpern, B. S., Walbridge, S., Selkoe, K. A., Kappel, C. V., Micheli,F., D’Agrosa, C., Bruno, J. F., Casey, K. S., Ebert, C., Fox, H. E.,Fujita, R., Heinemann, D., Lenihan, H. S., Madin, E. M. P., Perry,M. T., Selig, E. R., Spalding, M., Steneck, R., and Watson, R.: Aglobal map of human impacts on marine ecosystems, Science,319, 948–952, 2008.
Han, A. Q., Dai, M. H., Kao, S. J., Gan, G. P., Li, Q., Wang, L.F., Zhai, W. D., and Wang, L.: Nutrient dynamics and biologi-cal consumption in a large continental shelf system under theinfluence of both a river plume and coastal upwelling, Limnol.Oceanogr., 57, 486–502, 2012.
Han, Y. S., Fu, C. Q., Tang, Q. J., and Xu, J.: The influence of nitro-gen application to yield of rice and nitrogen utilization in tropicalregion, Guangdong Agri. Sci., 37, 102–103, 2010 (in Chinese).
Hansen, H. P. and Koroleff, F.: Determination of nutrients, in: Meth-ods of Seawater Analysis, edited by: Grasshoff, K., Kremling,K., and Ehrhardt, M., Weinheim, New York, Chiester, Brisbane,Singapore, Toronto, WILEY-VCH, 159–228, 1999.
Herbeck, L. S., Unger, D., Krumme, U., Liu, S. M., and Jennerjahn,T. C.: Typhoon-induced precipitation impact on nutrient and sus-pended matter dynamics of a tropical estuary affected by humanactivities in Hainan, China, Estuar. Coast. Shelf S., 93, 375–388,2011.
Herbeck, L. S., Unger, D., Wu, Y., and Jennerjahn, T. C.: Effluent,nutrient and organic matter export from shrimp and fish pondscausing eutrophication in coastal and back-reef waters of NEHainan, Tropical China, Cont. Shelf Res., 57, 92–104, 2013.
Huang, B. Q., Ou, L. J., Hong, H. S., Luo, H. W., and Wang, D.Z.: Bioavailability of dissolved organic phosphorus compoundsto typical harmful dinoflagellateProrocentrum donghaienseLu,Mar. Pollut. Bull., 51, 838–844, 2005.
Jennerjahn, T. C.: Biogeochemical response of tropical coastal sys-tems to present and past environmental change, Earth–Sci. Rev.,114, 19–41, 2012.
Jennerjahn, T. C., Ittekkot, V., Klöpper, S., Adi, S., Nugroho, S.P., Sudiana, N., Yusmal, A., and Prihartanto, B. G. -H.: Biogeo-chemistry of a tropical river affected by human activities in its
catchment: Brantas River estuary and coastal waters of MaduraStrait, Java, Indonesia, Estuar. Coast. Shelf S., 60, 503–514,2004.
Jennerjahn, T. C., Soman, K., Ittekkot, V., Nordhaus, I., Sooraj, S.,Priya, R. S., and Lahajnar, N.: Effect of land use on the biogeo-chemistry of dissolved nutrients and suspended and sedimentaryorganic matter in the tropical Kallada River and Ashtamudi estu-ary, Kerala, India, Biogeochemistry, 90, 29–47, 2008.
Jennerjahn, T. C., Nasir, B., and Pohlenga, I.: Spatio-temporal vari-ation of dissolved inorganic nutrients related to hydrodynamicsand land use in the mangrove-fringed Segara Anakan Lagoon,Java, Indonesia, Reg. Environ. Change, 9, 259–274, 2009.
Ji, T., Du, J. Z., Moore, W. S., Zhang, G. S., Su, N., and Zhang,J.: Nutrient inputs to a lagoon through submarine groundwaterdischarge: The case of Laoye Lagoon, Hainan, China, J. Mar.Syst., 111–112, 253–262, 2013.
Jia, J. J., Gao, J. H., Liu, Y. F., Gao, S., and Yang, Y.: Environmentalchanges in Shamei Lagoon, Hainan Island, China: Interactionsbetween natural processes and human activities, J. Asian EarthSci., 52, 158–168, 2012.
Jing, Z. Y., Qi, Y. Q., Hua, Z. L., and Zhang, H.: Numerical study onthe summer upwelling system in the northern continental shelf ofthe South China Sea, Cont. Shelf Res., 29, 467–478, 2009.
Kaiser, D., Unger, D., Qiu, G. L., Zhou, H. L., and Gan, H. Y.: Nat-ural and human influences on nutrient transport through a smallsubtropical Chinese estuary, Sci. Total Environ., 450/451, 92–107, 2013.
Knutson, T. R., McBride, J. L., Chan, J., Emanuel, K., Holland, G.,Landsea, C., Held, I., Kossin, J. P., Srivastava, A. K., and Sugi,M.: Tropical cyclones and climate change, Nat. Geosci., 3, 157–163, 2010.
Kress, N., Thingstad, T. F., Pitta, P., and Psarra, S.: Effect of P and Naddition to oligotrophic Eastern Mediterranean waters influencedby near-shore waters: A microcosm experiment, Deep-Sea Res.Pt. II, 52, 3054–3073, 2005.
Krumme, U., Herbeck, L. S., and Wang, T. C.: Tide- and rainfall-induced variations of physical and chemical parameters in amangrove-depleted estuary of East Hainan (South China Sea),Mar. Environ. Res., 82, 28–39, 2012.
Lebo, M. E. and Sharp, J. H.: Distribution of phosphorus along theDelaware, an urbanized coastal plain estuary, Estuar. Coast., 16,290–301, 1993.
Li, D.: The Study on the HydroChemical Characteristics and theFlux to the Sea About Rivers in the East of China, Master Thesis,East China Normal University Press, Shanghai, China, 106 pp.,2009 (in Chinese).
Li, K. Z., Yin, J. Q., Huang, L. M., Lian, S. M., Zhang, J. L., andLiu, C. G.: Monsoon–forced distribution and assemblages of ap-pendicularians in the northwestern coastal waters of South ChinaSea, Estuar. Coast. Shelf S., 89, 145–153, 2010.
Li, K. Z., Yin, J. Q., Huang, L. M., Zhang, J. L., Lian, S. M., and Liu,C. G.: Distribution and abundance of thaliaceans in the northwestcontinental shelf of South China Sea, with response to environ-mental factors driven by monsoon, Cont. Shelf Res., 31, 979–989, 2011a.
Li, Q. P., Franks, P. J. S., Ohman, M. D., and Landry, M. R.: En-hanced nitrate fluxes and biological processes at a frontal zonein the southern California current system, J. Plankton Res., 34,790–801, doi:10.1093/plankt/fbs006, 2012.
Biogeosciences, 11, 481–506, 2014 www.biogeosciences.net/11/481/2014/

R. H. Li et al.: Nutrient dynamics in tropical rivers, lagoons, and coastal ecosystems 505
Li, R. H., Liu, S. M., Zhang, G. L., Ren, J. L., and Zhang, J.: Biogeo-chemistry of nutrients in an estuary affected by human activities:The Wanquan River estuary, eastern Hainan Island, China, Cont.Shelf Res., 57, 18–31, 2013.
Li, Y. W., Liu, S. M., Zhu, Z. Y., Zhang, G. L., Li, R. H., and Zhang,J.: Distribution and budget of particulate of phosphorus and silicain Wanquanhe River estuary, Acta Oceanol. Sinica, 33, 180–188,2011b (in Chinese with English abstract).
Liu, K. -K., Tang, T. Y., Gong, G. -C., Chen, L. -Y., and Shiah, F. -K.: Cross-shelf and along-shelf nutrient fluxes derived from flowfields and chemical hydrography observed in the southern EastChina Shelf off northern Taiwan, Cont. Shelf Res., 20, 493–523,2000.
Liu, S. M., Zhang, J., Chen, H. T., and Zhang, G. S.: Factors influ-encing nutrient dynamics in the eutrophic Jiaozhou Bay, NorthChina, Prog. Oceanogr., 66, 66–85, 2005.
Liu, S. M., Li, X. N., Zhang, J., Wei, H., Ren, J. L., and Zhang,G. L.: Nutrient dynamics in Jiaozhou Bay, Water Air Soil Pollut:Focus, 7, 625–643, 2007.
Liu, S. M., Ye, X. W., Zhang, J., Zhang, G. S., and Wu, Y.: Thesilicon balance in Jiaozhou Bay, North China, J. Marine Syst.,74, 639–648, 2008.
Liu, S. M., Hong, G.-H., Zhang, J., Ye, X. W., and Jiang, X. L.:Nutrient budgets for large Chinese estuaries, Biogeosciences, 6,2245–2263, 2009,http://www.biogeosciences.net/6/2245/2009/.
Liu, S. M., Li, R. H., Zhang, G. L., Wang, D. R., Du, J. Z., Her-beck, L. S., Zhang, J., and Ren, J. L.: The impact of anthro-pogenic activities on nutrient cycling dynamics in the tropicalWenchanghe and Wenjiaohe Estuary and Lagoon system in EastHainan, China, Mar. Chem., 125, 49–68, 2011.
Liu, X. J. and Ge, C. D.: Spatial and temporal variations of sedi-mented organic matter in Xiaohai Lagoon, Hainan Island, ActaOceanol. Sin., 31, 74–86, 2012.
Liu, X. J., Ge, C. D., Chen, P. P., and Shi, X. D.: Anthropogenic im-pact on the sedimentary environment of Xiaohai Lagoon, HainanIsland, Environ. Chem., 26, 384–387, 2007 (in Chinese with En-glish abstract).
Ludwig, W., Dumont, E., Meybeck, M., and Heussner, S.: Riverdischarges of water and nutrients to the Mediterranean and BlackSea: Major drivers for ecosystem changes during past and futuredecades?, Prog. Oceanogr., 80, 199–217, 2009.
Luo, X., Liu, S. M., Zhang, J., Ye, X. W., Zhang, G. S., Ren, J. L.,and Zhang, G. L.: A study on particulate biogenic silica and otherfactors in Jiaozhou Bay, Periodical of Ocean University of China,38, 627–634, 2008 (in Chinese with English abstract).
Mao, L. M., Zhang, Y. L., and Bi, H.: Modern pollen deposits incoastal mangrove swamps from northern Hainan Island, China,J. Coast. Res., 22, 1423–1436, 2006.
Meunier, J. D., Braun, J. J., Riotte, J., Kumar, C., and Sekhar, M.:Importance of weathering and human perturbations on the river-ine transport of Si, Appl. Geochem., 26, S360–S362, 2011.
Ning, X., Cai, F., Xue, H., Cai, Y., Liu, C., and Shi, J.: Physical-biological oceanographic coupling influencing phytoplanktonand primary production in the South China Sea, J. Geophys. Res.,109, C10005, doi:10.1029/2004JC002365, 2004.
Ou, L. J., Wang, D., Huang, B. Q., Qi, Y. Z., and Lu, S. H.: Com-parative study of phosphorus strategies of three typical harmful
algae in Chinese coastal waters, J. Plankton Res., 30, 1007–1017,2008.
Pan, Y. Z., Song, F., Gao, J. X., Jin, Y., Fu, G. J., and Ye, N. L.:Study on aquatic ecological pollution in inshore areas in HainanProvince, Res. Environ. Sci., 20, 58–63, 2007 (in Chinese withEnglish abstract).
Prastka, K. E. and Malcolm, S. J.: Particulate phosphorus in theHumber estuary, Aquat. Ecol., 28, 397–403, 1994.
Qiu, D. J., Huang, L. M., Zhang, J. L., and Lin, S. J.: Phytoplanktondynamics in and near the highly eutrophic Pearl River Estuary,South China Sea, Cont. Shelf Res., 30, 177–186, 2010.
Qu, H. J. and Kroeze, C.: Past and future trends in nutrients exportby rivers to the coastal waters of China, Sci. Total Environ., 408,2075–2086, 2010.
Ragueneau, O., Savoye, N., Del Amo, Y., Cotton, J., Tardiveau, B.,and Leynaert, A.: A new method for the measurement of biogenicsilica in suspended matter of coastal waters: using Si:Al ratios tocorrect for the mineral interference, Cont. Shelf Res., 25, 697–710, 2005.
Ren, F., Gleason, B., and Easterling, D.: Typhoon impacts onChina’s precipitation during 1957–1996, Adv. Atmos. Sci., 19,943–952, 2002.
Roder, C., Wu, Z. J., Richter, C., and Zhang, J.: Coral reef degrada-tion and metabolic preformance of the scleractinian coralPoritesluteaunder anthropogenic impact along the NE coast of HainanIsland, South China Sea, Cont. Shelf Res., 57, 123–131, 2013.
Savchuk, O. P.: Resolving the Baltic Sea into seven subbasins: Nand P budgets for 1991–1999, J. Mar. Syst., 56, 1–15, 2005.
Seitzinger, S. P., Harrison, J. A., Dumont, E., Beusen, A. H.W., and Bouwman, A. F.: Sources and delivery of carbon,nitrogen, and phosphorus to the coastal zone: an overviewof global nutrient export from watersheds (NEWS) modelsand their application, Global Biogeochem. Cy., 19, GB4S01,doi:10.1029/2005GB002606, 2005.
Smith, J., Burford, M. A., Revill, A. T., Haese, R. R., and For-tune, J., Effect of nutrient loading on biogeochemical processesin tropical tidal creeks, Biogeochemistry, 108, 359–380, 2012.
Smith, S. V., Swaney, D. P., Talaue-McManus, L., Bartley, J. D.,Sandhei, P. T., McLaughlin, C. J., Dupra, V. C., Crossland, C.J., Buddemeier, R. W., Maxwell, B. A., and Wulff, F.: Humans,hydrology, and the distribution of inorganic nitrogen loading tothe ocean, Bioscience, 53, 235–245, 2003.
Spivak, A. C., Canuel, E. A., Duffy, J. E., and Richardson, J. P.:Nutrient enrichment and food web composition affect ecosystemmetabolism in an experimental seagrass habitat, PLoS ONE, 4,e7473, doi:10.1371/journal.pone.0007473, 2009.
Statistical Bureau of Hainan Province, Survey Office of NationalBureau of Statistics in Hainan: Hainan Statistical Yearbook,China Statistic Press, Beijing, 654 pp., 1992 (in Chinese).
Statistical Bureau of Hainan Province, Survey Office of NationalBureau of Statistics in Hainan: Hainan Statistical Yearbook,China Statistic Press, Beijing, 461 pp., 2009 (in Chinese).
Statistical Bureau of Hainan Province, Survey Office of NationalBureau of Statistics in Hainan: Hainan Statistical Yearbook,China Statistic Press, Beijing, 460 pp., 2010 (in Chinese).
Su, J. and Pohlmann, T.: Wind and topography influence on an up-welling system at the eastern Hainan coast, J. Geophys. Res.,114, C06017, doi:10.1029/2008JC005018, 2009.
www.biogeosciences.net/11/481/2014/ Biogeosciences, 11, 481–506, 2014

506 R. H. Li et al.: Nutrient dynamics in tropical rivers, lagoons, and coastal ecosystems
Su, J., Wang, J., Pohlmann, T., and Xu, D. F.: The influence of mete-orological variation on the upwelling system off eastern Hainanduring summer 2007–2008, Ocean Dynam., 61, 717–730, 2011a.
Su, J. L.: Overview of the South China Sea circulation and its in-fluence on the coastal physical oceanography outside the PearlRiver Estuary, Cont. Shelf Res., 24, 1745–1760, 2004.
Su, N., Du, J. Z., Moore, W. S., Liu, S. M., and Zhang, J.: An ex-amination of groundwater discharge and the associated nutrientfluxes into the estuaries of eastern Hainan Island, China using226Ra, Sci. Total Environ., 409, 3909–3918, 2011b.
Sun, Y. J.: Application of sedimentary organic biomarkers assources tracer and environmental change indicator: case studiesin Hainan and the rivers in the east of China, Master Thesis, EastChina Normal University Press, Shanghai, China, 111 pp., 2011(in Chinese with English abstract).
Tang, D. L., Kawamura, H., Lee, M. -A., and Dien, T. V.: Seasonaland spatial distribution of chlorophyll-a concentrations and waterconditions in the Gulf of Tonkin, South China Sea. Remote Sens,Environ., 85, 475–483, 2003.
Thomas, S. M., Neill, C., Deegan, L. A., Krusche, A. V., Ballester,V. M., and Victoria, R. L.: Influences of land use and streamsize on particulate and dissolved materials in a small Amazonianstream network, Biogeochemistry, 68, 135–151, 2004.
Tian, L. X.: Distributions of organic carbon in the East China Sea,Yellow Sea, northeastern Hainan Rivers and coasts, Master The-sis, East China Normal University Press, Shanghai, China, 117pp., 2009 (in Chinese with English abstract).
Tian, X. P. and Li, C. C.: The environmental disruption and trans-formation of Xiaohai Lagoon in Hainan, Mar. Environ. Sci., 26,91–94, 2007 (in Chinese with English abstract).
Turner, R. E., Rabalais, N. N., Justic, D., and Dortch, Q.: Globalpatterns of dissolved N, P and Si in large rivers, Biogeochemistry,64, 297–317, 2003.
Unger, D., Herbeck, L. S., Li, M., Bao, H. Y., Wu, Y., Zhang, J.,and Jennerjahn, T. C.: Sources, transformation and fate of partic-ulate amino acids and hexosamines under varying hydrologicalregimes in the tropical Wenchang/Wenjiao Rivers and Estuary,Hainan, China, Cont. Shelf Res., 57, 44–58, 2013.
Wang, B. C., Chen, S. L., Gong, W. P., Lin, W. Q., and Xu, Y. (Eds):Development and evolution of estuarine coast in Hainan Island,Ocean Press, Beijing, China, 214 pp., 2006 (in Chinese).
Wang, D.: Westward moving typhoons and typhoon damages in theHainan Island, Trop. Geogr., 5, 141–148, 1985 (in Chinese withEnglish abstract).
Wang, S., Wu, K. T., and Chen, M.: Analysis for precipitationchange trend of Hainan Island since 1961, J. Guangxi Meteor.,27, 24–28, 2006 (in Chinese with English abstract).
Wang, S. F., Tang, D. L., He, F. L., Fukuyo, Y., and Azanza, R. V.:Occurrences of harmful algal blooms (HABs) associated withocean environments in the South China Sea, Hydrobiologia, 596,79–93, 2008.
Wang, S. J., Li, C. C., and Tian, X. P.: Self-adjustment and dete-rioration of Xiaohai barrier-lagoon-tidal inlet system in HainanIsland, J. Oceanogr. in Taiwan Strait, 22, 248–253, 2003 (in Chi-nese with English abstract).
Wang, W. L., Chen, J. F., Jin, H. Y., Liu, J. D., Jin, M. M., Lu, Y.,Xue, B., Li, H. L., and Wang, K.: The distribution characteristicsand influence factors of some species phosphorus in waters ofthe Changjiang River Estuary in summer, J. Mar. Sci., 27, 32–41,2009 (in Chinese with English abstract).
Wang, Y.: Environmental characteristics of Hainan Island coast,Mar. Geol. Lett., 18, 1–9, 2002 (in Chinese with English ab-stract).
Wang, Y. (Eds): Tidal inlet of Hainan Island coast, EnvironmentalScience of China press, Beijing, China, 281 pp., 1998.
Wang, Y. H. and Li, R. Y.: Landscape ecological planning in south-east coastal zone in Hainan Island, Areal Res. Develop., 25, 103–107, 2006 (in Chinese with English abstract).
Wen, L.-S., Jiann, K.-T., and Liu, K.-K.: Seasonal variation and fluxof dissolved nutrients in the Danshuei Estuary, Taiwan: a hypoxicsubtropical mountain river, Estuar. Coast. Shelf S., 78, 694–704,2008.
Xu, J., Yin, K. D., He, L., Yuan, X. C., Ho, A. Y. T., and Harrison, P.J.: Phosphorus limitation in the northern South China Sea duringlate summer: influence of the Pearl River, Deep-Sea Res. Pt. I,55, 1330–1342, 2008.
Yin, K. D.: Monsoonal influence on seasonal variations in nutrientsand phytoplankton biomass in coastal waters of Hong Kong inthe vicinity of the Pearl River estuary, Mar. Ecol-Prog. Ser., 245,111–122, 2002.
Yu, G. H., Lu, P. D., and Qiao, S. L.: Environmental change andmanagement of Xiaohai Lagoon, Hainan, Mar. Geol. Lett., 18,39–40, 2002.
Yule, C. M., Boyero, L., and Marchant, R.: Effects of sediment pol-lution on food webs in a tropical river (Borneo, Indonesia), Mar.Freshwater Res., 61, 204–213, 2010.
Zeng, Z. X. and Zeng, X. Z. (Eds): Physicogeography of the HainanIsland, Science Press, Beijing, China, 1989 (in Chinese).
Zhang, J., Wang, D. R., Jennerjahn, T., and Dsikowitzky, L.: Land-Sea interactions at the East Coast of Hainan Island, South ChinaSea: A Synthesis, Cont. Shelf Res., 57, 132–142, 2013.
Zhang, K. R., Song, C. Y., and Chen, Y. X.: Records and disasterassessment of Typhoon in east Hainan Island in recent 50 years,J. Anhui Agri. Sci., 38, 12880–12882, 2010 (in Chinese with En-glish abstract).
Zhao, H., Tang, D. L., and Wang, D. X.: Phytoplankton blooms nearthe Pearl River Estuary induced by Typhoon Nuri, J. Geophys.Res., 114, C12027, doi:10.1029/2009JC005384, 2009.
Zheng, G. M. and Tang, D. L.: Offshore and nearshore chlorophyllincreases induced by typhoon winds and subsequent terrestrialrainwater runoff, Mar. Ecol-Prog. Ser., 333, 61–74, 2007.
Zhou, Z. G.: Mangrove system and development of Hainan Island.Ocean Develop, Manag., 4, 51–53, 2004.
Zhu, D. K., Yin, Y., and Martini, I. P.: Geomorphology of the Boaocoastal system and potential effects of human activities–HainanIsland, South China, J. Geogr. Sci., 15, 187–198, 2005.
Biogeosciences, 11, 481–506, 2014 www.biogeosciences.net/11/481/2014/