biological and water quality study of the ottawa river ... · biological and water quality study of...
TRANSCRIPT

State of OhioEnvironmental Protection Agency Division of Surface Water
Robert A. TaftGovernor, State of OhioChristopher JonesDirector, Ohio Environmental Protection AgencyP.O. Box 1049, Lazarus Government Center, 122 S. Front St., Columbus, Ohio 43216-1049
December 31, 1998
Biological and Water Quality Study ofThe Ottawa River Basin (1996)
Allen and Putnam Counties, Ohio
Mayfly
(Baetis intercalaris)
Common Carp
(Caprodes carpio)

MAS/1997-12-6 Ottawa River Basin TSD December 31 , 1998
Biological and Water Quality Study of the Ottawa River Basin (1996)
Allen and Putnam CountiesOhio
December 31, 1998
OEPA Technical ReportNumber MAS/1997-12-6
Division of Surface WaterP.O. Box 1049Lazarus Government Center122 S. Front St.Columbus, Ohio 43216-1049

MAS/1997-12-6 Ottawa River Basin TSD December 31 , 1998
i
TABLE OF CONTENTS
ACKNOWLEDGMENTS . . . . . . . . . . . . . . . . . . . . . . . . . . . . . . . . . . . . . . . . . . . . . . . . iiNOTICE TO USERS . . . . . . . . . . . . . . . . . . . . . . . . . . . . . . . . . . . . . . . . . . . . . . . . . . . iiiFORWARD . . . . . . . . . . . . . . . . . . . . . . . . . . . . . . . . . . . . . . . . . . . . . . . . . . . . . . . . . . . v
INTRODUCTION . . . . . . . . . . . . . . . . . . . . . . . . . . . . . . . . . . . . . . . . . . . . . . . . . . . . . 1SUMMARY OF THE 1996 RESULTS . . . . . . . . . . . . . . . . . . . . . . . . . . . . . . . . . . . . . . 2 Ottawa River . . . . . . . . . . . . . . . . . . . . . . . . . . . . . . . . . . . . . . . . . . . . . . . . . . . . . . 2 Other Tributaries . . . . . . . . . . . . . . . . . . . . . . . . . . . . . . . . . . . . . . . . . . . . . . . . . . 5 Attainment Table . . . . . . . . . . . . . . . . . . . . . . . . . . . . . . . . . . . . . . . . . . . . . . . . . . 7 Waterbody Segment Summary Table . . . . . . . . . . . . . . . . . . . . . . . . . . . . . . . . . . . 10 Environmental Indicator Response Matrix . . . . . . . . . . . . . . . . . . . . . . . . . . . . . . 12 Trend Attainment Map . . . . . . . . . . . . . . . . . . . . . . . . . . . . . . . . . . . . . . . . . . . . . . 13 MAJOR POINT SOURCE DISCHARGERS . . . . . . . . . . . . . . . . . . . . . . . . . . . . . . . . . . 14CONCLUSIONS . . . . . . . . . . . . . . . . . . . . . . . . . . . . . . . . . . . . . . . . . . . . . . . . . . . . . . . 28RECOMMENDATIONS . . . . . . . . . . . . . . . . . . . . . . . . . . . . . . . . . . . . . . . . . . . . . . . . . 30 Ottawa River . . . . . . . . . . . . . . . . . . . . . . . . . . . . . . . . . . . . . . . . . . . . . . . . . . . . . . 30 Waterbody Use Designation Table . . . . . . . . . . . . . . . . . . . . . . . . . . . . . . . . . . . . . 32STUDY AREA . . . . . . . . . . . . . . . . . . . . . . . . . . . . . . . . . . . . . . . . . . . . . . . . . . . . . . . . 33 Description . . . . . . . . . . . . . . . . . . . . . . . . . . . . . . . . . . . . . . . . . . . . . . . . . . . . . . . . 33 Study Area Map . . . . . . . . . . . . . . . . . . . . . . . . . . . . . . . . . . . . . . . . . . . . . . . . . . . 36 Site Location Table . . . . . . . . . . . . . . . . . . . . . . . . . . . . . . . . . . . . . . . . . . . . . . . . . 38METHODS . . . . . . . . . . . . . . . . . . . . . . . . . . . . . . . . . . . . . . . . . . . . . . . . . . . . . . . . . . . 41TRENDS . . . . . . . . . . . . . . . . . . . . . . . . . . . . . . . . . . . . . . . . . . . . . . . . . . . . . . . . . . . . . 46 Chemical Water Quality Trends . . . . . . . . . . . . . . . . . . . . . . . . . . . . . . . . . . . . . . . 46
Fish Kills and Chemical Spills . . . . . . . . . . . . . . . . . . . . . . . . . . . . . . . . . . . . . . . . . 75Fish Tissue 1996 . . . . . . . . . . . . . . . . . . . . . . . . . . . . . . . . . . . . . . . . . . . . . . . . . . . . 76
Biomarker Trends . . . . . . . . . . . . . . . . . . . . . . . . . . . . . . . . . . . . . . . . . . . . . . . . . . 78Physical Habitat for Aquatic Life . . . . . . . . . . . . . . . . . . . . . . . . . . . . . . . . . . . . . . 82Biological Trends: Macroinvertebrates . . . . . . . . . . . . . . . . . . . . . . . . . . . . . . . . . . 86Biological Trends: Fish Community . . . . . . . . . . . . . . . . . . . . . . . . . . . . . . . . . . . . 98
Integrated Biological Trends: ADVs and Attainment Status . . . . . . . . . . . . . . . . . 109 REFERENCES . . . . . . . . . . . . . . . . . . . . . . . . . . . . . . . . . . . . . . . . . . . . . . . . . . . . . . . 113
APPENDICES TO THE DATA OF THE 1996 REPORT Available in paper form only. Furnished upon request.

MAS/1997-12-6 Ottawa River Basin TSD December 31 , 1998
ii
AcknowledgmentsDave Altfater - Biomarker collections.Bernie Counts - Biomarker collections.Jack Freda - Macroinvertebrate field collections.Erin Gaskill - Chemical water quality/sediment trends (from the Indicator Project Report)Dan Glomski - Instream and sediment chemistry collection, pollutant loadings, facility descriptions,
chemical trends, and sediment chemistry. Martin Knapp - Macroinvertebrate community assessments and field collections, biomarker
analyses, chemical trends and sediment chemistry analyses, study area maps, and TSD editor.Robert Miltner - Fish community assessments.Katie McKibben - Study area description.Eric Nygaard - Pollutant loading trends (from the Indicator Project Report)Randy Sanders - Fish field collections.
Jeff DeShon, Marc Smith and Chris Yoder - Reviewers.
Water chemistry and organic/metal sediment analyses were provided by the Ohio EPA Division ofEnvironmental Services. Numerous college interns and District Office staff assisted in thecollection of field samples. Landowners who granted permission for site access are dulyappreciated.

MAS/1997-12-6 Ottawa River Basin TSD December 31 , 1998
iii
NOTICE TO USERS
Ohio EPA incorporated biological criteria into the Ohio Water Quality Standards (WQS; OhioAdministrative Code 3745-1) regulations in February 1990 (effective May 1990). These criteriaconsist of numeric values for the Index of Biotic Integrity (IBI) and Modified Index of Well-Being(MIwb), both of which are based on fish assemblage data, and the Invertebrate Community Index(ICI), which is based on macroinvertebrate assemblage data. Criteria for each index are specifiedfor each of Ohio's five ecoregions (as described by Omernik 1987), and are further organized byorganism group, index, site type, and aquatic life use designation. These criteria, along with theexisting chemical and whole effluent toxicity evaluation methods and criteria, figure prominentlyin the monitoring and assessment of Ohio’s surface water resources.
The following documents support the use of biological criteria by outlining the rationale for usingbiological information, the methods by which the biocriteria were derived and calculated, the fieldmethods by which sampling must be conducted, and the process for evaluating results:
Ohio Environmental Protection Agency. 1987a. Biological criteria for the protection of aquatic life:Volume I. The role of biological data in water quality assessment. Div. Water Qual. Monit.& Assess., Surface Water Section, Columbus, Ohio.
Ohio Environmental Protection Agency. 1987b. Biological criteria for the protection of aquatic life:Volume II. Users manual for biological field assessment of Ohio surface waters. Div. WaterQual. Monit. & Assess., Surface Water Section, Columbus, Ohio.
Ohio Environmental Protection Agency. 1989b. Addendum to Biological criteria for the protectionof aquatic life: Volume II. Users manual for biological field assessment of Ohio surfacewaters. Div. Water Qual. Plan. & Assess., Ecological Assessment Section, Columbus, Ohio.
Ohio Environmental Protection Agency. 1989c. Biological criteria for the protection of aquatic life:Volume III. Standardized biological field sampling and laboratory methods for assessingfish and macroinvertebrate communities. Div. Water Quality Plan. & Assess., Ecol. Assess.Sect., Columbus, Ohio.
Ohio Environmental Protection Agency. 1990. The use of biological criteria in the Ohio EPAsurface water monitoring and assessment program. Div. Water Qual. Plan. & Assess., Ecol.Assess. Sect., Columbus, Ohio.
Rankin, E.T. 1989. The qualitative habitat evaluation index (QHEI): rationale, methods, andapplication. Div. Water Qual. Plan. & Assess., Ecol. Assess. Sect., Columbus, Ohio.
Since the publication of the preceding guidance documents new publications by Ohio EPA havebecome available. The following publications should also be consulted as they represent the latest

MAS/1997-12-6 Ottawa River Basin TSD December 31 , 1998
iv
information and analyses used by Ohio EPA to implement the biological criteria.
DeShon, J.D. 1995. Development and application of the invertebrate community index (ICI),pp. 217-243. in W.S. Davis and T. Simon (eds.). Biological Assessment and Criteria: Tools for Risk-based Planning and Decision Making. Lewis Publishers, Boca Raton,FL.
Rankin, E. T. 1995. The use of habitat assessments in water resource management programs,pp. 181-208. in W. Davis and T. Simon (eds.). Biological Assessment and Criteria: Tools for Water Resource Planning and Decision Making. Lewis Publishers, BocaRaton, FL.
Yoder, C.O. and E.T. Rankin. 1995. Biological criteria program development andimplementation in Ohio, pp. 109-144. in W. Davis and T. Simon (eds.). BiologicalAssessment and Criteria: Tools for Water Resource Planning and Decision Making. Lewis Publishers, Boca Raton, FL.
Yoder, C.O. and E.T. Rankin. 1995. Biological response signatures and the area of degradationvalue: new tools for interpreting multimetric data, pp. 263-286. in W. Davis and T.Simon (eds.). Biological Assessment and Criteria: Tools for Water Resource Planningand Decision Making. Lewis Publishers, Boca Raton, FL.
Yoder, C.O. 1995. Policy issues and management applications for biological criteria, pp. 327-344. in W. Davis and T. Simon (eds.). Biological Assessment and Criteria: Tools forWater Resource Planning and Decision Making. Lewis Publishers, Boca Raton, FL.
Yoder, C.O. and E.T. Rankin. 1995. The role of biological criteria in water quality monitoring,assessment, and regulation. Environmental Regulation in Ohio: How to Cope With theRegulatory Jungle. Inst. of Business Law, Santa Monica, CA. 54 pp.
These documents and this report can be obtained by writing to:
Ohio EPA, Division of Surface WaterMonitoring and Assessment Section
1685 Westbelt DriveColumbus, Ohio 43228-3809
(614) 728-3377
FOREWORD

MAS/1997-12-6 Ottawa River Basin TSD December 31 , 1998
v
What is a Biological and Water Quality Survey?A biological and water quality survey, or “biosurvey”, is an interdisciplinary monitoring effortcoordinated on a waterbody specific or watershed scale. This effort may involve a relatively simplesetting focusing on one or two small streams, one or two principal stressors, and a handful ofsampling sites or a much more complex effort including entire drainage basins, multiple andoverlapping stressors, and tens of sites. Each year Ohio EPA conducts biosurveys in 10-15 differentstudy areas with an aggregate total of 250-300 sampling sites.
Ohio EPA employs biological, chemical, and physical monitoring and assessment techniques inbiosurveys in order to meet three major objectives: 1) determine the extent to which use designationsassigned in the Ohio Water Quality Standards (WQS) are either attained or not attained; 2)determine if use designations assigned to a given water body are appropriate and attainable; and 3)determine if any changes in key ambient biological, chemical, or physical indicators have takenplace over time, particularly before and after the implementation of point source pollution controlsor best management practices. The data gathered by a biosurvey is processed, evaluated, andsynthesized in a biological and water quality report. Each biological and water quality studycontains a summary of major findings and recommendations for revisions to WQS, futuremonitoring needs, or other actions which may be needed to resolve existing impairment ofdesignated uses. While the principal focus of a biosurvey is on the status of aquatic life uses, thestatus of other uses such as recreation and water supply, as well as human health concerns, are alsoaddressed.
The findings and conclusions of a biological and water quality study may factor into regulatoryactions taken by Ohio EPA (e.g., NPDES permits, Director’s Orders, the Ohio Water QualityStandards [OAC 3745-1]), and are eventually incorporated into Water Quality Permit SupportDocuments (WQPSDs), State Water Quality Management Plans, the Ohio Nonpoint SourceAssessment, and the Ohio Water Resource Inventory (305[b] report).
Hierarchy of IndicatorsA carefully conceived ambient monitoring approach, using cost-effective indicators comprised ofecological, chemical, and toxicological measures, can ensure that all relevant pollution sources arejudged objectively on the basis of environmental results. Ohio EPA relies on a tiered approach inattempting to link the results of administrative activities with true environmental measures. Thisintegrated approach is outlined in Figure 1 and includes a hierarchical continuum fromadministrative to true environmental indicators. The six “levels” of indicators include: 1) actionstaken by regulatory agencies (permitting, enforcement, grants); 2) responses by the regulatedcommunity (treatment works, pollution prevention); 3) changes in discharged quantities (pollutantloadings); 4) changes in ambient conditions (water quality, habitat); 5) changes in uptake and/orassimilation (tissue contamination, biomarkers, wasteload allocation); and, 6) changes in health,

Responsesby theRegulatedCommunitiy
Point Source Loadings -Effluent & InfluentWhole Effluent Toxicity (WET)NPDES ViolationsToxic Release InventorySpills & Other ReleasesFish Kills
Assimilative Capacity -TMDL/WLABiomarkersTissue Contamination
LEVEL 6
LEVEL 3
LEVEL 2
LEVEL 1
MAS/1997-12-6 Ottawa River Basin TSD December 31 , 1998
vi
Figure 1. Hierarchy of administrative and environmental indicators which can be used for waterquality management activities such as monitoring and assessment, reporting, and theevaluation of overall program effectiveness. This is patterned after a model developed byU.S. EPA (1995).

MAS/1997-12-6 Ottawa River Basin TSD December 31 , 1998
vii
ecology, or other effects (ecological condition, pathogens). In this process the results ofadministrative activities (levels 1 and 2) can be linked to efforts to improve water quality (levels 3,4, and 5) which should translate into the environmental “results” (level 6). Thus, the aggregateeffect of billions of dollars spent on water pollution control since the early 1970s can now bedetermined with quantifiable measures of environmental condition.
Superimposed on this hierarchy is the concept of stressor, exposure, and response indicators.Stressor indicators generally include activities which have the potential to degrade the aquaticenvironment such as pollutant discharges (permitted and unpermitted), land use effects, and habitatmodifications. Exposure indicators are those which measure the effects of stressors and can includewhole effluent toxicity tests, tissue residues, and biomarkers, each of which provides evidence ofbiological exposure to a stressor or bioaccumulative agent. Response indicators are generallycomposite measures of the cumulative effects of stress and exposure and include the more directmeasures of community and population response that are represented here by the biological indiceswhich comprise Ohio’s biological criteria. Other response indicators could include targetassemblages, i.e., rare, threatened, endangered, special status, and declining species or bacteriallevels which serve as surrogates for the recreational uses. These indicators represent the essentialtechnical elements for watershed-based management approaches. The key, however, is to use thedifferent indicators within the roles which are most appropriate for each.
Describing the causes and sources associated with observed impairments revealed by the biologicalcriteria and linking this with pollution sources involves an interpretation of multiple lines ofevidence including water chemistry data, sediment data, habitat data, effluent data, biomonitoringresults, land use data, and biological response signatures within the biological data itself. Thus theassignment of principal causes and sources of impairment represents the association of impairments(defined by response indicators) with stressor and exposure indicators. The principal reportingvenue for this process on a watershed or subbasin scale is a biological and water quality report.These reports then provide the foundation for aggregated assessments such as the Ohio WaterResource Inventory (305[b] report), the Ohio Nonpoint Source Assessment, and other technicalbulletins.
Ohio Water Quality Standards: Designated Aquatic Life UsesThe Ohio Water Quality Standards (WQS; Ohio Administrative Code 3745-1) consist of designateduses and chemical, physical, and biological criteria designed to represent measurable properties ofthe environment that are consistent with the goals specified by each use designation. Usedesignations consist of two broad groups, aquatic life and non-aquatic life uses. In applications ofthe Ohio WQS to the management of water resource issues in Ohio’s rivers and streams, the aquaticlife use criteria frequently result in the most stringent protection and restoration requirements, hencetheir emphasis in biological and water quality reports. Also, an emphasis on protecting for aquaticlife generally results in water quality suitable for all uses.
The five different aquatic life uses currently defined in the Ohio WQS are described as follows:

MAS/1997-12-6 Ottawa River Basin TSD December 31 , 1998
viii
1) Warmwater Habitat (WWH) - this use designation defines the “typical” warmwater assemblageof aquatic organisms for Ohio rivers and streams; this use represents the principal restorationtarget for the majority of water resource management efforts in Ohio.
2) Exceptional Warmwater Habitat (EWH) - this use designation is reserved for waters whichsupport “unusual and exceptional” assemblages of aquatic organisms which are characterizedby a high diversity of species, particularly those which are highly intolerant and/or rare,threatened, endangered, or special status (i.e., declining species); this designation representsa protection goal for water resource management efforts dealing with Ohio’s best waterresources.
3) Coldwater Habitat (CWH) - this use is intended for waters which support assemblages of coldwater organisms and/or those which are stocked with salmonids with the intent of providing aput-and-take fishery on a year round basis which is further sanctioned by the Ohio DNR,Division of Wildlife; this use should not be confused with the Seasonal Salmonid Habitat (SSH)use which applies to the Lake Erie tributaries which support periodic “runs” of salmonidsduring the spring, summer, and/or fall.
4) Modified Warmwater Habitat (MWH) - this use applies to streams and rivers which have beensubjected to extensive, maintained, and essentially permanent hydromodifications such that thebiocriteria for the WWH use are not attainable and where the activities have been sanctionedand permitted by state or federal law; the representative aquatic assemblages are generallycomposed of species which are tolerant to low dissolved oxygen, silt, nutrient enrichment, andpoor quality habitat.
5) Limited Resource Water (LRW) - this use applies to small streams (usually <3 mi. drainage area)2
and other water courses which have been irretrievably altered to the extent that no appreciableassemblage of aquatic life can be supported; such waterways generally include small streamsin extensively urbanized areas, those which lie in watersheds with extensive drainagemodifications, those which completely lack water on a recurring annual basis (i.e., trueephemeral streams), or other irretrievably altered waterways.
Chemical, physical, and/or biological criteria are generally assigned to each use designation inaccordance with the broad goals defined by each. As such the system of use designations employedin the Ohio WQS constitutes a “tiered” approach in that varying and graduated levels of protectionare provided by each. This hierarchy is especially apparent for parameters such as dissolvedoxygen, ammonia-nitrogen, temperature, and the biological criteria. For other parameters such asheavy metals, the technology to construct an equally graduated set of criteria has been lacking, thusthe same water quality criteria may apply to two or three different use designations.Ohio Water Quality Standards: Non-Aquatic Life UsesIn addition to assessing the appropriateness and status of aquatic life uses, each biological and waterquality survey also addresses non-aquatic life uses such as recreation, water supply, and human

MAS/1997-12-6 Ottawa River Basin TSD December 31 , 1998
ix
health concerns as appropriate. The recreation uses most applicable to rivers and streams are thePrimary Contact Recreation (PCR) and Secondary Contact Recreation (SCR) uses. The criterionfor designating the PCR use is simply having a water depth of at least one meter over an area of atleast 100 square feet or where canoeing is a feasible activity. If a water body is too small andshallow to meet either criterion the SCR use applies. The attainment status of PCR and SCR isdetermined using bacterial indicators (e.g., fecal coliforms, E. coli) and the criteria for each arespecified in the Ohio WQS.
Water supply uses include Public Water Supply (PWS), Agricultural Water Supply (AWS), andIndustrial Water Supply (IWS). Public Water Supplies are simply defined as segments within 500yards of a potable water supply or food processing industry intake. The Agricultural Water Supply(AWS) and Industrial Water Supply (IWS) use designations generally apply to all waters unless itcan be clearly shown that they are not applicable. An example of this would be an urban area wherelivestock watering or pasturing does not take place, thus the AWS use would not apply. Chemicalcriteria are specified in the Ohio WQS for each use and attainment status is based primarily onchemical-specific indicators. Human health concerns are additionally addressed with fish tissuedata, but any consumption advisories are issued by the Ohio Department of Health are detailed inother documents.
MAS/1997-12-6 Ottawa River Basin TSD December 31 , 1998
1
Biological and Water Quality Study of the Ottawa River Basin (1996)
(Allen and Putnam Counties Ohio)
INTRODUCTION
The 1996 Ottawa River study area consisted of the Ottawa River mainstem from Thayer Road (RM46.1) to near the mouth (RM 1.0). Subbasins sampled within the study area included Pike Run andPlum Creek. Two other tributaries within the Ottawa River study area were sampled - ZurmehleyCreek and the Little Ottawa River. See Table 4 and Figures 2-4 for a complete list of samplinglocations.
Specific objectives of this study were to:
1) evaluate the physical habitat, surface water and sediment quality, and the biological integrityof the Ottawa River study area,
2) assess impacts from municipal and industrial wastewater treatment plants, nonpoint sourcesof pollution, and habitat alterations,
3) determine attainment status of aquatic life and non-aquatic life use designations, andrecommend changes where appropriate, and
4) compare results of this survey with previous surveys to assesses changes in water quality andbiological integrity.
Previous biological and` water quality studies in the Ottawa River study area by the Ohio EPADivision of Surface Water include: Water Quality Study of the Ottawa River OEPA 79/1 (OhioEPA, 1979); Ottawa River WQTSD (Ohio EPA, 1985); Summary of the 1989 Biological and WaterQuality Survey of the Ottawa River, Allen and Putnam Counties, Ohio and Changes Since 1985(Ohio EPA, 1989); and Biological and Water Quality Study of the Ottawa River, Hog Creek, LittleHog Creek, and Pike Run (Ohio EPA, 1992).

MAS/1997-12-6 Ottawa River Basin TSD December 31 , 1998
2
SUMMARY OF THE 1996 RESULTS
A total of 82 miles of rivers and streams in the Ottawa River subbasin was assessed as part of the1996 survey. Biological index scores indicated that 14 miles (17.3 %) were in full attainment of theWarmwater Habitat (WWH) biocriteria. Approximately 16 miles (19.3 %) were in partial attainmentand 52 miles (63.4 %) were in non-attainment of WWH or Modified Warmwater Habitat (MWH)biocriteria (Table 1).
Ammonia, nutrients, organic enrichment, and pathogens were the leading causes (52 miles, 75 %)of the partial and non-attainment in the basin. The major sources were industrial and municipalpoint sources, combined sewer overflows (CSOs), and sanitary sewer overflows (SSOs). Associatedcauses and sources of partial and non-attainment are presented in Table 2.
A narrative matrix (Figure 2) was constructed summarizing selected environmental stressors (i.e.,cumulative load, spills, CSOs/SSOs, number of dams/pools, and concentrations of urban/industrialland use), exposures (i.e., sediment and fish tissue contamination levels, toxicity), and responseindicators (i.e., fish and macroinvertebrate indices, habitat quality). Designated aquatic life useattainment status was also included as part of the matrix. The shading darkens as the departure fromreference widens. While some ratings were necessarily general or based on ralative comparisons,they show that observed reductions in response indicators coincide with increased exposure and theincreasing prescence of external stressors from both point and nonpoint sources. The greatestdeclines in the biological community metrics were noted in segments within and downstream fromthe Lima WWTP, Clark Oil, and PCS Nitrogen, and coincided with high to very high stressor andexposure indicator levels.
Ottawa River MainstemOhio EPA monitoring in 1996 showed that there is a gradual, longitudinal loss (FULL to PARTIALto NON) of WWH aquatic life use attainment in the Ottawa River as it flows into and through Lima,followed by a gradual recovery (NON to PARTIAL to FULL) downstream from Lima between Elidaand the confluence with the Auglaize River. Compared to previous surveys, the results throughLima are unchanged, but the rate of improvement has increased in the downstream reaches (Figure3).
All biological indices attained the WWH criteria at the most upstream station, Thayer Road (RM46.1), and attained or were in nonsignificant departure at the next site downstream, Fetter Road (RM44.5). The Ottawa River flows through a series of low-head dams starting with the Metzger Roaddam (RM 43.5), and the proportion of tolerant and omnivorous fish increases. Although themacroinvertebrate communities attain WWH, the fish assemblages represent mostly fair conditionsin the segment between the Metzger Road dam and Sugar Street, resulting in partial attainment ofWWH biocriteria. Chemical water quality exceedences (iron, nitrate, and TDS) in the Ottawa Riverfrom Thayer Road to the City of Lima were found only at RM 43.45 and included the statewidecriteria for protection of human health for Public Water Supply (see Appendix Table).

MAS/1997-12-6 Ottawa River Basin TSD December 31 , 1998
3
Upstream from the Lima CSOs, fish indices downstream from Sugar Street (RM 40.8) to the LoversLane dam pool (RM 40.2) did not meet WWH biocriteria. Fish crews sampling in this reachobserved thick deposits of sewage solids next to an island near Schoonover Park. An area ofunsewered homes (with septic systems) along Findlay Road is the suspected source of theimpairment.
Within the series of dams and CSOs from RM 40.8 to RM 38.5, none of the fish sites sampled metWWH criteria. Qualitative Habitat Evaluation Index (QHEI) scores ranged from 44.5 to 51.0 andreflected the characteristics of the modified habitats caused by the series of lowhead dams withinthe City of Lima. Even the MWH impoundment criteria were not met for fish in this section exceptfor the MIwb at RM 40.8 and RM 38.5. Macroinvertebrates were sampled at RMs 40.1, 39.6, and38.6 in this reach. The site located in the Elm Street dam tailwaters between the Elm Street dam(RM 39.70) and the Central Street dam (RM 39.58) had good current velocity (>0.3 fps) over theartificial substrates. By contrast, the other two benthic sites sampled in this area had less thanoptimal flow over the artificial substrates but, more importantly, were directly downstream oradjacent to CSO control structures; neither site met the WWH criterion. Sludge deposits wereobserved by fish and macroinvertebrate crews downstream from the Lovers Lane and Collette Streetcontrol structures. The non-attainment of biological criteria from the Lovers Lane dam (RM 40.14)to the Lima WWTP dam (RM 37.96) was attributed to the City of Lima CSOs. Chemical waterquality exceedences detected downstream from the CSOs were mostly for dissolved oxygen. TheCSO outfalls 002-006 discharged a combined total of 1.4 MGD of wastewater; 1,125 kg/day of totalsuspended solids (TSS); and 90 kg/day of 5-day carbonaceous biochemical oxygen demand (CBOD )5
in 1996. The cumulative loadings from these CSOs occurred during rainfall events, but the impactsof those events were evident well after individual events had subsided.
Partial attainment of WWH biocriteria was observed downstream from the CSO control structuresand dams at RM 37.9, immediately upstream from both the Lima WWTP and L5 landfill. Fishindices either met or were in nonsignificant departure from WWH biocriteria. Although the ICIscore of 28 did not attain WWH biocriterion at this site, it showed a significant improvement overthe score of 6 determined in 1991. Fish and macroinvertebrate indices did not meet the WWHbiocriteria at the next station at RM 37.7. An increase in fish anomalies and a decrease in the ICI(28 to 14) was attributed to the L5 landfill. Leachate has been observed seeping into the river fromthe landfill since 1991 and there was large amount of oil observed adjacent to the landfill in 1996.There was a large release of oil observed and sampled that escaped the containment boom duringone of the 1996 sampling events (Sept. 4). There were 6 different chemical parameter exceedencesobserved at RM 37.7 in 1996. A large number of selenium exceedences (# of samples > 5 ug/l) weredocumented downstream from the BP Refinery discharge at chemical sampling stations from RM37.0 to RM 22.94.
The Lima WWTP discharges at RM 37.67. The macroinvertebrate communities improvedsignificantly from previous years at the site downstream from the Lima WWTP (RM 37.4, ICI = 42)and at the Shawnee Country Club (RM 34.5, ICI =38), but sites located downstream from BP Oil

MAS/1997-12-6 Ottawa River Basin TSD December 31 , 1998
4
and PCS Nitrogen remained poor and fair. Fish indices remained fair to poor at non-mixing zonesites from immediately upstream of the Lima WWTP (RM 37.7) to the Allentown dam (RM 28.9). The most significant change observed in water chemistry attributed to the Lima WWTP in the 1996survey was an increase in nitrate-nitrite-N in the Ottawa River from an average of 5.2 mg/l upstreamto 7.0 mg/l downstream from outfall 001. The average concentration of selenium was greater than5 ug/l in the Ottawa River for approximately 15 miles downstream from the BP Refinery outfall 001.Also, the BP Refinery outfall 001 had the highest mean oil and grease concentration (of the threemajor dischargers) reported during the 1996 survey.
The segment of the Ottawa River showing the most severe impact to fish communities wasdownstream from the PCS Nitrogen outfalls (RM 36.7 to RM 34.7). The lowest MIwb scores(excluding dam pool sites) and the lowest IBI scores were reported downstream from the PCSoutfalls (RM 36.0) to the Shawnee Country Club (RM 34.7), despite good habitat conditions. QHEIscores ranged from 79.5 to 84.0 in this section suggesting the potential for at least WWHperformance with improved water chemistry. The highest percentages of DELT (25.9 % to 48.8%)anomalies were also reported in this area. The single highest percentage of DELTs in the 1996Ottawa River survey was 48.8%, reported on 8/29/96 downstream from PCS outfall 001 at RM36.70. White suckers and common carp collected downstream from the PCS outfalls for biomarkeranalyses showed the highest levels of blood urea nitrogen (BUN). During the six chemical runs conducted by the Ohio EPA during the summer of 1996, the averageinstream concentrations of ammonia, BOD, iron, total Kjeldahl nitrogen, nitrite, phosphorus, andzinc increased in the Ottawa River downstream from the PCS-Nitrogen outfall 001 (RM 36.87).Exceedences of the 30-day average ammonia criterion occurred in 2 out of 6 sampling events at RM36.80 and 1 of 6 events at RM 36.3, a result of the PCS 001 effluent. Although urea was not ameasured instream parameter, the concentrations and loadings from the PCS outfalls are high. Thesite at RM 36.80 was the only location that chromium (30 ug/l detection level) and free cyanidewere detected instream, and these instream concentrations were attributed to the PCS 001 outfall.Chromium, copper, and zinc sediment concentrations were substantially higher downstream fromPCS-Nitrogen at RM 36.8 compared to upstream at RM 37.0. It was difficult to detect significant biological impacts from the Shawnee #2 WWTP (RM 32.5) andElida WWTP (RM 24.2) because of the overlying degradation extending downstream from Lima’smajor dischargers. However, fish and macroinvertebrate indices were slightly lower downstreamfrom the Shawnee #2 WWTP and Elida WWTP compared to upstream sites.
The mainstem changes from non attainment to partial attainment downstream from the Allentowndam, and then full attainment is reached in the lower 6 miles. The macroinvertebrate and fish MIwbscores generally attain biocriteria downstream from the Allentown dam to the mouth, but the fishIBI scores do not attain until the lower 6 miles. Relative to previous years, fish trophic function in1996 in the lower 6 miles, as judged by the relative abundance of omnivores and insectivores,recovers nearly to that expected for the ecoregion and stream size. Correspondingly, the absolute
MAS/1997-12-6 Ottawa River Basin TSD December 31 , 1998
5
and relative abundance of roundbodied suckers increased in the lower reach of the river. Oneconsequence of the increased abundance of redhorse was a commensurate increase in the numberof anomalous deformities, eroded fins, lesions or tumors (DELTs). Redhorse suckers are especiallysusceptible to accruing DELTs because of their sensitivity to pollution and low dissolved oxygenregimes. The high incidence of DELTs among this group demonstrates that the cumulativepollutant loadings to the river continue to stress the lower reach despite the recovery to fullattainment.
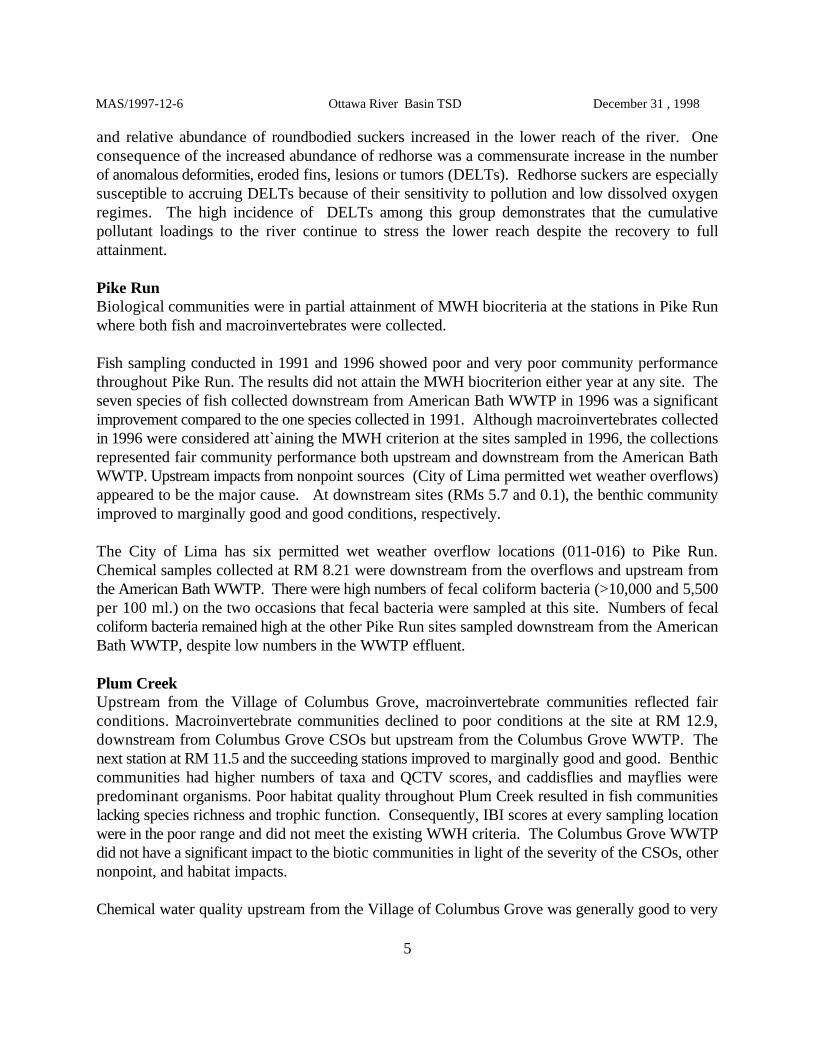
Pike RunBiological communities were in partial attainment of MWH biocriteria at the stations in Pike Runwhere both fish and macroinvertebrates were collected.
Fish sampling conducted in 1991 and 1996 showed poor and very poor community performancethroughout Pike Run. The results did not attain the MWH biocriterion either year at any site. Theseven species of fish collected downstream from American Bath WWTP in 1996 was a significantimprovement compared to the one species collected in 1991. Although macroinvertebrates collectedin 1996 were considered att`aining the MWH criterion at the sites sampled in 1996, the collectionsrepresented fair community performance both upstream and downstream from the American BathWWTP. Upstream impacts from nonpoint sources (City of Lima permitted wet weather overflows)appeared to be the major cause. At downstream sites (RMs 5.7 and 0.1), the benthic communityimproved to marginally good and good conditions, respectively.
The City of Lima has six permitted wet weather overflow locations (011-016) to Pike Run.Chemical samples collected at RM 8.21 were downstream from the overflows and upstream fromthe American Bath WWTP. There were high numbers of fecal coliform bacteria (>10,000 and 5,500per 100 ml.) on the two occasions that fecal bacteria were sampled at this site. Numbers of fecalcoliform bacteria remained high at the other Pike Run sites sampled downstream from the AmericanBath WWTP, despite low numbers in the WWTP effluent.
Plum CreekUpstream from the Village of Columbus Grove, macroinvertebrate communities reflected fairconditions. Macroinvertebrate communities declined to poor conditions at the site at RM 12.9,downstream from Columbus Grove CSOs but upstream from the Columbus Grove WWTP. Thenext station at RM 11.5 and the succeeding stations improved to marginally good and good. Benthiccommunities had higher numbers of taxa and QCTV scores, and caddisflies and mayflies werepredominant organisms. Poor habitat quality throughout Plum Creek resulted in fish communitieslacking species richness and trophic function. Consequently, IBI scores at every sampling locationwere in the poor range and did not meet the existing WWH criteria. The Columbus Grove WWTPdid not have a significant impact to the biotic communities in light of the severity of the CSOs, othernonpoint, and habitat impacts.
Chemical water quality upstream from the Village of Columbus Grove was generally good to very

MAS/1997-12-6 Ottawa River Basin TSD December 31 , 1998
6
good, with most pollutants at or below respective MDLs, although a D.O. violation was documented.Within the village limits, a CSO impact was evident, reflected by the D.O., NH -N, and fecal3
coliform bacteria exceedences which were documented. These exceedences occurred due to theaccumulation and decomposition of sludges, complicated by low stream gradient and channelmodifications. A nutrient enrichment impact resulted from the Columbus Grove WWTP, withincreasing nitrate, phosphorus, and BOD concentrations, but it was unclear what portion of the5
impact was attributable to CSOs. An impact occurred near Kalida, especially with increasingsuspended solids concentrations, but it was unknown whether this resulted from upstreamagricultural practices or urban sources, such as construction sites.
Little Ottawa River, Zurmehly CreekThe macroinvertebrate site on the Little Ottawa River at RM 0.4 had slightly less than optimalcommunity characteristics and was evaluated as marginally good. The macroinvertebrate samplecollected at Zurmehly Creek RM 0.1 was evaluated as fair.
Habitat impacts from channelization, intensive agriculture, and in the case of Zurmehly Creek,urbanization, limited the fish communities in both streams. Based on the number of modified habitatattributes, neither stream is currently capable of supporting WWH fish communities.
Inorganic water quality was generally very good in the Little Ottawa River, with most pollutants ator below respective MDLs. Some temporal variability in nutrient and suspended solidconcentrations was exhibited, with higher concentrations documented during the 5 August samplingevent. These results indicated a slight nonpoint source impact. No Water Quality Standardsexceedences were documented at this station. Water quality was generally very good in Zurmehly Creek, with most pollutants evaluated at orbelow respective MDLs. Some temporal variability in nutrient and suspended solid concentrationswas exhibited, with higher concentrations documented during the 5 August sampling event. Theseresults indicated a slight nonpoint source impact. No Water Quality Standards exceedences weredocumented at this station. A fecal coliform bacteria count exceeding the Primary ContactRecreation criterion on 16 September indicated a possible source of sanitary wastewater in thedrainage.
MAS/1997-12-6 Ottawa River Basin TSD December 31 , 1998
7
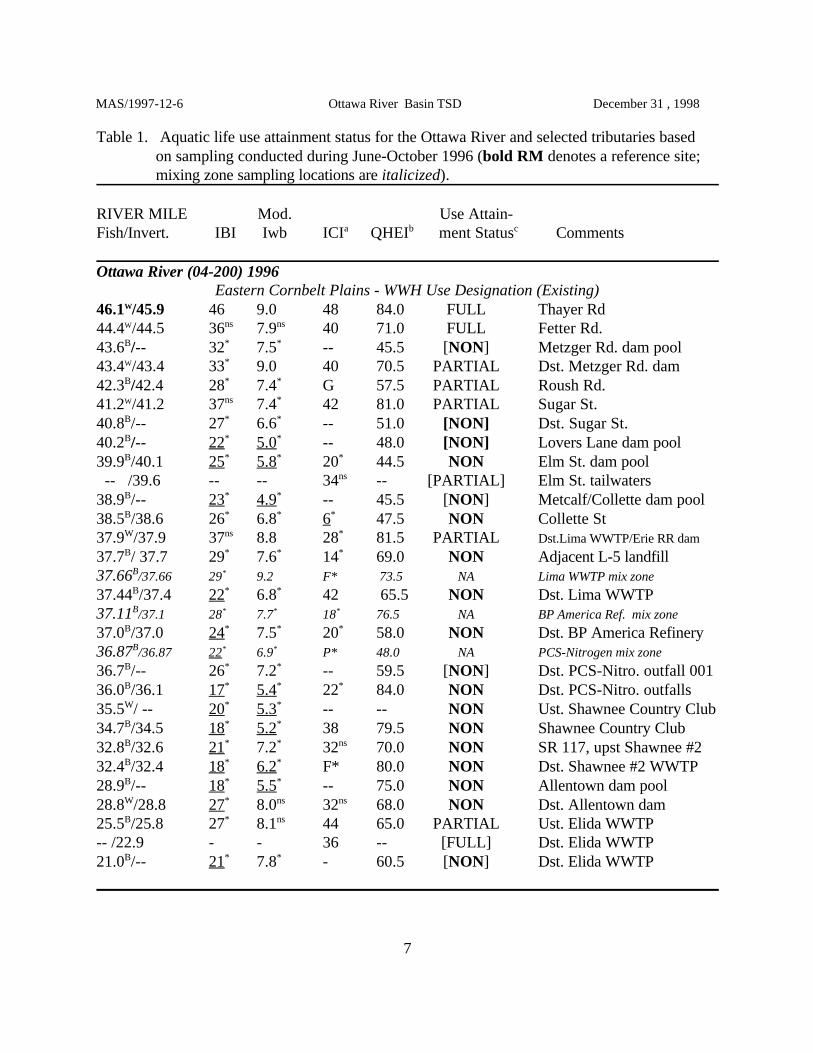
Table 1. Aquatic life use attainment status for the Ottawa River and selected tributaries basedon sampling conducted during June-October 1996 (bold RM denotes a reference site;mixing zone sampling locations are italicized).
RIVER MILE Mod. Use Attain- Fish/Invert. IBI Iwb ICI QHEI ment Status Commentsa b c
Ottawa River (04-200) 1996Eastern Cornbelt Plains - WWH Use Designation (Existing)
46.1 /45.9 46 9.0 48 84.0 FULL Thayer RdW
44.4 /44.5 36 7.9 40 71.0 FULL Fetter Rd.W ns ns
43.6 /-- 32 7.5 -- 45.5 [NON] Metzger Rd. dam poolB * *
43.4 /43.4 33 9.0 40 70.5 PARTIAL Dst. Metzger Rd. damW *
42.3 /42.4 28 7.4 G 57.5 PARTIAL Roush Rd.B * *
41.2 /41.2 37 7.4 42 81.0 PARTIAL Sugar St.W ns *
40.8 /-- 27 6.6 -- 51.0 [NON] Dst. Sugar St. B * *
40.2 /-- 22 5.0 -- 48.0 [NON] Lovers Lane dam poolB * *
39.9 /40.1 25 5.8 20 44.5 NON Elm St. dam poolB * * *
-- /39.6 -- -- 34 -- [PARTIAL] Elm St. tailwatersns
38.9 /-- 23 4.9 -- 45.5 [NON] Metcalf/Collette dam poolB * *
38.5 /38.6 26 6.8 6 47.5 NON Collette StB * * *
37.9 /37.9 37 8.8 28 81.5 PARTIAL Dst.Lima WWTP/Erie RR damW ns *
37.7 / 37.7 29 7.6 14 69.0 NON Adjacent L-5 landfillB * * *
37.66 /37.66 29 9.2 F* 73.5 NA Lima WWTP mix zoneB *
37.44 /37.4 22 6.8 42 65.5 NON Dst. Lima WWTPB * *
37.11 /37.1 28 7.7 18 76.5 NA BP America Ref. mix zoneB * * *
37.0 /37.0 24 7.5 20 58.0 NON Dst. BP America RefineryB * * *
36.87 /36.87 22 6.9 P* 48.0 NA PCS-Nitrogen mix zoneB * *
36.7 /-- 26 7.2 -- 59.5 [NON] Dst. PCS-Nitro. outfall 001B * *
36.0 /36.1 17 5.4 22 84.0 NON Dst. PCS-Nitro. outfallsB * * *
35.5 / -- 20 5.3 -- -- NON Ust. Shawnee Country ClubW * *
34.7 /34.5 18 5.2 38 79.5 NON Shawnee Country ClubB * *
32.8 /32.6 21 7.2 32 70.0 NON SR 117, upst Shawnee #2B * * ns
32.4 /32.4 18 6.2 F* 80.0 NON Dst. Shawnee #2 WWTPB * *
28.9 /-- 18 5.5 -- 75.0 NON Allentown dam poolB * *
28.8 /28.8 27 8.0 32 68.0 NON Dst. Allentown damW * ns ns
25.5 /25.8 27 8.1 44 65.0 PARTIAL Ust. Elida WWTPB * ns
-- /22.9 - - 36 -- [FULL] Dst. Elida WWTP21.0 /-- 21 7.8 - 60.5 [NON] Dst. Elida WWTPB * *
MAS/1997-12-6 Ottawa River Basin TSD December 31 , 1998
8
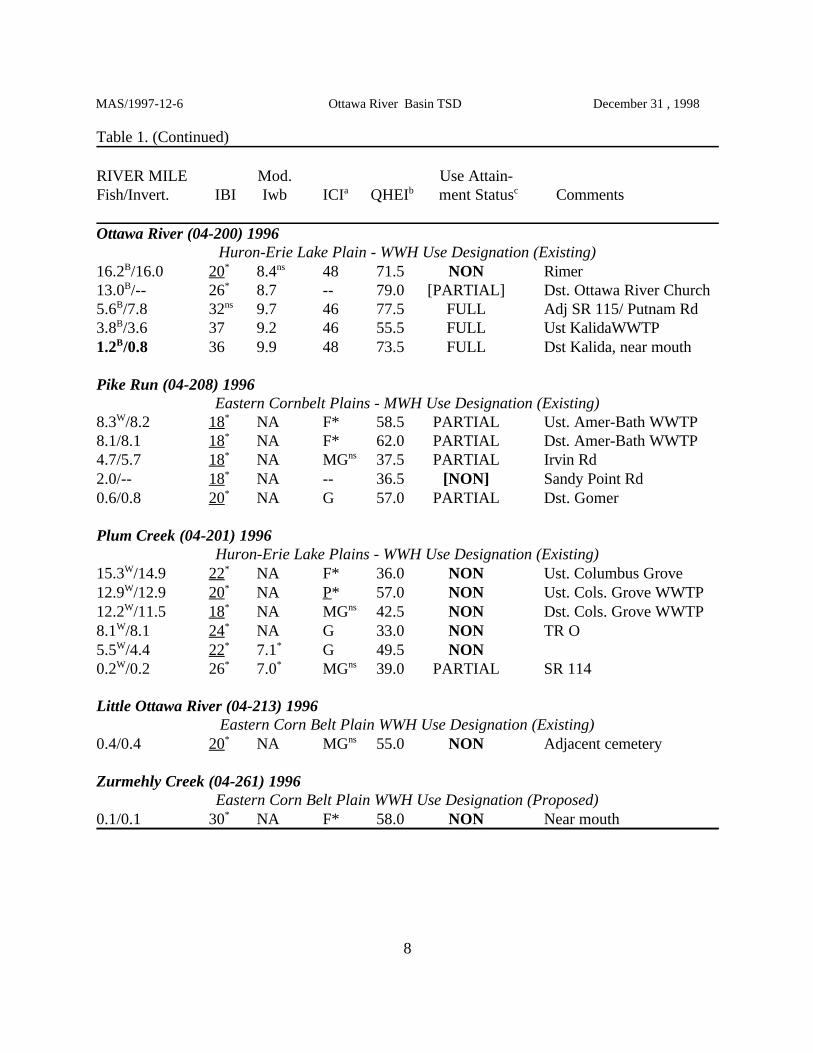
Table 1. (Continued)
RIVER MILE Mod. Use Attain- Fish/Invert. IBI Iwb ICI QHEI ment Status Commentsa b c
Ottawa River (04-200) 1996Huron-Erie Lake Plain - WWH Use Designation (Existing)
16.2 /16.0 20 8.4 48 71.5 NON RimerB * ns
13.0 /-- 26 8.7 -- 79.0 [PARTIAL] Dst. Ottawa River ChurchB *
5.6 /7.8 32 9.7 46 77.5 FULL Adj SR 115/ Putnam RdB ns
3.8 /3.6 37 9.2 46 55.5 FULL Ust KalidaWWTPB
1.2 /0.8 36 9.9 48 73.5 FULL Dst Kalida, near mouthB
Pike Run (04-208) 1996Eastern Cornbelt Plains - MWH Use Designation (Existing)
8.3 /8.2 18 NA F* 58.5 PARTIAL Ust. Amer-Bath WWTPW *
8.1/8.1 18 NA F* 62.0 PARTIAL Dst. Amer-Bath WWTP*
4.7/5.7 18 NA MG 37.5 PARTIAL Irvin Rd* ns
2.0/-- 18 NA -- 36.5 [NON] Sandy Point Rd*
0.6/0.8 20 NA G 57.0 PARTIAL Dst. Gomer*
Plum Creek (04-201) 1996Huron-Erie Lake Plains - WWH Use Designation (Existing)
15.3 /14.9 22 NA F* 36.0 NON Ust. Columbus GroveW *
12.9 /12.9 20 NA P* 57.0 NON Ust. Cols. Grove WWTPW *
12.2 /11.5 18 NA MG 42.5 NON Dst. Cols. Grove WWTPW * ns
8.1 /8.1 24 NA G 33.0 NON TR OW *
5.5 /4.4 22 7.1 G 49.5 NONW * *
0.2 /0.2 26 7.0 MG 39.0 PARTIAL SR 114W * * ns
Little Ottawa River (04-213) 1996Eastern Corn Belt Plain WWH Use Designation (Existing)
0.4/0.4 20 NA MG 55.0 NON Adjacent cemetery* ns
Zurmehly Creek (04-261) 1996Eastern Corn Belt Plain WWH Use Designation (Proposed)
0.1/0.1 30 NA F* 58.0 NON Near mouth*

MAS/1997-12-6 Ottawa River Basin TSD December 31 , 1998
9
Table 1. (Continued)
Ecoregional Biological Criteria:Eastern Corn Belt Plains (ECBP) Huron-Erie Lake Plain (HELP)
INDEX - Site Type WWH EWH MWH WWH EWH MWHd d
IBI - Headwaters 40 50 24 28 50 20IBI - Wading 40 50 24 32 50 22IBI - Boat 42 48 24 34 48 20Mod. Iwb - Wading 8.3 9.4 6.2 7.3 9.4 5.6Mod. Iwb - Boat 8.5 9.6 5.8 8.6 9.6 5.7ICI 36 46 22 34 46 22
* Significant departure from ecoregional biocriteria; poor and very poor results are underlined. Nonsignificant departure from ecoregional biocriteria for WWH or EWH (<4 IBI, <4 ICI, <0.5 MIwb ns
units).NA Not applicable. Narrative evaluation used in lieu of ICI (E=Exceptional; VG= Very Good; G=Good; MG=Marginally good; a
F=Fair; P=Poor; VP=Very Poor). Qualitative Habitat Evaluation Index (QHEI) values based on Rankin (1989).b
Attainment status based on one organism group is parenthetically expressed.c
Channel modified.d
B Fish sampled using the Boat Method.H Headwater site (drainage area < 20 square miles) fish sampling was conducted using a wadeable method.W Fish sampled using the Wading Method.

MAS/1997-12-6 Ottawa River Basin TSD December 31 , 1998
10
Table 2. Waterbody segment (305b) summaries for streams sampled in the Ottawa River basin during 1996.
Waterbody Stream(RM) Reach Causes, Sources, and CommentsUpper/Lower Length
Attainment Miles Status
FULL Partial NON Threatened
Ottawa River mainstem - WWH
50.70/35.30 15.40 6.3 4.2 4.9 0.0 Causes: Ammonia, organic enrichmentSources: Industrial & municipal point sources, CSOsComments:Biological attainment declines from full to partial to non as river passes through Lima area
35.30/22.93 12.37 0.0 5.87 6.5 0.0 Causes: Organic enrichment, unknown toxicitySources: Industrial & municipal point sources (Lima area)Comments:Reach most impacted from cumulative load from Lima area
22.93/6.57 16.36 1.43 5.9 9.03 0.0 Causes: Unknown toxicitySources: Industrial & municipal point sources (Lima area)Comments:Reach still impacted from cumulative load from Lima area
6.57/0.00 6.57 6.57 0.0 0.0 0.0 Causes: NoneSources: NoneComments:Full attainment occurred at the farthest point upstream since OEPA sampling was initiated in the 1970s
Pike Run - MWH
9.45/0.00 9.45 9.45 0.0 Causes: Pathogens0.0 0.0Sources: CSOs, municipal point sourceComments: Partial attainment due to poor fish community (bugs- fair to good)

MAS/1997-12-6 Ottawa River Basin TSD December 31 , 1998
11
Table 2. (cont.) Waterbody segment (305b) summaries for streams sampled in the Ottawa River basin during 1996.
Waterbody Stream Attainment Miles Status(RM) ReachUpper/Lower Length
Causes, Sources, and CommentsFULL Partial NON Threatened
Plum Creek - WWH
14.40/0.00 14.40 0.0 2.8 11.6 0.0 Causes: Organic enrichment, ammonia, pathogensSources: CSOs, municipal point sourceComments:Most non attainment due to poor performance of fish IBI. Bugswere F-P ust WWTP, MG-G dst.
Zurmehly Creek - WWH
1.82/0.00 1.82 0.0 0.0 1.82 0.0 Causes: Priority organics Sources: Urban runoff/storm sewersComments:Non attainment due to poor performance of fish IBI. Bug community performance was marginally good.
Little Ottawa River - WWH.
6.40/0.00 6.40 0.0 0.0 6.40 0.0 Causes: Nutrients Sources: Urban runoff/storm sewersComments:Both fish and bugs had fair community performance

MAS/1997-12-6 Ottawa River Basin TSD December 31 , 1998
12
SEGMENT
DES. RESPONSE EXPOSURE INDICATORS STRESSORSUSE INDICATORS
Attain Water Sedi- Toxi- % Fish Bio- # Urban- Cumu- Spills CSOsment QHEI IBI MIwb ICI Column ment city Delts Tissue marker Dams/ Indust. lative SSOsStatus Chem. Chem Pools LandUse Load
Ottawa River
Thayer Rd to FULL- 68 Fair- Fair- Good Nitrates Low NA Mod- Mer- Low Mod- Low Low Low LowSugar St. PART. Good Good High cury erate
Sugar St. to Poor Poor Poor CBOD As,Cr Mod- High Pesti- BUN High High Mod- Mod- HighLima WWTP NON 47 to to to TSS Cd,Cu erate cides Naph erate eratedam Fair Fair M.G. D.O. Ni,Zn B(a)p
Lima WWTP Poor Fair Amm. As,Cr Mod- Very Selen- EROD Mod- High High High Highdam to NON 72 Poor to to CBOD Cd,Cu erate High ium Naph erateAllentown dam Fair Good TSS Ni,Zn Pest- B(a)p
D.O. PAH icides BUNNitratesPhosChrom.PAHPesticid
Allentown dam PAR- 69 Poor Fair- Good TSS Low NA High Pesti- Low Low Low High Low Lowto Kalida TIAL -Fair Good -Exc. cides
Kalida to FULL 69 Good Good Exc. TSS Low NA Very Pesti- Low Low Low High Low Lowmouth High cides
Figure 2. A matrix of summarized information from environmental response indicators, measurements of pollutant exposure levels,and potential pollutant stressors in segments of the Ottawa River mainstem.

Ottawa River1985
1991
1996
Lima
Lima
Lima
Ottawa River
Ottawa River
Kalida
Elida
Elida
Elida
Kalida
Kalida
Lima WWTP, Clark Oil, PCS Nitrogen
Lima CSOs
Lima CSOs
Lima CSOs
Lima WWTP, Clark Oil, PCS Nitrogen
Lima WWTP, Clark Oil, PCS Nitrogen
Figure 3. Biological community performance trends in the Ottawa River for 1985, 1991, and 1996.
Biological Community Performance
Exceptional
Good
Fair
Poor
13

MAS/1997-12-6 Ottawa River Basin TSD December 31 , 1998
14
Point Source Discharge SummariesLima WWTP (Ottawa River RM 37.67)The City of Lima Wastewater Treatment Plant (WWTP), Ohio EPA permit number 2PE00000, islocated at 1200 Ft. Amanda Road, Lima, Ohio. The current permit became effective on 1 November,1993 and expired on 1 June, 1998. The facility was constructed in 1931 and last renovated in 1993and is an advanced treatment system designed to treat "first flush" combined sanitary and stormwaterflows. Treatment technology includes; screening and grit removal, phosphorus removal through theaddition of ferrous chloride and polymer, primary settling, biochemical oxygen demand removalthrough activated sludge aeration, secondary clarification, nitrification through trickle filtration,chlorine disinfection, dechlorination, and anaerobic sludge digestion. Sludge is dewatered and landapplied at agronomic rates through an approved sludge management plan. Final effluent dischargesto the Ottawa River through outfall 001 at river mile (RM) 37.67. Flows up to the design capacityof 18.5 million gallons per day (MGD) receive full treatment and must meet the most stringenteffluent limits, while flows between 18.5 MGD and 33 MGD have somewhat relaxed effluent limits,flows between 33 MGD and the hydraulic capacity of 53 MGD receive primary treatment andchlorination and must meet the least stringent effluent limits, and flows in excess of 53 MGD arebypassed. The annual average discharge is approximately 13.2 MGD. The facility also implementsan industrial pretreatment program which was approved in 1984. Seven significant categoricalindustrial users, one significant noncategorical industrial user, and eighty other noncategoricalindustrial users discharge to the facility, contributing 20% of the incoming flow.
A significant decline in peak NH -N loadings occurred around 1981. A decline in BOD and TSS3 5
loadings occurred around 1991 and rates have remained relatively stable since. This presumablyoccurred due to the upgrading of the sludge digesters and an improvement in sludge handlingcapabilities. Loadings of NO -N have remained relatively constant through the evaluation period.3
The most significant change observed in water chemistry downstream from the Lima WWTP in the1996 survey was an increase in nitrate-nitrite-N in the Ottawa River from an average of 5.2 mg/lupstream to 7.0 mg/l downstream from outfall 001.
Facility self monitoring records for 1996 were evaluated for NPDES permit violations. A monthlymaximum concentration violation for residual chlorine was documented in May. Effluent grabsamples collected during the study period were evaluated for monthly maximum concentrationexceedences. None were documented. No volatile organic compounds were detected, whilechloroform and six organochlorine pesticides were detected at low concentrations. Ohio EPA spillrecords from 1992 to 1996 contained 7 reported spills attributed to the Lima WWTP system.
Ohio EPA conducted two 48-hr. acute screening bioassays at the Lima WWTP in May and June1996 as part of a toxics evaluation in conjunction with permit reissuance. There was no significanttoxicity to fathead minnows in the May and June bioassays, and no significant toxicity toCeriodaphnia dubia in the June bioassay. However, in the May bioassay, Lima WWTP mixing zoneand all effluent samples were lethal (100 % mortality) to C. dubia. There was no mortality in thecontrol or the upstream Lima WWTP samples. A concurrent bioassay on Shawnee #2 WWTP

MAS/1997-12-6 Ottawa River Basin TSD December 31 , 1998
15
reported no mortality from the Shawnee #2 effluents, but the upstream samples collected at SR 117(RM 32.6) and the Shawnee mixing zone sample (RM 32.4) were lethal to C. dubia. The LC of50
the Lima WWTP composite sample was measured at 10% effluent. The harmonic mean flow andthe discharger flows show that the Lima WWTP mixing zone is approximately 63.6% effluent, andthat as far downstream as the Shawnee WWTP mixing zone the Ottawa River is approximately46.6% effluent from the Lima WWTP.
CSOs and SSOsApproximately 95% of the facility service area is sewered. The collection system is comprised of80% combined sanitary and stormwater sewers (CSOs) and 20% separate sanitary sewers. Thecombined system contains one lift station, which has no bypass, and nineteen overflows, of whichfive are mechanically controlled and metered. The separate system contains twenty-three liftstations, of which seven have bypasses, and twenty-seven overflows, none of which are mechanicallycontrolled or metered.
Of the combined sewer overflows (CSOs) which the City of Lima is permitted to discharge duringwet weather periods, outfalls 002-006 are mechanically controlled and metered for stormwaterretention. These control structures are located at Lovers Lane (006), Central Ave. (005), McDonelSt. (004), Heindel St. (003), and Collett St. (002). Although discharges from these outfalls areintermittent, they contribute a significant load of pollutants to the Ottawa River and have a potentialto impact human health and the aquatic food chain. During a rainfall event (1.08 inches) in July1996, four of these control structures were sampled and contributed a TSS load ranging from 15,400to 21,600 pounds each (7,000 kg to 9,800 kg). Expressed in a daily fashion, outfalls 002-006discharged a combined total of 1.4 MGD of wastewater; 1,125 kg/day of total suspended solids(TSS); and 90 kg/day of 5-day carbonaceous biochemical oxygen demand (CBOD ) in 1996.5
Combined with final effluent pollutant loadings to the Ottawa River from the Lima WWTP, BP OilCo., and PCS Nitrogen Ohio, L.P. facilities; CSOs contributed 67.9% of the total TSS load and28.9% of the total CBOD load.5
The City of Lima submitted a Water Quality Impact Report as required by their NPDES permit. Thestudy collected water samples from the Ottawa River and four of the control structures during twowet weather periods to assess the impact of the CSOs on the Ottawa River. Parameters analyzedwere ammonia, CBOD, fecal coliform bacteria, and TSS. Sediment samples were collected at 17river sites and in two of the control structures.
The two wet weather periods sampled were during rainfall events of 0.74 in. and 1.08 inches. Thehighest concentrations of ammonia, CBOD, and TSS occurred in the first flush. Although thesecond wet weather event caused higher loadings of TSS, the concentrations were less due to adilutional effect of the increased amount of rainfall. Apparently, a considerable load of solids aresettling out in the collection system, and are then, consequently, flushed out into the river duringrainfall events. The most impacted areas are those areas downstream from the control structures andlocated in dam pools that act as settling basins for these CSO outfalls.

MAS/1997-12-6 Ottawa River Basin TSD December 31 , 1998
16
During dry weather periods, the impact from the CSOs resulted in low D.O. and increased levels ofmetals, PAHs, and PCBs in the sediments. The Ohio EPA sampled water column chemistry at 8sites and sediment chemistry at 5 sites from Thayer Road (RM 45.97) to downstream from the LimaWWTP/Erie-Lackawanna Railroad Dam (RM 47.91). Dissolved oxygen fell below 5.0 mg/l at bothRM 38.63 and RM 37.91, downstream from the CSOs. Sediment concentrations of cadmium,chromium, copper, lead, nickel, and zinc were higher and considered elevated to extremely elevated(Ohio EPA, 1996) downstream from the CSOs in the dam pool at RM 38.0 compared to upstreamfrom the CSOs (RM 42.61). None of these concentrations exceeded the severe effect level (SEL,Persuad et. al., 1994). Pesticide and PAH sediment concentrations were mostly below detectionupstream from the Lima CSOs. Downstream from the CSOs at RM 38.63 and RM 38.0, theseorganics were present above detection limits, with many of them greater than the Effects Range-Median, ER-M (Long and Morgan, 1991), but at the same time were less than the Severe EffectLevel, SEL (Persuad et. al., 1994). The increased concentrations of these parameters in the sedimentin the dam pool at RM 38.0 was attributed to the CSOs.
Data collected for the City of Lima Water Quality Impacts Study showed high concentrations ofmetals in sediments in the Central Avenue and Collette Street control structures (chromium - 178and 881 ug/g, copper - 205 and 484 ug/g, lead - 202 and 290 ug/g, nickel - 78 and 156 ug/g, zinc -500 and 1270 ug/g, and total PAHs - 120 and 323 ug/g, respectively).
Fish and MacroinvertebratesUpstream from the CSOs fish indices in the reach from downstream of Sugar Street (RM 40.8) tothe Lovers Lane dam pool (RM 40.2) did not meet WWH biocriteria. Fish crews sampling in thisreach observed thick deposits of sewage solids next to an island near Schoonover Park. An area ofunsewered homes (with septic systems) along Findlay Road is the suspected cause of impairment.
Within the series of dams and CSOs from RM 40.8 to RM 38.5, none of the fish sites sampled metWWH criteria. Qualitative Habitat Evaluation Index (QHEI) scores ranged from 44.5 to 51.0 andreflected the characteristics of the impounded section caused by the series of dams within the Cityof Lima. Even the impoundment criteria was not met for fish in this section except for the MIwbat RM 40.8 and RM 38.5. Macroinvertebrates were sampled at RMs 40.1, 39.6, and 38.6 in thissection. The site located in the Elm Street dam tailwaters between the Elm Street dam (RM 39.70)and the Central Street dam (RM 39.58) had good flow (>0.3 fps) over the artificial substrates. Bycontrast the other two benthic sites sampled in this area had less than optimal flow over the artificialsubstrates, but more importantly were directly downstream or adjacent to CSO control structures,and did not meet the WWH criterion. Sludge deposits were observed by fish and bug crewsdownstream from the Lovers Lane and Collette Street control structures. The non attainment ofbiological criteria from the Lovers Lane dam (RM 40.14) to the Lima WWTP dam (RM 37.96) wasattributed to the City of Lima CSOs.
Partial attainment of WWH biocriteria was observed downstream from the CSO control structuresand dams at RM 37.9. Fish indices either met or were in nonsignificant departure from criteria.

MAS/1997-12-6 Ottawa River Basin TSD December 31 , 1998
17
Although the ICI score of 28 did not attain WWH biocriteria at this site, it showed a significantimprovement over the score of 6 found in 1991. Fish and macroinvertebrate indices did not meetthe WWH biocriteria at the next station at RM 37.7 due to impacts from the L5 landfill.
The Lima WWTP discharges at RM 37.67. Mixing zone collections were indicative of a nutrientenrichment impact. The macroinvertebrate communities improved significantly from previous yearsin this section at the site downstream from the Lima WWTP (RM 37.4, ICI of 42) and at theShawnee Country Club (RM 34.5, ICI of 38). Fish indices remained fair to poor at non-mixing zonesites from upstream of the Lima WWTP (RM 37.7) to the Allentown dam (RM 28.9).
Pike RunThe City of Lima also has six permitted wet weather overflow locations (0011-016) to Pike Run.Chemical samples collected at RM 8.21 were downstream from the overflows and upstream fromthe American Bath WWTP. There were high numbers of fecal coliform bacteria (>10,000 and 5,500per 100 ml.) on the two occasions that fecal bacteria were sampled at this site. Numbers of fecalcoliform bacteria remained high in the other Pike Run sites sampled downstream from the AmericanBath WWTP, despite low numbers in the WWTPs effluent.
Fish sampling conducted in 1991 and 1996 showed poor and very poor community performancethroughout Pike Run and with sites not attaining the MWH biocriterion either year at any site.Although macroinvertebrates collected in 1996 were considered attaining the MWH criterion at thesites sampled in 1996, the collections represented only fair community performance both upstreamand downstream from the American Bath WWTP. Upstream impacts from CSOs/SSOs (City ofLima wet weather overflows) appeared to be the major cause for partial and nonattainment of MWHin Pike Run.
Clark Oil (formerly BP Oil Company), Lima Refinery, Ottawa River RM 37.11
The Clark Oil Company, Lima Refinery, Ohio EPA permit number 2IG00001, is located at 1150South Metcalf Street, Lima, Ohio. The current permit became effective on 1 November, 1996 andexpires on 31 October, 1997. The Lima Refinery produces unleaded gasoline, diesel fuel, aviationfuel, kerosene, LPG, heating oils, petroleum coke, benzene, toluene, and tolumen from crude oiltransported to Lima from the Gulf Coast and West Texas. Some of the process operations includecrude distillation and desalting, hydro treating, fluid catalytic cracking, hydro cracking, delayedcoking, and catalytic reforming. Flows from the refinery are treated by an on-site advancedwastewater treatment system (AWWT). Oily process water, cooling water, boiler water, stormwater,and Clark terminals tank water are routed to a three bay API separator followed by dissolved airfloatation (DAF) to remove the oily wastes and heavy solids. High benzene (>10 ppm) wastewatergenerated at the facility is collected in a segregated sewer system designed to comply with NationalEmission Standards for Hazardous Air Pollutants (NESHAPS). The NESHAPS wastewater istreated using a corrugated plate interceptor followed by an induced gas floatation unit. The benzeneremoved is incinerated. The API/DAF and NESHAPS streams are combined with sanitary

MAS/1997-12-6 Ottawa River Basin TSD December 31 , 1998
18
wastewater and process flows from the adjacent PCS Nitrogen facility in an equalization tank andthen enter the AWWT. PCS Nitrogen manufactures acrylonitrile, acrylonitrile catalysts, and Barex®
resin and recovers and purifies acetonitrile and hydrogen cyanide. The AWWT is comprised ofactivated sludge aeration, flocculation, chemical conditioning, gravity thickening, rapid sandfiltration, and polishing. Treated wastewater discharges from the aerated polishing ponds to theOttawa River through outfall 001 at RM 37.11. Solids generated in the process are aerobicallydigested, undergo flocculation and gravity thickening, and put through a biological belt press beforebeing land applied. The annual, average discharge is approximately 5.33 MGD. The facility has astormwater capacity of 24 million gallons. The primary impoundment is a concrete tank with acapacity of 5 million gallons (G-Tank). The secondary impoundment is a pond with a capacity of19 million gallons (D-Pond). The stormwater flow is bled back to the AWWT to prevent overflowsdischarged to the Ottawa River via outfall 002.
A significant decline in loadings of all evaluated pollutants occurred around 1984 and rates haveremained relatively stable since. This presumably occurred due to the construction of the AWWT.Facility self-monitoring records for 1996 were evaluated for NPDES permit violations. A monthlymaximum loading violation for TSS was documented in July. Effluent grab samples collectedduring the study period were evaluated for monthly maximum concentration violations. None weredocumented. No volatile or semi-volatile organic compounds were detected and no organochlorinepesticides were detected. During the 1996 survey, a number of selenium exceedences weredocumented downstream from the Clark Refinery discharge and were attributed to effluent loadings.
BioassaysOhio EPA conducted 48-hr. acute screening bioassays on Clark Refinery effluents as part of a toxicsevaluation in conjunction with permit reissuance. Grab and composite derived outfall 001 effluents,Ottawa River upstream, and Ottawa River in the acute (near-field) mixing zone were evaluated usingthe fathead minnow, Pimephales promelas, and crustacean, Ceriodaphnia dubia, as test organisms.Bioassay number 96-1664-NW was conducted in May 1996. Test results indicated that outfall 001effluents were not acutely toxic to either P. promelas or C. dubia. No mortality or any other adverseacute effects were exhibited by the other samples tested to either test organism. Bioassay number96-1678-NW was conducted in June 1996. Test results indicated that outfall 001 effluents wereacutely toxic to P. promelas but not C. dubia. There was 40%P. promelas mortality in the day 2effluent grab sample. Magnitude of acute toxicity was not sufficient to calculate a LC50. The 10%mortality in the effluent composite and 5% in each rearing unit control are within acceptable limits.No mortality or any other adverse acute effects were exhibited by P. promelas in the remainingsamples. No C. dubia mortality or adverse acute effects were observed in the samples tested.
Fish and MacroinvertebratesThe Invertebrate Community Index (ICI) scores declined from 42 upstream from the Clark Refineryoutfall 001 (RM 37.11) to 20 downstream. There were decreased densities of mayflies and

MAS/1997-12-6 Ottawa River Basin TSD December 31 , 1998
19
caddisflies and lower numbers of mayfly, caddisfly, dipteran, and total taxa collected from theartificial substrates. The fish IBI and MIwb index scores were unchanged and remained in the poor(IBI) and fair (MIwb) range from upstream to downstream from the BP Refinery outfall.
Oil ContaminationOil contamination was directly traced to at least three sources in this segment of the Ottawa Riverin 1996. 1) A release from the L5 landfill observed on 4 September is known to be the source ofpesticide and oil and grease violations. Surface water samples collected on this date were extremelyoil laden and analytical results indicated highly elevated concentrations of PAHs and pesticides. BPOil Company (1996) had installed a retaining wall, rip-rap, and oil boom to contain leachate fromthe landfill and oil absorbent pads are deployed and maintained inside the boom. Even though thesecontrol measures have been implemented, releases occasionally occur, as evidenced by the 4September event. 2) The Clark Refinery outfall 001 had the highest mean oil and greaseconcentration (of the three major dischargers) reported during the 1996 survey. 3) An abandonedpipe line, that crossed the Ottawa River near RM 36.9 - 37.0 and which had been cut off andremoved west of the river, was continuously seeping a small amount of crude oil.
Fish biomarker data showed increases in EROD activity, and BAP-type and NAPH-type metabolites,from upstream to downstream from the BP Refinery outfall 001. EROD measures a class ofmetabolic enzymes that are induced by planar xenobiotics such as polycyclic aromatic hydrocarbons(PAHs) and halogenated hydrocarbons. EROD activity is an indicator of the induction of hepaticdetoxification systems. A common carp score below 50 pmol EROD/mg protein and a white suckerscore below 100 pmol EROD/mg protein are a conservative indication of noninduction. Scoresgreater than these values indicate induction and are a measure of the exposure to these contaminantsand detoxification activity by fish. EROD values increased from 49 pmol EROD/mg proteinupstream from the BP Refinery outfall to 193 pmol EROD/mg protein downstream in white suckers,and from 18 pmol EROD/mg protein to 49 pmol EROD/mg protein in carp, respectively. In fish,metabolites of PAHs accumulate in the bile. Bile metabolites indicate recent exposure to PAHs.The benzo(a)pyrene, BAP-type, metabolites are generally associated with combustion by-products.BAP-type metabolites increased from 447 ng BAP/mg protein upstream from the BP Refinery outfallto 1224 ng BAP/mg protein downstream in white suckers (500 ng BAP/mg protein, reference value),and from 930 ng BAP/mg protein to 1745 ng BAP/mg protein in carp (500 ng BAP/mg protein,reference value). The naphthalene, NAPH-type, metabolites are associated with oil contamination.NAPH-type metabolites increased from 55000 ng NAPH/mg protein upstream from the ClarkRefinery outfall to 115000 ng NAPH/mg protein downstream in white suckers (50000 ng NAPH/mgprotein, reference value), and from 121000 ng NAPH/mg protein to 185000 ng BAP/mg protein incarp (100000 ng BAP/mg protein, reference value).
SeleniumWater chemistry data (6 samples per RM) reported an increase in selenium concentrations from an
MAS/1997-12-6 Ottawa River Basin TSD December 31 , 1998
20
average of 2.5 ug/l upstream Clark Oil outfall 001 at RM 37.30 to 8.8 ug/l downstream at RM37.00. The average concentration (6 samples collected concurrently with the instream samples) ofthe BP Refinery outfall 001 was 18.8 ug/l. A large number of selenium exceedences (# of samples> 5 ug/l) were documented downstream from the BP Refinery discharge, in at least half of thesamples collected at RM 37.00 (5), RM 36.80 (3), RM 36.30 (5), RM 34.55 (5), RM 32.60 (4), RM32.41 (3), RM 31.03 (4), RM 28.83 (4), RM 25.75 (3), and RM 22.94 (3). This data suggests thatthe average concentration of selenium (based on 6 grab samples per site collected during the summerof 1996) was greater than 5 ug/l in the Ottawa River for approximately 15 miles downstream fromthe BP Oil outfall 001.
Selenium concentrations in both carp and smallmouth bass samples were sharply elevateddownstream from the Lima WWTP and BP Refinery complex with respect to upstream samples.Although selenium is a nutrient at trace levels, it becomes toxic at higher concentrations.
PCS Nitrogen (formerly Arcadian Ohio, L.P., formerly BP Chemicals)(Ottawa River RM 36.87)
BP Chemicals Inc. transferred ownership of the nitrogen manufacturing facility to Arcadian Ohio,L.P. in June 1994 and the facility name was changed to PCS Nitrogen Ohio, L.P. in early 1997. PCS manufactures ammonia, urea, nitric acid, ammonium nitrate, nitrogen fertilizer, and carbondioxide gas. Process wastewater and stormwater from the PCS facility is collected in the #2 processpond and pumped to the #1 process pond and treated using ammonia stripping and ion exchange.A trickling filter is used during summer months to provide additional treatment. The non-contactcooling water, cooling tower blowdown, and steam generator blowdown undergo neutralization andsedimentation. Some sanitary wastewater is pretreated prior to being sent to the Clark Oil Co.AWWT, while the other portion is treated along with the process wastewater. The treatedwastewater is then combined with non-contact cooling water, cooling tower blowdown, and steamgenerator blowdown from the adjacent BP Chemicals in the fire water pond prior to discharge to theOttawa River through outfall 001 at RM 36.87. The annual average discharge is approximately 5.40MGD.
Stormwater from the warehouse roofs are subject to deposits of urea from the prill tower. To helpalleviate high organic nitrogen discharges to the Ottawa River during storm events, the roof drainsare piped into a diversion box which sends the first flush to the stormwater pond under normalconditions. The stormwater pond will contain a 0.75 inch rainfall before it discharges to the OttawaRiver through outfall 003. When the stormwater pond is full, the diversion box will redirect the flowfrom the roofs to outfall 002. During dry periods, the contents of the stormwater pond are pumpedto the #1 or #2 process pond. Stormwater discharged through outfall 004 is untreated. Outfalls 002,003, and 004 discharge to the Ottawa River downstream from outfall 001 between RM 36.8 and36.0.
Pollutant loading trends from outfall 001 showed that a significant decline in NH -N loadings3
occurred around 1977 and rates have remained relatively stable since. Loadings of phosphorus
MAS/1997-12-6 Ottawa River Basin TSD December 31 , 1998
21
exhibit a slight increasing trend between 1985-1990 and have stabilized since then. PCS Nitrogenis required to monitor discharges from stormwater outfalls 002, 003, and 004. Expressed in a dailyfashion, stormwater outfalls discharged a combined total of 3.4MGD of wastewater. Concentrationsand loadings (monthly operating report, MOR, data) of ammonia and urea are high for these outfalls.Maximum concentrations of ammonia for 1996 were 197 mg/l (002), 111 mg/l (003), and 50 mg/l(004). For outfall 001, the 50th percentile and maximum urea concentrations were 9.0 mg/l and 54mg/l, respectively. Outfall 002 was sampled four times in 1996 and concentrations of urea reportedwere 342 mg/l, 373 mg/l, 1,357 mg/l, and 2,474 mg/l. Urea concentrations for outfall 003 weresampled twelve times in 1996 and the 50th percentile was below detection, the 75th percentile was6 mg/l, and the maximum concentration reported was 450 mg/l. Urea concentrations for outfall 004were sampled thirteen times in 1996 and the 50th percentile was below detection, the 75th percentilewas 21 mg/l, and the maximum concentration reported was 1,156 mg/l.
Facility self monitoring records for 1996 were evaluated for NPDES permit violations. A monthlymaximum loading violation for organic nitrogen was documented in January. Effluent grab samplescollected during the study period were evaluated for monthly maximum concentration exceedences.None were documented. No volatile organic compounds were detected, while chloroform and fourorganochlorine pesticides were detected at low concentrations.
During the six chemical runs conducted by the Ohio EPA during the summer of 1996, the averageinstream concentrations of the following parameters increased in the Ottawa River from upstreamof the PCS Nitrogen outfall 001(RM 36.87) at RM 37.0 to downstream at RM 36.80: ammonia(0.14 to 1.62 mg/l), BOD (2.5 to 5.3 mg/l), iron (330 to 804 mg/l), total Kjeldahl nitrogen (1.1 to 2.9mg/l), nitrite (0.05 to 0.32 mg/l), phosphorus (0.27 to 0.38 mg/l), and zinc (12.2 to 30.3 ug/l).Additionally, the site at RM 36.80 was the only location that chromium (30 ug/l detection level) andfree cyanide were detected instream, and these instream concentrations were attributed to the PCS001 outfall.
Compared to the upstream site at RM 37.0, sediment metal concentrations were substantially higherdownstream from PCS Nitrogen at RM 36.8 for the following parameters: chromium (39 to 227mg/kg), copper (32 to 92 mg/kg), and zinc (122 to 314 mg/kg). The sediment concentration forarsenic downstream from the PCS outfall 001 at RM 36.80, and for selenium downstream from PCSoutfalls 002, 003, and 004, at RM 36.30 were slightly higher than upstream at RM 37.0.
ChromiumThe only detection of chromium in the 1996 chemical survey (30 ug/l detection limit) was aninstream concentration of 49 ug/l downstream from the PCS outfall 001, and the only detections inthe effluents tested were in 4 of 6 PCS outfall 001 effluent samples ranging from 38 to 64 ug/l.(Lima WWTP and Clark Oil Refinery each had six samples below detection). The metal translatorstudy had a much lower detection level (0.05 ug/l) for chromium, but, sampled at only two locations- Thayer Rd and the Fire Station. This study showed total chromium values increased upstream todownstream from 0.37 ug/l to 4.65 ug/l (five sample average).
MAS/1997-12-6 Ottawa River Basin TSD December 31 , 1998
22
Apparently chromium is settling out in the sediments in concentrations toxic to aquatic organisms.The highest chromium sediment concentration collected by the Ohio EPA in both 1991 and 1996,and reported in the City of Lima Water Quality Impact Study (1996 data), was downstream from thePCS Nitrogen 001 outfall at levels exceeding the Ontario severe effect level (> 110 ug/g)andconsidered extremely elevated (Ohio EPA, 1996).
Nitrogenous wastesDuring the 1996 survey, the region of the Ottawa River exerting the highest stress to fishcommunities from nitrogenous wastes was downstream from the PCS Nitrogen outfalls. Samplestaken downstream from outfall 001 at RM 36.7 had the highest blood urea nitrogen (BUN) value (4.4units) for common carp and the highest average incidence of DELT anomalies (38.9 %) in the 1996survey. The site located downstream from PCS Nitrogen outfalls 002, 003, and 004, at RM 34.7,had the highest BUN value (2.8 units) for white suckers and the third highest incident of DELTanomalies (31.7 %). The lowest fish IBI scores sampled in the Ottawa River during the 1996 surveywere also at RMs 36.7 and 34.7. Although BUN values were higher in other sections of the OttawaRiver in 1991 and 1993 (indicating improvement in those sections in 1996), fish DELT anomaliesand IBI scores downstream from PCS outfalls have remained the lowest observed in the OttawaRiver in 1985, 1989, and 1991 surveys, as well as the 1996 survey. Instream chemical sampling showed increases in ammonia, nitrite, and TKN concentrations in theOttawa River from upstream of outfall 001 at RM 37.00 to downstream at RM 36.80. Exceedencesof the ammonia 30 day average criterion occurred in 2 out of 6 sampling events at RM 36.80 and 1of 6 events at RM 36.3, a result of the PCS 001 effluent. Although urea was not a measuredinstream parameter, the concentrations and loadings from the PCS outfalls are high. Althoughoutfalls 003 and 004 are storm water outfalls, during 1996 there was a flow value reported for the75th percentile indicating that out of 278 sampling events in 1996 these outfalls were flowing forat least 69 days of the year.
BioassaysPCS conducted annual chronic toxicity tests between 1990-95. Only one of those bioassays showedchronic toxicity. The July 1994 bioassay reported a NOEC of 25 % and LOEC of 50 % toCeriodaphnia dubia, which would be a 2.8 TU . Biomonitoring was removed from their permitc
based on the results of these bioassays submitted by the entity.
Ohio EPA conducted two acute screening bioassays in 1996 of PCS outfall 001 effluents as part ofa toxics evaluation in conjunction with permit reissuance. Samples of grab and composite outfall001 effluents, Ottawa River upstream, and Ottawa River in the acute (near-field) mixing zone wereevaluated using the fathead minnow, Pimephales promelas, and Ceriodaphnia dubia as testorganisms. The May 1996 bioassay showed no significant toxicity to either test organism. However,the June 1996 bioassay showed that PCS outfall 001 effluents were acutely toxic to C. dubia. Bothgrabs and the composite resulted in 100% mortality to C. dubia. This results in a minimum toxic unitof 1.0 TUa which is greater than the AET of 0.31 TUa calculated in Section 2 of the PCS Nitrogen

MAS/1997-12-6 Ottawa River Basin TSD December 31 , 1998
23
PSD. There was no mortality to fathead minnows in any of the test concentrations
During the 1996 survey, macroinvertebrates collected in the mixing zone of the PCS outfall 001indicated toxic conditions.
Based on the Ohio EPA 1996 field sampling and bioassay testing, further biomonitoring isrecommended. Split samples or bioassay samples collected during compliance sampling eventsshould be performed to assure the quality of bioassay sampling results. It should also be noted atthis time that there is no rapid and complete mixing of the PCS outfall 001 effluent and the OttawaRiver. The effluent stays to the river left.
Fish and MacroinvertebratesAlthough macroinvertebrate communities were considered fair both upstream (RM 37.0) anddownstream (RM 36.1) from the PCS outfalls, the results from the mixing zone of outfall 001 wasconsidered a response to toxicity. Low numbers of taxa, the absence of caddisfly and tanytarsinimidge taxa, the virtual absence of mayflies (except two individuals of the genus Caenis, collectedon only one of two sampling dates), and the predominance of pollution tolerant organisms wereindications of a toxic impact in the PCS outfall 001 mixing zone. Oil and muck were observed inthe sediments in the mixing zone area sampled.
The segment of the Ottawa River showing the most severe impact to fish communities wasdownstream from the PCS outfalls. The lowest MIwb scores (excluding dam pool sites) and thelowest IBI scores were reported downstream from the PCS outfalls (RM 36.0) to the ShawneeCountry Club (RM 34.7), despite good habitat conditions. QHEI scores ranged from 79.5 to 84.0 inthis section suggesting the potential for EWH performance with improved water chemistry. Thehighest percentage of DELT anomalies were also reported in this area. The highest percentage ofDELTs in the 1996 Ottawa River survey was 48.8 %, reported on 8/29/96 downstream from PCSoutfall 001 at RM 36.70. These results have changed little since 1991. White suckers and commoncarp collected for biomarker analyses showed the highest levels of blood urea nitrogen (BUN)downstream from the PCS outfalls.
Allen County Shawnee #2 WWTP (Ottawa River RM 32.50 )The Shawnee #2 WWTP, Ohio EPA permit number 2PK00002, is located at 3640 State Route (S.R.)117, Shawnee Township, Allen County, Ohio. The current permit became effective on 1 May, 1996and expires on 30 June, 1998. The facility was constructed in 1974 and last renovated in 1994 whenthe present sequencing batch reactors (SBRs) began operation on 13 January. Treatment technologyincludes: a manual bar screen and comminutor, two SBRs, chlorine disinfection, dechlorination,post aeration, and aerobic sludge digestion. Sludge is dewatered in a gravity thickener and belt filterpress and land applied at agronomic rates. Final effluent discharges to the Ottawa River throughoutfall 001 at RM 32.50. The design capacity of the facility is 2.0 MGD, while the hydraulic

MAS/1997-12-6 Ottawa River Basin TSD December 31 , 1998
24
capacity is 7.0 MGD. The annual average discharge is approximately 1.56 MGD. Within the servicearea approximately 80% of the area has sewers. The collection system is comprised of 100%separate sanitary sewers and contains twenty-three lift stations, of which one has a bypass, and sevenoverflows.
A significant decline in phosphorus loadings occurred around 1990, likely due to the implementationof a phosphate detergent ban in the Lake Erie drainage basin. A slight decreasing trend in NH -N3
and NO -N loadings was exhibited since the new facility went on-line in 1994. Facility self3
monitoring records for 1996 were evaluated for NPDES permit violations. Numerous violations forCBOD and TSS were documented from January through April. Instream chemical data from the5
1996 survey showed slight increases in BOD, COD, and phosphorus downstream from the ShawneeWWTP in the Ottawa River at RM 32.41 compared to upstream at RM 32.6.
Excessive inflow and infiltration entering the separate sewer collection system causes bypasses tooccur and occasionally requires activation of an influent bypass. A general plan for the eliminationof the collection system overflows was to be submitted to Ohio EPA by 1 May, 1997. Ohio EPAspill records from 1992 to 1996 contained 67 reported spills attributed to the Shawnee #2 WWTPsystem.
Ohio EPA conducted two 48-hr. acute screening bioassays at the Shawnee #2 WWTP in May andJune 1996 as part of a toxics evaluation in conjunction with permit reissuance. There was nosignificant mortality in the effluent samples to Pimephales promelas or Ceriodaphnia dubia in eitherof the two bioassays. However, in the May bioassay, in the Ottawa River samples both the upstreamgrab at SR117 and the Shawnee mixing zone were lethal (100 % mortality) to C. dubia. The Maybioassay was concurrent with a bioassay on Lima WWTP effluents which were also lethal to C.dubia and, given the effluent dominated nature of the Ottawa River due to the discharge from theLima WWTP, the toxicity upstream and downstream from the Shawnee WWTP was attributed tothe effluents from the Lima WWTP.
During the 1996 field survey, it was difficult to detect impacts from the Shawnee #2 WWTP becauseof the degradation extending downstream from Lima’s major dischargers. Fish andmacroinvertebrate indices were slightly lower downstream from the Shawnee #2 WWTP effluentat RM 32.4 compared to upstream at RM 32.8/32.6. Although the evaluation of the MIwb scoredecreased from fair to poor, and the macroinvertebrate evaluation from marginally good to fair, theoverall non attainment status remained due to the poor performance of the fish IBI score at bothsites.
Elida WWTP
The Village of Elida WWTP, Ohio EPA permit number 2PB00046, is located at 4180 North DutchHollow Road, Elida, Ohio. The facility was constructed in 1966 and last modified in 1993 when astormwater equalization basin was installed. Treatment technology includes; comminutor,

MAS/1997-12-6 Ottawa River Basin TSD December 31 , 1998
25
phosphorus removal through addition of alum, primary settling, trickling filter, final settling,chlorine disinfection, dechlorination, and aerobic sludge digestion. Final effluent discharges to theOttawa River through outfall 001 at RM 24.20. The design capacity of the facility is 0.50 MGD,while the hydraulic capacity is 0.90 MGD. The annual average discharge is approximately 0.45MGD. Within the facilities service area, 100% has sewers. The collection system is comprised of100% separate sanitary sewers and contains no lift stations, bypasses, or overflows. The facilityexperiences high flows during periods of heavy rain and a cross connection between the sanitary andstorm sewers is suspected.
Loadings of BOD , NH -N, and NO -N have remained relatively constant through the evaluation5 3 3
period, with the exception of a slight peak in the mid-1980's. A significant decline in P loadingsoccurred around 1990, likely due to the implementation of a phosphate detergent ban in the LakeErie drainage basin. A significant decline in TSS loadings occurred around 1992, likely due to theconstruction of a stormwater equalization basin.
Facility self monitoring records for 1996 were evaluated for NPDES permit violations. Severalviolations for cBOD , oil and grease, and residual chlorine were documented. 5
Kalida WWTP
The Village of Kalida WWTP, Ohio EPA permit number 2PA00047, is located on S.R. 114, Kalida,Ohio. The facility was constructed in 1981 and last modified in 1993 when a ultraviolet (UV)disinfection system was installed. Treatment technology includes; series of three aerated lagoonswith a continuous discharge and UV disinfection. Final effluent discharges to the Ottawa River atRM 2.63. The design and hydraulic capacity of the facility is 0.22 MGD. The annual averagedischarge is approximately 0.14 MGD. Within the facilities service area, 100% has sewers. Thecollection system is comprised of 100% separate sanitary sewers and contains one lift station, whichhas no bypass, and no overflows.
Loadings have remained relatively constant since 1988. Prior to this time, the facility experienceddifficulties with malfunctioning aerators, which resulted in elevated pollutant concentrations. Thepeak in flows during the mid-1980's is attributed to an improperly calibrated flow meter.
Facility self monitoring records for 1996 were evaluated for NPDES permit violations. A monthlyconcentration maximum violation for fecal coliform was documented in June.
American Bath WWTP (Pike Run RM 8.20 )The American Bath WWTP, Ohio EPA permit number 2PH 00007, is located at 3226 North ColeStreet, Lima, Ohio. The facility is currently regulated under interim effluent limits contained in aConsent Decree effective 3 May, 1996. The facility was constructed in 1966 and completelyrenovated in 1996 when the present oxidation ditch began operation on 30 April. Treatmenttechnology includes; mechanical bar screen, phosphorus removal through the addition of alum,

MAS/1997-12-6 Ottawa River Basin TSD December 31 , 1998
26
oxidation ditch, final settling, UV disinfection, and aerobic sludge digestion. Sludge is dewateredin a gravity belt thickener and land applied at agronomic rates. Final effluent discharges to Pike Runat RM 8.16, which flows into the Ottawa River at RM 19.53. The design capacity of the facility is1.5 MGD, while the hydraulic capacity is 4.0 MGD. The annual average discharge is approximately1.1 MGD, although accurate figures are not available since the renovated facility has been inoperation for only a short period of time. The facilities service area is 100% sewered. The collectionsystem is comprised of 100% separate sanitary sewers and contains three lift stations, which havevisual high water alarms, and three overflows.
Ohio EPA conducted two 48-hr. acute screening bioassays in October and November 1996 atAmerican Bath WWTP as part of a toxics evaluation in conjunction with permit reissuance. Nomortality or any other adverse effects were displayed by either test organism in the samples tested.
Loadings for most pollutants have generally exhibited an increasing trend through the evaluationperiod. A significant decline in phosphorus loadings occurred around 1990, likely due to theimplementation of a phosphate detergent ban in the Lake Erie drainage basin. The old facility wasseverely overloaded, due in part to numerous sewer extensions and excessive inflow and infiltrationentering the separate sewer collection system. Since the new oxidation ditch facility has onlyrecently gone on-line, it is difficult to evaluate the benefit of this upgrade.
Facility self monitoring records for 1996 were evaluated for NPDES permit violations. Numerousviolations for CBOD and TSS were documented from January-March. These violations resulted5
from permit limits effective prior to the 3 May, 1996 Consent Decree and prior to the plantrenovation going on-line. Effluent grab samples collected during the study period were evaluatedfor monthly maximum concentration exceedences. None were documented. The most significantchange observed in water chemistry downstream from the American Bath WWTP in the 1996 surveywas an increase in phosphorus in Pike Run from an average of 0.11 mg/l upstream to 2.28 mg/ldownstream from outfall 001.
Pike Run is currently designated MWH due to previous channelization, petitioned ditch status, andthe possibility of being put on a maintenance schedule. Per phone conversation with a DouglassDegen of the Allen County Engineer’s office, work will be conducted on Pike Run in 1998 fromnorth of Rob Ave. and east of McCauley Ave. in Lima to Gomer.
The City of Lima has six permitted wet weather overflow locations (0011-016) to Pike Run.Chemical samples collected at RM 8.21 were downstream from the overflows and upstream fromthe American Bath WWTP. There were high numbers of fecal coliform bacteria (>10,000 and 5,500per 100 ml.) on the two occasions that fecal bacteria were sampled at this site. Numbers of fecalcoliform bacteria remained high in the other Pike Run sites sampled downstream from the AmericanBath WWTP, despite low numbers in the WWTPs effluent.
Fish sampling conducted in 1991 and 1996 showed poor and very poor community performance
MAS/1997-12-6 Ottawa River Basin TSD December 31 , 1998
27
throughout Pike Run. The results did not attain the MWH biocriterion either year at any site. Theseven species of fish collected downstream from American Bath WWTP in 1996 was a significantimprovement compared to the one species collected in 1991. Although macroinvertebrates collectedin 1996 were considered attaining the MWH criterion at the sites sampled in 1996, the collectionsrepresented only fair community performance both upstream and downstream from the AmericanBath WWTP. Upstream impacts from nonpoint sources (City of Lima wet weather overflows)appeared to be the major cause for nonattainment in Pike Run.
Columbus Grove WWTP
The Columbus Grove WWTP, Ohio EPA permit number 2PC00004, is located on Church Street,Columbus Grove, Ohio. The current permit became effective on 1 April 1993 and expired on 28March 1998. The facility was constructed in 1934 and last modified in 1968. Treatment technologyincludes; grit and grease removal, primary settling, trickling filters, final settling, chlorination, andanaerobic sludge digestion. Sludge is dewatered in drying beds and land applied at agronomic ratesthrough an approved sludge management plan. Final effluent discharges to Plum Creek at RM12.80, which flows into the Ottawa River at RM 2.67. The design capacity of the facility is 0.82MGD, while the hydraulic capacity is 2.30 MGD. The annual average discharge is approximately0.38 MGD. Within the facilities service area, 100% has sewers. The collection system is comprisedof 80% combined sanitary and stormwater sewers and 20% separate sanitary sewers. The combinedsystem contains one lift station, which has no bypass, and four overflows, none of which aremechanically controlled or metered. The separate system contains one lift station, which has nobypass, and no overflows.
Loadings have remained relatively constant through the evaluation period for most pollutants. Asignificant decline in P loadings occurred around 1990, likely due to the implementation of aphosphate detergent ban in the Lake Erie drainage basin. A slight decline in NH -N and NO -N3 3
loadings occurred in the mid-1980's, likely due to the addition of a new primary aerator and finalclarifier during this time frame.
Facility self monitoring records for 1996 were evaluated for NPDES permit violations. A monthlyconcentration maximum violation for NH -N was documented in July and September.3
CONCLUSIONS
There has been no significant change in the overall attainment status in the Ottawa River from the1991 survey to the 1996 survey. The 1996 evaluation showed more areas of partial attainment thanthe 1991 survey, however, this partial attainment appears to be more of an artifact of individualsampling location differences between years (more sites sampled in 1996) than actual improvementsin water quality.
There is, however, evidence of incremental progress in the Ottawa River, but this progress is not

MAS/1997-12-6 Ottawa River Basin TSD December 31 , 1998
28
nearly at the rate observed for other major rivers with major WWTP influences in Ohio. Othereffluent dominated streams (e.g. Great Miami River downstream from Dayton, Licking Riverdownstream from Newark, Scioto River downstream from Columbus) are now attaining ecoregionalexpectations for virtually their entire length.
One site that did show improvement to partial attainment was RM 37.9, downstream from the LimaWWTP dam and upstream from the L5 landfill. Additional sampling showed attainment of themacroinvertebrate community between the Elm Street dam and the Central Street dam within theCity of Lima. Other areas showed large increases in the ICI (downstream from the Lima WWTPand at the Shawnee Country Club, ICI scores of 42 and 36, respectively). Improvements to the fishcommunity lagged behind the macroinvertebrate scores at some of these sites, due to highpercentages of DELT anomalies and/or differences in fish community composition. Although pollutant loadings from the major municipal and industrial facilities in Lima havesignificantly declined from the early 1980s to 1991, pollutant loadings have remained stable from1991 to 1996. [Lima WWTP, BP Oil Co. Refinery, and PCS Nitrogen (formerly L.P.Arcadian Ohio,formerly BP Chemicals)] The 1996 survey does show that the segment of the Ottawa Riverdownstream from the PCS Nitrogen discharges has some of the lowest fish and macroinvertebrateindex scores, lowest levels of dissolved oxygen, highest levels of ammonia, and highest percentageof fish anomalies (Figure 2).
Little change in Ottawa River chemical water quality occurred between the 1991 and 1996 studyperiods. Exceedences of statewide D.O. and ammonia criteria for the protection of aquatic lifecontinue to be documented. Results of D.O. grab samples indicate a significant "sag" downstreamfrom the major point source dischargers within the City of Lima and downstream from the Shawnee#2 WWTP.
The ICI and MIwb indices were in attainment or near attainment in the lower 30 miles (downstreamfrom Lima) of the Ottawa River in 1996. However, the IBI scores were well below ecoregionalexpectations from RM 30 to RM 13. These trends were also evident in 1989 and 1991,demonstrating little or no improvement has occurred from the 1989-91 period to 1996 (see theIntegrated Biological Trends section).
Percentages of DELT anomalies on fish still remain extremely high in the Ottawa River. The OttawaRiver had some of the highest DELT anomalies recorded by the Ohio EPA (48.8% on one pass atRM 36.7 in 1996). These high anomalies in 1996 in combination with low IBI scores indicate thattoxic conditions persist.
Bioassays conducted by the Ohio EPA in 1996 reported acute toxicity in the effluents of the majormunicipal and industrial facilities in Lima. [Lima WWTP - May 1996, BP Oil Co. Refinery - June1996, and PCS Nitrogen Ohio, L.P. (formerly Arcadian Ohio, formerly BP Chemicals) - June 1996]

MAS/1997-12-6 Ottawa River Basin TSD December 31 , 1998
29
The full attainment of WWH at predominantly agricultural sites with intact physical habitats (i.e.,non-channelized), suggests that agricultural nonpoint runoff is not a significant factor in the non-attainment found in the Ottawa River mainstem. The upstream site at Thayer Road has continuallyattained WWH criteria throughout the past 20 years. In addition, full recovery has been evident inthe lower 5 miles of the mainstem with slight improvements noted between 1991 and 1996.Agricultural land use predominates in and upstream from this area.
Excluding hydromodifications, nonpoint source pollutant loadings (i.e., stormwater runoff, spills,leaks, landfill leachate), which contribute to the use impairment of WWH in the Ottawa Riverwatershed, are primarily the result of urban/industrial sources as opposed to rural land uses.
The discharges from CSOs in the City of Lima during rainfall events result in high loadings of TSS,CBOD, and other pollutants. Outfalls 002-006 discharged a combined 1.4 million gallons per day(MGD) of wastewater, 1,125 kg/day of TSS (67.9% of the total TSS load), and 90 kg/day of CBOD5
(28.9% of the total CBOD load) in 1996. A portion of these pollutant loads settle behind the series5
of lowhead dams in the City of Lima and are associated with low dissolved oxygen levels in thissegment of the Ottawa River after individual CSO discharges have subsided. These dischargeevents are also thought to be associated with contaminated bottom sediments in the mainstem.
Impacts from the BP Oil Co. L5 Landfill continue to be a major concern. A release of oil ladenleachate was observed and documented on 4 September, 1996. Analytical results indicate highlyelevated concentrations of polynuclear aromatic hydrocarbons (PAHs) and organochlorinepesticides. Several violations of Ohio EPA statewide and Lake Erie drainage basin water qualitycriteria were documented in the Ottawa River downstream from the L5 Landfill due to this release.Another oil release from an abandoned pipeline near Adgate Road was documented in 1996.
Sediment contamination continues to be associated with the partial and non-attainment of aquaticlife uses. Beginning downstream from the Lima CSOs and continuing downstream to the AllentownRoad dam, concentrations of metals, especially cadmium, chromium, copper, lead, nickel, and zinc,were measured at levels considered to be highly and extremely elevated. Within this zone,concentrations of organic compounds such as PAHs, PCBs, and organochlorine pesticides are alsoa major concern. Concentrations of PCBs were highly elevated in the Erie-Lackawanna dam pooland downstream from the BP Oil Co. L5 Landfill (upstream from the Lima WWTP). Concentrationsof PAHs were most pervasive, especially downstream from the Lima WWTP, and were detected atlevels considered to be potentially toxic to aquatic life.
RECOMMENDATIONS
Execution of the recommendations below will reduce the amounts of pollutants generally enteringthe river during periods of wet weather and higher stream flows. The management and control ofpollutant loadings entering the river during periods of dry weather and critical low stream flow

MAS/1997-12-6 Ottawa River Basin TSD December 31 , 1998
30
conditions is accomplished through NPDES permit limits on the final wastewater process outfalls.
Pollutant Loadings:Attainment of the Ottawa River's Warmwater Habitat potential will require further reductions in totalpollutant loadings. Specifically, reduction of nitrate-nitrites from the Lima WWTP; reductions ofselenium from BP Oil; and reductions of nitrogenous wastes (including urea) from all dischargesfrom PCS Nitrogen.
The City of Lima should address the problems caused by Combined Sewer Overflows (CSOs)through cost effective management, control and treatment measures. The present frequency andduration of CSO discharge events in combination with the series of lowhead dams greatly exceedsthe ability of the river to assimilate the wastes without environmental degradation.
Greater attention should be given to accurately measuring the types and quantities of pollutantsdischarged in stormwater runoff at the Clark Oil and PCS Nitrogen facilities. The most impactedsegment of the Ottawa River is downstream from the PCS discharges. The amounts of urea cominginto the river should be adequately documented and accurate pollutant loading estimates developed.If appropriate, specific control measures should be required.
Spills:The release of oil into the Ottawa River continues to impact the biota and every effort should bemade to control and abate this pollutant from entering the river. The oil laden sample collectedSeptember 4 (1996) downstream from the L5 Landfill had water quality exceedences for oil andgrease (1720 mg/l) . Also in 1996, an abandoned pipe near Adgate Road was found to be leachingoil into the river.

MAS/1997-12-6 Ottawa River Basin TSD December 31 , 1998
31
Status of Aquatic Life Uses (Table 3): There are 7 major impoundments on the Ottawa River in the Lima area: Metzger Road dam (RM43.5), Roush Road dam (RM 42.30), Lovers Lane dam (RM 40.14), Elm Street dam (RM 39.70),Central Street dam (RM 39.58), Metcalf/Collette Street dam (RM 38.7), and the Lima WWTP/Erie-Lackawana RR dam (RM 37.96). While the very nature of the impoundments invites the ModifiedWarmwater Habitat (MWH) aquatic life use, due consideration should be given to their removal.This would enhance overall quality by improving habitat and the assimilative capacity of the river.
The Ottawa River upstream from the lowhead dam at Metzger Road has recently been designatedas Public Water Supply use. The following new designation is recommended based on the 1996survey results.
Zurmehly Creek: Current habitat conditions are degraded (QHEI = 58), however, ZurmehlyCreek is not a petitioned ditch and is not on a scheduled maintenance program. The highgradient should promote a faster rate of improvement of WWH characteristics. The WWHaquatic life use designation is appropriate. There are pools present with a minimum depth of40 cm., so the Primary Contact Recreation (PCR) applies.
Status of Non-Aquatic Life Uses (Table 3): Results of the present study support the three non-aquatic life uses (Agricultural, Industrial, andPrimary Contact Recreation) currently designated for each of the four streams (Ottawa River, LittleOttawa River, Pike Run, Plum Creek, and Zurmehly Creek).
Future Monitoring:Biological and water quality sampling should continue in the Ottawa River in accordance with theFive-Year Basin approach for monitoring to track the progress in attaining designated uses andimproved water quality. Continued monitoring of external fish anomalies, fish tissue, sediments,and specialized biomarker techniques is appropriate.
Urea should be analyzed instream at sites upstream and downstream from the PCS Nitrogen outfalls.Oil and grease should continue to be analyzed upstream from the L5 landfill to downstream fromPCS Nitrogen.
A rainfall study should be conducted to estimate nutrient loads entering the Ottawa River fromnonpoint agricultural sources at Thayer Road, and to estimate the concentrations and loadings ofnitrogenous wastes (ammonia, urea, etc.) in the Ottawa River from the PCS Nitrogen stormwateroutfalls.

MAS/1997-12-6 Ottawa River Basin TSD December 31 , 1998
32
Table 3. Waterbody use designations for the Ottawa River basin. Changes to existing usedesignations appear as a delta symbol (ª); designations based on the 1978 Water QualityStandards as an asterisk(*), and those designations for which results of biological fieldassessments are now available appear as plus signs (+). Designated use based onjustification other than the results of a biological field assessment performed by the OhioEPA (o).
Stream Segment Comments
Use Designations
Aquatic Life Water Recreation
S W E M S C L A I P B P SR W W W S W R W W W W C CW H H W H H W S S S R R
Ottawa River + + + +
Ottawa River upstream of low head dam + + + +ª at Metzger Road (RM 43.45)
Plum Creek + + + +
Sycamore Creek * * * *
Sugar Creek + * * *
Rattlesnake Creek * * * *
Ford Tributary(Sugar Ck at RM 18.8) + * *
Huber Ditch * * * *
Cotner Ditch * * * *
Leatherwood Ditch * * * *
Pike Run + + + + HELP Ecoregion - Channel Modified
Honey Run * * * *
Dug Run * * * *
Kessler Run * * * *
Swalley Ditch * * * *
Little Ottawa River + + + +
Zurmehly Creek ª ª ª ª
MAS/1997-12-6 Ottawa River Basin TSD December 31 , 1998
33
STUDY AREA
The Ottawa River Watershed is located in Allen, Hardin, Putnam, and a small portion of AuglaizeCounties in west central Ohio. The river is 52.7 miles long with a gradient of 4.0 feet per mile anddrains an area of approximately 365 square miles. The 1996 study area included the Ottawa Riverfrom Thayer Road (RM 46.1) to Kalida (RM 0.96). The river flows through the City of Lima, otherrural communities and predominantly agricultural areas in the watershed. Tributaries included inthe study were the Little Ottawa River, Pike Run, Plum Creek, and Zurmehly Creek. A map of thestudy area is shown in Figure 4.
The Ottawa River originates in the Eastern Corn Belt Plains (ECBP) ecoregion at the confluence ofHog and Little Hog Creeks, and flows southwesterly through Lima along the southern boundary ofthe Fort Wayne moraine. It then crosses the boulder belt and flows northward into the Huron/ErieLake Plain (HELP) ecoregion to its confluence with the Auglaize River west of Kalida. The OttawaRiver watershed covers 238,080 acres of Wisconsin glaciated till and lake plains. Underlyingbedrock of Silurian limestone and dolomite is exposed at various locations in the river and elsewhereis covered by several to more than two hundred feet of drift material.
The Eastern Corn Belt Plains (ECBP) ecoregion is a rich agricultural area that covers the upperportion of the watershed in Allen and Hardin Counties. The relief in this part of the watershed isnearly level to gently rolling, with steeper areas along streams and the three end moraines whichtraverse the county from east to west. These end moraines are among the areas where soil erosionis most severe in the watershed. Local relief is greater than in the HELP ecoregion, and the streamshave a steeper gradient. Little Hog Creek and the Little Ottawa River have gradients of 11.7 and8.6 feet per mile, respectively.
The Huron/Erie Lake Plain (HELP) ecoregion in the lower part of the watershed (northern Allen andPutnam Counties) is characterized by a broad, almost level, lake plain crossed by low moraines andbeach ridges. Local relief is generally only a few feet and streams have a lower gradient. PlumCreek and Sugar Creek have gradients of 3.5 and 5.5 feet per mile, respectively.
Soils in the watershed can be classified by ecoregion location, with the ECBP "till plain" soilsgenerally being derived from glacial till materials , and HELP "lake plain" soils generally beingformed from lacustrine sediments. Soils in the Morely-Blount-Pewamo association are found in theupland areas (ECBP ecoregion) of Hardin and Allen Counties. They are characterized as lightcolored, somewhat poorly drained, fertile soils of the till plains and moraines. Hog Creek Marsh islocated on the extreme west edge of the watershed, near Dola in Hardin County. Here you find deep,poorly drained soils of the Milford-Patton association that formed in medium to moderately finetextured lacustrine sediment on lake plains. In the HELP ecoregion of northern Allen County andinto Putnam County the soils move from the Blount-Pewamo to the Hoytville-Nappaneeassociations. These soils are darker colored, very poorly drained soils of the till plains and lakeplains. Beach ridge soils in the Haskins-Mermill-Millgrove association are found in the southern

MAS/1997-12-6 Ottawa River Basin TSD December 31 , 1998
34
part of Putnam County along SR 12 near Columbus Grove.
Grain farming is the predominant land use in the watershed, and since most of the soils are poorlydrained, an extensive artificial drainage system must be maintained to make row crop farmingpossible. Many of the small streams have been extensively channelized to assist these field tile anddrainage ditch systems throughout the watershed. In addition, an estimated 30,000 acres of farmlandin the watershed contain soils in the highly erodible lands (HEL) category, that are subject to eitherwater or wind erosion above the tolerable erosion rate. HEL lands represent a threat to theproductive capacity of the soil resource, as well as the aquatic resource when soil is transported offfarmland into the streams. Offsite damage from soil erosion costs millions of Ohio taxpayer dollarsevery year to remove sediment from drainage ditches, shipping harbors and recreational areas (SCS1985, USDA 1996).
The Ottawa River watershed is largely rural with a population of 100,230 residents. Lima is thelargest urban area with 45% of the county's population. There are eleven other communities locatedin the watershed: Ada, Lafayette, Fort Shawnee, Cridersville, Beaverdam, Cairo, Columbus Grove,Gomer, Vaughnsville, Elida, and Kalida. Land use is primarily dedicated to agricultural activitieswith approximately 85% ( 202,368 acres) of land used for crop production, 5% forest, 1% pasture,and 9% urban and other land uses (Allen SWCD 1994, USDA 1996).
The Ottawa River and its tributaries are impaired by a combination of point and nonpoint sourcesof pollution. Point source impairment is attributed to industrial and municipal effluents, combinedsewer overflow (CSO) and sanitary sewer overflow (SSO) discharges from the City of Lima andother villages in the watershed, as well as inadequately or untreated sewage discharges from severalunsewered areas in the watershed. The villages of Gomer, Rimer, and Vaughnsville currently donot have sanitary sewerage systems. The Village of Cairo began construction of a wastewatercollection system in 1997 and will be connected to the American Bath wastewater treatment plant.Industrial effluents also continue to contribute to impairment of the river. Table 4 lists the streamcharacteristics and pollution sources for the streams that were sampled during the 1996 survey.
Significant improvements have been made to wastewater treatment facilities at the major industrialand municipal dischargers in the Lima area since the late 1970s. Ongoing improvements at the LimaWWTP, BP Oil, and PCS Nitrogen Ohio, as well as completely new wastewater treatment facilitiesat Shawnee and American Bath have further decreased pollutant loadings to the Ottawa River andPike Run since the Ohio EPA water quality survey in 1991.
In addition to the usual agricultural sources of nonpoint pollution identified in Table 4, the OttawaRiver is impaired or impacted by several urban sources including leachate from the old BathTownship landfill, the BP Oil L5 landfill, runoff from heavy manufacturing facilities, and runoff orspills from petroleum transfer and tank farm facilities. Known causes of impairment to the OttawaRiver and tributary streams include organic enrichment and low dissolved oxygen, habitat
MAS/1997-12-6 Ottawa River Basin TSD December 31 , 1998
35
alterations, nutrients, ammonia, metals, oil and grease, and chlorine.
Conservation programs in farming are being promoted by the Natural Resources ConservationService (NRCS) and local Soil and Water Conservation Districts (SWCDs) throughout thewatershed. Conservation tillage practices have increased significantly over the last ten years in allfour counties. The 1996 Allen County tillage transect indicates that more than half of the grain cropswere planted in no-till or mulch-till with greater than 30% residue (45.4% corn, 63.8% soybeans,52% wheat)(Allen SWCD 1996).
A USDA Forest Service Report prepared in 1996 for the Ottawa River watershed identified problemssuch as excessive erosion, inadequate forest management, and degraded water quality and fishhabitat in the watershed. The report made recommendations for the establishment of windbreaks,riparian buffers, and trees for streambank stabilization to protect the forest, soil and water resourcesin the watershed (USDA 1996). Through a Section 319 Nonpoint Source program grant from OhioEPA and a Nature Works grant from ODNR, over $290,000 was available through 1998 to stabilizestream banks and convert farmland and floodplain land to riparian buffer strips along the rivercorridor.
In 1994, a local watershed action group, the Ottawa River Coalition, was formed as a non profitorganization to coordinate efforts of local residents, landowners, and groups to improve water qualityand educate the public on the benefits of protecting the watershed's resources. Over the past fouryears the Coalition has worked hard to promote nonpoint source and pollution prevention awareness,and has maintained a positive presence throughout the watershed. In 1995 the Ottawa RiverCoalition received a Section 319 grant from Ohio EPA to implement nonpoint source pollutionincentive programs in the watershed. Over the course of this three and a half year grant, nearly$300,000 will be spent on educational and cost share programs that include erosion control andriparian protection projects, pollution prevention workshops, demonstration of wetlands for sewagetreatment, storm drain stenciling, and a volunteer stream monitoring program.
Aquatic life use designations for the Ottawa River, Little Ottawa River, and Plum Creek areWarmwater Habitat; and Modified Warmwater Habitat is the designation for Pike Run. All streamsin the study area have a recreational use designation of Primary Contact Recreation. As a watersupply resource, the Ottawa River is designated as an Industrial and Agricultural Water Supply. TheCity of Lima Water Treatment Plant also supplies over 16 million gallons of treated water per dayto the City of Lima, the Elida area, Fort Shawnee area and into Bath Township in Allen County. TheOttawa River system also provides for local recreation such as fishing, waterfowl hunting, bikingor hiking along the corridor path constructed by the Lima Parks, Recreation and ForestryDepartment, and numerous community and family activities offered by the Johnny Appleseed MetroParks District.
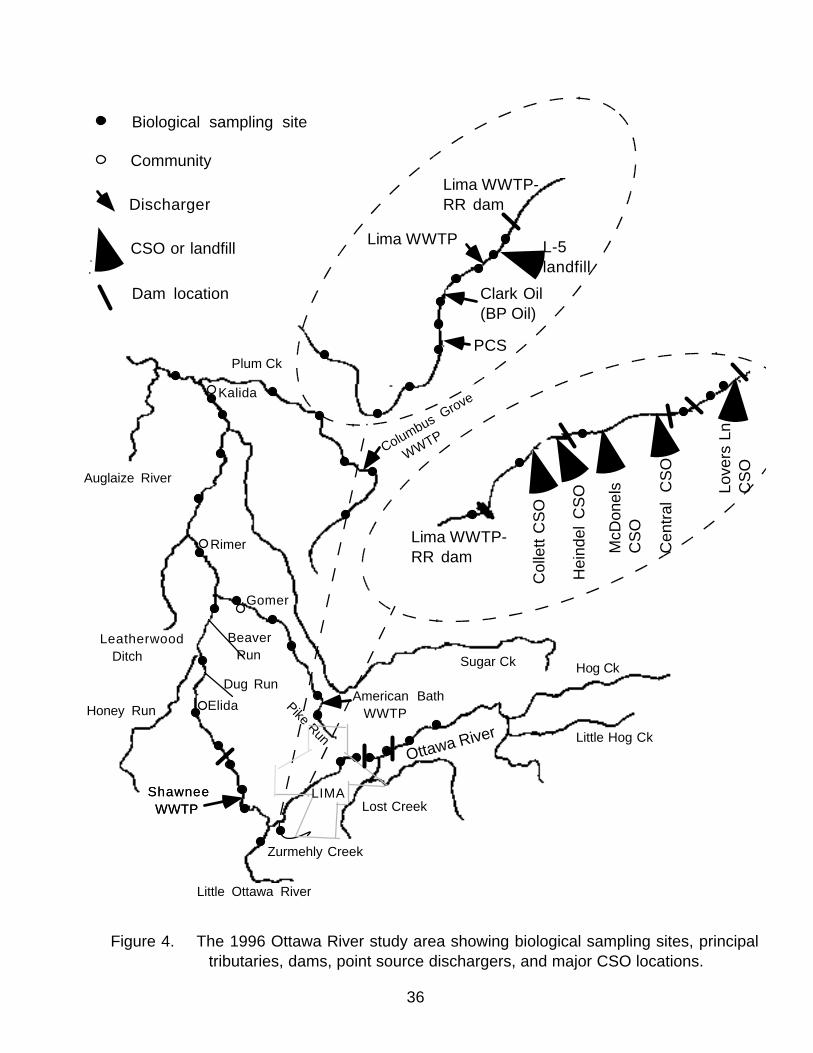
Figure 4. The 1996 Ottawa River study area showing biological sampling sites, principal tributaries, dams, point source dischargers, and major CSO locations.
36
Clark Oil(BP Oil)
PCS
Lima WWTP
Lima WWTP-RR dam
L-5landfill
Love
rs L
nC
SO
McD
onel
sC
SO
Cen
tral
C
SO
Hei
ndel
CS
O
Col
lett
CS
OLima WWTP-RR dam
Hog Ck
Little Hog CkOttawa River
Lost Creek
Little Ottawa River
Zurmehly Creek
Honey Run
Leatherwood Ditch
Auglaize River
Plum Ck
Sugar Ck
Pike Run
Beaver Run
Dug Run
Elida
Shawnee WWTPShawnee WWTP
Rimer
Kalida
Columbus Grove
WWTP
Gomer
American Bath WWTP
LIMA
Biological sampling site
Community
Discharger
CSO or landfill
Dam location

MAS/1997-12-6 Ottawa River Basin TSD December 31 , 1998
37
Table 4. Stream Characteristics and Significant Identified Pollution Sources in the Ottawa River Study Area ( ODNR 1954, Ohio EPA 1997)
River/Stream Length Gradient Drain. Area Nonpoint Point(mi.) (ft./mi.) (sq. mi.) Sources Sources
Ottawa River 52.7 4.0 365.0 Bath Twp Landfill Lima WWTPBP Oil L-5 LF Clark Oil (formerly BP Oil)Agriculture PCS Nitrogen Ohio, LPCrop production (formerly Arcadian Ohio LPLivestock pasture/ and BP Chemicals)feedlots Shawnee #2 WWTPSpecialty crops Elida WWTPHydromodification Kalida WWTPStorm sewersSanitary sewersSurface runoffWastewaterSan. landfillIn place pollutantsSurface miningDam constructionSludgeIndustrial land trtmt
Little Ottawa River 6.4 8.6 16.4 Agriculture Cridersville WWTPCrop productionStorm sewersHydromodificationStreambank modification
Pike Run 8.2 7.9 13.0 Agriculture American Bath WWTPCrop productionStorm sewersHydromodification
Plum Creek 14.4 3.5 39.9 Agriculture Columbus Grove WWTPCrop productionLivestock pasture/feedlotsUrban runoffHydromodification
Zurmehly Creek (no information) Lima Army Tank PlantVarious petroleum tank farms and transfer stations

MAS/1997-12-6 Ottawa River Basin TSD December 31 , 1998
38
Table 5. 1996 Sampling locations (effluent sample - E, water chemistry - C, sediment chemistry - S [metals-m, organics-o], datasonde - D, benthos - B, fish - F, fish tissue - FT, biomarker - BM) in the Ottawa River
study area._________________________________________________________________________________________
Stream Type of USESRM Sampling Latitude/Longitude Landmark Quad. Map
__________________________________________________________________________________________Ottawa River
46.1 F,FT,BM 40E45'58"/84E00'39" Ust Thayer Rd. Cairo45.97 C,CO,SM,SO 40E45'57"/84E00'43" Thayer Rd. Cairo45.9 B,D 40E45'55"/84E00'50" Thayer Rd. Cairo44.5 B 40E45'26"/84E02'02" Ust Fetter Rd Cairo44.4 F 40E45'26"/84E02'03" Fetter Rd Cairo44.26 C,SM,SO 40E45'25"/84E02'14" Fetter Rd Cairo43.6 F 40E45'12"/84E02'50" Metzger Rd dam pool Cairo43.45 C,CO NA Dst Metzger Rd dam Cairo43.4 F,B,D 40E45'03"/84E03'05" Dst Metzger Rd dam Cairo42.61 C,CO,SM,SO 40E44'51"/84E04'09" Roush Rd Lima42.4 B,BM 40E44'52"/84E04'15" Dst Roush Rd dam Lima42.3 F 40E44'55"/84E00'57 Dst Roush Rd dam Lima41.30 C,D 40E44'55"/84E05'16" Sugar St Lima41.2 F,B 40E44'54"/84E05'14" Sugar St. Lima40.8 F 40E44'59"/84E05'38" Dst. Sugar St Lima40.2 F,FT 40E44'34"/84E05'33" Ust. Lovers Ln (dam pool)Lima40.14 C,CO 40E44'25"/84E05'36" Dst Lovers Ln dam Lima40.1 B 40E44'26"/84E05'37" Dst Lovers Ln dam Lima39.9 F 40E44'19"/84E05'49" Elm St. dam pool Lima39.6 B 40E44'12"/84E06'03" Dst. Elm St. dam Lima38.9 F 40E43'59"/84E06'48" Ust. Collette St. dam Lima38.63 C,CO,SM,SO 40E43'55"/84E07'09" Collette St. Lima38.6 F,FT,B,D,BM 40E43'50"/84E07'22" Dst. Collett St. Lima38.0 SM,SO 40E43'30"/84E07'33" Ust. dam & dst. CSOs Cridersville37.91 C,CO 40E43'27"/84E07'36" Dst. dam Cridersville37.9 F,FT,B,D 40E43'28"/84E07'34" Dst. dam & CSOs Cridersville37.8 B 40E43'27"/84E07'37" Dst. dam & CSOs Cridersville37.70 C,CO,SM,SO,F,BM 40E43'25"/84E07'41" Dst. dam & CSOs Cridersville37.67 E 40E43'23"/84E07'55" Lima WWTP effluent Cridersville37.66 F,B 40E43'23"/84E07'56" Lima WWTP mix zone Cridersville37.4 B,BM 40E43'20"/84E08'09" Dst. Lima WWTP Cridersville37.30 C,CO,SM,SO,D 40E43'20"/84E08'11" Dst. Lima WWTP Cridersville37.2 F 40E43'14"/84E08'13" Dst landfill/low water brdgCridersville37.11 E 40E43'08"/84E08'14" BP Refinery effluent Cridersville37.10 F,B 40E43'07"/84E08'14" BP Refinery mix zone Cridersville37.00 C,CO,SM,SO,D,F,B,BM 40E43'05"/84E08'14" Dst. BP Refinery Cridersville36.87 E 40E43'01"/84E08'15" Arcadian LP effluent Cridersville36.86 F,B 40E43'00"/84E08'15" Arcadian LP mix Cridersville
Table 5. Continued.

MAS/1997-12-6 Ottawa River Basin TSD December 31 , 1998
39
_________________________________________________________________________________________
Stream Type of USESRM Sampling Latitude/Longitude Landmark Quad. Map
__________________________________________________________________________________________36.80 C,CO,SM,SO,F,FT 40E42'58"/84E08'15" Dst. Arcadian LP Cridersville36.7 BM 40E42'47"/84E08'17" Dst. Arcadian LP Cridersville 36.30 C,CO,SM,SO,D 40E42'30"/84E08'28" Dst. Arcadian LP SSO Cridersville36.1 B 40E42'28"/84E08'40" Twp. Fire Station Cridersville 36.0 F 40E42'35"/84E08'45" Twp. Fire Station Cridersville35.5 F 40E42'25"/84E09'00" Ust. Shawnee CC Cridersville34.7 F,BM 40E42'40"/84E09'22" Shawnee Country Club Cridersville34.55 C,CO,SM,SO 40E42'45"/84E09'25" Shawnee Country Club Cridersville34.5 B 40E42'51"/84E09'28" Shawnee Country Club Cridersville34.3 D 40E42'58"/84E09'34" Shawnee Country Club Cridersville32.60 C,CO,SM,SO,D,F,B 40E43'20"/84E10'27" Ust. SR 117 Cridersville32.41 C 40E43'31"/84E10'26" Dst. Shawnee WWTP Cridersville32.4 F,B 40E43'31"/84E10'26" Dst. Shawnee WWTP Cridersville31.03 C,CO,SM,SO 40E44'13"/84E10'51" Elm St,dst. Seriff Landfil Cridersville31.0 D NA Elm St,dst. Seriff Landfil Cridersville28.9 F,FT,BM 40E45'13"/84E11'42" Ust. Allentown Dam Elida28.87 SM,SO 40E45'19"/84E11'41" Ust. Allentown Dam Elida28.83 C,CO 40E45'19"/84E11'41" Dst. Allentown Dam Elida28.8 F,B,D 40E45'19"/84E11'41" Dst. Allentown Dam Elida25.8 B 40E47'14"/84E12'45" Ust. Piquad Rd Elida25.75 C,CO,SM,SO 40E47'16"/84E12'45" Piquad Rd Elida25.7 F 40E47'17"/84E12'46" Dst. Piqaud Rd Elida24.2 D 40E48'01"/84E12'14" Elida22.94 C,CO,SM,SO 40E49'00"/84E12'30" State Rd Elida22.9 B,D 40E48'57"/84E12'28" Ust. State Rd Elida21.1 BM Ridge Rd Elida21.0 F 40E50'14"/84E11'51" Ridge Rd Elida16.2 F 40E52'46"/84E12'30" Ust. SR 189 (Rimer) Kalida16.0 B 40E53'02"/84E12'47" Ust. SR 189 (Rimer) Kalida15.98 C,CO,SM,SO,D 40E53'03"/84E12'47" SR 189 Kalida13.0 F 40E54'31"/84E12'26" Dst. Ottawa River Churc Kalida8.12 C,CO,SM,SO,D 40E56'49"/84E11'12" Putnam CR P Kalida7.8 B 40E56'56"/84E11'39" Adj. Putnam Rd 17N Kalida5.6 F 40E58'06"/84E11'26" Adj. SR 115(Collie prop) Kalida3.8 F 40E58'42"/84E12'09" Ust. US 224 Kalida3.7 B 40E58'47"/84E12'10" Ust. US 224 Kalida3.67 C,D 40E58'50"/84E12'15" US 224 Kalida1.2 F,FT 40E59'23"/84E13'24" Ust. Putnam Rd. 19 Kalida1.1 BM Ust. Putnam Rd. 19 Kalida0.96 C,CO,SM,SO,D 40E59'26"/84E14'36" Putnam Rd. 19 Kalida0.8 B 40E59'25"/84E13'45" Dst. Putnam Rd. 19 Kalida

MAS/1997-12-6 Ottawa River Basin TSD December 31 , 1998
40
Table 5. Continued.._________________________________________________________________________________________
Stream Type of USESRM Sampling Latitude/Longitude Landmark Quad. Map
__________________________________________________________________________________________
Pike Run8.22 C,D 40E47'01"/84E07'21" Ust. A.-Bath WWTP Cairo8.2 F,B 40E47'01"/84E07'21" Ust. A.-Bath WWTP Cairo8.20 E 40E47'01"/84E07'21" American Bath WWTP Cairo8.1 C,D,F,B 40E47'06"/84E07'20" Dst. A.-Bath WWTP Cairo5.7 C,B 40E48'07"/84E08'59" Irvin Rd Elida4.7 F 40E48'57"/84E08'53" State Rd Elida4.3 ? D NA State Rd Elida2.2 F 40E50'24"/84E09'26" Ust. Sandy Pt Elida2.1 C,D 40E50'25"/84E10'02" Sandy Point Rd. Elida0.84 C 40E50'48"/84E11'09" Dst. Gomer Elida0.8 B 40E50'47"/84E11'12" Dst. Gomer Elida0.6 F 40E50'50"/84E11'19" Dst. Gomer Elida0.2 D
Plum Creek15.3 F 40E54'16"/84E05'00" Ust. Columbus Grove Columbus Grove14.9 C,CO,SM,SO,D,B 40E54'26"/84E04'41" Ust. Columbus Grove Columbus Grove12.94 C 40E55'26"/84E03'45" WWTP drive, Church St Columbus Grove12.9 F,B 40E55'26"/84E03'46" WWTP drive, Church St Columbus Grove12.2 F 40E55'45"/84E04'17" Road ust. CR-11-J Columbus Grove11.5 C,COCSM,SO,D,B 40E55'51"/84E04'54" CR-11-J Columbus Grove8.1 C,D,F,B 40E57'47"/84E06'07" TR O Columbus Grove5.5 F 40E58'34"/84E08'29" Adjacent M-10 Kalida4.4 C,D,B 40E58'58"/84E08'39" US 224 or TR M-10 Kalida0.2 C,CO,SM,SO,D,F,B 40E59'12"/84E12'33" SR 114 Kalida
Zurmehly Creek0.1 C,CO,SM,SO,F,B 40E42'19"/84E08'51" Near mouth Cridersville
Little Ottawa River0.4 C,CO,SM,SO,D,F,B 40E42'02"/84E09'15" Cemetery access Cridersville
_________________________________________________________________________________________

MAS/1997-12-6 Ottawa River Basin TSD December 31 , 1998
41
METHODSAll chemical, physical, aquatic habitat, and biological field, laboratory, data processing, and data analysismethodologies and procedures adhere to those specified in the Manual of Ohio EPA Surveillance Methodsand Quality Assurance Practices (Ohio Environmental Protection Agency 1989a), Biological Criteria forthe Protection of Aquatic Life, Volumes I-III (Ohio Environmental Protection Agency 1987a, 1987b, 1989b,1989c), and The Qualitative Habitat Evaluation Index (QHEI): Rationale, Methods, and Application (Rankin1989, 1995). Chemical, physical, aquatic habitat, and biological sampling locations are listed in Table 5.
Determining Use Attainment StatusUse attainment status is a term describing the degree to which environmental indicators are either above orbelow criteria specified by the Ohio Water Quality Standards (WQS; Ohio Administrative Code 3745-1).Assessing aquatic use attainment status involves a primary reliance on the Ohio EPA biological criteria(OAC 3745-1-07; Table 7-14). These are confined to ambient assessments and apply to rivers and streamsoutside of mixing zones. Numerical biological criteria are based on multi metric biological indicesincluding the Index of Biotic Integrity (IBI) and modified Index of Well-Being (MIwb), indices measuringthe response of the fish community, and the Invertebrate Community Index (ICI), which indicates theresponse of the macroinvertebrate community. Numerical endpoints are stratified by ecoregion, usedesignation, and stream or river size. Three attainment status results are possible at each sampling location -full, partial, or non-attainment. Full attainment means that all of the applicable indices meet the Ohio WQSbiocriteria. Partial attainment means that one or more of the applicable indices fails to meet the biocriteria.Non-attainment means that none of the applicable indices meet the biocriteria, or one of the organism groupsreflects poor or very poor performance. An aquatic life use attainment table (see Table 1) is constructedbased on the sampling results and is arranged from upstream to downstream and includes the samplinglocations indicated by river mile, the applicable biological indices, the use attainment status (i.e., full,partial, or non), the Qualitative Habitat Evaluation Index (QHEI), and comments and observations for eachsampling location.
The attainment status of aquatic life uses (i.e., full, partial, and non-attainment) is determined by using thebiological criteria codified in the Ohio Water Quality Standards (WQS; Ohio Administrative Code [OAC]3745-1-07, Table 7-14). The biological community performance measures used include the Index of BioticIntegrity (IBI) and Modified Index of Well-Being (MIwb), based on fish community characteristics, and theInvertebrate Community Index (ICI) which is based on macroinvertebrate community characteristics. TheIBI and ICI are multi metric indices patterned after an original IBI described by Karr (1981) and Fausch etal. (1984). The ICI was developed by Ohio EPA (1987b) and further described by DeShon (1995). TheMIwb is a measure of fish community abundance and diversity using numbers and weight information andis a modification of the original Index of Well-Being originally applied to fish community information fromthe Wabash River (Gammon 1976; Gammon et al. 1981).
Performance expectations for the principal aquatic life uses in the Ohio WQS (Warmwater Habitat [WWH],Exceptional Warmwater Habitat [EWH], and Modified Warmwater Habitat [MWH]) were developed usingthe regional reference site approach (Hughes et al. 1986; Omernik 1987). This fits the practical definition

MAS/1997-12-6 Ottawa River Basin TSD December 31 , 1998
42
of biological integrity as the biological performance of the natural habitats within a region (Karr and Dudley1981). Attainment of the aquatic life use is full if all three indices (or those available) meet the applicablebiocriteria, partial if at least one of the indices does not attain and performance is fair, and non-attainmentif all indices fail to attain or any index indicates poor or very poor performance. Partial and non-attainmentindicate that the receiving water is impaired and does not meet the designated use criteria specified by theOhio WQS.
Chemical Sediment Quality AssessmentThe quality of sediment concentrations was based on two classification schemes. The Kelly and Hite (1984)and Ohio EPA (1996) classifications grade sediment quality from low concentrations (non-elevated)measured at relatively unimpacted areas to higher concentrations (ie. slightly, highly, or extremely elevated)measured at heavily impacted areas. The Ontario guidelines (Persaud, 1994) are based on the chronic,long term effects of contaminants on macroinvertebrates and grades sediment quality as no effect, lowesteffect, and severe effect levels.
Fish Tissue AssessmentFish tissue sampling procedures are detailed in the Manual of Ohio EPA Surveillance Methods and QualityAssurance Practices (Ohio Environmental Protection Agency 1989a). Mercury and pesticides werecompared to the U.S. FDA criteria. PCBs were compared to a tiered sportfish consumption advisory asmodified from the Great Lakes Sport Fish Advisory Task Force, 1993. This classification scheme rates fishtissue PCB levels as slightly elevated (i.e., >50 and <300 ug/kg), elevated (i.e., >300 and <1000 ug/kg),highly elevated(i.e., >1000 and <5000 ug/kg), and extremely elevated (i.e., >5000 ug/kg).
Biomarker AssessmentWhite sucker and common carp were collected for biomarker processing in the Ottawa River during 1996.Fish were kept in a floating livewell until biomarker tissue samples could be taken. Fish were anesthetizedwith MS222 and length and weight was measured. Fish health/condition was assessed using procedures inGoede (1988). Blood was drawn from the caudal vein through a 21 gauge needle into heparin treated 3 mlblood drawing tubes. Whole blood was centrifuged on-site and the plasma removed (flash frozen at -100C in a liquid nitrogen dry shipper). The liver was excised, wrapped in aluminum foil and frozen in a liquido
nitrogen dry shipper. Bile was removed, placed in amber microcentrifuge tubes and placed in a liquidnitrogen dry shipper. Sections of liver and spleen were excised from each fish and placed in bufferedformalin for histological evaluation. Tissue samples were transported to the U.S. EPA in Cincinnati forlaboratory analysis. Specific biomarker analyses included ethoxyresorufin-O-deethylase (EROD), totalhepatic glutathione, blood urea nitrogen, plasma levels of pseudocholinesterase, and bile metabolites. Eachbile sample was diluted with distilled/deionized water and measured by fixed fluorescence at fourexcitation/emission wavelength pairs according to Lin et al. (in preparation). Although more than onecompound is known to fluoresce under these conditions, some compounds give a greater response. Themetabolites are referred to by one of their most sensitive respondents: pyrenol-type at 340/380 nm,benzo(a)pyrenol-type at 380/430 nm, phenanthrol-type at 256/380 nm and naphthol-type at 290/335 nm.Microsomes for measuring EROD and cytosol for glutathione were prepared from liver tissue. Microsomeswere prepared according to Lin et al. (1989) and the cytosolic supernatant resulting from the high speed

MAS/1997-12-6 Ottawa River Basin TSD December 31 , 1998
43
centrifugation was reserved for glutathione measurement. EROD activity was measured fluorometricallyaccording to Pohl and Fouts (1980) and modified Lin et al. (1989). Glutathione was measured accordingto Akerboum and Sies (1981) and adapted for use with an automated chemistry analyzer.
Habitat AssessmentPhysical habitat was evaluated using the Qualitative Habitat Evaluation Index (QHEI) developed by theOhio EPA for streams and rivers in Ohio (Rankin 1989, 1995). Various attributes of the habitat are scoredbased on the overall importance of each to the maintenance of viable, diverse, and functional aquatic faunas.The type(s) and quality of substrates, amount and quality of instream cover, channel morphology, extent andquality of riparian vegetation, pool, run, and riffle development and quality, and gradient are some of thehabitat characteristics used to determine the QHEI score which generally ranges from 20 to less than 100.The QHEI is used to evaluate the characteristics of a stream segment, as opposed to the characteristics ofa single sampling site. As such, individual sites may have poorer physical habitat due to a localizeddisturbance yet still support aquatic communities closely resembling those sampled at adjacent sites withbetter habitat, provided water quality conditions are similar. QHEI scores from hundreds of segmentsaround the state have indicated that values greater than 60 are generally conducive to the existence ofwarmwater faunas whereas scores less than 45 generally cannot support a warmwater assemblage consistentwith the WWH biological criteria. Scores greater than 75 frequently typify habitat conditions which havethe ability to support exceptional warmwater faunas.
Macroinvertebrate Community AssessmentMacroinvertebrates were sampled quantitatively using multiple-plate, artificial substrate samplers (modifiedHester/Dendy) in conjunction with a qualitative assessment of the available natural substrates. During thepresent study, analyses of macroinvertebrate data collected from the natural substrates was supplementedusing an assessment tool currently in the field validation phase. This method relies on tolerance valuesderived for each taxon, based upon the abundance data for that taxon from artificial substrate (quantitative)samples collected throughout Ohio. To determine the tolerance value of a given taxon, ICI scores at alllocations where the taxon has been collected are weighted by its abundance on the artificial substrates. Themean of the weighted ICI scores for the taxon results in a value which represents its relative level oftolerance on the 0 to 60 scale of the ICI. For the qualitative collections in the Ottawa River study area, themedian tolerance value of all organisms from a site resulted in a score termed the Qualitative CommunityTolerance Value (QCTV). The QCTV shows potential as a method to supplement existing assessmentmethods using the natural substrate collections. Use of the QCTV in evaluating sites in the Ottawa Riverstudy area was restricted to relative comparisons between sites and was not unilaterally used to interpretquality of the sites or aquatic life use attainment status.
Fish Community AssessmentFish were sampled using wading or boat method pulsed DC electrofishing gear. The wading method wasused at a frequency of one or two samples at each site. The boat method was used at a frequency of two

MAS/1997-12-6 Ottawa River Basin TSD December 31 , 1998
44
samples at each site except where the boat method was used on the first pass, and the wading method on thesecond pass due to low flows.
Area of Degradation Value (ADV)An Area Of Degradation Value (ADV; Rankin and Yoder 1991; Yoder and Rankin 1995) was calculatedfor the study area based on the longitudinal performance of the biological community indices. The ADVportrays the length or "extent" of degradation to aquatic communities and is simply the distance that thebiological index (IBI, MIwb, or ICI) departs from the applicable biocriterion or the upstream level ofperformance (Figure 5). The “magnitude” of impact refers to the vertical departure of each index below thebiocriterion or the upstream level of performance. The total ADV is represented by the area beneath thebiocriterion (or upstream level) when the results for each index are plotted against river mile. The resultsare expressed as ADV/mile to normalize comparisons between segments, sampling years, and other streamsand rivers.
Causal AssociationsUsing the results, conclusions, and recommendations of this report requires an understanding of themethodology used to determine the use attainment status and assigning probable causes and sources ofimpairment. The identification of impairment in rivers and streams is straightforward - the numericalbiological criteria are used to judge aquatic life use attainment and impairment (partial and non-attainment).The rationale for using the biological criteria, within a weight of evidence framework, has been extensivelydiscussed elsewhere (Karr et al. 1986; Karr 1991; Ohio EPA 1987a,b; Yoder 1989; Miner and Borton 1991;Yoder 1991; Yoder 1995). Describing the causes and sources associated with observed impairments relieson an interpretation of multiple lines of evidence including water chemistry data, sediment data, habitat data,effluent data, land use data, and biological results (Yoder and Rankin 1995). Thus the assignment ofprincipal causes and sources of impairment in this report represent the association of impairments (basedon response indicators) with stressor and exposure indicators. The reliability of the identification of probablecauses and sources is increased where many such prior associations have been identified, or have beenexperimentally or statistically linked together. The ultimate measure of success in water resourcemanagement is the restoration of lost or damaged ecosystem attributes including aquatic communitystructure and function. While there have been criticisms of misapplying the metaphor of ecosystem “health”compared to human patient “health” (Suter 1993), in this document we are referring to the process forevaluating biological integrity and causes or sources associated with observed impairments, not whetherhuman health and ecosystem health are analogous concepts.

POINT SOURCEMIXING ZONE
AREA OF DEGRADATION VALUE (ADV)
INDEXVALUE
CSO/NPS20
30
40
50
60
0102030405060RIVER MILE
WWH Criterion(Index Value=40)
12 Flow Direction
POINTSOURCE
MAS/1997-12-6 Ottawa River Basin TSD December 31 , 1998
45
Figure 5. Graphic illustration of the Area of Degradation Value (ADV) based on theecoregion biocriterion (WWH in this example). the index value trend lineindicated by the unfilled boxes and solid shading (area of departure)represents a typical response to a point source impact (mixing zone appearsas a solid triangle); the filled boxes and dashed shading (area of departure)represent a typical response to a nonpoint source or combined seweroverflow impact. The blended shading represents the overlapping impact ofthe point and nonpoint sources.

MAS/1997-12-6 Ottawa River Basin TSD December 31 , 1998
46
TRENDS
Chemical Parameters: 1975-1996
Ottawa RiverAmmoniaThe Clark Oil and PCS Nitrogen plants have had significant reductions allowable ammonialoadings over time (Figures 6 and 7). The 1977-78 reductions were due to federal bestpracticable treatment (BPT) requirements. The 1986 reductions appear to be due to acombination of best available technology (BAT) and wasteload allocation (WLA)requirements. Ammonia limits have been required for the Lima WWTP for most of itspermit history and have not needed revision. The Shawnee WWTP has had water qualitybased ammonia limits for the summer low-flow period since 1989. Limits are not requiredduring the winter, because the effluent ammonia concentrations typically associated withsecondary treatment will allow Water Quality Standards (WQS) to be attained. Similarly,limits have also not been required for the Elida WWTP because of its small flow relative tothe Ottawa River. Secondary treatment allows ammonia WQS to be met during all seasons.
Loadings from the Lima WWTP were mostly very low but had a number of “spikes” abovelimits during the 1980s, especially during the summer (Figure 8). There have been noviolations since 1989. The Clark Oil and PCS Nitrogen facilities have reduced ammonialoadings several times, mostly in response to required reductions in limits. Loadings havegenerally been within limits. The Shawnee WWTP had a significant decrease in ammonialoadings in 1979; however, given problems with reporting, it is difficult to determine whenthe reductions really occurred. Loadings from the Elida WWTP were highly variable andshowed no apparent pattern.
A longitudinal examination of instream ammonia concentrations is presented in Figure 6.These graphs show that the average ambient ammonia concentration has steadily decreasedover time throughout the study area. However, ammonia exceedences still occurreddownstream from the PCS Nitrogen outfalls in 1991 (RM 36.80) and 1996 (RM 36.80 andRM 36.30), see Appendix Table . PCS Nitrogen continues to discharge the highest loadingsof ammonia to the Ottawa River (Figure 7).

0
100
200
300
400
500
600
1975
1976
1977
1978
1979
1980
1981
1982
1983
1984
1985
1986
1987
1988
1989
1990
1991
1992
1993
1994
Am
mon
ia L
oadi
ng (
kg/d
ay)
N=153 153 153 137 153152 152 153 153 153150 152150153151 153 153 153 153151
LIMA WWTP
0
100
200
300
400
500
600
1975
1976
1977
1978
1979
1980
1981
1982
1983
1984
1985
1986
1987
1988
1989
1990
1991
1992
1993
1994
Am
mon
ia L
oadi
ng (
kg/d
ay)
N=35 44 44 44 4444 44 44 44 4447 43444444 35 44 44 4644
Clark Oil Company
0
100
200
300
400
500
600
1975
1976
1977
1978
1979
1980
1981
1982
1983
1984
1985
1986
1987
1988
1989
1990
1991
1992
1993
1994
Am
mon
ia L
oadi
ng (
kg/d
ay)
N=22 22 21 22 2222 22 22 22 9022 86212222 21 88 88 8822
PCS Nitrogen
MAS/1997-12-6 Ottawa River Basin TSD December 31 , 1998
47
Figure 6. E f f l u e n tmonitoring data for ammonia from June to October, 1975 to 1994.

1976
Lima WWTPClark OilPCS NitrogenShawnee WWTPElida WWTPKalida WWTP
213 kg/day17.3%
313 kg/day25.4%
680 kg/day55.1%
20.1 kg/day1.63%
8.5 kg/day0.688%
1986
7.7 kg/day6.62%
8.4 kg/day7.19%
75.2 kg/day64.7%
8.8 kg/day7.56%
14.5 kg/day12.5%
1.7 kg/day1.46%
1996
3.8 kg/day5.85%
4.0 kg/day6.27%
47.3 kg/day73.4%
1.1 kg/day0.987%
7.1 kg/day11%
1.6 kg/day2.48%
MAS/1997-12-6 Ottawa River Basin TSD December 31 , 1998
48
Ammonia 50th Percentile Loadings
Figure 7. Ammonia 50th percentile monthly operating report (MOR) data, 1976, 1986,and 1996.

0
2
4
6
8
10
0510152025303540
OTTAWA RIVER
1977198519911996
Am
mon
ia-N
(m
g/l)
LimaWWTP
PCS-Nitrogen
Clark Oil
Shawnee WWTP
0
1
2
3
2123252729313335373941
198519911996
Am
mon
ia-N
(m
g/l)
River Mile
LimaWWTP
PCS-Nitrogen
Clark Oil
Shawnee WWTP
MAS/1997-12-6 Ottawa River Basin TSD December 31 , 1998
49
Figure 8. Longitudinal ammonia trends in the Ottawa River. Top graph includes 1977 data. Bottom graph is a different scale to better show more recent trends.
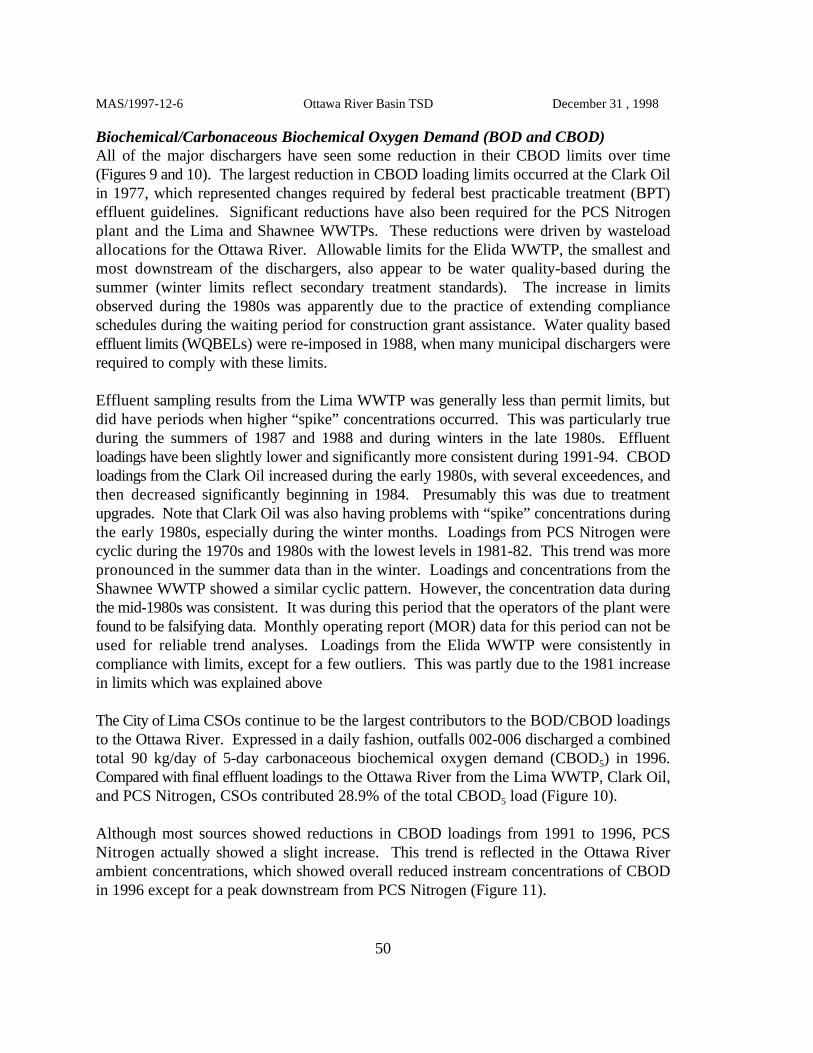
MAS/1997-12-6 Ottawa River Basin TSD December 31 , 1998
50
Biochemical/Carbonaceous Biochemical Oxygen Demand (BOD and CBOD)All of the major dischargers have seen some reduction in their CBOD limits over time(Figures 9 and 10). The largest reduction in CBOD loading limits occurred at the Clark Oilin 1977, which represented changes required by federal best practicable treatment (BPT)effluent guidelines. Significant reductions have also been required for the PCS Nitrogenplant and the Lima and Shawnee WWTPs. These reductions were driven by wasteloadallocations for the Ottawa River. Allowable limits for the Elida WWTP, the smallest andmost downstream of the dischargers, also appear to be water quality-based during thesummer (winter limits reflect secondary treatment standards). The increase in limitsobserved during the 1980s was apparently due to the practice of extending complianceschedules during the waiting period for construction grant assistance. Water quality basedeffluent limits (WQBELs) were re-imposed in 1988, when many municipal dischargers wererequired to comply with these limits.
Effluent sampling results from the Lima WWTP was generally less than permit limits, butdid have periods when higher “spike” concentrations occurred. This was particularly trueduring the summers of 1987 and 1988 and during winters in the late 1980s. Effluentloadings have been slightly lower and significantly more consistent during 1991-94. CBODloadings from the Clark Oil increased during the early 1980s, with several exceedences, andthen decreased significantly beginning in 1984. Presumably this was due to treatmentupgrades. Note that Clark Oil was also having problems with “spike” concentrations duringthe early 1980s, especially during the winter months. Loadings from PCS Nitrogen werecyclic during the 1970s and 1980s with the lowest levels in 1981-82. This trend was morepronounced in the summer data than in the winter. Loadings and concentrations from theShawnee WWTP showed a similar cyclic pattern. However, the concentration data duringthe mid-1980s was consistent. It was during this period that the operators of the plant werefound to be falsifying data. Monthly operating report (MOR) data for this period can not beused for reliable trend analyses. Loadings from the Elida WWTP were consistently incompliance with limits, except for a few outliers. This was partly due to the 1981 increasein limits which was explained above
The City of Lima CSOs continue to be the largest contributors to the BOD/CBOD loadingsto the Ottawa River. Expressed in a daily fashion, outfalls 002-006 discharged a combinedtotal 90 kg/day of 5-day carbonaceous biochemical oxygen demand (CBOD ) in 1996.5
Compared with final effluent loadings to the Ottawa River from the Lima WWTP, Clark Oil,and PCS Nitrogen, CSOs contributed 28.9% of the total CBOD load (Figure 10).5
Although most sources showed reductions in CBOD loadings from 1991 to 1996, PCSNitrogen actually showed a slight increase. This trend is reflected in the Ottawa Riverambient concentrations, which showed overall reduced instream concentrations of CBODin 1996 except for a peak downstream from PCS Nitrogen (Figure 11).
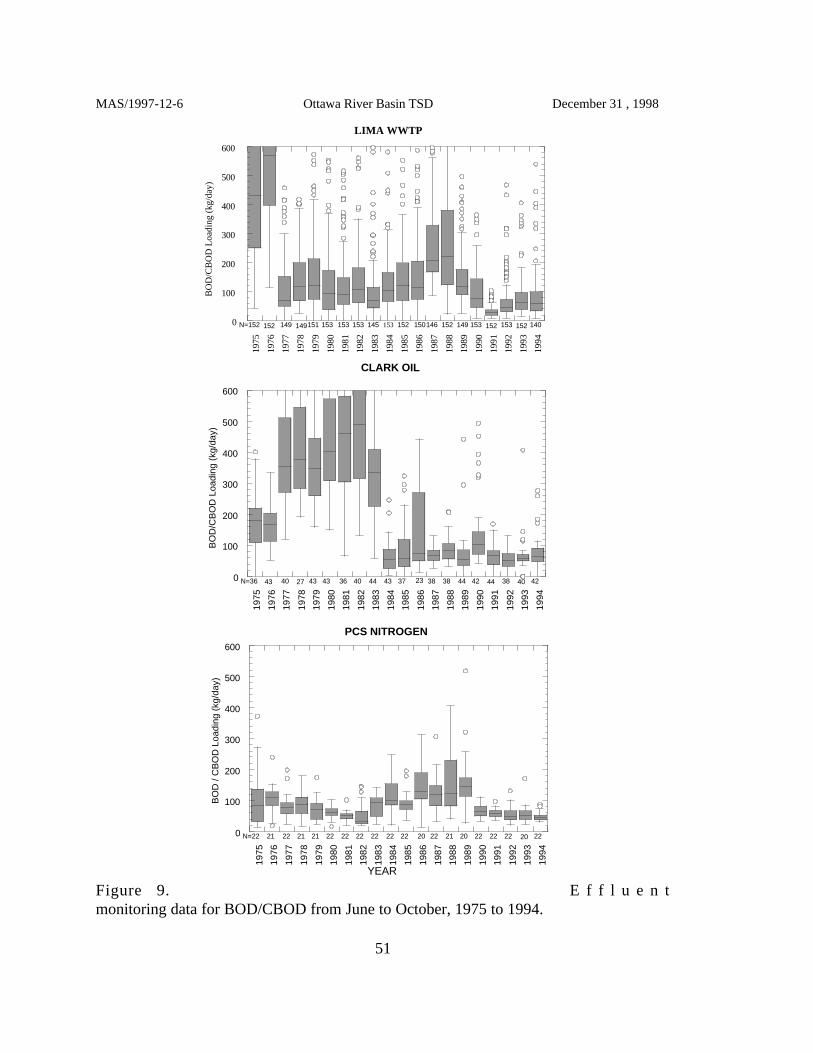
0
100
200
300
400
500
600
1975
1976
1977
1978
1979
1980
1981
1982
1983
1984
1985
1986
1987
1988
1989
1990
1991
1992
1993
1994
BO
D/C
BO
D L
oadi
ng (
kg/d
ay)
N=152 152 149151 153153 145 153 152 152149 153149146152 150 153 152 140153
LIMA WWTP
0
100
200
300
400
500
600
1975
1976
1977
1978
1979
1980
1981
1982
1983
1984
1985
1986
1987
1988
1989
1990
1991
1992
1993
1994
BO
D/C
BO
D L
oadi
ng (
kg/d
ay)
N=36 43 27 43 4036 44 43 38 4440 38443837 23 42 40 4243
CLARK OIL
0
100
200
300
400
500
600
1975
1976
1977
1978
1979
1980
1981
1982
1983
1984
1985
1986
1987
1988
1989
1990
1991
1992
1993
1994
BO
D /
CB
OD
Loa
ding
(kg
/day
)
N=22 21 21 21 2222 22 22 21 2222 22202222 20 22 20 2222
PCS NITROGEN
YEAR
MAS/1997-12-6 Ottawa River Basin TSD December 31 , 1998
51
Figure 9. E f f l u e n tmonitoring data for BOD/CBOD from June to October, 1975 to 1994.
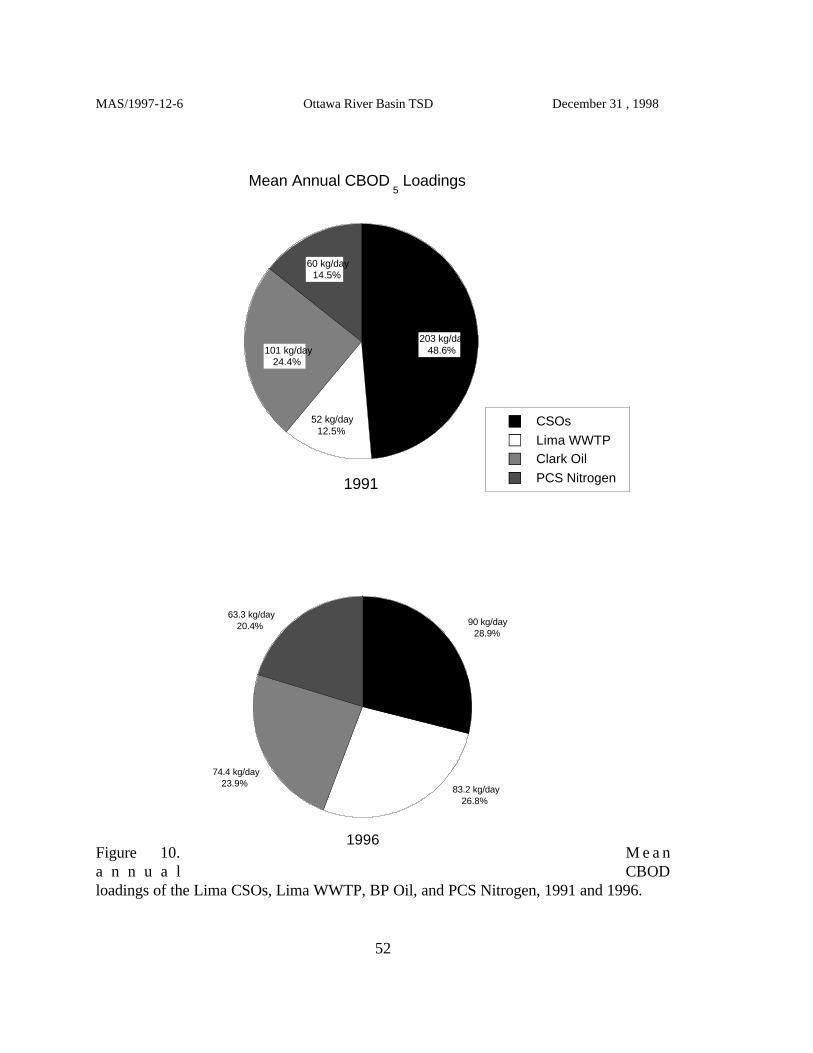
Mean Annual CBOD5 Loadings
CSOs
Lima WWTPClark Oil
PCS Nitrogen
203 kg/day48.6%
52 kg/day12.5%
101 kg/day24.4%
60 kg/day14.5%
1991
1996
90 kg/day28.9%
83.2 kg/day26.8%
74.4 kg/day23.9%
63.3 kg/day20.4%
MAS/1997-12-6 Ottawa River Basin TSD December 31 , 1998
52
Figure 10. M e a na n n u a l CBODloadings of the Lima CSOs, Lima WWTP, BP Oil, and PCS Nitrogen, 1991 and 1996.

0
2
4
6
8
10
12
051015202631364146
OTTAWA RIVER
1977
1991
1996
BO
D5 (
mg/
l)
Lima WWTP
PCS-NitrogenClark Oil
Shawnee WWTPCSOs
0
4
8
12
29303132343536383940
197719911996
BO
D5 (
mg/
l)
River Mile
LimaWWTP
PCS-Nitrogen
Clark Oil
Shawnee WWTP
CSOs
MAS/1997-12-6 Ottawa River Basin TSD December 31 , 1998
53
Figure 11. Longitudinal biochemical oxygen demand (BOD ) trends in the Ottawa5
River. Top graph includes data from Thayer Road to the mouth. Bottomgraph is a different scale to better show more recent trends.

MAS/1997-12-6 Ottawa River Basin TSD December 31 , 1998
54
Total Suspended Solids (TSS)The City of Lima CSOs continue to be the largest contributors of TSS loadings to the OttawaRiver. Expressed in a daily fashion, outfalls 002-006 discharged a combined total of 1,125kg/day of total suspended solids (TSS) in 1996. Compared with final effluent loadings to theOttawa River from the Lima WWTP, Clark Oil, and PCS Nitrogen, CSOs contributed 67.9%of the total TSS load (Figure 13).
Both the Clark Oil and PCS Nitrogen show slight, gradual reductions in TSS loading overthe period of record. Clark Oil’s 1984 treatment upgrade appears to have had the largesteffect (Figure 12). Most of these reductions were due to changes in allowable loadings underthe effluent guidelines. The 1977 changes were due to BPT rules, and the 1986 and 1990changes were apparently due to revisions in the production figures used to calculate theseload limits (the Petroleum Refining BPT/BAT guidelines are very sensitive to changes in theproduction mix, as well as changes in the overall level of production).
A significant increase in TSS concentrations occurred downstream from Rimer (lower 10-15miles), possibly due to an ecoregion transition from the ECBP to HELP (Figure 14).
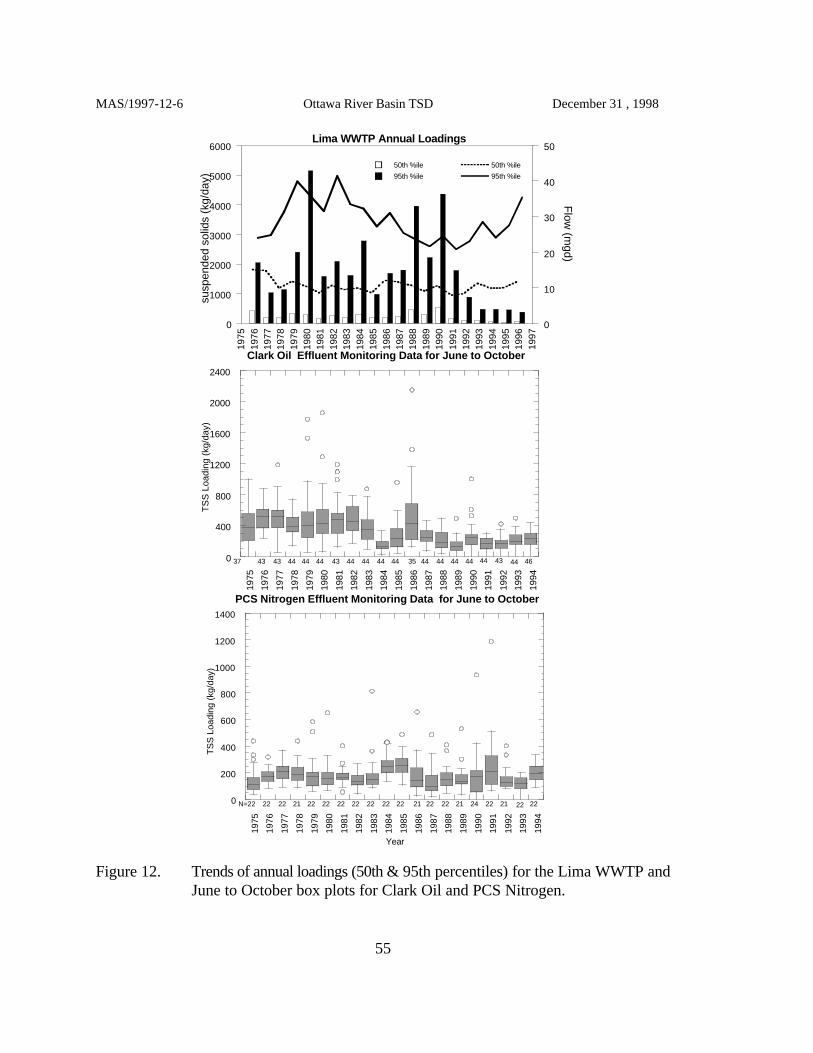
0
1000
2000
3000
4000
5000
6000
0
10
20
30
40
50
1975
1976
1977
1978
1979
1980
1981
1982
1983
1984
1985
1986
1987
1988
1989
1990
1991
1992
1993
1994
1995
1996
1997
50th %ile
95th %ile
50th %ile
95th %ile
susp
ende
d so
lids
(kg/
day)
Flow
(mgd)
Lima WWTP Annual Loadings
0
400
800
1200
1600
2000
2400
1975
1976
1977
1978
1979
1980
1981
1982
1983
1984
1985
1986
1987
1988
1989
1990
1991
1992
1993
1994
TS
S L
oadi
ng (
kg/d
ay)
37 43 44 44 4443 44 44 44 4443 43444444 35 44 44 4644
Clark Oil Effluent Monitoring Data for June to October
0
200
400
600
800
1000
1200
1400
1975
1976
1977
1978
1979
1980
1981
1982
1983
1984
1985
1986
1987
1988
1989
1990
1991
1992
1993
1994
TS
S L
oadi
ng (
kg/d
ay)
N=22 22 21 22 2222 22 22 22 2222 21212222 21 24 22 2222
Year
PCS Nitrogen Effluent Monitoring Data for June to October
MAS/1997-12-6 Ottawa River Basin TSD December 31 , 1998
55
Figure 12. Trends of annual loadings (50th & 95th percentiles) for the Lima WWTP andJune to October box plots for Clark Oil and PCS Nitrogen.

Mean Annual TSS Loadings
1118.9 kg/day60.6%
341.2 kg/day18.5%
204.9 kg/day11.1%
182.2 kg/day9.86%
1991
CSOs
Lima WWTP
Clark Oil
PCS Nitrogen
1124.8 kg/day67.9%
108.6 kg/day6.56%
258.7 kg/day15.6%
163.6 kg/day9.88%
1996
MAS/1997-12-6 Ottawa River Basin TSD December 31 , 1998
56
Figure 13. Mean annual total suspended solids (TSS) loadings of the Lima CSOs, LimaWWTP, CLARK Oil, and PCS Nitrogen, 1991 and 1996.

0
10
20
30
40
50
60
010203040
OTTAWA RIVER
1977198519911996
Tot
al S
uspe
nded
Sol
ids,
TS
S (
mg/
l)
LimaWWTP
PCS-Nitrogen
Clark Oil Shawnee WWTP
CSOs
River Mile
MAS/1997-12-6 Ottawa River Basin TSD December 31 , 1998
57
Figure 14. Longitudinal trend data of total suspended solids (TSS) in the Ottawa River,1977, 1985, 1991, and 1996.

MAS/1997-12-6 Ottawa River Basin TSD December 31 , 1998
58
Dissolved Oxygen (D.O.)Although there was increased instream concentrations of dissolved oxygen during the 1970s,levels of dissolved oxygen have remained relatively stable from 1985 to 1996 (Figure 15).There continues to be two depressions (sags) in oxygen levels, one downstream from theLima CSOs and the other downstream from the major dischargers.
Water samples were collected from the Ottawa River and four of the control structuresduring wet weather periods to assess the impact of the CSOs on the Ottawa River (The Cityof Lima’s Water Quality Impact Report, 1996). During a July 30, 1996 rain event dissolvedoxygen at Collett Street fell below 4.0 mg/l; and during an August 19 rain event dissolvedoxygen fell below 4.0 mg/l at Collett Street and below 3.0 mg/l at High Street (upstreamfrom CSO discharges).
During dry weather periods, the impact from the CSOs resulted in low D.O. in the watercolumn and increased levels of metals, PAHs, and PCBs in the sediments. During 1996, theOhio EPA sampled water column chemistry at 8 sites and sediment at 5 sites from ThayerRoad (RM 45.97) to downstream from the Lima WWTP/Erie-Lackawanna Railroad Dam(RM 47.91). Dissolved oxygen fell below 5.0 mg/l at both RM 38.63 and RM 37.91,downstream from the CSOs and upstream from the major point source dischargers.
An improvement was observed in the dissolved oxygen regime at the site immediatelydownstream from the Lima WWTP/Erie-Lackawana RR dam (RM 37.9) in 1996 comparedto 1991 (Figure 16). In 1996, datasonde data showed all values during a three day period tobe above 6.0 mg/l, compared the mean value less than 5.0 mg/l during a three day period in1991. The macroinvertebrate ICI increased from 6 (poor) to 28 (fair) from 1991 to 1996,respectively, at this site.
Downstream from the major dischargers (between RM 35 and RM 31) during the surveyyears, dissolved oxygen levels dropped below the average criterion of 5.0 mg/l in 1985 andbelow the minimum criterion of 4.0 mg/l in 1991 and 1996 (Figure 16). This sagcorresponds with increased levels of instream nutrients including ammonia, nitrate-nitrites,and phosphorus.
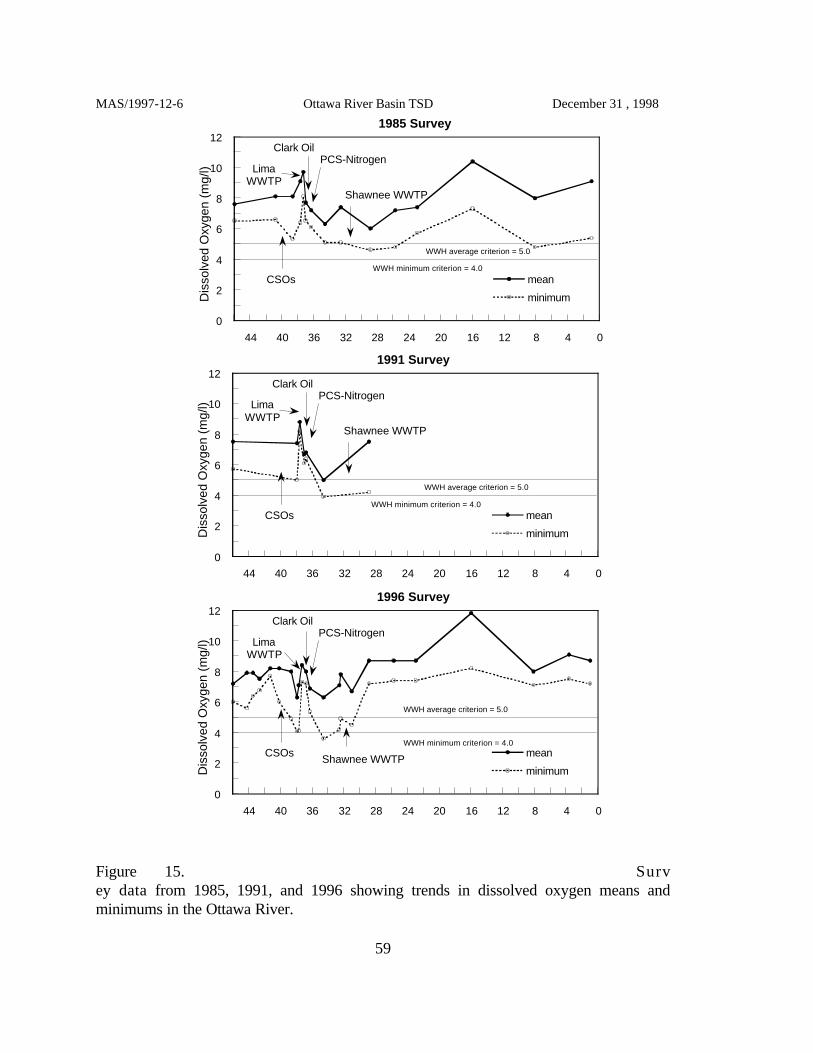
0
2
4
6
8
10
12
048121620242832364044
1985 Survey
mean
minimumDis
solv
ed O
xyge
n (m
g/l) Lima
WWTP
PCS-NitrogenClark Oil
Shawnee WWTP
CSOs
WWH average criterion = 5.0
WWH minimum criterion = 4.0
0
2
4
6
8
10
12
048121620242832364044
1991 Survey
mean
minimumDis
solv
ed O
xyge
n (m
g/l) Lima
WWTP
PCS-NitrogenClark Oil
Shawnee WWTP
CSOs
WWH average criterion = 5.0
WWH minimum criterion = 4.0
0
2
4
6
8
10
12
048121620242832364044
1996 Survey
mean
minimumDis
solv
ed O
xyge
n (m
g/l) Lima
WWTP
PCS-NitrogenClark Oil
Shawnee WWTPCSOs
WWH average criterion = 5.0
WWH minimum criterion = 4.0
MAS/1997-12-6 Ottawa River Basin TSD December 31 , 1998
59
Figure 15. Survey data from 1985, 1991, and 1996 showing trends in dissolved oxygen means andminimums in the Ottawa River.

1
10
100
1000
104
1996 Flow on Ottawa River at RM 37.9, USGS Gauge
Mea
n D
isch
arge
(cf
s)
May June July Aug. Sept
Q7, 10 = 18 cfs
survey sample collection dates (6)
datasonde collection
.74"
1.08" rainfall
2.28" rainfall
.83"
2
4
6
8
10
12
14
16
18
45.9
0
43.4
0
41.3
0
37.9
0
37.3
0
37.0
0
36.3
0
34.3
0
32.6
0
31.0
0
28.8
0
24.2
0
22.9
0
Ottawa River datasonde data August 13-15, 1996
Dis
solv
ed O
xyge
n (m
g/l)
River Mile
CSOs
LimaWWTP
Clark Oil
PCS
Shawnee #2WWTP
MAS/1997-12-6 Ottawa River Basin TSD December 31 , 1998
60
Figure 16. Ohio EPA datasonde data for the Ottawa River from August 13-15, 1996(top), and 1996 flow data recorded on the Ottawa River at the USES gaugestation at RM 37.9, upstream from the Lima WWTP (bottom).

MAS/1997-12-6 Ottawa River Basin TSD December 31 , 1998
61
Nitrates-nitritesInstream levels of NO -NO appear to have increased from 1985 and 1991, to 1996 in the2 3
upper section of the Ottawa River from Thayer Road to the Lima WWTP. This may be anartifact of the sampling event differences between the years. Three of the six samplescollected at Thayer Road in 1996 were below detection (<0.10 mg/l). The two highestconcentrations (11.3 and 6.44 mg/l) recorded at Thayer Road in 1996 were collectedfollowing rain events (Figure 16). These results were similar from Thayer Road to the LimaWWTP dam (two high values on the same day and four other low values) resulting in anaverage (of six samples) that was higher than previous years.
The instream data does suggest a nonpoint source loading of NO -NO is entering the Ottawa2 3
River upstream from Thayer Road during rainfall events, however, the bulk (highest load andhighest dry weather concentration) is entering the Ottawa River from the major point sources(Figure 18). Loadings of nitrates-nitrites (NO -NO ) increased at the Lima WWTP in 19762 3
and 1977 coinciding with reductions of ammonia loadings. Loadings from PCS Nitrogenhave increased from 1985 to 1991 (Figure 17).
There is also an indication that NO -NO is entering the Ottawa River in the area of the L-52 3
Landfill. On three sampling dates from August 19 to September 16 (see Appendix),concentrations of NO -NO were significantly higher downstream from the landfill at RM2 3
37.7 (8.06, 1.77, and 4.48 mg/l, respectively) compared to upstream at RM 37.9 (0.14, <0.10,and <0.10 mg/l, respectively).

0
500
1000
1500
2000
2500
0
10
20
30
40
50
1975
1976
1977
1978
1979
1980
1981
1982
1983
1984
1985
1986
1987
1988
1989
1990
1991
1992
1993
1994
1995
1996
1997
50th %ile
95th %ile
50th %ile
95th %ile
Nitr
ate
-N (
kg/d
ay)
Flow
(mgd)
Year
Lima WWTP Annual Loadings
0
20
40
60
80
100
120
140
0
1
2
3
4
5
1975
1976
1977
1978
1979
1980
1981
1982
1983
1984
1985
1986
1987
1988
1989
1990
1991
1992
1993
1994
1995
1996
1997
50th %ile
95th %ile
50th %ile
95th %ile
Nitr
ate-
N (
kg/d
ay)
Flow
(mgd)
Year
PCS Nitrogen Annual Loadings
MAS/1997-12-6 Ottawa River Basin TSD December 31 , 1998
62
Figure 17. Nitrate loadings trends for the Lima WWTP and PCS-Nitrogen, 1975-1996.
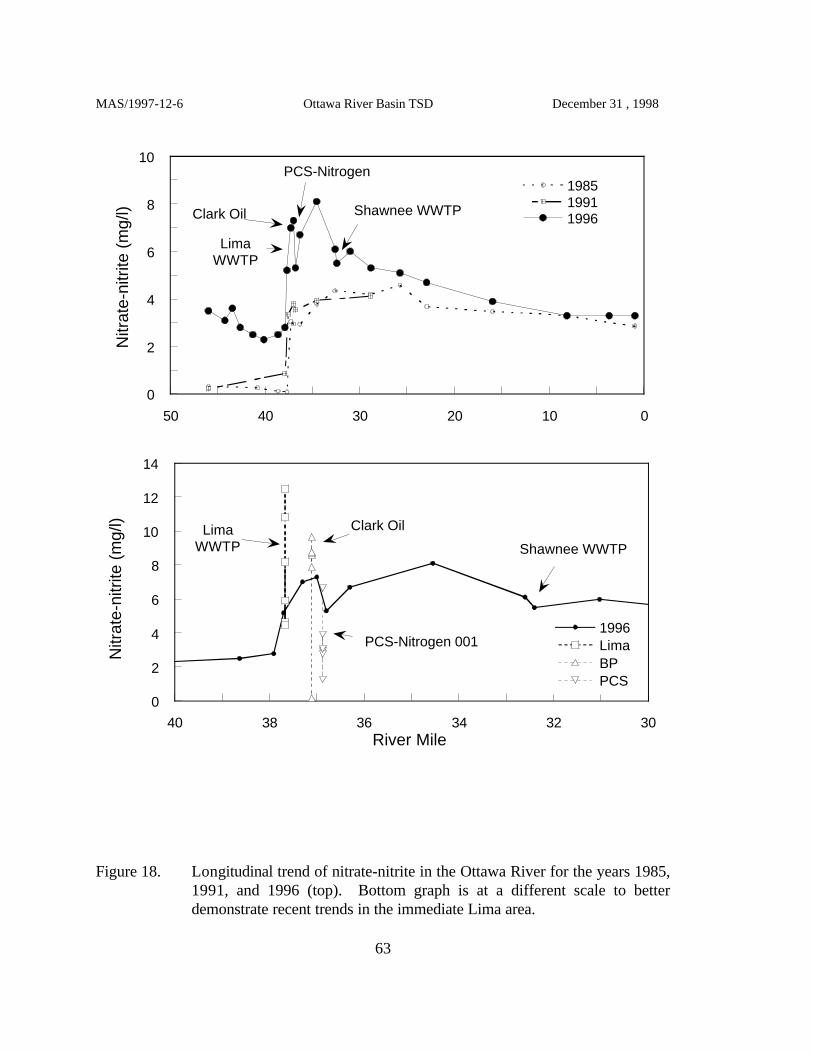
0
2
4
6
8
10
01020304050
198519911996
Nitr
ate-
nitr
ite (
mg/
l)
River Mile
LimaWWTP
PCS-Nitrogen
Clark Oil Shawnee WWTP
0
2
4
6
8
10
12
14
303234363840
1996LimaBPPCS
Nitr
ate-
nitr
ite (
mg/
l)
River Mile
LimaWWTP
PCS-Nitrogen 001
Clark Oil
Shawnee WWTP
MAS/1997-12-6 Ottawa River Basin TSD December 31 , 1998
63
Figure 18. Longitudinal trend of nitrate-nitrite in the Ottawa River for the years 1985,1991, and 1996 (top). Bottom graph is at a different scale to betterdemonstrate recent trends in the immediate Lima area.

MAS/1997-12-6 Ottawa River Basin TSD December 31 , 1998
64
PhosphorusAlthough loadings from the major dischargers were reduced from the 1970s to the 1990s,there was little change from 1985 to the 1996 (Figure 19).
Total phosphorus levels appear to have declined from 1985 to 1991, with little or no changeobserved from 1991 to 1996 (Figure 20). Increases in the ambient concentration ofphosphorus occurred downstream from the major dischargers in the Lima area.
There was one high value of phosphorus at RM 25.75 on 7/22/96 which drove the meanvalue up. This date coincides with a rainfall event (Figure 16) associated with high levelsof nitrate-nitrites in the upper section of the Ottawa River. The other five values ofphosphorus at this station were not significantly higher/lower than at the nearestupstream/downstream site collected on the same date. This suggests that a nonpoint sourcerunoff between the Allentown dam and Piquad Road may impact the Ottawa River duringhigh rainfall periods with loadings of phosphorus; however, the bulk (highest load andhighest continuous concentration) is entering the Ottawa River from the major point sources.

0
20
40
60
80
0
10
20
30
40
50
1975
1976
1977
1978
1979
1980
1981
1982
1983
1984
1985
1986
1987
1988
1989
1990
1991
1992
1993
1994
1995
1996
1997
TP 50th %ile
TP 95th %ile
Flow 50th %ile
Flow 95th %ile
Pho
spho
rus
(kg/
day)
Flow
(mgd)
Lima WWTP, Annual Loadings149 387 218 120 115 124
0
10
20
30
40
50
0
2
4
6
8
10
1975
1976
1977
1978
1979
1980
1981
1982
1983
1984
1985
1986
1987
1988
1989
1990
1991
1992
1993
1994
1995
1996
1997
TP 50th %ile
TP 95th %ile
Flow 50th %ile
Flow 95th %ile
Pho
spho
rus
(kg/
day)
Flow
(mgd)
Clark Oil, Annual Loadings
0
10
20
30
40
50
0
1
2
3
4
5
1975
1976
1977
1978
1979
1980
1981
1982
1983
1984
1985
1986
1987
1988
1989
1990
1991
1992
1993
1994
1995
1996
1997
50th %ile
95th %ile
50th %ile
95th %ile
Pho
spho
rus
(kg/
day)
Flow
(mgd)
Year
PCS Nitrogen Ohio, L.P. Annual Loadings
MAS/1997-12-6 Ottawa River Basin TSD December 31 , 1998
65
Figure 19. Annual 50th and 95th percentile loadings of phosphorus for Lima WWTP,Clark Oil, and PCS Nitrogen, for the years 1975 to 1996.

0
0.2
0.4
0.6
0.8
1
1.2
303234363840
1996LimaBPPCS
Pho
spho
rus
(mg/
l)
River Mile
LimaWWTP
PCS-Nitrogen 001
Clark Oil
Shawnee WWTP
0
0.4
0.8
2123252729313335373941
198519911996
Pho
spho
rus
(mg/
l)
River Mile
LimaWWTP
PCS-Nitrogen
Clark Oil
Shawnee WWTP
MAS/1997-12-6 Ottawa River Basin TSD December 31 , 1998
66
Figure 20. Longitudinal trend of phosphorus in the Ottawa River, 1985, 1991, and 1996(top). Bottom graph is at a different scale to better demonstrate recent trendsin the immediate Lima area.

MAS/1997-12-6 Ottawa River Basin TSD December 31 , 1998
67
ChromiumChromium limits were required in the PCS Nitrogen (formerly BP Chemicals) permit from1977-88. These limits appear to have been a response to the high levels of chromiumobserved in the effluent in 1975-76. Chromium may have been used as a cooling wateradditive at PCS Nitrogen and was replaced by other chemicals in 1977. Chromium is afederal guideline parameter for petroleum refineries and, as such, has been limited in all ofthe permits for Clark Oil. Federal guidelines require loading limits, but concentration limitshave been required at times to help assure that WQS are maintained.
The largest use of chromium at these industrial plants is as a cooling tower additive, used toinhibit biological growth. These additives have been replaced by less toxic and persistentcompounds for most uses. Both Clark Oil and PCS Nitrogen have reduced chromiumloadings over the period of record. Clark Oil’s discharge levels have declined gradually,while PCS Nitrogen levels declined rapidly during the late 1970s. By 1990, concentrationsand loadings were low enough with respect to the WLA that limitations were removed.Chromium loadings from the public WWTPs are generally low.
The only detection of chromium in the 1996 water chemistry survey (30 ug/l detection limit)was an instream concentration of 49 ug/l downstream from the PCS outfall 001, and the onlydetections in the effluents tested were in 4 of 6 PCS outfall 001 effluent samples rangingfrom 38 to 64 ug/l. (Lima WWTP and BP Refinery each had six samples below detection).The metal translator study had a much lower detection level (0.05 ug/l) for chromium, butwas sampled at only two locations - Thayer Rd and the Fire Station. This study showed totalchromium concentrations increased from Thayer Road (0.37 ug/l, five sample average) todownstream from PCS Nitrogen at the Fire Station site (4.65 ug/l, five sample average). Apparently chromium is settling out in the sediments in concentrations toxic to aquaticorganisms (Figure 21). The highest chromium sediment concentration collected by the OhioEPA in both 1991 and 1996, and reported in the City of Lima Water Quality Impact Study(1996 data), was downstream from the PCS-Nitrogen 001 outfall at levels exceeding theOntario severe effect level (> 110 ug/g).

20
30
40
50
60
70
33343536373839
OTTAWA RIVER
1985199119961996 PCS
Tot
al C
hrom
ium
(ug
/l)
LimaWWTP
PCS-Nitrogen
Clark Oil
30 ug/l detection level
0
50
100
150
200
250
46 38.6
38 37.9
37.7
37.6
37.3
37 36.8
36.3
35.4
34.6
28.8
198919911996
Chr
omiu
m, s
edim
ent (
mg/
kg)
River Mile
Col
ette
St C
SO
Lim
a W
WT
P d
am
BP
L-5
land
fill
Lim
a W
WT
P
Cla
rk O
il PC
S N
itrog
en
Alle
ntow
n da
m
110SEL
26LEL
MAS/1997-12-6 Ottawa River Basin TSD December 31 , 1998
68
Figure 21. Surface water and sediment quality trend graphs of chromium in the OttawaRiver, 1986 to 1996.

0
5
10
15
20
25
30
2426283032343638
OTTAWA RIVER
1985
1996
1996BP Oil
Sel
eniu
m (
ug/l)
LimaWWTP
PCS-Nitrogen
Clark Oil
2.0 ug/l detection level
River Mile
MAS/1997-12-6 Ottawa River Basin TSD December 31 , 1998
69
SeleniumWater chemistry data (6 samples per site) reported an increase in selenium concentrationsfrom an average of 2.5 ug/l upstream Clark Oil outfall 001 at RM 37.30 to 8.8 ug/ldownstream at RM 37.00 (Figure 22). The average concentration (6 samples collectedconcurrently with the instream samples) of Clark Oil outfall 001 was 18.8 ug/l. A largenumber of selenium exceedences (# of samples > 5 ug/l) were documented downstream fromthe Clark Oil discharge, in at least half of the samples collected at RM 37.00 (5), RM 36.80(3), RM 36.30 (5), RM 34.55 (5), RM 32.60 (4), RM 32.41 (3), RM 31.03 (4), RM 28.83 (4),RM 25.75 (3), and RM 22.94 (3). This data suggests that the average concentration ofselenium (based on 6 grab samples per site collected during the summer of 1996) was greaterthan 5 ug/l in the Ottawa River for approximately 15 miles downstream from the Clark Oiloutfall 001.
Selenium concentrations in both carp and smallmouth bass samples were sharply elevateddownstream from the Lima WWTP and Clark Oil complex with respect to upstream samples.Although selenium is a nutrient at trace levels, it becomes toxic at higher concentrations.
Figure 22. Clark Oil effluent concentrations and instream concentrations of selenium
in the Ottawa River for the years 1985 and 1996.

MAS/1997-12-6 Ottawa River Basin TSD December 31 , 1998
70
Arsenic, Cadmium, Copper, Lead, Nickel and ZincZinc concentrations appeared to decrease over time (Figure 23). Although zincconcentrations have peaked downstream from the major Lima dischargers, sediment levelshave consistently been below the severe effect level.
Concentrations for arsenic, cadmium, lead, and nickel were mostly below the detection levelin the water column chemistry in 1996. A better indication of any environmental harmwould be to assess the sediment concentrations (Figure 24). Of these metals, only nickel waspresent at levels above the severe effect level (SEL) concentration. Relative concentrations of metals were ranked based on a stream sediment classificationsystem developed by Ohio EPA (1996). Sediment metal concentrations analyzed in 1996 inthe Ottawa River showed nonelevated levels (except for slightly elevated chromium levels)at the two most upstream stations, Thayer Road and Fetter Road, and at the two mostdownstream stations, Putnam CR P and Putnam Road 19. At least one metal parameter washighly elevated to extremely elevated at sites within the City of Lima from Collett Street toSR 117 (Appendix Table ). There were extremely elevated concentrations of cadmium andcopper upstream from the Lima WWTP/Erie Railroad dam; chromium, copper, and nickelwere extremely elevated downstream from the L5 landfill; and chromium and copper wereextremely elevated downstream from PCS Nitrogen.

0
20
40
60
80
100
120
140
160
33343536373839
OTTAWA RIVER
1985
1991
1996
Tot
al Z
inc
(ug/
l)
LimaWWTP PCS-Nitrogen
Clark Oil
10 ug/l detection level
0
100
200
300
400
500
46 38.6
38 37.9
37.7
37.6
37.3
37 36.8
36.3
35.4
34.6
28.8
198919911996
Zin
c, s
edim
ent (
mg/
kg)
River Mile
Col
ette
St C
SO
Lim
a W
WT
P d
am
BP
L-5
land
fill
Lim
a W
WT
P
Cla
rk O
il PC
S N
itrog
en
Alle
ntow
n da
m
SEL level820 mg/kg
LEL level120 mg/kg
MAS/1997-12-6 Ottawa River Basin TSD December 31 , 1998
71
Figure 23. Surface water (top) and sediment (bottom) quality trends of zinc in theOttawa River, 1985 to 1996.
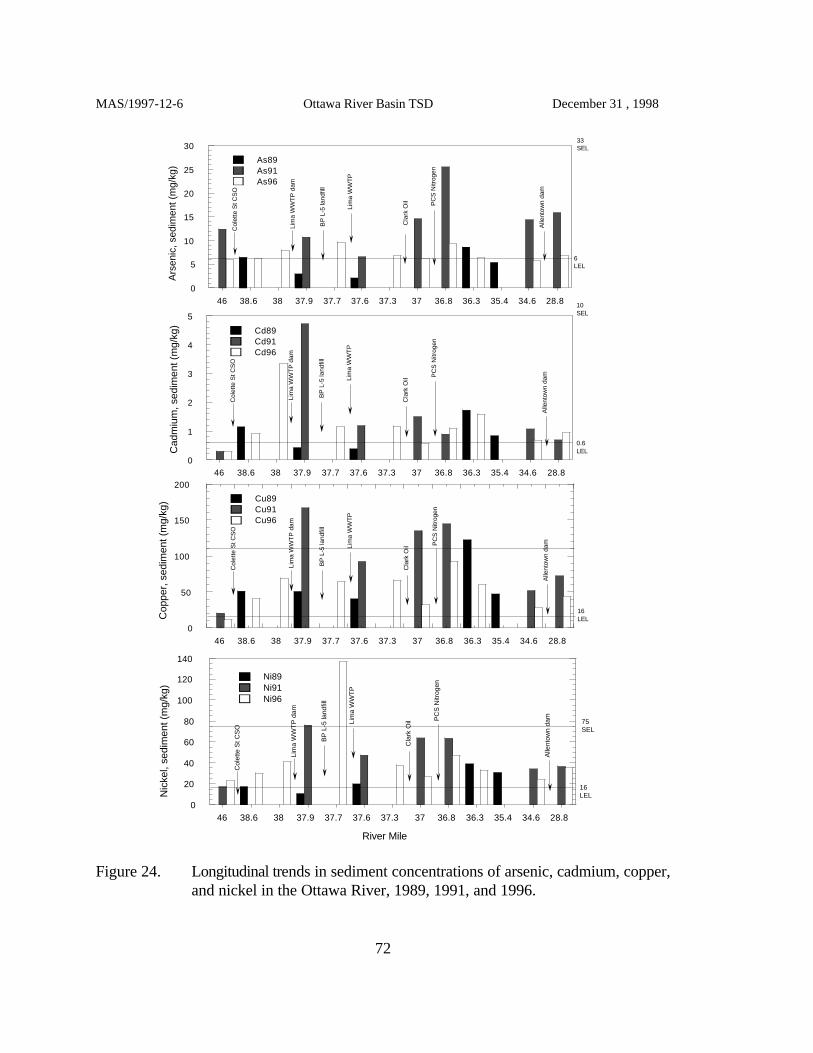
0
5
10
15
20
25
30
46 38.6 38 37.9 37.7 37.6 37.3 37 36.8 36.3 35.4 34.6 28.8
As89As91As96
Ars
enic
, sed
imen
t (m
g/kg
)
Col
ette
St C
SO
Lim
a W
WT
P d
am
BP
L-5
land
fill
Lim
a W
WT
P
Cla
rk O
il PC
S N
itrog
en
Alle
ntow
n da
m
6LEL
33SEL
0
1
2
3
4
5
46 38.6 38 37.9 37.7 37.6 37.3 37 36.8 36.3 35.4 34.6 28.8
Cd89Cd91Cd96
Cad
miu
m, s
edim
ent (
mg/
kg)
Col
ette
St C
SO
Lim
a W
WT
P d
am
BP
L-5
land
fill
Lim
a W
WT
P
Cla
rk O
il PC
S N
itrog
en
Alle
ntow
n da
m
0.6LEL
10SEL
0
50
100
150
200
46 38.6 38 37.9 37.7 37.6 37.3 37 36.8 36.3 35.4 34.6 28.8
Cu89Cu91Cu96
Cop
per,
sed
imen
t (m
g/kg
)
Col
ette
St C
SO
Lim
a W
WT
P d
am
BP
L-5
land
fill
Lim
a W
WT
P
Cla
rk O
il PC
S N
itrog
en
Alle
ntow
n da
m
16LEL
0
20
40
60
80
100
120
140
46 38.6 38 37.9 37.7 37.6 37.3 37 36.8 36.3 35.4 34.6 28.8
Ni89Ni91Ni96
Nic
kel,
sedi
men
t (m
g/kg
)
River Mile
Col
ette
St C
SO
Lim
a W
WT
P d
am
BP
L-5
land
fill
Lim
a W
WT
P
Cla
rk O
il PC
S N
itrog
en
Alle
ntow
n da
m
16LEL
75SEL
MAS/1997-12-6 Ottawa River Basin TSD December 31 , 1998
72
Figure 24. Longitudinal trends in sediment concentrations of arsenic, cadmium, copper,and nickel in the Ottawa River, 1989, 1991, and 1996.

MAS/1997-12-6 Ottawa River Basin TSD December 31 , 1998
73
Organic CompoundsOrganics were analyzed at 20 surface water sampling stations and 19 sediment samplingstations during the 1996 survey (see Appendix). The 1986 and 1991 surveys sampled onlyfor oil and grease at surface water stations and there only were three organic sediment sitessampled in 1991. Instream data showed water quality exceedences for oil and grease in 1985(RMs 36.3 and 28.9) and in 1996 (RMs 37.7 and 36.3). Other exceedences in 1996 were y-BHC, 4,4'-DDD, and endrin at RM 37.7, and dieldrin at RM 28.83.
Concentrations of volatile and semi-volatile organic compounds were mostly below detectionat the surface water stations, except for xylene at RM 40.14 and chloroform at RMs 37.3,37.0, 36.8, 36.3, and 34.55. Concentrations of organochlorine pesticides and polychlorinatedbiphenyls were relatively low with more parameters detected in the lower segment of the1996 survey than in the upper segment. One exception to these relatively low values was an oil laden sample collected at RM 37.7 downstream from the L5 landfill on September 4,1996. The analytical results from this sample indicated highly elevated concentrations ofPAHs and pesticides.
Except for two low PAH values at RM 42.61, the three sites upstream from Lima (RMs45.97, 44.26, and 42.61) had PAHs below detection in the sediment. Total PAH valuesranged from 27.6 mg/kg to 75.6 mg/kg in the City of Lima from Collett Street (RM 38.63)to the Shawnee Country Club (RM 34.55), except for the highest concentration of 662.4mg/kg downstream from the Lima WWTP at RM 37.3 which was greater than the SevereEffect Level (SEL). The only other value greater than the SEL (using a TOC value) was 15.1mg/kg anthracene at the Shawnee Country Club, RM 34.55. Total PAH sedimentconcentrations were less than 16.6 mg/kg from SR 117 (RM 32.6) to the mouth (RM 0.96),with three of the last four stations reporting values below detection.
Pesticides were below detection in the sediments upstream (Thayer Road to Roush Road) anddownstream (from SR 117 to the mouth) from the City of Lima, except for one detection ofmethoxychlor at Piquad Road (RM 25.75). Sites upstream from the Lima WWTP/Erie-Lackawana Railroad dam (RMs 38.63 and 38.0) and downstream from PCS Nitrogen (RMs36.8 and 36.3) had between 6 and 8 pesticide parameters detected.
Other organic sediment detections in 1996 included phenol (2 samples) downstream fromthe L-5 landfill (RM 37.7) and toluene downstream from PCS Nitrogen (RM 36.8).Arochlor-1260, a polychlorinated biphenyl, was detected in the sediment at 8 sites betweenRoush Road and the Shawnee County Club with the highest value of 340 mg/kg reporteddownstream from the L5 landfill (RM 37.7). A comparison of the three common sediment sites between 1991 to 1996 showed generallyhigher PAH and lower pesticides concentrations in 1996.

MAS/1997-12-6 Ottawa River Basin TSD December 31 , 1998
74
Pike RunDramatic improvements in Pike Run chemical water quality occurred between the two studyperiods. The persistent septic conditions which were prevalent in 1991 were not present inthe stream in 1996. The American Bath WWTP upgrade which was completed in April 1996has successfully eliminated the numerous D.O., NH -N, and metals exceedences which were3
documented in 1991. However, a remaining concern in Pike Run is the frequent fecalcoliform bacteria exceedences, which result from CSOs in the City of Lima collection systemand SSOs in the American Bath collection system. An additional concern is the persistentdetection of cadmium, which warrants further investigation.
Plum CreekPlum Creek is designated with the Warmwater Habitat aquatic life use and the PrimaryContact Recreation. Surface water quality was evaluated from near its origin southwest ofthe Village of Columbus Grove downstream to its confluence with the Ottawa River at RM2.67 near the Village of Kalida. The primary objectives for evaluating Plum Creek were toassess ambient water quality upstream from the Village of Columbus Grove and evaluateimpacts from the Columbus Grove WWTP and CSOs . The wastewater collection systemis comprised of 80% combined sanitary and stormwater sewers. The CSOs are located priorto the plant (outfall 002) at RM 12.85, Wayne St.-Church St. (outfall 003) at RM 12.95, N.Main St.-Pendelton St. (outfall 004) at RM 13.15, and Cross St. (outfall 005) at RM 13.25.Inorganic water quality upstream was generally good to very good, with most pollutants ator below respective MDLs, although a D.O. exceedence was documented. Within the villagelimits, a CSO impact is evident, reflected by the D.O., NH -N, and fecal coliform violations3
which were documented. These exceedences occur due to the accumulation anddecomposition of sludges, complicated by low stream gradient and channel modifications.A nutrient enrichment impact results from the Columbus Grove WWTP, with increasingnitrate, phosphorus, and BOD concentrations, but it is unclear what portion of the impact5
is attributable to CSOs. An additional impact occurs near Kalida, especially with increasingsuspended solids concentrations, but it is unknown whether this results from upstreamagricultural practices or municipal sources, such as construction sites.
Zurmehly CreekSurface water quality was evaluated at Ft. Amanda Rd. (RM 0.03) near its confluence withthe Ottawa River at RM 35.63. This station was intended to evaluate ambient water qualityand potential impacts from the refinery tank farm and Buckeye Road landfill. Inorganicwater quality was generally very good, with most pollutants evaluated at or below respectiveMDLs. Some temporal variability in nutrient and suspended solid concentrations wasexhibited, with higher concentrations documented through the 5 August sampling event.These results indicate a slight nonpoint source impact. No Water Quality Standardsexceedences were documented at this station. A fecal coliform bacteria count exceeding thePrimary Contact Recreation criterion on 16 September indicates a possible source of sanitarywastewater in the drainage.

MAS/1997-12-6 Ottawa River Basin TSD December 31 , 1998
75
Little Ottawa RiverThe Little Ottawa River is designated in the Ohio Water Quality Standards with theWarmwater Habitat aquatic life use and the Primary Contact Recreation use. Surface waterquality was evaluated at Ft. Amanda Rd. (RM 0.03) near its confluence with the OttawaRiver at RM 35.30. This station was intended to evaluate ambient water quality andpotential impacts from the Village of Cridersville WWTP, which discharges to an unnamedtributary that flows into the Little Ottawa River at RM 4.68. Inorganic water quality wasgenerally very good, with most pollutants at or below respective MDLs. Some temporalvariability in nutrient and suspended solid concentrations was exhibited, with higherconcentrations documented through the 5 August sampling event. These results indicate aslight nonpoint source impact. No Water Quality Standards exceedences were documentedat this station.
Fish Kills and Chemical SpillsPollutant discharges from spills are a significant source of lethal and sublethal stresses foraquatic communities in the Ottawa River. Leading sources (# reported spills) from 1985 to1991 were PCS Nitrogen (12),Clark Oil (5), Lima WWTP (5), Shawnee #2 WWTP (3), andElida WWTP (3). Leading sources from 1992 to 1996 were Shawnee #2 WWTP (67),ClarkOil (16), PCS Nitrogen (11), American Bath WWTP (11), and Lima WWTP (7). Althoughit appears that there were more spills in the later period, most of the spills are reported by theentities, and may have been influenced by factors such as different reporting practices. Suchwould be the case for the low number of spills reported for the Shawnee WWTP during theearlier period when some of the records were falsified. The large increase in reported spillsat Shawnee in the latter period may be a result of this facility reporting every bypass thatoccurred along with CSO discharges as well, compared to other facilities that may not havereported all bypassing or CSO discharges as spills.
Pollution investigations from 1985 to 1991 list seven fish kill incidents reported comparedto nine reported from 1992 to 1996. In the latter period the waterways affected (# reportedfish kill incidents) were the Ottawa River (3), Hog Creek (1), Little Ottawa River (1),Leatherwood Ditch (1), Lima Lake (1), Zurmehly Creek (1), and an unnamed tributary to theOttawa River (1).

MAS/1997-12-6 Ottawa River Basin TSD December 31 , 1998
76
Fish TissueTissue samples collected from the Ottawa River in 1996 were analyzed for metals, polychlorinatedbiphenyls and pesticides. Selenium concentrations in most carp and smallmouth bass samples eitherapproached or exceeded the respective 90th percentiles of concentrations reported in the Statewidedatabase (Figure 25). Selenium concentrations in both carp and smallmouth bass samples weresharply elevated downstream from the Lima WWTP and Clark Oil with respect to upstream samples.Although selenium is a nutrient at trace levels, it becomes toxic at higher concentrations. Toxicresponses to selenium that could occur at the concentrations detected in this study are impairmentor loss of hepatic and renal function, reduced hematocrit, and increased erythrocyte irregularities(Sorensen 1991). No other fish tissue contaminant showed a defined longitudinal response inrelation to either the WWTP or Clark Oil.
Mercury concentrations in both carp and smallmouth bass were highest at RM 45.9, upstream fromany significant point sources, and exceeded the 90th percentile for respective samples in theStatewide database (Figure 25).
DDT was present in a fish tissue sample at RM 42.3 and nowhere else, whereas the DDTmetabolites, DDD and DDE, were present at all samples collected from RM 42.3 to RM 3.6. Useof DDT in the United States has been banned since 1972; however it is highly resistant tophotodegradation and oxidation, and its presence reflects this environmental persistence.
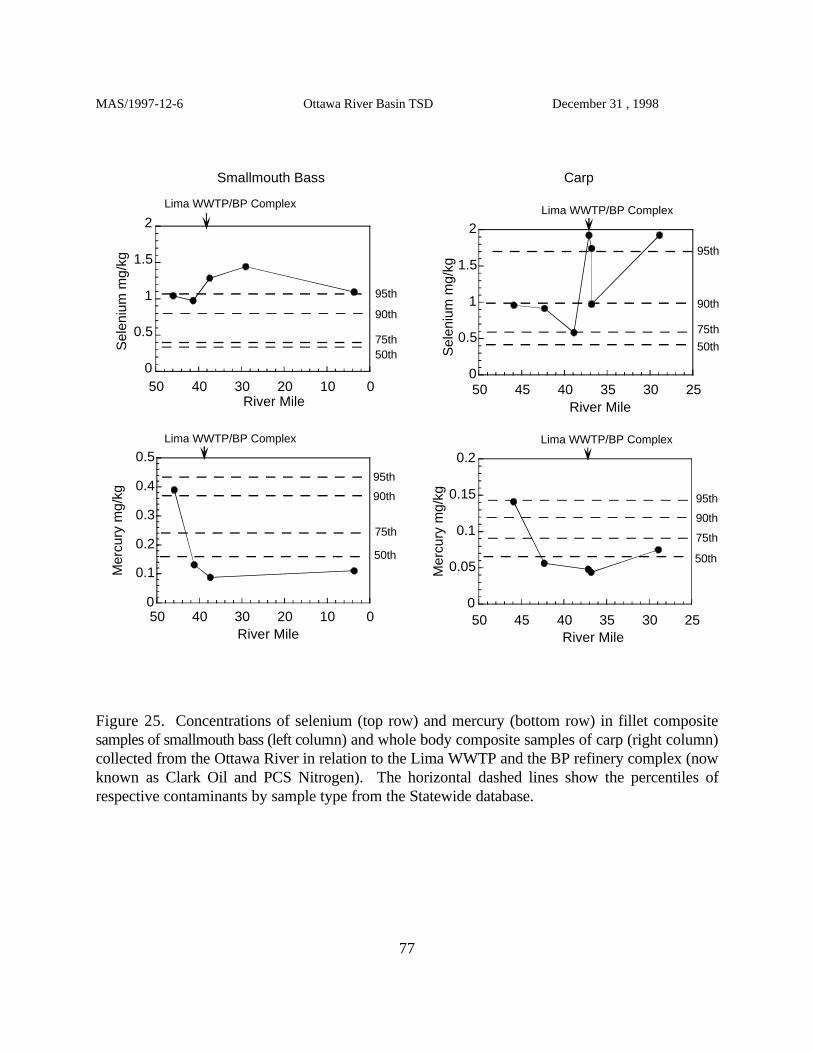
0
0.05
0.1
0.15
0.2
253035404550
Mer
cury
mg/
kg
River Mile
95th
90th
75th
50th
Lima WWTP/BP Complex
0
0.1
0.2
0.3
0.4
0.5
01020304050
Mer
cury
mg/
kg
River Mile
95th
90th
75th
50th
Lima WWTP/BP Complex
0
0.5
1
1.5
2
01020304050
Sel
eniu
m m
g/kg
River Mile
95th
90th
75th50th
Lima WWTP/BP Complex
0
0.5
1
1.5
2
253035404550
Sel
eniu
m m
g/kg
River Mile
95th
90th
75th
50th
Lima WWTP/BP Complex
Smallmouth Bass Carp
MAS/1997-12-6 Ottawa River Basin TSD December 31 , 1998
77
Figure 25. Concentrations of selenium (top row) and mercury (bottom row) in fillet compositesamples of smallmouth bass (left column) and whole body composite samples of carp (right column)collected from the Ottawa River in relation to the Lima WWTP and the BP refinery complex (nowknown as Clark Oil and PCS Nitrogen). The horizontal dashed lines show the percentiles ofrespective contaminants by sample type from the Statewide database.

MAS/1997-12-6 Ottawa River Basin TSD December 31 , 1998
78
Biomarker Trends: 1991, 1993, and 1996Blood, liver, and bile samples were collected from common carp (10 sites) and white sucker (3 sites)in the Ottawa River in 1996 at RMs 46.1, 42.4, 38.6, 37.7, 37.4, 37.0, 36.7, 34.7, 28.9, and 1.1.Biochemical analyses for ethoxyresorufin-o-deethylase (EROD) activity, bile metabolites, plasmalevels of alanine transaminase (ALT), blood urea nitrogen (BUN), albumin (ALB), total protein (TP),pseudo-cholinesterase (CHE), cholesterol (CHOL), and triglycerides (TRIG) were performed for allsamples from common carp. EROD measures a class of metabolic enzymes that are induced byplanar xenobiotics such as polycyclic aromatic hydrocarbons (PAHs) and halogenated hydrocarbons.EROD activity is an indicator of the induction of hepatic detoxification systems. A common carpscore below 50 pmol EROD/mg protein and a white sucker score below 100 pmol EROD/mgprotein are a conservative indication of noninduction. Scores greater than these values indicateinduction and are a measure of the exposure to these contaminants and detoxification activity by fish.In fish, metabolites of PAHs accumulate in the bile. Bile metabolites indicate recent exposure toPAHs. The benzo(a)pyrene (B(a)P-type metabolites are generally associated with combustionby-products. The naphthalene (NAPH)-type metabolites are associated with oil contamination. HighBUN (blood urea nitrogen) values may be expected with fish in waters with a higher ammonia ororganic nitrogen level, near sources of fertilizer or ammoniacal industrial chemical solutions, or incarp feeding in areas where ammonia is a component of the toxic sediments. Gill and kidneydisfunction can also cause increased BUN.
Fish biomarker data showed increases in EROD activity, and BAP-type and NAPH-type metabolites,from upstream to downstream from the Clark Oil outfall 001. EROD values increased from 49 pmolEROD/mg protein upstream from the Clark Oil outfall to 193 pmol EROD/mg protein downstreamin white suckers, and from 18 pmol EROD/mg protein to 49 pmol EROD/mg protein in carp,respectively (Figure 27). BAP-type metabolites increased from 447 ng BAP/mg protein upstreamfrom Clark Oil to 1224 ng BAP/mg protein downstream in white suckers (500 ng BAP/mg protein,reference value), and from 930 ng BAP/mg protein to 1745 ng BAP/mg protein in carp (500 ngBAP/mg protein, reference value). NAPH-type metabolites increased from 55000 ng NAPH/mgprotein upstream from Clark Oil to 115000 ng NAPH/mg protein downstream in white suckers(50000 ng NAPH/mg protein, reference value), and from 121000 ng NAPH/mg protein to 185000ng BAP/mg protein in carp (100000 ng BAP/mg protein, reference value), see Figure 28.
Samples collected downstream from PCS Nitrogen outfall 001 at RM 36.7 had the highest bloodurea nitrogen (BUN) value (4.4 units) for common carp and the highest average incidence of DELTanomalies (38.9 %) in the 1996 survey. The site located at RM 34.7 was downstream from PCS-Nitrogen outfalls 002, 003, and 004, and had the highest BUN value (2.8 units) for white suckersand the third highest incident of DELT anomalies (31.7 %). The lowest fish IBI scores sampled inthe Ottawa River during the 1996 survey were also at RMs 36.7 and 34.7. Although BUN valueswere higher in other sections of the Ottawa River in 1991 and 1993 (indicating improvement in thosesections in 1996), DELT anomalies and IBI scores downstream from PCS outfalls have remainedthe lowest observed in the Ottawa River in the 1985, 1989, 1991 and 1996 surveys (Figure 26).

0
2
4
6
8
1046
.1
42.4
38.6
37.7
37.4
37 36.7
36 34.7
28.9
1.1
Carp Trend
199119931996
Cla
rk O
il
PC
S N
itrog
en
Lim
a W
WT
PCol
ette
St C
SO
No
Dat
a 91
-93
No
Dat
a 96
No
Dat
a 91
-93 Reference
value
BU
N V
alue
s (b
lood
ure
a ni
trog
en, I
U/d
l)
0
1
2
3
4
5
6
7
46.1
42.4
38.6
37.7
37.4
37 36.7
36 34.7
28.9
1.1
White Sucker Trend
199119931996
Cla
rk O
il
PC
S N
itrog
en
Lim
a W
WT
P
Col
ette
St C
SO
No
Dat
aN
o D
ata
91,9
3
No
Dat
a 91
,96
BU
N V
alue
s (b
lood
ure
a ni
trog
en, I
U/d
l)
0
1
2
3
4
5
6
7
46.1
42.4
38.6
37.7
37.4
37.0
36.7
34.7
28.9
1.1
White Sucker 1996
BU
N V
alue
s (b
lood
ure
a ni
trog
en, I
U/d
l)
Referencevalue
PC
S o
utfa
lls 0
02-0
04
PC
S 0
01
0
1
2
3
4
5
6
7
46.1
42.4
38.6
37.7
37.4
37.0
36.7
28.9
21.1
1.1
Carp 1996
Referencevalue
BU
N V
alue
s (b
lood
ure
a ni
trog
en, I
U/d
l)
PC
S 0
01
Col
lette
St C
SO
MAS/1997-12-6 Ottawa River Basin TSD December 31 , 1998
79
BUN data (blood urea nitrogen)
Figure 26. BUN data (blood urea nitrogen, IU/dl) for white suckers and carp in the Ottawa River.Top graphs are boxplots of the 1996 data showing the median, 25th, and 75th percentiles.Bottom graphs are bar graphs of means (average) for the years 1991, 1993, and 1996. Inaddition to the “no data” listed in the trend graphs, there was no data collected in 1991 atRMs 42.4, 37.7, 28.9, and 1.1.

0
100
200
300
400
500
46.1
42.4
38.6
37.7
37.4
37 36.7
36 34.7
28.9
1.1
White Sucker Trend
199119931996
Cla
rk O
il
PC
S N
itrog
en
Lim
a W
WT
P
Col
ette
St C
SO
No
Dat
a 91
-93
No
Dat
a 91
,96
Level ofInduction
Reference Value
ER
OD
Val
ue (
mg
pmol
res
oruf
in/ m
g pr
otei
n)
0
100
200
300
400
50046
.1
42.4
38.6
37.7
37.4
37 36.7
36 28.9
21.1
1.1
Carp Trend
199119931996
Col
ette
St C
SO Lim
a W
WT
P
Cla
rk O
il
PC
S N
itrog
enN
o D
ata
No
Dat
a 91
-93
No
Dat
a 91
,96
No
Dat
a 91
-93
Level ofInduction Reference
Value
ER
OD
Val
ue (
mg
pmol
res
oruf
in/ m
g pr
otei
n)
0
100
200
300
400
46.1
42.4
38.6
37.7
37.4
37.0
36.7
34.7
28.9
1.1
White Sucker 1996
Reference Value
Level ofInduction
ER
OD
Val
ue (
mg
pmol
res
oruf
in/ m
g pr
otei
n)
Cla
rk O
il
PC
S
0
50
100
150
200
46.1
42.4
38.6
37.7
37.4
37.0
36.7
28.9
21.1
1.1
Carp 1996
Reference Value
Level ofInduction
Cla
rk O
il
PC
S
ER
OD
Val
ue (
mg
pmol
res
oruf
in/ m
g pr
otei
n)
MAS/1997-12-6 Ottawa River Basin TSD December 31 , 1998
80
EROD data (hepatic detoxification system indicator)
Figure 27. EROD data (mg pmol resorufin/ mg protein) for white suckers and carp in the OttawaRiver. Top graphs are boxplots of the 1996 data showing the median, 25th, and 75thpercentiles. Bottom graphs are bar graphs of means (average) for the years 1991, 1993,and 1996. In addition to the “no data” listed in the trend graphs, there was no datacollected in 1991 at RMs 42.4, 37.7, 28.9, and 1.1 for both white suckers and carp, andno data collected in 1991 at RM 46.1 for carp.

0
500
1000
1500
2000
2500
46.1
42.4
38.6
37.7
37.4
37 36.7
36 28.9
21.1
1.1
Carp1993
1996
Col
ette
St C
SO
Lim
a W
WT
P
Cla
rk O
il
PC
S N
itrog
enN
o D
ata
93
No
Dat
a 93
BA
P-t
ype
met
ablo
lite
(ng
B(a
)P/ m
g pr
otei
n)
ReferenceValue
No
Dat
a 96
0
500
1000
1500
2000
2500
46.1
42.4
38.6
37.7
37.4
37 36.7
36 34.7
28.9
1.1
White Sucker1993
1996C
lark
Oil
PC
S N
itrog
en
Lim
a W
WT
P
Col
ette
St C
SO
No
Dat
a 93
No
Dat
a 96
BA
P-t
ype
met
ablo
lite
(ng
B(a
)P/ m
g pr
otei
n)
ReferenceValue
0
50
100
150
20046
.1
42.4
38.6
37.7
37.4
37 36.7
36 28.9
21.1
1.1
Carp 1993
1996C
olet
te S
t CS
O
Lim
a W
WT
P
Cla
rk O
il
PC
S N
itrog
enN
o D
ata
93
No
Dat
a 93
NA
PH
-typ
e m
etab
lolit
e (n
g N
AP
H/ m
g pr
otei
n)
ReferenceValue
No
Dat
a 96
0
50
100
150
200
46.1
42.4
38.6
37.7
37.4
37 36.7
36 34.7
28.9
1.1
White Sucker1993
1996
NA
PH
-typ
e m
etab
lolit
e (n
g N
AP
H/ m
g pr
otei
n)
Cla
rk O
il
PC
S N
itrog
en
Lim
a W
WT
P
Col
ette
St C
SO
No
Dat
a 93
ReferenceValue
No
Dat
a 96
MAS/1997-12-6 Ottawa River Basin TSD December 31 , 1998
81
BAP- and NAPH-Type Metabolites (combustion and oil contamination indicators)
Figure 28. BAP-type (ng B(a)P/ mg protein) and NAPH-type (ng NAPH/ mg protein) metabolitedata for white suckers and carp in the Ottawa River for the years 1993 and 1996.

MAS/1997-12-6 Ottawa River Basin TSD December 31 , 1998
82
Physical Habitat for Aquatic Life
Ottawa RiverA thirty mile stretch of the Ottawa River from RM 46 to RM 16 is composed of an alternating seriesof high quality free-flowing habitats, and channel modified or impounded habitats. Normal warmwaterhabitat attributes dominate the free-flowing segments as evidenced by the low ratio of modified towarmwater habitat attributes (0.42 ± 0.22 SD; Table 6). Typically, the habitat within these segmentsis characterized by a moderately sinuous channel containing well defined riffle-pool-run sequences,an abundance of unembedded boulder and cobble substrates, woody debris, root mats and root wadssupplied by wooded riparian buffers, and water willow fringing the margins of the shallows and riffles.The high QHEI scores (0 = 76.2 ± 5.1 SD) reflect these positive attributes. Conversely, the segmentsinfluenced by channelization and impoundment contain few natural warmwater habitat attributes andhave more modified attributes than warmwater attributes. In most instances, habitat limitations withinthese segments include embedded substrates, little or no cover, poor channel development and lowsinuosity, and no functional riffles. A 3 mile segment from RM 38 to RM 41 is unduly modified bya relatively contiguous series of low-head dams and other channel modifications. The number ofmodified habitat attributes within this reach (see Table 6) is likely to preclude warmwater faunas.Although the habitat within the other segments influenced by channelization and impoundment arelocally limiting, they are not of sufficient length or frequency to lower the warmwater potential of theremaining free flowing river.
Plum CreekPlum Creek has been extensively channelized throughout its length. Consequently, the number ofmodified habitat attributes exceed warmwater attributes at all of the six locations evaluated (Table 6).The channel lacks development, sinuosity, cover, and substrate heterogeneity at all locations. The lackof warmwater attributes is sufficient to preclude establishment of a functional warmwater fauna(Rankin 1995). The average QHEI score for the six sites sampled is 42.8 ± 9.0 SD.
Pike RunLike Plum Creek, Pike Run has been converted into a drainage ditch lacking functional habitatattributes. The average QHEI score for the five sites sampled is 50.3 ± 12.3 SD.
Little Ottawa RiverThough the site evaluated was not channelized, extensive channelization of upstream reaches impartsmodified attributes to the site. Little cover is present, sinuosity low, and substrates are relativelyhomogenous and embedded. The number of modified attributes exceed the number of warmwaterattributes (Table 6), thereby limiting the potential to support a warmwater fauna.
Zurmehly CreekZurmehly Creek at the site evaluated was previously channelized. Though having recovered some freeflowing character, it remains dominated by modified habitat attributes. Substrates are embedded withsilt and sand, the sand bedload suffocates riffles rendering them nonfunctional, and sinuosity is low.

MAS/1997-12-6 Ottawa River Basin TSD December 31 , 1998
83
The modified character of the stream is augmented by effects of urban runoff as evidenced by theheavy bedload of sand and silt. The QHEI score of 58 indicates a marginal ability to support a faunaconsistent with WWH expectations. The high gradient should promote a faster rate of improvementof WWH characteristics.
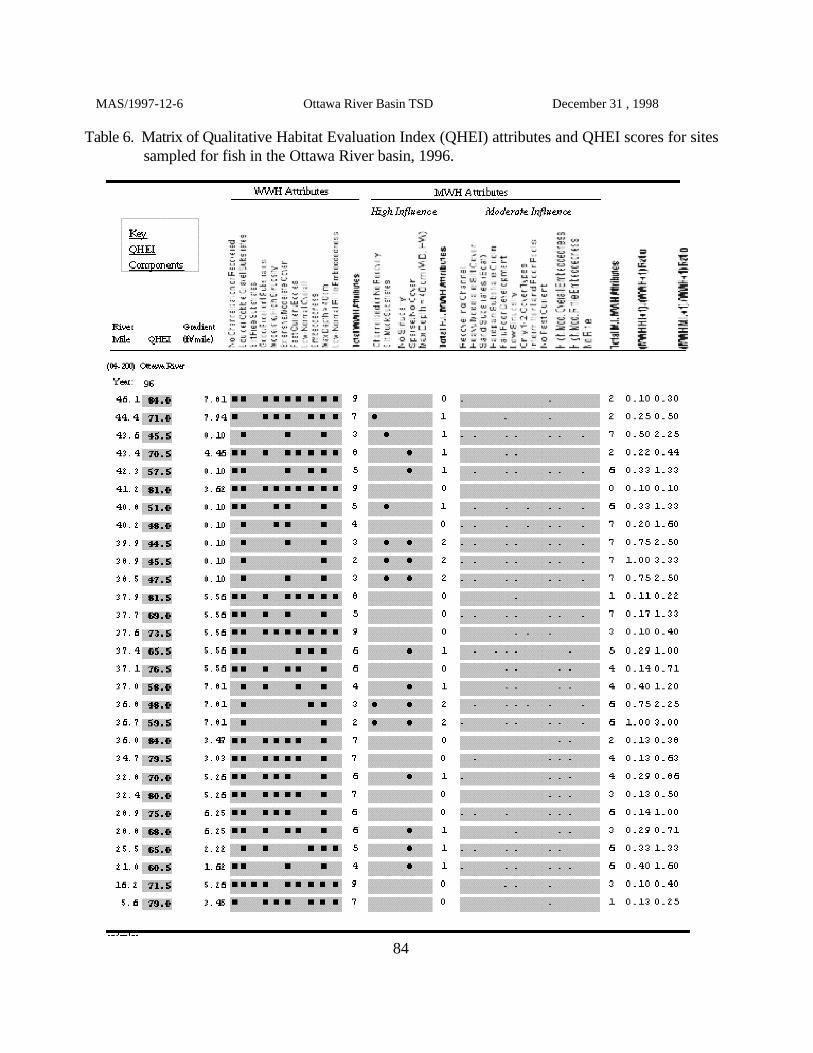
MAS/1997-12-6 Ottawa River Basin TSD December 31 , 1998
84
Table 6. Matrix of Qualitative Habitat Evaluation Index (QHEI) attributes and QHEI scores for sitessampled for fish in the Ottawa River basin, 1996.

MAS/1997-12-6 Ottawa River Basin TSD December 31 , 1998
85
Table 6. Continued.
MAS/1997-12-6 Ottawa River Basin TSD December 31 , 1998
86
TRENDSBiological Assessment - Macroinvertebrate CommunitiesOttawa River: 1974-1996Macroinvertebrates collected at Thayer Road (RM 45.9/46.0) yielded Invertebrate Community Index(ICI) scores that have attained the WWH criterion in the 1980s and 1990s (Figure 29). Sampling from1985 to 1996 showed very good to exceptional conditions (except for an ICI of 36). Although the ICIscores ranged only from 16 to 24 in the 1970s, each sampling year from that time period wasnarratively evaluated as good at the time based on the mayfly, caddisfly, stonefly, and tanytarsini taxapresent.
Previous surveys have not been as comprehensive as the 1996 survey for the area between ThayerRoad and the Lima WWTP. Macroinvertebrates were collected at 8 sites between RM 45.9 and RM37.9 in 1996, compared to 3 sites in 1985, and less in other years. Benthic communities collected fromRMs 44.5, 43.4, 42.4, and 41.2 scored ICI values in the good to very good range in 1996 (Table 7).The site at Sugar Street (RM 41.2) has improved from ICI scores of 16 (fair) in 1985 and 32(marginally good) in 1989, to 42 (very good) in 1989.
There are five lowhead dams and five major CSOs in the City of Lima (Figure 4). Macroinvertebrateswere collected at four locations downstream from these dams and CSOs in 1996. The benthic samplecollected at RM 40.1 (ICI of 20 in the fair range) was downstream from the Lovers Lane dam and onthe opposite side of the stream from the Lovers Lane CSO control structure. The next site was at RM37.9. between the Elm Street dam and the Central Street dam. There were no CSOs between thesedams and habitat was good despite the urban setting. The ICI score was marginally good and indicatedthat without impacts from CSOs, this reach has the capability of supporting a WWH community forthe macroinvertebrates. However, CSOs in this reach of the river contribute high loads of suspendedsolids and CBOD during rainfall events and result in low dissolved oxygen levels that persistafterwards. The prime example is the Collett Street CSO (RM 38.63). Not only was the D.O. levellow after rainfall events but the turbidity caused by suspended solids interfered with the probe on thedissolved oxygen meter causing it to malfunction in both the Ohio EPA and the City of Lima studies.The effect of the low D.O. and settling of suspended solids on the benthic communities at RM 38.6resulted in poor communities where pollution tolerant aquatic worms and the midge Dicrotendipessimpsoni accounted for 93 % (1985) and 33 % (1996) of the organisms collected from the artificialsubstrates. Caddisfly and tanytarsini taxa were not found either year at this site.
Benthic communities collected downstream from the Lima WWTP dam at RM 37.9/37.8 havehistorically had ICI scores in the very poor to poor range from 1974 to 1991.Previously the ICI scoresat this site have ranged from a low of 0 (very poor) in the 1970s to 16 (fair) in 1989. Due to increasednumbers of EPT, dipteran taxa, and total taxa, and a smaller percentage of tolerant organisms, this sitescored an ICI value of 28 (fair) in 1996 (Figures 30 and 31).
The L5 Landfill is located on the river right bank (south bank) between RM 37.9 and 37.7. At thedownstream site (RM 37.7) the numbers of dipteran taxa and total taxa decreased and there was an

MAS/1997-12-6 Ottawa River Basin TSD December 31 , 1998
87
increase in the percentage of tolerant organisms (a reversal of trends seen at the upstream site)resulting in a lower ICI score of 14.
Macroinvertebrate communities downstream from the Lima WWTP at RM 37.4/37.3 have shown adramatic recovery in 1996 (ICI score of 42) compared to previous sampling years (Figure 29). TheICI score ranged from 0 in the 1970s to 10 in 1991. In 1974 and 1976 there were large percentagesof the tolerant midge genus Chironomus, representing high amounts of nutrient rich, sewage pollution.No mayflies, caddisflies, or tanytarsini midges were collected at this site from 1974 to 1985. Only onetaxon of tanytarsini midges was collected on the artificial substrates in 1989 and 1991, and mayflies(one taxa) didn’t appear until 1991. In 1996, a total of 10 EPT taxa and three tanytarsini midge taxawere collected from the artificial and natural substrates.
The Ottawa River downstream from Clark Oil (RM 37.0) and PCS Nitrogen (RM 36.8/36.1) was alsovirtually devoid of EPT taxa and tanytarsini midge taxa from 1974 to 1985 with ICI scores in the verypoor to poor range (0-6). In 1985, tolerant organisms, including aquatic worms and the tolerant midgesCricotopus bicinctus and Nanocladius distinctus, accounted for 52% to 75% of the organisms collectedfrom the artificial substrates (Figure 31). Slight improvements in the macroinvertebrate communitieswere observed from 1989 to 1996 with the appearance of the mayfly Baetis intercalaris as apredominant organism collected from the artificial substrates, with generally lower percentages oftolerant taxa and increases in EPT taxa. The highest ICI scores at these sites were still only 20 and 22(mid-fair range) in 1996.
In the lower 35 miles of the Ottawa River, macroinvertebrate communities were in nonattainment ofecoregion biocriteria (ECBP and HELP) in the 1970s with ICI scores ranging from 0 to 14. The 1985survey showed the lower seven miles to be in attainment, the 1989 survey showed the lower 20 milesto be in attainment, and the most recent survey in 1996 showed most of the lower 30 miles to be inattainment or nonsignificant departure from the macroinvertebrate ecoregion biocriteria (ECBP andHELP). This pattern of recovery (i.e., attainment progressing in a downstream to upstream directionwith less severe near-field impacts) has been observed in many Ohio streams and rivers.
Plum CreekUpstream from the Village of Columbus Grove, macroinvertebrate communities reflected fairconditions. Sampling yielded a relatively low number of EPT taxa (5) and a low QCTV score (32.6);both were below expectations based on sites in this drainage basin that achieve WWH criteria.Flatworms, clams, and aquatic sowbugs were predominant. Water quality was further degraded topoor conditions at the site at RM 12.9, downstream from Columbus Grove CSOs but upstream fromthe Columbus Grove WWTP. Only one EPT taxon was collected from this site and the tolerant midgetaxon Chironomus decorus was one of the numerically predominant organisms.
The next station at RM 11.5 and the succeeding stations improved to marginally good and goodmacroinvertebrate community conditions. Communities had higher numbers of taxa and QCTVscores, and caddisflies and mayflies predominated.

MAS/1997-12-6 Ottawa River Basin TSD December 31 , 1998
88
Pike RunAlthough macroinvertebrates collected in Pike Run were considered achieving MWH expectations atthe sites sampled in 1996, the collections represented only fair community performance both upstreamand downstream from the American Bath WWTP. Upstream impacts from nonpoint sources (Cityof Lima wet weather overflows) appeared to be the major cause. Downstream sites at RMs 5.7 and0.1 improved to marginally good and good community conditions.
Little Ottawa RiverThe qualitative samples in the Ottawa River basin achieving WWH expectations generally had 9 ormore EPT taxa, QCTV scores equal to or greater than 37.9, and over 40 total qualitative taxa. The siteon the Little Ottawa River (RM 0.4) had slightly less than these optimal characteristics and wasevaluated as marginally good.
Zurmehly CreekThe qualitative sample collected at RM 0.1 was evaluated as fair. The sample had a relatively lownumber of EPT taxa and a QCTV score less than the 75th percentile of comparable ECBP ecoregionsites not achieving the WWH biocriterion.

MAS/1997-12-6 Ottawa River Basin TSD December 31 , 1998
89
Table 7. Summary of macroinvertebrate data collected from artificial substrates (quantitativesampling) and from natural substrates (qualitative sampling) in the Ottawa River basin,1996. Also included are historical collection summaries from 1974-95, where available.
Quantitative EvaluationStream/River Density Quant Qual Qual Total QCTV
Mile (#/sq.ft.) Taxa Taxa EPT Taxa Score ICI Evaluationa b
Ottawa River (1996) Eastern Cornbelt Plains Use Designation (Existing)
45.9 617 40 62 16 74 39.5 48 Exceptional44.5 432 37 51 13 63 39.2 40 Good43.4 537 30 39 13 52 39.0 40 Good42.4 - - 56 12 - 37.7 - Good41.2 326 36 39 13 54 39.0 42 Very Good40.1 779 26 41 8 52 32.9 20* Fair39.6 1331 44 45 12 66 32.8 34 Marginally Goodns
38.6 473 19 32 2 42 30.5 6* Poor37.9 2121 39 41 8 55 32.9 28* Fair37.7 561 28 23 4 37 32.8 14* Fair37.4 825 40 52 8 66 32.6 42 Very Good37.1 313 31 18 1 39 32.4 18 Fair37.0 536 30 43 4 55 31.9 20* Fair36.1 627 24 36 4 45 32.4 22* Fair34.5 1049 31 42 9 48 34.3 38 Good32.6 1491 43 51 8 62 34.3 32 Marginally Goodns
32.4 - - 42 5 - 33.1 - Fair28.8 1268 29 48 10 59 34.9 32 Marginally Goodns
25.8 801 33 46 12 57 38.7 44 Very Good22.9 524 24 32 9 44 37.7 36 Good16.0 1124 41 45 12 65 34.2 48 Exceptional7.8 1499 31 40 15 52 40.3 46 Exceptional3.6 1685 61 49 16 58 41.5 46 Exceptional0.8 1462 24 35 13 46 42.4 48 Exceptional
Ottawa River (1995) Eastern Cornbelt Plains Use Designation (Existing)
45.9 611 45 46 14 66 40.6 48 Exceptional28.8 336 28 36 9 52 34.9 30* Fair

MAS/1997-12-6 Ottawa River Basin TSD December 31 , 1998
90
Table 7. (Continued)
Quantitative EvaluationStream/River Density Quant Qual Qual Total QCTV
Mile (#/sq.ft.) Taxa Taxa EPT Taxa Score ICI Evaluationa b
Ottawa River (1991) Eastern Cornbelt Plains Use Designation (Existing)
45.9 1027 51 53 15 78 34.7 36 Good37.8 1922 17 39 6 42 26.9 6* Poor37.4 906 20 29 1 33 28.5 8* Poor37.0 408 25 39 2 46 28.6 14* Fair36.1 1081 13 34 2 36 25.1 10* Poor34.5 435 17 36 3 39 26.6 18* Fair28.8 490 32 46 8 54 29.3 28* Fair0.8 2055 30 53 17 65 35.3 [28] Goodc
Ottawa River (1990) Eastern Cornbelt Plains Use Designation (Existing)
45.9 423 37 34 13 56 39.5 50 Exceptional28.8 182 36 33 7 47 35.9 22* Fair
Ottawa River (1989) Eastern Cornbelt Plains Use Designation (Existing)
45.9 465 42 53 12 66 39.2 48 Exceptional41.2 269 30 40 11 53 28.7 32 Marginally Goodns
37.9 1535 28 30 2 40 31.8 16* Fair37.4 693 15 26 0 29 31.9 10* Poor37.0 439 18 38 1 43 29.4 12* Poor36.8 606 19 19 1 31 23.9 14* Fair36.1a 550 19 26 2 35 27.1 16* Fair36.1b 440 20 26 2 37 27.1 14* Fair34.5 498 24 33 8 42 31.8 30* Fair30.1 343 25 40 9 47 32.4 26* Fair28.8 422 29 41 8 53 31.7 34 Marginally Goodns
25.8 482 29 45 11 51 35.9 30* Fair19.3 430 36 46 12 59 34.9 40 Good
0.8 1114 26 48 16 57 39.4 42 Very Good

MAS/1997-12-6 Ottawa River Basin TSD December 31 , 1998
91
Table 7. (Continued)Quantitative Evaluation
Stream/River Density Quant Qual Qual Total QCTVMile (#/sq.ft.) Taxa Taxa EPT Taxa Score ICI Evaluationa b
Ottawa River (1985) Eastern Cornbelt Plains Use Designation (Existing)
45.9 855 40 42 10 60 38.4 42 Very Good41.1 333 27 25 4 39 32.8 16* Fair38.6 3035 9 22 2 22 22.6 2* Poor37.7 3667 18 35 4 36 27.9 6* Poor37.3 271 17 15 0 23 32.8 6* Poor37.0 405 19 19 0 26 31.7 6* Poor36.1 749 13 25 1 29 23.1 4* Poor34.5 547 18 18 1 25 31.7 6* Poor32.6 586 18 25 1 31 22.7 6* Poor28.8 487 24 25 4 33 32.8 22* Fair25.8 425 29 35 7 47 34.8 28* Fair22.9 286 27 30 4 43 31.9 24* Fair16.0 580 39 29 7 52 33.1 28* Fair7.8 1692 32 31 9 47 38.7 42 Very Good0.8 1914 36 43 15 57 39.5 46 Exceptional
Ottawa River (1977) Eastern Cornbelt Plains Use Designation (Existing)
46.0 198 26 14 6 35 40.9 [24] Goodc e
37.9 520 9 17 0 21 22.6 0* Very Poore
37.4 756 14 10 0 20 21.9 8* Poore
36.8 109 11 11 0 18 22.6 6* Poore
32.6 428 8 12 0 14 21.9 0* Very Poore
28.8 346 5 14 1 17 21.7 8* Poore
22.4 143 14 19 3 28 22.6 4* Poore
1.0 183 14 13 4 21 32.2 14* Faire

MAS/1997-12-6 Ottawa River Basin TSD December 31 , 1998
92
Table 7. (Continued)Quantitative Evaluation
Stream/River Density Quant Qual Qual Total QCTVMile (#/sq.ft.) Taxa Taxa EPT Taxa Score ICI Evaluationa b
Ottawa River (1976) Eastern Cornbelt Plains Use Designation (Existing)
46.0 88 25 8 2 28 40.9 [22] Goode
37.9 22 7 9 1 12 17.7 0* Very Poore
37.4 417 10 5 0 13 - 0* Very Poore
36.8 254 7 5 0 9 - 0* Very Poore
32.6 2327 2 5 0 6 - 0* Poore
28.8 812 5 6 1 9 - 6* Poore
16.0 85 14 7 1 17 - 10* Poore
1.0 91 18 5 1 19 - 10* Poore
Ottawa River (1974)Eastern Cornbelt Plains Use Designation (Existing)
46.0 28 17 33 8 44 32.6 [16] Goode
37.9 1067 9 14 0 19 15.9 2* Poore
37.4 3 4 1 0 5 - 0* Very Poore
36.8 105 4 9 0 9 14.3 0* Very Poore
32.6 1038 5 10 0 10 17.7 2* Poore
28.8 2107 4 15 1 18 17.7 6* Poore
Qualitative EvaluationStream/River Qual QCTV Qual Relative Predominant Narrative
Mile Taxa Score EPT Density Organisms Evaluationb a
Ottawa River (1996)42.4 56 37.7 12 Moderate Hydropsychid caddisflies, Good
mayflies, midges37.66A 26 34.3 3 Low-Mod. Baetid mayflies, Fair
blackflies,hydropsychid caddisflies37.66B 32 34.3 7 Low Turbellarians, oligochaetes Fair
Baetid mayflies36.87A 18 22.6 1 Low Leeches, red midges, beetles Poor36.87B 15 22.6 0 Low Crayfish, oligochaetes,snails. Poor32.4 42 33.1 5 Low-Mod. Midges, mayflies Fair
Table 7. (Continued)
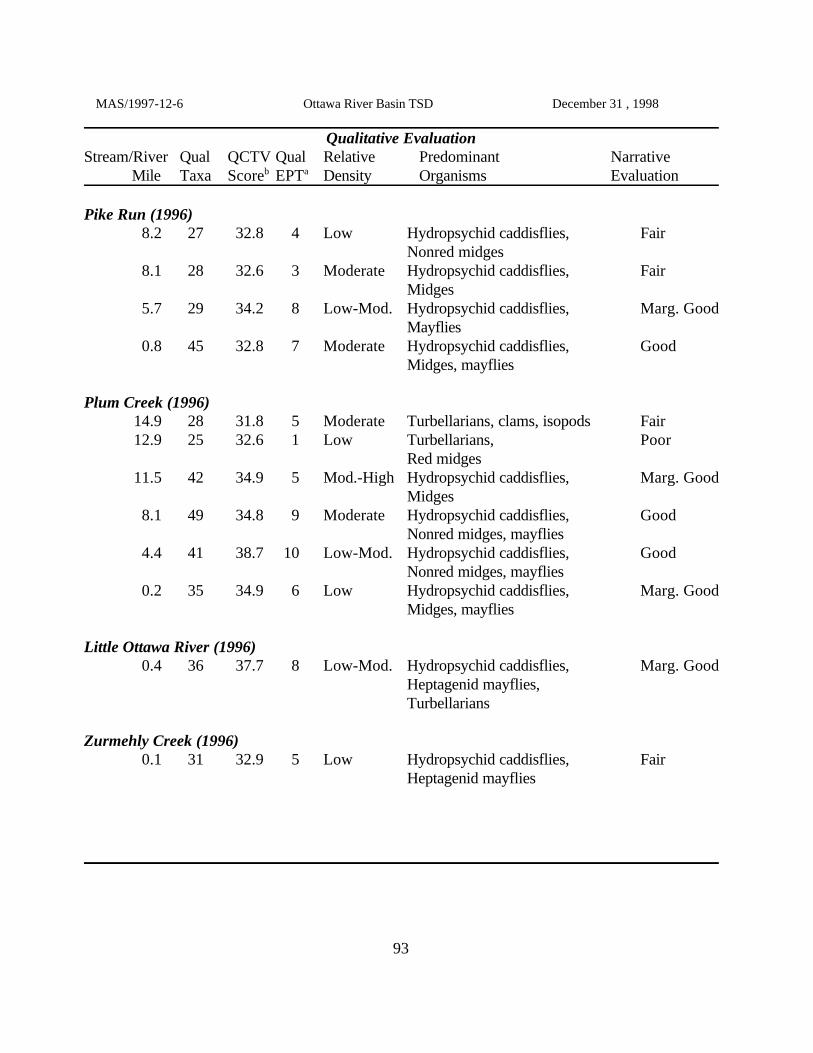
MAS/1997-12-6 Ottawa River Basin TSD December 31 , 1998
93
Qualitative EvaluationStream/River Qual QCTV Qual Relative Predominant Narrative
Mile Taxa Score EPT Density Organisms Evaluationb a
Pike Run (1996)8.2 27 32.8 4 Low Hydropsychid caddisflies, Fair
Nonred midges8.1 28 32.6 3 Moderate Hydropsychid caddisflies, Fair
Midges5.7 29 34.2 8 Low-Mod. Hydropsychid caddisflies, Marg. Good
Mayflies0.8 45 32.8 7 Moderate Hydropsychid caddisflies, Good
Midges, mayflies
Plum Creek (1996)14.9 28 31.8 5 Moderate Turbellarians, clams, isopods Fair12.9 25 32.6 1 Low Turbellarians, Poor
Red midges11.5 42 34.9 5 Mod.-High Hydropsychid caddisflies, Marg. Good
Midges8.1 49 34.8 9 Moderate Hydropsychid caddisflies, Good
Nonred midges, mayflies4.4 41 38.7 10 Low-Mod. Hydropsychid caddisflies, Good
Nonred midges, mayflies0.2 35 34.9 6 Low Hydropsychid caddisflies, Marg. Good
Midges, mayflies
Little Ottawa River (1996)0.4 36 37.7 8 Low-Mod. Hydropsychid caddisflies, Marg. Good
Heptagenid mayflies,Turbellarians
Zurmehly Creek (1996)0.1 31 32.9 5 Low Hydropsychid caddisflies, Fair
Heptagenid mayflies

MAS/1997-12-6 Ottawa River Basin TSD December 31 , 1998
94
Table 7. (Continued)
Ecoregion Biological Criteria:E. Corn Belt Plains (ECBP) Huron Erie Lake Plain (HELP)
WWH EWH MWH WWH EWH MWHd d
ICI 36 46 22 34 46 22
a - EPT = total Ephemeroptera (mayflies), Plecoptera (stoneflies), and Trichoptera (caddisflies) taxa richness.b - Qualitative Community Tolerance Value (QCTV) derived as the median of the tolerance values calculated for each
qualitative taxon present (see discussion in text, page 42).c - The quantitative sample was affected by slow current speed; evaluation was based primarily on the qualitative
sample.d - Modified Warmwater Habitat for channelized habitats.e - Evaluation based on 1979 report. Methods of collection were not the same as post 1980 data.ns - Nonsignificant departure from biocriteria (<4 IBI or ICI units, or <0.5 MIwb units).* - Indicates significant departure from applicable biocriteria (>4 IBI or ICI units, or >0.5 MIwb
units). Underlined scores are in the Poor or Very Poor range.
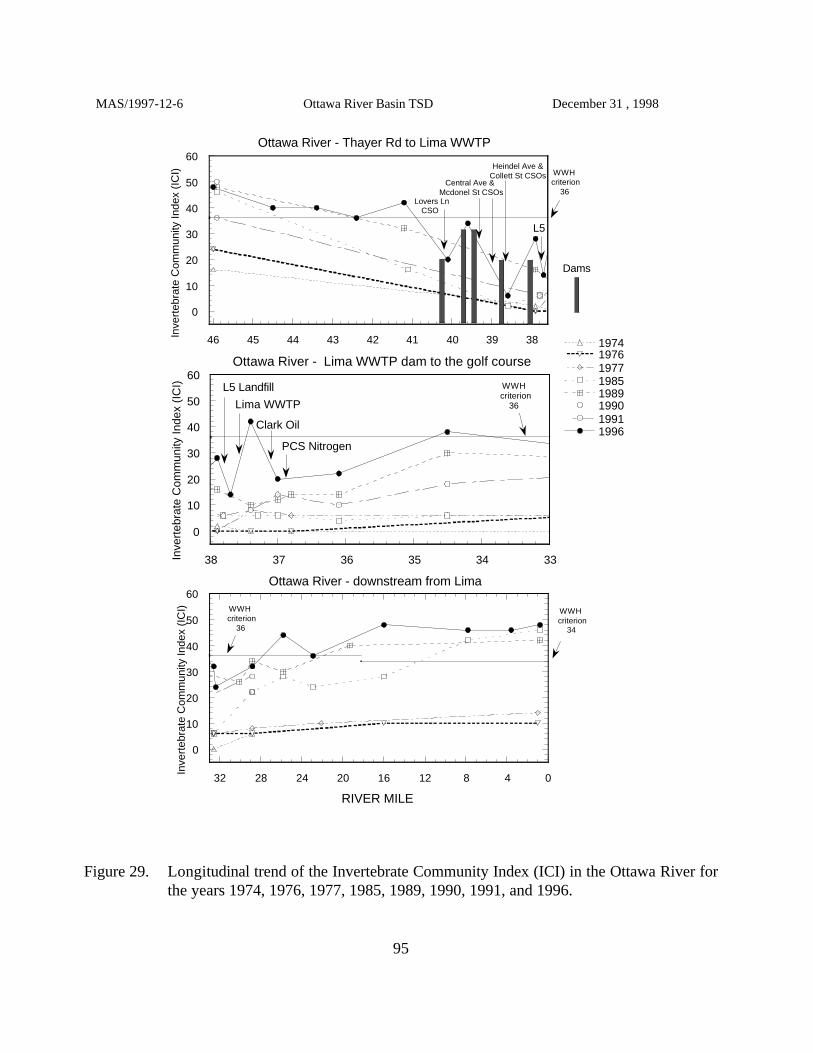
0
10
20
30
40
50
60
383940414243444546
Ottawa River - Thayer Rd to Lima WWTP
WWH criterion
36
Inve
rteb
rate
Com
mun
ity In
dex
(IC
I)
Lovers LnCSO
Central Ave &Mcdonel St CSOs
Heindel Ave &Collett St CSOs
Dams
L5
0
10
20
30
40
50
60
333435363738
Ottawa River - Lima WWTP dam to the golf course19741976197719851989199019911996
Inve
rteb
rate
Com
mun
ity In
dex
(IC
I) L5 Landfill
Lima WWTP
Clark Oil
PCS Nitrogen
WWH criterion
36
0
10
20
30
40
50
60
048121620242832
Ottawa River - downstream from Lima
RIVER MILE
Inve
rteb
rate
Com
mun
ity In
dex
(IC
I) WWH criterion
34
WWH criterion
36
MAS/1997-12-6 Ottawa River Basin TSD December 31 , 1998
95
Figure 29. Longitudinal trend of the Invertebrate Community Index (ICI) in the Ottawa River forthe years 1974, 1976, 1977, 1985, 1989, 1990, 1991, and 1996.

0
20
40
60
80
100
46 37.9 37.4 37 36.8 32.6 28.8 1
1976
Percent EPTTotal EPT Taxa
0
5
10
15
20
25C
SO
s
Lim
a W
WT
P
Cla
rk O
il
PC
S N
itrog
en
Tot
al E
PT
and
Tan
ytar
sini
Tax
a
0 0 0 0 0000
No
Dat
a
Per
cent
(%
) E
PT
and
Tan
ytas
ini
0
20
40
60
80
100
45.9 37.8 37.3 37 36.1 34.5 28.8 0.8
1985
Percent EPTTotal EPT Taxa
0
5
10
15
20
25
CS
Os
Lim
a W
WT
P
Cla
rk O
il
PC
S N
itrog
en
0 00 0000
Per
cent
(%
) E
PT
and
Tan
ytas
ini
Tot
al E
PT
and
Tan
ytar
sini
Tax
a
0
20
40
60
80
100
45.9 37.9 37.4 37 36.1 34.5 28.8 0.8
1996
Percent EPTTotal EPT Taxa
0
5
10
15
20
25
Per
cent
(%
) E
PT
and
Tan
ytas
ini
CS
Os
Lim
a W
WT
P
Cla
rk O
il
PC
S N
itrog
en
0
River Mile
Tot
al E
PT
and
Tan
ytar
sini
Tax
a0
20
40
60
80
100
45.9 37.9 37.4 37 36.1 34.5 28.8 0.8
1989
Percent EPTTotal EPT Taxa
0
5
10
15
20
25
CS
Os
Lim
a W
WT
P
Cla
rk O
il
PC
S N
itrog
en
0
Per
cent
(%
) E
PT
and
Tan
ytas
ini
Tot
al E
PT
and
Tan
ytar
sini
Tax
a
0
20
40
60
80
100
45.9 37.8 37.4 37 36.1 34.5 28.8 0.8
1991
ept %total ept taxa
0
5
10
15
20
25
CS
Os
Lim
a W
WT
P
Cla
rk O
il
PC
S N
itrog
en
Per
cent
(%
) E
PT
and
Tan
ytas
ini
Tot
al E
PT
and
Tan
ytar
sini
Tax
a
MAS/1997-12-6 Ottawa River Basin TSD December 31 , 1998
96
Figure 30. Percent EPT (mayfly, stonefly, and caddisfly) and tanytarsini midge taxa collected on theartificial substrates (left axis), and the total number of EPT and tanytarsini midge taxacollected from both the artificial substrates and from the natural substrates at each site(right axis) for the Ottawa River at selected sites and sampling years, 1976-1996.

0
20
40
60
80
100
46 37.9 37.4 37 36.8 32.6 28.8 1
1976
% Tolerants
Per
cent
(%
) T
oler
ant O
rgan
ism
s
No
data
0.1 0.3
CS
Os
Lima WWTP
Cla
rk O
il
PC
S N
itrog
en
0
20
40
60
80
100
45.9 37.8 37.3 37 36.1 34.5 28.8 0.8
1985
% Tolerants
CS
Os
Lim
a W
WT
P
Cla
rk O
il
PC
S N
itrog
en
0.1
Per
cent
(%
) T
oler
ant O
rgan
ism
s
0
20
40
60
80
100
45.9 37.8 37.4 37 36.1 34.5 28.8 0.8
1991
% Tolerants
CS
Os
Lim
a W
WT
P
Cla
rk O
il
PC
S N
itrog
en
0.1
Per
cent
(%
) T
oler
ant O
rgan
ism
s
0
20
40
60
80
100
45.9 37.9 37.4 37 36.1 34.5 28.8 0.8
1996
% Tolerants
CS
Os
Lim
a W
WT
P
Cla
rk O
il
PC
S N
itrog
en
0.1
River Mile
Per
cent
(%
) T
oler
ant O
rgan
ism
s
0
20
40
60
80
100
45.9 37.9 37.4 37 36.1 34.5 28.8 0.8
1989
% Tolerants
CS
Os
Lim
a W
WT
P
Cla
rk O
il
PC
S N
itrog
en
0.1
Per
cent
(%
) T
oler
ant O
rgan
ism
s
MAS/1997-12-6 Ottawa River Basin TSD December 31 , 1998
97
Figure 31. Longitudinal trend of the percent tolerant macroinvertebrates collected from the artificialsubstrates in the Ottawa River for the years 1976, 1985, 1989, 1991, and 1996.

MAS/1997-12-6 Ottawa River Basin TSD December 31 , 1998
98
Biological Assessment - Fish CommunitiesOttawa River: 1979-1996Fish communities in the Ottawa River have been sampled by the Ohio EPA at similar locations in1979, 1985, 1987, 1989, 1991 and 1996. Each sampling has produced roughly the same longitudinalpattern in biological index scores in response to habitat and a variety of pollution sources (Figure 32),and that pattern is recapped as follows. The upstream most sampling location, RM 46.1, supports awarmwater fish assemblage expected for the WWH aquatic life use within the ECBP ecoregion. Mostnotably, the fish community is composed primarily of insectivores and top carnivores indicating propertrophic function. Also, the number of darter species fully met expectations based on referenceconditions, reflecting the high quality habitat and lack of channel modifications within the immediatereach. However, impacts from intensive agricultural land use within the basin were evident in theslightly elevated abundance of tolerant fishes and incidence of deformities, erosion, lesions, or tumors(DELT anomalies). Effects of widespread habitat degradation (primarily channelization) in theheadwaters, and impounding of downstream reaches by lowhead dams were manifest in the completeabsence of intolerant species and low numbers of sucker species. The fish community performanceat RM 46.1 demonstrates that, while nonpoint source pollution and channel modifications are limitingto the fish community in the Ottawa River mainstem as a whole, those limitations obviously do notpreclude a WWH community.
As the river approaches and passes through Lima, it becomes subject to an increasing number ofstressors (Figure 32). First, the river flows through a series of low-head dams starting at RM 43.5, andthe proportion of tolerant and omnivorous fishes increases. Additionally, sewage solids emanatingfrom an unsewered residential area along Findlay Road result in poor fish community performance atRM 40.2. Next, the first of several combined sewer overflows (CSOs) enters the river at RM 40.13,and with those, so increases the percentage of fish with DELT anomalies, and MIwb and IBI scoresdrop to the very poor and poor range, respectively (Table 8). The combination of low IBI and MIwbscores coupled with an increased incidence of DELT anomalies implies a toxic component to the CSOdischarges (Yoder and Rankin 1995). Downstream from the series of dam pools, the fish communityrecovers through a stretch of free flowing river. However, the L5 landfill adjacent to the river at RM37.9 oozes leachate. Although IBI and MIwb scores improved compared to upstream, as the river isfree flowing, the number of DELT anomalies increased relative to upstream in response to the landfill,suggesting that the landfill exacerbates problems in the fish community downstream.
Moving downstream from RM 37.7, discharges from the Lima WWTP, BP Oil Refinery, and PCSNitrogen plant stormwater outfalls enter the river within a 0.8 mi reach. Despite free flowingconditions, biological index scores decline into the poor range especially downstream from the PCSNitrogen stormwater outfalls; the percentage of DELT anomalies increases from about 10%encountered downstream from the CSOs and the L5 landfill, to over 30% (Figure 32 - bottom panel),characterizing a complex toxic impact (Yoder and Rankin 1995). These results correspond with thehigh instream ammonia-nitrogen concentrations and detectable concentrations of cyanide founddownstream from PCS Nitrogen, and contaminated sediments throughout the reach.

MAS/1997-12-6 Ottawa River Basin TSD December 31 , 1998
99
The fish community shows signs of recovery downstream from the Allentown Dam; however, theElida WWTP (RM 24.2) reverses and delays the trend. Some of the upstream to downstreamdifference may be attributable to habitat, as deep pools were present at the upstream location but notat the downstream. Consequently sunfish, and correspondingly, the relative abundance of insectivoreswere more abundant upstream than downstream from Elida. However, despite improved habitat at RM16.2, the IBI score remained depressed relative to upstream from the plant owing to the continued highabundance of omnivores (primarily bluntnose and fathead minnows). The elevated abundance ofomnivores suggests excessive organic enrichment from the Elida WWTP. Recovery to levelsapproaching that found upstream from Lima is not realized for more than 30 miles at RM 5.6.
The fish community showed only slight improvement in 1996 compared to pre-1989 conditions. Therelative abundance of non-tolerant fishes increased downstream from Lima, as reflected by higherMIwb scores (Figure 34), indicating either less of an acute toxic impact or less gross organicenrichment (and ensuing D.O. depletion). Relative to previous years, trophic function in 1996 in thelower 6 miles, as judged by the relative abundance of omnivores and insectivores, recovers nearly tothat expected for the HELP ecoregion and stream size. Correspondingly, the absolute and relativeabundance of roundbodied suckers increased in the lower reach of the river. One consequence of theincreased abundance of redhorse was a commensurate increase in the number of DELT anomalies(Figure 34). Roundbodied suckers, especially redhorse, are susceptible to accruing DELT anomaliesbecause of their sensitivity to pollution and dissolved oxygen regimes. The continued underperforming IBI scores combined with the high incidence of DELT anomalies (Figure 34) demonstratesthat the aggregate pollutant loadings are overly stressing the river.

MAS/1997-12-6 Ottawa River Basin TSD December 31 , 1998
100
Table 8. Fish community indices from samples collected in the Ottawa River study area 1996through 1979.
Mean Mean MeanNumber Cumulative Rel. No Rel. Wt. Mean Mean Narrative
River Mile Species Species (No./0.3 km) (wt./0.3 km) QHEI MIwb IBI Evaluationa
Ottawa River (04-200) 1996 ECBP Ecoregion - WWH (Existing)46.10 19.5 22 1280 19.47 84.0 9.0 46 Very GoodD
44.40 19.0 21 523 9.14 71.0 7.9 36 Marg. GoodD ns ns
43.60 14.0 17 396 115.94 45.5 7.5 32 FairA * *
43.40 21.0 23 1907 16.37 70.5 9.0 33 V. Good/FairD *
42.30 17.0 18 1186 219.16 57.5 7.4 28 FairA * *
41.20 19.0 20 461 10.43 81.0 7.4 37 Fair/M.GoodD * ns
40.80 13.5 18 308 33.65 51.0 6.6 27 FairA * *
40.20 11.0 12 260 97.74 48.0 5.0 22 PoorA * *
39.90 14.0 19 521 57.02 44.5 5.8 25 PoorA * *
38.90 11.0 14 520 58.33 45.5 4.9 23 V.Poor/PoorA * *
38.50 16.0 20 419 97.22 47.5 6.8 26 FairA * *
37.90 23.5 29 1470 40.52 81.5 8.8 37 Good/M.GoodD ns
37.70 19.5 29 1183 318.61 69.0 7.6 29 FairA * *
37.66 19.0 24 2775 399.11 73.5 9.2 29 V.Good/FairA *
37.40 18.5 22 777 83.68 65.5 6.8 22 Fair/PoorA * *
37.11 15.0 20 2580 323.87 76.5 7.7 28 FairA * *
37.00 16.5 21 1548 23.40 58.0 7.5 24 Fair/PoorA * *
36.87 11.0 15 1430 28.31 48.0 6.9 22 Fair/PoorA * *
36.70 16.0 20 334 31.23 59.5 7.2 26 FairA * *
36.00 12.5 16 625 20.40 84.0 5.4 17 PoorA * *
35.50 10.0 10 131 0.87 5.3 20 PoorD * *
34.70 12.5 16 248 53.96 79.5 5.2 18 PoorA * *
32.80 15.5 20 861 55.27 70.0 7.2 21 Fair/PoorA * *
32.40 14.0 18 578 38.96 80.0 6.2 18 PoorA * *
28.90 14.0 17 600 63.38 75.0 5.5 18 PoorA * *
28.80 16.5 21 498 5.34 68.0 8.0 27 M.Good/PoorD ns *
25.50 27.5 32 840 164.54 65.0 8.1 27 M.Good/FairA ns *
21.00 21.0 24 1006 243.24 60.5 7.8 21 Fair/PoorA * *
HELP Ecoregion - WWH (Existing)16.20 19.0 20 2031 174.76 71.5 8.4 20 M.Good/PoorA ns *
13.00 22.0 23 1028 150.76 79.0 8.7 26 Good/FairA *
5.60 22.5 26 842 163.88 77.5 9.7 32 Excpt/M.GoodA ns
3.80 22.5 27 516 200.74 55.5 9.2 37 V.Good/GoodA
1.20 25.5 32 726 177.26 73.5 9.9 36 Excpt/GoodA
Table 8. Continued.

MAS/1997-12-6 Ottawa River Basin TSD December 31 , 1998
101
Mean Mean MeanNumber Cumulative Rel. No Rel. Wt. Mean Mean Narrative
River Mile Species Species (No./0.3 km) (wt./0.3 km) QHEI MIwb IBI Evaluationa
1991 ECBP Ecoregion - WWH (Existing)46.10 18.0 0 801 30.11 80.5 8.5 42 GoodD
37.70 15.7 1 1989 348.10 75.5 6.0 22 PoorA * *
37.40 15.7 1 937 93.73 73.5 5.0 20 PoorA * *
37.00 12.7 1 872 62.86 77.0 6.5 21 Fair/PoorA * *
36.70 10.0 2 297 14.18 60.0 4.8 21 V.PoorA * *
34.70 8.0 0 297 49.12 81.5 3.4 15 V.PoorA * *
28.90 10.7 2 409 36.54 79.5 4.4 17 V.PoorA * *
HELP Ecoregion - WWH (Existing)1.20 27.3 3 1351 89.06 71.0 9.2 32 V.Good/M.GoodA ns
1989 ECBP Ecoregion - WWH (Existing)46.10 20.3 0 1149 17.70 84.5 8.8 45 GoodD
37.90 19.3 5 1509 34.06 77.0 7.4 31 FairD * *
37.70 17.3 7 1394 221.32 68.0 7.4 27 FairA * *
37.50 19.0 20 2603 181.34 77.0 7.6 28 FairA * *
37.40 17.0 5 741 115.19 70.0 5.4 23 PoorA * *
37.00 19.0 7 703 97.79 77.0 7.6 24 Fair/PoorA * *
36.70 13.7 10 351 32.20 65.0 6.0 23 PoorA * *
36.00 7.3 4 191 8.21 90.5 3.9 17 V.Poor/PoorA * *
34.70 10.3 7 258 41.43 76.5 4.3 19 V.Poor/PoorA * *
32.40 13.0 18 457 54.90 85.0 6.3 20 PoorA * *
28.90 12.0 5 255 78.60 78.5 4.7 19 V.Poor/PoorA * *
25.50 24.0 4 713 84.60 76.5 8.1 29 M.Good/FairA ns *
HELP Ecoregion - WWH (Existing)19.00 21.3 28 945 275.54 67.0 8.3 26 M.Good/FairA ns *
1.20 28.3 2 771 92.05 9.0 35 Good/GoodA
1988 ECBP Ecoregion - WWH (Existing)43.00 13.5 15 298 0.64 55.5 7.0 39 Fair/M.GoodD * ns
42.40 14.0 17 556 1.55 56.5 7.3 35 FairD * *
1987 ECBP Ecoregion - WWH (Existing)47.20 19.0 20 920 55.13 82.0 8.1 34 M.Good/FairD ns *
46.10 21.0 5 1098 27.25 8.8 42 GoodD
44.40 18.0 21 550 22.03 85.0 8.1 38 M.GoodD ns ns
43.60 11.7 19 369 97.22 45.0 7.3 35 FairA * *
Table 8. Continued.Mean Mean Mean
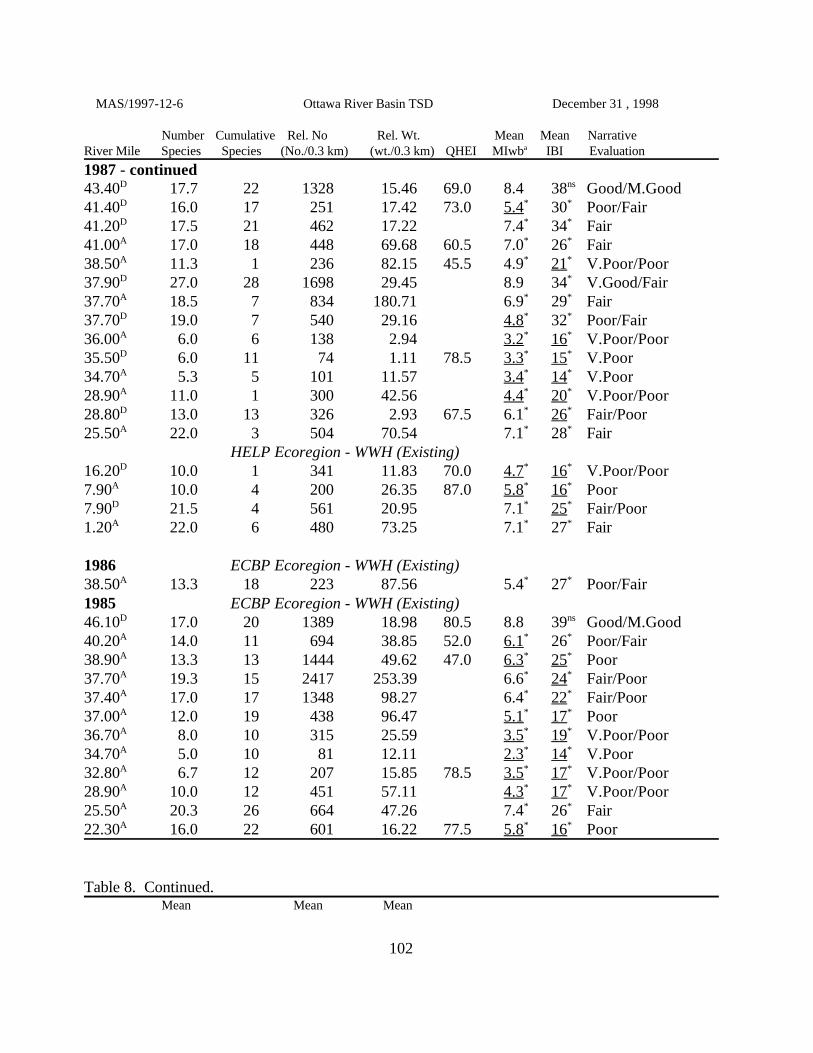
MAS/1997-12-6 Ottawa River Basin TSD December 31 , 1998
102
Number Cumulative Rel. No Rel. Wt. Mean Mean NarrativeRiver Mile Species Species (No./0.3 km) (wt./0.3 km) QHEI MIwb IBI Evaluationa
1987 - continued43.40 17.7 22 1328 15.46 69.0 8.4 38 Good/M.GoodD ns
41.40 16.0 17 251 17.42 73.0 5.4 30 Poor/FairD * *
41.20 17.5 21 462 17.22 7.4 34 FairD * *
41.00 17.0 18 448 69.68 60.5 7.0 26 FairA * *
38.50 11.3 1 236 82.15 45.5 4.9 21 V.Poor/PoorA * *
37.90 27.0 28 1698 29.45 8.9 34 V.Good/FairD *
37.70 18.5 7 834 180.71 6.9 29 FairA * *
37.70 19.0 7 540 29.16 4.8 32 Poor/FairD * *
36.00 6.0 6 138 2.94 3.2 16 V.Poor/PoorA * *
35.50 6.0 11 74 1.11 78.5 3.3 15 V.PoorD * *
34.70 5.3 5 101 11.57 3.4 14 V.PoorA * *
28.90 11.0 1 300 42.56 4.4 20 V.Poor/PoorA * *
28.80 13.0 13 326 2.93 67.5 6.1 26 Fair/PoorD * *
25.50 22.0 3 504 70.54 7.1 28 FairA * *
HELP Ecoregion - WWH (Existing)16.20 10.0 1 341 11.83 70.0 4.7 16 V.Poor/PoorD * *
7.90 10.0 4 200 26.35 87.0 5.8 16 PoorA * *
7.90 21.5 4 561 20.95 7.1 25 Fair/PoorD * *
1.20 22.0 6 480 73.25 7.1 27 FairA * *
1986 ECBP Ecoregion - WWH (Existing)38.50 13.3 18 223 87.56 5.4 27 Poor/FairA * *
1985 ECBP Ecoregion - WWH (Existing)46.10 17.0 20 1389 18.98 80.5 8.8 39 Good/M.GoodD ns
40.20 14.0 11 694 38.85 52.0 6.1 26 Poor/FairA * *
38.90 13.3 13 1444 49.62 47.0 6.3 25 PoorA * *
37.70 19.3 15 2417 253.39 6.6 24 Fair/PoorA * *
37.40 17.0 17 1348 98.27 6.4 22 Fair/PoorA * *
37.00 12.0 19 438 96.47 5.1 17 PoorA * *
36.70 8.0 10 315 25.59 3.5 19 V.Poor/PoorA * *
34.70 5.0 10 81 12.11 2.3 14 V.PoorA * *
32.80 6.7 12 207 15.85 78.5 3.5 17 V.Poor/PoorA * *
28.90 10.0 12 451 57.11 4.3 17 V.Poor/PoorA * *
25.50 20.3 26 664 47.26 7.4 26 FairA * *
22.30 16.0 22 601 16.22 77.5 5.8 16 PoorA * *
Table 8. Continued.Mean Mean Mean

MAS/1997-12-6 Ottawa River Basin TSD December 31 , 1998
103
Number Cumulative Rel. No Rel. Wt. Mean Mean NarrativeRiver Mile Species Species (No./0.3 km) (wt./0.3 km) QHEI MIwb IBI Evaluationa
1985 - continued HELP Ecoregion - WWH (Existing)16.20 19.3 28 1995 91.34 6.6 20 Fair/PoorA * *
12.30 21.0 31 847 120.43 73.5 6.3 24 Poor/PoorA * *
7.90 21.0 31 795 61.68 7.0 24 Fair/PoorA * *
4.40 24.3 33 885 120.62 77.0 8.1 28 M.Good/FairA ns *
1.20 24.3 33 647 102.14 8.5 31 Good/M.GoodA ns
1979 ECBP Ecoregion - WWH (Existing)46.00 17.0 18 755 13.31 8.3 36 Good/M.GoodG ns
45.90 15.0 16 1527 21.17 6.7 30 FairG * *
42.60 14.0 15 477 174.73 5.2 24 Poor/PoorA * *
40.20 9.0 10 206 28.90 3.5 18 V.Poor/PoorA * *
38.90 5.0 6 369 68.81 3.0 18 V.Poor/PoorA * *
37.70 11.0 12 618 249.39 4.6 20 V.Poor/PoorA * *
37.40 9.0 10 573 57.91 4.7 14 V.PoorA * *
36.70 2.0 3 27 5.19 0.9 12 V.PoorA * *
28.90 4.0 4 25 1.18 2.8 12 V.PoorA * *
22.90 2.0 2 6 0.09 0.7 12 V.PoorA * *
Plum Creek (04-201) 1996 HELP Ecoregion - WWH (Existing)15.30 10 726 -- 36.0 NA 22 --/PoorE *
12.90 12 874 -- 57.0 NA 20 --/PoorE *
12.20 13 1090 -- 42.5 NA 18 --/PoorE *
8.10 13 916 -- 33.0 NA 24 --/PoorE *
5.50 17 1062 11.73 49.5 7.1 22 Fair/PoorD * *
0.20 17 3520 7.31 39.0 7.0 26 Fair/PoorD * *
Pike Run (04-208) 1996 ECBP Ecoregion - MWH (Existing)8.30 5 120 -- 58.5 NA 18 PoorE *
8.10 9 318 -- 62.0 NA 18 PoorE *
4.70 8 122 -- 37.5 NA 18 PoorE *
2.20 11 1040 -- 36.5 NA 18 PoorD *
0.60 14 1152 -- 57.0 NA 20* PoorD
1991 ECBP Ecoregion - MWH (Existing)8.20 4 381 2.96 50.0 NA 14 Very PoorD *
8.10 1 17 0.03 28.5 NA 12 Very PoorD *
2.10 11 272 11.43 40.0 NA 20* PoorD
Table 8. Continued.
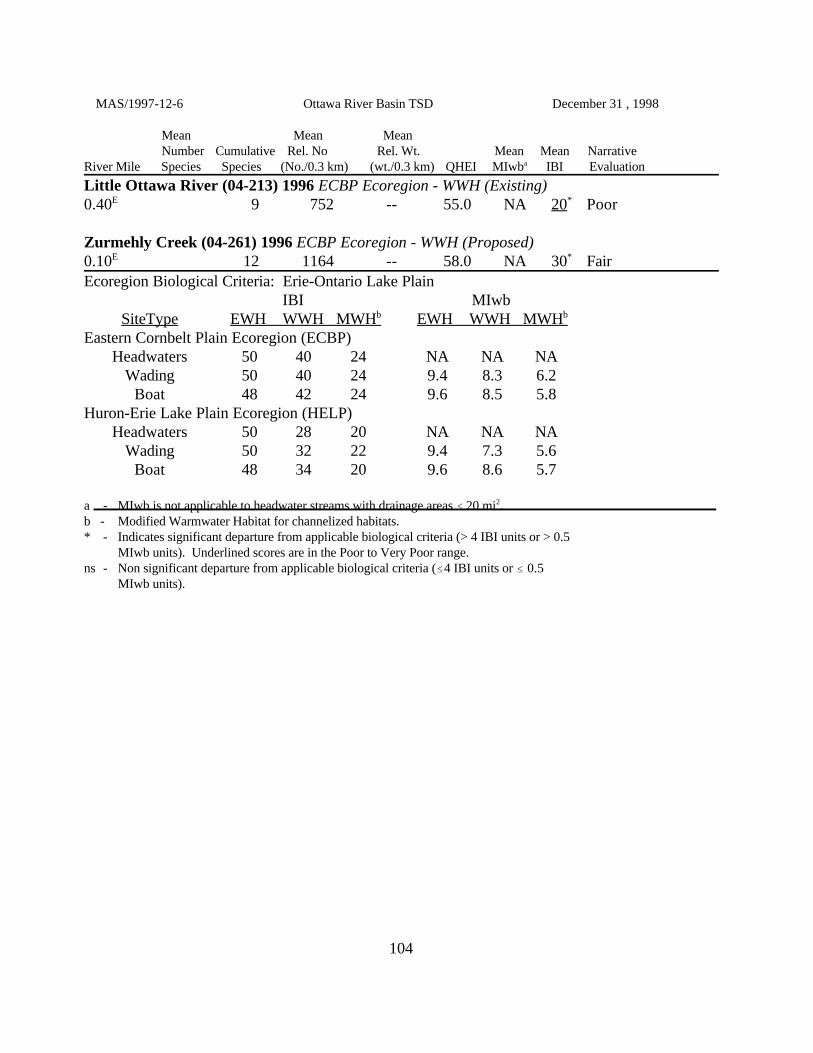
MAS/1997-12-6 Ottawa River Basin TSD December 31 , 1998
104
Mean Mean MeanNumber Cumulative Rel. No Rel. Wt. Mean Mean Narrative
River Mile Species Species (No./0.3 km) (wt./0.3 km) QHEI MIwb IBI Evaluationa
Little Ottawa River (04-213) 1996 ECBP Ecoregion - WWH (Existing)0.40 9 752 -- 55.0 NA 20 PoorE *
Zurmehly Creek (04-261) 1996 ECBP Ecoregion - WWH (Proposed)0.10 12 1164 -- 58.0 NA 30 FairE *
Ecoregion Biological Criteria: Erie-Ontario Lake PlainIBI MIwb
SiteType EWH WWH MWH EWH WWH MWHb b
Eastern Cornbelt Plain Ecoregion (ECBP) Headwaters 50 40 24 NA NA NA
Wading 50 40 24 9.4 8.3 6.2Boat 48 42 24 9.6 8.5 5.8
Huron-Erie Lake Plain Ecoregion (HELP)Headwaters 50 28 20 NA NA NA
Wading 50 32 22 9.4 7.3 5.6Boat 48 34 20 9.6 8.6 5.7
a - MIwb is not applicable to headwater streams with drainage areas # 20 mi . 2
b - Modified Warmwater Habitat for channelized habitats.* - Indicates significant departure from applicable biological criteria (> 4 IBI units or > 0.5
MIwb units). Underlined scores are in the Poor to Very Poor range.ns - Non significant departure from applicable biological criteria (#4 IBI units or # 0.5
MIwb units).
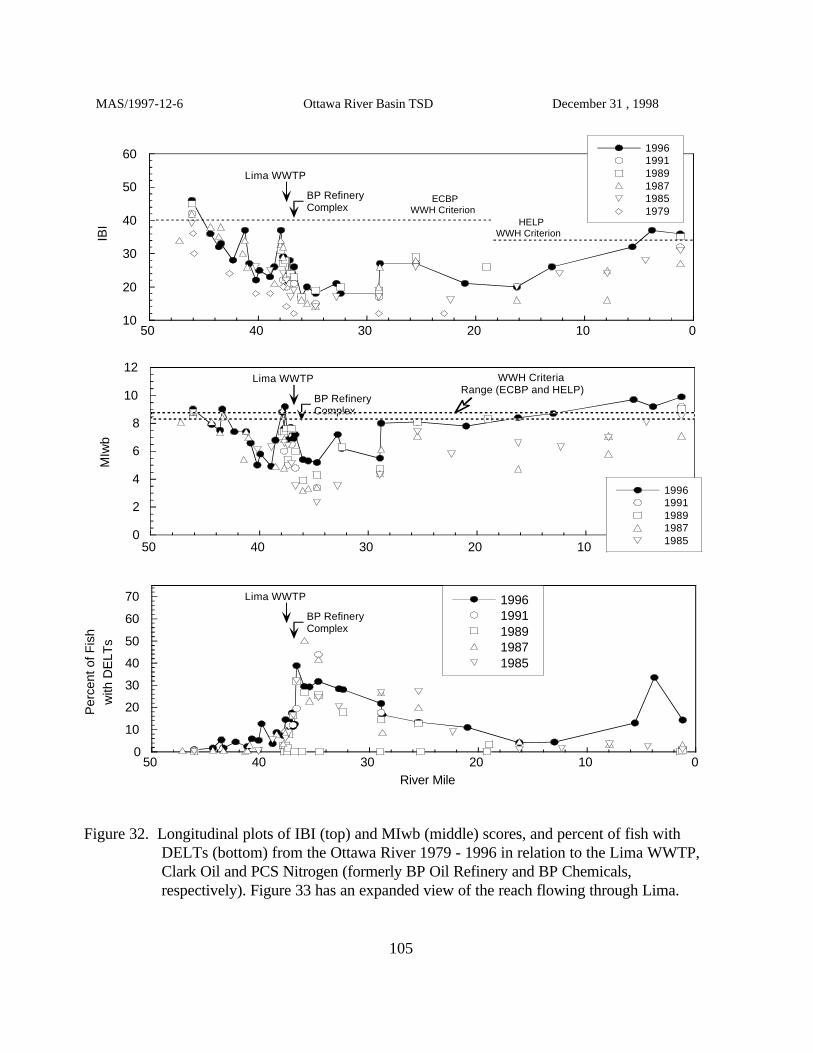
0
10
20
30
40
50
60
70
01020304050
19961991198919871985
Per
cent
of F
ish
with
DE
LTs
Lima WWTP
BP RefineryComplex
River Mile
0
2
4
6
8
10
12
01020304050
19961991198919871985
MIw
b
Lima WWTP
BP RefineryComplex
WWH CriteriaRange (ECBP and HELP)
10
20
30
40
50
60
01020304050
199619911989198719851979
IBI
Lima WWTP
BP RefineryComplex
ECBPWWH Criterion
HELPWWH Criterion
MAS/1997-12-6 Ottawa River Basin TSD December 31 , 1998
105
Figure 32. Longitudinal plots of IBI (top) and MIwb (middle) scores, and percent of fish withDELTs (bottom) from the Ottawa River 1979 - 1996 in relation to the Lima WWTP,Clark Oil and PCS Nitrogen (formerly BP Oil Refinery and BP Chemicals,respectively). Figure 33 has an expanded view of the reach flowing through Lima.
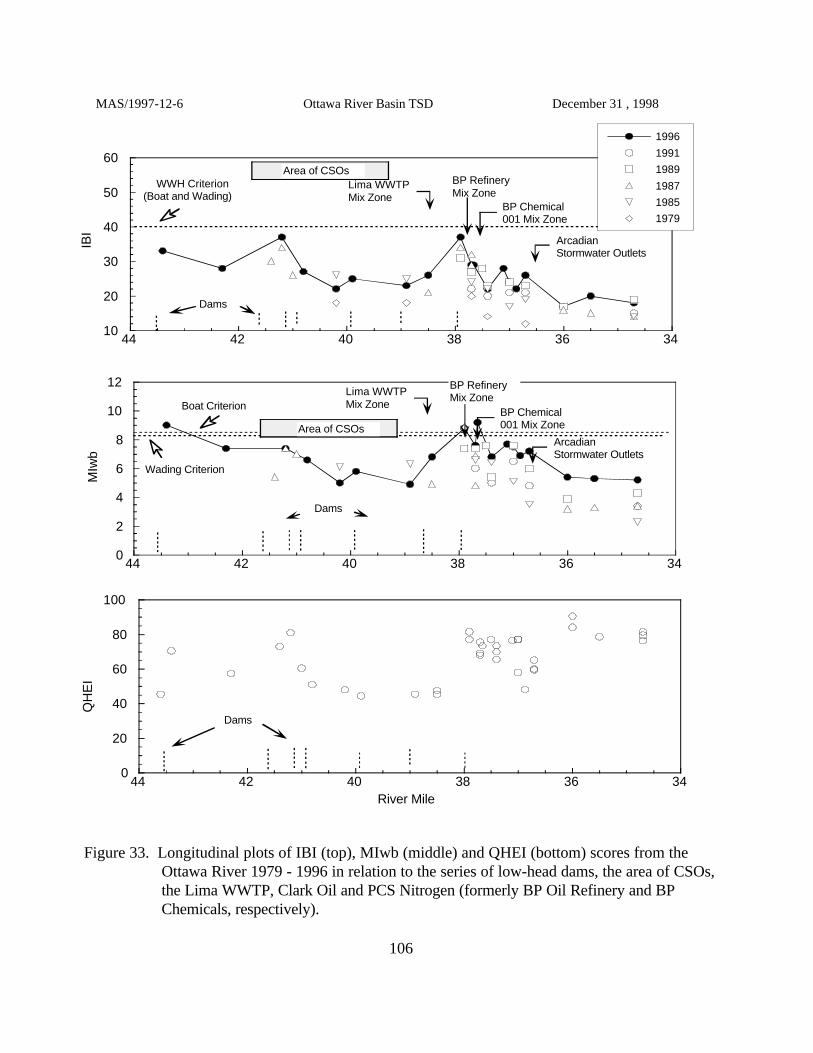
0
20
40
60
80
100
343638404244
QH
EI
River Mile
Dams
0
2
4
6
8
10
12
343638404244
MIw
b
BP Chemical001 Mix Zone
BP RefineryMix ZoneLima WWTP
Mix Zone
Area of CSOsArcadianStormwater Outlets
Dams
Wading Criterion
Boat Criterion
10
20
30
40
50
60
343638404244
1996
1991
1989
1987
1985
1979
IBI
BP Chemical001 Mix Zone
BP RefineryMix Zone
Lima WWTPMix Zone
ArcadianStormwater Outlets
Area of CSOs
Dams
WWH Criterion(Boat and Wading)
MAS/1997-12-6 Ottawa River Basin TSD December 31 , 1998
106
Figure 33. Longitudinal plots of IBI (top), MIwb (middle) and QHEI (bottom) scores from theOttawa River 1979 - 1996 in relation to the series of low-head dams, the area of CSOs,the Lima WWTP, Clark Oil and PCS Nitrogen (formerly BP Oil Refinery and BPChemicals, respectively).

10
20
30
40
50
60
19961991198919871985
IBI
14 1413
7
23
0
2
4
6
8
10
12
19961991198919871985
MIw
b
1414 13
7
23
-200
0
200
400
600
800
1000
1200
1400
19961991198919871985
Rel
ativ
e N
umbe
rof
Non
-Tol
eran
t Fis
hes
2515
1222
7
-10
0
10
20
30
40
50
60
19961991198919871985P
erce
nt o
f Fis
hS
how
ing
DE
LTs
2515 12
22
7
MAS/1997-12-6 Ottawa River Basin TSD December 31 , 1998
107
Figure 34. Left to right from top, distributions of IBI scores, percentage of fish with DELTs,MIwb scores, and the relative number of fishes excluding tolerant species from theOttawa River in an downstream from Lima, Ohio by sample year. Boxes enclose the25th through 75th percentiles, whiskers represent points falling within 1.5 times therespective upper or lower interquartile distance.

20
40
60
80
100
0246810
IBI - 1996IBI - 1991QHEI
QH
EI
River Mile
American/BathWWTP
MWH
10
20
30
40
50
60
0246810121416
IBI
QHEI
20
40
60
80
100
IBI
River Mile
Columbus GroveWWTP
WWH
MWH
Plum Creek Pike Run
MAS/1997-12-6 Ottawa River Basin TSD December 31 , 1998
108
Plum CreekPoor habitat quality throughout Plum Creek results in fish communities lacking species and trophicfunction. Consequently, IBI scores at every sampling location were in the poor range and did not meetthe existing WWH criteria (Figure 35). The Columbus Grove WWTP did not have a significant,additive impact to the fish community in light of the severity of the overriding nonpoint and habitatimpacts.
Pike Run Pike Run is maintained as an agricultural drainage ditch; consequently, the fish community iscommensurately degraded (Figure 35). Although Pike Run is designated MWH, the fish communitydid not meet those lower standards. One possible cause may be the heavy bedload of soil washedunencumbered by riparian buffers from adjacent agricultural fields. In contrast to 1991 when only onebluegill was collected downstream from the American Bath WWTP, no significant impact from theplant was detectable in 1996.
Little Ottawa River and Zurmehly CreekHabitat impacts from channelization, intensive agriculture, and in the case of Zurmehly Creek,urbanization, limit the aquatic communities in both streams. Based on the number of modified habitatattributes, neither stream is likely to support fish communities expected for the WWH aquatic life use.
Figure 35. Longitudinal plots of IBI (on the left y-axises) and QHEI (on the right y-axises) scoresfrom Plum Creek (left plot) and Pike Run (right plot) in relation to the Columbus GroveWWTP and the American Bath WWTP. The shaded box in the Plum Creek plotrepresents the existing WWH IBI criterion. The stippled line shows the respectiveproposed and existing MWH criterion for both.

MAS/1997-12-6 Ottawa River Basin TSD December 31 , 1998
109
Integrated Biological Assessment: Area of Degradation Values (ADVs) and Attainment Status
Improvements in the biological communities have yielded a greater number of river miles in full andpartial attainment in 1996 compared to 1985 (Figure 36, Table 9). The recovery was driven largelyby the macroinvertebrate ICI and the fish MIwb scores as evidenced by lower ADV per mile for bothindices in 1996 relative to 1985 (Table 9). However, a large portion, 24.6 miles, of the Ottawa Riverremain in the poor or very poor categories reflecting a continued toxic impact associated with LimaCSOs, the Lima WWTP, and the complex of industrial dischargers.
From 1985 to 1996, the upper segment from Thayer Road to the Lima WWTP/Erie-Lackawana RRdam (RM 46.1 to RM 37.9) showed improvement with more miles in partial attainment (+ 3.2 miles)and full attainment (+ 0.4 miles), and less miles in non attainment (- 3.6 miles). Although the area ofdegradation (ADV) values for the fish indices remained the same for this reach between 1985 and1996, the positive statistics (Table 9) showed an increase in the area of attainment values (AAV- areaof graph above attainment line in Figure 5). ADVs decreased substantially for macroinvertebratesfrom 122 ADV/mile in 1985 to 35 ADV/mile in 1996. One sampling site in this reach showingimprovement was the site at RM 37.9, downstream from the Lima CSOs and upstream from the L5landfill, which improved to partial attainment in 1996.
The segment of the Ottawa River showing the least improvement in attainment status was between theLima WWTP/Erie-Lackawana RR dam and the Allentown dam (RM 37.9 to RM 28.8). Biologicalsampling in the years 1976, 1979, 1985, 1987, 1989, 1991, and 1996 resulted in non attainment for theentire 9.1 miles, except for 0.2 miles (RM 37.9 to RM 37.7) in partial attainment in 1987 and 1996.ADV values for the MIwb and ICI have substantially decreased, but the ADV value for the IBI hasremained very high (Figure 36, Table 9).
The most improvement to the biological communities from 1985 to 1996 occurred in the lower sectionbetween the Allentown dam and the mouth (RM 28.8 to RM 0.0). Full attainment was increased from2.2 miles in 1985 to 8.0 miles in 1996.The ADV values for the fish Miwb and the macroinvertebrateICI decreased to essentially zero in 1996. The fish IBI ADV values decreased from 82 ADV/mile in1985 to 54 ADV/mile in 1996. The IBI scores ranged from poor to fair from RM 28.8 to RM 13.0,contributing to the non attainment (13.9 miles) in this reach in 1996.
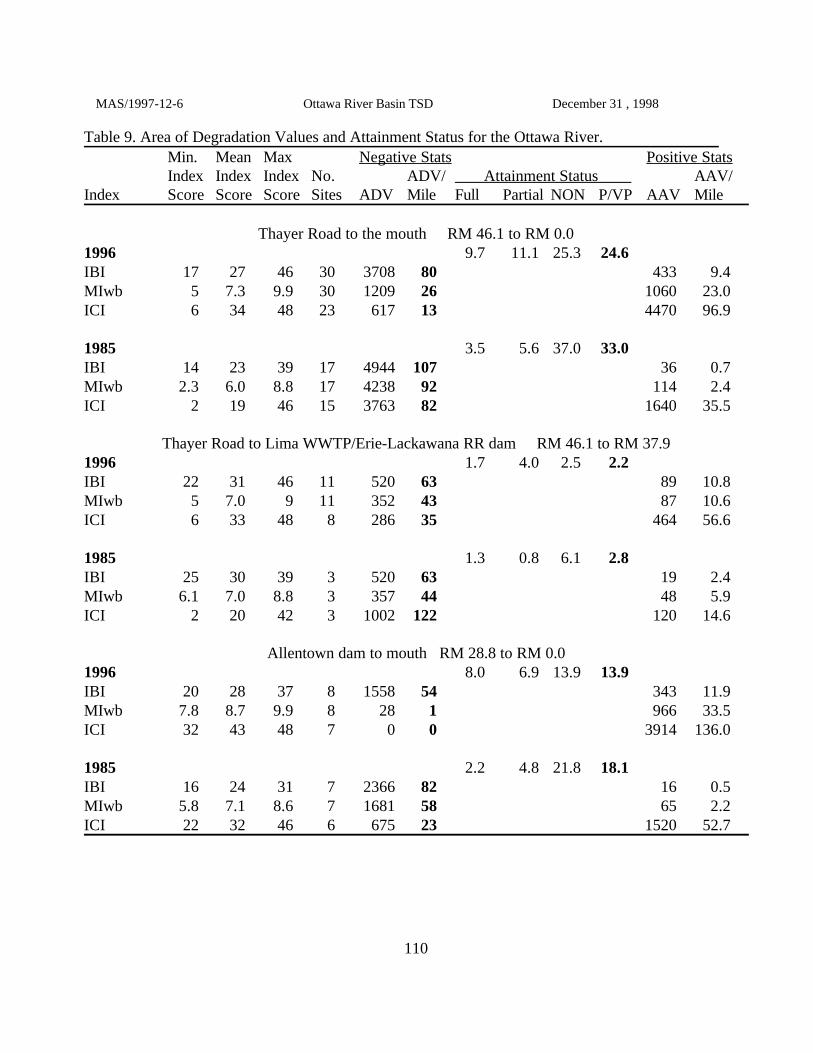
MAS/1997-12-6 Ottawa River Basin TSD December 31 , 1998
110
Table 9. Area of Degradation Values and Attainment Status for the Ottawa River.Min. Mean Max Negative Stats Positive StatsIndex Index Index No. ADV/ Attainment Status AAV/
Index Score Score Score Sites ADV Mile Full Partial NON P/VP AAV Mile
Thayer Road to the mouth RM 46.1 to RM 0.01996 9.7 11.1 25.3 24.6IBI 17 27 46 30 3708 80 433 9.4MIwb 5 7.3 9.9 30 1209 26 1060 23.0ICI 6 34 48 23 617 13 4470 96.9
1985 3.5 5.6 37.0 33.0IBI 14 23 39 17 4944 107 36 0.7MIwb 2.3 6.0 8.8 17 4238 92 114 2.4ICI 2 19 46 15 3763 82 1640 35.5
Thayer Road to Lima WWTP/Erie-Lackawana RR dam RM 46.1 to RM 37.91996 1.7 4.0 2.5 2.2IBI 22 31 46 11 520 63 89 10.8MIwb 5 7.0 9 11 352 43 87 10.6ICI 6 33 48 8 286 35 464 56.6
1985 1.3 0.8 6.1 2.8IBI 25 30 39 3 520 63 19 2.4MIwb 6.1 7.0 8.8 3 357 44 48 5.9ICI 2 20 42 3 1002 122 120 14.6
Allentown dam to mouth RM 28.8 to RM 0.01996 8.0 6.9 13.9 13.9IBI 20 28 37 8 1558 54 343 11.9MIwb 7.8 8.7 9.9 8 28 1 966 33.5ICI 32 43 48 7 0 0 3914 136.0
1985 2.2 4.8 21.8 18.1IBI 16 24 31 7 2366 82 16 0.5MIwb 5.8 7.1 8.6 7 1681 58 65 2.2ICI 22 32 46 6 675 23 1520 52.7

MAS/1997-12-6 Ottawa River Basin TSD December 31 , 1998
111
Table 9. (continued) Area of Degradation Values and Attainment Status for the Ottawa River.Min. Mean Max Negative Stats Positive StatsIndex Index Index No. ADV/ Attainment Status AAV/
Index Score Score Score Sites ADV Mile Full Partial NON P/VP AAV Mile
Lima WWTP/Erie-Lackawana RR dam to Allentown dam RM 37.9 to RM 28.81996 0 0.2 8.9 8.5IBI 17 23 37 11 1629 179 0.1 0.1MIwb 5.2 6.6 8.8 11 828 91 0.7 0.2ICI 14 28 42 8 331 36 10.0 2.9
1991 0 0 9.1 9.1IBI 15 19 22 6 1888 208 0.0 0.0MIwb 3.4 5.0 6.5 6 1680 185 0.0 0.0ICI 6 11 18 5 1195 131 0.0 0.0
1989 0 0 9.1 8.7IBI 17 23 31 10 1614 177 0.0 0.0MIwb 3.9 6.1 7.6 10 1193 131 0.0 0.0ICI 10 18 30 7 691 76 0.2 0.3
1987 (No ICI data) 0 0.2 8.9 8.6IBI 14 21 34 6 1775 195 0.0 0.0MIwb 3.2 5.0 8.9 6 1715 188 0.6 0.2
1985 0 0 9.1 9.1IBI 14 19 24 7 1901 209 0.0 0.0MIwb 2.3 4.5 6.6 7 1974 217 0.0 0.0ICI 4 6 6 6 2095 230 0.0 0.0
1979 (No ICI data) 0 0 9.1 9.1IBI 12 15 20 4 2323 255 0.0 0.0MIwb 0.9 3.3 4.7 4 2672 294 0.0 0.0
1976 (No IBI, MIwb data) 0 0 9.1 9.1ICI 0 2 6 4 2563 282 0.0 0.0
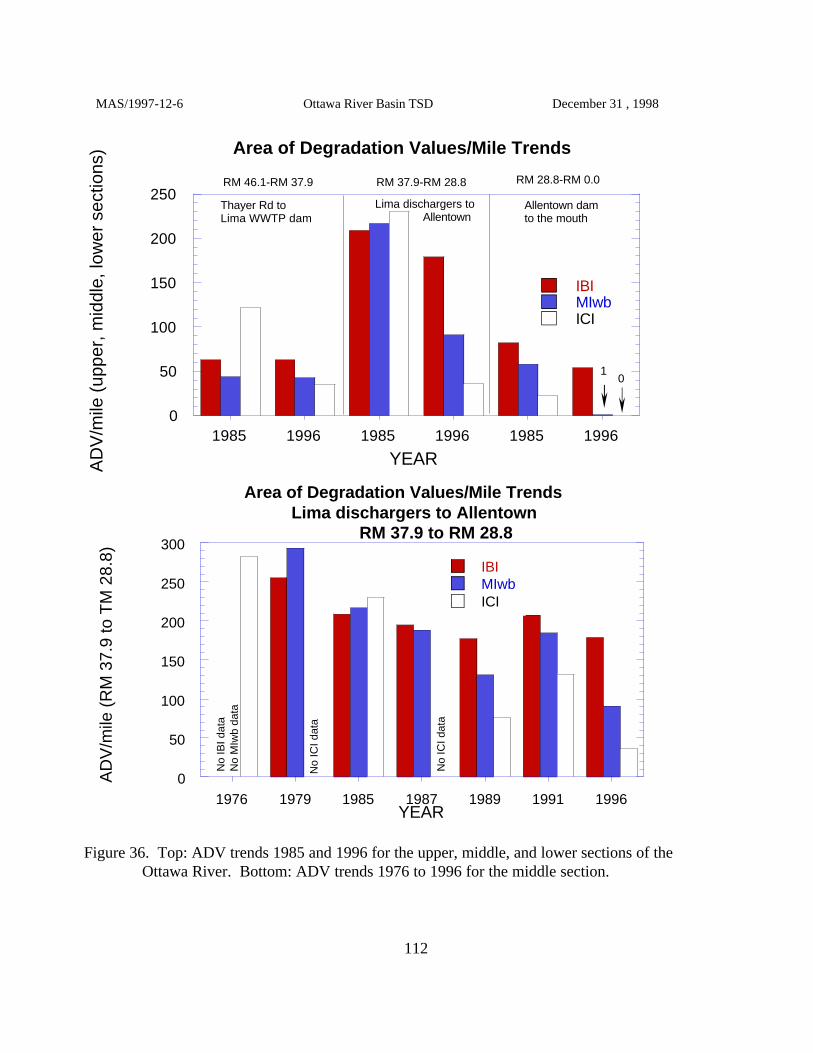
0
50
100
150
200
250
1985 1996 1985 1996 1985 1996
Area of Degradation Values/Mile Trends
IBIMIwbICI
AD
V/m
ile (
uppe
r, m
iddl
e, lo
wer
sec
tions
)
YEAR
10
RM 46.1-RM 37.9 RM 28.8-RM 0.0RM 37.9-RM 28.8
Thayer Rd to Lima WWTP dam
Lima dischargers to Allentown
Allentown dam to the mouth
0
50
100
150
200
250
300
1976 1979 1985 1987 1989 1991 1996
Area of Degradation Values/Mile Trends Lima dischargers to Allentown
RM 37.9 to RM 28.8
IBIMIwbICI
AD
V/m
ile (
RM
37.
9 to
TM
28.
8)
YEAR
No
IBI d
ata
No
MIw
b da
ta
No
ICI d
ata
No
ICI d
ata
MAS/1997-12-6 Ottawa River Basin TSD December 31 , 1998
112
Figure 36. Top: ADV trends 1985 and 1996 for the upper, middle, and lower sections of the Ottawa River. Bottom: ADV trends 1976 to 1996 for the middle section.

MAS/1997-12-6 Ottawa River Basin TSD December 31 , 1998
113
REFERENCES
Allan, D.S. 1995. Stream ecology, structure and function of running water. Chapman and Hall,Boundy Row, London.Anderson, D. M. and C.C. King (eds.). 1976. Environmentalanalysis of central Ohio. The Ohio State University. Ohio Biological Survey, Columbus.
DeShon, J.D. 1995. Development and application of Ohio EPA’s invertebrate community index(ICI), in W.S. Davis and T. Simon (eds.). Biological assessment and criteria: tools forrisk-based planning and decision making. CRC Press/Lewis Publishers, Ann Arbor.
Fausch, D.O., Karr, J.R. and P.R. Yant. 1984. Regional application of an index of biotic integritybased on stream fish communities. Trans. Amer. Fish. Soc. 113:39-55. Gammon, J.R., A.Spacie, J.L. Hamelink, and R.L. Kaesler. 1981. Role of electrofishing in assessingenvironmental quality of the Wabash River. pp. 307-324. In: Ecological assessments ofeffluent impacts on communities of indigenous aquatic organisms. ASTM STP 703, J.M.Bates and C.I. Weber (eds.). Philadelphia, PA.
Gammon, J.R. 1976. The fish populations of the middle 340 km of the Wabash River. Tech. ReportNo. 86. Purdue University. Water Resources Research Center, West Lafayette, Indiana. 73 pp.
Gordon, R.B. 1969. The natural vegetation of Ohio in pioneer days. The Ohio State University. Ohio Biological Survey, Columbus. III-2. 113pp.
Hughes, R. M., D. P. Larsen, and J. M. Omernik. 1986. Regional reference sites: a method forassessing stream pollution. Env. Mgmt. 10(5): 629-635.
Hynes, H.B.N. 1970. The ecology of running waters. University of Toronto Press, Toronto.Johnson, D.P. and K.D. Metzker. 1981. Low-flow characteristics of Ohio streams. United States
Department of the Interior-Geological Survey. 81-1195. 285pp.Karr, J. R. 1991. Biological integrity: A long-neglected aspect of water resource management.
Ecological Applications 1(1): 66-84.Karr, J.R., K.D. Fausch, P.L. Angermier, P.R. Yant, and I.J. Schlosser. 1986. Assessing biological
integrity in running waters: a method and its rationale. Ill. Nat. Hist. Surv. Spec. Publ. 5. 28 pp.
Karr, J.R. 1981. Assessment of biotic integrity using fish communities. Fisheries 6 (6): 21-27.Karr, J.R. and D.R. Dudley. 1981. Ecological perspective on water quality goals. Env. Mgmt. 5(1):
55-68.Kelly, M. H. and R. L. Hite. 1984. Evaluation of Illinois stream sediment data: 1974-1980. Illinois
Environmental Protection Agency, Division of Water Pollution Control. Springfield,Illinois.
Leonard, P.M. and D.J. Orth. 1986. Application and testing of an Index of Biotic Integrity in smallcool water streams. Tans. Am. Fish. Soc. 115:401-414.
Miner R. and D. Borton. 1991. Considerations in the development and implementation of biocriteria,Water Quality Standards for the 21st Century, U.S. EPA, Offc. Science and Technology,Washington, D.C., 115.

MAS/1997-12-6 Ottawa River Basin TSD December 31 , 1998
114
Montgomery Watson. 1997. City of Lima. Water Quality Impacts Study. CSO study conductedduring 1996.
Ohio Department of Natural Resources. 1985. Principal streams and their drainage area. Division ofWater. Ohio Department of Natural Resources. Columbus, Ohio.
___ 1960. Gazetteer of Ohio streams. Ohio Dept. Natural Resources, Division of Water, OhioWater Plan Inventory Report No. 12.
Ohio Environmental Protection Agency. 1979. Water Quality Study of the Ottawa River OEPA 79/1.___ 1985. Ottawa River WQTSD (1985) - draft.___ 1987a. Biological criteria for the protection of aquatic life: Volume I. The role of biological
data in water quality assessment. Division of Water Quality Monitoring and Assessment,Surface Water Section, Columbus, Ohio..
___ 1987b. Biological criteria for the protection of aquatic life: Volume II. Users manual forbiological field assessment of Ohio surface waters. Division of Water Quality Monitoringand Assessment, Surface Water Section, Columbus, Ohio.
___ 1989a. Addendum to biological criteria for the protection of aquatic life: Users manual forbiological field assessment of Ohio surface waters. Division of Water Quality Planningand Assessment, Surface Water Section, Columbus, Ohio.
___ 1989b. Biological criteria for the protection of aquatic life: Volume III. Standardized biologicalfield sampling and laboratory methods for assessing fish and macroinvertebratecommunities. Division of Water Quality Planning and Assessment, Columbus, Ohio.
___ 1989c. Ohio EPA policy for implementing chemical specific water quality based effluent limitsand whole effluent toxicity controls in NPDES permits. Divisions of Water PollutionControl and Water Quality Planning and Assessment, Columbus, Ohio.
___ 1989d. Summary of the 1989 Biological and Water Quality Survey of the Ottawa River, Allenand Putnam Counties, Ohio and Changes Since 1985.
___ 1990. The cost of biological field monitoring. Division of Water Quality Planning andAssessment, Columbus, Ohio.
___ 1990a. State of Ohio nonpoint source assessment: Volume 5. Region. Division of WaterQuality Planning and Assessment, Nonpoint Source Program Management Section,Columbus, Ohio.
___ 1990b. Ohio water resource inventory - 1990 305b report. Volume II. Edward T. Rankin,editor. Division of Water Quality Planning and Assessment, Surface Water Section,Columbus, Ohio.
___ 1991. Calculation and uses of the Area of Degradation Value (ADV). Division of WaterQuality Planning and Assessment, Surface Water Section, Columbus, Ohio.
___ 1992. 1991 Biological and Water Quality Study of the Ottawa River, Hog Creek, Little HogCreek, and Pike Run (September 21, 1992).
___ 1996. Statistical Analyses of Sediment Metals Data from Ohio: Relationships BetweenSediments, Ecoregion and Biological Criteria.
Omernik, J.M. and A.L. Gallant. 1988. Ecoregions of the upper midwest states. EPA/600/3-88/037. U. S. Environmental Protection Agency, Environmental Research Laboratory, Corvallis,
MAS/1997-12-6 Ottawa River Basin TSD December 31 , 1998
115
Oregon. 56 pp.Persaud, D., J. Jaagiumagi, and A. Hayton. 1994. Guidelines for the protection and management of
aquatic sediment quality in Ontario. Ontario Ministry of the Environment. Toronto. 24 pp.Rankin, E.T. 1995. The qualitative habitat evaluation index (QHEI), in W.S. Davis and T. Simon
(eds.). Biological Assessment and Criteria: Tools for Risk-based Planning and DecisionMaking. CRC Press/Lewis Publishers, Ann Arbor. (in press).
Rankin, E.T. and C.O. Yoder. 1991 Calculation and use of the area of degradation value (ADV). Division of Water Quality Planning and Assessment, Surface Water Section, Columbus,Ohio.
Rankin, E.T. 1989. The qualitative habitat evaluation index (QHEI): rationale, methods, andapplication. Division of Water Quality Planning and Assessment, Columbus, Ohio.
Shindel, H.L., J.P. Mangus, and L.E. Trimble. 1996. Water resources data Ohio, Water year 1994,Volume 1. Ohio River basin excluding project data. United States Department of theInterior-Geological Survey. Water-Data Report OH-90-1. 287pp.
Suter, G.W., II. 1993. A critique of ecosystem health concepts and indexes. EnvironmentalToxicology and Chemistry, 12: 1533-1539.
Trautman, M. B. 1981. The fishes of Ohio with illustrated keys. Ohio State Univ. Press, Columbus. 782 p
Whittier, T.R., D.P. Larsen, R.M. Hughes, C.M. Rohm, A.L. Gallant, and J.M. Omernik. 1987. TheOhio stream regionalization project: a compendium of results. EPA/600/3-87/025. 66 pp.
Yoder, C.O., J. DeShon, R. Thoma, E. Rankin, and R. Beaumier. 1986. Evaluation of effluenttoxicity screening of two selected discharges. Division of Water Quality Monitoring andAssessment, Columbus, Ohio.
Yoder, C.O. 1989. The development and use of biological criteria for Ohio surface waters. U.S.EPA, Criteria and Standards Div., Water Quality Stds. 21st Century, 1989: 139-146.
Yoder, C. O. 1991. Answering some concerns about biological criteria based on experiences in Ohio, in G. H. Flock (ed.) Water quality standards for the 21st century. Proceedings of a NationalConference, U. S. EPA, Office of Water, Washington, D.C.
Yoder, C.O. 1995. Policy issues and management applications of biological criteria, in W.S. Davisand T. Simon (eds.). Biological Assessment and Criteria: Tools for Risk-based Planningand Decision Making. CRC Press/Lewis Publishers, Ann Arbor.
Yoder, C.O. and E.T. Rankin. 1995. Biological response signatures and the area of degradationvalue: new tools for interpreting multi-metric data, in W.S. Davis and T. Simon (eds.). Biological Assessment and Criteria: Tools for Risk-based Planning and Decision Making. CRC Press/Lewis Publishers, Ann Arbor. Yoder, C. O. and E. T. Rankin. 1995. Biological response signatures and the area of degradation value: New tools forinterpreting multimetric data, pp. 263-286 (Chapter 17). in W.S. Davis and T. Simon(eds.). Biological Assessment and Criteria: Tools for Water Resource Planning andDecision Making. Lewis Publishers, Boca Raton, FL.