biological examination and characterization of … examination and characterization of...
TRANSCRIPT
Biological examination andcharacterization of ribonucleotidereductase inhibitory peptides
Study of peptides based on the C-terminal of theR2 subuint
Peter Yohanoun
Degree project in biology, Bachelor of science, 2007Examensarbete i biologi 15 hp till kandidatexamen, 2007Biology Education Centre and Department of Cell and Molecular biology, Uppsala UniversitySupervisors: Torsten Unge and Annette Roos

Summary
This project was focused on the attempt to control the gram-positive bacterium Mycobacterium tuberculosis, through targeting the protein ribonucleotide reductase (RNR). RNR has a central role in the production pathway of DNA building blocks, the deoxyribonucleotides. The active form of RNR is a double heterodimer consisting of the R1 and R2 subunits.
The goal for this project was to block the R2 subunit from interacting with the R1 subunit, which is essential for enzyme activation and thus for survival of the bacteria. I examined a number of given oligopeptides, testing their potency in inhibiting the interaction between the two subunits. Since the R2 subunit binds to R1 through its unstructured C-terminal part, the peptides designed to compete for the binding were based on this sequence. The long-term goal is to mimic the peptide structure, designing chemical compounds that can be transported and absorbed by the bacteria, without being degraded in the human body.
The method applied was based on an activity assay where the amount of product produced by RNR was studied. The IC50-value (concentration of peptide needed to inhibit 50% of the reaction) was taken directly from the graph. Comparisons of different IC50-values gave a clue to what chemical groups at any given position contributed to higher affinity.
The results from this project led to the conclusion that modifications at the peptide ends by far contributed to highest affinity. The tetrapeptide Cap-DWDF – modified at the N-term by the addition of a fluorene group – showed highest affinity. In the absence of the bridge between the two benzene rings, or when only one benzene ring was present, the affinity dropped from an IC50 of 2 µM by almost a hundred fold. Cis/trans isomers of the added chemical groups also affected the binding affinity, given that benzene groups in the trans-confirmation contributed to double affinity in comparison to cis-confirmation, as the case for the heptapeptides.

2
Introduction
The disease
Tuberculosis (TBC) is an infectious disease caused by the bacterium Mycobacterium tuberculosis. The disease leads to the death of 2 million people worldwide each year and it is estimated that one-third of the world’s population is infected [3]. Not until 1920 did mankind manage to get control over its epidemic outbreaks and its deadly outcome. Today there are several treatments that can give fair opportunities to those who have been affected to live an almost completely normal life. However, the treatments used are fairly ineffective, take a long time and are expensive. In all cases at least two drugs must be given in parallel for a period of six months. The standard treatments involve the top-of-the-line drugs rifampicin, ethambutol, isoniazid and pyrazinamide, although the effectiveness is only about 95%. In addition, latent TBC has to be treated for up to nine months [12, 5] and patients must be kept under constant supervision for many years [12, 13].
With this background, it is almost impossible for those who suffer the most, mostly poor people, to get the treatment needed. Each year, approximately 500 cases of TBC are reported in Sweden –numbers considered to be among the smallest in the world [9]. The problem is usually, as mentioned, not the method of treatment itself, but rather the cost for it and the time involved. Even though in western countries this disease is treated routinely as any other disease, it is hard to escape the fact that millions and millions of people are affected and suffer from it till this day. In recent years it has been noticeable that the number of people who fall ill in TBC is increasing at the same rate as infrastructure is improving, and more and more people travel around the world, bearing the disease. The situation is critical in poor countries, but TBC is a problem also in the EU, mostly in the Baltics, but also in Russia. This is for another reason though, namely multidrug resistant strains [4,8,11]. For this reason, TBC once again has ended up on the World Health Organization’s (WHO) priority list [10]. The demand for better treatments and medicines has increased dramatically.
The bacterium and some drawbacks in terms of drug design
What makes M. tuberculosis so hard to kill and how can it escape the body’s immune response? TBC belongs to the classification of Gram-positive bacteria [5], which has a very thick peptidoglycan layer surrounding the outer membrane. However, because Mycobacterium is an acid-fast bacterium (a property leading to poor staining followed by retention), it is not susceptible to Gram-staining. Nevertheless, the drug designed has to stay intact when transported in the body; to be able to pass the peptidoglycan layer and bacterial membrane and then end up in the cytosol where the actual action takes place. In addition, this drug has to be target-specific.
Antibiotics can be designed based on various considerations. The most common approach is to inhibit specific proteins inside the bacterial cells. The substance is introduced into the body and is absorbed by the bacteria. The substance could have either a bactericidal effect, which knocks out an essential process and leads to the killing of the bacteria, or bacteriostatic, which arrests the cell and impedes it from proliferating. In many cases, scientists are forced to work with completely sealed eyes.

3
Features of ribonucleotide reductase
Ribonucleotide reductase, RNR, is a protein that catalyzes the formation of deoxy-ribonucleotides – which are the main building blocks in DNA, fig. 1. RNR in M. tuberculosis belongs to the class 1b of several subclasses [14]. The active form of this protein complex is a double heterodimer consistent of the subunits R1 and R2. Many efforts to crystallize the R1 subunit have been made, although the results have not been successful. The difficulties experienced in the crystallization attempts are mainly due to the large number of flexible parts involved in the reaction mechanism [7]. TBC R1 shares about 75% sequence similarity with Salmonella typhimurium. Hence, most of the knowledge is based on homologous R1/R2 proteins in other organisms, such as salmonellae. Moreover, residues present in the active sites of R1 are highly conserved in many other related bacteria.
Figure 1. Redox reactions in the substrate active site of RNR R1. The SH-groups come from Cys462 and Cys225. Under physiological conditions, the S-S bonds are reduced by certain enzymes, e.g. thioredoxin, but in this assay, dithiotreitol (DTT) is used as a reducing agent for regeneration of enzyme. The reaction is shown as formation of deoxynucleotides (dNDPs).
The R1 subunit has a number of important “pockets” with a variety of functions: interaction with the R2 subunit, binding of substrate (CDP) and binding of allosteric regulator (ATP). In addition, R2 has a Mg++-ion binding region, for sustaining structure stability. Studies have shown that the interaction between the R1 and R2 subunits occurs at least through the carboxyl end of R2 [7], fig. 2.
The binding and interaction with the R2 C-terminus has been found to be essential for the reaction to take place (an unpaired electron is transported from R2 to the R1 active site, a distance of 35 Å) [14,4,10]. It has been possible to synthesize small peptides based on the R2 C-terminus sequence. These peptides will have some affinity for the R2 binding pocket. With organic chemistry methods it has also been possible to synthesize peptides that have greater affinity to R1 compared to the affinity between native R1-R2 proteins [10]. In theory, the synthesized peptide will bind to the pocket and actively hinder R2 from binding. In this way, catalysis will be blocked and the DNA synthesis in the bacteria will be arrested. The proliferation of cells will be stopped.

4
Figure 2. Chrystallographic structures of R1 and R2. The secondary structures for the 79kDa R1 subunit of RNR (left) are depicted by colors, showing β-sheets (yellow) and α-helices (purple). The R2 subunit (right) is almost entirely folded into a bundle of α-helices. The R2 C-term is clearly shown on the upper part.
Fluorescence polarization
Fluorescence polarization is a method for examination of substance-enzyme interaction, which distinguishes between the emitted light from the bound and unbound state of the peptide. If unbound, the peptide emits light in all directions because of the intrinsic spin, whereas the bound state will “arrest” the peptide giving possibility to measure the difference in emission between the bound and unbound state – which then indicate if the peptide is bound or not, fig. 4. The output difference depends on the potency of each peptide. This method demands that a well-characterized peptide labeled with a fluorescent protein is used. Addition of a peptide of interest to the reaction mix will result in displacement of the tagged peptide, generating a difference in emission. The fluorescence polarization (FP) signal is given in mP (milli “P”, given that “P” is a unit for depolarized light).
Figure 4. The principles of fluorescence polarization. The intrinsic rotation of all molecules depolarizes, in specific degree, the light with which it is irradiated. The ligand illustrates the dansylated peptide in this experiment, which when unbound, rotates in high speed. When the ligand binds to the receptor molecule (i.e. R1 subunit), it slows down. The polarization difference is measured and monitored as a decrease in mP [7].

5
Aims
The purpose of the study was to make a biological examination of a number of synthetic oligopeptides. The peptides are between 4 and 7 amino acids in length in different composition and with several types of terminal modifications, fig. 3. The results will be based on measuring IC50 values for each and every one of the tested and examined peptides. IC50 means “the concentration of substance needed to inhibit 50% of the amount of tested protein”. The aim was to build an understanding of the nature of the R2 binding pocket. Using the knowledge obtained, it will be possible to construct peptides that can imitate and bind R1 with high potency. Depending on which peptides bound strongly and which bound weakly, clues will be obtained as to what types of bindings and charges contribute to high affinity at a given residue position.
Figure 3. Modifications on peptide terminals (indicated in red). Peptide structures provided with permission of Johanna Nurbo and Anders Karlén, University of Uppsala, 2007.
The inhibition of RNR activity was measured as reduction of counts per minutes, dependent on the amount (or concentration) of product from the RNR reaction in each sample.
6
Results
Expression and purification of R1 and R2
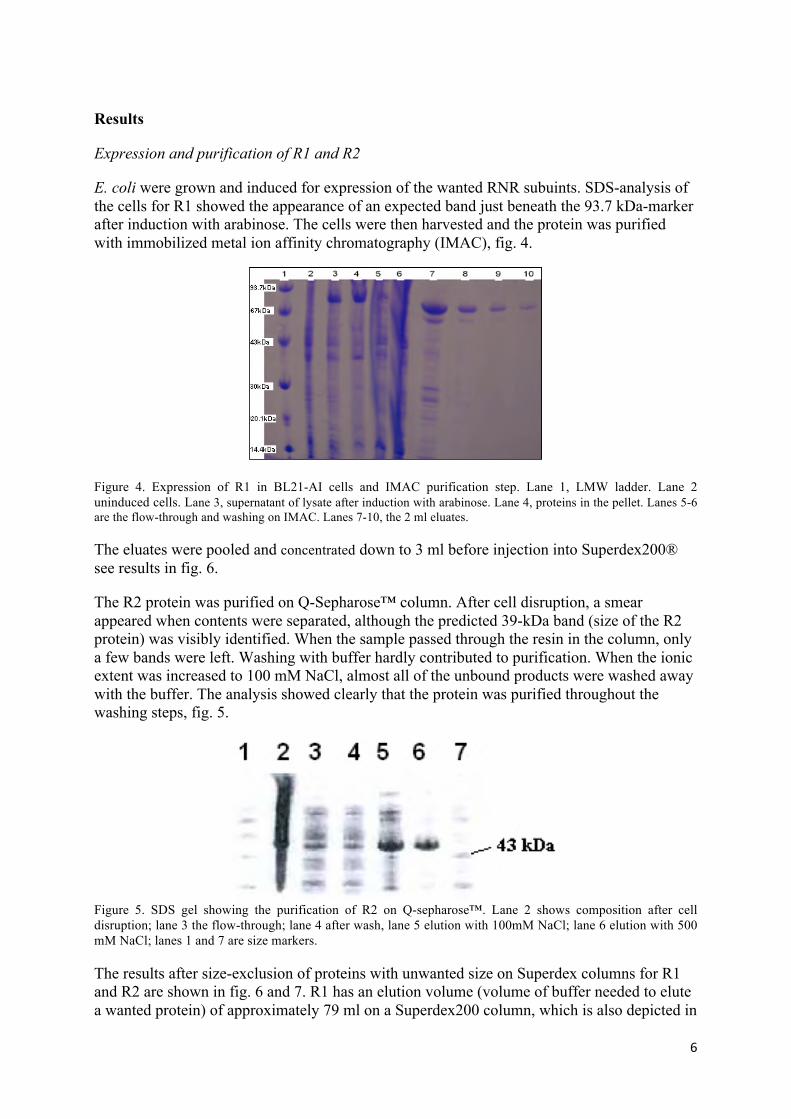
E. coli were grown and induced for expression of the wanted RNR subuints. SDS-analysis of the cells for R1 showed the appearance of an expected band just beneath the 93.7 kDa-marker after induction with arabinose. The cells were then harvested and the protein was purified with immobilized metal ion affinity chromatography (IMAC), fig. 4.
Figure 4. Expression of R1 in BL21-AI cells and IMAC purification step. Lane 1, LMW ladder. Lane 2 uninduced cells. Lane 3, supernatant of lysate after induction with arabinose. Lane 4, proteins in the pellet. Lanes 5-6 are the flow-through and washing on IMAC. Lanes 7-10, the 2 ml eluates.
The eluates were pooled and concentrated down to 3 ml before injection into Superdex200® see results in fig. 6.
The R2 protein was purified on Q-Sepharose™ column. After cell disruption, a smear appeared when contents were separated, although the predicted 39-kDa band (size of the R2 protein) was visibly identified. When the sample passed through the resin in the column, only a few bands were left. Washing with buffer hardly contributed to purification. When the ionic extent was increased to 100 mM NaCl, almost all of the unbound products were washed away with the buffer. The analysis showed clearly that the protein was purified throughout the washing steps, fig. 5.
Figure 5. SDS gel showing the purification of R2 on Q-sepharose™. Lane 2 shows composition after cell disruption; lane 3 the flow-through; lane 4 after wash, lane 5 elution with 100mM NaCl; lane 6 elution with 500 mM NaCl; lanes 1 and 7 are size markers.
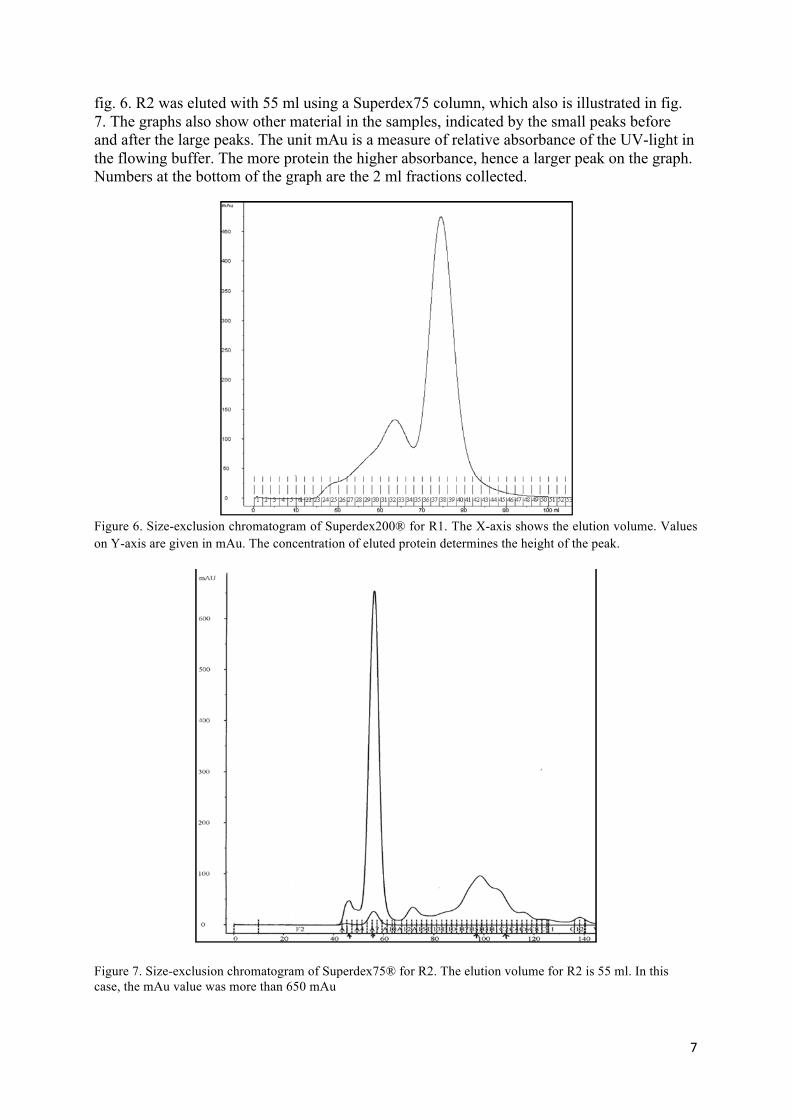
The results after size-exclusion of proteins with unwanted size on Superdex columns for R1 and R2 are shown in fig. 6 and 7. R1 has an elution volume (volume of buffer needed to elute a wanted protein) of approximately 79 ml on a Superdex200 column, which is also depicted in
7
fig. 6. R2 was eluted with 55 ml using a Superdex75 column, which also is illustrated in fig. 7. The graphs also show other material in the samples, indicated by the small peaks before and after the large peaks. The unit mAu is a measure of relative absorbance of the UV-light in the flowing buffer. The more protein the higher absorbance, hence a larger peak on the graph. Numbers at the bottom of the graph are the 2 ml fractions collected.
Figure 6. Size-exclusion chromatogram of Superdex200® for R1. The X-axis shows the elution volume. Values on Y-axis are given in mAu. The concentration of eluted protein determines the height of the peak.
Figure 7. Size-exclusion chromatogram of Superdex75® for R2. The elution volume for R2 is 55 ml. In this case, the mAu value was more than 650 mAu
8
Activity of aggregated R1
Fraction no 32 from the small peak shown in fig. 6 was isolated and assumed to be aggregated R1 protein. When the urea concentration was increased to 6 M, the absorbance was measured and the protein was tested under same conditions as the native protein while performing the assay, and showed to be totally inactive.
Results IC50 calculations
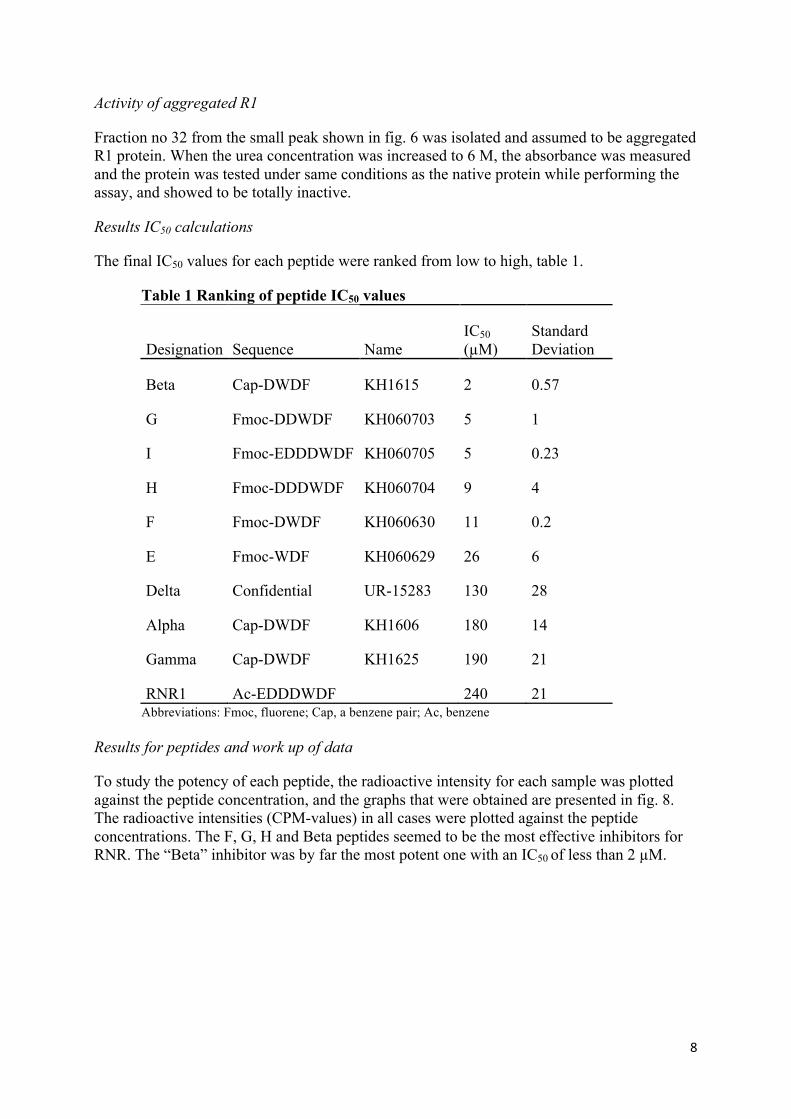
The final IC50 values for each peptide were ranked from low to high, table 1.
Table 1 Ranking of peptide IC50 values
Designation Sequence Name IC50 (µM)
Standard Deviation
Beta Cap-DWDF KH1615 2 0.57
G Fmoc-DDWDF KH060703 5 1
I Fmoc-EDDDWDF KH060705 5 0.23
H Fmoc-DDDWDF KH060704 9 4
F Fmoc-DWDF KH060630 11 0.2
E Fmoc-WDF KH060629 26 6
Delta Confidential UR-15283 130 28
Alpha Cap-DWDF KH1606 180 14
Gamma Cap-DWDF KH1625 190 21
RNR1 Ac-EDDDWDF 240 21 Abbreviations: Fmoc, fluorene; Cap, a benzene pair; Ac, benzene
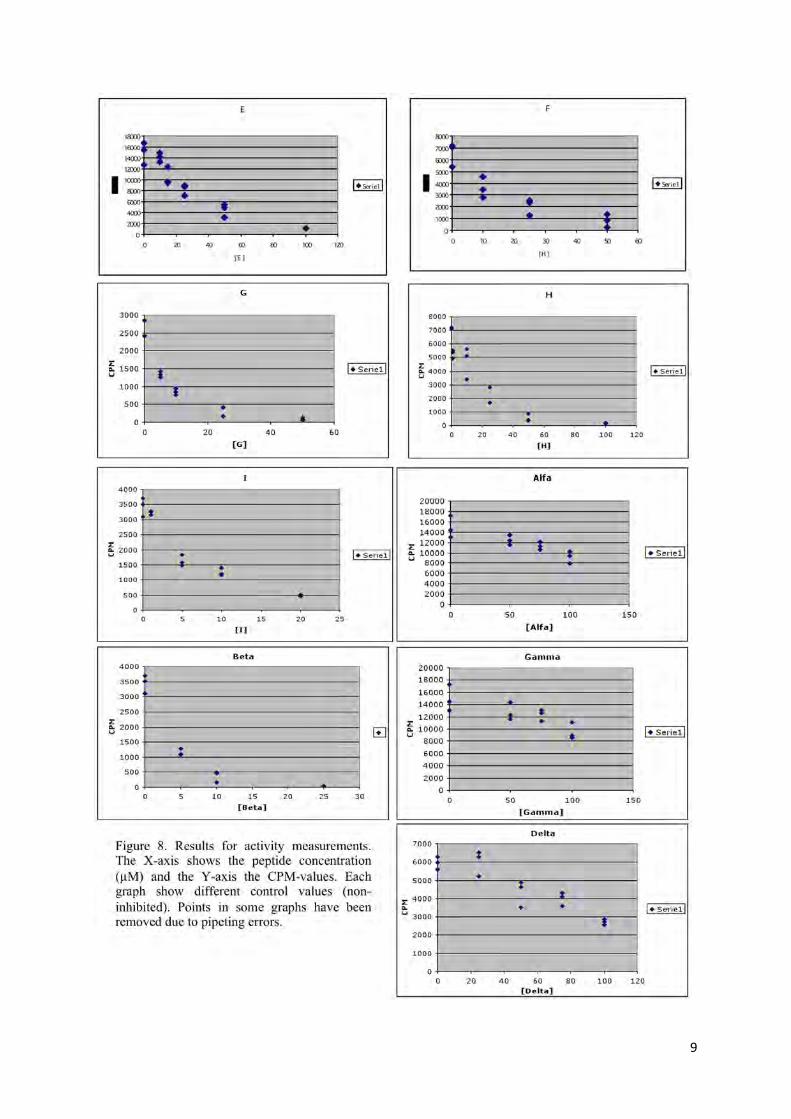
Results for peptides and work up of data
To study the potency of each peptide, the radioactive intensity for each sample was plotted against the peptide concentration, and the graphs that were obtained are presented in fig. 8. The radioactive intensities (CPM-values) in all cases were plotted against the peptide concentrations. The F, G, H and Beta peptides seemed to be the most effective inhibitors for RNR. The “Beta” inhibitor was by far the most potent one with an IC50 of less than 2 µM.
9
10
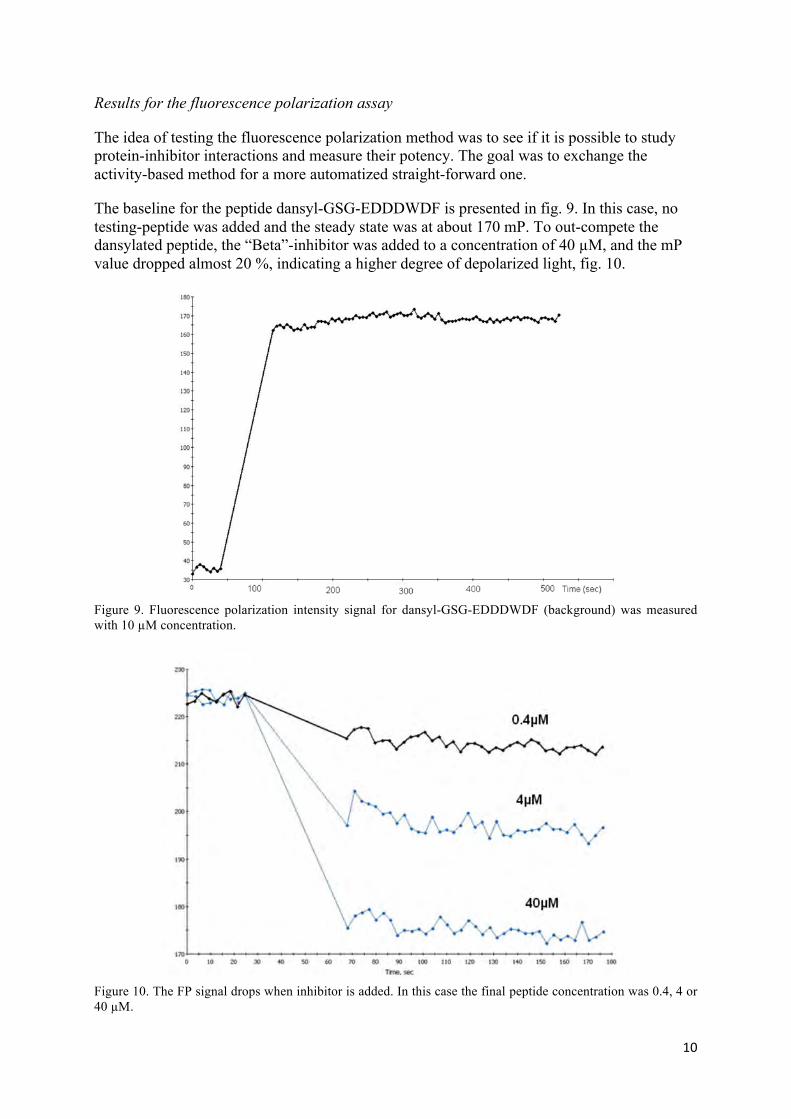
Results for the fluorescence polarization assay
The idea of testing the fluorescence polarization method was to see if it is possible to study protein-inhibitor interactions and measure their potency. The goal was to exchange the activity-based method for a more automatized straight-forward one.
The baseline for the peptide dansyl-GSG-EDDDWDF is presented in fig. 9. In this case, no testing-peptide was added and the steady state was at about 170 mP. To out-compete the dansylated peptide, the “Beta”-inhibitor was added to a concentration of 40 µM, and the mP value dropped almost 20 %, indicating a higher degree of depolarized light, fig. 10.
Figure 9. Fluorescence polarization intensity signal for dansyl-GSG-EDDDWDF (background) was measured with 10 µM concentration.
Figure 10. The FP signal drops when inhibitor is added. In this case the final peptide concentration was 0.4, 4 or 40 µM.

11
Discussion
Nature of the R2 binding pocket on R1and properties of the peptides
According to the results, the Beta, G, I and H peptides were most potent in terms of inhibition of R1. The structures for the tetrapeptides Beta and Alpha are identical, with the exception of a bridge between the benzene rings (fluorene) of the added groups on the peptide N-termini. Removal of the bridge increased the IC50 value almost hundredfold, as in the comparison between Beta and Alpha. In practice, this would probably mean that the more rigid structure of the bridged benzene rings leads to an induced-fit type of mechanism, which potentially anchors the group into the R2 binding pocket of R1. In contrast, the more flexible un-bridged rings in the same case would adapt more or less to the environment of the pocket and could dissociate easily, hence the increased IC50 value. The Gamma peptide has only one benzene ring and is slightly worse in inhibition than Alpha.
The G and I peptides (cis-confirmation of the added fluorine group) had the same IC50 value of 5 µM, even though I peptide is elongated with an addition of glutamic acid and phenylalanine at the N-terminus. When the benzene pair was turned to the trans-confirmation and an aspartic acid was added at the N-terminus instead, the potency decreased to almost half, as for the H peptide. At this stage, no conclusion can be made whether it is the change of confirmation or the addition of an extra amino acid that contributes to decreased potency. It is not unreasonable, though, to suggest the possibility that the whole peptide would rotate so that the benzene pair would bind in precisely the same sterical way as for the mechanism proposed for binding of the Beta peptide. However, this is even more evident when the F peptide is taken in consideration. This peptide has a six-fold higher IC50 value than Beta, and the only difference is the confirmation of the benzene group, which is rotated into the cis-confirmation.
Expression and purification of R1
Expression of R1 was difficult in this study because of its tendency to aggregate. At the same time as high yield is wanted it was important to keep the expression at a fairly low level, so aggregation was avoided as much as possible. Optimal conditions for R1 expression seemed to be induction at room temp for 3.5 h. In addition, the temperature had to drop down to room temp after the 37°C incubation before arabinose was added, which means that cultures had to be incubated at room temp for at least 15-20 min. This might slow down the folding rate, hence avoiding improperly folded protein.
The attempt to refold aggregated R1 protein failed totally even with 6 M urea. It seems like the concentration of urea in this case did not affect the refolded state – at least not with the short incubation time performed in this experiment. Incubation with urea needs to be tested for a longer period, and also increasing the urea concentration directly in the lysate before purification should be tested.
Drawbacks in the assay
The assay performed in this experiment had some flaws. The method is very sensitive and time-consuming. The most important problem is that the method cannot be used to measure activity at really low peptide concentrations (pM). This is due to the high enzyme concentrations: The concentration of the enzyme is almost 14 µM in the final reaction, which is too high in comparison to IC50 values below 14 µM (such as peptide Beta). In contrast, the radioactive intensity drops quite dramatically when inhibition is extremely effective, which in

12
turn may increase the rate of error when counting, and consequently generate misleading results. The real IC50 value for an inhibitor might be much lower than the apparent value obtained from the calculations based on this assay.
The ionic strength may affect the interaction between the peptide and the enzyme, but also the enzyme-enzyme interaction. The Na2SO4 concentration was about 20 mM, which could shield the charged residues on the peptides, and thereby interfere with the interaction. With increased ionic strength, the ineffectiveness of the peptide would increase which in turn would generate too low or inaccurate IC50 values. The experiment need to be repeated with lower ionic strength.
Calculation of IC50 values using Excel
The application of Excel in terms of determining IC50-values has been debated [9]. Bugs in the program, and errors in the calculation performed by Solver® were constantly returning issues also in this experiment. The calculated IC50 values could vary for the same set of data, from one calculation to the other. However, the differences were always the same – one had to choose between the lower or higher (~10x) value calculated. The repeated experiments decided which one was the correct. This is why I suggest a more sophisticated program to be used, e.g. GraphPad Prism®, when performing non-linear regression analysis of datasets.
Application of fluorescence polarization method
The fluorescence polarization yielded impressive results. The dansyl-tagged peptide could be outcompeted for the binding of R1 when the Beta-peptide was added, and the output difference was clearly shown as an increase in the level of polarized light. In practice, this mean that the peptide bound to the R2 C-term binding pocket of R1, resulting in the release of the dansyl-tagged peptide.
With respect to the activity assay, fluorescence polarization really increases the probability of obtaining reliable results, because all of the substances needed for the reaction in the activity assay to take place (ATP, R2, metal ions, substrate, reducing agents…) are by-passed, not mentioning the time saved and reduction of pipetting errors.
Conclusion
It is clear that the confirmation of the N-terminus benzene rings have highest affect on binding to the R2 binding pocket of R1. The amino groups of the peptides have in this case very small influence on the potency of each inhibiting peptide. As proposed, the peptide can be rotated so that the rigid structure of the bridged benzene rings can be fitted into the cavity that makes up the inner part of the pocket. Although, one coming feature that is shared by all peptides is that the C-terminal amino acids have aromatic side chains, tryptophan and phenylalanine. This indicates that the outer volume of the cavity in the pocket needs to be filled with bulky, composed, groups, such as the amino acids mentioned. Moreover, the N-terminal residues are among the smallest amino acids, namely glutamic and aspartic acids. The conclusion is that the inner part of the pocket is, in comparison to the outer part, smaller in space and the volume taken up by the bridged benzene pair determines the borderlines for how big the space is in farthest inside. This could doubtless help in the design of drugs that can cure TBC.

13
Materials and Methods
Expression and purification of R1
E. coli BL21-AI (Invitrogene™ or in-house) chemically competent cells were transformed with 0.5 µl 210 ng/µl plasmid by heat shock at 42°C for 35 seconds. The cells were then spread on an LB plate (1% tryptone, 0.5% yeast extract, 1% NaCl, 1.5% Bacto agar with 50 µg/ml ampicillin (Amp)) and incubated over night at 37°C. Some 5-6 colonies were transferred to a 15 ml incubation tube containing 1 ml LB (same as above except agar) and 1 µl 50 mg/ml Amp. Tubes were shaken and incubated at 37°C until OD600 had reached 1. A 400 µl aliquot was transferred to an E-flask with 20 ml LB and 20 µl 50 mg/ml Amp and incubated at 37°C until the optical density (OD600) had reached 1. For the 1 L culture, 20% LB was used as growth and induction medium: 200 ml LB, 800 ml M9 salts, 20 ml 20% glucose, 2 ml 1 M MgSO4, 100 µl 1 M CaCl2 and 1 ml 50 mg/ml Amp. The flask was incubated at 37°C until OD was between 0.5 and 1. The flask was then transferred to room temp, and expression was induced with 2 g L-arabinose for 3-4 h. After expression, the cells were harvested by centrifugation 4600 x g for 20 min at 4°C. The supernatant was discarded and the pellet was washed with 20 ml 1xSSP buffer (50 mM Tris-HCl pH 7.8, 150 mM NaCl, 1% Nonidet P-40) and then transferred to a 50 ml Falcon™ tube followed by centrifugation at 4200 x g in 20 min. The pellet was dissolved in lysis buffer: 50 mM NaH2PO4, 300 mM NaCl, 10 mM imidazole and 10 % glycerol pH 8. Lysozyme (1 mg/ml), DNase (20 mg/ml) and RNase (10 mg/ml) were added, and the cells were incubated at room temp for 10 min, followed by mechanical lysis using a cell disrupter at 2 bar. Phenylmethanesulphonylfluoride (PMSF) and β-mercaptoethanol, of final concentrations of 0.1 mM and 5 mM respectively, were added to the lysate immediately after disruption. The lysate was then transferred to a centrifugation tube, and centrifuged at 10 000 x g for 20 min. The protein in the supernatant (SN) was purified using immobilized metal ion affinity chromatography (IMAC). The SN was incubated with 2 ml Ni-resin for 20 min at room temperature (rt), then washed with 20 ml 50 mM NaH2PO4, 300 mM NaCl, 10 mM imidazole, pH 8.0 followed by elution step with 4 ml of the same buffer with increased imidazole to 250 mM. Buffer exchange was performed on a PD-10 column (Amersham Biosciences, PD-10 Desalting column) with 50 mM Hepes pH 7.2. Finally, the protein was purified by size-exclusion on a Superdex200 column (Hi-load™) with the same buffer. The protein was precipitated with 0.5 g NH4SO4 / ml protein and stored at 4°C.
Purification of R2
In case of R2, the pellet was dissolved in 20 mM 2-(N-morpholino) ethanesulfonic acid (MES), 10 mM ammonium sulfate pH 6.0 and dialysed against the same buffer for 1.5 h using 1.7 ml/cm 12 kDa tube. Ion exchange chromatography was performed on a Q-sepharose™ (Amersham Biosciences®) column and the sample was finally purified by size-exclusion chromatography on Superdex75™ column (Hi-Load™) with 50 mM Hepes.
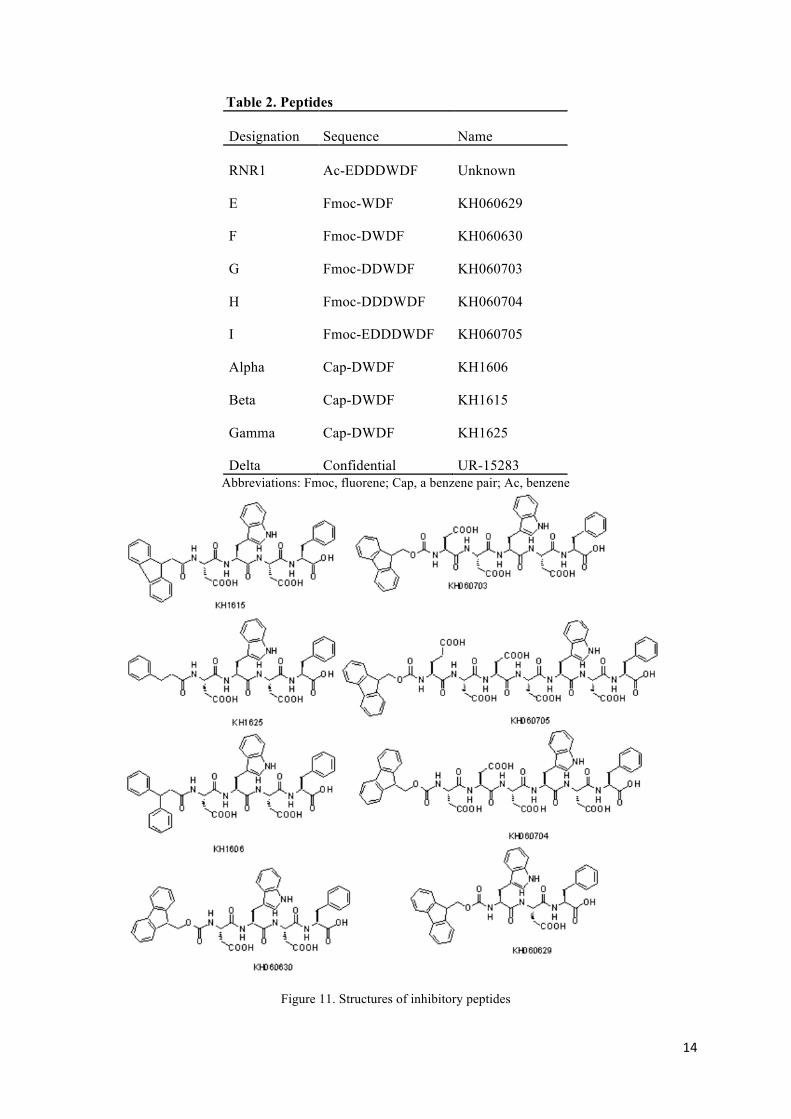
Peptides
All inhibitory peptides used in this experiment are presented in table 2. All sequences and the N-terminal modifications are shown, except for the Delta-peptide. The modifications at the N-terminal are designated Ac (benzene), Fmoc (fluorene ) or Cap (a benzene pair). The same designation could represent several isomeric confirmations of the same group. Representative structures of the peptides are shown in fig. 11.
14
Table 2. Peptides
Designation Sequence Name
RNR1 Ac-EDDDWDF Unknown
E Fmoc-WDF KH060629
F Fmoc-DWDF KH060630
G Fmoc-DDWDF KH060703
H Fmoc-DDDWDF KH060704
I Fmoc-EDDDWDF KH060705
Alpha Cap-DWDF KH1606
Beta Cap-DWDF KH1615
Gamma Cap-DWDF KH1625
Delta Confidential UR-15283 Abbreviations: Fmoc, fluorene; Cap, a benzene pair; Ac, benzene
Figure 11. Structures of inhibitory peptides
15
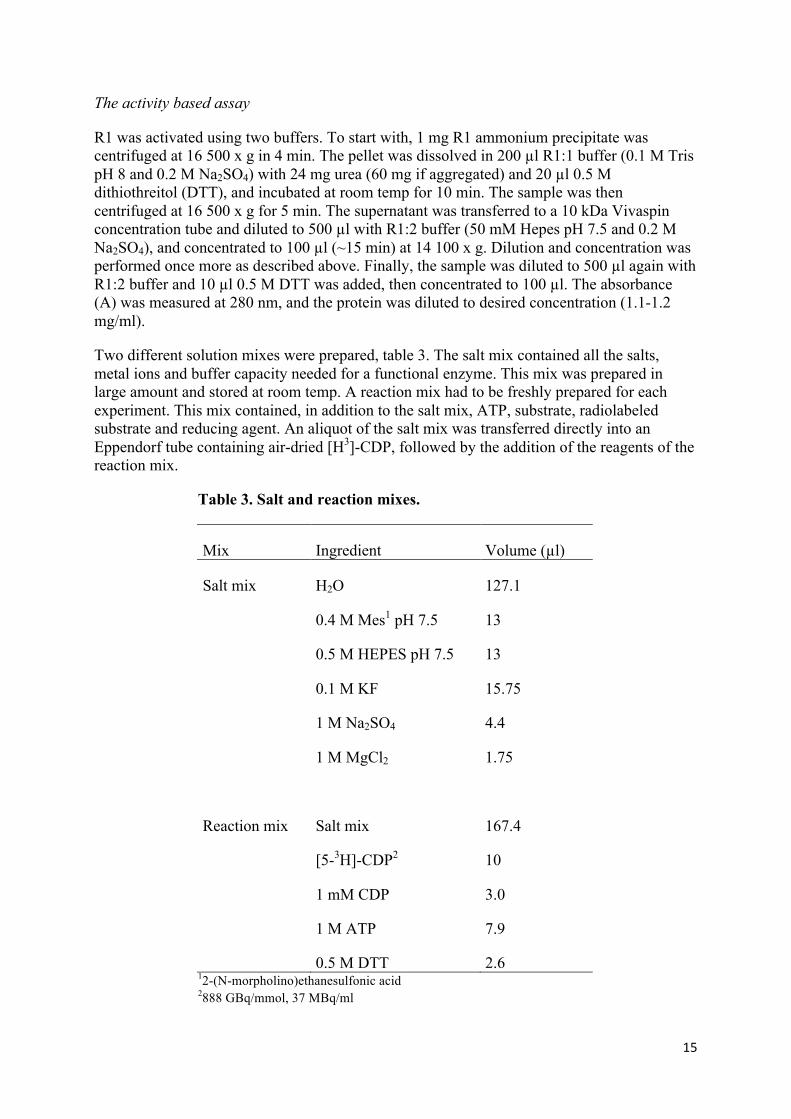
The activity based assay
R1 was activated using two buffers. To start with, 1 mg R1 ammonium precipitate was centrifuged at 16 500 x g in 4 min. The pellet was dissolved in 200 µl R1:1 buffer (0.1 M Tris pH 8 and 0.2 M Na2SO4) with 24 mg urea (60 mg if aggregated) and 20 µl 0.5 M dithiothreitol (DTT), and incubated at room temp for 10 min. The sample was then centrifuged at 16 500 x g for 5 min. The supernatant was transferred to a 10 kDa Vivaspin concentration tube and diluted to 500 µl with R1:2 buffer (50 mM Hepes pH 7.5 and 0.2 M Na2SO4), and concentrated to 100 µl (~15 min) at 14 100 x g. Dilution and concentration was performed once more as described above. Finally, the sample was diluted to 500 µl again with R1:2 buffer and 10 µl 0.5 M DTT was added, then concentrated to 100 µl. The absorbance (A) was measured at 280 nm, and the protein was diluted to desired concentration (1.1-1.2 mg/ml).
Two different solution mixes were prepared, table 3. The salt mix contained all the salts, metal ions and buffer capacity needed for a functional enzyme. This mix was prepared in large amount and stored at room temp. A reaction mix had to be freshly prepared for each experiment. This mix contained, in addition to the salt mix, ATP, substrate, radiolabeled substrate and reducing agent. An aliquot of the salt mix was transferred directly into an Eppendorf tube containing air-dried [H3]-CDP, followed by the addition of the reagents of the reaction mix.
Table 3. Salt and reaction mixes.
Mix Ingredient Volume (µl)
Salt mix H2O 127.1
0.4 M Mes1 pH 7.5 13
0.5 M HEPES pH 7.5 13
0.1 M KF 15.75
1 M Na2SO4 4.4
1 M MgCl2 1.75
Reaction mix Salt mix 167.4
[5-3H]-CDP2 10
1 mM CDP 3.0
1 M ATP 7.9
0.5 M DTT 2.6 12-(N-morpholino)ethanesulfonic acid2888 GBq/mmol, 37 MBq/ml

16
Aliquots of the reaction mix were pipetted into Eppendorf tubes, and peptide (dissolved in 50 mM Hepes or DMSO) was added in different concentrations (between 5 and 200 µM depending on the range for each peptide) with 14 µM R1 and 25 µM R2. The final reaction tube contained:
59.5 µl reactionmix, 14 µl peptide, 7µl R1 and 7 µl R2 in 87.5 µl
Peptides dissolved and diluted in DMSO due to poor solubility (I, Alfa, Beta, Gamma and Delta) resulted in a DMSO concentration of 2.5% in the final reaction.
The R2 concentration (~1.5 mg/ml) was about two times the R1 concentration (~1.1 mg/ml). As negative control, no R2 or peptide was added to the sample. For positive control, the peptide was omitted. The reaction mix was aliquoted into three tubes with 25 µl. All reaction tubes were incubated at 37°C in water a bath for 45 min. Columns were packed with 3 ml Dowex® resin (Sigma-Aldrich®) (cation exchanger) and capped with a thick membrane to immobilize the resin. The resin was equilibrated with 0.2 M acetic acid (HAc).
After incubation, 200 µl 1 M perchloric acid (PCA) was added to the samples, followed by 10 min of boiling to hydrolyse dCDP to dCMP. The acid was then neutralized with 70 µl 4 M KOH with phenol red for pH indication. Samples were vortexed and centrifuged at 16 500 x g for 5 min and 236 µl of the supernatant, with equal volume of HAc, was added on top of the Dowex® resin until it had been sucked in. The walls of the columns were then washed with 500 µl HAc. CMP was eluted with 42 ml HAc, discarded, and dCMP was eluted with 2 ml HAc. A volume of 1 ml from the eluate was transferred to a scintillation vial containing 10 ml scintillation fluid, and shaken. Radioactive intensity (CPM value) was measured for each sample.
Raw data (CPM values) were fed into an MS® Excel sheet; the background was subtracted and the radioactivity was plotted against the peptide concentration, see example in fig 12. The points were further inserted in an equation system in Excel, and the IC50-values were finally calculated with the Solver-application. The calculation was based on a non-linear regression analysis for noncompetitive inhibition.
Figure 12. Plot illustrating the relation between CPM and peptide concentration. Each concentration is tested in triplicates.

17
Excel was programmed to fit a curve using Y = (High-Low)/(1+(X/IC50))+Low, where Y and X are the coordinates fitting the curve, High and Low are the algorithms used by the program and IC50 is the solved IC50 value. In addition, degrees of freedom, correlation and R2 are taken in consideration, see reference [1] for details.
Fluorescence polarization assay
The assay was performed on a 96-well plate using the instrument Envision®. The fluorescence polarization (FP) signal was measured in mixes containing 0.25 µM, 1 µM and 10 µM C-term dansyl-labeled peptide with an R1 concentration of 1 µM, in 0.05 % Triton X-100. The labeled peptide was equilibrated in buffer for 2 min before R1 was added, and the mP signal (measures the change in depolarization/directionality of the emitted light) was measured up to 10 min. In the displacement assay, inhibitor Beta was added in the concentrations of 0.4 µM, 4 µM and 40 µM, and the kinetics were observed in real-time.

18
References
1. Agus M. brown (2001) Nonlinear regression analysis using a spreadsheet, Comp. Prof. Meth. Biomed., 65, 191-200
2. Dooley, S. W., Jarvis, W. R., Martone, W. J. & Snider, D. E., Jr. (1992). Multidrug-resistant tuberculosis. Ann Intern Med 117, 257-9
3. Dye C. (2006). Global epidemilogy of tuberculosis. Lancet 367, 938-40
4. Fisher A, Yang F D, Rubin H, Cooperman B S (1993) R2 C-terminal peptide Inhibition of Mammalian and Yeast Ribonucleotide Reductase, J. Med. Chem. 36, 3859-3862
5. Fude Y, Curran S C, Li L S, Avarbock D, Graf J D, Chua M M, Lu G, Salem J, Rubin H (1997) Characterization of Two Genes Encoding the Mycobacterium tuberculosis Ribonucleotide Reductase Small subunit, Journal of Bacteriology, 179.20, 6408-6415
6. Gregory C. Lavallée P, Rakhit S, Plante R, Gaudette Y, Lawetz C, Whitehead P W, Duceppe J-S, Lépine-Frenette C, Dansereau N, Guilbault C, Langelier Y, Gaudreau P, Thelander L, and Guindon Y (1990) Specific inhibition of ribonucleotide reductase by peptides corresponding to the C-terminal of their second subunit, Biochemical Cell biology, 69, 79-83
7. Kazuaki Kakehi, Faculty of Pharmaceutical Sciences, Kinki University Illustration adopted from Glycotechnology,
8. Kochi, A., Vareldzis, B. & Styblo, K. (1993). Multidrug-resistant tuberculosis and its control. Res Microbiol 144, 104-10
9. McCullough B D, Willson B(1999) On the accuracy of statistical procedures in Microsoft Excel 97. Computational Statistics and Data Analysis 31, 27-37
10. Nurbo J, Roos AK, Muthas D, Wahlström E, Ericsson DJ, Lundstedt T, Unge T, Karlén A (2007) Design, synthesis and evaluation of peptide inhibitors of Mycobacterium tuberculosis ribonucleotide reductase, Journal of Peptide Science, 10, 1002
11. Ragnar N (2007) Tuberkulos fortfarande ett aktuellt hot i Sverige, WWW-document nr 5 2005: http://www.smittskyddsinstitutet.se/smittskydd/arkiv/test/tuberkulos-fortfarande-ett-aktuellt-hot-i-sverige/. Downloaded 2008-01
12. Snider, D. E., Jr. & Roper, W. L. (1992). The new tuberculosis. N Engl J Med 326, 703-5
13. Stephanie S, Warner D F, Tsenova L, Timm J, McKinney J D, Kaplan g, Rubin H, Mizrahi1 V (2003) Ribonucleotide Reduction in Mycobacterium tuberculosis: function and Expression of Genes Encoding Class Ib and Class II Ribonucleotide Reductases, American Society for Microbiology, 71.11, 6124-6131
14. Uppsten M, Davis J, Rubin H, Uhlin U (2004) Crystal structure of the biologically active form of class Ib ribonucleotide reductase small subunit from Mycobacterium tuberculosis, FEBS letters, 569, 117-122

19
15. Uppsten M, Färnegårdh M, Domkin V, Uhlin U,(2006) The first Holocomplex Structure of Ribonucleotide Reductase Gives New Insight into its Mechanism of Action, J. Mol. Biol. 359, 365-377