biological opportunities for alberta
TRANSCRIPT

Submitted to Kirk Andries Climate Change and Emission Management Corporation,
Operational Management Group
Karen Haugen-Kozyra, M.Sc., P.Ag. KHK Consulting Milo Mihajlovich, RPF, Incremental Forest Technologies Ltd.
March 31, 2010
Spring ‘10
Biological Opportunities for Alberta

2
Table of Contents Executive Summary ............................................................................................................ 3 Introduction ......................................................................................................................... 5 Methodology ....................................................................................................................... 6
Quantification Protocols ................................................................................................. 6 Technical Potential for Mitigation Options in Alberta ....................................................... 7
Agriculture Sector Estimates using Accepted Quantification Protocols ........................ 7 Forestry Sector Estimates using Developmental Quantification Protocols .................... 8 Waste to Energy ............................................................................................................ 10 BioChar/BioCoal........................................................................................................... 10 Waste Sector Estimates based on Projects on the Alberta Offset System Registry ...... 11 GHG Reduction Type ..................................................................................................... 12
External National Estimates of Biological Mitigation for Alberta ................................... 12 The Federal Government’s Turning the Corner Climate Change Plan (2007) ............. 12 BIOCAP Canada Estimates of Biological Mitigation Potentials .................................. 13
Future Options .................................................................................................................. 14 Mountain Pine Beetle .................................................................................................... 14 Material Switching/BioProducts: .................................................................................. 16
Conclusions ....................................................................................................................... 16
Appendix I - Improved Forest Management Estimates………………………………….18
Appendix II –Conifer Afforestation Estimates ................................................................. 20 Appendix III –Short Rotation Intensive Culture (SRIC) Afforestation Estimates ........... 21

3
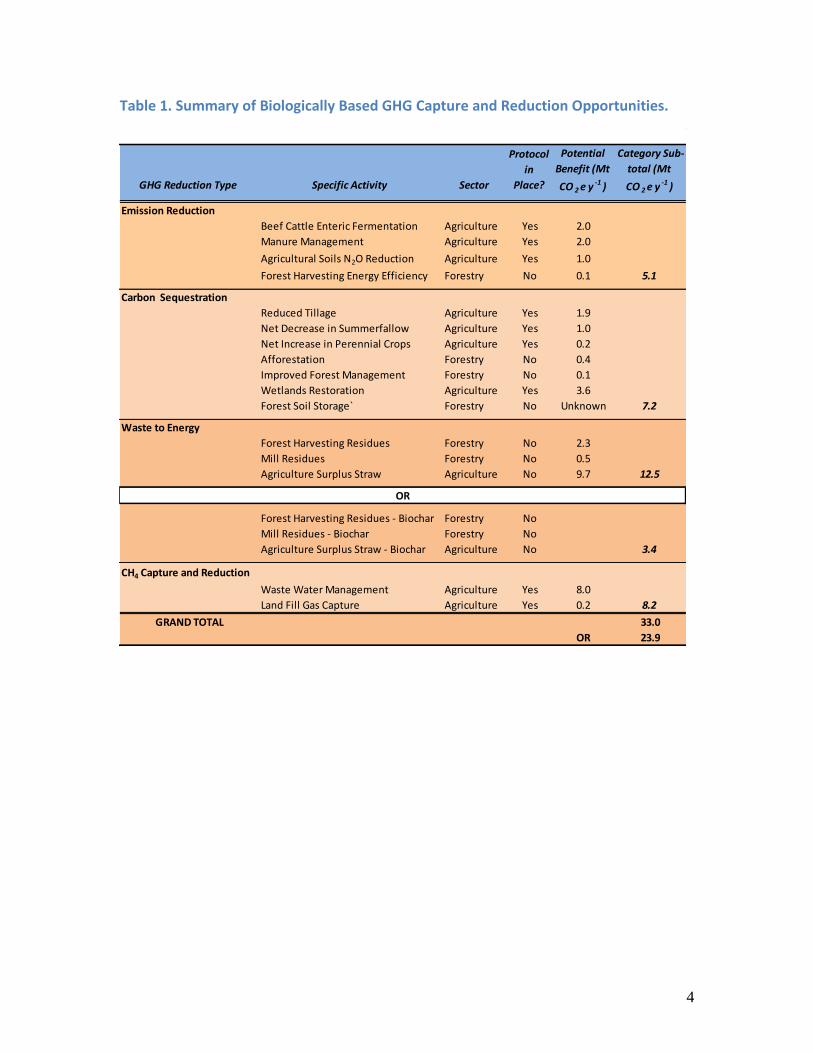
Executive Summary This document was produced at the request of the Climate Change and Emissions Management Corporation (CCEMC). It examines the potential for emissions management and capture around Alberta’s core biologically based industries – agriculture and forestry. There have been numerous estimates of bio-capture of greenhouse gases (GHG’s) produced for Alberta; including studies by BIOCAP, internal feasibility studies for the Government of Alberta, and others. These studies, while quite diverse in approach, have all shared a focus of relying on projections not necessarily founded on the same quantification methods as the Alberta’s Offset System Quantification Protocols. The set of Protocols accepted for use by the Government of Alberta in the Offset System, are particularly rigorous in ensuring emission reduction and offset quantifications are “additional”, that is, they go beyond business as usual in Alberta’s forest and agriculture industries current state of carbon biocapture and management. This quantification was guided by the need to ensure any reductions or offsets estimated were truly additional. For example, all estimates for reductions or offsets for which protocols exist were quantified empirically by applying the appropriate protocol to estimates of the impact of changed behavior. This approach was useful for agriculture estimates due to the availability of protocols. In the case of forestry and wetlands, conservation protocols currently under development for the Alberta Offset System were used. Table 1 shows potentials identified using this approach. In summary, the technical potential for Alberta’s biologically-based industries to capture and manage carbon stocks, ranges from 23.9 to 33 Mt CO2e per year. These numbers are within the conservative range of other estimates that have been compiled by the federal government under their Turning the Corner Climate Change Plan and BIOCAP’s analysis. As this document concludes, Alberta requires a next wave of greenhouse gas emission reduction and mitigation in order to meet the absolute targets of reduction by 2020 being contemplated in North America today. Biological capture and fuel replacement strategies are the most efficient mitigation options readily available to Alberta.
4
Table 1. Summary of Biologically Based GHG Capture and Reduction Opportunities.
GHG Reduction Type Specific Activity Sector
Protocol
in
Place?
Potential
Benefit (Mt
CO 2 e y -1 )
Category Sub-
total (Mt
CO 2 e y -1 )
Emission Reduction
Beef Cattle Enteric Fermentation Agriculture Yes 2.0
Manure Management Agriculture Yes 2.0
Agricultural Soils N2O Reduction Agriculture Yes 1.0
Forest Harvesting Energy Efficiency Forestry No 0.1 5.1
Carbon Sequestration
Reduced Tillage Agriculture Yes 1.9
Net Decrease in Summerfallow Agriculture Yes 1.0
Net Increase in Perennial Crops Agriculture Yes 0.2
Afforestation Forestry No 0.4
Improved Forest Management Forestry No 0.1
Wetlands Restoration Agriculture Yes 3.6
Forest Soil Storage` Forestry No Unknown 7.2
Waste to Energy
Forest Harvesting Residues Forestry No 2.3
Mill Residues Forestry No 0.5
Agriculture Surplus Straw Agriculture No 9.7 12.5
Forest Harvesting Residues - Biochar Forestry No
Mill Residues - Biochar Forestry No
Agriculture Surplus Straw - Biochar Agriculture No 3.4
CH4 Capture and Reduction
Waste Water Management Agriculture Yes 8.0
Land Fill Gas Capture Agriculture Yes 0.2 8.2
GRAND TOTAL 33.0
OR 23.9
OR

5
Introduction Blessed with abundant natural resources - fossil fuel deposits, high quality agricultural lands, substantial forest and natural areas - Alberta has used these to utmost advantage in creating a vibrant mix of export-oriented economic sectors, attracting world attention and global market demand. This economic success story brings with it significant greenhouse gas tradeoffs compounded by other factors, such as Alberta’s northern latitude and associated harsh winters with its consequent demands for energy consumption. These trade-offs are significantly impacting Alberta’s reputation abroad. The social, political and economic challenges Alberta currently faces with respect to Climate Change are unprecedented. Given this reality, and facing a likely North American reduction target of 17% below 2005 emission levels by 20201, Alberta must unleash a “Next Wave” of innovation and creativity, drawing on all of her skills and attributes, to meet the climate change challenge. Alberta’s Climate Change Strategy sets out a roadmap designed to achieve a more sustainable, less carbon intensive energy sector by 2050. It is primarily based on greening Alberta’s energy sector and diversifying energy sources to cleaner technologies, as well as improving use and conservation of energy. However, other sectors can contribute to de-intensifying Alberta’s carbon footprint - through utilizing our inherent green advantage of vast forests, agricultural and natural lands and making better use of waste streams. This involves enhancing nature’s pathways for biological capture and storage, as well as managing forestry and agricultural inputs more wisely to reduce greenhouse gas emissions. Indeed, we must mobilize all our options to meet the challenge. This paper explores the technical potential for biological mitigation options in Alberta to determine the most promising areas for strategic investment and further investigation. The analysis is at a high-level, but features a more realistic set of estimates than previous reports of this nature, primarily because the calculations are based on quantification tools that are accepted or being drafted for the Alberta government for Offset quantification. Where other tools are used to quantify the potential, they are indicated in the report. Other options that have not been confidently quantified are included in the last section as meriting further investigation.
1 Canada’s endorsement of the targets set out in the non-binding Copenhagen Accord. Similar to the
United States. Alberta’s current Climate Change Strategy sets targets for an absolute reduction of 14% by
2050 from an average of 2003-2005 levels.
6
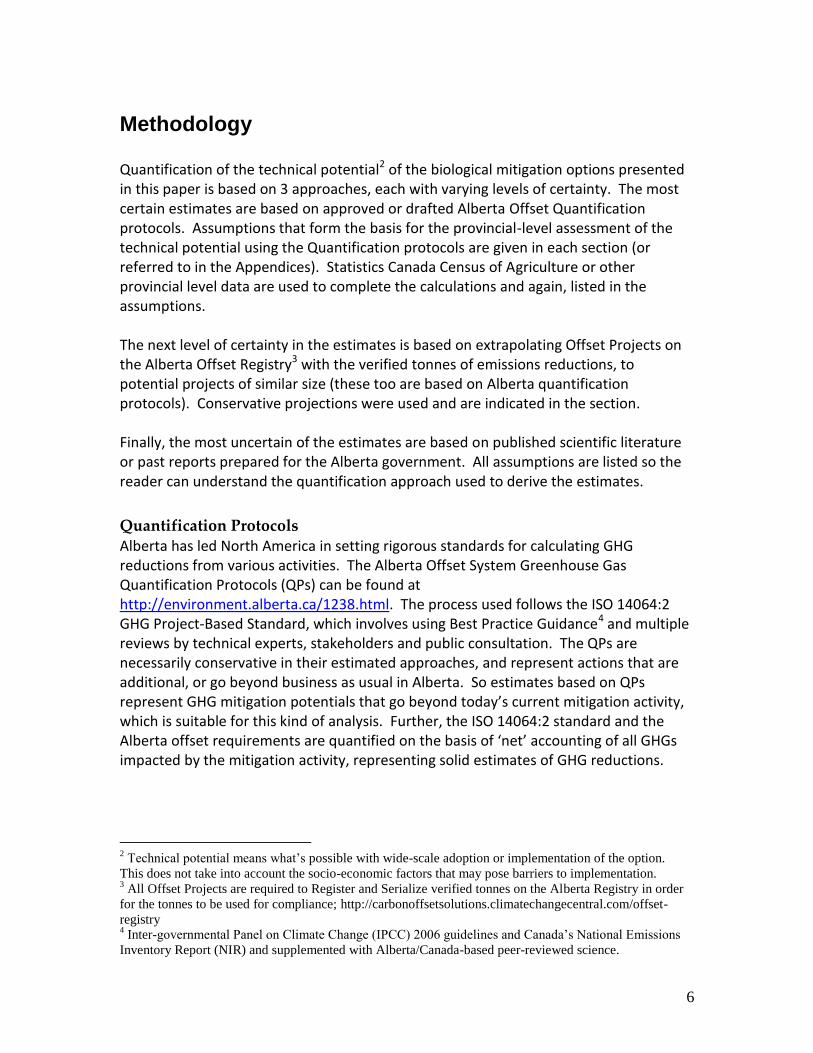
Methodology Quantification of the technical potential2 of the biological mitigation options presented in this paper is based on 3 approaches, each with varying levels of certainty. The most certain estimates are based on approved or drafted Alberta Offset Quantification protocols. Assumptions that form the basis for the provincial-level assessment of the technical potential using the Quantification protocols are given in each section (or referred to in the Appendices). Statistics Canada Census of Agriculture or other provincial level data are used to complete the calculations and again, listed in the assumptions. The next level of certainty in the estimates is based on extrapolating Offset Projects on the Alberta Offset Registry3 with the verified tonnes of emissions reductions, to potential projects of similar size (these too are based on Alberta quantification protocols). Conservative projections were used and are indicated in the section. Finally, the most uncertain of the estimates are based on published scientific literature or past reports prepared for the Alberta government. All assumptions are listed so the reader can understand the quantification approach used to derive the estimates.
Quantification Protocols Alberta has led North America in setting rigorous standards for calculating GHG reductions from various activities. The Alberta Offset System Greenhouse Gas Quantification Protocols (QPs) can be found at http://environment.alberta.ca/1238.html. The process used follows the ISO 14064:2 GHG Project-Based Standard, which involves using Best Practice Guidance4 and multiple reviews by technical experts, stakeholders and public consultation. The QPs are necessarily conservative in their estimated approaches, and represent actions that are additional, or go beyond business as usual in Alberta. So estimates based on QPs represent GHG mitigation potentials that go beyond today’s current mitigation activity, which is suitable for this kind of analysis. Further, the ISO 14064:2 standard and the Alberta offset requirements are quantified on the basis of ‘net’ accounting of all GHGs impacted by the mitigation activity, representing solid estimates of GHG reductions.
2 Technical potential means what’s possible with wide-scale adoption or implementation of the option.
This does not take into account the socio-economic factors that may pose barriers to implementation. 3 All Offset Projects are required to Register and Serialize verified tonnes on the Alberta Registry in order
for the tonnes to be used for compliance; http://carbonoffsetsolutions.climatechangecentral.com/offset-
registry 4 Inter-governmental Panel on Climate Change (IPCC) 2006 guidelines and Canada’s National Emissions
Inventory Report (NIR) and supplemented with Alberta/Canada-based peer-reviewed science.

7
Technical Potential for Mitigation Options in Alberta Biological systems can significantly reduce carbon dioxide emission impacts on climate. The IPCC 4th Assessment Report, Chapter 8 indicates that globally, if the agriculture and forestry sectors were mobilized at a price of carbon of $50/tonne (economic potential), over 50% of the manmade fossil fuel emissions could be removed from the atmosphere on an annual basis - simply by carbon sequestration in soils, forests and other biological systems (over 3 Gt of CO2e emissions per year).
Agriculture Sector Estimates using Accepted Quantification Protocols Estimates in Table 1 are calculated using the quantification methodologies in the QPs, combined with Statistics Canada Census information and other activity data sources to determine the provincial level potential. They represent the technical potential of the options, and are based on additional actions to today’s current mitigation activity. Table 1. GHG Reduction activities and their potentials.
Potential
GHG Reductions
Total
GHG Reduction Type (Mt CO2e yr-1
) Notes (%)
1) Emission Reduction
Beef Cattle Enteric Fermentation - CH4 z 2.0 a 16
Manure Management - CH4 and N2O 2.0 b 16
Agricultural Soils - N2O reduction
- Direct 1.0 c 8
2) Carbon Sequestration y
Reduced Tillage 1.9 e 15
Net Decrease in Summerfallow 1.0 f 8
Net Increase in Perennial 0.2 g 2
3) BioFuels/Energy Efficiency x
Ethanol blend 0.6-1.38 h 5
Bio-diesel blend 0.2-4.91 h 2
Energy Efficiency 0.1 i 1
Sub Total for livestock and cropping 9.2
Wetlands Restoration 3.6 j 28
Total with Wetlands 12.6 100
z All greenhouse gases (GHG) converted to carbon dioxide equivalents or CO2e (CH4 * 21, N2O * 310) y Also known as biological carbon capture and storage. Applied tillage system management; reduced summerfallow and conversion to perennial forage QPs (last 2 in draft form) x Lower range of values drawn from Blue Source Canada, Assessment of Greenhouse Gas Emission Reductions in Specific Agriculture Related Projects, 2008, using Biofuels /EE QP.for announced biofuel plants; Higher values of Ethanol GHG reductions based on Alberta’s ethanol forecast production capacity = 1.38 Mt CO2e per year based on proposed Renewable Fuel Standard for E5 blend (required production capacity = 0.46 Mt from RFS) Biodiesel GHG reductions from Alberta’s biodiesel forecast production capacity = 4.91 Mt CO2e per year (required production capacity = 0.16 Mt from RFS); lower values only included in 12.6 Mt total to be conservative. a Assumed beef cattle represent 91% of enteric emissions; edible oil diets may reduce cattle fermentation by 25%. Includes AB Beef Feeding, Lifecycle, Edible Oils and Days on Feed QPs. b Includes estimates using Alberta Pork, Dairy and Anaerobic Digester QPs.; cross referenced with Alberta Research Council estimate of 332 MW of electricity generated from manure feedstocks through anaerobic digestion. c Estimated 35% reduction of current source, according to draft Nitrous Oxide Emission Reduction QP. d Assumed limited potential for management to reduce GHG emissions e Applied default coefficients from AB Reduced Tillage Protocol to tillage area by approximate soil zone (2006 Census)

8
f Applied draft reduced summerfallow QP coefficient to (Table 3.5-8) to area of summerfallow in 2006 Census g Assumed draft conversion to perennial QP coefficient value decreases by 20% due to high annual crop prices h Assumed Canada's Renewable Fuel targets E5 and B2 using AB Biofuels QP ; on announced Biofuel facility capacity in AB (not including forestry plants). i Based on Ontario farm audit & energy savings data, adjusted for size to AB facilities for pork, dairy, poultry using EE QP j Based on draft Wetlands Science Discussion Document “Wetlands Conservation and Restoration Protocol: Wetlands Quantification, Wetlands Working Group. July 2009; Drained and cropped wetlands area in AB 4090 ha; restored coefficient 0.86 t CO2e/ha/yr; based on research from the Agriculture-Wetlands GHG Initiative with benchmark sites across Canada.
Forestry Sector Estimates using Developmental Quantification Protocols At present, there are no approved “forestry” protocols in the Alberta Offset System – the Afforestation quantification protocol has been withdrawn for revision while an Improved Forest Management protocol similar to that supported by the Climate Action Reserve in California is under development. Estimates of greenhouse gas emission offsets attributable to all forestation activities followed the methodologies being developed for both protocols, and applied to data obtained from “real world” forestation efforts in Alberta. Specifically, the draft revision of the afforestation protocol was applied to both coniferous (white spruce and lodgepole pine) and hybrid poplar plantation growth and yield information. The afforestation protocol is under review because the degree to which sequestered carbon persists in harvested wood products is being developed so that a 100% debit of the removed above ground carbon does not occur to the project upon harvest of the trees5. The improved forest management protocol under development was applied to volume information from 1000 ha of recently measured young regeneration plantings that meet the definition of “additionality or incrementality” being in excess of “business as usual.” Note that agricultural plantings were not included – either shelterbelts or smaller scale farmland tree plantings as a present these plantings are relatively small in total area. Table 2. GHG Reduction activities and their potentials – forest management.
Potential
GHG Reductions
GHG Reduction Type (Mt CO2e yr-1
) Notes
1) Emission Reduction
Forest harvesting 0.02 – 0.1 a
Forest Soils – Carbon Storage Unknown
2) Carbon Sequestration
Improved forest management 0.04 – 0.16 b
Afforestation - coniferous 0.04 c
Afforestation - deciduous 0.25 – 0.50 d
3) BioFuels/Energy Efficiency
Co-generation Unknown e
a-based on direct reduction of emissions at harvesting from a developmental protocol
5 Under Kyoto Accounting rules, harvest of a tree results in a 100% debit of the tonnage sequestered above
ground. The Climate Action Reserve in California has built in HWP accounting to bring in a more realistic
approach for sequestered carbon in forests. Alberta is doing the same for its Afforestation protocol.
9
b-estimate based on 15 - 30% of conifer reforestation being eligible for IFM offsets c-estimate based on current conifer afforestation in AB d- current Short Rotation Intensive Culture (SRIC) offset values doubled and an estimate of total independent adoption equal to one SRIC project
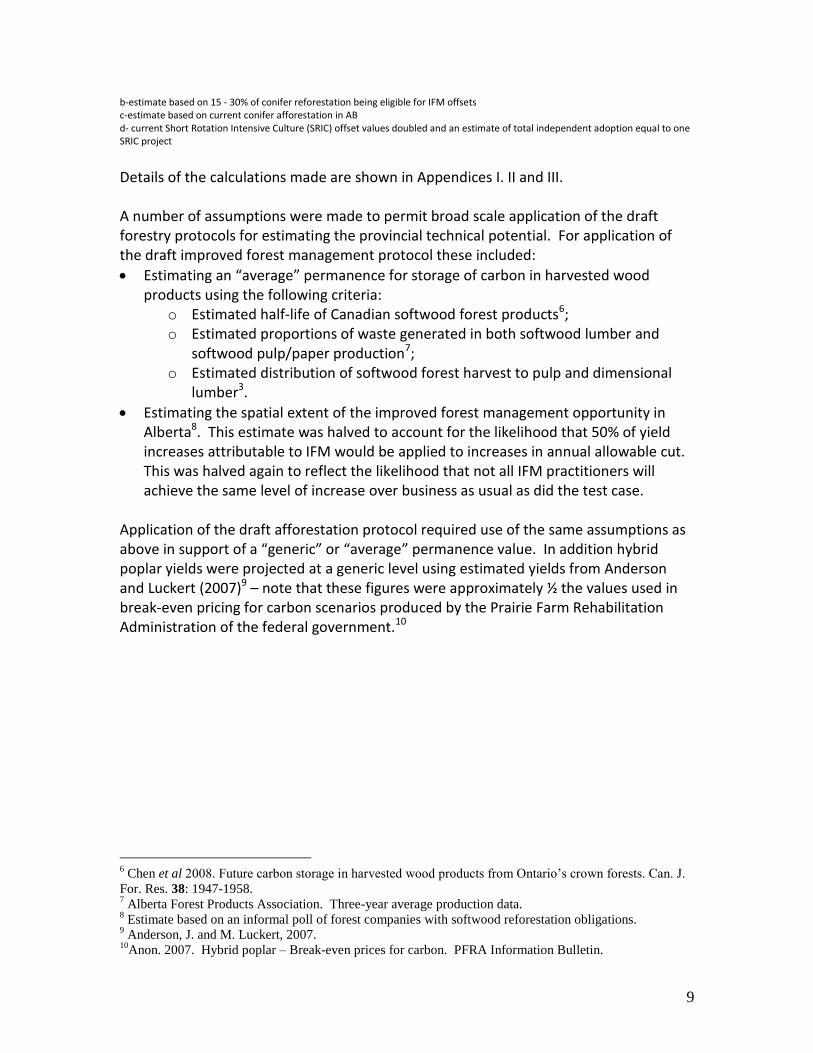
Details of the calculations made are shown in Appendices I. II and III. A number of assumptions were made to permit broad scale application of the draft forestry protocols for estimating the provincial technical potential. For application of the draft improved forest management protocol these included:
Estimating an “average” permanence for storage of carbon in harvested wood products using the following criteria:
o Estimated half-life of Canadian softwood forest products6; o Estimated proportions of waste generated in both softwood lumber and
softwood pulp/paper production7; o Estimated distribution of softwood forest harvest to pulp and dimensional
lumber3.
Estimating the spatial extent of the improved forest management opportunity in Alberta8. This estimate was halved to account for the likelihood that 50% of yield increases attributable to IFM would be applied to increases in annual allowable cut. This was halved again to reflect the likelihood that not all IFM practitioners will achieve the same level of increase over business as usual as did the test case.
Application of the draft afforestation protocol required use of the same assumptions as above in support of a “generic” or “average” permanence value. In addition hybrid poplar yields were projected at a generic level using estimated yields from Anderson and Luckert (2007)9 – note that these figures were approximately ½ the values used in break-even pricing for carbon scenarios produced by the Prairie Farm Rehabilitation Administration of the federal government.10
6 Chen et al 2008. Future carbon storage in harvested wood products from Ontario’s crown forests. Can. J.
For. Res. 38: 1947-1958. 7 Alberta Forest Products Association. Three-year average production data.
8 Estimate based on an informal poll of forest companies with softwood reforestation obligations.
9 Anderson, J. and M. Luckert, 2007.
10Anon. 2007. Hybrid poplar – Break-even prices for carbon. PFRA Information Bulletin.

10
Waste to Energy The technical potential of producing electricity from forest or agricultural biomass through direct combustion is large in Alberta (Table 3). Table 3. Estimates of Overall Potential GHG Reductions from Biomass Availability for Electrical Energy (annualized)
Residue Source
PJ GWh tCO2e/MWha
Potential GHG Reductions
(Mt CO2e yr-1
) Forest Residuesb 14 3889 0.65 2.3
Mill Residuesb 3.2 889 0.65 0.5
Agriculture Surplus Strawc 51 16388 0.65 9.7 a – Emission Factor for indirect GHG reductions from renewable energy in Alberta. b – Based on AFPA harvest statistics and forest company harvest efficiency data c –Estimates based on Levelton and ST2 Consultant’s Report - Bioenergy Opportunities for Alberta: Strategic Feasibility Study, January 15, 2006, commissioned by the Alberta government.
Electrical generation potential from forest residues was estimated as follows:
Potential (GJ) = Residues (m3) X 0.4 (conversion to Bone Dry Tonnes) X 20 GJ/BDT
Potential (PJ) = Potential (GJ)/1000000
However logistics of collection and transport and the need to establish biomass combustion facilities can hinder this potential. This is why biocharcoal, that can be easily substituted for coal in thermal electricity plants is gaining popularity. Mobile pyrolysis units to produce the biocharcoal are one way of converting and then transporting an energy rich product.
BioChar/BioCoal The following estimates of biochar production potential from forest biomass assume all sawmill residue streams and pulp mill waste streams less organic bio-solid waste are eligible for conversion to biochar. The formula was:
BioChar (Mt) = 1000’s m
3 residue X 0.4 (generic conversion to bone dry tonnes) X 0.231
(generic conversion from BDT to BioChar)
The estimates for agricultural surplus straw were taken from the Levelton report, as per above. Emissions from the pyrolysis procedure are considered to be carbon-neutral, and fossil fuels are initially required for the biochar process to begin, but once produced, the biochar or it’s by-products can be used as a carbon neutral energy source to run the rest of the process.
11
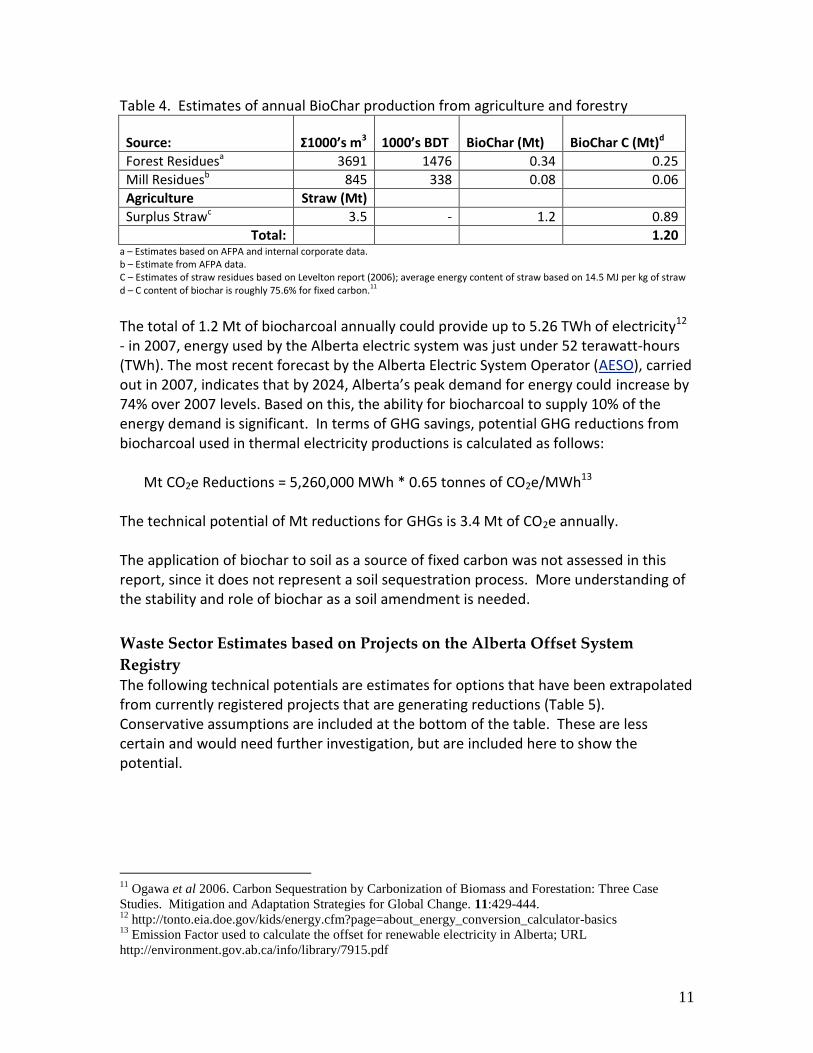
Table 4. Estimates of annual BioChar production from agriculture and forestry
Source: Σ1000’s m3 1000’s BDT BioChar (Mt)
BioChar C (Mt)d
Forest Residuesa 3691 1476 0.34 0.25
Mill Residuesb 845 338 0.08 0.06
Agriculture Straw (Mt)
Surplus Strawc 3.5 - 1.2 0.89
Total: 1.20 a – Estimates based on AFPA and internal corporate data. b – Estimate from AFPA data. C – Estimates of straw residues based on Levelton report (2006); average energy content of straw based on 14.5 MJ per kg of straw d – C content of biochar is roughly 75.6% for fixed carbon.11
The total of 1.2 Mt of biocharcoal annually could provide up to 5.26 TWh of electricity12 - in 2007, energy used by the Alberta electric system was just under 52 terawatt-hours (TWh). The most recent forecast by the Alberta Electric System Operator (AESO), carried out in 2007, indicates that by 2024, Alberta’s peak demand for energy could increase by 74% over 2007 levels. Based on this, the ability for biocharcoal to supply 10% of the energy demand is significant. In terms of GHG savings, potential GHG reductions from biocharcoal used in thermal electricity productions is calculated as follows:
Mt CO2e Reductions = 5,260,000 MWh * 0.65 tonnes of CO2e/MWh13
The technical potential of Mt reductions for GHGs is 3.4 Mt of CO2e annually. The application of biochar to soil as a source of fixed carbon was not assessed in this report, since it does not represent a soil sequestration process. More understanding of the stability and role of biochar as a soil amendment is needed.
Waste Sector Estimates based on Projects on the Alberta Offset System
Registry The following technical potentials are estimates for options that have been extrapolated from currently registered projects that are generating reductions (Table 5). Conservative assumptions are included at the bottom of the table. These are less certain and would need further investigation, but are included here to show the potential.
11
Ogawa et al 2006. Carbon Sequestration by Carbonization of Biomass and Forestation: Three Case
Studies. Mitigation and Adaptation Strategies for Global Change. 11:429-444. 12
http://tonto.eia.doe.gov/kids/energy.cfm?page=about_energy_conversion_calculator-basics 13
Emission Factor used to calculate the offset for renewable electricity in Alberta; URL
http://environment.gov.ab.ca/info/library/7915.pdf

12
Table 5. Projected GHG Reduction Potential from Existing Projects
Potential GHG Reductions
Total
GHG Reduction Type (Mt CO2e y-1
) Notes (%)
1) CH4 Capture and Destruction
Waste Water Management – CH4 8.0 a 97
Land Fill Gas - CH4 0.2 b 3
8.2 100
a - Extrapolated from projects currently on the Registry (Cargill Waste Water Treatment Project), conservatively estimating 10 more projects of that size could be added on to foot processing and municipal waste lagoons. b – Extrapolated from projects currently on the Registry (Cloverbar Landfill), conservatively estimating 4 more projects on Alberta landfills.
External National Estimates of Biological Mitigation for Alberta Several reliable sources external to Alberta have done some limited predictions on biological mitigation at a national level. The sources do not cover the range of options as this paper’s analysis, but can serve to give a useful cross-validation perspective for some of the major options in this report.
The Federal Government’s Turning the Corner Climate Change Plan (2007) In the Detailed Emissions and Economic Modeling chapter of Turning the Corner14, over 55 Mt of CO2e reductions per year were expected to be generated by 2014 through offset projects in the forestry, agriculture and land fill gas sectors (Figure 1). Given that Alberta has roughly 30 to 35% of agricultural production in Canada, Mt of reduction from the chart below fall in the 40Mt range by 2014 for agriculture, the estimates of 12.6 Mt in Table 1 of this report fall in the predicted range of federal analysis for Alberta. Alberta represents approximately 13% of Canadian forest harvesting on a volume basis (29.7 MM m3 of a total harvest of 231.1 MM m3 – NFDB15) and 8% of the landbase managed for forest production in Canada (21 MM ha of a total 256.7 MM ha.) As all Canadian forests are managed sustainably these data suggest Alberta has somewhat more productive lands than average; thus national estimates should likely be derived through aggregation of provincial data. The Detailed Emissions and Economic Modeling chapter of Turning the Corner suggests forestry will provide a reduction of approximately 7 Mt in 2010 – whilst this review suggests Alberta is capable of producing
14
Detailed Emissions and Modeling Chapter - http://www.ec.gc.ca/doc/virage-corner/2008-
03/571/tdm_toc_eng.htm 15
NFDB – National Forest Database – Accessed March 19, 2010.
http://nfdp.ccfm.org/inventory/background_e.php

13
up to 1 Mt of total reduction through forestry – this is consistent with Alberta representing between 8 and 13% of Canada’s productive forest landbase. Figure 1. Turning the Corner Analysis for Offsets in Canada (55 Mt by 2014)
BIOCAP Canada Estimates of Biological Mitigation Potentials The BIOCAP Canada Foundation16 had several research networks that were intent on providing solutions to deliver new forms and sources of clean energy, short and long term domestic strategies to reduce greenhouse gas emissions, and opportunities via new products and markets for rural economic development across Canada. Taken from the plenary presentation from Dr. David Layzelle at the BiOCAP conference in 2006, the following graphic was an estimate of the potential for biological mitigation in Canada (Figure 2).
16
See www.biocap.ca for numerous reports and publications.
14
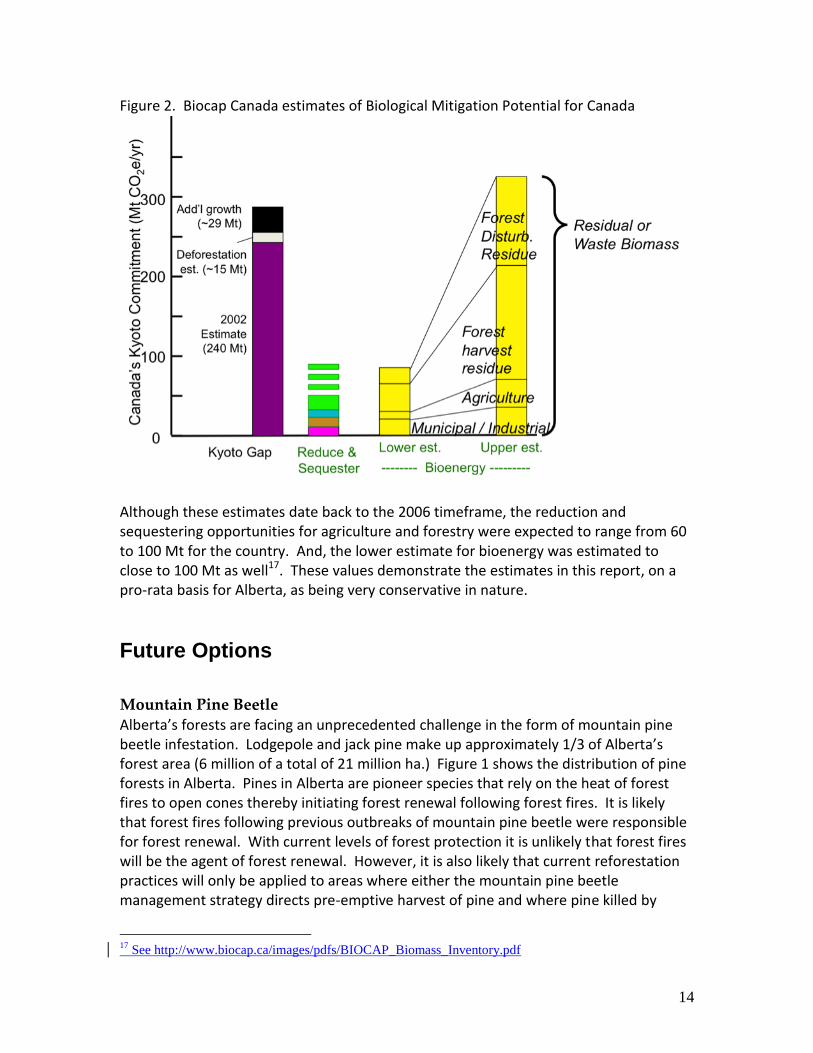
Figure 2. Biocap Canada estimates of Biological Mitigation Potential for Canada
Although these estimates date back to the 2006 timeframe, the reduction and sequestering opportunities for agriculture and forestry were expected to range from 60 to 100 Mt for the country. And, the lower estimate for bioenergy was estimated to close to 100 Mt as well17. These values demonstrate the estimates in this report, on a pro-rata basis for Alberta, as being very conservative in nature.
Future Options
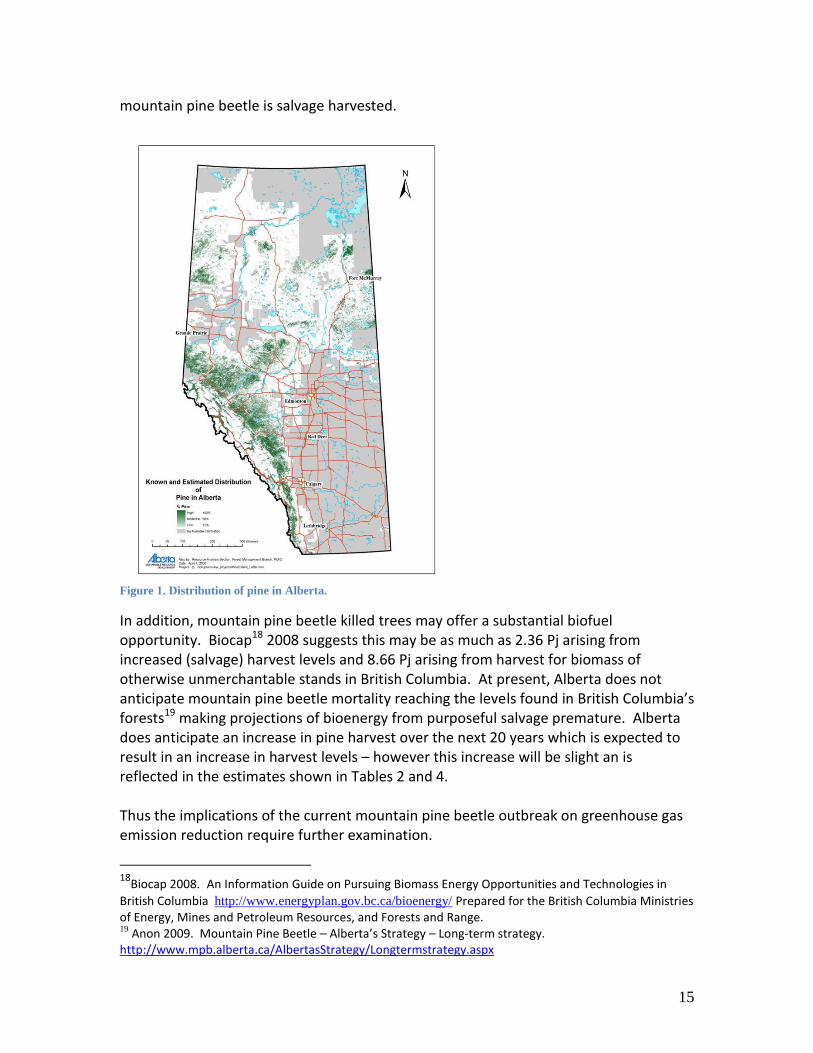
Mountain Pine Beetle Alberta’s forests are facing an unprecedented challenge in the form of mountain pine beetle infestation. Lodgepole and jack pine make up approximately 1/3 of Alberta’s forest area (6 million of a total of 21 million ha.) Figure 1 shows the distribution of pine forests in Alberta. Pines in Alberta are pioneer species that rely on the heat of forest fires to open cones thereby initiating forest renewal following forest fires. It is likely that forest fires following previous outbreaks of mountain pine beetle were responsible for forest renewal. With current levels of forest protection it is unlikely that forest fires will be the agent of forest renewal. However, it is also likely that current reforestation practices will only be applied to areas where either the mountain pine beetle management strategy directs pre-emptive harvest of pine and where pine killed by
17
See http://www.biocap.ca/images/pdfs/BIOCAP_Biomass_Inventory.pdf
15
mountain pine beetle is salvage harvested.
Figure 1. Distribution of pine in Alberta.
In addition, mountain pine beetle killed trees may offer a substantial biofuel opportunity. Biocap18 2008 suggests this may be as much as 2.36 Pj arising from increased (salvage) harvest levels and 8.66 Pj arising from harvest for biomass of otherwise unmerchantable stands in British Columbia. At present, Alberta does not anticipate mountain pine beetle mortality reaching the levels found in British Columbia’s forests19 making projections of bioenergy from purposeful salvage premature. Alberta does anticipate an increase in pine harvest over the next 20 years which is expected to result in an increase in harvest levels – however this increase will be slight an is reflected in the estimates shown in Tables 2 and 4. Thus the implications of the current mountain pine beetle outbreak on greenhouse gas emission reduction require further examination.
18
Biocap 2008. An Information Guide on Pursuing Biomass Energy Opportunities and Technologies in
British Columbia http://www.energyplan.gov.bc.ca/bioenergy/ Prepared for the British Columbia Ministries of Energy, Mines and Petroleum Resources, and Forests and Range. 19
Anon 2009. Mountain Pine Beetle – Alberta’s Strategy – Long-term strategy. http://www.mpb.alberta.ca/AlbertasStrategy/Longtermstrategy.aspx
16
Material Switching/BioProducts: Material switching involves the conversion of biological residues into consumer or industrial products and precursors, with the intent of displacing more energy intensive feedstocks. Natural materials are a rapidly emerging economic sector in global jurisdictions such as Europe but the application of scientific rigor to their climate change mitigation potential is relatively new. Measurements on potential carbon reductions for Alberta from natural materials have not been made and are compounded by the potential of thousands of different product possibilities – this is an area that requires more work. Such materials include natural fiber insulation, advanced composites for automotive markets, carbon nanotubes, traditional wood products to cellulose-based chemicals designed to reduce the energy requirements for unconventional oil extraction. The effect of these materials on GHG reduction will not only be based on carbon sequestered in their structure, but on the product efficiencies related to their application. Greenhouse gas mitigation can occur through:
Carbon storage in to long-term materials that can be recycled at end-of-life or converted to bioenergy.
Chemical fractionation of bio-based derivatives for precursors substituting fossil-fuel based precursors in product supply chains
Displacement of energy intensive materials with less energy intensive natural alternatives.
Improvements in energy efficiency due material performance enhancement (a major reason for auto sector interest in natural fibers is the promise of improvements in fuel economy due to lighter material construction
Natural Fiber Insulation a business case exists for three 30 Mt facilities in Alberta based on relatively recent market conditions20
Conclusions Alberta requires a next wave of greenhouse gas emission reduction and mitigation. Biological capture and fuel replacement strategies are the most efficient mitigation options readily available to Alberta. Agriculture reduction and capture potential is highest with a possible total reduction of 16.5 Mt CO2e per year, methane capture offers a potential reduction of 8.2 Mt CO2e per year, while forestry based capture offers between 0.7 and 1.1 Mt CO2e of reduction per year. These estimates while conservative are within the lower limits of the range suggested in Turning the Corner.
20
Woodbridge, Hemp Insulation and Hemp Board, 2008.

17
The estimates do not include changes in forest soil storage or mountain pine beetle management impacts on carbon capture and storage, or bio-products and natural materials – pointing out the need for a concerted effort to more accurately quantify the Alberta’s potential for biological capture and storage. Quantification efforts would provide a vehicle for seeking current state of the art knowledge and identification of knowledge gaps thus identifying opportunities to leverage CCEMC support and activities to synergize the next wave of greenhouse gas emission reduction.

18
Appendix I –Improved Forest Management Estimates Table A1. Estimate of GHG Capture from 1000 ha of IFM.
Stand
Age (yrs) "C" Stands
"CD"
Stands
"DC"
Stands
"C"
Stands
"CD"
Stands
"DC"
Stands Total
10 0.57 0.73 -0.17 392 120 -27 485
20 23.90 21.61 -8.65 16295 3578 -1363 18510
30 84.53 76.54 -30.95 57625 12675 -4878 65423
40 165.85 152.92 -61.88 113062 25324 -9753 128634
50 251.20 235.89 -95.33 171246 39063 -15023 195286
60 330.02 314.48 -126.91 224972 52078 -20001 257048
70 397.10 382.48 -154.20 270702 63339 -24302 309739
80 451.05 437.38 -176.23 307481 72430 -27773 352138
90 492.40 479.02 -192.94 335666 79326 -30408 384584
100 522.71 508.54 -204.80 356328 84214 -32276 408265
110 544.51 527.57 -212.45 371189 87366 -33483 425073
120 559.36 537.88 -216.60 381318 89072 -34136 436255
130 568.73 541.05 -217.87 387700 89597 -34336 442961
Offsets (tonnes/ha) Total Carbon Dioxide Capture (tonnes)
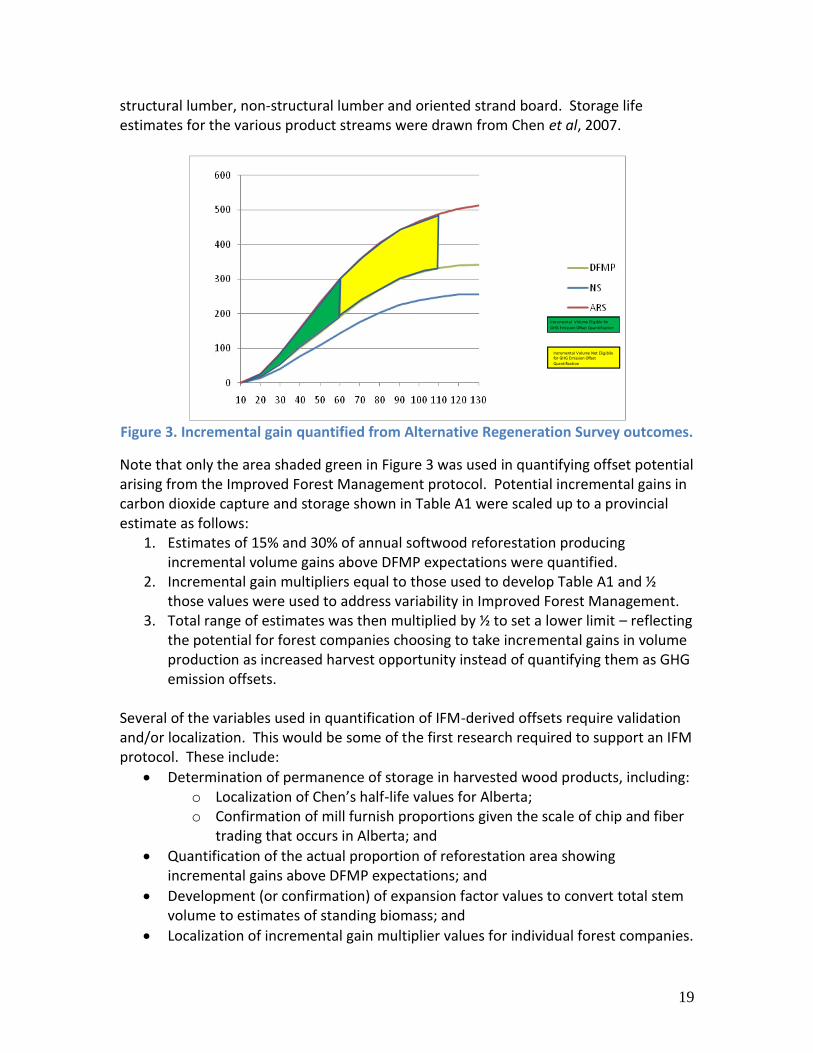
Table A1 shows potential GHG emission offsets arising from one year of improved forest management on 1000 ha; using actual data drawn from an Alternative Regeneration Survey pilot project. Offset values are calculated for gains in volume accrual above detailed forest management plan (DFMP) expectations (i.e. “business as usual”.) Note that this data is a single time point for a single enterprise; however, in the experience of the author the example represents the higher level of incremental gain likely to be realized in Alberta. Figure 3 shows the incremental gain represented in the Table A1 second column i.e. “C” Stands. Values in Table A1 are total standing volume by yield curve converted to carbon dioxide emission offset values by applying expansion factors to estimate above-ground biomass and root shoot ratios to estimate below-ground biomass. Above-ground estimates are likely somewhat high as expansion factors developed for merchantable volume were applied to total volume. Both above-ground and below-ground biomass estimates are converted to carbon values then to carbon dioxide values. Above-ground values were then deflated to 41.6% of total carbon values to reflect a generic storage in harvested wood products adjustment. The harvested wood products value was derived by applying proportions of harvest estimating proportions of harvest going wood pulp,
19
structural lumber, non-structural lumber and oriented strand board. Storage life estimates for the various product streams were drawn from Chen et al, 2007.
Incremental Volume Eligible for
GHG Emission Offset Quantification
Incremental Volume Not Eligibile for GHG Emission Offset
Quantification
Figure 3. Incremental gain quantified from Alternative Regeneration Survey outcomes.
Note that only the area shaded green in Figure 3 was used in quantifying offset potential arising from the Improved Forest Management protocol. Potential incremental gains in carbon dioxide capture and storage shown in Table A1 were scaled up to a provincial estimate as follows:
1. Estimates of 15% and 30% of annual softwood reforestation producing incremental volume gains above DFMP expectations were quantified.
2. Incremental gain multipliers equal to those used to develop Table A1 and ½ those values were used to address variability in Improved Forest Management.
3. Total range of estimates was then multiplied by ½ to set a lower limit – reflecting the potential for forest companies choosing to take incremental gains in volume production as increased harvest opportunity instead of quantifying them as GHG emission offsets.
Several of the variables used in quantification of IFM-derived offsets require validation and/or localization. This would be some of the first research required to support an IFM protocol. These include:
Determination of permanence of storage in harvested wood products, including: o Localization of Chen’s half-life values for Alberta; o Confirmation of mill furnish proportions given the scale of chip and fiber
trading that occurs in Alberta; and
Quantification of the actual proportion of reforestation area showing incremental gains above DFMP expectations; and
Development (or confirmation) of expansion factor values to convert total stem volume to estimates of standing biomass; and
Localization of incremental gain multiplier values for individual forest companies.
20
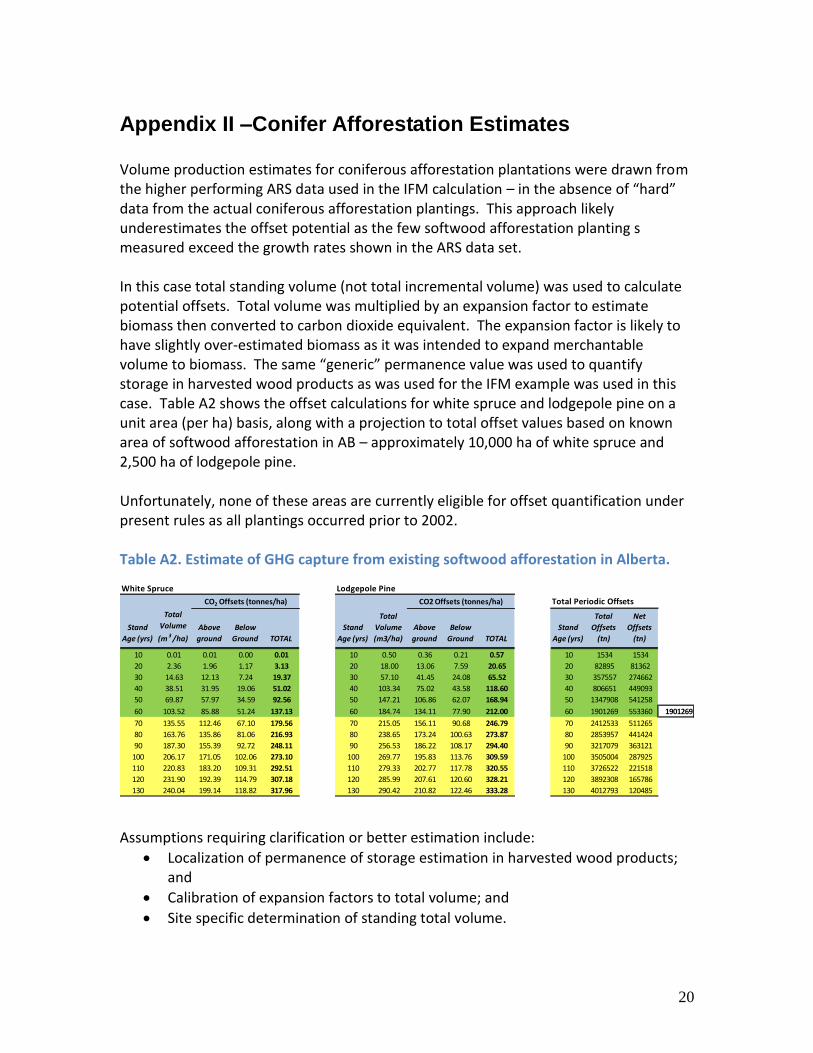
Appendix II –Conifer Afforestation Estimates Volume production estimates for coniferous afforestation plantations were drawn from the higher performing ARS data used in the IFM calculation – in the absence of “hard” data from the actual coniferous afforestation plantings. This approach likely underestimates the offset potential as the few softwood afforestation planting s measured exceed the growth rates shown in the ARS data set. In this case total standing volume (not total incremental volume) was used to calculate potential offsets. Total volume was multiplied by an expansion factor to estimate biomass then converted to carbon dioxide equivalent. The expansion factor is likely to have slightly over-estimated biomass as it was intended to expand merchantable volume to biomass. The same “generic” permanence value was used to quantify storage in harvested wood products as was used for the IFM example was used in this case. Table A2 shows the offset calculations for white spruce and lodgepole pine on a unit area (per ha) basis, along with a projection to total offset values based on known area of softwood afforestation in AB – approximately 10,000 ha of white spruce and 2,500 ha of lodgepole pine. Unfortunately, none of these areas are currently eligible for offset quantification under present rules as all plantings occurred prior to 2002. Table A2. Estimate of GHG capture from existing softwood afforestation in Alberta.
White Spruce Lodgepole Pine
Total Periodic Offsets
Stand
Age (yrs)
Total
Volume
(m 3 /ha)
Above
ground
Below
Ground TOTAL
Stand
Age (yrs)
Total
Volume
(m3/ha)
Above
ground
Below
Ground TOTAL
Stand
Age (yrs)
Total
Offsets
(tn)
Net
Offsets
(tn)
10 0.01 0.01 0.00 0.01 10 0.50 0.36 0.21 0.57 10 1534 1534
20 2.36 1.96 1.17 3.13 20 18.00 13.06 7.59 20.65 20 82895 81362
30 14.63 12.13 7.24 19.37 30 57.10 41.45 24.08 65.52 30 357557 274662
40 38.51 31.95 19.06 51.02 40 103.34 75.02 43.58 118.60 40 806651 449093
50 69.87 57.97 34.59 92.56 50 147.21 106.86 62.07 168.94 50 1347908 541258
60 103.52 85.88 51.24 137.13 60 184.74 134.11 77.90 212.00 60 1901269 553360 1901269
70 135.55 112.46 67.10 179.56 70 215.05 156.11 90.68 246.79 70 2412533 511265
80 163.76 135.86 81.06 216.93 80 238.65 173.24 100.63 273.87 80 2853957 441424
90 187.30 155.39 92.72 248.11 90 256.53 186.22 108.17 294.40 90 3217079 363121
100 206.17 171.05 102.06 273.10 100 269.77 195.83 113.76 309.59 100 3505004 287925
110 220.83 183.20 109.31 292.51 110 279.33 202.77 117.78 320.55 110 3726522 221518
120 231.90 192.39 114.79 307.18 120 285.99 207.61 120.60 328.21 120 3892308 165786
130 240.04 199.14 118.82 317.96 130 290.42 210.82 122.46 333.28 130 4012793 120485
CO2 Offsets (tonnes/ha)CO2 Offsets (tonnes/ha)
Assumptions requiring clarification or better estimation include:
Localization of permanence of storage estimation in harvested wood products; and
Calibration of expansion factors to total volume; and
Site specific determination of standing total volume.

21
Appendix III –Short Rotation Intensive Culture (SRIC) Afforestation Estimates
SRIC afforestation estimates considered only hybrid poplar and high performance clones of native aspen. In the absence of empirical yield information a mean annual increment (MAI) value of 7.45 m3/ha/yr (Anderson and Luckert, 2007) was used to estimate GHG capture. Again, volume was expanded to an estimate of total biomass using an expansion factor and below ground biomass was estimated using a root:shoot ratio. Biomass was converted to carbon thence to CO2. A total of 85% of biomass was presumed to be converted to pulp with the remaining 15% identified as “residue” – no attempt was made to convert residue values into biomass fuel eligible offsets. Total volume was expanded to biomass then to carbon then CO2. All below ground biomass was considered eligible for offsetting. Again, the expansion factor used likely over-estimated biomass. However, a permanence of in harvested wood products value of 0.07 was used base on Chen et al, 2008 half-life of paper in Canada. Total area used to estimate potential was double current area under SRIC poplar cultivation as it seems likely at least one other deciduous pulp operator will likely adopt a “triad” management system thereby setting the stage for a second SRIC project in Alberta. Assumptions requiring clarification include:
Verification of the harvested wood products storage value for paper; and
Expansion factor for converting total volume of hybrid poplar and aspen to biomass; and
Verification of proportion of deciduous biomass going to pulp production and to residues; and
Fate of residues arising from deciduous pulp production.