biologically based fertilizer recommendations to meet yield expectations and preserve water quality
TRANSCRIPT


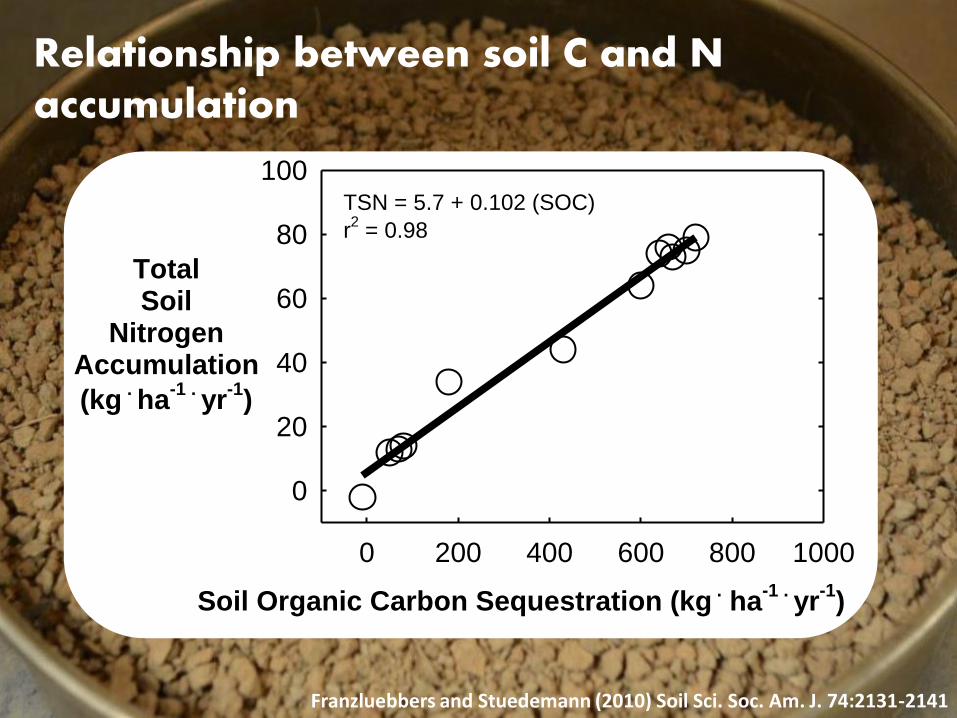
Franzluebbers and Stuedemann (2010) Soil Sci. Soc. Am. J. 74:2131-2141
Soil Organic Carbon Sequestration (kg . ha
-1 . yr
-1)
0 200 400 600 800 1000
TotalSoil
NitrogenAccumulation
(kg . ha
-1 . yr
-1)
0
20
40
60
80
100TSN = 5.7 + 0.102 (SOC)
r2 = 0.98
Relationship between soil C and N accumulation
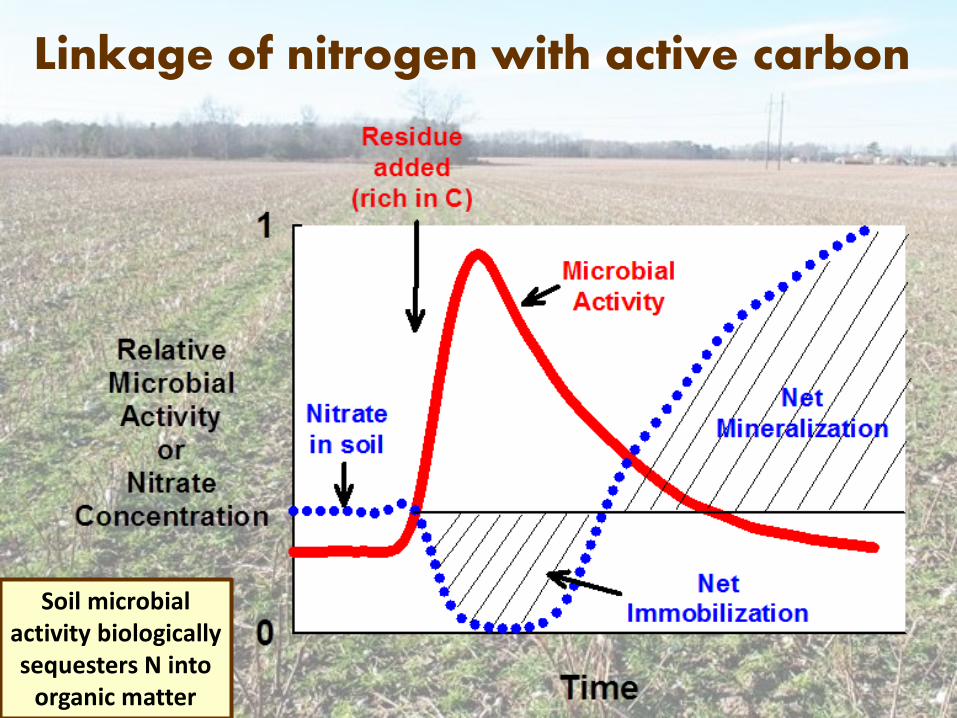
Linkage of nitrogen with active carbon
Soil microbial activity biologically sequesters N into
organic matter

Soil process relationships
Franzluebbers et al. (1999) Soil Sci. Soc. Am. J. 64:613-623
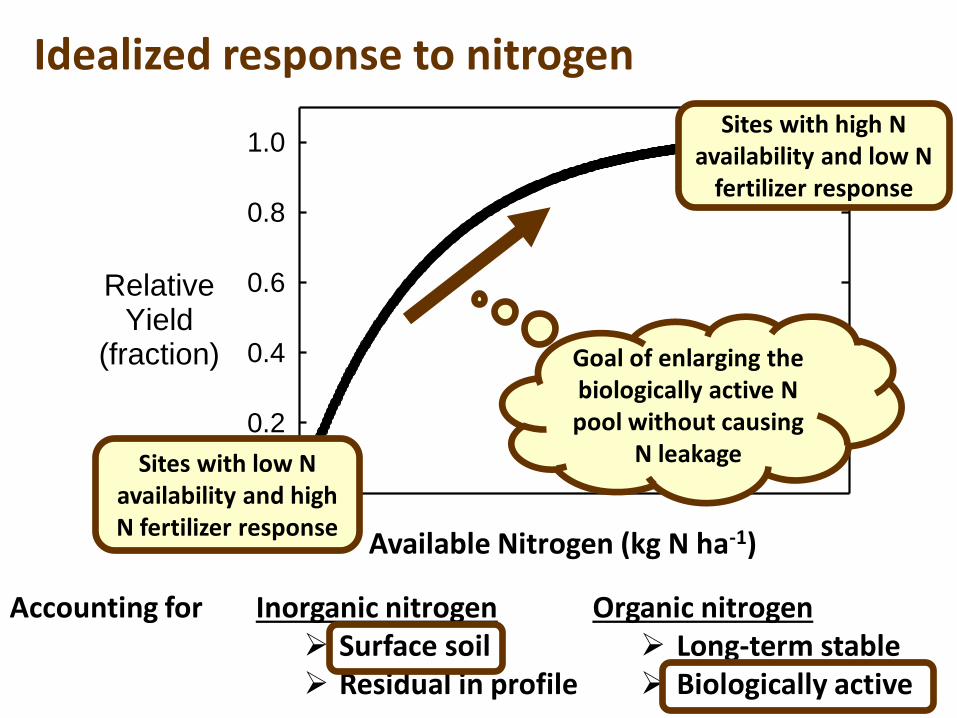
Available Nitrogen (kg ha-1
)
RelativeYield
(fraction)
0.0
0.2
0.4
0.6
0.8
1.0Sites with high N
availability and low N fertilizer response
Goal of enlarging the biologically active N pool without causing
N leakage
Inorganic nitrogen Surface soil Residual in profile
Organic nitrogen Long-term stable Biologically active
Accounting for
Available Nitrogen (kg N ha-1)
Sites with low N availability and high N fertilizer response
Idealized response to nitrogen

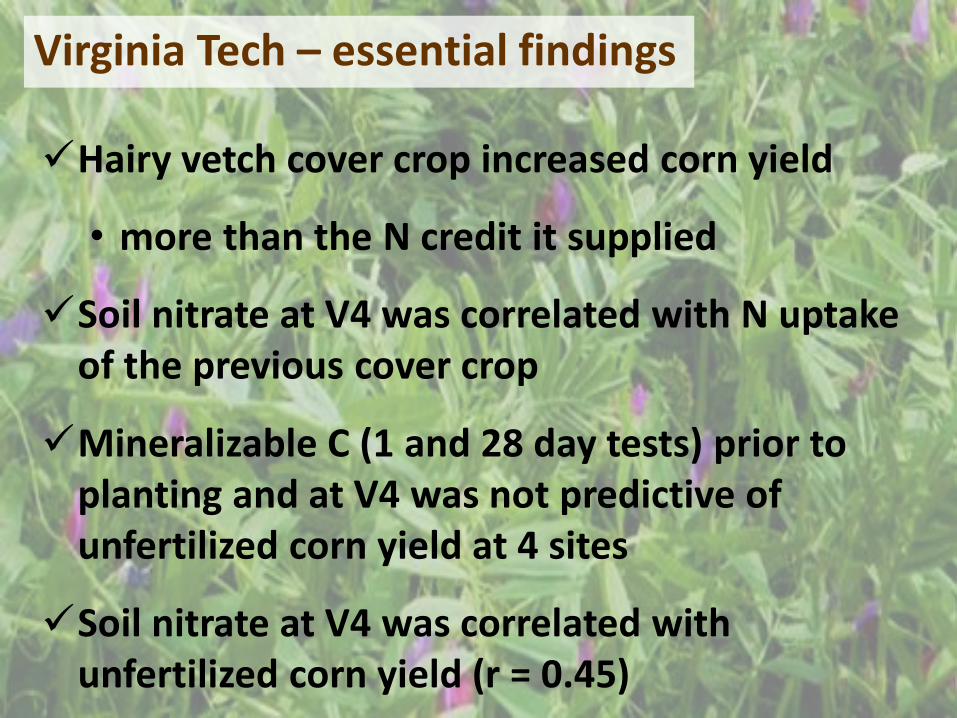
Virginia Tech – essential findings
Hairy vetch cover crop increased corn yield
• more than the N credit it supplied
Soil nitrate at V4 was correlated with N uptake of the previous cover crop
Mineralizable C (1 and 28 day tests) prior to planting and at V4 was not predictive of unfertilized corn yield at 4 sites
Soil nitrate at V4 was correlated with unfertilized corn yield (r = 0.45)

Predicting N supply from cover crops and soil organic matter with ecologically-based models
318.03.8 ,10
):(40.01max0084.0 NO
NCNN
Y
whccwhccwhwkcc
where,
ngmineralizi N and tillage-no if0.020,
ngmineralizi N and tillageif0.034,
ngimmobilizi N and tillageif0.12,
wh
Step 1: Cover Crop N Supply Model
Difference in unfertilized corn yield (Mg/ha) between a cover cropped soil and a bare fallow reference
Efficiency of N supply is controlled by tillage and N mineralization
vs. immobilization
Pre-emptive competition for
soil NO3- reduces
N supply
Winterkilled and winterhardy species have different N
supply regulators
N mineralization/ immobilization is controlled by microbial carbon use
efficiency and biomass stoichiometry
White et al. 2016. A model data-fusion approach for predicting cover crop nitrogen supply to corn. Agronomy Journal. doi:10.2134/agronj2016.05.0288

Predicting N supply from cover crops and soil organic matter with ecologically-based models
Best Model (r2=0.67) Unfertilized Corn Yield (Mg/ha) = -3.6 + 3.2*Soil %C + 0.14*% sand + 0.054*% silt + 0.46*Cov.Crop N Credit
Model with CO2 Burst (r2=0.60) Unfertilized Corn Yield (Mg/ha) = 2.9 + (0.00017 * CO2Burst2)† + 0.14*% sand + 0.48*Cov.Crop N Credit
†Term is only included in tilled soils
Step 2: Soil Organic Matter N Supply Model • Calibrated with unfertilized corn yields from 5 cover crop experiments (119
plots) • N supply from cover crop residues was isolated using the previously
calibrated cover crop N supply model • Find the best predictors of N supply from soil organic matter
• Tested total soil %C, 24hr CO2 burst, soil particle size fractions, tillage vs. no-till in a general linear model stepwise selection process
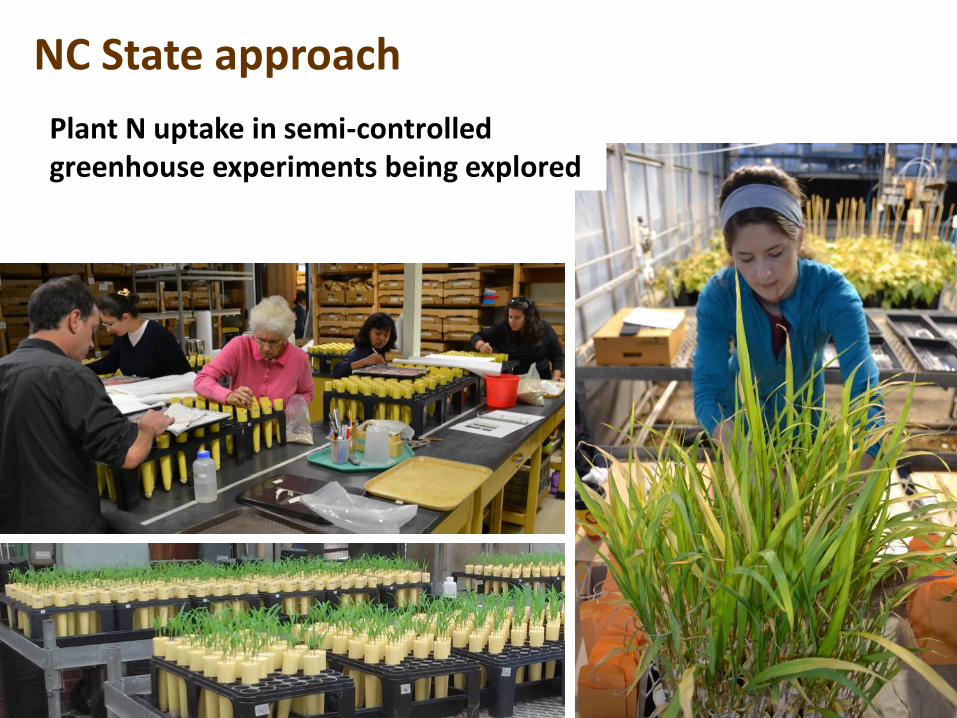
NC State approach
Plant N uptake in semi-controlled greenhouse experiments being explored

Plant N uptake in minor relationship with total organic C
Pershing (2016) NC State University MS thesis

Plant N uptake in strong relationship with mineralizable N
Pershing (2016) NC State University MS thesis
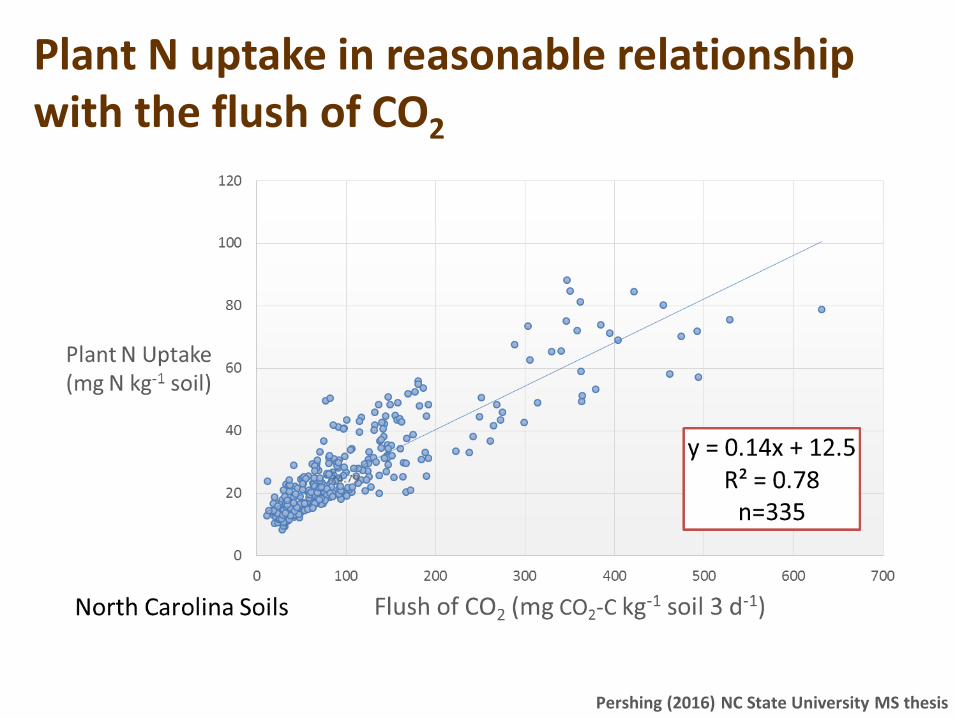
Plant N uptake in reasonable relationship with the flush of CO2
Pershing (2016) NC State University MS thesis

Field trials to evaluate biological N supply
Example of 3 strips fertilized with 0, 69, and 125 kg N ha-1 at sidedress
- Corn grain and silage in North Carolina and Virginia

1 2 3 4
Soil sampling (8 cores from each of 4 replicate locations)
Soil analyses Flush of CO2, net nitrogen mineralization Routine soil testing for pH, P, K, other elements (NC Dept Agric) Bulk density, particle size, total C-N, microbial biomass C, inorganic N
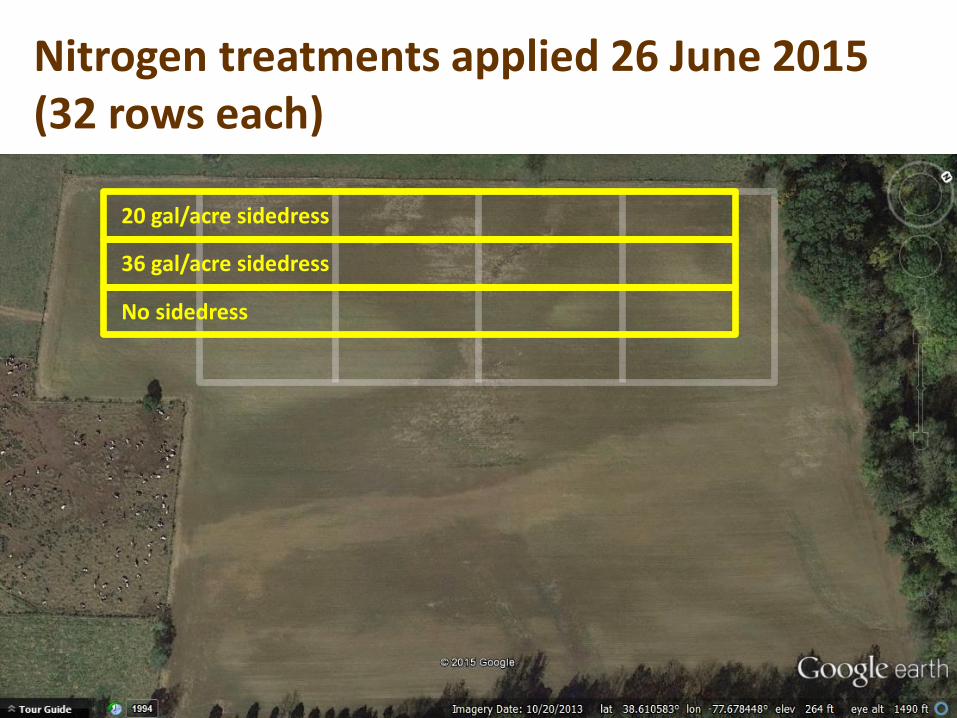
20 gal/acre sidedress
36 gal/acre sidedress
No sidedress
Nitrogen treatments applied 26 June 2015 (32 rows each)

Yield harvest (18’ row sections at 12 points in each strip)
Plant analyses Dry matter yield, stand density, nutrient concentration of forage, including protein, fiber, minerals (Ca, P, S, Mg, Na, K, Cu, Fe, Mn, Zn), ADF, NDF, nitrate (NC Dept Agric)

Collected yield estimates on 21 August 2015


Yield Results
Sidedress N Application (lb N/acre)
0 40 80 120
CornSilageYield
(ton/acre)[35% DM]
0
10
20
30
40
Rep 1

Yield Results
Sidedress N Application (lb N/acre)
0 40 80 120
CornSilageYield
(ton/acre)[35% DM]
0
10
20
30
40
Rep 2

Yield Results
Sidedress N Application (lb N/acre)
0 40 80 120
CornSilageYield
(ton/acre)[35% DM]
0
10
20
30
40
Rep 3
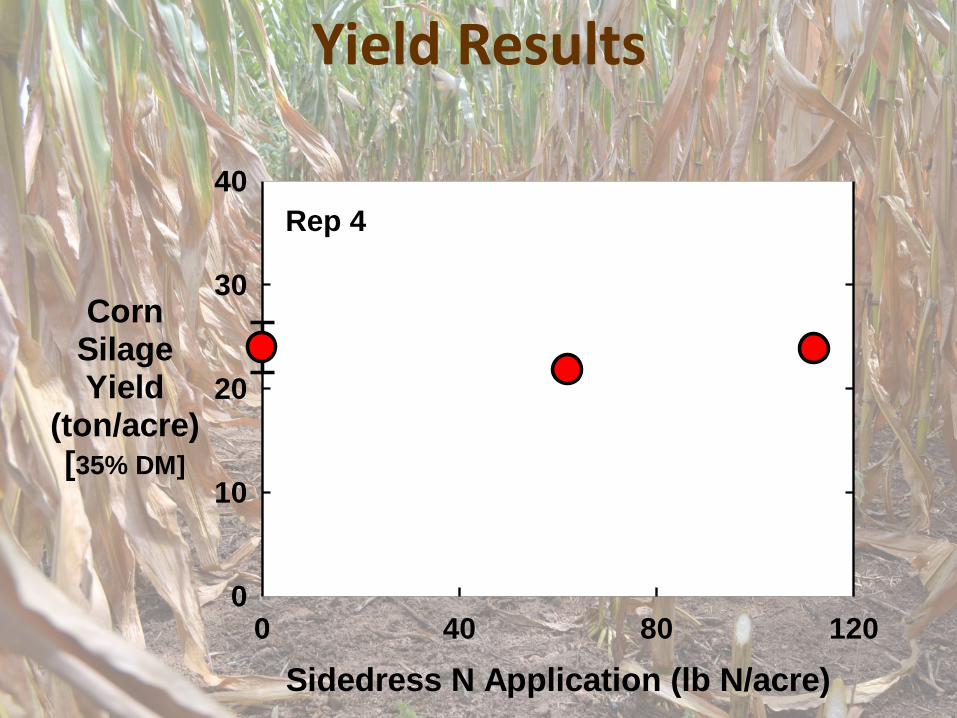
Yield Results
Sidedress N Application (lb N/acre)
0 40 80 120
CornSilageYield
(ton/acre)[35% DM]
0
10
20
30
40
Rep 4

Yield Results
Sidedress N Application (lb N/acre)
0 40 80 120
CornSilageYield
(ton/acre)[35% DM]
0
10
20
30
40
Overall (n = 12)
Average yield = 23.6 ton/acre

Implications
Sidedress N Application (lb N/acre)
0 40 80 120
CornSilageYield
(ton/acre)[35% DM]
0
10
20
30
40
Overall (n = 12)

Wheat grain evaluations in North Carolina

Flush of CO2 following Rewetting of Dried Soil
(mg CO2-C kg
-1 soil)
0-3 days
0 100 200 300 400 5000.0
0.2
0.4
0.6
0.8
1.0
1.2
Relative
Yield
Without
In-Season
Nitrogen
Wheat
Tall fescue
Corn
Preliminary results
Unpublished data
We’re getting excited about the potential!