biology name date lesson series - bio rocks - home...biome and then color the area on the map that...
TRANSCRIPT

Biology Unlocking the Genius Lesson Series
Name Date Period
Directions: There are 4 activities in this lesson series. You will only complete about one per day. Use the directions that follow to complete each task and answer the questions. If you have questions as you proceed feel free to ask your teacher, do not simply copy from your neighbor. LESSON 1: SAVE OUR SPECIES
Go to: “How many species are we losing” http://wwf.panda.org/about_our_earth/biodiversity/biodiversity/ and answer the questions
1) Why are questions about species loss so difficult to answer?
2) Experts estimate that species loss today is between ___________ and _____________ times higher than the
_________________ __________________ ____________.
3) This means that if the lower estimate is true, between ___________ and ______________ extinctions occur each
year. If the upper estimate is true, between _________________ and _________________ extinctions occur each
year.
4) Click on the “Causes of Loss” tab on the left side of the web page. Name some of the reasons our plant is losing species due to extinction.
5) Click on the What can I do? This just seems so BIG! What impact could I possibly have? link. What is the first thing listed that you can do to help prevent all of this extinction?
6) Sketch the picture that appears next to the description of how you can be good to our climate. Then, explain why you think the authors of this site chose this picture to accompany the description.
7) Click on the “Critical Species” tab at the bottom of the page. What are the six categories of animals pictured?
8) Pick one of the categories to read more about: ____________________ (category you selected) Explain 4 things that you learn by reading more.

9) Click on the “Priority Places & Habitats” tab at the bottom of the page. What are the six categories of places
pictured?
10) Pick one of the categories to read more about: ____________________ (category you selected) Explain 4 things that you learn by reading more.
11) From the main web quest page, click on the “Extinction Crisis” http://www.biologicaldiversity.org/programs/biodiversity/elements_of_biodiversity/extinction_crisis/ link and read the first paragraph. According to this web site, what are we currently experiencing on our planet?
12) Read about the categories of species toward the bottom of the page, and fill in the following blanks:
Scientists estimate that a ______________ or more of all the roughly 6,300 known species of amphibians are at risk of extinction
________________ _______ and degradation have caused most of the bird declines, but the impacts of _______________ ____________ and capture by collectors play a big role, too.
In the ocean, _________-building ______________ are declining at an alarming rate.
Overall, the IUCN estimates no less than _______________mammals across the globe classified as endangered, ______________, or vulnerable.
About ______ % of evaluated plant species are threatened.
Globally, _____% of the total evaluated reptiles in the world are deemed endangered or vulnerable to extinction by the IUCN.
13) Go to the IUCN Red List Introduction http://www.iucnredlist.org/about/introduction page and fill in the conservation status diagram to the right.
14) Use google or other search engine to find an organism that is at risk (either vulnerable, endangered or critically endangered). Use the Species Directory https://www.worldwildlife.org/species/directory?direction=desc&sort=extinction_status link if you’d like. Name the organism you chose and write 4-5 sentences about why it’s at risk and what is being done to protect it.
Biology Unlocking the Genius Lesson Series
Name Date Period
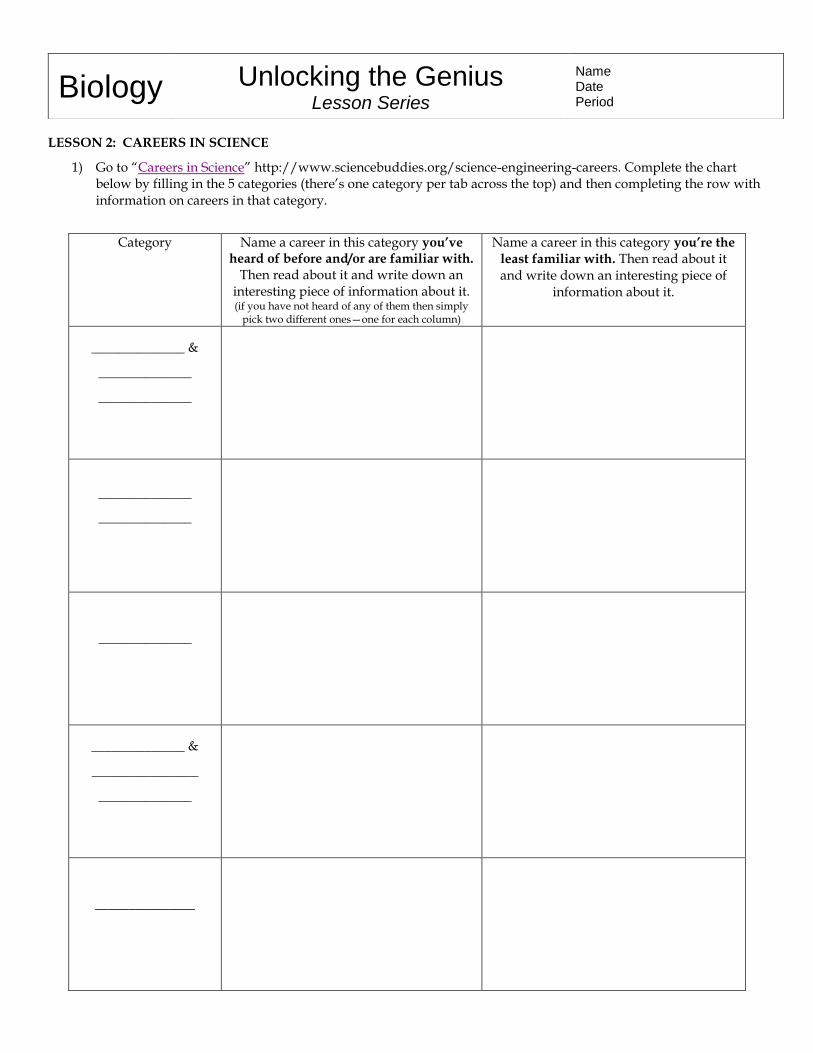
LESSON 2: CAREERS IN SCIENCE
1) Go to “Careers in Science” http://www.sciencebuddies.org/science-engineering-careers. Complete the chart below by filling in the 5 categories (there’s one category per tab across the top) and then completing the row with information on careers in that category.
Category Name a career in this category you’ve heard of before and/or are familiar with.
Then read about it and write down an interesting piece of information about it. (if you have not heard of any of them then simply
pick two different ones—one for each column)
Name a career in this category you’re the
least familiar with. Then read about it and write down an interesting piece of
information about it.
______________ &
______________
______________
______________
______________
______________
______________ &
________________
______________
_______________

2) Pick a career from any of the 5 categories that sounds the most interesting to you (it doesn’t have to be one that you named above). Then, complete the chart below by reading about it and finding the following information:
Career: ___________________________________ from the category: __________________________________________
What are some things a person with this career might do? (list at least three things)
What are some “key requirements” for this job?
What is the median salary for this position?
What is the minimum education for someone in this career?
Find the information about “Work Environment” and describe where/how a person in this position might spend his/her day.
Name two companies that may hire someone for this position.
Watch the video posted in the “On the Job” tab and write two things you learn about it by watching.
Name two related occupations.

Biology Unlocking the Genius Lesson Series
Name Date Period
LESSON 3: BIOMES
Engage 1) Why don’t bananas grow in Alaska?
2) Why don’t blueberries grow in Hawaii?
3) Explain what you think the significance of climate is to environments and ecosystems?
4) What biome do you live in?
Explore
Perhaps you figured out that bananas are unique to a hot and wet tropical ecosystem, whereas blueberries are unique to a cooler, less wet ecosystem. Thus, bananas grow well in Central America and Indonesia, where there are tropical rainforests, and blueberries grow well in Northeastern United States, in temperate deciduous forests. Earth’s diverse living organisms inhabit a wide range of ecosystems. The type of ecosystem depends mostly on the amount of annual precipitation and the average annual temperature. Biologists refer to each of the major ecosystems by the name of their climax community and these are called biomes.
Fill in the chart based on the information found in your reading. There are 10 terrestrial biomes and 2 aquatic (Miller pg 110-121). Color and label the map to show the distribution of these major biomes: tropical forest, savanna, desert, chaparral, temperate grassland, temperate deciduous forest, coniferous forest, and tundra. (If you want to go into more detail, you can include polar and high-mountain-ice areas.)
Explain Answer the following questions after filling in our Biome Worksheet and map
5) Define biome.
6) Using your own words, give three examples of how plants and animals within a given biome are suited to that biome (make sure to list the biome you are discussing).
1- 2- 3- 7) List in order, from greatest to least amount of rainfall: tropical rain forest, tropical grassland, temperature woodland, and tundra.
8) Which of the following biomes has the coldest annual temperature? a) boreal forest b) grasslands c) tundra d) temperate deciduous forest 9) Which biome would you find deciduous trees and primates a) tundra b) tropical dry forest c) tropical rain forest d) boreal forest
10) Which biome would you find large grazing herbivores? a) temperate woodland b) desert c) temperate grassland d) tundra

WORLD MAP OF BIOMES
Color Biome Color Biome
Tropical Rain Forest Temperate Forrest/Deciduous
Tropical Dry Forest Northwestern Coniferous Forest
Tropical Grassland/Savannah Boreal/Taiga
Desert Tundra
Temperate Grasslands Freshwater
Temperate Woodlands/Chaparral Saltwater
Simply select a color to use for each biome (make sure the each color is clearly different) color the key for the
biome and then color the area on the map that you would find that biome.
You will end up with a map that shows the distribution of these major biomes: tropical forest, savanna, desert,
chaparral, temperate grassland, temperate deciduous forest, coniferous forest, and tundra.
(If you want to go into more detail, you can include polar and high-mountain-ice areas.)

Biome Name
Worldwide Location
(list the general areas)
Annual Temperature (list the range
of temperatures found on the
graph)
Annual Precipitation (list the range of precipitation found on the
graph)
Abiotic factors
(list three that you would find in each biome)
Biotic factors (list three that you would find in each biome)
Defining characteristic (something very
unique about that biome)
Tropical
Rainforest
Tropical Dry
Forest
Tropical
Grassland/
Savannah
Desert
Temperate
Grassland
Temperate
Woodland/
Chaparral

Biome Name Worldwide Location (list the general areas)
Annual Temperature (list the range of temperatures found on the graph)
Annual Precipitation (list the range of precipitation found on the graph)
Abiotic factors (list three that you would find in each biome)
Biotic factors (list three that you would find in each biome)
Defining characteristic (something very unique about that biome)
Temperate
Forest/
Deciduous
Northwestern
Confiferous
Forest
Boreal/Taiga
Tundra
Freshwater
Saltwater

Biology Unlocking the Genius Lesson Series
Name Date Period
LESSON 4: PLATE TECTONICS
Engage
The stresses and strains in the Earth’s upper layers have many causes: thermal expansion and contraction, gravitational
forces, volume changes due to mineral phase transitions, etc. Faulting is one of the methods of mechanical adjustment or
release of such stress and strain. Faults are often (but not always) found near plate boundaries and each type of fault is
frequently associated with specific types of plate movements. However you can probably find all types of fault movement
associated with each type of plate boundary.
A fault is a fracture or zone of fractures between two blocks of rock. Faults allow the blocks to move relative to each
other. This movement may occur rapidly, in the form of an earthquake - or may occur slowly, in the form of creep. Faults
may range in length from a few millimeters to thousands of kilometers. Most faults produce repeated displacements over
geologic time. During an earthquake, the rock on one side of the fault suddenly slips with respect to the other. The fault
surface can be horizontal or vertical or some arbitrary angle in between. Earth scientists use the angle of the fault with
respect to the surface (known as the dip) and the direction of slip along the fault to classify faults. Faults which move along
the direction of the dip plane are dip-slip faults and described as either normal or reverse (thrust), depending on their
motion. Faults which move horizontally are known as strike-slip faults and are classified as either right-lateral or left-
lateral. Faults which show both dip-slip and strike-slip motion are known as oblique-slip faults.
normal fault - a dip-slip fault in which the block above the fault has moved downward relative to the block below. This
type of faulting occurs in response to extension and is often observed in the Western United States Basin and Range
Province and along oceanic ridge systems. Normal faults are often associated with divergent (tensional) boundaries.
revers or thrust fault - a dip-slip fault in which the upper block, above the fault plane, moves up and over the lower
block. This type of faulting is common in areas of compression, such as regions where one plate is being subducted under
another as in Japan. When the dip angle is shallow, a reverse fault is often described as a thrust fault. Thrust faults are often
associated with convergent (compressional) boundaries
transform or strike-slip fault - a fault on which the two blocks slide past one another. The San Andreas Fault is an
example of a right lateral fault. A left-lateral strike-slip fault is one on which the displacement of the far block is to the left
when viewed from either side. A right-lateral strike-slip fault is one on which the displacement of the far block is to the right
when viewed from either side. Strike-slip faults are often associated with transform (sliding) boundaries
1. What kind of faults would you expect to find in the Himalaya Mountains? Why?
2. What kind of faults would you expect to find along the Mid-Atlantic Ridge? Why?
3. What kind of faults is the San Andreas Fault? Is California likely to “fall off into the Pacific Ocean?” Why?
Follow the directions to construct your own Fault model using the template on the last page of this lesson.
a. Color the fault model according to the color key.
b. Cut the fault model making sure to include the tabs.
c. Glue the fault model to the piece of construction paper and once again cut it out making sure to leave the tabs attached.
d. Fold each side of the fault model down to form a box with the drawn features on the top.
e. Tape or glue the corners of the model together. This box is a three dimensional model of the top layers of the Earth’s crust.
f. The dashed lines on your model represent a fault. Carefully cut along the dashed line. You will end up with two pieces.
Explore I – Normal Fault
Locate points A and B on your model.
Move point B so that it is next to Point A.
Observe your model from the side (its cross-section).

4. Draw the normal fault as represented by the model you have just constructed.
Explain I
5. Which way did point B move relative to point A?
6. What happened to rock layers X, Y and Z?
7. Are the rock layers still continuous
8. What likely happened to the river? The road? The railroad tracks? Explain your answer.
9. Is this type of fault caused by tension, compression or shearing?
Explore II – Reverse (Thrust) fault
Locate points C and D on your model.
Move point C next to point D.
Observe the cross-section of your model.
10. Draw the reverse fault as represented by the model you have just constructed
Explain II
11. Which way did point D move relative to point C?
12. What happened to rock layers X, Y, Z?
13. Are the rock layers still continuous?

14. What likely happened to the river? The road? The railroad tracks? Explain your answer.
15. Is this type of fault caused by tension, compression or shearing?
Explore III – Transform (Strike-slip) fault
Locate points F and G on your model.
Move the pieces of the model so that point F is next to point G.
16. Draw an overhead view of the surface as it looks after movement along the fault.
17. If you were standing at point F and looking across the fault, which way did the block on the opposite side move?
18. What happened to rock layers X, Y, and Z?
19. Are the rock layers still continuous?
20. What likely happened to the river? The road? The railroad tracks? Explain your answer.
21. If the scale used in this model is 1 mm = 2 m, how many meters did the earth move when the strike-slip fault caused point F
to move alongside point G? (Note that this scale would make an unlikely size for the railroad track!) If there were a sudden
horizontal shift of this magnitude it would be about five times the shift that occurred in the 1906 San Andreas fault as a result
of the San Francisco earthquake.
22. Is this type of fault caused by tension, compression or shearing?


Fault Model—To construct your fault model please follow the instructions given on the first page of your lesson.