biomarkers for immunotherapy - oncologypro.esmo.org · j. haanen, nki-avl 1. til therapy 1....
TRANSCRIPT

Biomarkers for immunotherapy
John Haanen MD PhD
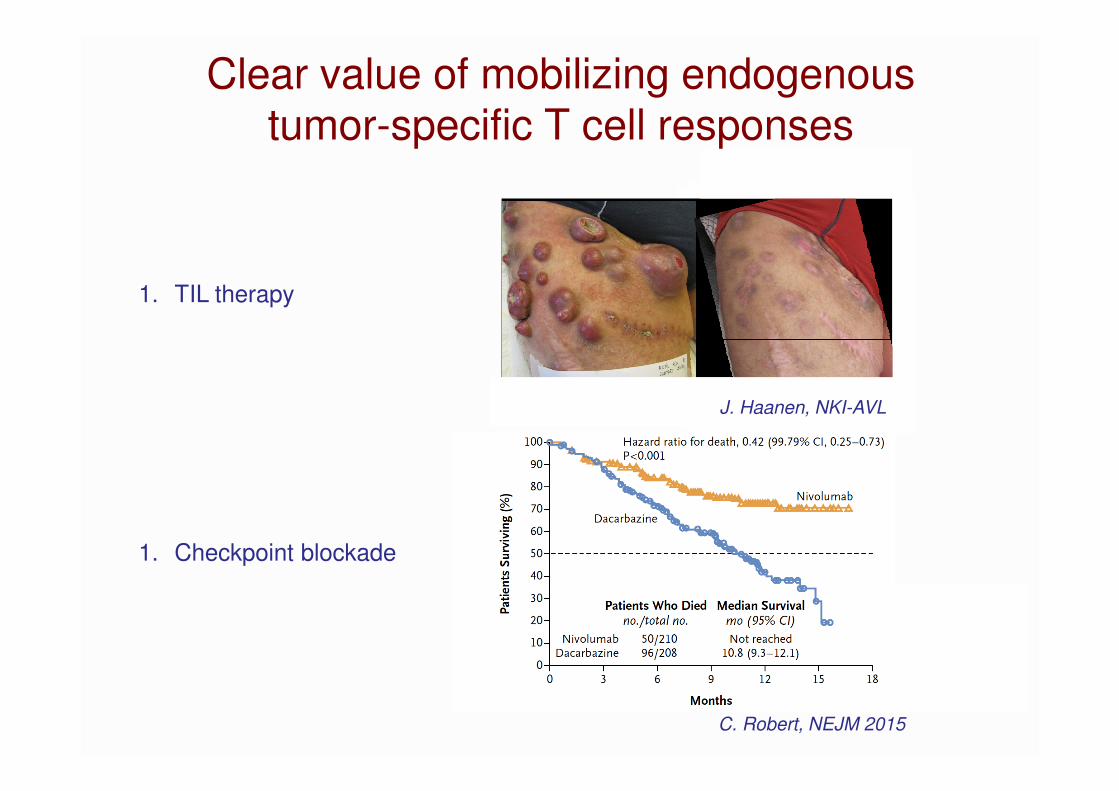
J. Haanen, NKI-AVL
1. TIL therapy
1. Checkpoint blockade
C. Robert, NEJM 2015
Clear value of mobilizing endogenous tumor-specific T cell responses
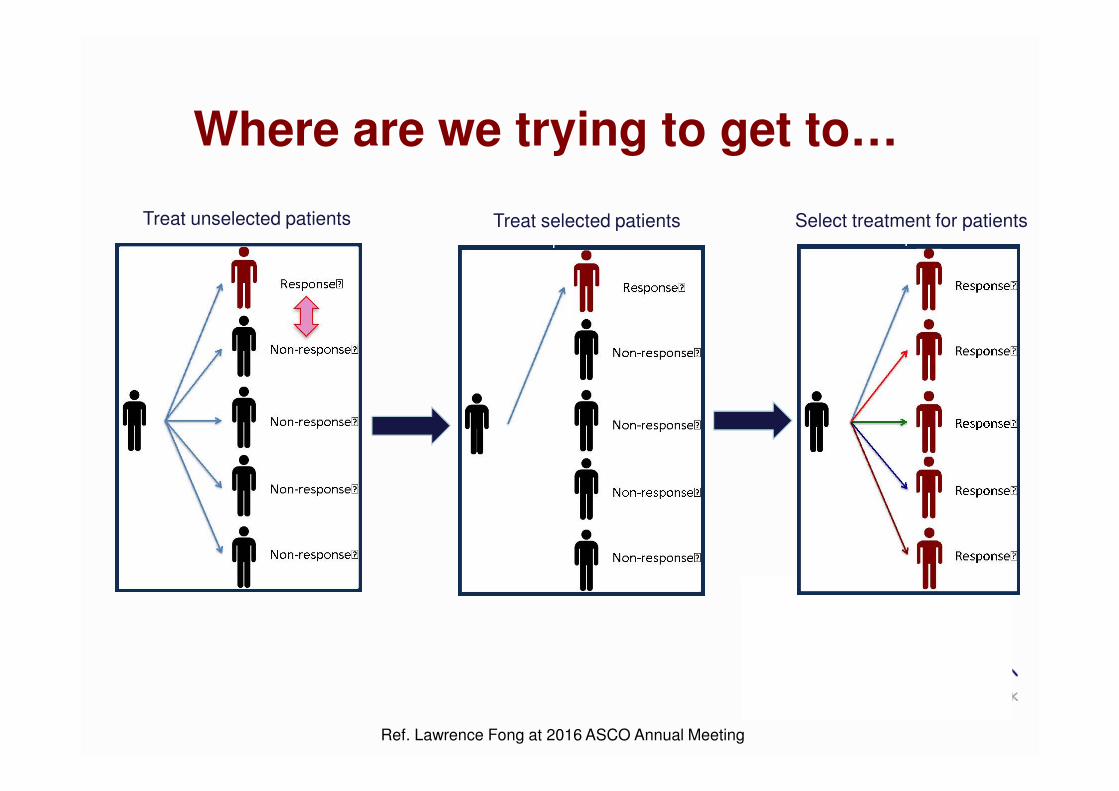
Where are we trying to get to…
Ref. Lawrence Fong at 2016 ASCO Annual Meeting
Treat unselected patients Treat selected patients Select treatment for patients

Biomarker research
Melero, .., Haanen, Nat Rev Canc 2015
FaecesUrineExhaled air
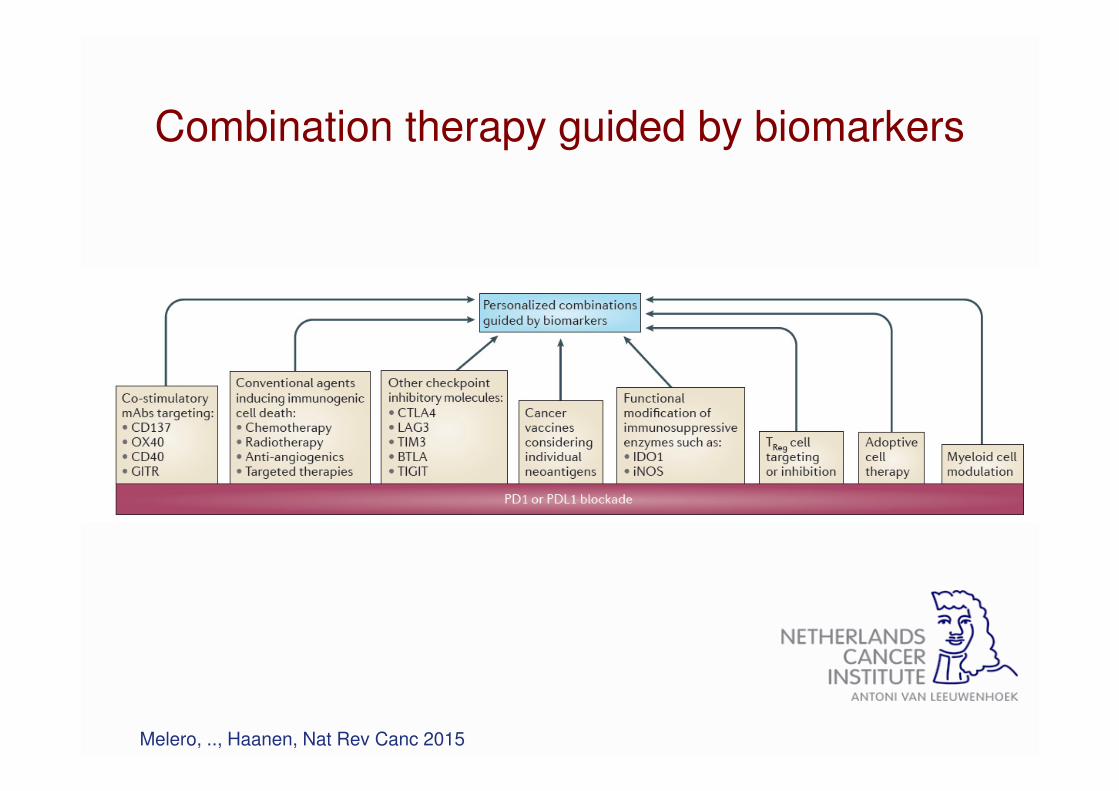
Combination therapy guided by biomarkers
Melero, .., Haanen, Nat Rev Canc 2015
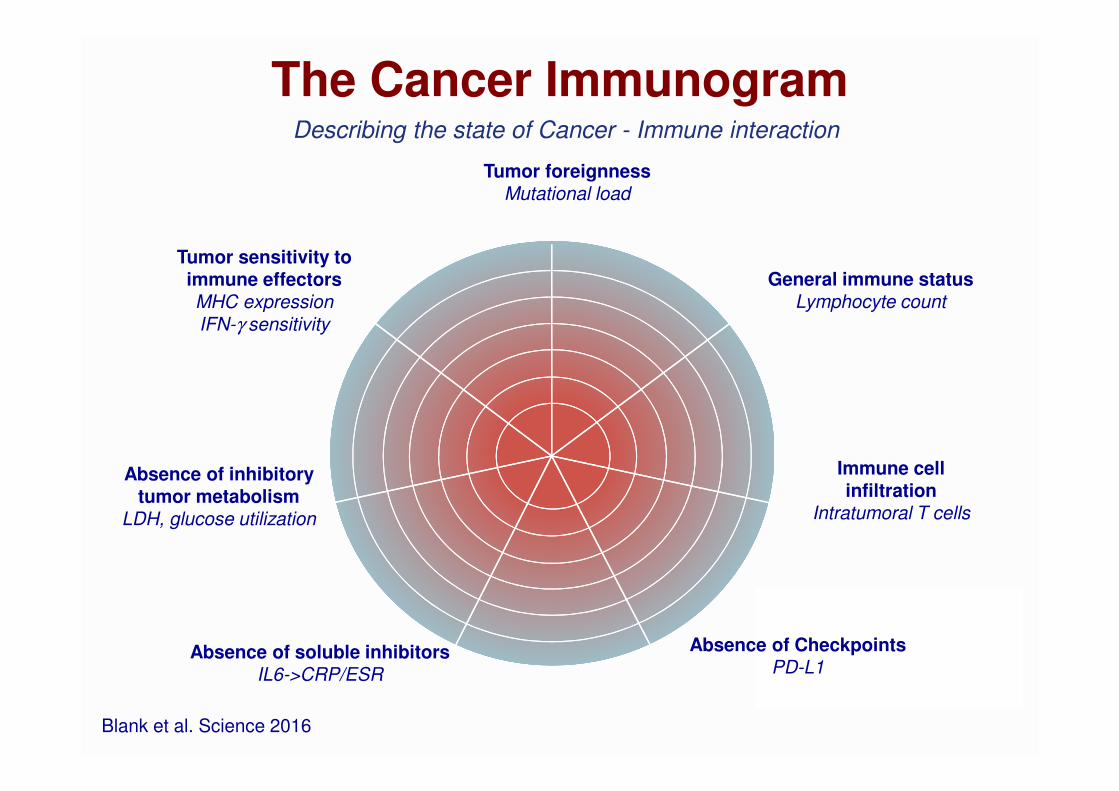
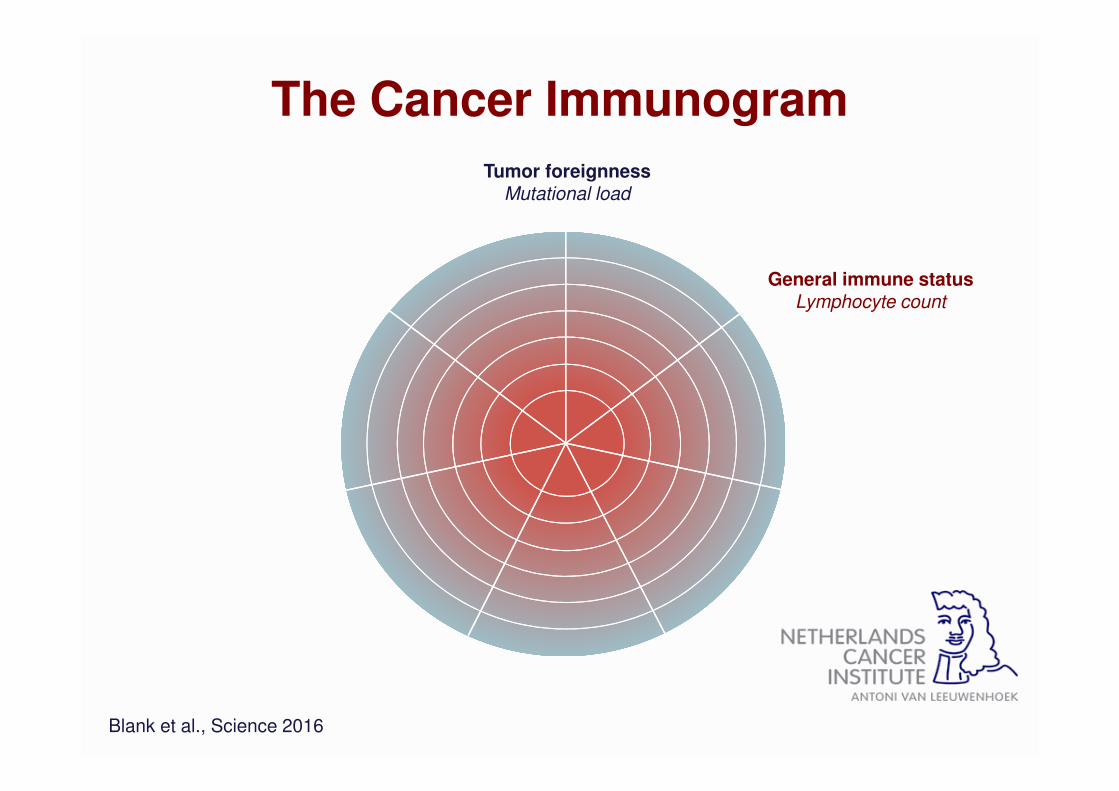
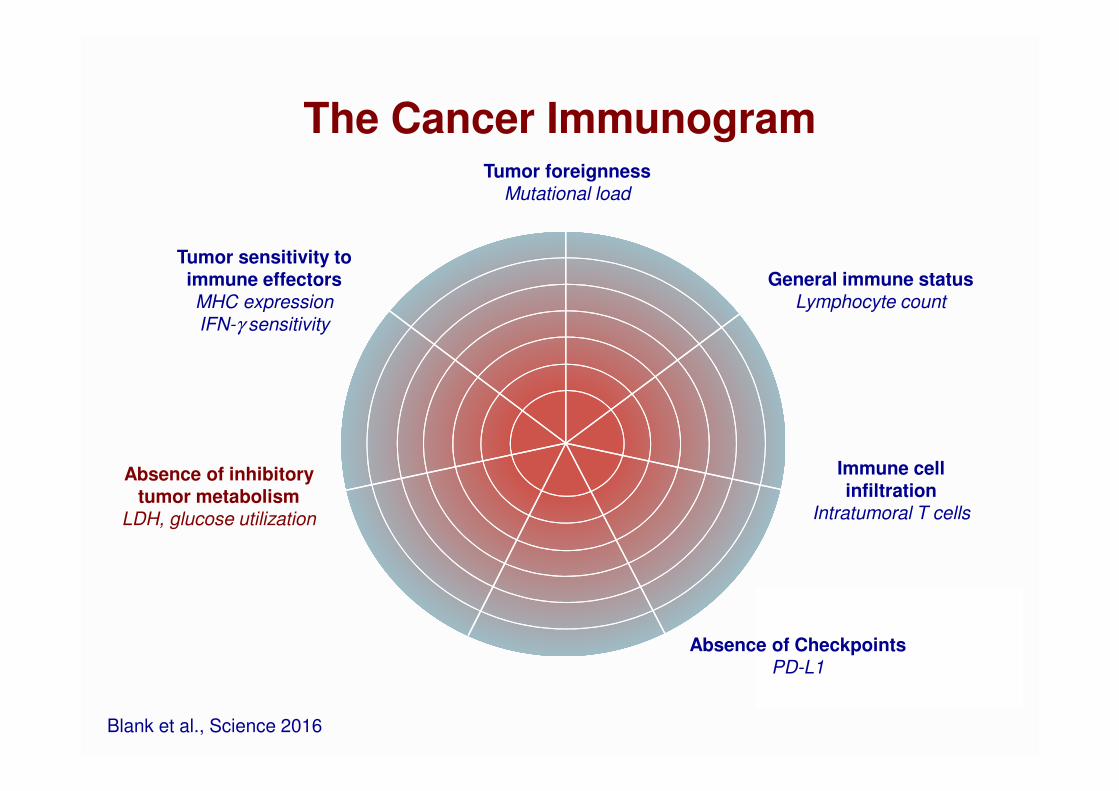
Tumor foreignnessMutational load
General immune statusLymphocyte count
Immune cell infiltration
Intratumoral T cells
Absence of CheckpointsPD-L1
Absence of soluble inhibitorsIL6->CRP/ESR
Tumor sensitivity to immune effectors MHC expression
IFN-γ sensitivity
Absence of inhibitory tumor metabolism
LDH, glucose utilization
Blank et al. Science 2016
The Cancer ImmunogramDescribing the state of Cancer - Immune interaction

The Cancer Immunogram
Tumor foreignnessMutational load
Blank et al., Science 2016
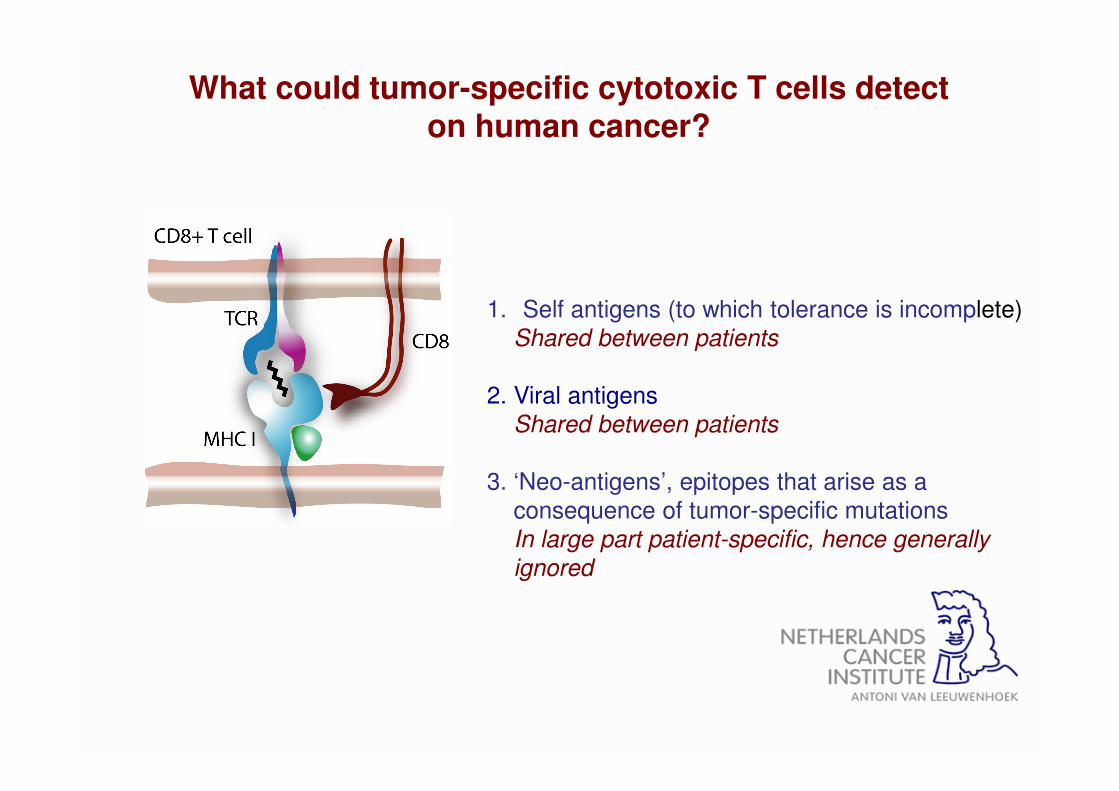
1. Self antigens (to which tolerance is incomplete)
Shared between patients
2. Viral antigens
Shared between patients
3. ‘Neo-antigens’, epitopes that arise as a
consequence of tumor-specific mutations
In large part patient-specific, hence generally
ignored
What could tumor-specific cytotoxic T cells detect on human cancer?

Generation of pMHC multimers by UV-induced peptide exchange
Peptide 1 Peptide 2 Peptide 3
Disintegration
Rescue
Peptides
Toebes et al. Nat. Med. 2006
Bakker et al. PNAS 2008
Allows generation of 1000s of pMHC in parallel
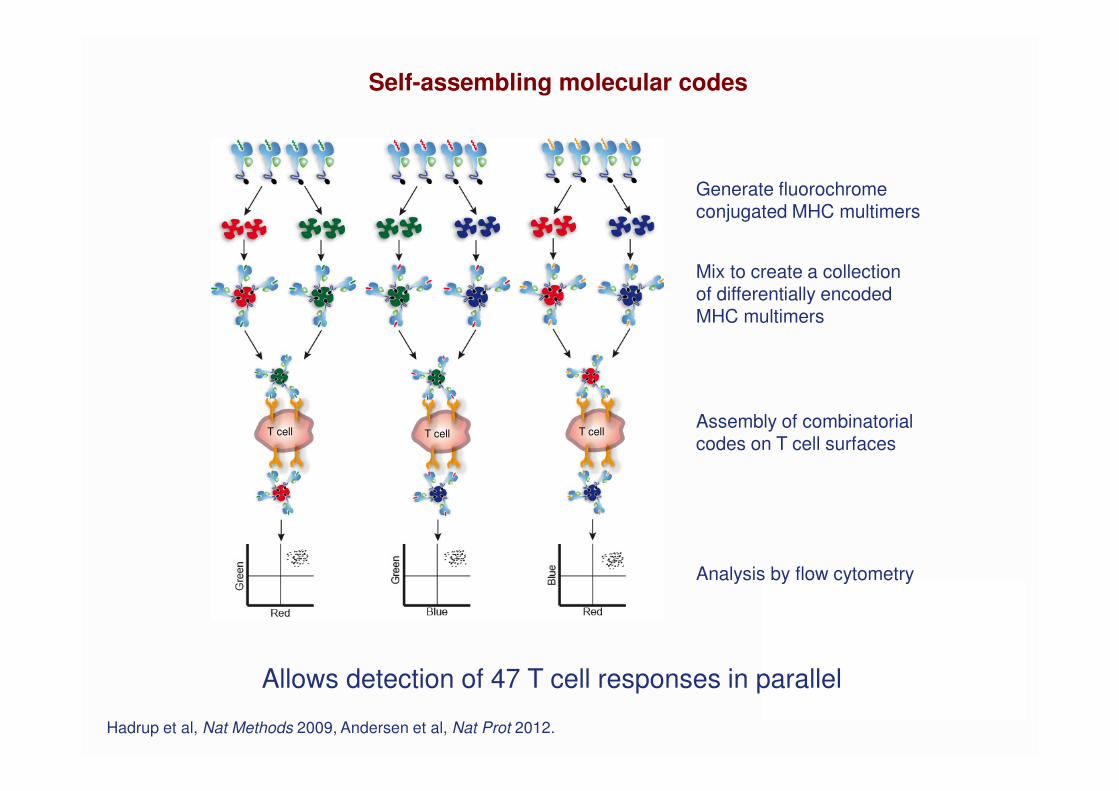
Generate fluorochromeconjugated MHC multimers
Mix to create a collectionof differentially encodedMHC multimers
Assembly of combinatorialcodes on T cell surfaces
Analysis by flow cytometry
T cell T cell T cell
Self-assembling molecular codes
Allows detection of 47 T cell responses in parallel
Hadrup et al, Nat Methods 2009, Andersen et al, Nat Prot 2012.
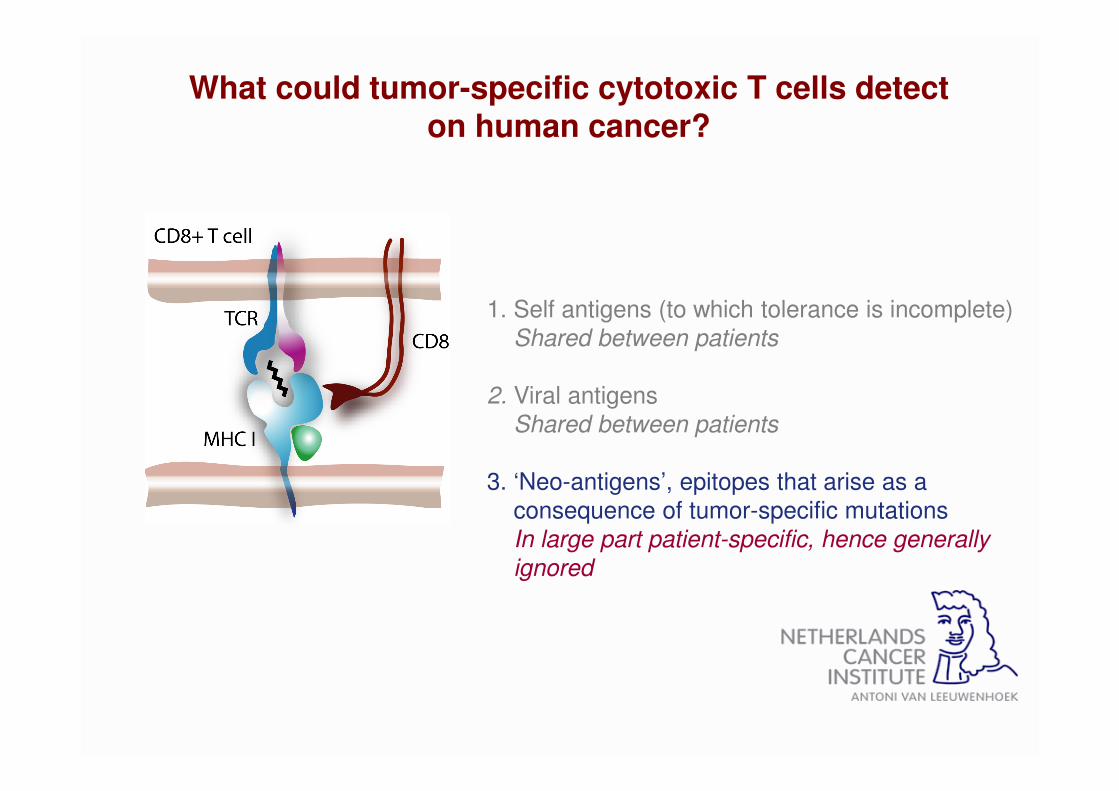
1. Self antigens (to which tolerance is incomplete)
Shared between patients
2. Viral antigens
Shared between patients
3. ‘Neo-antigens’, epitopes that arise as a
consequence of tumor-specific mutations
In large part patient-specific, hence generally
ignored
What could tumor-specific cytotoxic T cells detect on human cancer?

Predictions:
1). If recognition of neo-antigens is an important ingredient to cancer immunotherapy
one would expect that, in tumor types that are responsive to immunotherapy,
the immune system is often able to recognize mutant antigens

Predictions:
1). If recognition of neo-antigens is an important ingredient to cancer immunotherapy
one would expect that, in tumor types that are responsive to immunotherapy,
the immune system is often able to recognize mutant antigens
2). If recognition of neo-antigens is an important ingredient to cancer immunotherapy
one would expect that the extent of DNA damage correlates with the clinical
effects of cancer immunotherapy

Generate map of tumor-
specific mutations (ExomeSeq)
Determine which mutated
genes are expressed (RNASeq)
Predict epitopes for each
mutation/ each HLA-allele in silico
Screen for T cell recognition
of mutated epitopes
MDLVLNELVISLIVESKLLE
HLA-A2HLA-B7HLA-C2
T cell
Analyzing the neo-antigen-specific T cell repertoire in human cancer

Isolate tumor cells
Pt 010: complete response upon TIL therapy
Screen with MHC multimer technology
Resected tumor material
Identify tumor-specific mutations
Predict potential epitopes
Isolate tumor-infiltratingT cells
480 1 2 3.5 5 6 7 8 9 10 11 12 13 14 15
0
50
100
Months post infusion of TIL
Red
uc
tio
n in
tu
mo
r b
urd
en
Months post infusion of TIL
Tum
or
burd
en

VARST>M MYLKG>V
TIL infusion product
WDR1N>K LRP3T>S RBM12S>L
Strong T cell responses against neo-antigens in the infusion product
0.096 1.03 1.242 0.290 29
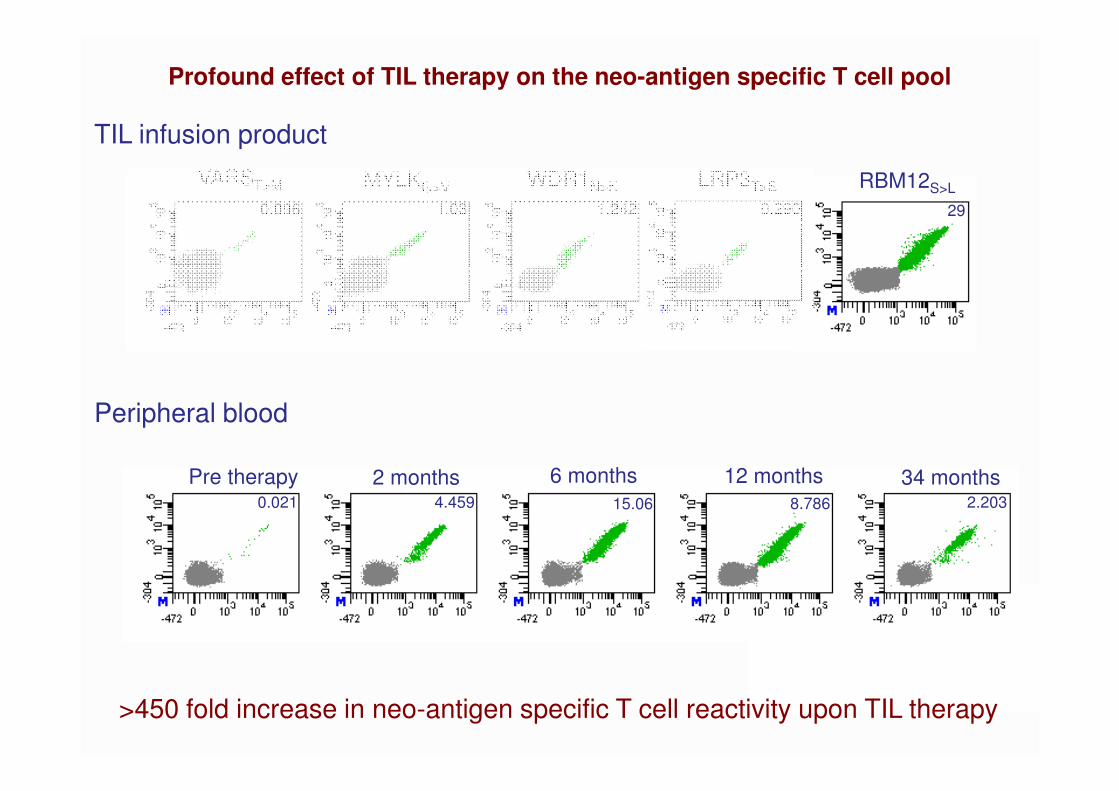
TIL infusion product
Profound effect of TIL therapy on the neo-antigen specific T cell pool
Peripheral blood
Pre therapy 2 months 6 months 12 months 34 months4.4590.021 15.06 2.2038.786
VARST>M MYLKG>V WDR1N>K LRP3T>S RBM12S>L
0.096 1.03 1.242 0.290 29
>450 fold increase in neo-antigen specific T cell reactivity upon TIL therapy
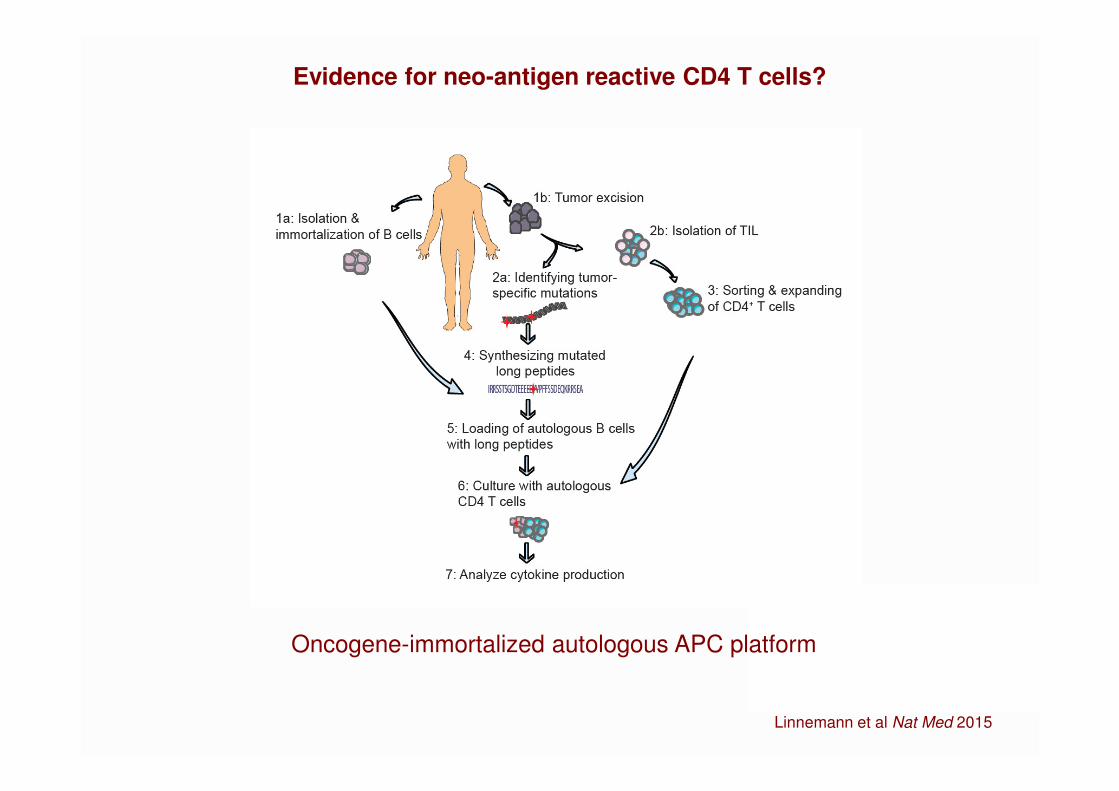
Evidence for neo-antigen reactive CD4 T cells?
Oncogene-immortalized autologous APC platform
Linnemann et al Nat Med 2015
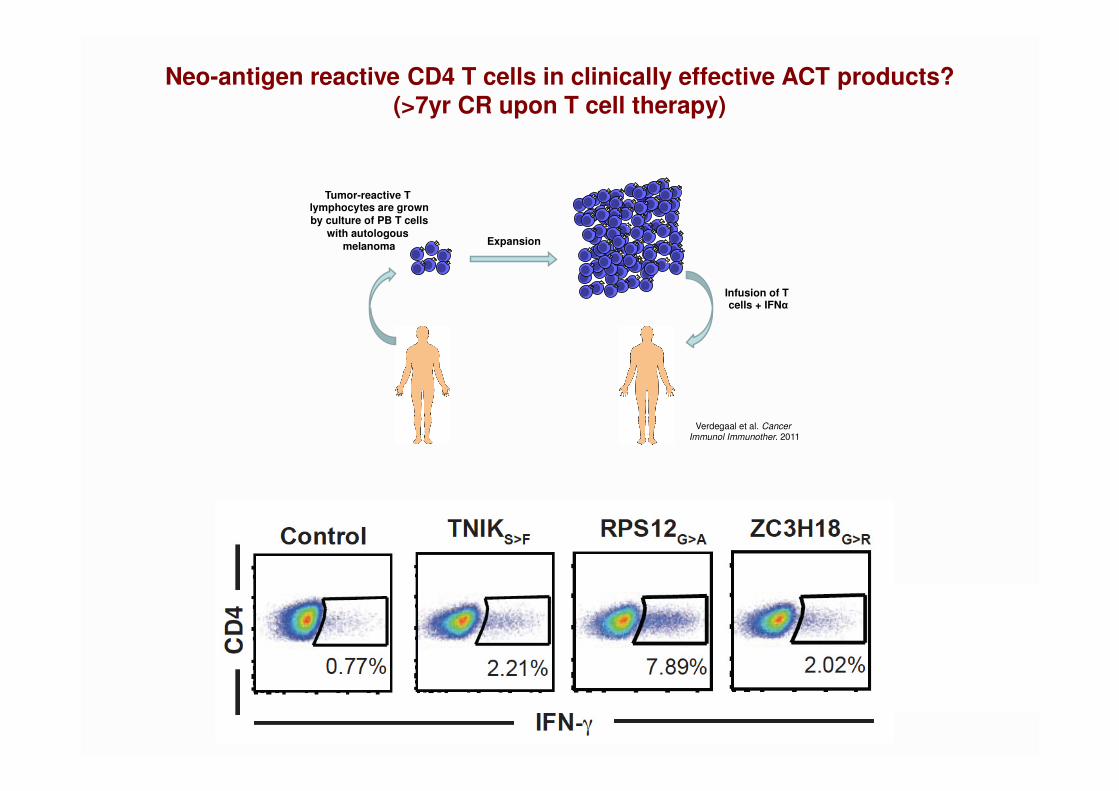
Neo-antigen reactive CD4 T cells in clinically effective ACT products?(>7yr CR upon T cell therapy)
Verdegaal et al. Cancer Immunol Immunother. 2011
Tumor-reactive T lymphocytes are grown
by culture of PB T cells
with autologous
melanoma
Infusion of T cells + IFNα
Expansion
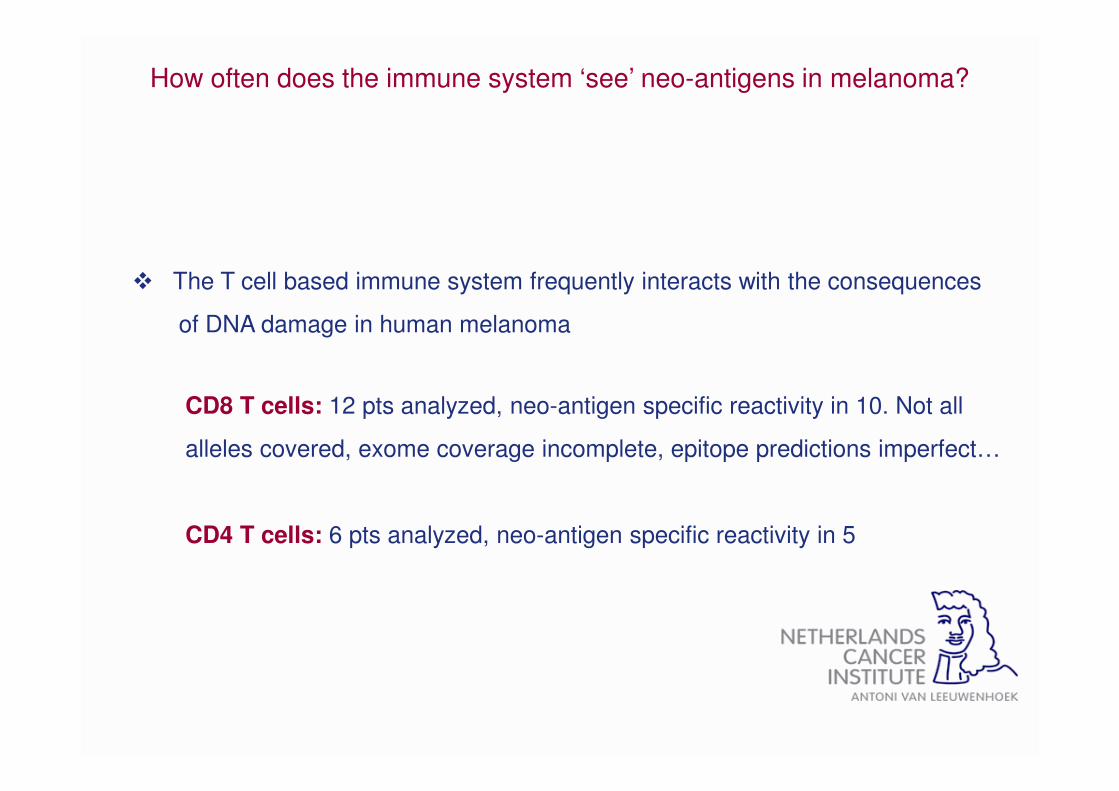
How often does the immune system ‘see’ neo-antigens in melanoma?
� The T cell based immune system frequently interacts with the consequences
of DNA damage in human melanoma
CD8 T cells: 12 pts analyzed, neo-antigen specific reactivity in 10. Not all
alleles covered, exome coverage incomplete, epitope predictions imperfect…
CD4 T cells: 6 pts analyzed, neo-antigen specific reactivity in 5
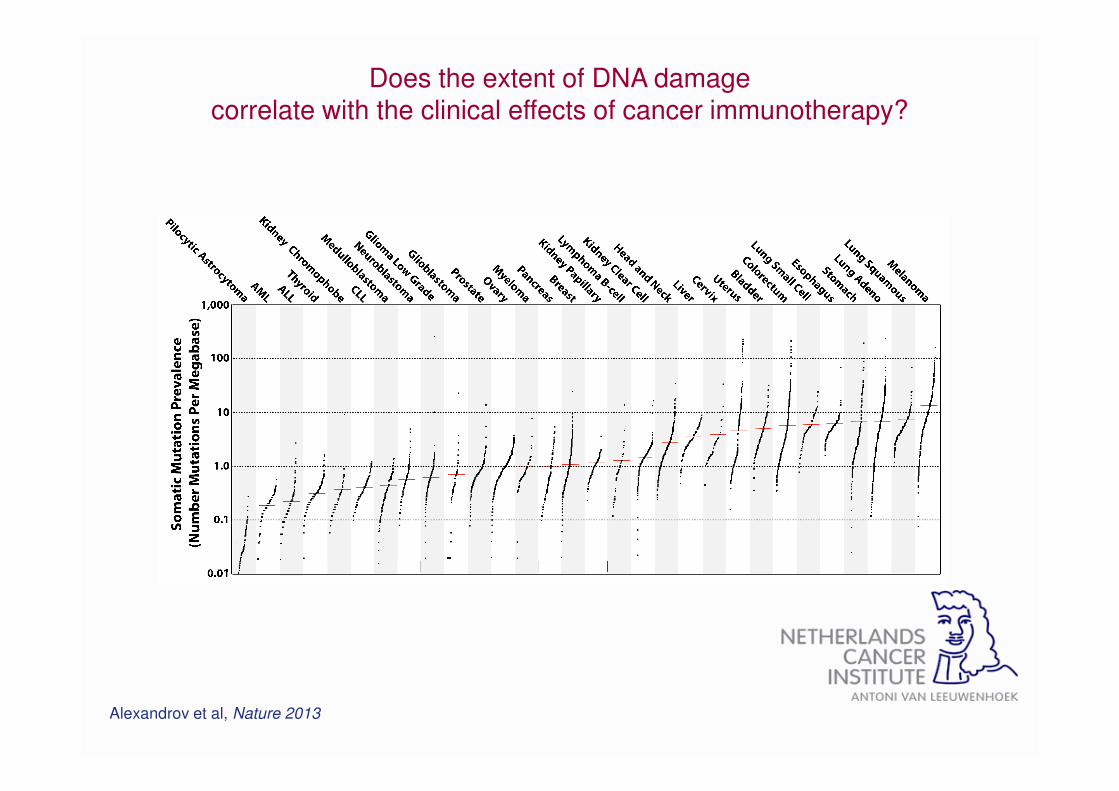
Does the extent of DNA damagecorrelate with the clinical effects of cancer immunotherapy?
Alexandrov et al, Nature 2013
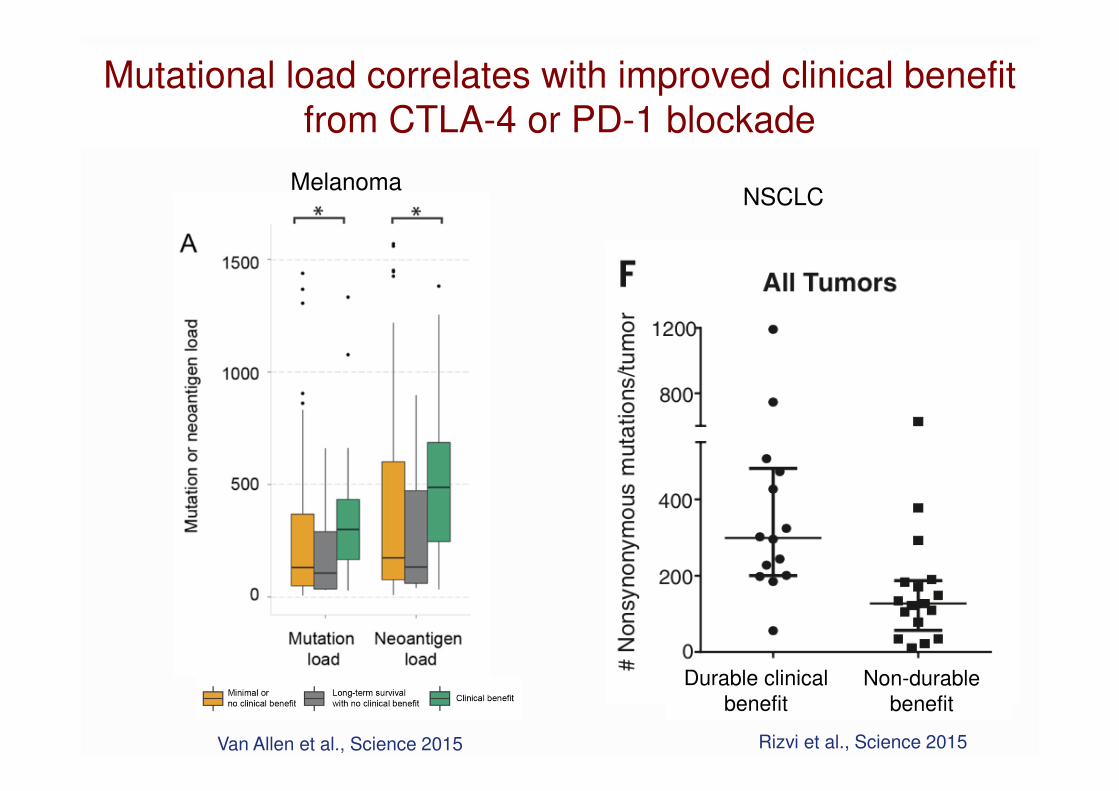
Van Allen et al., Science 2015 Rizvi et al., Science 2015
Mutational load correlates with improved clinical benefit
from CTLA-4 or PD-1 blockade
Durable clinical
benefitNon-durable
benefit
MelanomaNSCLC
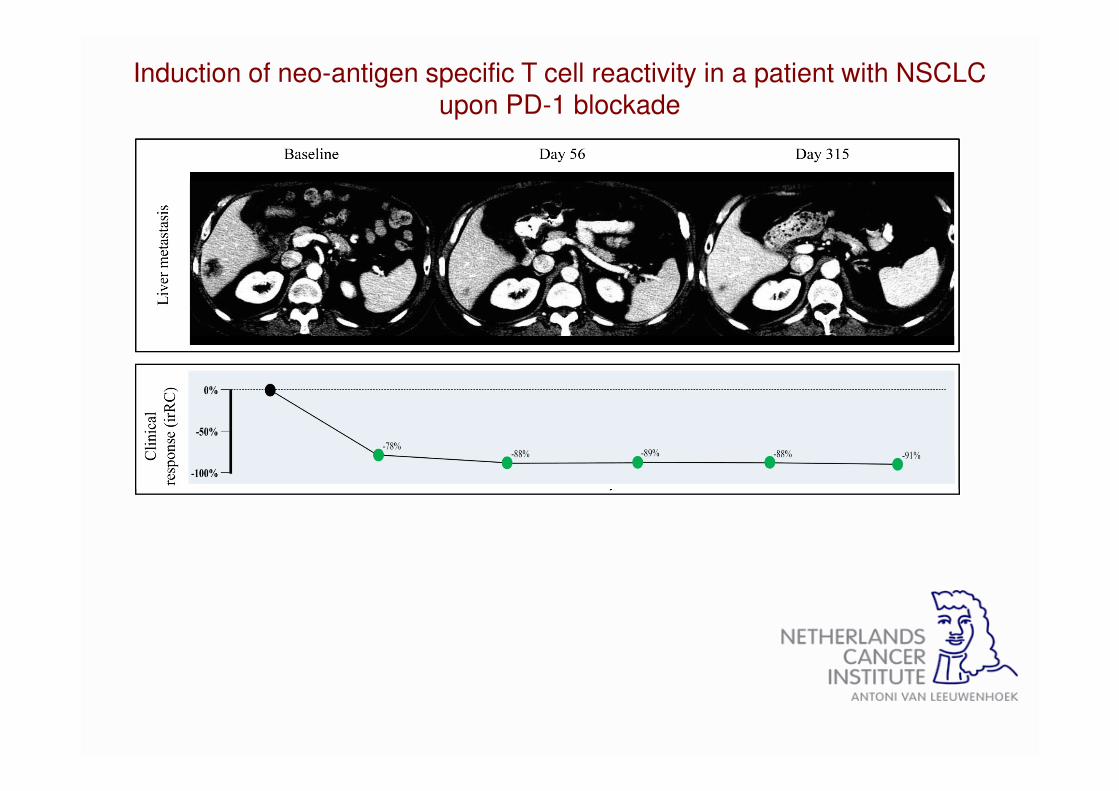
Induction of neo-antigen specific T cell reactivity in a patient with NSCLC upon PD-1 blockade
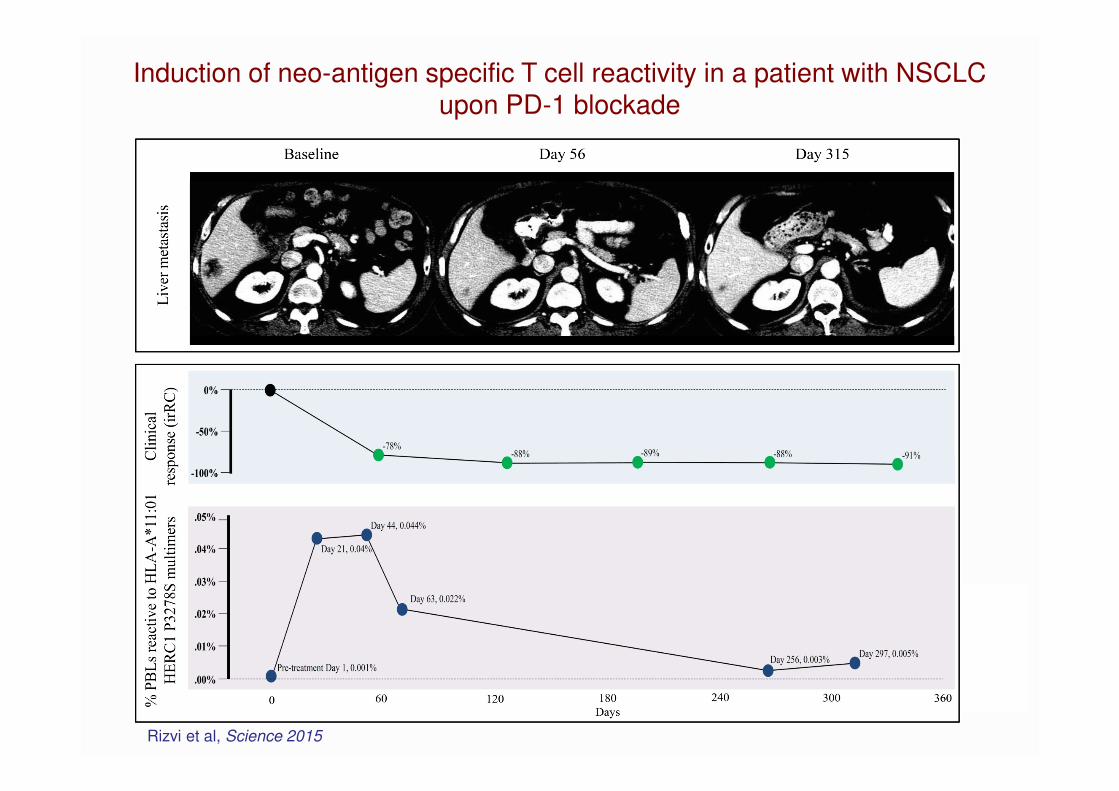
Induction of neo-antigen specific T cell reactivity in a patient with NSCLC upon PD-1 blockade
Rizvi et al, Science 2015
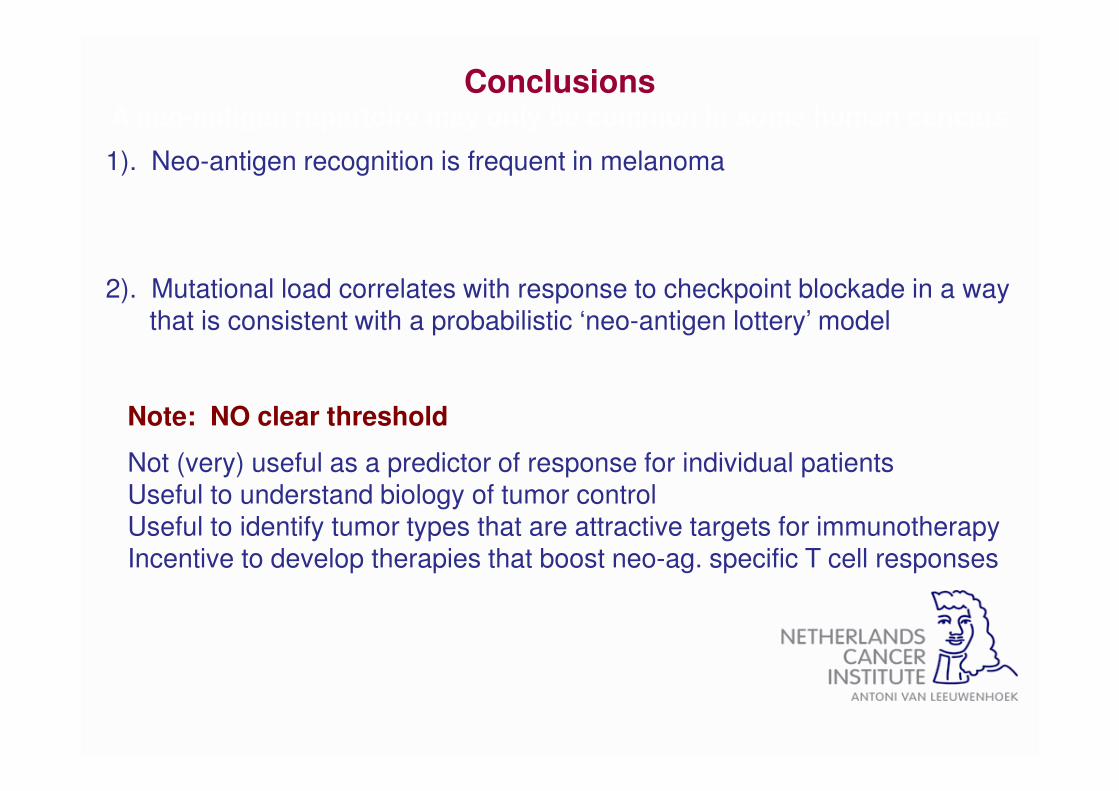
ConclusionsA neo-antigen repertoire may only be common in some human cancers
1). Neo-antigen recognition is frequent in melanoma
2). Mutational load correlates with response to checkpoint blockade in a way that is consistent with a probabilistic ‘neo-antigen lottery’ model
Note: NO clear threshold
Not (very) useful as a predictor of response for individual patientsUseful to understand biology of tumor control Useful to identify tumor types that are attractive targets for immunotherapyIncentive to develop therapies that boost neo-ag. specific T cell responses
The Cancer Immunogram
Tumor foreignnessMutational load
General immune statusLymphocyte count
Blank et al., Science 2016
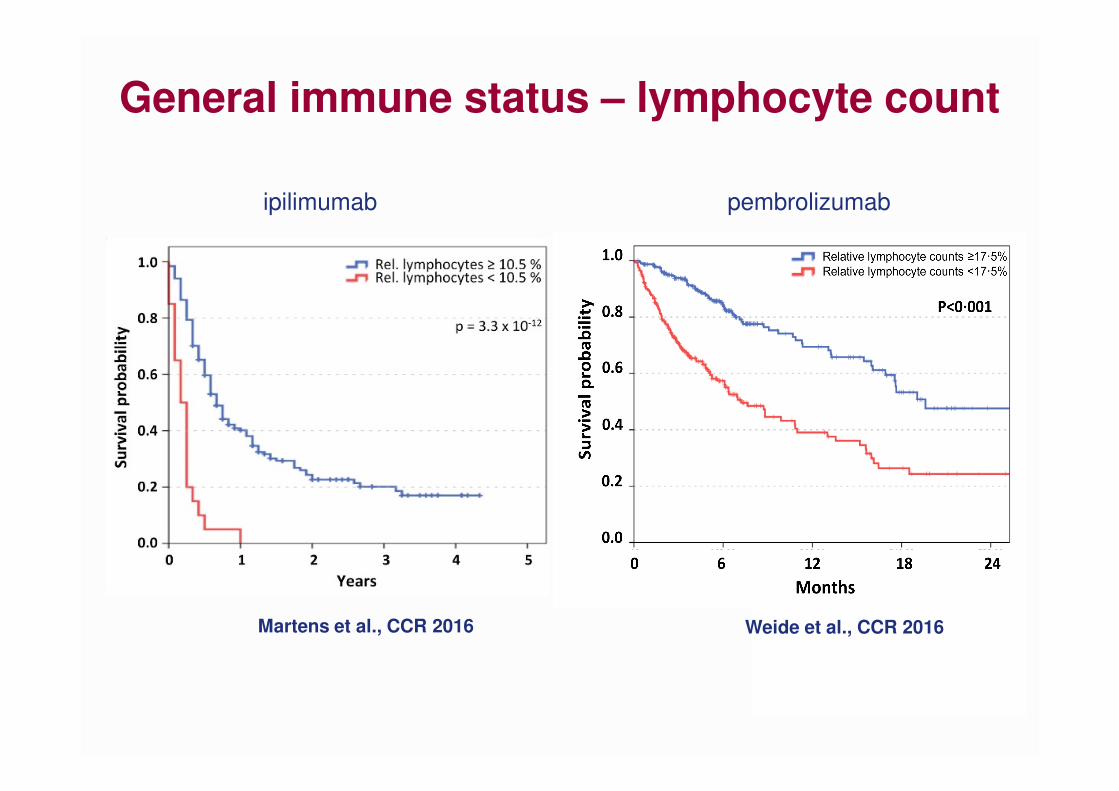
Weide et al., CCR 2016Martens et al., CCR 2016
General immune status – lymphocyte count
ipilimumab pembrolizumab
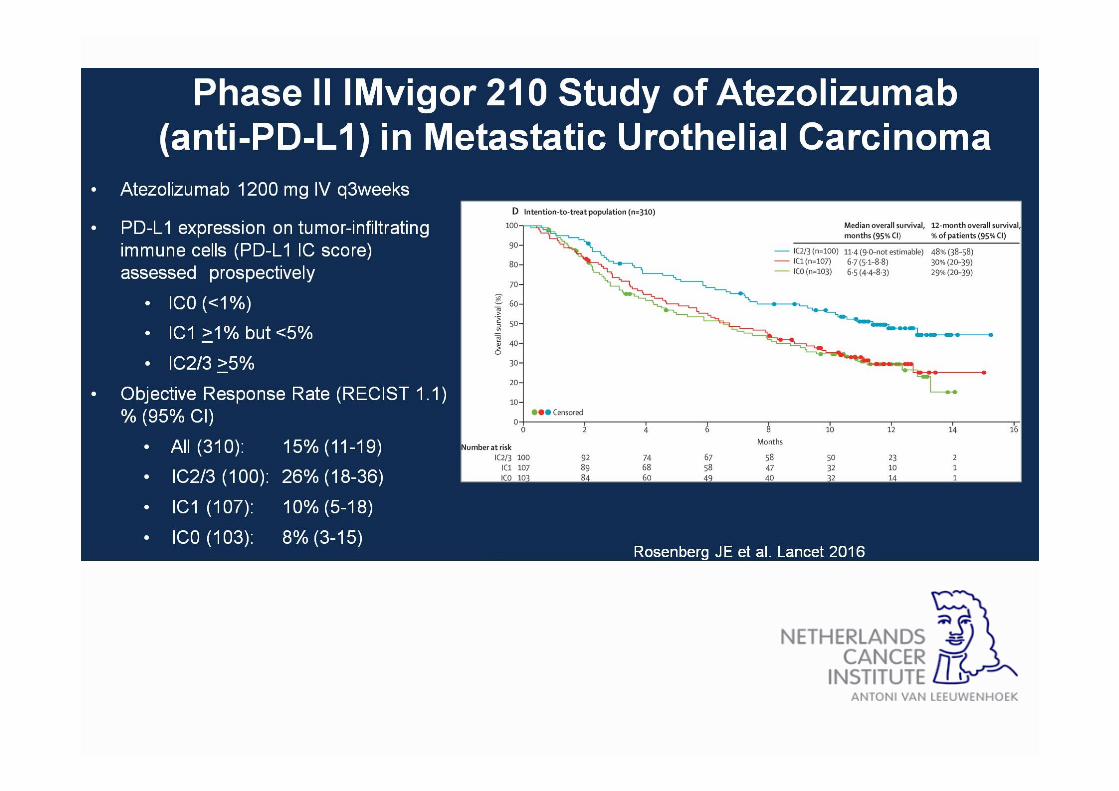
Phase II IMvigor 210 Study of Atezolizumab <br />(anti-PD-L1) in Metastatic Urothelial Carcinoma

Pretreatment peripheral blood T cell
clonality analysis
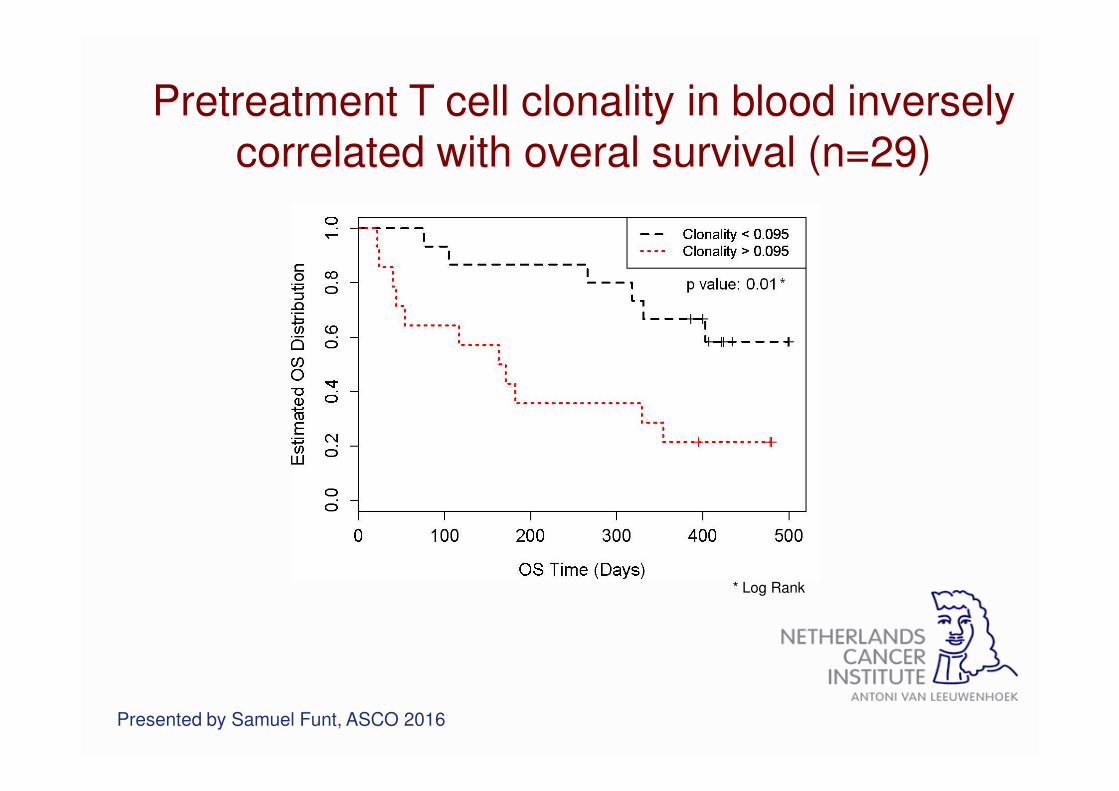
Pretreatment T cell clonality in blood inversely correlated with overal survival (n=29)
* Log Rank
Presented by Samuel Funt, ASCO 2016

The Cancer Immunogram
Tumor foreignnessMutational load
General immune statusLymphocyte count
Immune cell infiltration
Intratumoral T cells
Blank et al., Science 2016

Response to anti-PD1 is associated with baseline
T cell infiltration in melanoma
Tumeh et al., Nature 2014
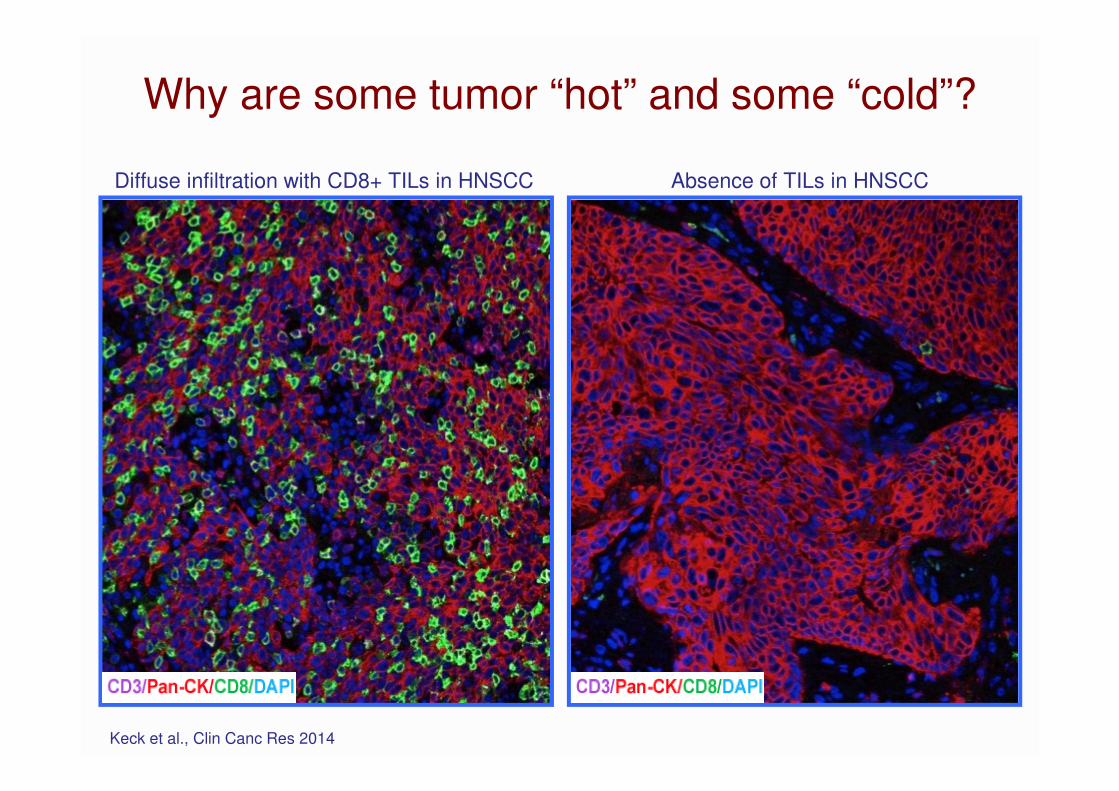
Why are some tumor “hot” and some “cold”?
Keck et al., Clin Canc Res 2014
Diffuse infiltration with CD8+ TILs in HNSCC Absence of TILs in HNSCC
Probably accounts for <10% of “cold” tumors

TIL clonality and outcome in melanoma and bladder cancer
• T cell repertoire assessment by TCRβ sequencing
• High TIL clonality associated with improved
outcome

The Cancer Immunogram
Tumor foreignnessMutational load
General immune statusLymphocyte count
Immune cell infiltration
Intratumoral T cells
Absence of CheckpointsPD-L1
Blank et al., Science 2016

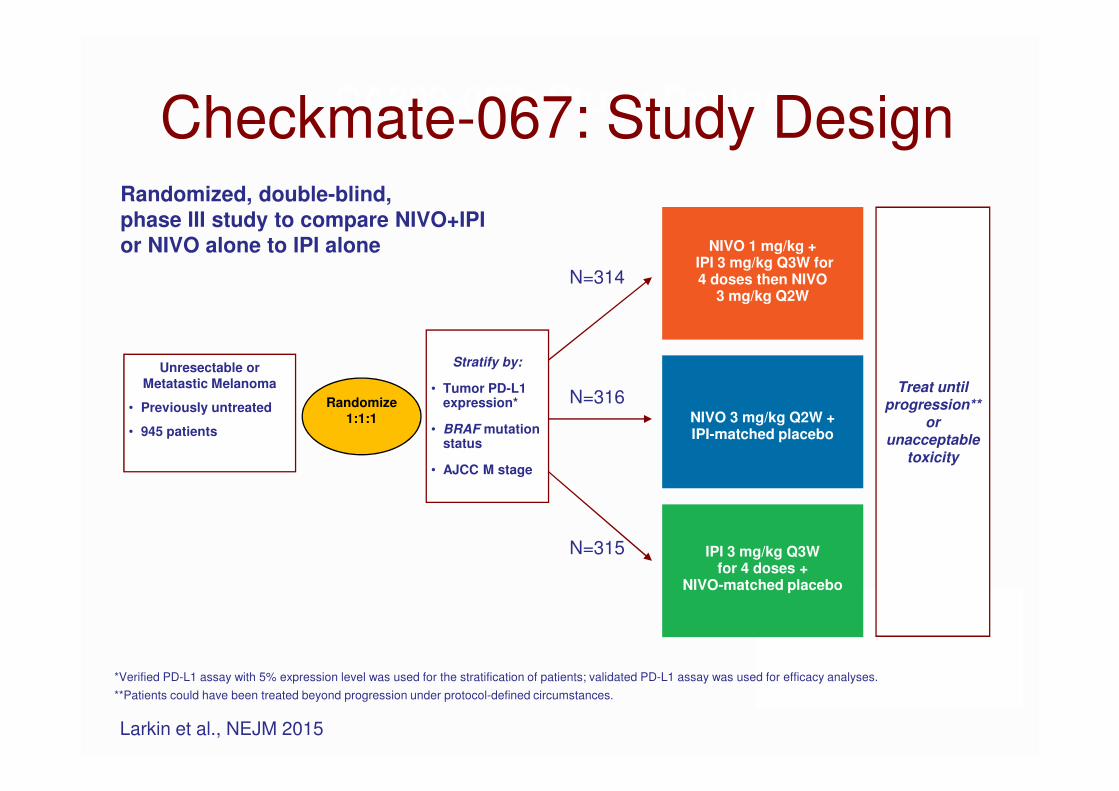
Unresectable or
Metatastic Melanoma
• Previously untreated
• 945 patients
CA209-067: Study Design Checkmate-067: Study Design
Treat until progression**
orunacceptable
toxicity
NIVO 3 mg/kg Q2W +IPI-matched placebo
NIVO 1 mg/kg + IPI 3 mg/kg Q3W for 4 doses then NIVO
3 mg/kg Q2W
IPI 3 mg/kg Q3W for 4 doses +
NIVO-matched placebo
Randomize
1:1:1
Stratify by:
• Tumor PD-L1 expression*
• BRAF mutation status
• AJCC M stage
N=314
N=316
N=315
Randomized, double-blind, phase III study to compare NIVO+IPI or NIVO alone to IPI alone
*Verified PD-L1 assay with 5% expression level was used for the stratification of patients; validated PD-L1 assay was used for efficacy analyses.
**Patients could have been treated beyond progression under protocol-defined circumstances.
Larkin et al., NEJM 2015

Progression-free Survival by Tumor PD-L1 Expression
• For the original PD-L1 PFS analysis, the descriptive hazard ratio comparing NIVO+IPI vs NIVO was 0.96, with a similar median PFS in both groups (14 months)
Database lock Nov 2015
NIVO + IPI (N=210)
NIVO(N=208)
IPI(N=202)
Median PFS, months (95% CI)
11.1(8.0–22.2)
5.3(2.8–7.1)
2.8(2.8–3.1)
HR (95% CI) vs NIVO
0.74 (0.58–0.96)*
─ ─
NIVO + IPI
(N=212)NIVO
(N=218)IPI
(N=215)
Median PFS, months (95% CI)
NR(9.7─NR)
22.0(8.9─NR)
3.9(2.8–4.2)
HR (95% CI) vs. NIVO
0.87 (0.54–1.41)*
─ ─
Pe
rce
nta
ge
of
PF
S
PFS (months)
0
10
20
30
40
50
60
70
80
90
100
0 3 6 9 12 15 18 272421
210
208
202
113
89
45
86
69
26
69
55
12
5
7
0
142
108
82
101
75
34
81
62
22
31
29
7
0
0
0
Number of
patients at risk:
NIVO + IPI
NIVO
IPI
NIVO + IPI
NIVO
IPI
Tumor PD-L1 Expression Level <5%
*Exploratory endpoint
Pe
rce
nta
ge
of
PF
S
PFS (months)
0
10
20
30
40
50
60
70
80
90
100
0 3 6 9 12 15 18 272421
*Exploratory endpoint
68
80
75
44
51
21
33
39
14
22
36
8
3
1
2
53
57
40
39
45
17
31
37
12
13
16
6
0
0
0
Number of
patients at risk:
NIVO + IPI
NIVO
IPI
NIVO + IPI
NIVO
IPI
Tumor PD-L1 Expression Level ≥5%

Response to Treatment by Tumor PD-L1 Expression*
NIVO+IPI NIVO IPI
PD-L1(≥5%)
ORR, %(95% CI)
72.1(59.9–82.3)
57.5(45.9–68.5)
21.3(12.7–32.3)
Median Duration of Response
(months)NR 20.7 NR
PD-L1(<5%)
ORR, %(95% CI)
54.8(47.8–61.6)
41.3(34.6–48.4)
17.8(12.8–23.8)
Median Duration of Response
(months)NR 22.3 18.2
*Pre-treatment tumor specimens were centrally assessed by PD-L1 immunohistochemistry (using a validated BMS/Dako assay).
Database lock Nov 2015
Presented by Wolchok at ASCO 2016

Higher T cell infiltration and clonality are associated with higher PD-L1 expression
Presented By Samuel Funt at 2016 ASCO Annual Meeting

The Cancer Immunogram
Tumor foreignnessMutational load
General immune statusLymphocyte count
Immune cell infiltration
Intratumoral T cells
Absence of CheckpointsPD-L1
Tumor sensitivity to immune effectors MHC expression
IFN-γ sensitivity
Blank et al., Science 2016

Carette et al., Science 2009
Understanding tumor cell resistance to T cell attack by haploid screening

Red => sensitive cells
Green => resistant cells
T cells are added Resistant cells are
enriched
Understanding tumor cell resistance to T cell attack by haploid screening

• IFNGR1
• IFNGR2
• JAK1
• JAK2
• STAT1
• IFN inducible gene
• IFN unrelated genes, part of the same complex.
2:1 1:1 0,5:1
0,25:1 0,125:1 0
WT
2:1 1:1 0,5:1
0,25:1 0,125:1 0
KO Wild type Knock-out
Understanding tumor cell resistance to T cell attack by haploid screeningHits obtained:

Tumors may loose MHC expression
The Cancer ImmunogramTumor foreignness
Mutational load
General immune statusLymphocyte count
Immune cell infiltration
Intratumoral T cells
Absence of CheckpointsPD-L1
Tumor sensitivity to immune effectors MHC expression
IFN-γ sensitivity
Absence of inhibitory tumor metabolism
LDH, glucose utilization
Blank et al., Science 2016

High LDH and poor survival to ipilimumab in melanoma
Kelderman et al., CII 2014
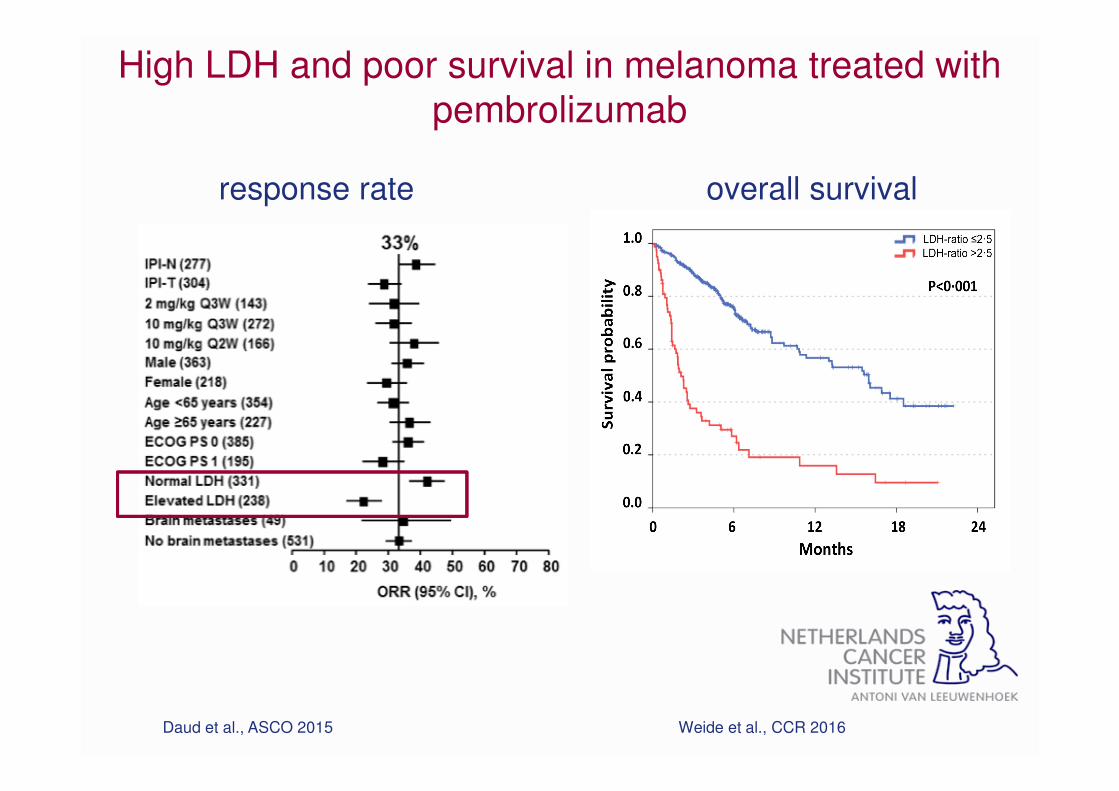
High LDH and poor survival in melanoma treated with
pembrolizumab
Daud et al., ASCO 2015 Weide et al., CCR 2016
response rate overall survival

Total population57.6% (314) 38.6% (31.3–45.2)
43.7% (316) 24.6% (17.5–31.4)
BRAF
Wild-type 53.3% (212) 35.6% (26.8–43.6)
46.8% (218) 29.1% (20.5–37.1)
Mutant 66.7% (102) 44.7% (31.5–55.6)
36.7% (98) 14.7% (2.0–26.8)
M Stage
M1c51.4% (185) 37.1% (27.9–45.4)
38.9% (185) 24.6% (15.8–33.0)
Baseline LDH
≤ULN65.3% (199) 40.6% (31.1–48.9)
51.5% (196) 26.8% (17.3–35.6)
>ULN44.7% (114) 35.2% (24.1–45.2)
30.4% (112) 20.8% (10.5–30.7)
>2x ULN37.8% (37) 37.8% (20.0–53.9)
21.6% (37) 21.6% (6.3–37.2)
Age (yr)
≥65 and <7557.4% (94) 39.5% (25.8–51.0)
48.1% (79) 30.1% (16.0–42.8)
≥7554.3% (35) 27.0% (5.3–45.8)
43.6% (39) 16.3% (-4.1–35.2)
PD-L1 Expression Level
<5%54.8% (210) 36.9% (28.0–45.0)
41.3% (208) 23.5% (14.8–31.8)
≥5%72.1% (68) 50.7% (35.0–62.8)
57.5% (80) 36.2% (21.0–49.0)
NIVO + IPI NIVO
Unweighted ORR difference vs IPI (95% CI)
70 -10103050 0
IPI betterNIVO or NIVO + IPI better
ORR in Patient SubgroupsORR (Patients)
24.7%
ORR
ipi
9.7%
0.0%

The Cancer ImmunogramTumor foreignness
Mutational load
General immune statusLymphocyte count
Immune cell infiltration
Intratumoral T cells
Absence of CheckpointsPD-L1
Absence of soluble inhibitorsIL6->CRP/ESR
Tumor sensitivity to immune effectors MHC expression
IFN-γ sensitivity
Absence of inhibitory tumor metabolism
LDH, glucose utilization
Blank et al., Science 2016
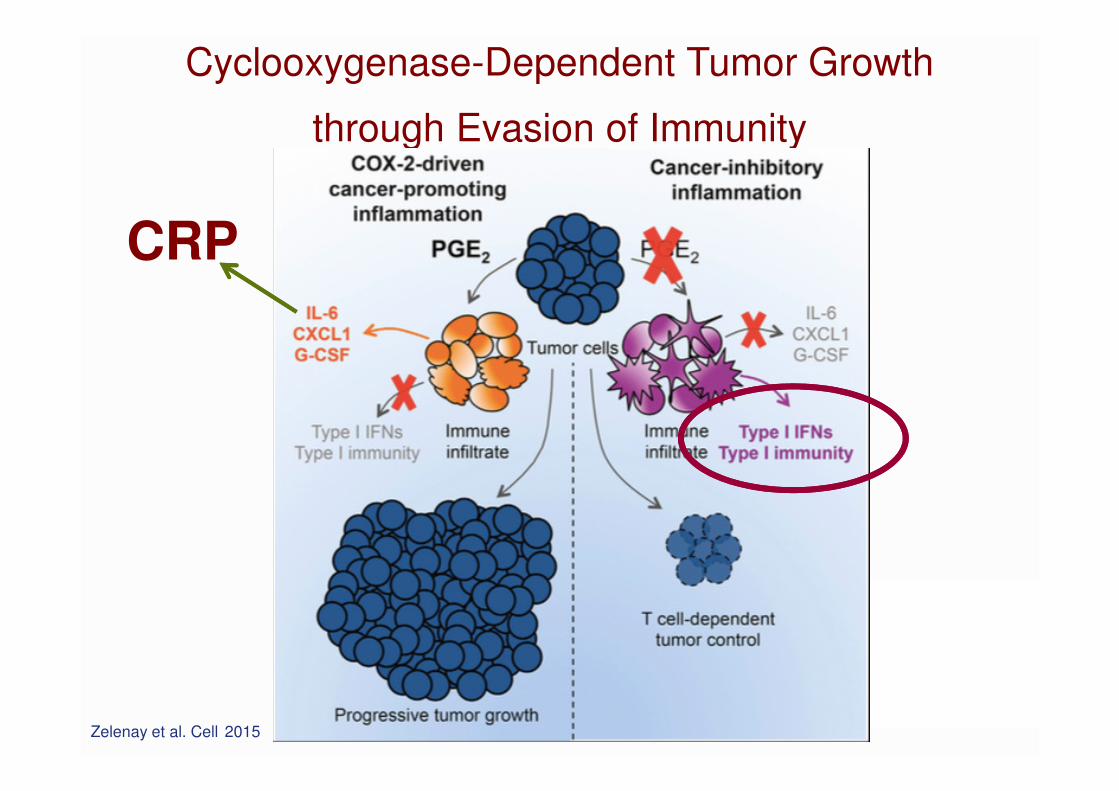
Cyclooxygenase-Dependent Tumor Growth
through Evasion of Immunity
CRP
Zelenay et al. Cell 2015

Signature Expanded in Validation Set<br />(While Blinded to Clinical Outcome)
Presented By Antoni Ribas at 2015 ASCO Annual Meeting
Tumor microenvironment-associated biomarkers – IFN
gene signatures (pembrolizumab in melanoma)

How to use the Cancer Immunogram?
Tumor foreignnessMutational load
General immune statusLymphocyte count
Immune cell infiltration
Intratumoral T cells
Absence of CheckpointsPD-L1
Absence of soluble inhibitorsIL6->CRP/ESR
Tumor sensitivity to immune effectors MHC expression
IFN-γ sensitivity
Absence of inhibitory tumor metabolism
LDH, glucose utilization
Blank et al., Science 2016
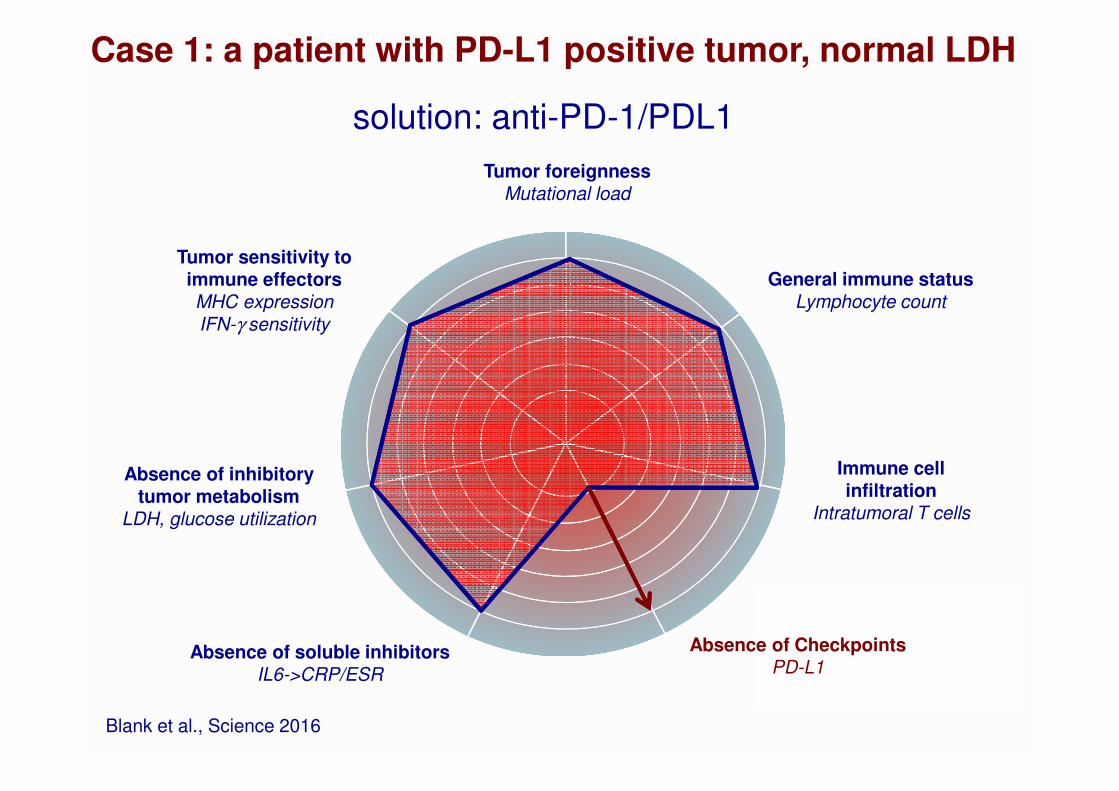
Case 1: a patient with PD-L1 positive tumor, normal LDH
Tumor foreignnessMutational load
General immune statusLymphocyte count
Immune cell infiltration
Intratumoral T cells
Absence of CheckpointsPD-L1
Absence of soluble inhibitorsIL6->CRP/ESR
Tumor sensitivity to immune effectors MHC expression
IFN-γ sensitivity
Absence of inhibitory tumor metabolism
LDH, glucose utilization
Blank et al., Science 2016
solution: anti-PD-1/PDL1
Tumor foreignnessMutational load
General immune statusLymphocyte count
Immune cell infiltration
Intratumoral T cells
Absence of CheckpointsPD-L1
Absence of soluble inhibitorsIL6->CRP/ESR
Tumor sensitivity to immune effectors MHC expression
IFN-γ sensitivity
Absence of inhibitory tumor metabolism
LDH, glucose utilization
Blank et al., Science 2016
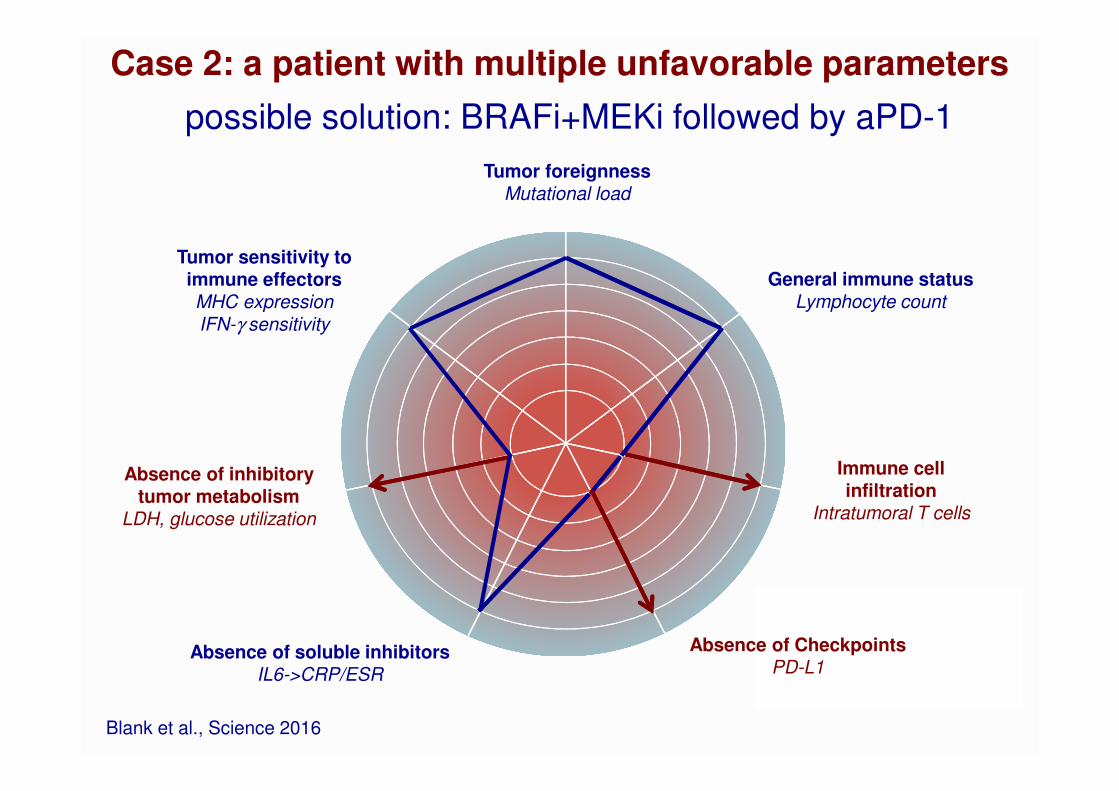
Case 2: a patient with multiple unfavorable parameters
possible solution: BRAFi+MEKi followed by aPD-1

Tumor foreignnessMutational load
General immune statusLymphocyte count
Immune cell infiltration
Intratumoral T cells
Absence of CheckpointsPD-L1
Absence of soluble inhibitorsIL6->CRP/ESR
Tumor sensitivity to immune effectors MHC expression
IFN-γ sensitivity
Absence of inhibitory tumor metabolism
LDH, glucose utilization
Blank et al., Science 2016
Case 3: tumor with few mutations and no TIL
Possible solution: adoptive T cell therapy
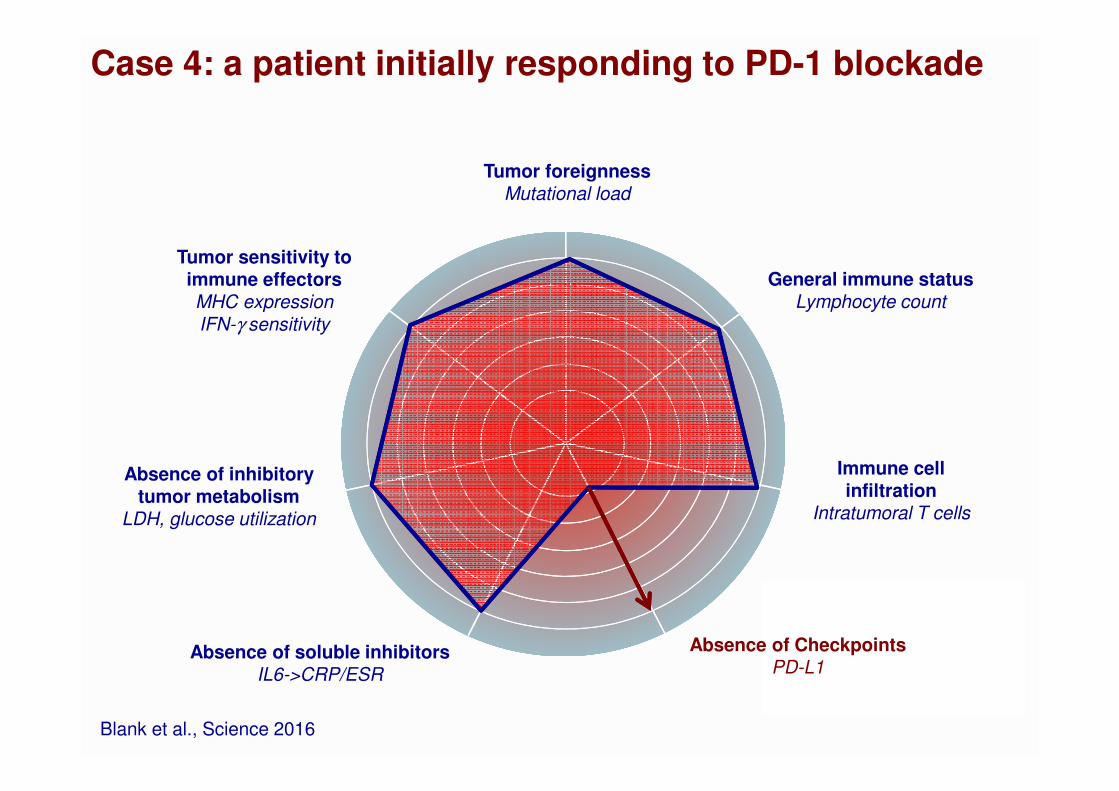
Case 4: a patient initially responding to PD-1 blockade
Tumor foreignnessMutational load
General immune statusLymphocyte count
Immune cell infiltration
Intratumoral T cells
Absence of CheckpointsPD-L1
Absence of soluble inhibitorsIL6->CRP/ESR
Tumor sensitivity to immune effectors MHC expression
IFN-γ sensitivity
Absence of inhibitory tumor metabolism
LDH, glucose utilization
Blank et al., Science 2016

Case 4: a patient responding to PD-1 blockade
Tumor foreignnessMutational load
General immune statusLymphocyte count
Immune cell infiltration
Intratumoral T cells
Absence of CheckpointsPD-L1
Absence of soluble inhibitorsIL6->CRP/ESR
Tumor sensitivity to immune effectors MHC expression
IFN-γ sensitivity
Absence of inhibitory tumor metabolism
LDH, glucose utilization
Blank et al., Science 2016
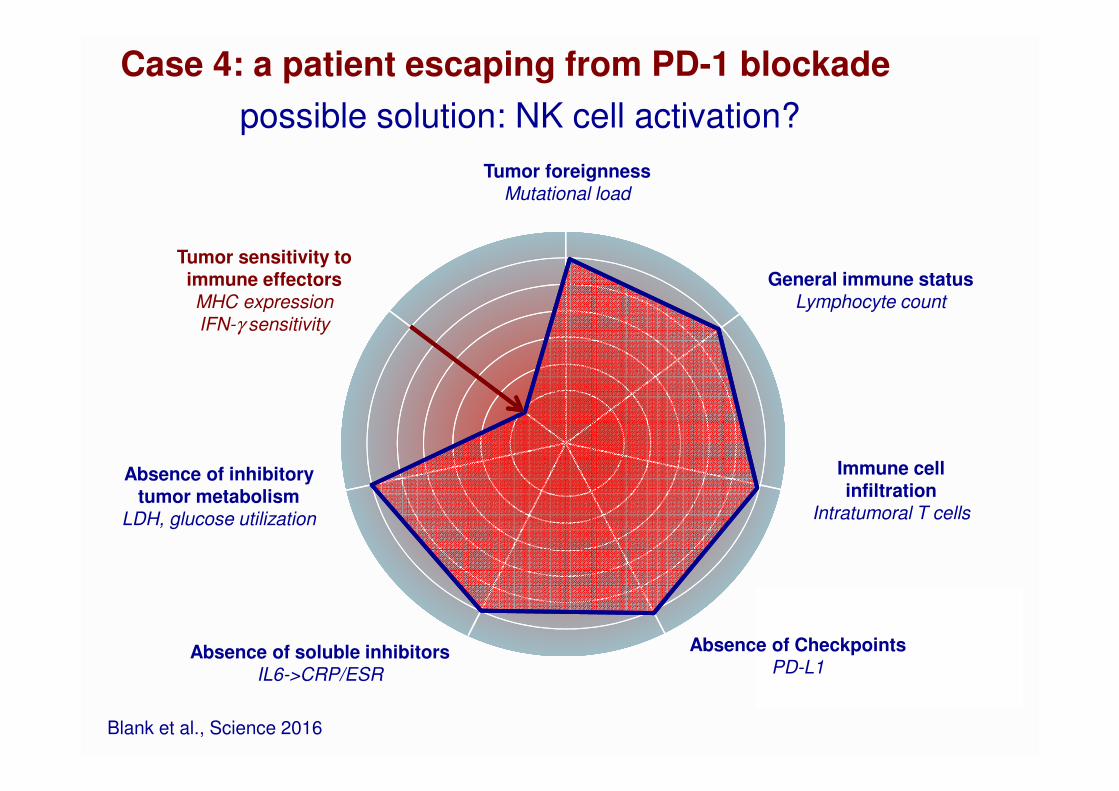
Case 4: a patient escaping from PD-1 blockade
Tumor foreignnessMutational load
General immune statusLymphocyte count
Immune cell infiltration
Intratumoral T cells
Absence of CheckpointsPD-L1
Absence of soluble inhibitorsIL6->CRP/ESR
Tumor sensitivity to immune effectors MHC expression
IFN-γ sensitivity
Absence of inhibitory tumor metabolism
LDH, glucose utilization
Blank et al., Science 2016
possible solution: NK cell activation?
conclusions
• The Cancer – Immunogram is a framework to help to
describe the cancer – immune system interaction for
individual patients and predict which aspect to target
• LDH (< 2x ULN) appears to be a solid biomarker of
response to select melanoma patients for ipilimumab
treatment
• Many biomarkers of response to CIT are in development.
Linking all this information to create a large database will
rapidly increase our understanding of immune resistance
and escape.
Netherlands Cancer Institute
Ton SchumacherPia KvistborgDaniel PeeperKarin de Visser
Christian BlankHans van ThienenMarnix GeukesSandra AdriaanszHenk MalloElsbeth van der Laan
Working group on Immunotherapy of Oncology (WIN-O)Geke HospersAlfons van den EertweghEllen KapiteijnJan Willem de GrootEdward FietsRutger KornstraWim Kruijt
Acknowledgements
Royal Marsden and Christie HospitalPaul LoriganMartin GoreJames Larkin
MIA SydneyGeorgina Long
University of TübingenBenjamin Weide
University of EssenDirk Schadendorf
University of RegensburgMarina KreutzWolfgang Herr
UCLAToni Ribas
Cancer Immunotherapy Dream Team