biomarkers on patient t cells diagnose active …...tb diagnosis and for monitoring treatment...
TRANSCRIPT

The Journal of Clinical Investigation C l i n i C a l M e d i C i n e
1 8 2 7jci.org Volume 125 Number 5 May 2015
IntroductionDiagnosis of pulmonary active tuberculosis (ATB) currently relies on evaluation of clinical symptoms, radiological assessments,and detection of Mycobacterium tuberculosis (Mtb) in patient respira-tory samples, such as sputum. Microscopic detection of Mtb in sputum smears is the most widely used method for diagnosing pulmonary ATB and for monitoring response to treatment (1). However, sputum smears are poorly sensitive and a high propor-tion (20%–66%) of tuberculosis (TB) cases are smear negative (2). Nucleic acid amplification–based tests are more sensitive for diagnosing ATB (2), but do not differentiate between live and dead Mtb and are thus not useful for monitoring treatment-mediated clearance of Mtb. Sputum culture is currently the gold standard for
TB diagnosis and for monitoring treatment response, but takes 3 to 6 weeks for results (1). Blood-based host biomarkers for diag-nosing TB are attractive alternatives to tests that rely on detecting mycobacteria. Existing blood-based tests, such as IFN-γ release assays (IGRAs), measure IFN-γ+ production in response to stimu-lation with Mtb-specific antigens ESAT6 and CFP10 and are spe-cific for Mtb infection (3, 4). However, IGRAs (e.g., QuantiFERON or T-SPOT.TB) fail to discriminate between ATB and latent Mtb infection (LTBI) (5, 6) and are inadequate for monitoring treat-ment response (7). Since CD4+ T cells are the predominant cell type producing IFN-γ in response to Mtb infection (8), we hypoth-esized that host immune markers on Mtb-specific CD4+ T cells that correlate with pathogen load could confer discriminatory capacity to IFN-γ–based assays.
Studies in chronic viral infections have shown that the phe-notypes and frequencies of virus-specific CD4+ and CD8+ T cell phenotypes correlate with viral antigen load in vivo (9, 10). Due to the large burden of replicating mycobacteria present in ATB
BACKGROUND. The identification and treatment of individuals with tuberculosis (TB) is a global public health priority. Accurate diagnosis of pulmonary active TB (ATB) disease remains challenging and relies on extensive medical evaluation and detection of Mycobacterium tuberculosis (Mtb) in the patient’s sputum. Further, the response to treatment is monitored by sputum culture conversion, which takes several weeks for results. Here, we sought to identify blood-based host biomarkers associated with ATB and hypothesized that immune activation markers on Mtb-specific CD4+ T cells would be associated with Mtb load in vivo and could thus provide a gauge of Mtb infection.
METHODS. Using polychromatic flow cytometry, we evaluated the expression of immune activation markers on Mtb-specific CD4+ T cells from individuals with asymptomatic latent Mtb infection (LTBI) and ATB as well as from ATB patients undergoing anti-TB treatment.
RESULTS. Frequencies of Mtb-specific IFN-γ+CD4+ T cells that expressed immune activation markers CD38 and HLA-DR as well as intracellular proliferation marker Ki-67 were substantially higher in subjects with ATB compared with those with LTBI. These markers accurately classified ATB and LTBI status, with cutoff values of 18%, 60%, and 5% for CD38+IFN-γ+, HLA-DR+IFN-γ+, and Ki-67+IFN-γ+, respectively, with 100% specificity and greater than 96% sensitivity. These markers also distinguished individuals with untreated ATB from those who had successfully completed anti-TB treatment and correlated with decreasing mycobacterial loads during treatment.
CONCLUSION. We have identified host blood-based biomarkers on Mtb-specific CD4+ T cells that discriminate between ATB and LTBI and provide a set of tools for monitoring treatment response and cure.
TRIAL REGISTRATION. Registration is not required for observational studies.
FUNDING. This study was funded by Emory University, the NIH, and the Yerkes National Primate Center.
Biomarkers on patient T cells diagnose active tuberculosis and monitor treatment responseToidi Adekambi,1 Chris C. Ibegbu,1,2 Stephanie Cagle,3 Ameeta S. Kalokhe,1,3 Yun F. Wang,4,5 Yijuan Hu,6 Cheryl L. Day,1,7 Susan M. Ray,3 and Jyothi Rengarajan1,3
1Emory Vaccine Center, Department of Medicine, Emory University School of Medicine, Atlanta, Georgia, USA. 2Department of Microbiology and Immunology, Yerkes National Primate Center,
Emory University, Atlanta, Georgia, USA. 3Division of Infectious Disease, Department of Medicine, Emory University School of Medicine, Atlanta, Georgia, USA. 4Department of Pathology,
Grady Memorial Hospital, Atlanta, Georgia, USA. 5Department of Pathology and Laboratory Medicine, Emory University School of Medicine, Atlanta, Georgia, USA. 6Department of Biostatistics and
Bioinformatics, Rollins School of Public Health, Emory University, Atlanta, Georgia, USA. 7Department of Microbiology and Immunology, Emory University School of Medicine, Atlanta, Georgia, USA.
Conflict of interest: T. Adekambi, C.C. Ibegbu, and J. Rengarajan are inventors on a pat-ent application that is related to this work.Submitted: July 15, 2014; Accepted: February 12, 2015.Reference information: J Clin Invest. 2015;125(5):1827–1838. doi:10.1172/JCI77990.
The Journal of Clinical Investigation C l i n i C a l M e d i C i n e
1 8 2 8 jci.org Volume 125 Number 5 May 2015
involved in antigen presenta-tion, which is highly expressed on activated antigen-specific T cells. Both CD38 and HLA-DR are early immune markers that reflect T cell activation in response to microbial infection or vaccination. Ki-67 is a nucle-ar protein that has been widely used as an intracellular prolif-eration marker due to its selec-tive expression in cycling cells (15–17). Here, we report that CD38+IFN-γ+, HLA-DR+IFN-γ+, and Ki-67+IFN-γ+CD4+ T cells each distinguished individu-als with LTBI from treatment-naive individuals with sputum culture–confirmed ATB recruit-ed from the metropolitan Atlan-ta area (Georgia, USA). These markers also accurately classi-fied individuals with ATB and LTBI recruited from the West-ern Cape in South Africa. Final-ly, we show that these markers are associated with responsive-ness to anti-TB treatment and clinical resolution of TB.
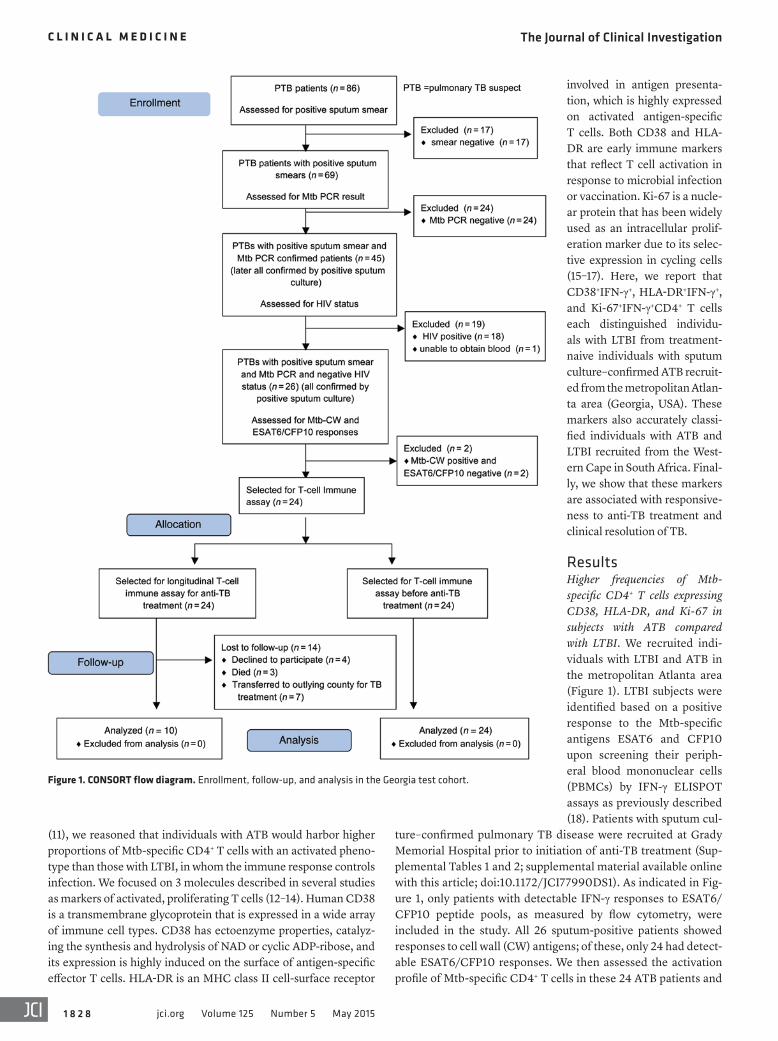
ResultsHigher frequencies of Mtb-specific CD4+ T cells expressing CD38, HLA-DR, and Ki-67 in subjects with ATB compared with LTBI. We recruited indi-viduals with LTBI and ATB in the metropolitan Atlanta area (Figure 1). LTBI subjects were identified based on a positive response to the Mtb-specific antigens ESAT6 and CFP10 upon screening their periph-eral blood mononuclear cells (PBMCs) by IFN-γ ELISPOT assays as previously described (18). Patients with sputum cul-
ture–confirmed pulmonary TB disease were recruited at Grady Memorial Hospital prior to initiation of anti-TB treatment (Sup-plemental Tables 1 and 2; supplemental material available online with this article; doi:10.1172/JCI77990DS1). As indicated in Fig-ure 1, only patients with detectable IFN-γ responses to ESAT6/CFP10 peptide pools, as measured by flow cytometry, were included in the study. All 26 sputum-positive patients showed responses to cell wall (CW) antigens; of these, only 24 had detect-able ESAT6/CFP10 responses. We then assessed the activation profile of Mtb-specific CD4+ T cells in these 24 ATB patients and
(11), we reasoned that individuals with ATB would harbor higher proportions of Mtb-specific CD4+ T cells with an activated pheno-type than those with LTBI, in whom the immune response controls infection. We focused on 3 molecules described in several studies as markers of activated, proliferating T cells (12–14). Human CD38 is a transmembrane glycoprotein that is expressed in a wide array of immune cell types. CD38 has ectoenzyme properties, catalyz-ing the synthesis and hydrolysis of NAD or cyclic ADP-ribose, and its expression is highly induced on the surface of antigen-specific effector T cells. HLA-DR is an MHC class II cell-surface receptor
Figure 1. CONSORT flow diagram. Enrollment, follow-up, and analysis in the Georgia test cohort.
The Journal of Clinical Investigation C l i n i C a l M e d i C i n e
1 8 2 9jci.org Volume 125 Number 5 May 2015
while performing laboratory analyses. PBMCs from 36 individu-als with ATB or LTBI were stimulated with Mtb-CW and ESAT6-CFP10 peptide pools, and flow cytometry analyses were performed. Using the cutoffs that were statistically determined to be predictive of ATB from the test cohort data, 17 individuals had greater than 18% frequencies of CD38+IFN-γ+, 17 individuals had greater than 60% frequencies of HLA-DR+IFN-γ+, and 12 individuals had greater than 5% frequencies of Ki-67+IFN-γ+ (Figure 5, A–C). After unblind-ing, we determined that 15 out of the 17 individuals classified as ATB by CD38+IFN-γ+ and HLA-DR+IFN-γ+ had clinically confirmed ATB, while all 12 individuals classified as ATB by Ki-67+IFN-γ+ had clinically confirmed ATB (Figure 5, A–C). Similarly, based on the cutoffs that were statistically determined to be predictive of LTBI from the test cohort, 19 individuals had frequencies of CD38+IFN-γ+ that were less than 18%, 19 individuals had frequencies of HLA-DR+IFN-γ+ that were less than 60%, and 24 individuals had frequen-cies of Ki-67+IFN-γ+ that were less than 5%. After unblinding, all 19 individuals classified as LTBI by CD38+IFN-γ+ and HLA-DR+IFN-γ+ and 21 out of 24 individuals classified as LTBI by Ki-67+IFN-γ+ were confirmed to be LTBI (Figure 5, A–C). Overall, CD38+IFN-γ+ and HLA-DR+IFN-γ+ predicted the clinical diagnosis of ATB in 100% of the cases, while Ki-67+IFN-γ+ predicted 80% of the cases.
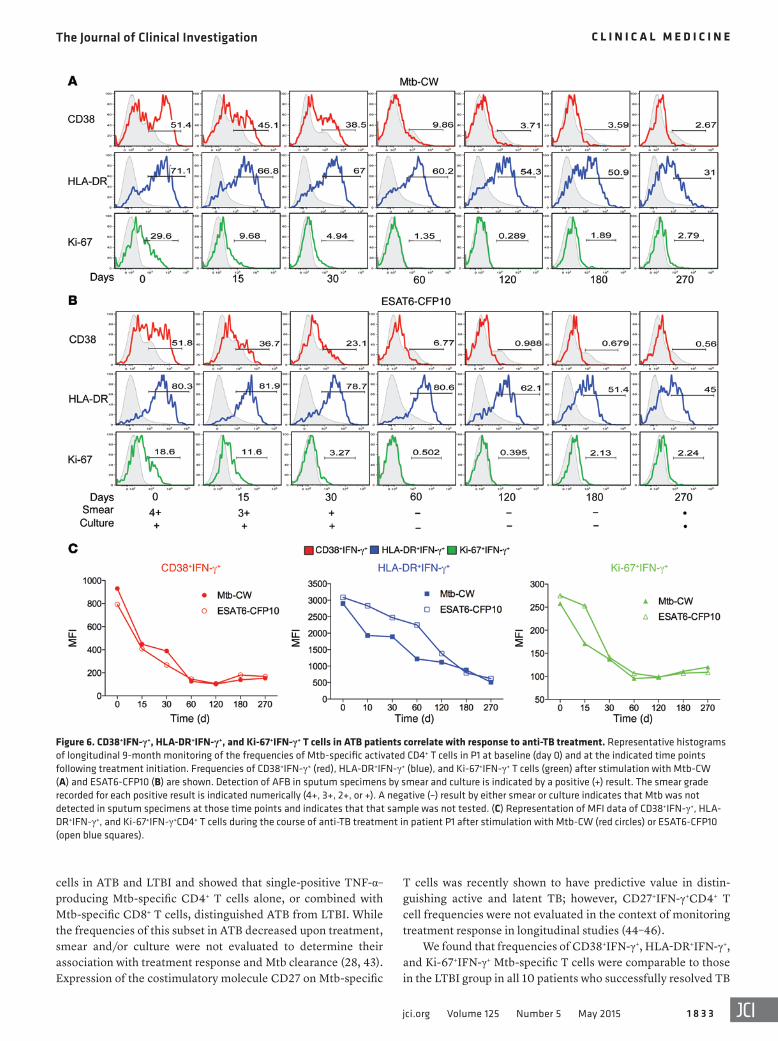
Decreases in the frequencies of activated Mtb-specific CD4+ T cells are associated with smear and culture conversion during anti-TB treatment. Markers of T cell immune activation have been shown to be associated with HIV viral load and disease progression (12–14) and correlate with response to antiretroviral therapy (20). To determine whether Mtb-specific CD38+IFN-γ+, HLA-DR+IFN-γ+, or Ki-67+IFN-γ+CD4+ T cells correlated with response to treat-ment and mycobacterial load, we performed longitudinal studies of sputum-positive pulmonary ATB patients with drug-susceptible TB (n = 10) who were enrolled prior to initiation of treatment and followed during and after successful completion of treatment (Fig-ure 1). We assessed frequencies of CD38+IFN-γ+, HLA-DR+IFN-γ+, and Ki-67+IFN-γ+CD4+ T cells at baseline (time 0) and at multiple time points after treatment initiation (Figure 6). Baseline diagnosis by sputum acid-fast bacilli (AFB) smear and culture is indicated for each patient, and sputum was monitored for AFB smear and culture conversion during treatment (Figure 6, A and B, and Figure 7A). In a representative patient, P1, frequencies of CD38+IFN-γ+, HLA-DR+IFN-γ+, and Ki-67+IFN-γ+ T cells decreased over the course of treatment in response to stimulation with Mtb-CW and ESAT6-CFP10 peptides (Figure 6, A and B), while frequencies of CD45RA–
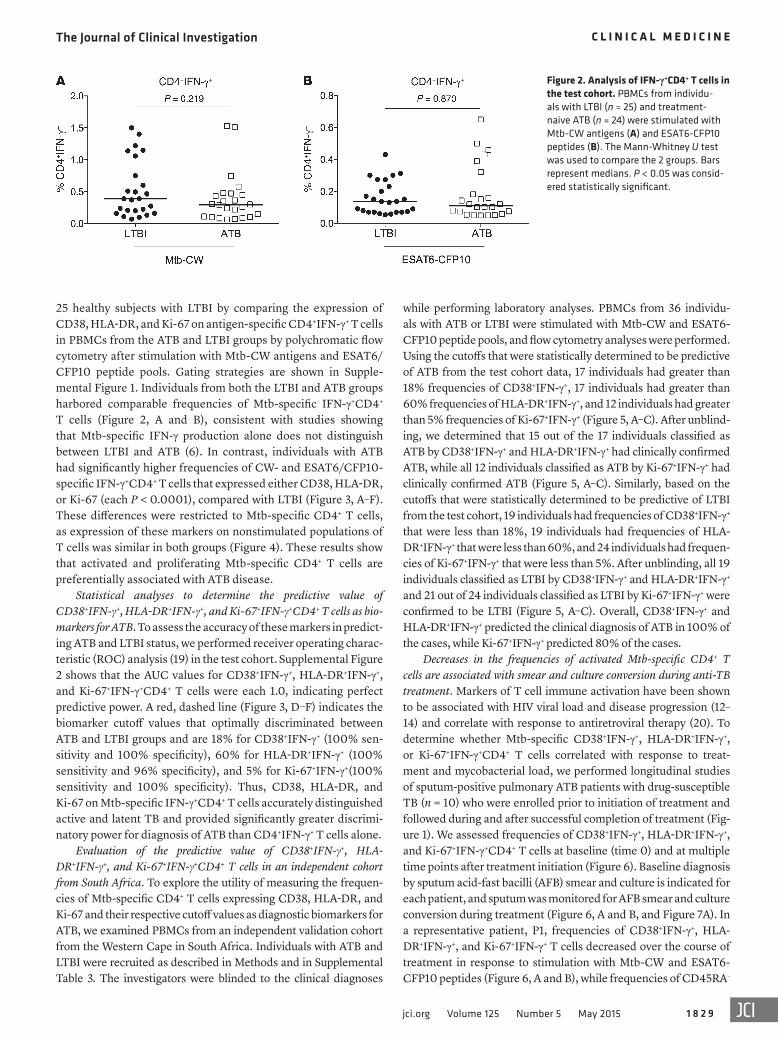
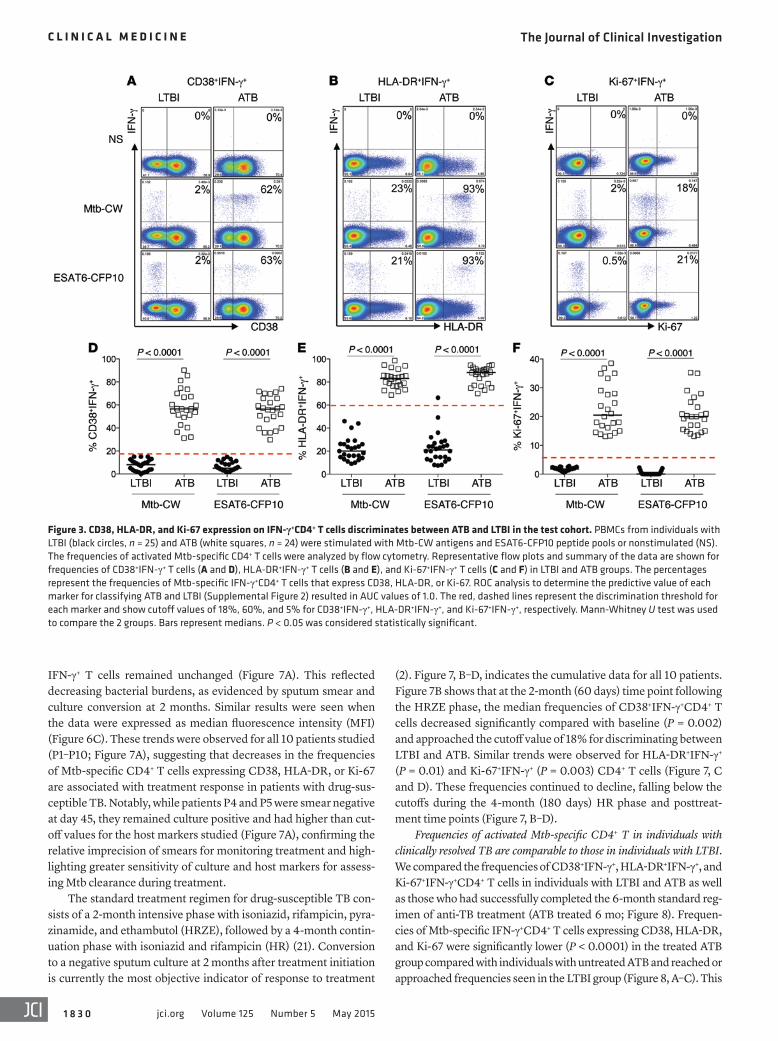
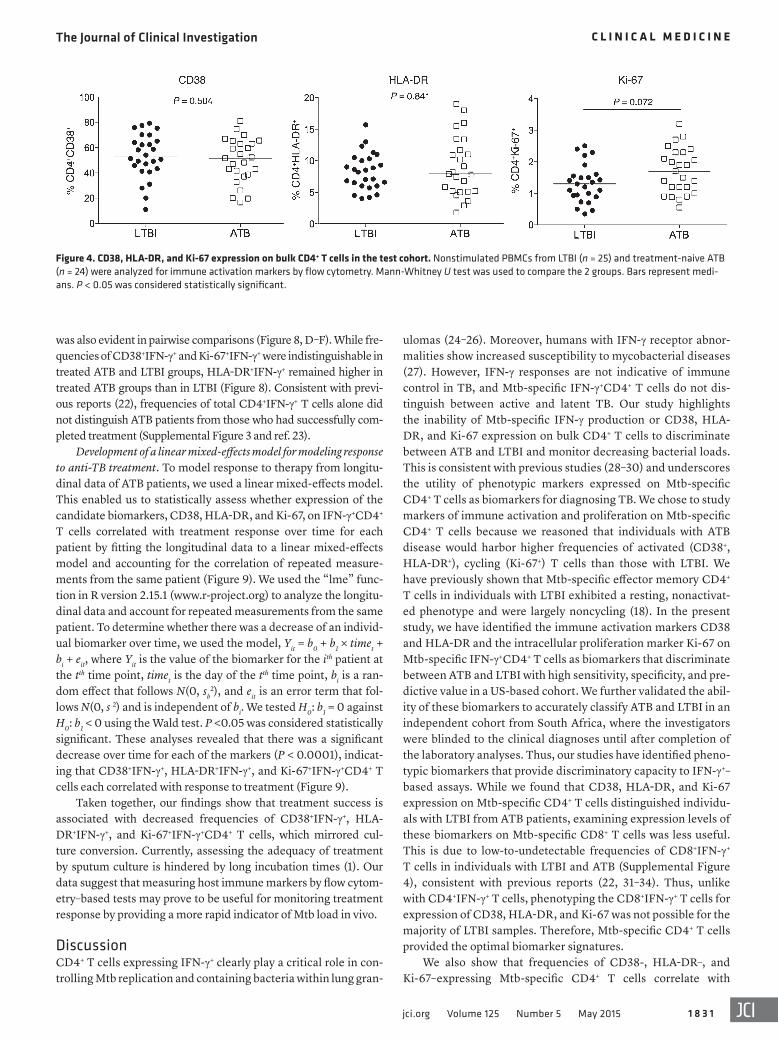
25 healthy subjects with LTBI by comparing the expression of CD38, HLA-DR, and Ki-67 on antigen-specific CD4+IFN-γ+ T cells in PBMCs from the ATB and LTBI groups by polychromatic flow cytometry after stimulation with Mtb-CW antigens and ESAT6/CFP10 peptide pools. Gating strategies are shown in Supple-mental Figure 1. Individuals from both the LTBI and ATB groups harbored comparable frequencies of Mtb-specific IFN-γ+CD4+ T cells (Figure 2, A and B), consistent with studies showing that Mtb-specific IFN-γ production alone does not distinguish between LTBI and ATB (6). In contrast, individuals with ATB had significantly higher frequencies of CW- and ESAT6/CFP10-specific IFN-γ+CD4+ T cells that expressed either CD38, HLA-DR, or Ki-67 (each P < 0.0001), compared with LTBI (Figure 3, A–F). These differences were restricted to Mtb-specific CD4+ T cells, as expression of these markers on nonstimulated populations of T cells was similar in both groups (Figure 4). These results show that activated and proliferating Mtb-specific CD4+ T cells are preferentially associated with ATB disease.
Statistical analyses to determine the predictive value of CD38+IFN-γ+, HLA-DR+IFN-γ+, and Ki-67+IFN-γ+CD4+ T cells as bio-markers for ATB. To assess the accuracy of these markers in predict-ing ATB and LTBI status, we performed receiver operating charac-teristic (ROC) analysis (19) in the test cohort. Supplemental Figure 2 shows that the AUC values for CD38+IFN-γ+, HLA-DR+IFN-γ+, and Ki-67+IFN-γ+CD4+ T cells were each 1.0, indicating perfect predictive power. A red, dashed line (Figure 3, D–F) indicates the biomarker cutoff values that optimally discriminated between ATB and LTBI groups and are 18% for CD38+IFN-γ+ (100% sen-sitivity and 100% specificity), 60% for HLA-DR+IFN-γ+ (100% sensitivity and 96% specificity), and 5% for Ki-67+IFN-γ+(100% sensitivity and 100% specificity). Thus, CD38, HLA-DR, and Ki-67 on Mtb-specific IFN-γ+CD4+ T cells accurately distinguished active and latent TB and provided significantly greater discrimi-natory power for diagnosis of ATB than CD4+IFN-γ+ T cells alone.
Evaluation of the predictive value of CD38+IFN-γ+, HLA-DR+IFN-γ+, and Ki-67+IFN-γ+CD4+ T cells in an independent cohort from South Africa. To explore the utility of measuring the frequen-cies of Mtb-specific CD4+ T cells expressing CD38, HLA-DR, and Ki-67 and their respective cutoff values as diagnostic biomarkers for ATB, we examined PBMCs from an independent validation cohort from the Western Cape in South Africa. Individuals with ATB and LTBI were recruited as described in Methods and in Supplemental Table 3. The investigators were blinded to the clinical diagnoses
Figure 2. Analysis of IFN-γ+CD4+ T cells in the test cohort. PBMCs from individu-als with LTBI (n = 25) and treatment-naive ATB (n = 24) were stimulated with Mtb-CW antigens (A) and ESAT6-CFP10 peptides (B). The Mann-Whitney U test was used to compare the 2 groups. Bars represent medians. P < 0.05 was consid-ered statistically significant.
The Journal of Clinical Investigation C l i n i C a l M e d i C i n e
1 8 3 0 jci.org Volume 125 Number 5 May 2015
(2). Figure 7, B–D, indicates the cumulative data for all 10 patients. Figure 7B shows that at the 2-month (60 days) time point following the HRZE phase, the median frequencies of CD38+IFN-γ+CD4+ T cells decreased significantly compared with baseline (P = 0.002) and approached the cutoff value of 18% for discriminating between LTBI and ATB. Similar trends were observed for HLA-DR+IFN-γ+ (P = 0.01) and Ki-67+IFN-γ+ (P = 0.003) CD4+ T cells (Figure 7, C and D). These frequencies continued to decline, falling below the cutoffs during the 4-month (180 days) HR phase and posttreat-ment time points (Figure 7, B–D).
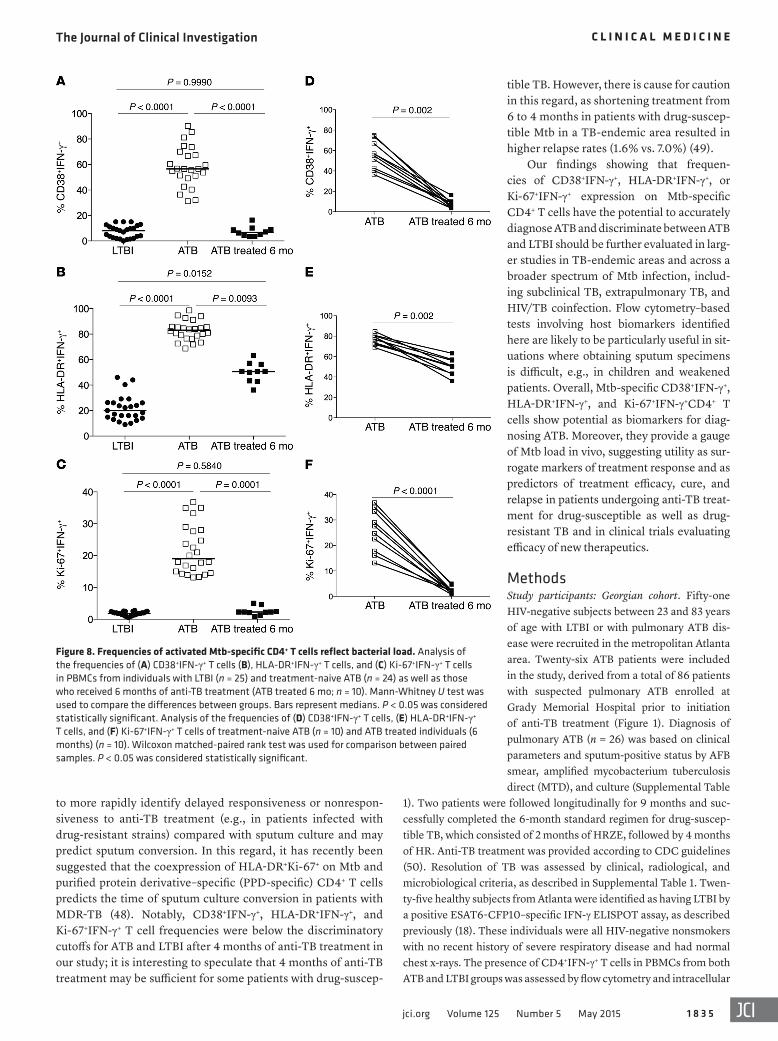
Frequencies of activated Mtb-specific CD4+ T in individuals with clinically resolved TB are comparable to those in individuals with LTBI. We compared the frequencies of CD38+IFN-γ+, HLA-DR+IFN-γ+, and Ki-67+IFN-γ+CD4+ T cells in individuals with LTBI and ATB as well as those who had successfully completed the 6-month standard reg-imen of anti-TB treatment (ATB treated 6 mo; Figure 8). Frequen-cies of Mtb-specific IFN-γ+CD4+ T cells expressing CD38, HLA-DR, and Ki-67 were significantly lower (P < 0.0001) in the treated ATB group compared with individuals with untreated ATB and reached or approached frequencies seen in the LTBI group (Figure 8, A–C). This
IFN-γ+ T cells remained unchanged (Figure 7A). This reflected decreasing bacterial burdens, as evidenced by sputum smear and culture conversion at 2 months. Similar results were seen when the data were expressed as median fluorescence intensity (MFI) (Figure 6C). These trends were observed for all 10 patients studied (P1–P10; Figure 7A), suggesting that decreases in the frequencies of Mtb-specific CD4+ T cells expressing CD38, HLA-DR, or Ki-67 are associated with treatment response in patients with drug-sus-ceptible TB. Notably, while patients P4 and P5 were smear negative at day 45, they remained culture positive and had higher than cut-off values for the host markers studied (Figure 7A), confirming the relative imprecision of smears for monitoring treatment and high-lighting greater sensitivity of culture and host markers for assess-ing Mtb clearance during treatment.
The standard treatment regimen for drug-susceptible TB con-sists of a 2-month intensive phase with isoniazid, rifampicin, pyra-zinamide, and ethambutol (HRZE), followed by a 4-month contin-uation phase with isoniazid and rifampicin (HR) (21). Conversion to a negative sputum culture at 2 months after treatment initiation is currently the most objective indicator of response to treatment
Figure 3. CD38, HLA-DR, and Ki-67 expression on IFN-γ+CD4+ T cells discriminates between ATB and LTBI in the test cohort. PBMCs from individuals with LTBI (black circles, n = 25) and ATB (white squares, n = 24) were stimulated with Mtb-CW antigens and ESAT6-CFP10 peptide pools or nonstimulated (NS). The frequencies of activated Mtb-specific CD4+ T cells were analyzed by flow cytometry. Representative flow plots and summary of the data are shown for frequencies of CD38+IFN-γ+ T cells (A and D), HLA-DR+IFN-γ+ T cells (B and E), and Ki-67+IFN-γ+ T cells (C and F) in LTBI and ATB groups. The percentages represent the frequencies of Mtb-specific IFN-γ+CD4+ T cells that express CD38, HLA-DR, or Ki-67. ROC analysis to determine the predictive value of each marker for classifying ATB and LTBI (Supplemental Figure 2) resulted in AUC values of 1.0. The red, dashed lines represent the discrimination threshold for each marker and show cutoff values of 18%, 60%, and 5% for CD38+IFN-γ+, HLA-DR+IFN-γ+, and Ki-67+IFN-γ+, respectively. Mann-Whitney U test was used to compare the 2 groups. Bars represent medians. P < 0.05 was considered statistically significant.
The Journal of Clinical Investigation C l i n i C a l M e d i C i n e
1 8 3 1jci.org Volume 125 Number 5 May 2015
ulomas (24–26). Moreover, humans with IFN-γ receptor abnor-malities show increased susceptibility to mycobacterial diseases (27). However, IFN-γ responses are not indicative of immune control in TB, and Mtb-specific IFN-γ+CD4+ T cells do not dis-tinguish between active and latent TB. Our study highlights the inability of Mtb-specific IFN-γ production or CD38, HLA-DR, and Ki-67 expression on bulk CD4+ T cells to discriminate between ATB and LTBI and monitor decreasing bacterial loads. This is consistent with previous studies (28–30) and underscores the utility of phenotypic markers expressed on Mtb-specific CD4+ T cells as biomarkers for diagnosing TB. We chose to study markers of immune activation and proliferation on Mtb-specific CD4+ T cells because we reasoned that individuals with ATB disease would harbor higher frequencies of activated (CD38+, HLA-DR+), cycling (Ki-67+) T cells than those with LTBI. We have previously shown that Mtb-specific effector memory CD4+ T cells in individuals with LTBI exhibited a resting, nonactivat-ed phenotype and were largely noncycling (18). In the present study, we have identified the immune activation markers CD38 and HLA-DR and the intracellular proliferation marker Ki-67 on Mtb-specific IFN-γ+CD4+ T cells as biomarkers that discriminate between ATB and LTBI with high sensitivity, specificity, and pre-dictive value in a US-based cohort. We further validated the abil-ity of these biomarkers to accurately classify ATB and LTBI in an independent cohort from South Africa, where the investigators were blinded to the clinical diagnoses until after completion of the laboratory analyses. Thus, our studies have identified pheno-typic biomarkers that provide discriminatory capacity to IFN-γ+–based assays. While we found that CD38, HLA-DR, and Ki-67 expression on Mtb-specific CD4+ T cells distinguished individu-als with LTBI from ATB patients, examining expression levels of these biomarkers on Mtb-specific CD8+ T cells was less useful. This is due to low-to-undetectable frequencies of CD8+IFN-γ+ T cells in individuals with LTBI and ATB (Supplemental Figure 4), consistent with previous reports (22, 31–34). Thus, unlike with CD4+IFN-γ+ T cells, phenotyping the CD8+IFN-γ+ T cells for expression of CD38, HLA-DR, and Ki-67 was not possible for the majority of LTBI samples. Therefore, Mtb-specific CD4+ T cells provided the optimal biomarker signatures.
We also show that frequencies of CD38-, HLA-DR–, and Ki-67–expressing Mtb-specific CD4+ T cells correlate with
was also evident in pairwise comparisons (Figure 8, D–F). While fre-quencies of CD38+IFN-γ+ and Ki-67+IFN-γ+ were indistinguishable in treated ATB and LTBI groups, HLA-DR+IFN-γ+ remained higher in treated ATB groups than in LTBI (Figure 8). Consistent with previ-ous reports (22), frequencies of total CD4+IFN-γ+ T cells alone did not distinguish ATB patients from those who had successfully com-pleted treatment (Supplemental Figure 3 and ref. 23).
Development of a linear mixed-effects model for modeling response to anti-TB treatment. To model response to therapy from longitu-dinal data of ATB patients, we used a linear mixed-effects model. This enabled us to statistically assess whether expression of the candidate biomarkers, CD38, HLA-DR, and Ki-67, on IFN-γ+CD4+ T cells correlated with treatment response over time for each patient by fitting the longitudinal data to a linear mixed-effects model and accounting for the correlation of repeated measure-ments from the same patient (Figure 9). We used the “lme” func-tion in R version 2.15.1 (www.r-project.org) to analyze the longitu-dinal data and account for repeated measurements from the same patient. To determine whether there was a decrease of an individ-ual biomarker over time, we used the model, Yit = b0 + b1 × timet + bi + eit, where Yit is the value of the biomarker for the ith patient at the tth time point, timet is the day of the tth time point, bi is a ran-dom effect that follows N(0, sb
2), and eit is an error term that fol-lows N(0, s 2) and is independent of bi. We tested H0: b1 = 0 against H0: b1 < 0 using the Wald test. P <0.05 was considered statistically significant. These analyses revealed that there was a significant decrease over time for each of the markers (P < 0.0001), indicat-ing that CD38+IFN-γ+, HLA-DR+IFN-γ+, and Ki-67+IFN-γ+CD4+ T cells each correlated with response to treatment (Figure 9).
Taken together, our findings show that treatment success is associated with decreased frequencies of CD38+IFN-γ+, HLA-DR+IFN-γ+, and Ki-67+IFN-γ+CD4+ T cells, which mirrored cul-ture conversion. Currently, assessing the adequacy of treatment by sputum culture is hindered by long incubation times (1). Our data suggest that measuring host immune markers by flow cytom-etry–based tests may prove to be useful for monitoring treatment response by providing a more rapid indicator of Mtb load in vivo.
DiscussionCD4+ T cells expressing IFN-γ+ clearly play a critical role in con-trolling Mtb replication and containing bacteria within lung gran-
Figure 4. CD38, HLA-DR, and Ki-67 expression on bulk CD4+ T cells in the test cohort. Nonstimulated PBMCs from LTBI (n = 25) and treatment-naive ATB (n = 24) were analyzed for immune activation markers by flow cytometry. Mann-Whitney U test was used to compare the 2 groups. Bars represent medi-ans. P < 0.05 was considered statistically significant.

The Journal of Clinical Investigation C l i n i C a l M e d i C i n e
1 8 3 2 jci.org Volume 125 Number 5 May 2015
Mtb burden in vivo and mirror sputum conversion during anti-TB treatment, providing real-time readouts for monitoring a patient’s responsiveness to treatment. Our observations in TB are similar to studies in HIV-infected individuals, where CD8+ T cells expressing CD38 and HLA-DR were shown to be asso-ciated with persistent immune activation, correlated with HIV viral load in peripheral blood, and decreased in response to anti-retroviral therapy (35, 36). One of the limitations of our study is that we restricted our analyses in the test cohort to ATB patients who exhibited detectable responses to both Mtb-CW antigens and to ESAT6/CFP10 peptide pools. Thus, we excluded patients who were responsive to Mtb-CW but not to ESAT6/CFP10 pep-tide pools. This is a general limitation of immune-based assays that measure Mtb-specific responses. IFN-γ production (i.e., IGRAs) in response to ESAT6/CFP10 stimulation has been shown in recent meta-analyses to have a pooled sensitivity of approximately 80% for TB cases and their contacts in endemic
and nonendemic settings (37–39). The use of additional, highly immunogenic Mtb-specific antigens could potentially improve the performance of immune-based assays in patients in whom there is a lack of detectable ESAT6/CFP10 responses.
TB-specific host biomarkers for diagnosis of ATB and moni-toring treatment response have been identified as important priorities for TB research (40) and have been explored in some recent studies. Berry et al. identified an IFN-inducible neutro-phil-driven transcriptional signature that was associated with ATB disease and correlated with response to treatment (41). Sim-ilar transcriptional blood signatures were shown to distinguish pulmonary TB from pulmonary sarcoidosis, pneumonias, and lung cancer (42). Since these signatures were derived from total unstimulated blood cell populations, the discriminatory capacity of phenotypic markers on Mtb-specific T cells could not be deter-mined in these studies. Other studies evaluated frequencies of single and polyfunctional cytokine-producing Mtb-specific T
Figure 5. Frequencies of CD38+IFN-γ+, HLA-DR+IFN-γ+, and Ki-67+IFN-γ+ in the validation cohort. PBMCs from individuals (n = 36) recruited in the Western Cape, South Africa, were stimulated with Mtb-CW antigens and ESAT6-CFP10 peptide pools or nonstimulated. The frequencies of activated Mtb-specific CD4+ T cells were analyzed by flow cytometry. Summary of the data are shown for frequencies of CD38+IFN-γ+ T cells (A), HLA-DR+IFN-γ+ T cells (B), and Ki-67+IFN-γ+ T cells (C). The red, dashed lines represent the cutoffs established from the Georgian cohort: (A) 18% for CD38+IFN-γ+, (B) 60% for HLA-DR+IFN-γ+, and (C) 5% for Ki-67+IFN-γ+. Red open squares and blue circles correspond to individuals with ATB and LTBI, respectively, after unblinding.
The Journal of Clinical Investigation C l i n i C a l M e d i C i n e
1 8 3 3jci.org Volume 125 Number 5 May 2015
cells in ATB and LTBI and showed that single-positive TNF-α–producing Mtb-specific CD4+ T cells alone, or combined with Mtb-specific CD8+ T cells, distinguished ATB from LTBI. While the frequencies of this subset in ATB decreased upon treatment, smear and/or culture were not evaluated to determine their association with treatment response and Mtb clearance (28, 43). Expression of the costimulatory molecule CD27 on Mtb-specific
T cells was recently shown to have predictive value in distin-guishing active and latent TB; however, CD27+IFN-γ+CD4+ T cell frequencies were not evaluated in the context of monitoring treatment response in longitudinal studies (44–46).
We found that frequencies of CD38+IFN-γ+, HLA-DR+IFN-γ+, and Ki-67+IFN-γ+ Mtb-specific T cells were comparable to those in the LTBI group in all 10 patients who successfully resolved TB
Figure 6. CD38+IFN-γ+, HLA-DR+IFN-γ+, and Ki-67+IFN-γ+ T cells in ATB patients correlate with response to anti-TB treatment. Representative histograms of longitudinal 9-month monitoring of the frequencies of Mtb-specific activated CD4+ T cells in P1 at baseline (day 0) and at the indicated time points following treatment initiation. Frequencies of CD38+IFN-γ+ (red), HLA-DR+IFN-γ+ (blue), and Ki-67+IFN-γ+ T cells (green) after stimulation with Mtb-CW (A) and ESAT6-CFP10 (B) are shown. Detection of AFB in sputum specimens by smear and culture is indicated by a positive (+) result. The smear grade recorded for each positive result is indicated numerically (4+, 3+, 2+, or +). A negative (–) result by either smear or culture indicates that Mtb was not detected in sputum specimens at those time points and indicates that that sample was not tested. (C) Representation of MFI data of CD38+IFN-γ+, HLA-DR+IFN-γ+, and Ki-67+IFN-γ+CD4+ T cells during the course of anti-TB treatment in patient P1 after stimulation with Mtb-CW (red circles) or ESAT6-CFP10 (open blue squares).

The Journal of Clinical Investigation C l i n i C a l M e d i C i n e
1 8 3 4 jci.org Volume 125 Number 5 May 2015
clinical response to treatment is currently used as diagnosis (47). While the 6-month treatment duration is recommended as the standard regimen for treating ATB, longer regimens are required when sputum conversion is delayed beyond the 2-month mile-stone. In this context, blood-based biomarkers have the potential
after 6 months of anti-TB treatment. Our data also showed that these biomarkers correlated with Mtb load and mirrored sputum conversion during the course of anti-TB treatment, suggesting that these biomarkers may also prove useful for diagnosing cul-ture-negative individuals with clinical symptoms of TB, for whom
Figure 7. Longitudinal monitoring of the frequencies of activated Mtb-specific CD4+ T cells during anti-TB treatment in ATB patients. (A) Frequencies of CD38+IFN-γ+, HLA-DR+IFN-γ+, Ki-67+IFN-γ+, and CD45RA– IFN-γ+CD4+ T cells in 10 different ATB patients (P1 to P10) over the course of anti-TB treatment after stimulation with Mtb-CW. Treatment response and culture conversion were monitored in sputum by smear microscopy and culture. These results are shown for the time of diagnosis (day 0) and at time points following treatment initiation. Detection of AFB in sputum specimens by smear and culture is indicated by a positive (+) result. The smear grade recorded for each positive result is indicated numerically (4+, 3+, 2+, or +). A negative (–) result by either smear or culture indicates that Mtb was not detected in sputum specimens at those time points and indicates that that sample was not tested. Cumula-tive data for patients P1 to P10 are presented for (B) CD38+IFN-γ+, (C) HLA-DR+IFN-γ+, and (D) Ki-67+IFN-γ+ T cells over the course of anti-TB treatment. Values are expressed as median on the y axis and as follow-up days on the x axis. The 2-month intensive phase (HRZE), 4-month continuation phase (HR), and follow-up (fu) posttreatment completion are indicated.
The Journal of Clinical Investigation C l i n i C a l M e d i C i n e
1 8 3 5jci.org Volume 125 Number 5 May 2015
tible TB. However, there is cause for caution in this regard, as shortening treatment from 6 to 4 months in patients with drug-suscep-tible Mtb in a TB-endemic area resulted in higher relapse rates (1.6% vs. 7.0%) (49).
Our findings showing that frequen-cies of CD38+IFN-γ+, HLA-DR+IFN-γ+, or Ki-67+IFN-γ+ expression on Mtb-specific CD4+ T cells have the potential to accurately diagnose ATB and discriminate between ATB and LTBI should be further evaluated in larg-er studies in TB-endemic areas and across a broader spectrum of Mtb infection, includ-ing subclinical TB, extrapulmonary TB, and HIV/TB coinfection. Flow cytometry–based tests involving host biomarkers identified here are likely to be particularly useful in sit-uations where obtaining sputum specimens is difficult, e.g., in children and weakened patients. Overall, Mtb-specific CD38+IFN-γ+, HLA-DR+IFN-γ+, and Ki-67+IFN-γ+CD4+ T cells show potential as biomarkers for diag-nosing ATB. Moreover, they provide a gauge of Mtb load in vivo, suggesting utility as sur-rogate markers of treatment response and as predictors of treatment efficacy, cure, and relapse in patients undergoing anti-TB treat-ment for drug-susceptible as well as drug-resistant TB and in clinical trials evaluating efficacy of new therapeutics.
MethodsStudy participants: Georgian cohort. Fifty-one HIV-negative subjects between 23 and 83 years of age with LTBI or with pulmonary ATB dis-ease were recruited in the metropolitan Atlanta area. Twenty-six ATB patients were included in the study, derived from a total of 86 patients with suspected pulmonary ATB enrolled at Grady Memorial Hospital prior to initiation of anti-TB treatment (Figure 1). Diagnosis of pulmonary ATB (n = 26) was based on clinical parameters and sputum-positive status by AFB smear, amplified mycobacterium tuberculosis direct (MTD), and culture (Supplemental Table
1). Two patients were followed longitudinally for 9 months and suc-cessfully completed the 6-month standard regimen for drug-suscep-tible TB, which consisted of 2 months of HRZE, followed by 4 months of HR. Anti-TB treatment was provided according to CDC guidelines (50). Resolution of TB was assessed by clinical, radiological, and microbiological criteria, as described in Supplemental Table 1. Twen-ty-five healthy subjects from Atlanta were identified as having LTBI by a positive ESAT6-CFP10–specific IFN-γ ELISPOT assay, as described previously (18). These individuals were all HIV-negative nonsmokers with no recent history of severe respiratory disease and had normal chest x-rays. The presence of CD4+IFN-γ+ T cells in PBMCs from both ATB and LTBI groups was assessed by flow cytometry and intracellular
to more rapidly identify delayed responsiveness or nonrespon-siveness to anti-TB treatment (e.g., in patients infected with drug-resistant strains) compared with sputum culture and may predict sputum conversion. In this regard, it has recently been suggested that the coexpression of HLA-DR+Ki-67+ on Mtb and purified protein derivative–specific (PPD-specific) CD4+ T cells predicts the time of sputum culture conversion in patients with MDR-TB (48). Notably, CD38+IFN-γ+, HLA-DR+IFN-γ+, and Ki-67+IFN-γ+ T cell frequencies were below the discriminatory cutoffs for ATB and LTBI after 4 months of anti-TB treatment in our study; it is interesting to speculate that 4 months of anti-TB treatment may be sufficient for some patients with drug-suscep-
Figure 8. Frequencies of activated Mtb-specific CD4+ T cells reflect bacterial load. Analysis of the frequencies of (A) CD38+IFN-γ+ T cells (B), HLA-DR+IFN-γ+ T cells, and (C) Ki-67+IFN-γ+ T cells in PBMCs from individuals with LTBI (n = 25) and treatment-naive ATB (n = 24) as well as those who received 6 months of anti-TB treatment (ATB treated 6 mo; n = 10). Mann-Whitney U test was used to compare the differences between groups. Bars represent medians. P < 0.05 was considered statistically significant. Analysis of the frequencies of (D) CD38+IFN-γ+ T cells, (E) HLA-DR+IFN-γ+ T cells, and (F) Ki-67+IFN-γ+ T cells of treatment-naive ATB (n = 10) and ATB treated individuals (6 months) (n = 10). Wilcoxon matched-paired rank test was used for comparison between paired samples. P < 0.05 was considered statistically significant.

The Journal of Clinical Investigation C l i n i C a l M e d i C i n e
1 8 3 6 jci.org Volume 125 Number 5 May 2015
to 4 years after collection. Stimulation of PBMCs was performed at the Emory Vaccine Center with Mtb-CW antigens (NIH-TBVRM con-tract, Colorado State University) and ESAT6-CFP10 peptide pools, which were composed of 15 mers with 11 amino-acid overlap (Gene-med Synthesis Inc.).
Flow cytometry and staining. For ICS, cryopreserved PBMCs were rested overnight at 37°C, 5% CO2, in RPMI 1640 medium (Lonza) con-taining 10% FBS, 2 mM glutamine, 100 IU/ml penicillin, and 100 μg/ml streptomycin. The viability of the lymphocytes was 75% to 95%. PBMCs (1 to 2 × 10⁶) were each stimulated with CW antigens (10 μg/ml) and ESAT6 and CFP10 peptide pools (10 μg/ml) for 2 hours fol-lowed by the addition of Brefeldin A (10 μg/ml) (BD Biosciences) and further incubated for 16 hours. PBMCs were stained for dead cells with LIVE/DEAD Fixable Yellow Dead Cell Stain (Life Technologies) at the beginning and then surface stained with appropriate antibodies: CD4 PerCp-Cy5.5 (clone L200), CD8 V500 (clone SK1), HLA-DR PE-Cy7 (clone L243), all from BD Biosciences; CD38 ECD (clone LS198.4.3) from Beckman-Coulter; and CD45RA BV711 (clone HI100) from Bio-legend. They were then permeabilized with Cytofix/Cytoperm Kit (BD Biosciences), stained intracellularly with appropriate antibodies (IFN-γ Alexa Fluor 700 [clone B27], Ki-67 PE [clone B56], and CD3 APC-H7 [clone UCHT1], all from BD Biosciences) and fixed with 1% paraformaldehyde before acquisition on an LSR-II system (BD Biosci-ences). Flow cytometry data were analyzed with FlowJo software (Tree Star Inc.). Positive Mtb-specific CD4+ T cell responses were defined by a frequency of CD4+IFN-γ+ of 0.05% or more.
Statistics. Statistical analyses were performed using Graphpad Prism 5.0 software. The Mann-Whitney U test was used to compare 2 groups. The median was used for descriptive statistics for each param-eter. Differences between paired samples were analyzed using the Wilcoxon matched-paired rank test. A P value of less than 0.05 was considered to be statistically significant. To evaluate the performance of each candidate biomarker in discriminating between ATB and LTBI groups and to establish probability cutoff values, logistic regres-sion analysis was performed followed by ROC curve analysis, which plots sensitivity (true-positive rates) versus 1-specificity (false-positive rates). The AUC is a quantitative measure of the discrimination power of each biomarker between ATB and LTBI subjects and was calculated
cytokine staining (ICS) following stimulation with Mtb-CW antigens and ESAT6 and CFP10 peptide pools. Out of the 26 ATB patients, 2 did not show reactivity to ESAT6/CFP10 peptide pools and were excluded from the study analysis (Figure 1).
Study participants: South African cohort. Thirty-six HIV-negative subjects between 18 and 64 years of age with LTBI or with pulmonary ATB were recruited in the Western Cape province of South Africa at the South African Tuberculosis Vaccine Initiative (SATVI) field site in the Worcester area (Supplemental Table 3). Subjects with LTBI were identified as healthy, asymptomatic individuals (defined as individu-als with negative symptom screening for all of the following TB-asso-ciated symptoms: persistent cough, fever, night sweats, weight loss, and hemoptysis) with a positive IGRA and with no previous history of TB diagnosis or treatment. All patients with pulmonary ATB had either a positive sputum AFB smear, a positive sputum culture for Mtb, or both, and had a clinical diagnosis of TB. In those with TB, periph-eral blood was collected prior to starting standard anti-TB treatment. Samples that were shipped from Cape Town to Atlanta were selected based on availability of the number of vials of cells.
Sputum AFB smear microscopy, microbiological culture, and nucle-ic acid amplification assessments. Diagnosis of ATB was based on a positive AFB culture of processed sputum on Middlebrook 7H11 media and the BacT/Alert mycobacterial culture system (BioMer-ieux) for baseline isolates of Mtb. Culture conversion was defined as the first negative sputum culture with at least 1 subsequent negative culture and no subsequent positive results. Detection of AFB in spu-tum smears was conducted by direct fluorescent microscopy. If AFB smear was positive, the amplified MTD test (GeneProbe Hologic) was performed for direct detection of Mtb. All samples were pro-cessed for culture.
PBMC isolation, antigens, and peptides for cell stimulations. Blood samples from the Georgian cohort were collected from all subjects at baseline and longitudinal time points. PBMCs were isolated from blood as described previously (18) using cell preparation tubes (CPT, BD Biosciences) and cryopreserved in 90% fetal FBS (Hyclone) and 10% dimethyl sulfoxide (Sigma-Aldrich). PBMCs from the South African cohort were isolated using Ficoll-Hypaque (Sigma-Aldrich) in South Africa and cryopreserved at –180°C anywhere from 4 months
Figure 9. Graphical representation of linear mixed-effects modeling of anti-TB treatment response. The linear mixed-effects model was used to show that frequencies of CD38+IFN-γ+ (A), HLA-DR+IFN-γ+ (B), and Ki-67+IFN-γ+ (C) T cells decreased significantly in response to anti-TB treatment in each patient with drug-susceptible TB.

The Journal of Clinical Investigation C l i n i C a l M e d i C i n e
1 8 3 7jci.org Volume 125 Number 5 May 2015
AcknowledgmentsWe thank the volunteers who participated in this study and the staff at Grady Memorial Hospital and the Fulton County Health Depart-ment. We gratefully acknowledge Joel Ernst, Bali Pulendran, Rama Amara, and Athena P. Kourtis for critical input and comments on the manuscript and members of the Rengarajan laboratory for helpful discussions. We also acknowledge Surinder Kaur for tech-nical assistance. This work was supported by the following funding sources: a Center For AIDS Research (CFAR) Immunology Core grant (P30AI050409 to Emory University), an Emory-CFAR03 Developmental grant (to T. Adekambi, J. Rengarajan, and S.M. Ray), a pilot project grant from the NIH Cooperative Centers on Human Immunology (AI057266 to J. Rengarajan), an Emory Glob-al Health Institute Faculty Distinction Award (to J. Rengarajan), an NIH/National Institute of Allergy and Infectious Diseases grant (AI083156 to C.L. Day), and a Yerkes National Primate Center base grant (RR000165).
Address correspondence to: Jyothi Rengarajan, Emory Vaccine Center and Division of Infectious Disease, 954 Gatewood Rd., Atlanta, Georgia 30329, USA. Phone: 404.727.8174; E-mail: [email protected].
by numerical integration for each marker (19). Optimal cutoff points for each biomarker were determined in order to achieve maximum sensitivity and specificity. An AUC value of 1.0 indicates the maxi-mum predictive value for a given marker.
Linear mixed-effects model for treatment response. To model response to therapy from longitudinal data of ATB patients, a linear mixed-effects model was used. This was carried out by the “lme” function in R version 2.15.1 and fitted to the longitudinal data to account for the correlation of repeated measurements from the same patient. To determine whether there was a decrease of an individual biomarker over time, we used the model, Yit = b0 + b1 × timet+ bi + eit, where Yit is the value of the biomarker for the ith patient at the tth time point, timet is the day of the tth time point, bi is a random effect that follows N(0, sb
2), and eit is an error term that fol-lows N(0, s 2) and is independent of bi. We tested H0: b1 = 0 against H0: b1 <0 using the Wald test. P < 0.05 was considered statistically significant.
Study approval. This study was conducted according to the prin-ciples expressed in the Declaration of Helsinki. Ethical approval was obtained from the Emory University Institutional Review Board, the Human Research Ethics Committee of the University of Cape Town, and the Western Cape Department of Health. All participants provid-ed written informed consent for the collection of samples and subse-quent analyses.
1. Parrish NM, Carroll KC. Role of the clinical mycobacteriology laboratory in diagnosis and management of tuberculosis in low-prevalence settings. J Clin Microbiol. 2011;49(3):772–776.
2. Davies PD, Pai M. The diagnosis and misdi-agnosis of tuberculosis. Int J Tuberc Lung Dis. 2008;12(11):1226–1234.
3. Nyendak MR, Lewinsohn DA, Lewinsohn DM. New diagnostic methods for tuberculosis. Curr Opin Infect Dis. 2009;22(2):174–182.
4. Thillai M, Pollock K, Pareek M, Lalvani A. Inter-feron-gamma release assays for tuberculosis: current and future applications. Expert Rev Respir Med. 2014;8(1):67–78.
5. Meier T, Eulenbruch HP, Wrighton-Smith P, Enders G, Regnath T. Sensitivity of a new com-mercial enzyme-linked immunospot assay (T SPOT-TB) for diagnosis of tuberculosis in clinical practice. Eur J Clin Microbiol Infect Dis. 2005;24(8):529–536.
6. Janssens JP, Roux-Lombard P, Perneger T, Metzger M, Vivien R, Rochat T. Quantitative scoring of an interferon-γ assay for differentiat-ing active from latent tuberculosis. Eur Respir J. 2007;30(4):722–728.
7. Denkinger CM, Pai M, Patel M, Menzies D. γ-Interferon release assay for monitoring of treat-ment response for active tuberculosis: an explo-sion in the spaghetti factory. J Clin Microbiol. 2013;51(2):607–610.
8. Rueda CM, Marin ND, Garcia LF, Rojas M. Char-acterization of CD4 and CD8 T cells producing IFN-γ in human latent and active tuberculosis. Tuberculosis (Edinb). 2010;90(6):346–353.
9. Jones RB, et al. Tim-3 expression defines a novel population of dysfunctional T cells with highly elevated frequencies in progressive HIV-1 infec-tion. J Exp Med. 2008;205(12):2763–2779.
10. Kaufmann DE, et al. Upregulation of CTLA-4 by HIV-specific CD4+ T cells correlates with disease
progression and defines a reversible immune dys-function. Nat Immunol. 2007;8(11):1246–1254.
11. Barry CE, et al. The spectrum of latent tuberculo-sis: rethinking the biology and intervention strat-egies. Nat Rev Microbiol. 2009;7(12):845–855.
12. Giorgi JV, et al. Shorter survival in advanced human immunodeficiency virus type 1 infection is more closely associated with T lymphocyte activation than with plasma virus burden or virus chemokine coreceptor usage. J Infect Dis. 1999;179(4):859–870.
13. Hazenberg MD, et al. Persistent immune activa-tion in HIV-1 infection is associated with progres-sion to AIDS. AIDS. 2003;17(13):1881–1888.
14. Liu Z, Cumberland WG, Hultin LE, Prince HE, Detels R, Giorgi JV. Elevated CD38 antigen expression on CD8+ T cells is a stronger marker for the risk of chronic HIV disease progression to AIDS and death in the Multicenter AIDS Cohort Study than CD4+ cell count, soluble immune acti-vation markers, or combinations of HLA-DR and CD38 expression. J Acquir Immune Defic Syndr Hum Retrovirol. 1997;16(2):83–92.
15. Shubinsky G, Schlesinger M. The CD38 lympho-cyte differentiation marker: new insight into its ectoenzymatic activity and its role as a signal transducer. Immunity. 1997;7(3):315–324.
16. Marsh SG, et al. Nomenclature for factors of the HLA system, 2004. Int J Immunogenet. 2005;32(2):107–159.
17. Scholzen T, Gerdes J. The Ki-67 protein: from the known and the unknown. J Cell Physiol. 2000;182(3):311–322.
18. Adekambi T, Ibegbu CC, Kalokhe AS, Yu T, Ray SM, Rengarajan J. Distinct effector memory CD4+ T cell signatures in latent Mycobacte-rium tuberculosis infection, BCG vaccination and clinically resolved tuberculosis. PLoS One. 2012;7(4):e36046.
19. Zweig MH, Campbell G. Receiver-operating
characteristic (ROC) plots: a fundamental evaluation tool in clinical medicine. Clin Chem. 1993;39(4):561–577.
20. Vigano A, Saresella M, Rusconi S, Ferrante P, Clerici M. Expression of CD38 on CD8 T cells predicts maintenance of high viraemia in HAART-treated HIV-1-infected children. Highly active antiretroviral therapy. Lancet. 1998;352(9144):1905–1906.
21. World Health Organization. Treatment Of Tuber-culosis: Guidelines For National Programmes. 4th ed. Geneva, Switzerland: World Health Organi-zation Document; 2010.
22. Day CL, et al. Functional capacity of Mycobac-terium tuberculosis-specific T cell responses in humans is associated with mycobacterial load. J Immunol. 2011;187(5):2222–2232.
23. Nyendak MR, et al. Mycobacterium tubercu-losis specific CD8(+) T cells rapidly decline with antituberculosis treatment. PLoS One. 2013;8(12):e81564.
24. Caruso AM, Serbina N, Klein E, Triebold K, Bloom BR, Flynn JL. Mice deficient in CD4 T cells have only transiently diminished levels of IFN-γ, yet succumb to tuberculosis. J Immunol. 1999;162(9):5407–5416.
25. Flynn JL. Immunology of tuberculosis and impli-cations in vaccine development. Tuberculosis (Edinb). 2004;84(1):93–101.
26. Kaufmann SH. Recent findings in immunology give tuberculosis vaccines a new boost. Trends Immunol. 2005;26(12):660–667.
27. Sologuren I, et al. Partial recessive IFN-γR1 deficiency: genetic, immunological and clinical features of 14 patients from 11 kindreds. Hum Mol Genet. 2011;20(8):1509–1523.
28. Harari A, et al. Dominant TNF-α+ Mycobacterium tuberculosis-specific CD4+ T cell responses discriminate between latent infection and active disease. Nat Med. 2011;17(3):372–376.
The Journal of Clinical Investigation C l i n i C a l M e d i C i n e
1 8 3 8 jci.org Volume 125 Number 5 May 2015
29. Sester U, et al. Whole-blood flow-cytometric analysis of antigen-specific CD4 T-cell cytokine profiles distinguishes active tuberculosis from non-active states. PLoS One. 2011;6(3):e17813.
30. Rodrigues DS, Medeiros EA, Weckx LY, Bonnez W, Salomao R, Kallas EG. Immunophenotypic characterization of peripheral T lymphocytes in Mycobacterium tuberculosis infection and dis-ease. Clin Exp Immunol. 2002;128(1):149–154.
31. Rozot V, et al. Mycobacterium tuberculosis-specific CD8 T cells are functionally and phenotypically different between latent infection and active disease. Eur J Immunol. 2013;43(6):1568–1577.
32. Caccamo N, et al. Analysis of Mycobacterium tuberculosis-specific CD8 T-cells in patients with active tuberculosis and in individuals with latent infection. PLoS One. 2009;4(5):e5528.
33. Kalokhe AS, Adekambi T, Ibegbu CC, Ray SM, Day CL, Rengarajan J. Impaired degranulation and proliferative capacity of mycobacterium tuberculosis-specific CD8+ T cells in HIV-infect-ed individuals with latent tuberculosis. J Infect Dis. 2015;211(4):635–640.
34. Lancioni C, et al. CD8+ T cells provide an immunologic signature of tuberculosis in young children. Am J Respir Crit Care Med. 2012;185(2):206–212.
35. Ho HN, et al. Circulating HIV-specific CD8+ cytotoxic T cells express CD38 and HLA-DR anti-
gens. J Immunol. 1993;150(7):3070–3079. 36. Riou C, et al. Distinct kinetics of Gag-specific CD4+
and CD8+ T cell responses during acute HIV-1 infection. J Immunol. 2012;188(5):2198–2206.
37. Pai M, Zwerling A, Menzies D. Systematic review: T-cell-based assays for the diagnosis of latent tuberculosis infection: an update. Ann Intern Med. 2008;149(3):177–184.
38. Diel R, Loddenkemper R, Nienhaus A. Evidence-based comparison of commercial interferon-γ release assays for detecting active TB: a meta-analysis. Chest. 2010;137(4):952–968.
39. Sester M, et al. Interferon-γ release assays for the diagnosis of active tuberculosis: a system-atic review and meta-analysis. Eur Respir J. 2011;37(1):100–111.
40. Wallis RS, et al. Biomarkers for tuberculosis dis-ease activity, cure, and relapse. Lancet Infect Dis. 2009;9(3):162–172.
41. Berry MP, et al. An interferon-inducible neutrophil-driven blood transcriptional signature in human tuberculosis. Nature. 2010;466(7309):973–977.
42. Bloom CI, et al. Transcriptional blood signatures distinguish pulmonary tuberculosis, pulmonary sarcoidosis, pneumonias and lung cancers. PLoS One. 2013;8(8):e70630.
43. Rozot V, et al. Combined use of Mycobacterium tuberculosis-Specific CD4 and CD8 T-cell responses is a powerful diagnostic tool of active
tuberculosis. Clin Infect Dis. 2015;60(3):432–437. 44. Jiang J, et al. Reduced CD27 expression on
antigen-specific CD4+ T cells correlates with persistent active tuberculosis. J Clin Immunol. 2010;30(4):566–573.
45. Streitz M, et al. Loss of receptor on tuberculin-reactive T-cells marks active pulmonary tubercu-losis. PLoS One. 2007;2(8):e735.
46. Portevin D, et al. Assessment of the novel T-cell activation marker-tuberculosis assay for diagno-sis of active tuberculosis in children: a prospec-tive proof-of-concept study. Lancet Infect Dis. 2014;14(10):931–938.
47. Fuhrmann S, Streitz M, Kern F. How flow cytometry is changing the study of TB immu-nology and clinical diagnosis. Cytometry A. 2008;73(11):1100–1106.
48. Riou C, et al. A subset of circulating blood myco-bacteria-specific CD4 T cells can predict the time to Mycobacterium tuberculosis sputum culture conversion. PLoS One. 2014;9(7):e102178.
49. Johnson JL, et al. Shortening treatment in adults with noncavitary tuberculosis and 2-month culture conversion. Am J Respir Crit Care Med. 2009;180(6):558–563.
50. Blumberg HM, et al. American Thoracic Society/Centers for Disease Control and Prevention/Infectious Diseases Society of America: treat-ment of tuberculosis. Am J Respir Crit Care Med. 2003;167(4):603–662.