biomass feedstock availability analysis for...
TRANSCRIPT

BIOMASS FEEDSTOCK AVAILABILITY ANALYSIS FOR THE
MARIPOSA BIOMASS PROJECT
Prepared for: Mariposa County Fire Safe Council
Prepared by: TSS Consultants
Rancho Cordova, California
August 26, 2015

ACKNOWLEDGMENTS The authors wish to thank several individuals and organizations for their significant efforts in support of this project. These include, but are not limited to:
• Jay Johnson, Chief Executive Officer, Mariposa Biomass Project Group • Steve Smallcombe, Member, Board of Directors, Mariposa Biomass Project Group • Megan Atkinson, Executive Director, Mariposa County Fire Safe Council • Rosemarie Smallcombe, Supervisor, Mariposa County • Dave Horak, Timber Management Officer, Stanislaus National Forest • Mike Nolen, Forester, Bass Lake Ranger District • Tim Tate, Forester, Sierra Pacific Industries • Brian Wayland, Forester, Sierra Pacific Industries • Bill Haigh, Field Manager, Bureau of Land Management, Mother Lode District • Matt Brown, Senior Land Consultant, PG&E • Corey Peters, Vegetation Program Manger, Central Valley Region, PG&E • David Carruth, Contract Program Manager, Central Valley Region, PG&E • Charles Sikora, Forester, Sikora Forestry • Greg Stangl, Principal, Phoenix Energy • John Romena, Fuel Procurement Manager, Buena Vista Biomass Power • Gregg Kaylor, Fuel Procurement Manager, Pacific Ultrapower Chinese Station • Tim Bordges, Bordges Timber, Inc. • Armando Soria, District 10 Traffic Operations Branch, CAL TRANS • Pat Garcia, Project Manager, Mariposa County Resource Conservation District
The TSS Consultants lead team included:
• Tad Mason, Forester and CEO • Katherine Mitchell, Spatial Analyst

Biomass Feedstock Availability Analysis for the Mariposa Biomass Project
Table of Contents INTRODUCTION ...........................................................................................................................1 FEEDSTOCK AVAILABILITY ANALYSIS ...............................................................................3
Vegetation Cover ........................................................................................................................ 3 Land Ownership and Jurisdiction ............................................................................................... 6 Forest-Sourced Biomass ........................................................................................................... 11
Timber Harvest Residuals ..................................................................................................... 11 Fuels Treatment/Plantation Thinning/Utility Line Clearance............................................... 16 Potential Forest Feedstocks................................................................................................... 18 Findings................................................................................................................................. 18
Urban-Sourced Biomass ........................................................................................................... 19 Construction and Demolition Wood ..................................................................................... 19 Residential Tree Trimming Material .................................................................................... 20
Agriculture-Sourced Biomass ................................................................................................... 21 Biomass Feedstock Competition Analysis ............................................................................... 23
Current Competition ............................................................................................................. 23 Potential Competition ........................................................................................................... 23
Findings..................................................................................................................................... 24 FEEDSTOCK COST ANALYSIS ................................................................................................26
Existing Market Prices .............................................................................................................. 26 Costs to Collect, Process and Transport Biomass Feedstocks .................................................. 26 Delivered Price Forecast ........................................................................................................... 28
FEEDSTOCK PROCUREMENT ..................................................................................................30 Feedstock Specifications ........................................................................................................... 30 Feedstock Providers .................................................................................................................. 30 Feedstock Procurement Contracting ......................................................................................... 31
CONCLUSIONS............................................................................................................................33 RECOMMENDATIONS ...............................................................................................................34

Biomass Feedstock Availability Analysis for the Mariposa Biomass Project
List of Tables
Table 1. Vegetation Cover within the FSA .................................................................................... 3 Table 2. Slope Assessment for Forested Land Cover Types ......................................................... 5 Table 3. Land Ownership and Jurisdiction within the FSA: Total and Forested Acres ............... 9 Table 4. Private Timber Harvest Volume 2010 through 2014 ..................................................... 11 Table 5. Private Timber Harvest Volume Estimates by County within the FSA ........................ 12 Table 6. Public Timber Harvest Volume 2010 through 2014 ...................................................... 12 Table 7. Public Timber Harvest Volume Estimates by County within the FSA ......................... 12 Table 8. Total Timber Harvest Residuals Technically and Economically Available .................. 15 Table 9. Fuels Treatment Activities and Utility Line Clearance Planned Across the FSA ......... 16 Table 10. Forest-Sourced Biomass Feedstock Available ............................................................ 18 Table 11. Construction and Demolition Wood Waste Feedstock ................................................ 19 Table 12. Tree Trimming Material Feedstock ............................................................................. 20 Table 13. Urban-Sourced Biomass Feedstock Available ............................................................ 21 Table 14. Commercial Orchard Acreage by Crop within the FSA .............................................. 21 Table 15. Agriculture-Sourced Biomass Feedstock Available .................................................... 22 Table 16. Facilities Currently Sourcing Biomass Feedstock from the FSA ................................ 23 Table 17. Potential Feedstock Competition ................................................................................. 24 Table 18. Biomass Feedstock Available within the FSA ............................................................ 24 Table 19. Current Biomass Feedstock Market Prices .................................................................. 26 Table 20. Biomass Collection, Processing, Transport Costs and Market Prices ......................... 26 Table 21. Optimized Feedstock Blend ......................................................................................... 28 Table 22. Five-Year Feedstock Cost Forecast 2017 to 2021 ....................................................... 28 Table 23. Forest Feedstock Processors ........................................................................................ 30 Table 24. Orchard Removal Contractors ..................................................................................... 31
List of Figures
Figure 1. Feedstock Sourcing Area and Drive Time ..................................................................... 1 Figure 2. Vegetation Cover Map ................................................................................................... 4 Figure 3. Vegetation Cover Distribution ....................................................................................... 5 Figure 4. Land Ownership and Jurisdiction within the FSA ......................................................... 7 Figure 5. Private Ownership Forested Lands ................................................................................. 8 Figure 6. Land Ownership Distribution. ...................................................................................... 10 Figure 7. Feedstock Supply Curve ............................................................................................... 29
List of Appendices Appendix A. Senate Bill 1122 Appendix B. SB 1122 Forest Derived Biomass Supply Eligibility Appendix C. Forest Health Protection Survey Appendix D. Feedstock Specifications Example

Biomass Feedstock Availability Analysis for the Mariposa Biomass Project 1
INTRODUCTION The Mariposa Biomass Project Group (MBPG) is considering development of a new community-scale (1 to 3 MW) biomass power generation facility at Mariposa, California. Availability of economical, woody biomass feedstock meeting feedstock specifications is an important consideration in the evaluation of this potential opportunity. A primary objective of the MBPG is to provide a value-added utilization alternative for excess forest biomass feedstock generated as a byproduct of hazardous forest fuels reduction activities in the greater Mariposa area. In order for the MBPG to take advantage of a 2012 state legislative initiative (Senate Bill 1122) in support of small-scale bioenergy project development in California, the project must meet SB 1122 program implementation guidelines.1 A key feedstock requirement included in the guidelines is the provision that the project must utilize at least 80 percent forest-sourced feedstock generated as byproducts of sustainable forest management. Appendix A provides an overview of SB 1122 and relevant feedstock provisions. This feedstock availability and cost analysis report addresses SB 1122 requirements. It will be important that the MBPG consider meeting SB 1122 guidelines in order to secure a power purchase agreement with PG&E.
The feedstock sourcing area (FSA) utilized for this analysis includes a 50-mile radius from Mariposa. Figure 1 highlights the 50-mile radius and approximate haul zones (30 minute, 60 minute and 90 minute). Please note that haul zone designations are very high level and are provided here to show that the local road system favors hauling from the north, west and south.
Figure 1. Feedstock Sourcing Area and Drive Time
1 Per January 2015 proposed decision issued by the California Public Utilities Commission Administrative Law Judge Simon.

Biomass Feedstock Availability Analysis for the Mariposa Biomass Project 2
Feedstock considered in this analysis includes forest-sourced material from both private and publicly managed lands, agricultural residuals, and urban wood including clean construction and demolition wood and green waste.2 This analysis addresses availability of technically and economically available feedstocks from the FSA. The technical availability analysis includes an assessment of availability based on critical issues such as SB 1122 compliance and road systems that will accommodate chip vans. The economically available screens address competition and demand for biomass feedstocks.
2 Green waste is primarily made up of tree trimmings and other woody vegetative material.

Biomass Feedstock Availability Analysis for the Mariposa Biomass Project 3
FEEDSTOCK AVAILABILITY ANALYSIS
Vegetation Cover
Woody biomass availability for any given region is heavily dependent on vegetation cover, topography, land management objectives, and ownership. Figure 2 (see next page) shows the vegetation cover types for the FSA using US Geological Survey LANDFIRE data. The vegetation cover types are categorized as agriculture, conifer, hardwood, shrubland, grassland, developed, water and non-forest. Non-forest includes barren, rocky and ice or snow-covered terrain. Vegetation cover types influence woody biomass availability. Depending on management objectives, certain cover types could generate significant volumes of woody biomass material for use as feedstocks for bioenergy production. Table 1 and Figure 3 summarize vegetative cover categories within the FSA. The conifer cover class is predominantly Sierran Mixed Conifer-Red Fir, with additional areas of Ponderosa Pine and Subalpine Conifer. The hardwood cover class consists mostly of Montane Hardwood. In the Mariposa FSA, shrubland includes areas of grassland mixed with Blue Oak Woodland and Mixed Chapparal.3
Table 1. Vegetation Cover within the FSA
COVER CATEGORIES 50-MILE FSA
ACRES PERCENT OF TOTAL
Agriculture 922,880 18.4% Conifer 1,724,935 34.3% Hardwood 327,550 6.5% Shrubland 988,272 19.7% Grassland 137,098 2.7% Non-Forested 298,817 5.9% Water 247,633 4.9% Developed 379,362 7.5%
TOTALS 5,026,548 100.0%
3 Vegetation cover also utilizes the California Wildlife Habitat Relationship (CWHR) vegetation classification database. California Department of Fish and Wildlife: https://www.dfg.ca.gov/biogeodata/cwhr/

!(
!(
!(North Fork
Sonora
Mariposa
Fresno
Modesto
Merced
Madera
Turlock
§̈¦5
£¤395
Fresno
Madera
Tuolumne
Merced
Mariposa
Mono
Stanislaus
CalaverasSan Joaquin
Alpine
Data Source:U.S. Geologic Survey
LANDFIRE Ü0 2010Miles
50-Mile RadiusRim FireSlope > 35%
Non-ForestedHardwoodConifer
GrasslandShrublandWater
AgricultureDeveloped
Figure 2. Vegetation Cover Map

Biomass Feedstock Availability Analysis for the Mariposa Biomass Project 5
Figure 3. Vegetation Cover Distribution
Over one-third of the FSA consists of the conifer cover type. Hardwoods (shown in Table 1 and Figure 3) are found in the Sierra Nevada foothills and along watercourses. Approximately 20 percent of the FSA is classed as shrubland. The 50-mile FSA includes access to agricultural and urban wood feedstocks. Forest biomass collection activities are generally restricted to topography that will allow ready access for equipment and crew. Steep topography over 35 percent slope gradient is considered to be the breakoff point for ground-based logging and/or biomass recovery equipment on federally managed lands (US Forest Service and Bureau of Land Management). Private land managers may use ground-based equipment on slopes up to 50 percent, but the cost of operating on sustained slopes above 35 percent are quite high and often considered prohibitive. Areas with 35 percent slope or higher are highlighted in Figure 2 (shown in black). Table 2 summarizes the results of the slope gradient analysis within the forested landscape across the FSA.
Table 2. Slope Assessment for Forested Land Cover Types
COVER CATEGORY 50-MILE FSA
< 35% SLOPE > 35% SLOPE Conifer 75.8% 24.2% Hardwood 47.8% 52.2%
WEIGHTED AVERAGE 71.3% 28.7%
Agriculture 18.4%
Conifer 34.3%
Hardwood 6.5%
Shrubland 19.7%
Grassland 2.7%
Non-Forested
5.9%
Water 4.9%
Developed 7.5%
50-Mile FSA

Biomass Feedstock Availability Analysis for the Mariposa Biomass Project 6
As shown in Table 2, slope gradient does limit accessible forestland. Hardwood forest types are significantly more affected than conifer. Approximately 52 percent of the total hardwood forest occurs on steep slope gradients. Steep slopes reduce forest treatment access on 24 percent of the conifer forest. However, much of the landscape with slopes greater than 35 percent is concentrated in riparian areas that are typically considered critical wildlife habitat and are not usually targeted for fuels treatment activities.
Land Ownership and Jurisdiction
Land ownership is important as a driver of vegetation management objectives and therefore the availability of acreage for feedstock sourcing. Figure 4 maps the location of public and private land ownerships and jurisdictions. Table 3 and Figure 6 summarize land ownership and jurisdiction within the Mariposa FSA. There are over 5 million total acres within the FSA, with approximately 58 percent in private ownership and 42 percent under state or federal jurisdiction. The USDA Forest Service (USFS) manages three national forests within the FSA: Sierra National Forest, Stanislaus National Forest and a very small section of the Inyo National Forest. Each of the three national forests has designated wilderness areas that remove acreage from consideration for feedstock sourcing. All of Yosemite National Park, and most of the Yosemite Wilderness, are under National Park Service (NPS) jurisdiction and fall within the FSA. The Forested Acres columns in Table 3 specifically calculate the acreage potentially available for feedstock sourcing. The Sierra National Forest non-wilderness has 33 percent of the forested land in the FSA. The Stanislaus National Forest non-wilderness has 26 percent; however, almost a third of the forested acreage in the Stanislaus National Forest has been removed from consideration for feedstock sourcing due to the large-scale 2013 Rim Fire. Yosemite National Park does have active forest management programs, although the forested acres potentially available for feedstock have also been reduced by the Rim Fire. There are approximately 1.5 million forested acres in the Mariposa FSA after acreage reductions for USFS and NPS wilderness and removal of all Rim Fire burned acres. Accounting for adverse slopes greater than 35 percent (see Table 2 and Table 3), the total forest landscape considered accessible for feedstock sourcing amounts to approximately 1.1 million acres. It is important to note that private lands constitute 43% of the forested acreage, making forest management activity on private lands a potentially significant source of feedstock materials. Figure 5 maps private forest acreage, conifer and hardwood cover classes. Although there are some contiguous parcels of private forest lands in the Stanislaus and Sierra National Forest, most private land forests are on smaller discontinuous acreage. Shrubland acreage within the FSA is almost all on private lands.

!(
!(
!(Sonora
North Fork
Mariposa
Fresno
Modesto
Merced
Madera
Turlock
£¤395
Fresno-Yosemite International Airport
Ü0 2010Miles
Sierra National Forest
Stanislaus National Forest
Data Source:Bureau Land Management
LAND Surface Estates
Figure 4. Land Ownership and Jurisdiction Within th FSA
FWS Wildlife Refuge50-Mile RadiusPrivate Lands
USFS National Forest USFS WildernessNPS National Park NPS WildernessBLM Public Domain BLM Wilderness
Other Federal Lands

!(
!(
!(Sonora
North Fork
Mariposa
Fresno
Modesto
Merced
Madera
Turlock
£¤395
Fresno-Yosemite International Airport
Ü0 2010MilesData Source:
Bureau Land ManagementLAND Surface Estates
50-Mile RadiusRim Fire
Conifer
Developed
Agricultural
GrasslandHardwood Water
Shrubland
Figure 5. Private Ownership of Forested Lands

Biomass Feedstock Availability Analysis for the Mariposa Biomass Project 9
Table 3. Land Ownership and Jurisdiction within the FSA: Total and Forested Acres
OWNERSHIP
50-MILE FSA TOTAL ACRES FORESTED ACRES
TOTAL ACRES
PERCENT TOTAL ACRES
CONIFER ACRES
HARDWOOD ACRES
TOTAL FORESTED
ACRES
PERCENT FORESTED
ACRES BLM Public Domain 129,706 2.6% 60,620 13,187 73,807 4.91% USFS Sierra National Forest (Non-Wilderness) 503,357 10.0% 404,113 87,614 491,727 32.68% USFS Stanislaus National Forest (Non Wilderness) 390,059 7.8% 299,505 88,695 388,200 25.80%
Stanislaus Rim Fire Burned Acres -154,540 -3.1% -109,980 -29,088 -139,068 -9.24% USFS Inyo National Forest (Non Wilderness) 6,570 0.1% 1,908 72 1,980 0.13% USFS National Forest Designated Wilderness 290,554 5.8% NPS Yosemite (Non Wilderness) 96,781 1.9% 60,194 10,202 70,396 4.68%
Yosemite Rim Fire Burned Acres -11,879 -0.2% -7,934 -1,707 -9,641 -0.64% NPS Yosemite Wilderness 623,107 12.4% Other Federal4 52,056 1.0% State and Local 19,153 0.4% Private 2,912,532 58.0% 548,390 99,217 647,607 43.04%
Private Land Rim Fire Burned Acres -23,988 -0.5% -17,691 -2,672 -20,363 -1.35% TOTALS 5,023,875 100% *1,239,125 *265,520 *1,504,645 100.0%
Steep Topography (> 35%) Acres -299,780 -138,655 GRAND TOTALS 939,345 126,865 1,066,210
*Rim Fire burned acres have been removed from totals The Total Acres columns do not have Rim Fire acres removed from their final total. However, the Forested Acres columns are summed with Rim Fire burned acreage removed. Therefore, Forested Acres columns represent acreage potentially available for feedstock sourcing.
4 Other federal lands include the Bureau of Reclamation, US Army Corps of Engineers and US Fish and Wildlife Service

Biomass Feedstock Availability Analysis for the Mariposa Biomass Project 10
Figure 6. Land Ownership Distribution.
*Forested acreage available for forest mananagement; Rim Fire burned acres are removed. Land ownership distribution is shown in Figure 6 using the acreage amounts in Table 3. Forested Acres are potentially available for feedstock sourcing. The Sierra National Forest has a larger portion of forested lands potentially available than the Stanislaus National Forest after excluding acreage lost to the Rim Fire. Yosemite National Park contains about 4 percent of the forest land available for management in the FSA.
BLM, 2.6% Sierra NF,
10.0%
Stanislaus NF, 7.8%
Inyo NF, 0.1% NF
Wilderness, 5.8%
Yosemite, 1.9%
Yosemite Wilderness,
12.4%
Other Federal, 1.0%
State&Local, 0.4%
Private, 58.0%
FSA TOTAL ACRES
BLM, 4.91%
Sierra NF, 32.68%
Stanislaus NF, 16.56% Inyo NF,
0.13%
Yosemite, 4.04%
Private, 41.69%
FSA FOREST ACRES*

Biomass Feedstock Availability Analysis for the Mariposa Biomass Project 11
Forest-Sourced Biomass
Timber Harvest Residuals Timber harvest residuals can provide significant volumes of woody biomass material. Typically available as limbs, tops and unmerchantable logs,5 these residuals are byproducts of commercial timber harvest operations. As such, these residuals have very limited market value though they can be a relatively economic raw material feedstock source for bioenergy production.6 Once collected and processed using portable chippers or grinders, this material is an excellent biomass feedstock due to relatively high heat value,7 low moisture content8 and low ash content.9 Timber harvest activity within the State of California is monitored by the State Board of Equalization (BOE). The BOE levies timber harvest taxes based on annual timber harvest levels. A review of the 2010 through 2014 BOE timber harvest data was conducted to analyze historic timber harvest activities within the FSA. BOE data is provided separately for commercial timber harvests on both private and public lands. The FSA takes in all or part of eight counties: Calaveras, Fresno, Madera, Mariposa, Merced, Mono, Stanislaus and Tuolumne. Table 4 and Table 5 provide results for private timber harvests by county, expressed in thousand board feet (MBF)10 per year. Table 6 and Table 7 provide results for public timber harvests, expressed in MBF per year.
Table 4. Private Timber Harvest Volume 2010 through 2014
COUNTY 2010 (MBF/YR)
2011 (MBF/YR)
2012 (MBF/YR)
2013 (MBF/YR)
2014 (MBF/YR)
AVERAGE (MBF/YR)
Calaveras 19,285 32,298 36,420 33,393 1,110 24,501 Fresno 5,244 4,534 5,724 3,934 530 3,993 Madera 21 38 990 231 211 298 Mariposa 1,524 4,335 3,031 5,080 4,406 3,675 Merced 0 0 0 0 0 0 Mono 0 0 0 0 0 0 Stanislaus 0 0 0 0 0 0 Tuolumne 11,715 37,981 28,287 63,520 67,768 41,854
TOTALS 37,789 79,186 74,452 106,158 74,026 74,322
5 Unmerchantable logs are typically too small or defective (diseased or dead) for manufacturing into lumber. 6 Biomass power plants such as Pacific Ultrapower Chinese Station and SPI Standard are currently procuring forest feedstock from the FSA. 7 Conifer material typically has a high heat value exceeding 8,000 Btu per dry pound. 8 If processed six months after harvest (allowed to dry), moisture content can be as low as 30%. 9 Typically less than 3% ash. 10 MBF = thousand board foot measure. One board foot is nominally 12” long by 12” wide and 1” thick.

Biomass Feedstock Availability Analysis for the Mariposa Biomass Project 12
Table 5. Private Timber Harvest Volume Estimates by County within the FSA
COUNTY PERCENT IN FSA
WEIGHTED AVERAGE (MBF/YR)
Calaveras 10.2% 2,489 Fresno 14.4% 577 Madera 98.1% 293 Mariposa 100.0% 3,675 Merced 54.6% 0 Mono 1.6% 0 Stanislaus 27.4% 0 Tuolumne 77.4% 32,406
TOTALS 39,440
Table 6. Public Timber Harvest Volume 2010 through 2014
COUNTY 2010 (MBF/YR)
2011 (MBF/YR)
2012 (MBF/YR)
2013 (MBF/YR)
2014 (MBF/YR)
AVERAGE (MBF/YR)
Calaveras 6,368 1,363 3,026 2,864 838 2,892 Fresno 2,070 13,246 7,405 11,083 25,978 11,956 Madera 3,532 3,900 8,910 5,538 2,137 4,803 Mariposa 3,579 228 0 5,080 0 1,777 Merced 0 0 0 0 0 0 Mono 0 30 2,349 444 0 565 Stanislaus 0 0 0 0 0 0 Tuolumne 11,881 6,095 7,072 16,987 62,555 20,918
TOTALS 27,430 24,862 28,762 41,996 91,507 42,911
Table 7. Public Timber Harvest Volume Estimates by County within the FSA
COUNTY PERCENT IN FSA
WEIGHTED AVERAGE (MBF/YR)
Calaveras 10.2% 294 Fresno 14.4% 1,727 Madera 98.1% 4,712 Mariposa 100.0% 1,777 Merced 54.6% 0 Mono 1.6% 9 Stanislaus 27.4% 0 Tuolumne 77.4% 16,196
TOTALS 24,715

Biomass Feedstock Availability Analysis for the Mariposa Biomass Project 13
Geographic Information System (GIS) spatial analysis determined the percentage of each of the eight counties that lies within the FSA (as shown in Table 5 and Table 7). Using this data, a weighted average timber harvest figure was calculated for each county. The 2010 through 2014 historic record of private and public timber harvest across all counties results in a weighted average annual harvest of 64,155 MBF within the 50-mile FSA. Results of historic timber harvest data analysis confirm that total harvest levels within the FSA have been inconsistent over time. For example, timber harvest figures for 2013 (private and public timber) and 2014 (public timber only) reflect fire salvage harvests consistent with the Rim Fire landscape restoration effort. It is also worth noting that the two counties that make up much of the FSA, Madera and Mariposa, have a combined average timber harvest of about 10,457 MBF per year. This combined harvest for these two counties represents about 16% of the total annual timber harvest within the FSA. The region immediately surrounding Mariposa is not an active commercial harvest area. Part of the reason for this is the fact that there are no large corporate timber holdings (e.g., Sierra Pacific Industries, Soper Wheeler Company) that are focused on growing commercial timber. In addition, the local sawlog market has constricted significantly following the closure of sawmills at North Fork (1994) and Auberry (1994). TSS’ experience with forest biomass recovery confirms that a recovery factor of 0.9 bone dry ton (BDT)11 per MBF of sawlogs harvested would apply for commercial timber harvests in mixed conifer stands within the FSA. This amounts to a potential availability of 57,739 BDT per year of timber harvest residuals as feedstock from the FSA. Not all road systems will accommodate biomass recovery operations. Slope gradient has a significant impact on forest road layout. Slope analysis (see Table 2) confirms that almost 29 percent of the forested acreage in the FSA is over 35 percent slope gradient. Based on interviews with public and private land managers, it is assumed that 75 percent of the publicly managed forest landscape has road systems that will facilitate chip transport. Privately managed forests are slightly less at 70 percent. For the purposes of this feedstock analysis, it is assumed that 75 percent of the timber harvest operations on publicly managed forest lands and 70 percent of the private forests are located on road systems that will support biomass feedstock transport using conventional chip vans. In addition to road systems, the other technical availability screens include compliance with Senate Bill 1122. SB 1122 clearly designates CAL FIRE as the lead agency to determine forest feedstocks that qualify as byproducts of sustainable forest management. Appendix A includes the full text of SB 1122. CAL FIRE convened a series of workshops during the fall of 2013 and developed suggested guidelines to meet the intent of SB 1122. In December 2014, the full California Public Utilities Commission (CPUC) accepted the SB 1122 implementation decision which included the CAL FIRE sustainability guidelines. See Appendix B for the SB 1122 forest feedstock sustainability guidelines. Forest biomass that qualifies as feedstock consistent with SB 1122 must be sourced as one of four forest sources. 11 One bone dry ton equals 2,000 dry pounds (no moisture content).

Biomass Feedstock Availability Analysis for the Mariposa Biomass Project 14
• Fire Threat Reduction o Consistent with Fire Plan approved by CAL FIRE o Consistent with fuels treatment activities on federal lands
• Fire Safe Clearance Activities o Near homes, businesses, consistent with state Public Resources Code sections
requiring defensible space clearance o Also applies to 150’ Fuel Reduction Exemption
• Infrastructure Clearance Projects o Power lines, substations, roads, railways, switchyards
• Other Sustainable Forest Management o Must meet at least 12 of 16 items that address:
Habitat, temporal, and spatial diversity objectives Habitat elements Forest health and fire management objectives Air and water quality protection Societal and economic benefits
As noted above, the SB 1122 guidelines suggest that forest biomass material sourced from sustainable forest management activities must meet at least 12 of 16 eligibility criteria listed (Section II of the guidelines). Some of the private land management activities within the FSA are carried out using even-age management prescriptions. It is not clear if even-age management will meet 12 of the eligibility criteria. TSS contacted CAL FIRE representatives12 to discuss how the agency plans to interpret and implement the sustainability guidelines. CAL FIRE staff13 confirmed that the Energy Division staff at the CPUC are tasked (as a result of the SB 1122 Implementation Decision) with implementing third-party verification and monitoring of feedstock sources and will likely do so within the next 12 months. In the meantime, TSS will assess timber harvest residual feedstock compliance assuming that byproducts of even-age forest management activities do not qualify as SB 1122 compliant feedstock. The SB 1122 guidelines require that at least 80 percent of the forest feedstock meet the sustainability criteria. The remaining 20 percent of the feedstock can be made up of byproducts from even-age management activities, agricultural operations and/or urban wood waste (no treated or painted wood). Due to the more cost-effective nature (as noted in Table 20) and wintertime availability of agricultural byproducts and urban wood waste, TSS recommends the 20 percent feedstock blend not include material sourced from even-age forest management activities (even though this is currently allowed by SB 1122 guidelines). Interviews with foresters managing private forestlands14 within the FSA confirmed that about 50 percent of the commercial timber harvested is from even-age management activities. Interviews with foresters managing public lands confirmed that no even-age management activities occur on publicly managed forests within the FSA.
12 Kim Carr, Assistant Deputy Director, CAL FIRE, Duane Shintaku, Deputy Director, CAL FIRE. 13 Kim Carr, Assistant Deputy Director, CAL FIRE. 14 Tim Tate, Sierra Pacific Industries, Charles Sikora, Consulting Forester, and Leon Manich, Consulting Forester.

Biomass Feedstock Availability Analysis for the Mariposa Biomass Project 15
Timber harvest residual biomass feedstock considered technically available has been screened for topography (slope gradient) and road systems that allow biomass transport and for SB 1122 guidelines assuming even-age management is considered non-compliant. The final feedstock availability screen is consideration of economic availability which addresses competing uses and markets for timber harvest residuals and forest thinning material. As noted in the Biomass Feedstock Competition Analysis, the primary market competition will be from existing and potential biomass power generation facilities. However, there are a variety of competing uses and fates for timber harvest residuals including:
• Firewood • Biomass fuel for existing and potential biomass power generation facilities • Compost • Pile and burn • Lop and scatter
Table 8 shows the timber harvest residuals considered technically and economically available on an annual basis.
Table 8. Total Timber Harvest Residuals Technically and Economically Available
COUNTY PRIVATE (BDT/YR)
PUBLIC (BDT/YR)
Calaveras 2,240 264 Fresno 519 1,554 Madera 263 4,240 Mariposa 3,308 1,600 Merced 0 0 Mono 0 8 Stanislaus 0 0 Tuolumne 29,166 14,576
POTENTIALLY AVAILABLE 35,496 22,243 ADJUSTMENT FOR ROADS/SLOPE -10,649 -5,561
ADJUSTMENT EVEN-AGE MGMT -17,748 TECHNICALLY AVAILABLE 23,782
ADJUSTMENT FOR COMPETING USES -8,324 ECONOMICALLY AVAILABLE 15,458
Timber harvest residual availability will fluctuate based on sawlog demand and landownership management goals and objectives. As Table 4 and Table 6 confirm, sawlog harvest can and will vary annually.

Biomass Feedstock Availability Analysis for the Mariposa Biomass Project 16
Of the five counties within the FSA that historically generate saw logs, only two are likely to provide significant volumes of timber harvest residuals that could be readily accessible to a biomass project at Mariposa: Madera and Mariposa.
Fuels Treatment/Plantation Thinning/Utility Line Clearance Mariposa County is home to numerous communities with residential neighborhoods situated within the wildland urban interface (WUI). Due to high fire danger conditions within the WUI, there are concerted efforts across all forest ownerships to proactively reduce hazardous forest fuels in support of defensible communities. In addition, forest landowners are conducting pre-commercial thinning activities within plantations in order to achieve fuels treatment and stocking control (reduce the number of trees per acre as plantations age over time and tree size increases). Utility line clearance activities are also a potential source of forest feedstock. Discussions with the Sierra National Forest,15 Stanislaus National Forest,16 Fire Safe Councils,17 Natural Resource Conservation Service,18 Pacific Gas and Electric (PG&E),19 National Park Service20 and consulting foresters21 managing private lands provided data on fuels treatment, plantation thinning, and utility line clearance projects and confirmed plans for future treatments. Summarized in Table 9 are the results of those interviews.
Table 9. Fuels Treatment Activities and Utility Line Clearance Planned Across the FSA
SOURCE
FOREST TREATMENT ACTIVITIES
AVERAGE (ACRES/YR)
BIOMASS FEEDSTOCK (BDT/YEAR)
LOW RANGE
(ACRES/YR)
HIGH RANGE
(ACRES/YR) Mariposa Co Fire Safe Council 200 400 300 3,750
Other Fire Safe Councils 300 500 400 5,000 Private Landowners 100 300 200 2,500 BLM 100 300 200 2,500 Sierra National Forest 500 800 650 8,125 Stanislaus National Forest 500 700 600 7,500
Yosemite National Park 100 300 200 2,500 Utility Line Clearance 750 Tree Service Contractors 750
15 Mike Nolen, Forester, Bass Lake RD. 16 Dave Horak, TMO, Stanislaus NF. 17 Chris Trott, Forester, Highway 108 Fire Safe Council. 18 Matt McNicol, Forester, Natural Resources Conservation Service. 19 Corey Peters, Vegetation Program Manager, Central Valley Region, PG&E, David Carruth, Contract Program Manager, Central Valley Region, PG&E. 20 Taro Pusina, Deputy Chief, Prescribed Fire and Fuels, Yosemite National Park, Brian Mattos, Forester, Yosemite National Park. 21 Leon Manich, Forester, Cal Reforest, Tim Tate, District Manager, Sierra Pacific Industries, Charles Sikora, Forester, Sikora Forestry.

Biomass Feedstock Availability Analysis for the Mariposa Biomass Project 17
SOURCE
FOREST TREATMENT ACTIVITIES
AVERAGE (ACRES/YR)
BIOMASS FEEDSTOCK (BDT/YEAR)
LOW RANGE
(ACRES/YR)
HIGH RANGE
(ACRES/YR) TOTALS 1,800 3,300 2,550 33,375
POTENTIALLY AVAILABLE 33,375
ADJUSTMENT FOR RECOVERY -13,350
TECHNICALLY AVAILABLE 20,025
ADJUSTMENT FOR COMPETING USES -8,010
ECONOMICALLY AVAILABLE 12,015
Due to very limited value-added markets for woody biomass material generated as a byproduct of forest fuels treatment activities, most of the fuels treatment operations are processing (mastication or chipping) excess forest biomass and leaving it on site or piling and burning as primary disposal techniques. Discussions with project coordinators and foresters indicated that if a ready market for biomass material existed with values high enough to cover most of the collection, processing and transport costs ($45 to $60/BDT), significant biomass volume would be diverted away from current business-as-usual activities (e.g., mastication, chip, lop and scatter, pile and burn). In addition to fuels treatment and plantation thinning within the FSA, PG&E conducts power distribution and transmission line clearance activities. Discussions with PG&E vegetation management staff22 confirmed that power distribution and transmission line clearance in support of hazard tree trimming and removal is conducted regularly within the FSA. Based on operations over the last five years, approximately 750 BDT per year of forest biomass residuals are generated along utility line corridors across all of the FSA. Interviews with forest managers and fiber procurement foresters confirmed that between 10 and 15 BDT per acre of biomass are considered recoverable during fuels treatment and plantation thinning activities. Assuming an average recovery factor of 12.5 BDT per acre and using the acreage figures as provided in Table 9, approximately 33,375 BDT (potentially availability figure) are potentially available per year. Interviews with resource managers confirmed that much of the potential feedstock is not recoverable due to roads, steep slopes and general accessibility. Applying a 60% adjustment factor results in a technically available figure of 20,025 BDT per year. Understanding that there
22 Corey Peters, Vegetation Management Program Manager, Central Valley Region, PG&E, David Carruth, Contract Program Manager, Central Valley Region, PG&E.

Biomass Feedstock Availability Analysis for the Mariposa Biomass Project 18
will be competing markets (see Biomass Feedstock Competition Analysis) and uses, TSS estimates that 40% of the technically available fuels treatment feedstock will not be available, resulting in 12,015 BDT per year considered to be economically available.
Potential Forest Feedstocks Episodic events such as wildfire and insect infestations can have a significant impact on forest health and the volume of byproducts available during restoration activities. Recent aerial surveys conducted by the US Forest Service confirm that prolonged drought conditions, coupled with bark beetle infestation, have had a severe impact on lower elevation pine and incense cedar on the western slope of the central and southern Sierra Nevada. Estimates from the July 2015 aerial survey of 3.6 million acres suggest that over six million trees on 500,000 acres are dead. The complete survey document can be found in Appendix C. Land managers, landowners and power utility foresters are seeking out markets for the drought and beetle killed timber. Unfortunately, due to recent fire activity (and the glut of sawlogs from fire salvage operations) the local sawmills23 are not able to absorb all the logs generated from tree morality removal operations. These logs (and harvest residue) are an excellent feedstock source. Logs can be stored for up to three years without significant degradation. North Fork Community Power is in the process of assessing whether to store logs on the sawmill site at North Fork in anticipation of the Q4 2016 start up of the bioenergy facility. Events such as the 2013 Rim Fire, 2013 American Fire and 2014 King Fire will generate significant quantities of non-merchantable material that could be utilized as forest feedstock. Feedstocks available as byproducts of fire restoration activities meet the SB 1122 guidelines. Because wildfire and insect infestations are not predictable, they are not specifically calculated in this feedstock availability analysis but are considered potential forest feedstocks.
Findings Table 10 summarizes findings regarding forest-sourced feedstock availability in the FSA.
Table 10. Forest-Sourced Biomass Feedstock Available
SOURCE POTENNTIALLY
AVAILABLE (BDT/YEAR)
TECHNICALLY AVAILABLE (BDT/YEAR)
ECONOMICALLY AVAILABLE (BDT/YEAR)
Timber Harvest Residuals 57,739 23,782 15,458 Forest Treatments 33,375 20,025 12,015
TOTALS 91,114 43,807 27,473
23 Discussions with Larry Duysen, Sierra Forest Products and Brian Wayland, Sierra Pacific Industries.

Biomass Feedstock Availability Analysis for the Mariposa Biomass Project 19
Urban-Sourced Biomass
Construction and Demolition Wood Wood waste generated by local residents, businesses, and construction projects within the FSA regularly produce wood waste in the form of construction debris, demolition wood, and industrial byproducts (e.g., wood pallets). Based on TSS’ experience with urban wood waste generation, approximately 11.5 pounds per capita of waste are generated daily with 10.5 percent of the solid waste stream made up of wood waste. Urban wood feedstock is assumed to have a 20 percent moisture content factor.24 Approximately 65 percent of the total potential volume of urban wood feedstock is recoverable as clean25 wood waste and is considered technically available. Discussions with the Mariposa County Solid Waste Facility staff26 confirmed that due to relatively high fees ($55/ton) charged for wood waste, the facility receives very little construction and demolition wood and green waste. Apparently most of the wood waste generated is burned as firewood or piled and burned. Between 2012 and 2014, the facility received an average of approximately 46 BDT per year (construction, demolition, and other wood waste are characterized as brush). Considering that most of the wood waste generated in the greater Mariposa area (per discussions with solid waste facility staff) is utilized as firewood or is piled and burned, TSS assumes that 90% of the construction and demolition wood is not available as feedstock for the Mariposa project. Table 11 identifies clean urban wood waste considered economically available in the FSA.
Table 11. Construction and Demolition Wood Waste Feedstock
COUNTY COUNTY 2015 POPULATION
50-MILE RADIUS
POPULATION
50-MILE RADIUS
(BDT/YR) Calaveras 45,688 4,642 818 Fresno 972,297 140,454 24,761 Madera 155,878 152,900 26,955 Mariposa 17,791 17,791 3,136 Merced 266,134 145,241 25,605 Mono 14,695 228 40 Stanislaus 532,297 145,600 25,669 Tuolumne 54,337 42,071 7,417 POTENTIALLY AVAILABLE 2,059,117 648,927 114,403
24 From TSS’ experience procuring urban wood waste feedstocks. 25 Clean wood waste is woody debris that is free of paint, resins, pesticides or chemical treatment. 26 Greg Ollivier, Manager, Mariposa County Solid Waste and Recycling.

Biomass Feedstock Availability Analysis for the Mariposa Biomass Project 20
COUNTY COUNTY 2015 POPULATION
50-MILE RADIUS
POPULATION
50-MILE RADIUS
(BDT/YR) ADJUSTMENT FOR
RECOVERY -40,041
TECHNICALLY AVAILABLE 74,362 ADJUSTMENT FOR COMPETING USES
-66,926
ECONOMICALLY AVAILABLE
7,436
Residential Tree Trimming Material Working from previous studies performed by TSS, it is estimated that approximately 100 dry pounds of tree trimmings (not including utility line clearance or commercial tree services) suitable for feedstock are generated annually per capita. TSS assumes approximately 60 percent of this wood waste is recoverable27 as biomass feedstock. Discussions with foresters28 and tree service companies29 confirmed that many homeowners are utilizing tree trimming material as compost or firewood. TSS assumes that 95% of the tree trimming material is not available due to these competing uses. Table 12 identifies tree trimming material considered economically available within the FSA.
Table 12. Tree Trimming Material Feedstock
COUNTY COUNTY 2015 POPULATION
50-MILE RADIUS
POPULATION
50-MILE RADIUS
(BDT/YR) Calaveras 45,688 4,642 232 Fresno 972,297 140,454 7,023 Madera 155,878 152,900 7,645 Mariposa 17,791 17,791 890 Merced 266,134 145,241 7,262 Mono 14,695 228 11 Stanislaus 532,297 145,600 7,280 Tuolumne 54,337 42,071 2,104 POTENTIALLY AVAILABLE 2,059,117 648,927 32,446
ADJUSTMENT FOR RECOVERY -12,979
TECHNICALLY AVAILABLE 19,468
27 From TSS’ experience procuring urban wood waste feedstocks. 28 Charles Sikora, Forester, Sikora Forestry. 29 Goodman and Cole Tree Service, Evan Tree Service.

Biomass Feedstock Availability Analysis for the Mariposa Biomass Project 21
COUNTY COUNTY 2015 POPULATION
50-MILE RADIUS
POPULATION
50-MILE RADIUS
(BDT/YR) ADJUSTMENT FOR COMPETING USES -18,494
ECONOMICALLY AVAILABLE 973
Table 13 summarizes urban-sourced biomass feedstock available within the FSA.
Table 13. Urban-Sourced Biomass Feedstock Available
SOURCE POTENTIALLY
AVAILABLE (BDT/YR)
TECHNICALLY AVAILABLE
(BDT/YR)
ECONOMICALLY AVAILABLE
(BDT/YR) Construction and Demolition 114,403 74,362 7,436
Tree Trimming 32,446 19,468 973 TOTALS 146,849 93,830 8,410
Agriculture-Sourced Biomass
Commercial agriculture comprises over 18 percent of the land use within the FSA (see Table 1). Specific crop production and acreage was calculated using GIS and 2014 National Agricultural Statistics Service data. About one-third of the agricultural acres grow commercial crops that produce significant volumes of wood waste from orchard removal activities. Table 14 summarizes commercial orchard acreage currently in production.30 Nut orchards, predominantly almonds, are the most significant agricultural woody crop in the FSA.
Table 14. Commercial Orchard Acreage by Crop within the FSA
COVER CATEGORIES 50-MILE FSA
ACRES PERCENT OF TOTAL
Almonds 306,318 91.1% Cherry 841 0.2% Other Tree Crops* 687 0.2% Walnuts 9,195 2.7% Peaches 1,304 0.4% Pistachios 18,027 5.4%
TOTALS 336,371 100.0% *Other tree crops include apples, apricots, plums and pecans
30 Data compiled from National Agricultural Statistic Service, 2014.

Biomass Feedstock Availability Analysis for the Mariposa Biomass Project 22
Woody crops are removed on a rotational basis that varies by crop. TSS, in collaboration with U.C. Davis Agricultural Extension and local orchard removal contractors, has identified replacement intervals and biomass recovery rates for the major tree crops within the FSA shown in Table 14. Crop replacement intervals provide an assessment of expected biomass material availability assuming constant annual acreage planted. Using the replacement interval and biomass recovery rates identified in Table 14, TSS calculated potential availability of agriculture-sourced feedstock within the FSA. To be conservative, TSS did not include the potential biomass from grape vines. Grape vine removals are often contaminated with trellis wire and metal stakes that are impractical to extricate. There are numerous orchard removal contractors active in the San Joaquin Valley with almost 100 percent of the orchard material being removed (100 percent recovery) and utilized primarily for firewood and fuel for biomass power plants operating in the valley (see Biomass Feedstock Competition Analysis). Because of the 100 percent recovery rate, TSS reports potentially availability and technical availability as one figure. Understanding that there is significant competition (firewood and biomass fuel) for orchard wood (see Biomass Feedstock Competition Analysis), TSS estimates that approximately 5% percent of the technically available volume is considered economically available. Table 15 provides an overview of economically available orchard material.
Table 15. Agriculture-Sourced Biomass Feedstock Available
CROP
REPLACEMENT INTERVAL
(YEARS)
BIOMASS RECOVERY (BDT/ACRE)
AVERAGE RECOVERY
RATE (BDT/ACRE-YR)
50-MILE RADIUS
(BDT/YR)
Almonds 25 28.5 1.14 349,202 Cherry 20 12.7 0.64 534 Other Tree Crops 35 22.9 0.65 450 Walnuts 30 35 1.17 10,728 Peaches 11.25 18.6 1.65 2,156 Pistachios 100 22 0.22 3,966
TOTAL 367,035 POTENTIALLY &
TECHNICALLY AVAILABLE
367,035
ADJUSTMENT FOR
COMPETING USES
-348,683
ECONOMICALLY AVAILABLE
18,352

Biomass Feedstock Availability Analysis for the Mariposa Biomass Project 23
Biomass Feedstock Competition Analysis
Current Competition Currently there are very limited markets for forest biomass material generated within the FSA. Existing biomass power generation facilities procuring biomass feedstock in the region that may occasionally source feedstock from the FSA are summarized in Table 16.
Table 16. Facilities Currently Sourcing Biomass Feedstock from the FSA
FACILITY SCALE (MW)
ANNUAL FEEDSTOCK
USAGE (BDT/YEAR)
LOCATION
HAUL DISTANCE
FROM MARIPOSA
Akeida Capital 12 96,000 Chowchilla 40 Akeida Capital 12 96,000 El Nido 48 Pacific Ultrapower Chinese Station 20 160,000 Jamestown 53
Sierra Pacific Standard 8 65,000 Standard 60 DTE Stockton 45 380,000 Stockton 107
TOTALS 97 797,000 Interviews with fuel procurement managers in the region confirmed that very little forest biomass feedstock is currently sourced from the FSA. Only Pacific Ultrapower Chinese Station is currently procuring forest feedstocks that are considered tributary to Jamestown. In addition, the Chinese Station facility is likely to completely curtail operations by 2018 as their power purchase agreement with PG&E terminates. TSS estimates that between 10,000 and 20,000 BDT of forest-sourced feedstock are currently procured annually from within the FSA as feedstock for existing biomass power plants. Note that none of these existing facilities are held to the SB 1122 forest feedstock guidelines. There will likely be minimal competitive impacts on forest feedstock volume considered economically available for a project at Mariposa because existing biomass power plants have ready access to all forest biomass (are not subject to SB 1122 compliance screens) generated within the FSA.
Potential Competition There is one proposed community-scale bioenergy facility that may compete for forest feedstock with the Mariposa facility. Known as North Fork Community Power (NFCP), this facility will have the capacity to generate up to 2 MW of power. Table 17 provides detailed information on the NFCP facility.

Biomass Feedstock Availability Analysis for the Mariposa Biomass Project 24
Table 17. Potential Feedstock Competition
FACILITY SCALE (MW)
ANNUAL FEEDSTOCK USAGE (BDT/YEAR)
LOCATION
HAUL DISTANCE FROM MARIPOSA
North Fork Community Power 1 to 2 8,000 - 16,000 North Fork 43
The proponents of NFCP have successfully secured a $4.9 million grant from the California Energy Commission and are likely to commence operations in late 2016. TSS assumes that NFCP will procure between 6,000 and 8,000 BDT per year of forest biomass feedstock material from within the FSA. TSS has accounted for this volume in the competition analysis (removing 16,334 BDT per year) when adjusting the timber harvest residuals and fuels treatment volumes.
Findings
Table 18 summarizes the feedstock by source that is potentially, technically and economically available within the FSA. In order to calculate economically available feedstock volumes, estimates of potentially available quantities were adjusted based on TSS research regarding accessibility, recoverable amounts and competing uses (including market demand). These adjustments provide final estimates of technically and/or economically available biomass feedstock. The largest economically available biomass feedstock source in the Mariposa FSA, at 27,473 BDT/year, is timber harvest residuals. Agricultural and urban sources of feedstock have less availability, with 18,352 BDT/year and 8,410 BDT/year respectively. The primary reason for the notable adjustment of agriculture and urban feedstocks is the relatively significant competing uses for this material (e.g., biomass fuel, firewood, compost).
Table 18. Biomass Feedstock Available within the FSA
SOURCE POTENTIALLY
AVAILABLE (BDT/YEAR)
TECHNICALLY AVAILABLE (BDT/YEAR)
ECONOMICALLY AVAILABLE (BDT/YEAR)
Forest 91,114 43,807 27,473 Urban 146,849 93,830 8,410 Agricultural 367,035 367,035 18,352
TOTALS 604,998 504,671 54,234 A bioenergy facility located at Mariposa will be able to compete more cost effectively for feedstocks located close in to the facility (30-mile and 40-mile radius) due to haul cost advantages. As noted in the Feedstock Cost Analysis, haul costs will average about $100 per hour for a walking floor trailer.31
31 Walking floor trailers are required, as there will not be a trailer tipping mechanism at the Mariposa biomass power facility.

Biomass Feedstock Availability Analysis for the Mariposa Biomass Project 25
Note that forest feedstock sourced from Tuolumne County may need to be delivered using chip trailers less than 30 feet in length (e.g., double trailers) in order to navigate the tight radius curves on Highway 49 between Mariposa and Sonora.32 Alternatively, a stinger steer chip trailer could be used, one similar to the trailer fabricated by the US Forest Service and currently stored at the Bass Lake Ranger District. Lastly, conventional 40-foot trailers could use alternative routes (La Grange/Snelling route) to circumvent the challenging stretch of roadway between Coulterville and Sonora. SB 1122-compliant forest feedstock considered economically available totals 27,473 BDT per year. Assuming the community-scale bioenergy facility is scaled at 2 MW (maximum generation capacity allowed by SB 1122 is 3 MW) and utilizes 12,800 BDT per year of SB 1122 compliant forest feedstock (80 percent of total feedstock usage), there is a feedstock supply coverage ratio of 2.15:1. The private financial sector typically prefer a feedstock coverage ratio of at least 2:1 as a critical feedstock availability screen for bioenergy project financing. The CPUC requires that 80 percent (12,800 of 16,000 BDT total usage per year) of the feedstock blend be forest feedstocks (meeting sustainability guidelines). Forest feedstocks are typically the most expensive of the three sources, so it is very likely that the remaining 20% (3,200 BDT per year) of the feedstock blend will be made up of more cost effective urban and agricultural material. If urban and agriculture sourced feedstocks are included in the calculation (26,762 BDT available), then feedstock coverage ratios are as follows:
• Forest feedstock coverage ratio of 2.15:1 • Urban and agricultural feedstock coverage ratio of 8.36:1
32 Cal Trans advisory suggests trailers under 30-foot length are not recommended (July 16, 2015 email correspondence between Armando Soria, Cal Trans Traffic Operations Branch and Mariposa County Supervisor Rosemarie Smallcombe).

Biomass Feedstock Availability Analysis for the Mariposa Biomass Project 26
FEEDSTOCK COST ANALYSIS
Existing Market Prices
As noted earlier in this report, there are several existing biomass power plants operating in the region (see Table 16). Existing market prices paid by these facilities are summarized in Table 19.
Table 19. Current Biomass Feedstock Market Prices
FEEDSTOCK SOURCE
DELIVERED PRICES TO EXISTING BIOMASS POWER PLANTS
LOW RANGE ($/BDT)
HIGH RANGE ($/BDT)
Forest $32 $40 Urban $24 $32 Agriculture33 $32 $38
Costs to Collect, Process and Transport Biomass Feedstocks
Commercial-scale infrastructure to collect, process, and transport biomass material currently exists within the FSA. TSS relied on interviews with local contractors in addition to TSS’ past experience to analyze these costs. Table 20 provides results of the cost analysis.
Table 20. Biomass Collection, Processing, Transport Costs and Market Prices
BIOMASS MATERIAL SOURCE DELIVERED MATERIAL
LOW RANGE ($/BDT)
HIGH RANGE ($/BDT)
Timber Harvest Residuals Chips $45 $60 Fuels Treatments – USFS/BLM/Private Chips $55 $70
Urban Chips $24 $30 Agriculture Chips $32 $38 Local Homeowners (delivering unprocessed clean wood waste)
Cull Logs, Limbs, Construction Debris, Miscellaneous Wood $10 $15
Note that the urban and agricultural source pricing is more reflective of market pricing (not just collection, processing and transport costs). Urban wood processors charge tip fees to receive wood waste, and these tip fees help to offset processing and transport costs. Orchard removal contractors (primary agricultural feedstock suppliers) charge orchard growers service fees (typically ranging from $100 to $300 per acre), and these fees offset some of the collection, processing and transport costs. Following are the assumptions used to calculate the range of feedstock costs.
33 Orchard removal material.

Biomass Feedstock Availability Analysis for the Mariposa Biomass Project 27
• No service fees or cost share arrangements are available from public agencies or private landowners to offset costs to collect, process and transport forest feedstocks.
• One-way transport averages 30 miles for biomass feedstocks. • Forest biomass is collected and processed (chipped) into the truck at the landing at a cost
of $25 to $40/BDT. • Haul costs are $100/hour for a walking floor chip trailer. • Local homeowners deliver raw wood (limbs, small trees, clean construction wood) with
processing (portable chipper or grinder) costs at Mariposa ranging from $10 to $15/BDT. • Delivered costs for urban and agriculture feedstocks are based on current biomass
feedstock market prices.34 • Biomass feedstock deliveries average 14 BDT/load to Mariposa.
Note that topography, stand density (pre-treatment), stem size, and road systems all have significant impacts on the costs to collect, process, and transport forest feedstocks. Harvest equipment (e.g., feller bunchers and skidders) does not operate as cost effectively on steep topography (35 percent-plus slope conditions) as on level topography. Forest stands that are considered dense (removal rates of 14 to 20 BDT per acre) allow harvest equipment to operate more efficiently and cost effectively. Forest stands considered less dense (e.g., 8 BDT or less per acre) require more travel time between trees by the feller bunchers and longer distances between biomass bundles for skidders. As shown in Table 20, the delivered cost of forest feedstock from fuels treatment activities is significant ($55 to $70 per BDT). There is potential for cost-share funding (federal and state) from existing programs that are designed to support fuels reduction, forest health improvement, and watershed protection. Programs administered by the USFS, CAL FIRE, and the Natural Resources Conservation Service may provide cost-share funding that reduces the delivered cost of forest feedstocks from fuels treatment activities. The most cost-effective forest feedstock will be sourced from timber harvest residuals stockpiled at the landing. As a byproduct of commercial timber harvests, this material (limbs, tops) has been harvested and skidded to the landing in conjunction with sawlog harvesting. The current fate of this material is disposal, using open burning as the preferred technique.35 In addition to being the most cost-effective forest feedstock, utilizing this wood waste as biomass feedstock for bioenergy significantly reduces air emissions36 when compared to current pile/burn technique. Local homeowners generate quantities of limbs and small stems consistent with fuels reduction activities near homes. In addition, due to the recent drought conditions and mountain pine beetle infestation, the greater Mariposa region is experiencing significant tree mortality. TSS recommends that the Mariposa bioenergy facility consider accepting a wide range of woody material that can be stockpiled on site, and a mobile chipper or grinder can be utilized from time to time (e.g., every 60 days) to process this material for use as a feedstock. Not only would the
34 Consistent with delivered feedstock prices paid by commercial scale biomass power facilities in the region. 35 Per discussions with local foresters. 36 Bruce Springsteen, Tom Christofk, Steve Eubanks, Tad Mason, Chris Clavin, and Brett Storey, “Emission Reductions from Woody Biomass Waste for Energy as an Alternative to Open Burning,” Journal of the Air and Waste Management Association, Volume 61, January 2011, pp. 63-68.

Biomass Feedstock Availability Analysis for the Mariposa Biomass Project 28
Mariposa facility be providing a community service, these feedstock sources are quite cost effective as part of the overall feedstock blend.
Delivered Price Forecast
The optimized feedstock blend for the Mariposa facility is shown in Table 21 and represents an SB 1122-compliant feedstock mix (80% forest, 20% urban/agriculture). Noting that there is more than enough feedstock to sustain a bioenergy facility scaled at 2 MW, TSS assumed an annual feedstock demand of 16,000 BDT.
Table 21. Optimized Feedstock Blend
SOURCE VOLUME (BDT/YR)
PERCENT OF TOTAL
Forest 12,800 80% Urban 2,400 15% Agriculture 800 5%
TOTALS 16,000 100% Table 22 provides a five-year biomass feedstock cost forecast for a community-scale bioenergy facility at Mariposa. The MBPG had requested a 10-year forecast, but considering the relatively high number of variables, TSS suggests that a five-year estimate is more relevant. The five-year forecast commences in 2017, as this would likely be the earliest that a community-scale bioenergy facility at Mariposa could attain commercial operations. The starting cost of $51 per BDT is based on the weighted average of feedstock cost (Table 20) and optimized feedstock blend (Table 21). The $51 per BDT base price also assumes a forest feedstock blend of 60 percent fuels treatment material and 40 percent timber harvest residuals.
Table 22. Five-Year Feedstock Cost Forecast 2017 to 2021
2017 2018 2019 2020 2021 Delivered Price $51.00 $48.50 $48.99 $49.47 $49.97
The feedstock cost forecast presented in Table 22 is based on the following assumptions.
• The feedstock supply chain is fully developed with feedstock available from forest-based operations.
• Diesel fuel prices remain under $4 per gallon through 2017 and then escalate at no more than 1.5 percent per year. Current on-highway diesel fuel prices are at their lowest average price since October 2009,37 but this is not sustainable.
• Labor rates remain stable through 2017, then climb at no more than 2 percent per year. • The Chinese Station, Rio Bravo Rocklin and Rio Bravo Fresno biomass power generation
facilities curtail operations by late 2017 (as current power purchase agreements terminate), causing regional urban and agriculture feedstocks to drop slightly in market value.
37 As noted by the US Department of Energy, Energy Information Administration.

Biomass Feedstock Availability Analysis for the Mariposa Biomass Project 29
• Biomass feedstock costs escalate at a 1 percent annual rate due to increased diesel fuel and labor costs from 2018 through 2021.
Presented below in Figure 7 is a feedstock supply curve graph that provides a high-level perspective addressing feedstock cost as a function of volume available (driven primarily by transport distance and cost). Please note that feedstock sourcing will change from year to year as the location of feedstock producing operations adjusts to accommodate forest operations, urban wood collection and orchard removal project locations.
Figure 7. Feedstock Supply Curve
R² = 0.9612
$10
$20
$30
$40
$50
$60
$70
Deliv
ered
Fee
dsto
ck P
rice
($/B
DT)
Biomass Feedstock Volume Available Annually (BDT)
Feedstock Cost and Supply Curve Log. (Supply Volume)

Biomass Feedstock Availability Analysis for the Mariposa Biomass Project 30
FEEDSTOCK PROCUREMENT
Feedstock Specifications
Discussions with the project developers38 confirmed that the technology of choice, thermal gasification, will require feedstock meeting certain specifications for heating value, moisture content and sizing. In order to assure consistent operations at baseload (24/7), it will be important that feedstock meet or exceed these specifications (see Appendix D).
Feedstock Providers
Consistent with SB 1122 guidelines, the primary feedstock utilized at the Mariposa facility will be forest-sourced material. Due to the relatively undeveloped forest biomass market in the region, there are very few local contractors that are equipped to collect, process and deliver forest biomass feedstock. Interviews with local fuel procurement managers and foresters39 confirmed the following commercial-scale contractors are operating in the region.
Table 23. Forest Feedstock Processors
ENTERPRISE HEADQUARTERS LOCATION PRINCIPAL PHONE #
David Wise and Sons Sonora David Wise 209.325.5158 Sierra Resource Management Jamestown Mike Albrecht 209.984.1146 Bordges Timber Shingle Springs Tim Bordges 530.626.7930 Mountain Enterprises Coloma Marcos Gomez 530.626.4127 CTL Forest Management Placerville Jeff Holland 530.626.0995
Urban-sourced feedstocks will be available from regional transfer stations and local homeowners delivering raw wood to the Mariposa site. Arrangements with the transfer stations to stockpile wood waste on their site for processing several times per year (using portable grinders) will likely be the most cost effective approach. TSS suggests making contact with County Solid Waste Departments to discuss potential wood waste storage and removal. Wood waste material from local homeowners can be stockpiled on site for processing every 60 or 90 days. Agricultural feedstocks are available primarily in the fall and winter months from commercial orchard removal contractors in the Central Valley. Winter-time delivery of orchard removal material can be timely, as most forest operations will be curtailed due to wet weather conditions. There are a number of orchard removal contractors operating within the FSA. The three most experienced contractors are listed in Table 24.
38 Phoenix Energy, West Biofuels. 39 John Romena, Buena Vista Biomass Power, Tim Tate, Sierra Pacific Industries, Steve Cannon, Foothill Resource Management.

Biomass Feedstock Availability Analysis for the Mariposa Biomass Project 31
Table 24. Orchard Removal Contractors
ENTERPRISE HEADQUARTERS LOCATION PRINCIPAL PHONE #
G + F Agri Services Ripon Randy Fondse 209.599.8911 Lionudakis Firewood Modesto Phil Lionudakis 209.838.8150 ALW Enterprises Fresno Tim Weaver 559.275.2828
In addition to orchard removal material, agricultural byproducts such as nut shell (e.g., almond, walnut) peach pits, orchard prunings and other agricultural byproducts may be available on a spot purchase basis. Many of these byproducts have high heating value and low moisture content and can be very cost effective.
Feedstock Procurement Contracting
Summarized below are key tasks to consider as part of the early phase feedstock supply chain development process. These tasks are presented in chronological order and apply to all feedstock types. These tasks will take 12 to 18 months to implement.
• Define feedstock specifications (for feedstock procurement agreements) by feedstock type (forest, urban, agriculture). Project developer input will be key. Timing of this task assumes that preferred combustion or gasification technology has been selected by this date. See Appendix D for draft feedstock specification example.
• Draft feedstock procurement agreement templates reviewed by legal staff and select
financial institutions. Recommend several procurement contract templates be considered: o Short term (<one year in duration) o Long term (>two years in duration)
• Commence discussions with US Forest Service (e.g., Stanislaus National Forest) and
BLM regarding long-term stewardship contract(s).
• Confirm target locations for fuels treatment/forest restoration projects included in stewardship contract(s).
• Confirm NEPA process progress with US Forest Service and BLM for stewardship
contract(s).
• Finalize feedstock procurement agreement templates.
• Create prioritized short list of potential feedstock providers. Commence discussions with top tier suppliers. Use Letters of Intent to confirm indicative pricing and suppliers’ interest to begin negotiations leading to long-term feedstock supply agreements.

Biomass Feedstock Availability Analysis for the Mariposa Biomass Project 32
• Contact County Solid Waste departments to begin discussions regarding stockpiling of urban wood waste for processing by MBPG supplied contractor.
• Review SB 1122 feedstock monitoring guidelines with CPUC appointed third party. Set
up accounting guidelines accordingly.
• Draft long-term feedstock procurement agreements delivered to select feedstock suppliers.
• Finalize long-term feedstock procurement agreements with suppliers. Secure signatures.
• Finalize agreements with County Solid Waste Departments for stockpiling of urban
wood.
• Review USFS and BLM stewardship contract template with financial institutions.
• Submit stewardship contract proposal to USFS and/or BLM in response to stewardship project solicitation. MBPG could work with local contractor to provide a shared proposal.
• Finalize stewardship contract(s). Secure signatures.

Biomass Feedstock Availability Analysis for the Mariposa Biomass Project 33
CONCLUSIONS This feedstock availability analysis confirms the long-term sustainable availability of sufficient volumes of forest, urban, and agricultural feedstocks to support a 2 MW bioenergy project at Mariposa. Over 54,000 BDT per year of SB 1122 compliant feedstocks (see Table 18) are available with feedstock coverage ratios consistently over 2:1 as summarized below.
• Forest feedstock coverage ratio of 2.15:1 • Urban and agricultural feedstock coverage ratio of 8.36:1
While year one (2017) delivered feedstock cost is estimated to be $51/BDT, there is opportunity to reduce this cost. US Forest Service and/or BLM service contract fees ($400 to $700/acre) may be available to offset a portion of the cost to harvest, collect and process excess forest biomass. AB 32 Cap and Trade funding administered through CAL FIRE and the GHG Reduction Fund may be available to offset some fuels treatment costs. In addition, the overall market demand for woody biomass feedstocks should begin to decline by late 2017, as three commercial scale biomass power generation facilities40 with combined biomass fuel usage of over 550,000 BDT per year are likely to curtail operations.
40 Chinese Station, Rio Bravo Rocklin, Rio Bravo Fresno.

Biomass Feedstock Availability Analysis for the Mariposa Biomass Project 34
RECOMMENDATIONS A community scale bioenergy facility sited at Mariposa would be strategically located in a region that is at significant risk to catastrophic wildfire events. Concerted efforts on the part of public land managers, private landowners and natural resource managers are currently generating, and will continue to generate, significant volumes of excess forest biomass material suitable for use as feedstock. Much of this excess material is currently piled and burned or chipped and scattered on site. Diversion of forest biomass material for use in a controlled combustion or gasification facility will mitigate air emissions from pile and burn activities while providing feedstock for renewable energy generation as well as sustain local economic development, such as local family wage jobs. Now that long-term, sustainable quantities of SB 1122 compliant feedstock are confirmed to be available, the Mariposa County Fire Safe Council and the Mariposa Biomass Project Group should consider next steps in the path towards development of a 2 MW bioenergy facility. TSS recommends the following tasks as key next steps.
• Convene a community meeting to discuss: o Siting of a bioenergy facility in the Mariposa area o Storage of drought and bug killed logs o Results of this feedstock availability analysis o Next steps
• Issue a Request for Proposals for a feasibility study for a bioenergy project at Mariposa.
The feasibility study would address: o Review of optimized site locations (if a preferred site has not been selected) o Bioenergy technology review and selection o Environmental and regulatory compliance review resulting in a Permitting Plan o Economic and financial feasibility analysis o Recommendations and next steps o Draft and final feasibility study report
• Monitor SB 1122 proceedings at the CA Public Utility Commission.
• Monitor grant funding opportunities that will support ongoing project development
efforts.
• Continue to maintain the Mariposa Biomass Project website, as this is a key tool in support of community outreach.

Appendix A. Senate Bill 1122

Senate Bill No. 1122
Passed the Senate August 31, 2012
Secretary of the Senate
Passed the Assembly August 30, 2012
Chief Clerk of the Assembly
This bill was received by the Governor this day
of , 2012, at o’clock m.
Private Secretary of the Governor

CHAPTER
An act to amend Section 399.20 of the Public Utilities Code,relating to energy.
legislative counsel’s digest
SB 1122, Rubio. Energy: renewable bioenergy projects.Under existing law, the Public Utilities Commission has
regulatory authority over public utilities. Existing law requiresevery electrical corporation to file with the commission a standardtariff for electricity generated by an electric generation facility, asdefined, that qualifies for the tariff, is owned and operated by aretail customer of the electrical corporation, and is located withinthe service territory of, and developed to sell electricity to, theelectrical corporation. Existing law requires an electricalcorporation to make the tariff available to the owner or operatorof an electric generation facility within the service territory of theelectrical corporation, as specified, until the electrical corporationmeets its proportionate share of a statewide cap of 750 megawatts,as specified.
This bill would require the commission, by June 1, 2013, todirect the electrical corporations to collectively procure at least250 megawatts of cumulative rated generating capacity fromdevelopers of bioenergy projects that commence operation on orafter June 1, 2013. The bill would require the commission, foreach electrical corporation, to allocate shares of the additional 250megawatts based on the ratio of each electrical corporation’s peakdemand compared to the total statewide peak demand. The billwould require the commission to allocate those 250 megawatts toelectrical corporations from specified categories of bioenergyproject types, with specified portions of that 250 megawatts to beallocated from each category. The bill would require thecommission to encourage gas and electrical corporations to developand offer programs and services to facilitate development of in-statebiogas for a broad range of purposes. The bill would authorize thecommission, in consultation with specified state agencies, if itfinds that the allocations of those 250 megawatts are not
93
— 2 —SB 1122

appropriate, to reallocate those 250 megawatts among thosecategories.
The people of the State of California do enact as follows:
SECTION 1. Section 399.20 of the Public Utilities Code isamended to read:
399.20. (a) It is the policy of this state and the intent of theLegislature to encourage electrical generation from eligiblerenewable energy resources.
(b) As used in this section, “electric generation facility” meansan electric generation facility located within the service territoryof, and developed to sell electricity to, an electrical corporationthat meets all of the following criteria:
(1) Has an effective capacity of not more than three megawatts.(2) Is interconnected and operates in parallel with the electrical
transmission and distribution grid.(3) Is strategically located and interconnected to the electrical
transmission and distribution grid in a manner that optimizes thedeliverability of electricity generated at the facility to load centers.
(4) Is an eligible renewable energy resource.(c) Every electrical corporation shall file with the commission
a standard tariff for electricity purchased from an electricgeneration facility. The commission may modify or adjust therequirements of this section for any electrical corporation with lessthan 100,000 service connections, as individual circumstancesmerit.
(d) (1) The tariff shall provide for payment for everykilowatthour of electricity purchased from an electric generationfacility for a period of 10, 15, or 20 years, as authorized by thecommission. The payment shall be the market price determinedby the commission pursuant to paragraph (2) and shall include allcurrent and anticipated environmental compliance costs, including,but not limited to, mitigation of emissions of greenhouse gasesand air pollution offsets associated with the operation of newgenerating facilities in the local air pollution control or air qualitymanagement district where the electric generation facility islocated.
(2) The commission shall establish a methodology to determinethe market price of electricity for terms corresponding to the length
93
SB 1122— 3 —

of contracts with an electric generation facility, in considerationof the following:
(A) The long-term market price of electricity for fixed pricecontracts, determined pursuant to an electrical corporation’s generalprocurement activities as authorized by the commission.
(B) The long-term ownership, operating, and fixed-price fuelcosts associated with fixed-price electricity from new generatingfacilities.
(C) The value of different electricity products includingbaseload, peaking, and as-available electricity.
(3) The commission may adjust the payment rate to reflect thevalue of every kilowatthour of electricity generated on atime-of-delivery basis.
(4) The commission shall ensure, with respect to rates andcharges, that ratepayers that do not receive service pursuant to thetariff are indifferent to whether a ratepayer with an electricgeneration facility receives service pursuant to the tariff.
(e) An electrical corporation shall provide expeditedinterconnection procedures to an electric generation facility locatedon a distribution circuit that generates electricity at a time and ina manner so as to offset the peak demand on the distribution circuit,if the electrical corporation determines that the electric generationfacility will not adversely affect the distribution grid. Thecommission shall consider and may establish a value for an electricgeneration facility located on a distribution circuit that generateselectricity at a time and in a manner so as to offset the peak demandon the distribution circuit.
(f) (1) An electrical corporation shall make the tariff availableto the owner or operator of an electric generation facility withinthe service territory of the electrical corporation, upon request, ona first-come-first-served basis, until the electrical corporation meetsits proportionate share of a statewide cap of 750 megawattscumulative rated generation capacity served under this section andSection 387.6. The proportionate share shall be calculated basedon the ratio of the electrical corporation’s peak demand comparedto the total statewide peak demand.
(2) By June 1, 2013, the commission shall, in addition to the750 megawatts identified in paragraph (1), direct the electricalcorporations to collectively procure at least 250 megawatts ofcumulative rated generating capacity from developers of bioenergy
93
— 4 —SB 1122

projects that commence operation on or after June 1, 2013. Thecommission shall, for each electrical corporation, allocate sharesof the additional 250 megawatts based on the ratio of each electricalcorporation’s peak demand compared to the total statewide peakdemand. In implementing this paragraph, the commission shall doall of the following:
(A) Allocate the 250 megawatts identified in this paragraphamong the electrical corporations based on the followingcategories:
(i) For biogas from wastewater treatment, municipal organicwaste diversion, food processing, and codigestion, 110 megawatts.
(ii) For dairy and other agricultural bioenergy, 90 megawatts.(iii) For bioenergy using byproducts of sustainable forest
management, 50 megawatts. Allocations under this category shallbe determined based on the proportion of bioenergy that sustainableforest management providers derive from sustainable forestmanagement in fire threat treatment areas, as designated by theDepartment of Forestry and Fire Protection.
(B) Direct the electrical corporations to develop standardcontract terms and conditions that reflect the operationalcharacteristics of the projects, and to provide a streamlinedcontracting process.
(C) Coordinate, to the maximum extent feasible, any incentiveor subsidy programs for bioenergy with the agencies listed insubparagraph (A) of paragraph (3) in order to provide maximumbenefits to ratepayers and to ensure that incentives are used toreduce contract prices.
(D) The commission shall encourage gas and electricalcorporations to develop and offer programs and services to facilitatedevelopment of in-state biogas for a broad range of purposes.
(3) (A) The commission, in consultation with the State EnergyResources Conservation and Development Commission, the StateAir Resources Board, the Department of Forestry and FireProtection, the Department of Food and Agriculture, and theDepartment of Resources Recycling and Recovery, may reviewthe allocations of the 250 additional megawatts identified inparagraph (2) to determine if those allocations are appropriate.
(B) If the commission finds that the allocations of the 250additional megawatts identified in paragraph (2) are notappropriate, the commission may reallocate the 250 megawatts
93
SB 1122— 5 —

among the categories established in subparagraph (A) of paragraph(2).
(4) For the purposes of this subdivision, “bioenergy” meansbiogas and biomass.
(g) The electrical corporation may make the terms of the tariffavailable to owners and operators of an electric generation facilityin the form of a standard contract subject to commission approval.
(h) Every kilowatthour of electricity purchased from an electricgeneration facility shall count toward meeting the electricalcorporation’s renewables portfolio standard annual procurementtargets for purposes of paragraph (1) of subdivision (b) of Section399.15.
(i) The physical generating capacity of an electric generationfacility shall count toward the electrical corporation’s resourceadequacy requirement for purposes of Section 380.
(j) (1) The commission shall establish performance standardsfor any electric generation facility that has a capacity greater thanone megawatt to ensure that those facilities are constructed,operated, and maintained to generate the expected annual netproduction of electricity and do not impact system reliability.
(2) The commission may reduce the three megawatt capacitylimitation of paragraph (1) of subdivision (b) if the commissionfinds that a reduced capacity limitation is necessary to maintainsystem reliability within that electrical corporation’s serviceterritory.
(k) (1) Any owner or operator of an electric generation facilitythat received ratepayer-funded incentives in accordance withSection 379.6 of this code, or with Section 25782 of the PublicResources Code, and participated in a net metering programpursuant to Sections 2827, 2827.9, and 2827.10 of this code priorto January 1, 2010, shall be eligible for a tariff or standard contractfiled by an electrical corporation pursuant to this section.
(2) In establishing the tariffs or standard contracts pursuant tothis section, the commission shall consider ratepayer-fundedincentive payments previously received by the generation facilitypursuant to Section 379.6 of this code or Section 25782 of thePublic Resources Code. The commission shall requirereimbursement of any funds received from these incentiveprograms to an electric generation facility, in order for that facilityto be eligible for a tariff or standard contract filed by an electrical
93
— 6 —SB 1122
corporation pursuant to this section, unless the commissiondetermines ratepayers have received sufficient value from theincentives provided to the facility based on how long the projecthas been in operation and the amount of renewable electricitypreviously generated by the facility.
(3) A customer that receives service under a tariff or contractapproved by the commission pursuant to this section is not eligibleto participate in any net metering program.
(l) An owner or operator of an electric generation facilityelecting to receive service under a tariff or contract approved bythe commission shall continue to receive service under the tariffor contract until either of the following occurs:
(1) The owner or operator of an electric generation facility nolonger meets the eligibility requirements for receiving servicepursuant to the tariff or contract.
(2) The period of service established by the commission pursuantto subdivision (d) is completed.
(m) Within 10 days of receipt of a request for a tariff pursuantto this section from an owner or operator of an electric generationfacility, the electrical corporation that receives the request shallpost a copy of the request on its Internet Web site. The informationposted on the Internet Web site shall include the name of the cityin which the facility is located, but information that is proprietaryand confidential, including, but not limited to, address informationbeyond the name of the city in which the facility is located, shallbe redacted.
(n) An electrical corporation may deny a tariff request pursuantto this section if the electrical corporation makes any of thefollowing findings:
(1) The electric generation facility does not meet therequirements of this section.
(2) The transmission or distribution grid that would serve as thepoint of interconnection is inadequate.
(3) The electric generation facility does not meet all applicablestate and local laws and building standards and utilityinterconnection requirements.
(4) The aggregate of all electric generating facilities on adistribution circuit would adversely impact utility operation andload restoration efforts of the distribution system.
93
SB 1122— 7 —

(o) Upon receiving a notice of denial from an electricalcorporation, the owner or operator of the electric generation facilitydenied a tariff pursuant to this section shall have the right to appealthat decision to the commission.
(p) In order to ensure the safety and reliability of electricgeneration facilities, the owner of an electric generation facilityreceiving a tariff pursuant to this section shall provide an inspectionand maintenance report to the electrical corporation at least onceevery other year. The inspection and maintenance report shall beprepared at the owner’s or operator’s expense by aCalifornia-licensed contractor who is not the owner or operator ofthe electric generation facility. A California-licensed electricianshall perform the inspection of the electrical portion of thegeneration facility.
(q) The contract between the electric generation facilityreceiving the tariff and the electrical corporation shall containprovisions that ensure that construction of the electric generatingfacility complies with all applicable state and local laws andbuilding standards, and utility interconnection requirements.
(r) (1) All construction and installation of facilities of theelectrical corporation, including at the point of the output meteror at the transmission or distribution grid, shall be performed onlyby that electrical corporation.
(2) All interconnection facilities installed on the electricalcorporation’s side of the transfer point for electricity between theelectrical corporation and the electrical conductors of the electricgeneration facility shall be owned, operated, and maintained onlyby the electrical corporation. The ownership, installation, operation,reading, and testing of revenue metering equipment for electricgenerating facilities shall only be performed by the electricalcorporation.
93
— 8 —SB 1122

Approved , 2012
Governor

Appendix B. SB 1122 Forest Derived Biomass Supply Eligibility

[SB 1122 BIOMASS-SUSTAINABLE FOREST MANAGEMENT] April 29, 2014
1
1
Forest Derived Biomass Supply Eligibility under 2
SECTION 1. Section 399.20 of the Public Utilities Code 3
4
Background 5
At the request of the Energy Division staff at the California Public Utilities Commission (CPUC), the 6 Department of Forestry and Fire Protection (CAL FIRE), with the assistance and facilitation of Sierra 7 Nevada Conservancy and a variety of other stakeholders, this whitepaper was prepared to assist in 8 determining fuel sourcing bioenergy production eligibility criteria for “byproducts of sustainable forest 9 management” consistent with the term as used in Public Utilities Code Section 399.20 (f)(2)(A)(iii). The 10 intent of this whitepaper is to: 1) propose a definition of “sustainable forest management” and 2) 11 provide recommendations for a process for certification, verification, and monitoring to be utilized by 12 sellers and purchasers of eligible by-products to verify that biomass feedstocks utilized by a particular 13 facility are supplied in a manner consistent with the statutory provision for sustainable forest 14 management Section 399.20. 15
Since submission of the whitepaper in late 2013, staff from CAL FIRE and Board of Forestry and Fire 16 Protection (BOF) identified the need for some changes in the original document. Changes have been 17 made to ensure that the objectives of SB 1122 are achieved, while recognizing the current adequacy of 18 regulations governing commercial timber operations under the Z’berg-Nejedly Forest Practice Act and 19 BOF forest practice regulations. 20
Issue 1-Recommendations for Defining of “Byproducts of Sustainable Forest Management” 21
SB 1122 directs 50Mw of bioenergy using byproducts of sustainable forest management allocated 22 based on the proportion of bioenergy derived from Fire Threat Treatment Areas as designated by the 23 Department of Forestry and Fire Protection. The current Fire Threat Treatment Area designation by the 24 Department was completed in 2005 and reflects an index of expected fire frequency and fire behavior 25 based upon fuel ranking and anticipated fire frequency (Sethi, et.al, 2005). Estimates of bioenergy 26 which are to be used for allocation purposes from Fire Threat Treatment Areas were made based on 27 datasets which reflected inventories and vegetation structure on forested lands and shrublands. 28
The categories of potential bioenergy sourcing were adapted from the Public Interest Energy Resources 29 publication titled “An assessment of biomass resources in California” published in 2004. Categories 30 included in the assessment for development of biomass and bioenergy estimates included 1) logging 31 slash, 2) forest thinning, 3) mill wastes, and 4) shrub. These categorizations are sufficient to support an 32 allocation of the 50Mw to the investor owned utilities (IOUs). 33
However, given the assumptions utilized to develop the overall estimates and the scale at which the 34 bioenergy estimates were developed, the Department concurs with the Black and Veatch draft 35 consultant report (April, 2013) that the resource potential and data assumptions for forest materials 36 that would be considered sustainable at the project level needs to be refined for the purposes of 37 determining whether a particular project which supplies by-products, meets the sustainable forest 38 management criteria. 39

[SB 1122 BIOMASS-SUSTAINABLE FOREST MANAGEMENT] April 29, 2014
2
The process for determining sustainable forest management byproduct eligibility under the provisions of 40 SB 1122 relies on the definition of sustainable forestry in part 2 of the Society of American Foresters 41 definition (Appendix A) as well as the federal level defined in FS-979 (Appendix B) and a series of public 42 workshops which were held to refine these broad definitions for the purposes of determining byproduct 43 eligibility under SB 1122. To meet eligibility requirements all biomass feedstocks that are used within 44 this program must be derived from projects that are conducted in conformance with local, state, and 45 federal policy, statutes and regulation, including CEQA and the National Environmental Policy Act 46 (NEPA). This whitepaper, however, does not support requiring CEQA or NEPA review on projects that 47 would not have otherwise been required to be reviewed under those laws. 48
The workshop process was planned and facilitated to assist in refining and integrating the key elements 49 of the two definitions of forest sustainability applicable to the determination of feedstock eligibility for 50 purposes of compliance with PUC Section 399.20. This five month process included stakeholders from 51 the environmental, community, governmental and private industry sectors. Numerous background 52 materials were prepared and circulated, three workshops were held to facilitate input and build 53 consensus and multiple drafts of this white paper were circulated for comment. This paper reflects a 54 balance of viewpoints and attempts to ensure that the majority of biomass feedstock is derived from 55 sustainable forest management practices while providing the biomass energy operators enough 56 flexibility to be able to use diverse sources to ensure year-round reliability. 57
Environmental stakeholders expressed concerns focused on the potential for markets for biomass 58 materials to lead to utilization of components of existing vegetation types which have not been 59 traditionally utilized at a pace and scale that would not be sustainable over time. This concern also 60 mirrors concerns raised in literature review including a comprehensive literature review done by 61 Stewart et. al. (July, 2011). 62
Paraphrasing Stewart, et. al. the structural stand components most likely to be harvested or 63 manipulated during woody biomass operations include: 64
1. Dead or downed wood (pre-existing) and harvest generated slash, 65 2. Understory shrub, herbaceous plants and non-merchantable trees, 66 3. Wildlife structural trees (decaying live trees, cavity trees, mast producing trees, etc.) 67
Stewart further notes: 68
“The maintenance recruitment of structural elements such as large tree and snags, logs, and 69 coarse woody debris that would otherwise not be replaced under an intensive biomass 70 harvesting regime is an issue of critical concern for biodiversity and food webs related to these 71 elements.” 72
There was general concurrence from the workshop participants regarding these key areas and 73 recognition that approaches to evaluating the potential impacts of a proposed forest management vary 74 somewhat between federal, private, and state ownerships both in terms of environmental permitting 75 requirements, review, approval, implementation, inspections, enforcement, etc. Furthermore, the 76 literature reviewed as part of this process did not make specific recommendations on prescriptive 77 retention standards. 78
There was also general concurrence that there be some certainty for supply of by-products and that the 79 process for verifying that by-products were eligible be kept as simple and straightforward as possible. 80

[SB 1122 BIOMASS-SUSTAINABLE FOREST MANAGEMENT] April 29, 2014
3
81
Existing California Sustainable Forest Management Regulatory and Management Framework for Non-82 federal and Federal lands. 83
Forest management activities on federal, state and private ownerships in California, that could provide 84 biomass to 3Mw or less electric generation facilities as defined in Section 399.20(b), are subject to 85 numerous statutes and regulation. 86
Existing Regulatory Framework for Non-federal Lands - Forest management activities conducted on 87 state and private forest ownerships, meeting the statutory definition of timberland, involving the barter 88 or sale of biomass byproducts, is subject to regulation under the provisions of the Z-berg-Nejedly Forest 89 Practice Act (Division 4, Chapter 8, Public Resources Code) and associated regulations under Title 14, 90 California Code of Regulations, Chapter 4. The Public Resources Code and its associated regulations 91 apply to activities that include a wide range of prescriptive standards designed to protect water quality, 92 wildlife habitat, fisheries habitat, soils productivity, archaeological resources, aesthetics, and forest 93 productivity. Landowners with more than 50,000 acres of forestland are required by regulation to 94 demonstrate how their planned management activities will meet long-term sustained yield objectives. 95
Private forest land owners with less than 2,500 acres of timberland are eligible to submit a Non-96 industrial Timber Management Plan which outlines the long term management strategy for the 97 property. Once approved through a multi-agency review, the landowner can conduct timber operations 98 under a Notice of Timber Operations. Non-industrial Timber Management Plans have a core component 99 that requires an assessment of long-term sustained yield based on an uneven-age silvicultural 100 prescription. The practice of uneven aged management requires demonstration of natural regeneration 101 and the maintenance of a balanced forest stand structure. State and private landowners may also 102 conduct timber harvesting operations designed to address fuel management, including biomass 103 harvesting, under a variety of exemptions and emergency notice provisions. 104
It is also anticipated that forest management activities that will generate biomass from private or state 105 forest landownerships that do not meet the definition of timberland, under the Z’berg-Nejedley Forest 106 Practice Act, will be eligible. These lands would typically not support a stand of commercial tree species, 107 but may still support other non-commercial tree species or other woody vegetation. While these 108 projects are not subject to regulation under the Forest Practice Act, they would generally fall under the 109 provisions of the California Environmental Quality Act (CEQA). Therefore, the types of forest 110 management activities that generate biomass feedstocks from most forest fuel hazard reduction 111 activities will fall within the definition of sustainable forest management given their alignment with 112 subpart (f) of the attached definition of sustainable forestry endorsed by the Society of American 113 Foresters (Appendix A), as well as by meeting the intent of SB 1122. As such, these feedstocks will be 114 classified as eligible. 115
Existing Regulatory Framework for Federal Lands - Federal policy for sustainability activities on National 116 Forest Lands is described in the National Forest Management Act of 1976 (P.L.94-588). National Forests 117 are required to prepare Forest and Resource Land Management Plans to guide how forests are managed 118 and to guide design of project level activities consistent with 36 CFR 219. The first priority under 36 CFR 119 219.2 is to maintain or restore ecological sustainability of national forests to provide for a wide variety 120 of uses, values, products and services and to conform to all applicable environmental laws and 121 regulations. Additional federal policy on sustainability is outlined in the National Report on Sustainable 122 Forests—2010 (FS 979). Current guidance regarding management activities on federal lands in the 123

[SB 1122 BIOMASS-SUSTAINABLE FOREST MANAGEMENT] April 29, 2014
4
National Forest System in California emphasize application of restoration principles identified in General 124 Technical Report (GTR)-220 (North, et.al., 2009) with management guidance provided in GTR-237, titled 125 Managing Sierra Nevada Forests (North, 2012). 126
Biomass Utilization and Sustainable Forest Management 127
A number of authors have recognized the clear benefits of reducing density of vegetation, particularly 128 on dry forest types to achieve numerous goals including reducing impacts associated with fire, 129 improving forest health, improving resilience of forests in light of anticipated climate change, and 130 maintaining sustainable carbon stocks and sequestration capacity of forested landscapes (Naeem, et. al. 131 1999, Aber, et. al., 2000, Franklin and Johnson, 2013, Forest Guild 2013, Franklin and Johnson, 2012). In 132 addition, reducing density of vegetation while maintaining important forest structure elements like 133 snags, down woody debris and native oaks often increase forest structural diversity and enhance wildlife 134 habitats (Spies and Franklin, 1991, Hayes et al., 1997), and increase overall wildlife and native plant 135 biodiversity at both the project and landscape scale (Hayes et al., 2003, Rupp et al. 2012, Verschuyl et al. 136 2011, Zwolak, 2009). 137
Markets for biomass feedstocks generated from forested landscapes in California have generally been 138 confined to those areas in close proximity to existing biomass facilities. It is anticipated that build out of 139 50 new Mw of capacity under the provisions of Public Utilities Section 399.20 will expand existing 140 markets for biomass feedstocks. 141
Sustainable Forest Management Definition Recommendations for Purposes of Determining Byproduct 142 Eligibility 143
While the Department recognizes that timber operations on private timberlands must address sustained 144 yield, sustainable forest management practices within the context of PUC Section 399.20 encompasses a 145 broader set of criteria and includes acreage in federal ownership. Given the emphasis of SB 1122 on fire 146 threat treatment linked to sustainable forest management activities and the input from workshop 147 participants, the Department recommends that CPUC staff focus on utilization of the definition 148 developed by the Society of American Foresters as a basis for determining sustainable forest 149 management. Further, the Department recommends that eligible project types for the purposes of 150 determining byproduct eligibility focus on 1) projects that incorporates the specific element in the SAF 151 definition associated with maintenance of long term socioeconomic benefits associated with public 152 safety, jobs, air quality, and economic benefits fuel treatment will provide if markets are found for by-153 products of fuel treatments, [Paraphrase of SAF definition subpart 2(f)] as well as, 2) projects that 154 maintains biodiversity, productivity, regeneration capacity, vitality and potential to fulfill relevant 155 ecological, economic, and social functions[Paraphrase of SAF definition subpart 2]. 156
Specifically, the Department recommends that CPUC staff consider the following definition of 157 sustainable forest management for purposes of determining eligibility of by-products— 158
Qualifying byproducts from sustainable forest management include materials derived from 159 projects that are conducted to reduce fuels which pose a threat to public and the environment in 160 an around communities as well as projects which can be demonstrated to contribute to 161 restoration of forests, enhance the resilience of forests through reduction in fire threat, 162 contribute to restoration of unique forest habitats or maintains or restores forest biodiversity, 163 productivity and regeneration capacity. 164

[SB 1122 BIOMASS-SUSTAINABLE FOREST MANAGEMENT] April 29, 2014
5
165
Issue 2-Verification, Certification, and Monitoring of Feedstock Eligibility 166
Consistent with the above definition, to meet the sustainable forest management eligibility fuel sourcing 167 criteria the owner or operator must ensure that biomass feedstock from any project is sourced from one 168 or more of the following project types and that, where appropriate, a third-party verification process 169 addresses the key elements and gaps related to sustainable forest management risk associated with 170 biomass operations identified by Stewart and others. The key elements to be evaluated are listed in 171 appendix C-2: 172
Eligible Byproduct Sources: 173
I. Fire Threat Reduction - biomass feedstock which originates from fuel reduction activities 174 identified in a fire plan approved by CAL FIRE or other appropriate state, local or federal agency. 175 On federal lands this includes fuel reduction activities approved under 36 CFR 220.6(e)(6)ii and 176 (12) thru (14). 177
178 II. Fire Safe Clearance Activities - biomass feedstock originating from fuel reduction activities 179
conducted to comply with PRC Sections 4290 and 4291. This would include biomass feedstocks 180 from timber operations conducted in conformance with 14 CCR 1038(c) (150’ Fuel Reduction 181 Exemption) as well as projects that fall under 14 CCR 1052.4 (Emergency for Fuel Hazard 182 Reduction), 14 CCR 1051.3-1051.7 (Modified THP for Fuel Hazard Reduction), and 14 CCR 1038(i) 183 (Forest Fire Prevention Exemption), and categorical exclusions on federal lands approved under 184 36 CFR 220.6(e)(6)ii and (12)-(14). 185
186 III. Infrastructure Clearance Projects - biomass feedstock derived from fuel reduction activities 187
undertaken by or on behalf of a utility or local, state or federal agency for the purposes of 188 protecting infrastructure including but not limited to: power lines, poles, towers, substations, 189 switch yards, material storage areas, construction camps, roads, railways, etc. This includes 190 timber operations conducted pursuant to 14 CCR 1104.1(b),(c),(d),(e),(f) &(g). 191
192 IV. Other Sustainable Forest Management – biomass feedstock derived from sustainable forest 193
management activities that accomplish one or more of the following: 1) forest management 194 applications that maintain biodiversity, productivity, and regeneration capacity of forests in 195 support of ecological, economic and social needs, 2) contributes to forest restoration and 196 ecosystem sustainability, 3) reduces fire threat through removal of surface and ladder fuels to 197 reduce the likelihood of active crown fire and/or surface fire intensity that would result in 198 excessive levels of mortality and loss of forest cover or, 4) contributes to restoration of unique 199 habitats within forested landscapes. 200
201 It is recommended by the Department that by-products which do not meet the criteria listed above 202 would not be eligible by-products of sustainable forest management. Based on input from the 203 workshop participants, it was recognized that some flexibility be provided to producers relative to mix of 204 fuel sources and that some provision be provided to allow a producer to utilize material sourced from 205 projects that would not meet the eligibility criteria listed above. To accommodate this need for some 206 supply flexibility the Department recommends that CPUC staff consider allowances for up to 20% of the 207 by-products be sourced from “other” sources as described below. 208

[SB 1122 BIOMASS-SUSTAINABLE FOREST MANAGEMENT] April 29, 2014
6
209 Other Eligible Supply Sources: Eligible byproducts from this category include the following: 210
I. biomass feedstocks derived from other forest management activities that fail to meet 12 211 out of 15 of the eligibility criteria in the checklist found in Appendix C-1 and C-2. 212
213 ii. biomass feedstocks that will be used at the facilities from ”other“ waste streams identified 214
in SB 1122 215 216 Establishing the Basis for and Use of Eligibility Criteria 217 218 It is recommended that by-products from projects which fall into the Fuel Reduction, Fire Safe 219 Clearance, and Infrastructure Categories as defined above (i, ii and iii) be presumed to be eligible and 220 would not be required to fill out the eligibility criteria form in Appendix C-1 and C-2. These projects will, 221 however, need to submit a certification form (Appendix D) and be compliant with other applicable 222 federal, state and local laws. 223 224 With some exceptions, as noted below, forest management activities not associated with the above 225 referenced categories are required to fill out the eligibility form in Appendix C-1 and C-2 to determine if 226 the biomass to be generated by the project is eligible and meets the criteria of Sustainable Forest 227 Management Practices for the purposes of SB 1122. 228 229 Evaluations, completed by a Registered Professional Forester or appropriate federal officer, with 230 exceptions noted herein, must be done on a project-by-project basis upon an assessment of the 231 applicable management practices. 232
Evaluation of biomass supply eligibility from by-products of sustainable forest management for federal 233 projects - Federal projects which generate biomass on National Forest System Lands or other federally 234 owned or managed lands which incorporate management principles identified in GTR-220 and GTR-237 235 will generally be eligible as being sourced from Sustainable Forest Management. To document the 236 consistency of a specific project with the restoration principles in the GTR guidance document, the 237 appropriate Forest Officer or agency official will utilize the eligibility form to determine whether biomass 238 feedstock meets sustainability criteria and can be certified as a by-product of sustainable forest 239 management consistent with Section 399.20. The Forest Biomass Sustainability Byproduct Eligibility 240 Form is used to help evaluate the project to determine and document if byproducts from a forest 241 management project are eligible as a sustainable forest management source. 242
Evaluation of biomass supply eligibility from by-products of sustainable forest management from 243 projects subject to regulation under the Z’Berg-Nejedley Forest Practice Act - For timber harvesting 244 conducted on state and private timberlands, removal of biomass material for sale constitutes a 245 commercial activity and is subject to regulation under the Forest Practice Act. Current forest practice 246 rules generally do not have c prescriptive regulatory requirements specifically addressing biomass 247 harvesting because the low volume harvesting of small woody material (tree tops, branches, slash from 248 logging operations, and small sapling/pole sized conifers and hardwoods) has not been viewed as an 249 activity likely to result in significant adverse or cumulative impacts. CAL FIRE would expect that biomass 250 harvesting, incidental to the more common types of commercial timber operations, not to rise to the 251 level of potential significant adverse impacts, and therefore the requirements of CEQA (disclosure, 252 evaluation and mitigation) would not be triggered. However, in cases where a fair argument for 253

[SB 1122 BIOMASS-SUSTAINABLE FOREST MANAGEMENT] April 29, 2014
7
significant adverse impacts is raised, CAL FIRE would expect the registered professional forester 254 preparing the timber harvesting plan (THP) to address those impacts in sufficient detail to mitigate the 255 impacts. 256
Since the Board of Forestry and Fire Protection’s forest practice rules are not tied to the proposed 257 definition of ‘sustainable forest management’ as described in Appendix A of this document, it is 258 recommended that CPUC should recognize the need for a separate governance process for biomass 259 harvesting operations that would be subject to Section 399.20 of the Public Utilities Code. CAL FIRE 260 does not view the two processes in conflict (enforcement of the Forest Practice Act by the department 261 and enforcement of Section 399.20 by PUC). THPs are intended to address significant adverse impacts, 262 and not necessarily intended to address the broader definition of sustainable forest management as 263 described in this whitepaper. While the Forest Practice Regulations (FPRs) governing THPs generally 264 address “the stewardship and use of forests and forest lands in a way, and at a rate, that maintains their 265 biodiversity, productivity, regeneration capacity, vitality, and potential to fulfill, now and in the future, 266 relevant ecological, economic, and social functions at local, national, and global levels”, the FPRs were 267 not intended for the type of specificity required in determining byproduct eligibility under SB 1122 . 268 The FPRs do not explicitly mention stewarding lands to fulfill economic and social functions at a local or 269 national level. Nonetheless, the department and many participants in the aforementioned workshops 270 deemed this to be an important consideration. 271
A checklist approach for certification has been provided in Appendix C-2; however, this should be 272 viewed as a recommendation, where the specific content could be modified or edited by PUC as 273 improvements, clarifications, or new issues are identified. 274
For each of the elements to be addressed in Appendix C-2 it is recommended that the seller of biomass 275 describe the planned operations and potential positive and/or negative impacts to each resource issue 276 to be addressed in Appendix C. Review of concepts from GTR 220, GTR 237, CEC-500-2011-036, 277 (Stewart, et.al), and GTR 292 (Jain et. al., 2012) are recommended as important references to assist in 278 assessing and addressing the sustainability of proposed operations where biomass removals are 279 proposed to achieve forest management, forest restoration, and/or fire threat reduction objectives. 280
Utilization of this approach will facilitate environmental review by third party verifiers, as well as 281 completion of Appendix C-2 (Forest Biomass Sustainability Byproduct Eligibility Form) for determination 282 of whether the biomass generated by the project meets eligible byproducts under PUC Section 399.20. 283
For ownerships with approved Sustained-Yield Plans or Programmatic Timber Environmental Impact 284 Reports, harvest documents may rely on the assessment of sustainability contained in the programmatic 285 documents to the extent that those elements are addressed and summarize the operational elements 286 applicable to any project under the appropriate area in Appendix C-2. 287
Exceptions to the requirement to apply Appendix C-1 and C-2 for Biomass Produced During Restoration 288 Projects and Small Projects: The following project types are assumed to meet the sustainable forest 289 management criteria or small project size and are recommended to be exempted from completing the 290 Forest Biomass Sustainability Byproduct Eligibility Form (Appendix C-2). 291
1) Sustainable forest management projects implemented on state, federal, and private ownership 292 which involve meadow restoration, restoration of wetlands, restoration of aspen and other 293 similar activities which are undertaken for restoration purposes and are subject to 294 environmental review under CEQA or NEPA. 295

[SB 1122 BIOMASS-SUSTAINABLE FOREST MANAGEMENT] April 29, 2014
8
2) Operations conducted pursuant to an approved Non-Industrial Timber Management Plan where 296 the plan or amendment to the plan evaluates and provides for a discussion of intended biomass 297 operations and byproducts that may have potential significant adverse impacts, evaluates 298 potential significant impacts, and mitigates potential significant impacts. 299
3) Operations conducted pursuant to an approved Timber Harvesting Plan or Modified Timber 300 Harvesting Plans on non-industrial timberland ownerships where the landowner is not primarily 301 engaged in the manufacture of wood products and where the approved plan or amendment to 302 the plan evaluates and provides for a discussion of intended biomass operations and byproducts 303 that may have potential significant adverse impacts, evaluates potential significant impacts, and 304 mitigates potential significant impacts. 305
4) Operations with a total estimated volume of 250 bone dry tons or less. 306
These projects will need to submit a certification form (Appendix D) and be compliant with other 307 applicable federal, state and local laws. 308 309
Certification, Verification and Monitoring to Determine Biomass/Byproduct Eligibility Requirements 310
Certification: For projects on private timberlands, completion of the “Forest Biomass Sustainability 311 Byproduct Form (Appendix C-2)” by a Registered Professional Forester as defined in Title 14 of the 312 California Code of Regulations, Chapter 10 is recommended. Representations of the Registered 313 Professional Forester in completion of the form and certification will be subject to the disciplinary 314 guidelines as described in Public Resources Code Sections 774-779 and the provisions of the California 315 Code of Regulations, Chapter 10, Sections 1612-1614. 316
For federal projects certification will be completed by the appropriate federal officer with authority to 317 approve project decisions pursuant to Forest Service Manual 2400 and all subtitles. Representatives 318 with responsibility for accuracy of the certification are subject to personnel procedures outlined in Code 319 of Federal Regulations Title 5, Subpart 430, Performance Management. 320
Certification by the Registered Professional Forester or appropriate federal representative should be 321 completed utilizing the certification form included in Appendix D. It is expected that each project will 322 have an identifier, map, certification relative to fuel source and an estimated volume by fuel source 323 category or categories. 324
Verification: The owner/operator of the bioenergy facility will be responsible for verifying that the fuel 325 has been appropriately certified. Trip tickets and loads origin will demonstrate a chain-of-custody to the 326 project source. Information shall be available at the bioenergy facility for audit. 327 328 Monitoring for Compliance with Eligibility Criteria: It is recommended that a random audit procedure be 329 established to ensure compliance with program requirements. The consequences for failure to comply 330 should be discussed and developed collaboratively between the CPUC, appropriate federal agencies and 331 CAL FIRE. 332 333 Recommended Audit Period and Remediation: It is also recommended that for purposes of verifying that 334 an individual biomass facility is securing supplies from eligible biomass feedstock sources in a proportion 335 consistent with the targets, the compliance with biomass feedstock supply mix criteria shall be 336 determined based on a 5-year rolling average. It is also recommended that CPUC staff develop a 337 process or processes that bring the biomass feedstock supply mix into conformance with the eligibility 338

[SB 1122 BIOMASS-SUSTAINABLE FOREST MANAGEMENT] April 29, 2014
9
requirements, if it is determined that a given facility is out of compliance. A process for facilities to alter 339 the eligible biomass feedstock mix should also be developed. 340 341 342
343

[SB 1122 BIOMASS-SUSTAINABLE FOREST MANAGEMENT] April 29, 2014
10
344
References: 345
346
Aber, J. and N. Christensen, I. Fernandez, J. Franklin, L. Hidinger, M. Hunter, J. MacMahon, D. 347 Mladenoff, J. Pastor, D. Perry, R. Slagen and H. van Miegroet. 2000. “Applying Ecological Principles to 348 Management of U.S. National Forests”, Issues in Ecology Number 6, Spring 2000, Published by the 349 Ecological Society of America. 350
Black and Veatch. 2013. “Draft Consultant Report Small-Scale Bioenergy: Resource Potential, Costs, and 351 Feed-In Tariff Implementation Assessment”, California Public Utilities Commission. 352
Forest Guild, 2013. “Forest Biomass Retention and Harvesting Guidelines for the Pacific Northwest,” 353 Forest Guild Pacific Northwest Biomass Working Group, report available online at: 354 www.forestguild.org/publications/research/2013/FG_Biomass_Guidelines_PNW.pdf 355
Hayes, J .P., and S. S. Chan, W. H. Emmingham, J. C. Tapperier, L. D. Kellogg, J. D. Bailey. 1997. Wildlife 356 response to thinning young forests in the Pacific Northwest. Journal of Forestry. 95: 28-33. 357
Hayes, J. P., J. M. Weikel, and M .M. P. Huso. 2003. Response of birds to thinning young Douglas-fir 358 forests. Ecological Applications. 13:1222-1232. 359
Helms, J.A., editor. 1998. “The Dictionary of Forestry”, The Society of American Foresters, 5400 360 Grosvernor Lane, Bethesda, MD 20814-2198, www.safnet.org, ISBN 0-939970-73-2. 361
Jain, T.B., M. Battaglia, H. Han, R.T. Graham, C.R. Keyes, J.S. Freid, and J.E. Sandquist, 2012. “A 362 comprehensive Guide to Fuel Management Practices for Dry Mixed Conifer Forests in the Northwestern 363 United States”, United States Department of Agriculture, Forest Service, Rocky Mountain Research 364 Station, General Technical Report RMRS-GTR-292. 365
Naeem, S. and F.S. Chapin III, R. Costanza, P. R. Ehrlich, F. B. Golley, D. U. Hooper, J.H Lawton, R. V. 366 O’Neill, H. A. Mooney, O. E. Sala, A. J. Symstad, D. Tilman. 1999. “Biodiversity and Ecosystem 367 Functioning: Maintaining Natural Life Support Processes”, Issues in Ecology, Number 4, Fall 1999, 368 Published by the Ecological Society of America. 369
North, M, and, P. Stine, K. O’Hara, W. Zielinski and S. Stephens. 2009. “An Ecosystem Management 370 Strategy for Sierran Mixed-Conifer Forests”, United States Department of Agriculture, Forest Service, 371 Pacific Southwest Research Station, General Technical Report PSW-GTR-220. 372
North, M. 2012. “Managing Sierra Nevada Forests”, United States Department of Agriculture, Forest 373 Service, Pacific Southwest Research Station, General Technical Report PSW-GTR-237 Johnson, K. M. and 374 J. F. Franklin. 2013. “Increasing Timber Harvest Levels on BLM O&C Lands While Maintaining 375 Environmental Values”, Testimony before the Senate Committee on Energy and Natural Resources. 376
Public Interest Energy Research Program. 2004. “An Assessment of biomass resources in California”, 377 Contract 500-01-016. http://biomass.ucdavis.edu/pages/CBC_BiomassAssessmentReport.pdf 378

[SB 1122 BIOMASS-SUSTAINABLE FOREST MANAGEMENT] April 29, 2014
11
Rupp, S.P. and L. Bies, A. Glaser, C. Kowaleski, T. McCoy, T. Rentz, S. Riffel, J. Sibbing, J. Verschuyl, T. 379 Wigley. 2012. Effects of bioenergy production on wildlife and wildlife habitat. Wildlife Society 380 Technical Review 12-03. The Wildlife Society, Bethesda, Maryland, USA. 381
Sethi, P. and G. Franklin. 2005. “Biomass Potentials from California Forest and Shrublands Including Fuel 382 Reduction Potentials to Lessen Wildfire Threat”, California Energy Commission Consultant Report, 383 Contract:500-04-004 384
Spies, T.A. and J.F. Franklin. 1991. The structure of natural young, mature and old-growth Douglas-fir 385 forests in Oregon and Washington. U.S. Department of Agriculture, Forest Service, Pacific Northwest 386 Research Station, Portland, Oregon, USA. 387
Stewart, W.,R.F. Powers, K. McGown, L. Chiono, and T. Chuang. 2011. “Potential Positive and Negative 388 Environmental Impacts of Increased Woody Biomass Use for California”, California Energy commission, 389 Public Interest Energy Research (PIER) Program, Final Project Report, CEC-500-2011-036. 390
United States Department of Agriculture, Forest Service, 2011. “National Report on Sustainable 391 Forests—2010”, FS-979. 392
Verschuyl, J., S. Riffel, D. Miller, and T.B.Wigley. 2011. Biodiversity response to intensive biomass 393 production from forest thinning in North American forests - A meta-analysis. Forest Ecology and 394 Management. 261:221-232. 395
Zwolak, R. 2009. A meta-analysis of the effects of wildfire, clearcutting and partial harvest on the 396 abundance of North American small mammals. Forest Ecology and Management 258: 539-545. 397
398
399
400
401
402
403

[SB 1122 BIOMASS-SUSTAINABLE FOREST MANAGEMENT] April 29, 2014
12
404 APPENDIX A 405
406
Society of American Foresters: The Dictionary of Forestry 407
(sustainable forestry) (SFM) this evolving concept has several definitions 1. the practice of meeting the 408 forest resource needs and values of the present without compromising the similar capability of future 409 generations —note sustainable forest management involves practicing a land stewardship ethic that 410 integrates the reforestation, managing, growing, nurturing, and harvesting of trees for useful products 411 with the conservation of soil, air and water quality, wildlife and fish habitat, and aesthetics (UN 412 Conference on Environment and Development, Rio De Janeiro, 1992) 2. the stewardship and use of 413 forests and forest lands in a way, and at a rate, that maintains their biodiversity, productivity, 414 regeneration capacity, vitality, and potential to fulfill, now and in the future, relevant ecological, 415 economic, and social functions at local, national, and global levels, and that does not cause damage to 416 other ecosystems (the Ministerial Conference on the Protection of Forests in Europe, Helsinki, 1993) —417 note criteria for sustainable forestry include (a) conservation of biological diversity, (b) maintenance of 418 productive capacity of forest ecosystems, (c) maintenance of forest ecosystem health and vitality, (d) 419 conservation and maintenance of soil and water resources, (e) maintenance of forest contributions to 420 global carbon cycles, (f) maintenance and enhancement of long-term multiple socioeconomic benefits to 421 meet the needs of societies, and (g) a legal, institutional, and economic framework for forest 422 conservation and sustainable management (Montréal Process, 1993) —see biological legacy, certify, 423 chain of custody, criteria and indicators, criterion, ecosystem management. 424
This definition last updated 10/23/2008. 425
426
427

[SB 1122 BIOMASS-SUSTAINABLE FOREST MANAGEMENT] April 29, 2014
13
428 APPENDIX B 429
United States Department of Agriculture: Forest Service: “National Report on Sustainable Forests”, June 430 2011 ( FS-979). 431
432
Sustainable forest management definition: 433 The stewardship and use of forests and forest lands in such a way, and at a rate, that maintains their 434 biodiversity, productivity, regeneration capacity, and vitality, and forest’s potential 435 to fulfill, now and in the future, relevant ecological, economic, and social functions at local, national, and 436 global levels, and not cause damage to other ecosystems. 437 The criteria and indicators are intended to provide a common understanding of what is meant by 438 sustainable forest management. They provide a framework for describing, assessing, and 439 evaluating a country’s progress toward sustainability at the national level and include measures of: 440
441 1. Conservation of biological diversity. 442 2. Maintenance of productive capacity. 443 3. Maintenance of forest ecosystem health. 444 4. Conservation and maintenance of soil and water resources. 445 5. Maintenance of forest contribution to global carbon cycles. 446 6. Maintenance and enhancement of long-term multiple socioeconomic benefits to meet the 447
needs of society. 448 7. Legal, institutional, and economic frameworks for forest conservation. 449
450
451
452

[SB 1122 BIOMASS-SUSTAINABLE FOREST MANAGEMENT] April 29, 2014
14
453
APPENDIX C - 1 454 SB1122 Forest Biomass 455
Forest Biomass Sustainability Byproduct Eligibility Form: 456 Instructions and Worksheet 457
458
Instructions 459 Projects which fall into the Fuel Reduction, Fire Safe Clearance, and Infrastructure categories as defined 460 under sustainable forest management are presumed to be eligible and are not required to fill out 461 Appendix C-2. Projects which meet the sustainable forest management criteria, but are exempt from 462 submitting Appendix C-2 must still meet the minimum sustainability criteria outlined in Appendix C-2. 463 Projects conducted under “I”, ‘ii”, “iii” or “iv” (including exempt projects) must submit a certification 464 form (Appendix D). 465 466 With the exception of projects types noted below, forest management activities not associated with 467 forest biomass categories “i”, “ii”, and “iii”, referenced below, will require use of the Forest Biomass 468 Sustainability Byproduct Eligibility Form (Appendix C-2) to determine if the biomass generated by the 469 project is eligible, and meets the criteria of Sustainable Forest Management Practices under PUC 399.20. 470 471 Ranking criteria have been developed to reflect and support the broad criteria described within the 472 above referenced definition of Sustainable Forest Management. Evaluations, completed by a Registered 473 Professional Forester or appropriate federal officer with exceptions noted herein, must be on a project-474 by-project basis upon an assessment of the applicable management practices. 475 476
Eligible Forest Biomass Categories 477 478
i. Fire Threat Reduction - biomass feedstock which originates from fuel reduction activities identified in a 479 fire plan approved by CAL FIRE or other appropriate, state, local or federal agency. On federal lands this 480 includes fuel reduction activities approved under36 CFR 220.6(e)(6)ii and (12) thru (14). 481 482 ii. Fire Safe Clearance Activities - biomass feedstock originating from fuel reduction activities conducted 483 to comply with PRC Sections 4290 and 4291. This would include biomass feedstocks from timber 484 operations conducted in conformance with 14 CCR 1038(c) 150’ Fuel Reduction Exemption, as well as 485 projects that fall under 14 CCR 1052.4 (Emergency for Fuel Hazard Reduction), 14 CCR 1051.3-1051.7 486 (Modified THP for Fuel Hazard Reduction), and 14 CCR 1038(i) Forest fire Prevention Exemption, 487 Categorical exclusions on federal lands approved under 36 CFR 220.6.(e).(6)ii., 488 489 iii. Infrastructure Clearance Projects - biomass feedstock derived from fuel reduction activities 490 undertaken by or on behalf of a utility or local, state or federal agency for the purposes of protecting 491 infrastructure including but not limited to: power lines, poles, towers, substations, switch yards, material 492 storage areas, construction camps, roads, railways, etc. This includes timber operations conducted 493 pursuant to 14 CC1104. 1(b),(c),(d),(e),(f) &(g). 494 495 iv. Other Sustainable Forest Management – biomass feedstock derived from sustainable forest 496 management activities that accomplish one or more of the following: 1) forest management 497 applications that maintain biodiversity, productivity, and regeneration capacity of forests in support of 498 ecological, economic and social needs, 2) contributes to forest restoration and ecosystem sustainability, 499
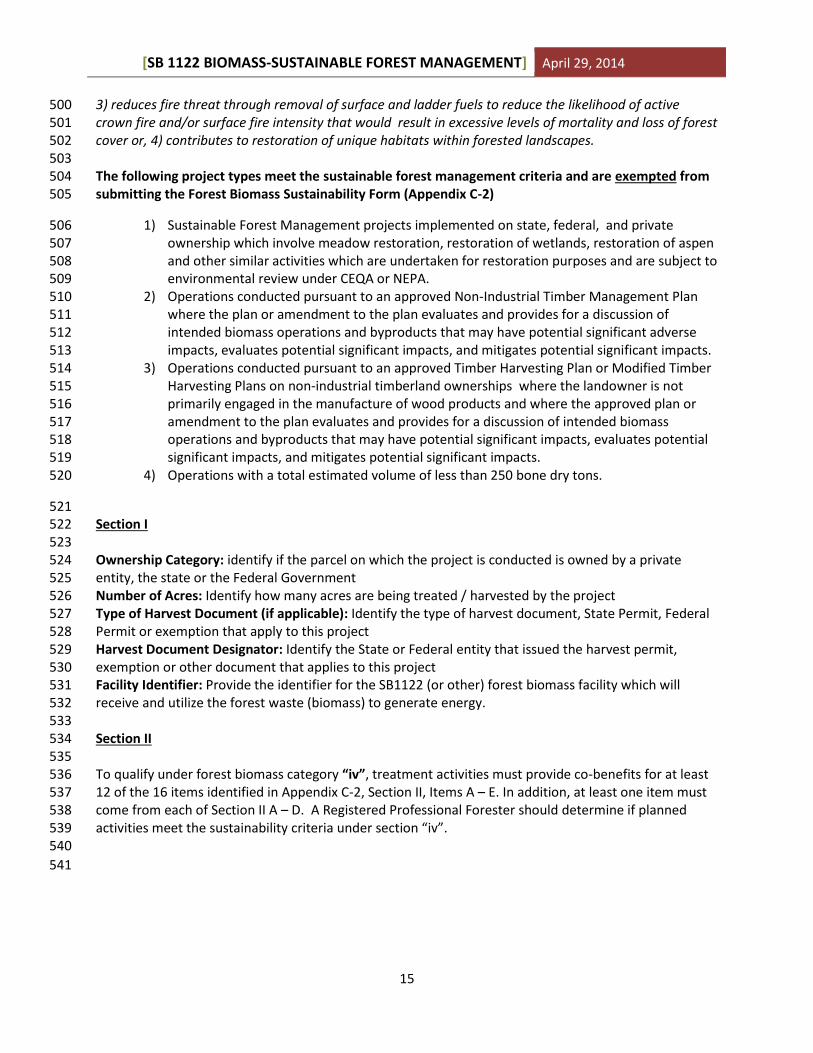
[SB 1122 BIOMASS-SUSTAINABLE FOREST MANAGEMENT] April 29, 2014
15
3) reduces fire threat through removal of surface and ladder fuels to reduce the likelihood of active 500 crown fire and/or surface fire intensity that would result in excessive levels of mortality and loss of forest 501 cover or, 4) contributes to restoration of unique habitats within forested landscapes. 502
503 The following project types meet the sustainable forest management criteria and are exempted from 504 submitting the Forest Biomass Sustainability Form (Appendix C-2) 505
1) Sustainable Forest Management projects implemented on state, federal, and private 506 ownership which involve meadow restoration, restoration of wetlands, restoration of aspen 507 and other similar activities which are undertaken for restoration purposes and are subject to 508 environmental review under CEQA or NEPA. 509
2) Operations conducted pursuant to an approved Non-Industrial Timber Management Plan 510 where the plan or amendment to the plan evaluates and provides for a discussion of 511 intended biomass operations and byproducts that may have potential significant adverse 512 impacts, evaluates potential significant impacts, and mitigates potential significant impacts. 513
3) Operations conducted pursuant to an approved Timber Harvesting Plan or Modified Timber 514 Harvesting Plans on non-industrial timberland ownerships where the landowner is not 515 primarily engaged in the manufacture of wood products and where the approved plan or 516 amendment to the plan evaluates and provides for a discussion of intended biomass 517 operations and byproducts that may have potential significant impacts, evaluates potential 518 significant impacts, and mitigates potential significant impacts. 519
4) Operations with a total estimated volume of less than 250 bone dry tons. 520
521 Section I 522 523 Ownership Category: identify if the parcel on which the project is conducted is owned by a private 524 entity, the state or the Federal Government 525 Number of Acres: Identify how many acres are being treated / harvested by the project 526 Type of Harvest Document (if applicable): Identify the type of harvest document, State Permit, Federal 527 Permit or exemption that apply to this project 528 Harvest Document Designator: Identify the State or Federal entity that issued the harvest permit, 529 exemption or other document that applies to this project 530 Facility Identifier: Provide the identifier for the SB1122 (or other) forest biomass facility which will 531 receive and utilize the forest waste (biomass) to generate energy. 532 533 Section II 534 535 To qualify under forest biomass category “iv”, treatment activities must provide co-benefits for at least 536 12 of the 16 items identified in Appendix C-2, Section II, Items A – E. In addition, at least one item must 537 come from each of Section II A – D. A Registered Professional Forester should determine if planned 538 activities meet the sustainability criteria under section “iv”. 539 540
541

[SB 1122 BIOMASS-SUSTAINABLE FOREST MANAGEMENT] April 29, 2014
16
542
APPENDIX C - 2 543
Forest Biomass Sustainability Byproduct Eligibility Form 544
545
SECTION I 546 547 Ownership Category: Private State Federal Number of Acres: ________ 548 549 Type of Harvest/NEPA Document: ______________Harvest/NEPA Document Designator: ____________ 550 551 Facility Identifier: ______________ 552
553
SECTION II 554
555 Note: Please keep responses brief (under 250 words) and focused on the basis for the determination 556 that the project will support sustainability of the specific objective. In lieu of providing a written 557 response or in addition to the written response, where appropriate provide source references to the 558 approved harvest/NEPA document where discussion of potential significant adverse impacts, evaluation 559 and mitigation measures are provided. 560 561
A. Habitat, Temporal and Spatial Diversity Objectives (Pick all that apply) 562 Openings for shade intolerant species were created to promote regeneration and
habitat diversity. Please describe percent and distribution of areas in small openings less than 2.5
acres in size and planned regeneration methods: ______________________________________________________________________
______________________________________________________________________
Multi-age, multi-species tree habitats were created at the project level. Please describe how the project immediately post harvest will support maintenance,
enhancement and/or restoration of canopy cover and maintain or increase the QMD of an overstory of multi-age, multi-species tree habitats.
______________________________________________________________________
______________________________________________________________________
Understory vegetation was retained and distributed across the project site consistent with fire threat reduction and habitat objectives and contributes to spatial heterogeneity by varying treatments to retain untreated patches, openings and widely spaced single trees and clumps.
Please describe objectives for retention of understory shrubs and trees and estimate post-harvest areas of untreated patches and openings. ______________________________________________________________________

[SB 1122 BIOMASS-SUSTAINABLE FOREST MANAGEMENT] April 29, 2014
17
______________________________________________________________________
B. Habitat Elements: (Pick all that apply) 563
Snags are retained consistent with safety, FPRs, and fire threat reduction goals. Please describe post harvest snag retention objectives and estimate the percentage
of existing snags to be removed as part of the planned forest management activities.
_______________________________________________________________________ _______________________________________________________________________
Down logs with benefit to habitat diversity are retained consistent with fire threat reduction goals.
Please describe project treatment objectives for retention of existing or project related down woody material. _______________________________________________________________________
_______________________________________________________________________
Large hardwoods and Legacy trees are retained as post treatment stand components and habitat.
Please describe post harvest retention objectives for hardwoods and legacy trees. _______________________________________________________________________
_______________________________________________________________________
Management practices and harvesting associated with the project impacts are consistent with objectives of retaining or recruiting large trees at the project and landscape level.
Please describe post harvest old growth tree retention objectives:
______________________________________________________________________
______________________________________________________________________ C. Forest Health and Fire Management Objectives: (Pick all that apply) 564
Fire threat is reduced through treatment of ladder fuels and surface fuels to achieve
reduction in incidence of crown torching in overstory trees and to avoid active crown fires under most conditions.
Please describe post harvest spatial arrangement objectives for retention of understory shrubs and trees in relation to overstory trees. _____________________________________________________________________
_____________________________________________________________________
Outcomes support reintroduction of prescribed fire. Please describe, if applicable post harvest surface and ladder fuel conditions and
proposed use of prescribed fire.

[SB 1122 BIOMASS-SUSTAINABLE FOREST MANAGEMENT] April 29, 2014
18
_____________________________________________________________________
Improvement of overall forest health through reduction in overstocking in small tree sizes and reduction of competition for soil moisture with overstory trees.
Please describe:
_______________________________________________________________________ _______________________________________________________________________
D. Air and Water Quality Protection: (Pick all that apply) 565 Avoided emissions by eliminating need for open burning of slash piles and/or
decomposition. Please describe the relative reduction in emissions attributable to removal of material
from the project site for use as fuel for energy generation in comparison to piling and burning or piling and decomposition.):
_____________________________________________________________________ _____________________________________________________________________
Measures have been incorporated to address moist microsites, and near stream habitats.
Please describe what measures will be employed to protect moist microsites and near-stream habitats.
_____________________________________________________________________ _____________________________________________________________________
Soil protection measures used to minimize compaction and loss of A-horizons and soil carbon. Please describe.
_____________________________________________________________________
_____________________________________________________________________
Operational plans provide for the retention of fine woody debris to minimize potential threats to soil productivity and meet fire threat reduction objectives. Please describe. _____________________________________________________________________ _____________________________________________________________________ E. Societal and Economic Benefits: (Pick all that apply) 566
Project contributes to societal benefits of local communities by way of fire safety,
improved environmental health and overall quality of life. Please describe.
_____________________________________________________________________

[SB 1122 BIOMASS-SUSTAINABLE FOREST MANAGEMENT] April 29, 2014
19
_____________________________________________________________________ Project contributes to local economies by way of providing additional local
employment opportunities and investment. Please describe .
_____________________________________________________________________
_____________________________________________________________________
567 568

[SB 1122 BIOMASS-SUSTAINABLE FOREST MANAGEMENT] April 29, 2014
20
APPENDIX D SB1122 Forest Biomass 569 Project Eligibility Certification 570
571 Ownership Category: Private State Federal Number of Acres: __________ 572 Type of Harvest/NEPA Document: ___________ Harvest/NEPA Document Designator: _____________ 573 Facility Identifier: __________________ RPF License Number (if Applicable): ______________ 574 575 Eligible Fuel Source: (Pick one) 576 To meet the eligible fuel sourcing criteria the owner or operator must ensure that biomass feedstock 577 from any project is sourced from one or more of the following project types: 578
Fire Threat Reduction - biomass feedstock which originates from fuel reduction activities 579 identified in a fire plan approved by CAL FIRE or other appropriate, state, local or federal agency, 580 Categorical exclusions on federal lands approved under 36 CFR 220.6.(e).(6)ii. 581 Fire Safe Clearance Activities- biomass feedstock originating from fuel reduction activities 582 conducted to comply with PRC Sections 4290 and 4291. This would include biomass feedstocks 583 from timber operations conducted in conformance with 14 CCR 1038(c) 150’ Fuel Reduction 584 Exemption, or Categorical exclusions on federal lands approved under36 CFR 220.6(e)(6)ii and 585 (12) thru (14). 586 Infrastructure clearance projects- biomass feedstock derived from fuel reduction activities 587 undertaken by or on behalf of a utility or local, state or federal agency for the purposes of 588 protecting infrastructure including but not limited to: power lines, poles, towers, substations, 589 switch yards, material storage areas, construction camps, roads, railways, etc. This includes 590 timber operations conducted pursuant to 14 CC1104.1(b),(c),(d),(e),(f) &(g). 591
Other Sustainable Forest Management* – biomass feedstock derived from sustainable forest 592 management activities that accomplish one or more of the following: 1) forest management 593 applications that maintain biodiversity, productivity, and regeneration capacity of forests in 594 support of ecological, economic and social needs, 2) contributes to forest restoration and 595 ecosystem sustainability, 3) reduces fire threat through removal of surface and ladder fuels to 596 reduce the likelihood of active crown fire and/or surface fire intensity that would result in 597 excessive levels of mortality and loss of forest cover or, 4) contributes to restoration of unique 598 habitats within forested landscapes. 599
600 Other Fuel Sources: 601 Eligible fuel from this category includes the following: 602 603
biomass feedstocks derived from other forest management activities that fail to meet the 604 requirements of the checklist found in Appendix “C”. 605
biomass feedstocks that will be used at the facilities from ” other “ waste streams covered by SB 606 1122 607
I hereby certify that the information contained in this certification is complete and accurate to the 608 best of my knowledge and conforms to State and Federal Laws, 609 610 611 Print Name:______________________________ Signature:_______________________________ 612
As appropriate attach Forest Biomass Sustainability Byproduct Eligibility Form. 613
614

[SB 1122 BIOMASS-SUSTAINABLE FOREST MANAGEMENT] April 29, 2014
21
* The following project types are assumed to meet the sustainable forest management criteria and 615 are exempted from completing the Forest Biomass Sustainability Form (Appendix C-2) 616
1) Sustainable Forest Management projects implemented on state, federal, and private 617 ownership which involve meadow restoration, restoration of wetlands, restoration of aspen 618 and other similar activities which are undertaken for restoration purposes and are subject to 619 environmental review under CEQA or NEPA. 620
2) Operations conducted pursuant to an approved Non-Industrial Timber Management Plan 621 where the plan or amendment to the plan evaluates and provides for a discussion of 622 intended biomass operations and byproducts that may have potential significant adverse 623 impacts, evaluates potential significant impacts, and mitigates potential significant impacts. 624
3) Operations conducted pursuant to an approved Timber Harvesting Plan or Modified Timber 625 Harvesting Plans on non-industrial timberland ownerships where the landowner is not 626 primarily engaged in the manufacture of wood products and where the approved plan or 627 amendment to the plan evaluates and provides for a discussion of intended biomass 628 operations and byproducts that may have potential significant adverse impacts, evaluates 629 potential significant impacts, and mitigates potential significant impacts. 630
4) Operations with a total estimated volume of less than 250 bone dry tons. 631
632

Appendix C. Forest Health Protection Survey

Aerial Detection Survey – South Sierra Foothills July 6th-10th, 2015
Background: Most of California is well into its fourth year of exceptional drought. As the drought has become increasingly severe and prolonged, tree mortality has generally increased in most areas, sometimes dramatically. This portion of the 2015 regular survey season was conducted for normal data collection within some of the most severe and prolonged drought conditions statewide and included areas of private lands not typically surveyed since mortality and other forest health concerns are not typically expressed in these areas. Particular attention was paid to lowland pine. Current drought conditions in this area are almost entirely exceptional especially to the south. See Figure 1 Objective: Detect and map extent and severity of tree mortality and drought stress along the central Sierras particularly within the Wildland Urban Interface where wild fires can most impact life and property. Much of this area was surveyed in April, but drought stress expression and status of deciduous trees particularly oaks were not discernable at that time. Additionally, more recent conifer mortality is now apparent. Surveyors: J. Moore, A. Jirka, L. McAfee Methodology: Recently dead or currently injured/stressed trees were mapped visually by surveyors using a digital aerial sketch-mapping system while flying in a light fixed-wing aircraft approximately 1,000 feet above ground level. Surveyors recorded the species of tree affected, number recently killed and/or any type of other damage (defoliation, dieback etc.) detected at each mapped location. Details: • Approximately 3.6 million acres were surveyed; covering the lower western foothills of the central and southern Sierras from the
Sacramento area south to Visalia. Much of this area is privately owned oak woodlands and low elevation pine forests, but public areas of note include the western extents of the Stanislaus, Sierra and Sequoia National Forests, Sequoia/Kings Canyon national Park and the Giant Sequoia National Monument. See Figure 3.
• An estimated more than 6 million recently killed trees across over 500,000 acres were recorded. See Figure 3. • Drought induced oak discoloration/defoliation often associated with suspected mortality was widespread throughout the southern portion
of surveyed area. Oaks often looked dead and were recorded as such over large areas. However, oak trees are quite tenacious and early leaf drop and die back are common drought responses. See Figures 2, 4.
• Well over half of the recorded mortality was of recently killed Ponderosa pine often mixed with incense cedar in the north, other pine species further south or with white fir in higher elevation areas. See Figures 5-8.
• Incense cedar mortality was also elevated and since these trees are not killed by bark beetles, mortality was attributed directly to drought. See Figures 5, 8.
• Gray pine mortality was also somewhat elevated but not at levels seen last year. See Figures 2, 7.
Forest Health Protection Survey
Direct questions pertaining to this report to Jeffrey Moore (email: [email protected] phone: 530-759-1753). Report Date Aug 9, 2015.
Figure 1. Flown area and drought conditions as of Aug 4, 2015 based on USGS Drought Monitor.
Summary: Area surveyed: 3.56 million acres Areas with mortality: 526,000 acres Estimated number of trees killed: 6,338,000
Figure 2. Gray pine, blue and live oak mortality and discoloration near Yuba River State Park.

Figure 3. Map of area Surveyed depicting tree mortality and other damage.

Figure 4. Severely discolored/defoliated blue oak containing some suspect mortality east of Pine Flat Reservoir.
Figure 5. Ponderosa pine and incense cedar mortality south of Shaver Lake on the Sierra National Forest.
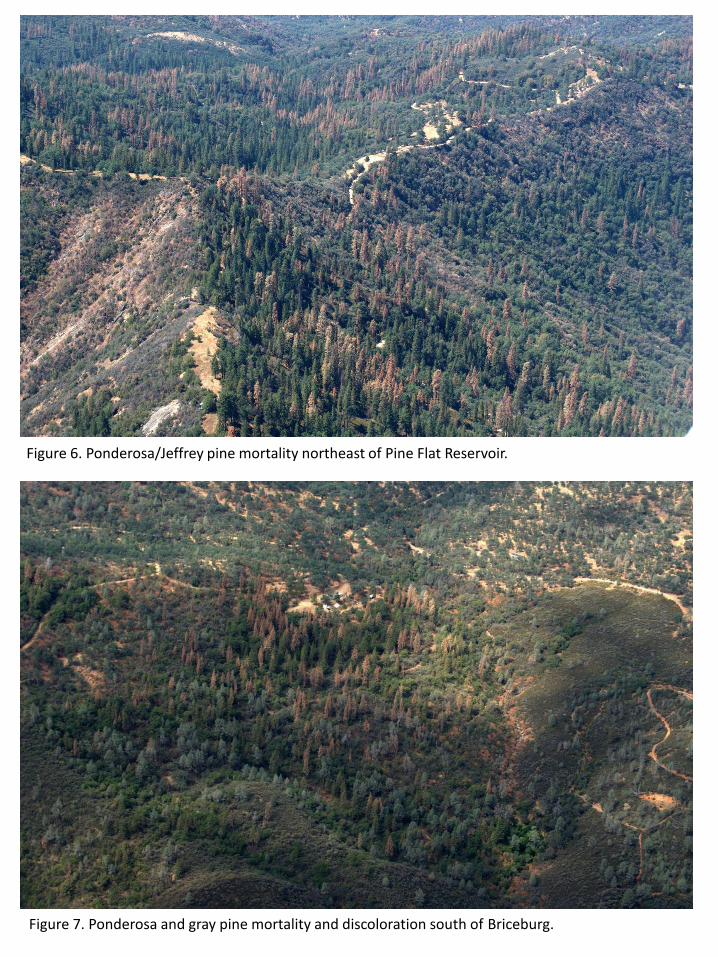
Figure 7. Ponderosa and gray pine mortality and discoloration south of Briceburg.
Figure 6. Ponderosa/Jeffrey pine mortality northeast of Pine Flat Reservoir.
Figure 8. Ponderosa and sugar pine along with incense cedar mortality east of Mariposa on the Stanislaus National Forest.
Figure 9. Knobcone pine mortality on the western flank of Black Mtn. east of Coulterville within the Stanislaus National Forest.

Appendix D. Feedstock Specifications Example

Forest- Sourced Feedstock Specifications (Example)
1. Feedstock Description. Feedstock shall be sourced from forest based operations and will include processed tree limbs, tree tops, cull logs, brush, and small diameter stems. (Paragraph 5 below lists certain excluded materials.) The Higher Heating Value (“HHV”) of the Feedstock shall be a minimum of 8,200 British Thermal Units (“Btu”) per dry pound, for each delivery. The ash content, as determined by an independent third party testing service shall not exceed two (2%) by dry weight of each delivery. 2. Maximum Moisture Content. The maximum moisture content for the Feedstock delivered to the facility shall be forty percent (40%) by weight. Moisture content with respect to any delivery shall be determined in accordance with ASTM specifications and procedures, or equivalent. 3. Maximum Size. Ninety percent (90%) or more of a delivery by volume shall be less than three (3) inches in every dimension. One hundred percent (100%) shall be less than four (4) inches in any dimension. 4. Minimum Size. (Fines and Sawdust). Fines and sawdust, defined as Feedstock of a size 1/4 inch or less, shall comprise no more than ten percent (10%) of gross tonnage for any individual truckload. 5. Excluded Materials. Feedstock shall not contain any foreign material, including, but not limited to, soil, sand, stone, metal, glass, rubber, plastics, pressure treated or lead based painted wood, chemicals, and any hazardous or toxic substances as defined under California or federal law. 6. Consistent with SB 1122 Guidelines. All forest feedstock will be sourced as byproducts of sustainable forest management (per Senate Bill 1122 guidelines).