biomass feedstock-based technology - stony brook …€¦ · · 2017-11-30bio-oil form algae:...
TRANSCRIPT

Biomass Feedstock-based Technology
Professor Devinder Mahajan
NYS SBDC/NYSERDA
The Directions of Renewable Energy Shaping The Future of Business on Long Island
June 8, 2011

World Energy Consumption- Projected
Data source: US DOE- EIA
(2010)

Worldwide CO2 Emissions
Data source: US DOE- EIA (2010)

Sectors that directly affect the public
Direct
• Cars: Gasoline, diesel
• Home heating: Natural gas or Oil
• Electricity
Distributed
- Jet fuel
- Diesel: Trucks, buses (transport food delivery,
etc)

Topics Covered
Topic1: Biofuels: definition and background Topic 2: 1st Generation biofuels Topic 3: 2nd Generation biofuels Topic 4: New York State Initiatives Topic 5: Relevance to Long Island Initiatives

Topic 1
Biofuels: Definition and Background

Background
Definition: Fuels derived from CO2-net neutral feedstocks.
Impact Sectors
• Transportation
• Utilities
• Manufacturing
Gasoline Consumption:
Year Billion gallons
2007 372
2009 346
Goal: Replace 75% oil imports by 2025.

Topic 2
1st Generation Biofuels
• Bioethanol
• Biodiesel

Biofuels
Target Fuel 2005 2012 2025
(billion gallons/year)
Bioethanol [U.S.]* 5 7.5 60
Biodiesel [U.S.]** 0.6 1.3 (2008) ---
Bioethanol [Brazil]** 4.5
*Corn based **Data from NBB ***Sugarcane based (45% of the world total).

Topic 3
2nd Generation Biofuels

U.S. Energy Independence and Security
Act of 2007:
136 billion L of renewable biofuels by 2022.
- corn-based ethanol: 57 billion L
- At least 61 billion L from cellulosic
EPA Ruling- 01/21/2011
- Vehicles 2001 or later: up to 15% ethanol
Drivers

- Biogas
- Algae
- Cellulosic Materials
Feedstocks

Biogas:
A Natural Source of
Bio-methane

14
Animal Animal weight
(lbs) Total manure & urine (gal/day)
Biogas production*
ft3/head/day
Dairy Cow 1400 12.5 46.4
Beef Feeder 800 6.1 27.6
Market Hog 135 1.35 3.9
Poultry Layer 4 0.032 0.29
Advantages
• Readily biodegradable organic matter content of manure.
• Reduction of odor by 50-98%.
• Reduction of pathogens by 90%.
Courtesy: M. Smith, USDA, 2009
Animal Waste

15
MSW
Courtesy: USEPA 2008, USEPA LMOP
Composition
• 70-80% of MSW is ―organic‖
• Landfills: 55% US waste
3 lbs person-1 day-1
50% CH4, 50% CO2
6.2-270 m3 tonne-1
(3.1-135 m3 person-1 yr-1)
• Other processing feasible
• Source separation advantageous
Advantages
• For a landfill: reduces GHG impact, odor control
• Other processes: residues may have value

16
Methane (CH4)
Carbon Dioxide (CO2)
Trace gases (H2S, NH3, H2, N2, CO…...)
Biogas
Anaerobic
Digester
Effluent Stabilized organics
Low odor
Reduced pathogens
Unstable organics
Odorous
Pathogens
Courtesy: M. Smith, USDA, 2009
Influent
Anaerobic Digestion (ASD) Process

Biogas Composition
Component Content
CH4* 55-70 % by vol.
CO2* 30-45% by vol.
H2S* 200-4000 ppm by vol.
NH3** 0-350ppm
Humidity*** Saturated
Energy Content* 20-25 MJ/m3
*RISE-AT (Regional Information Service Center for South East Asia on Appropriate Technology), 1998. Review of current status of
anaerobic digestion technology for treatment of municipal solid waste.
** Strik, D.P.B.T.B. et al., 2006. A pH-based control of ammonia in biogas during anaerobic digestion of artificial pig manure and maize silage.
Process Biochemistry 41, 1235-1238
*** Rakičan, 2007. Biogas for farming, energy conversion and environment projection
Courtesy: M. Smith, USDA, 2009

Biogas: Challenges
• Economical method to extract
bio-methane from biogas.

Algae- A natural
source of Bio-oils
Ref.: Pienkos et al., IEEE Spectrum,
November 2010

What is Algae?
• Algae are microscopic organisms that are oil
factories.
• Algae uses sunlight to make oils:
CO2 Sugars Oils
• Oil yields vary with algae strain (~30,000) but can be
as high as 50%.
- Soybean: 500 L oil/hectare/year
- Algae: 9,000 – 47,000 L oil/hectare/ year
• Oil is very similar to vegetable oils.
• Energy density: similar to gasoline whereas ethanol
is lower.
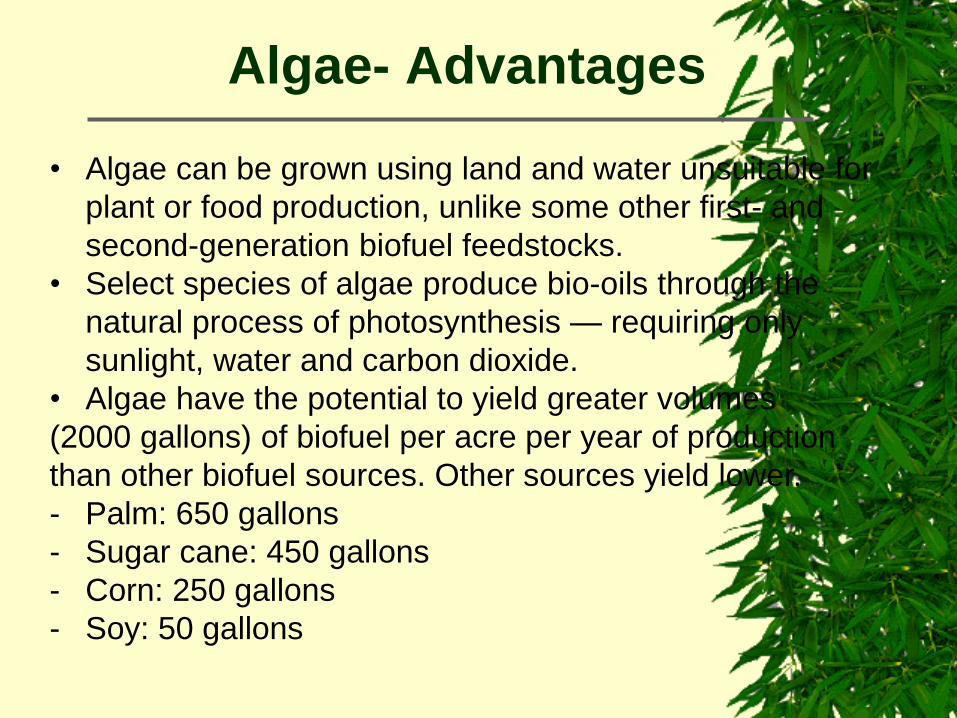
Algae- Advantages
• Algae can be grown using land and water unsuitable for
plant or food production, unlike some other first- and
second-generation biofuel feedstocks.
• Select species of algae produce bio-oils through the
natural process of photosynthesis — requiring only
sunlight, water and carbon dioxide.
• Algae have the potential to yield greater volumes
(2000 gallons) of biofuel per acre per year of production
than other biofuel sources. Other sources yield lower.
- Palm: 650 gallons
- Sugar cane: 450 gallons
- Corn: 250 gallons
- Soy: 50 gallons
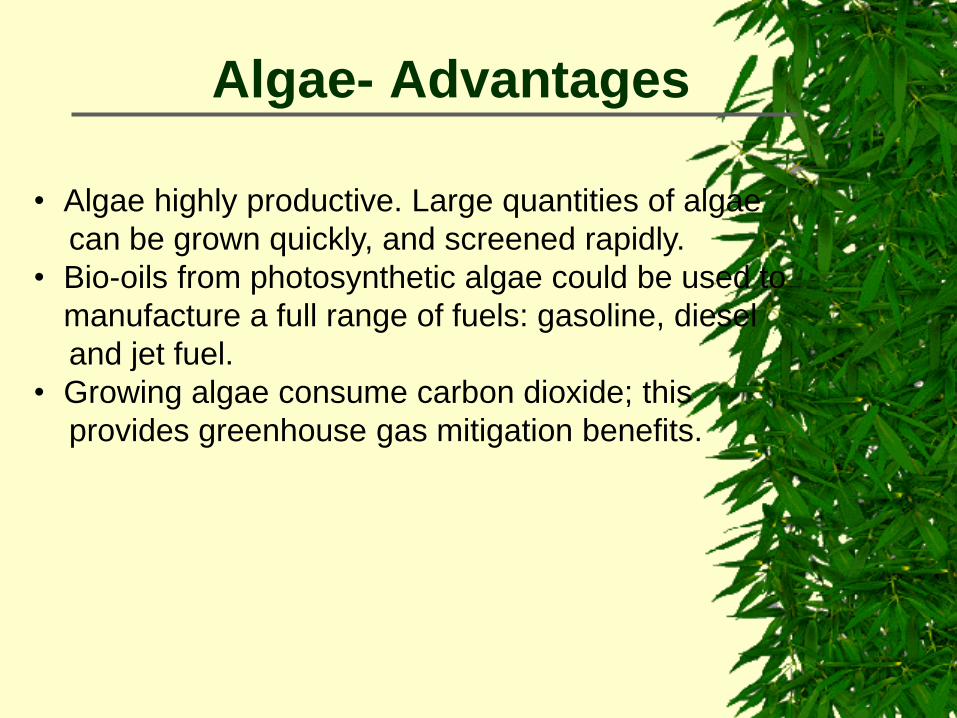
Algae- Advantages
• Algae highly productive. Large quantities of algae
can be grown quickly, and screened rapidly.
• Bio-oils from photosynthetic algae could be used to
manufacture a full range of fuels: gasoline, diesel
and jet fuel.
• Growing algae consume carbon dioxide; this
provides greenhouse gas mitigation benefits.

Algae Production-I:
Open Shallow Ponds

Algae Pr
Algae Production-II:
Photobioreactors

• Can be grown in stainless steel tanks
but not via photosynthesis.
• Add sugars, very similar to ethanol
Not of interest.
Algae Production-III:
Fermentors

Present technology:
2010 $: 10 - 35 / gallon oil equivalent
• Screening for novel strains that can grow quickly and
efficiently.
• Minimize water losses during growth (re.: open
ponds)
• Minimize: 1) growth of useless competitors (weeds),
2) pathogens, and 3) predators.
• Dewatering after growth: 1 g algae/L water
• Product focus: diesel, gasoline and jet fuel
Projection (2020): $75 - $100 / barrel
Bio-Oil form Algae: Challenges
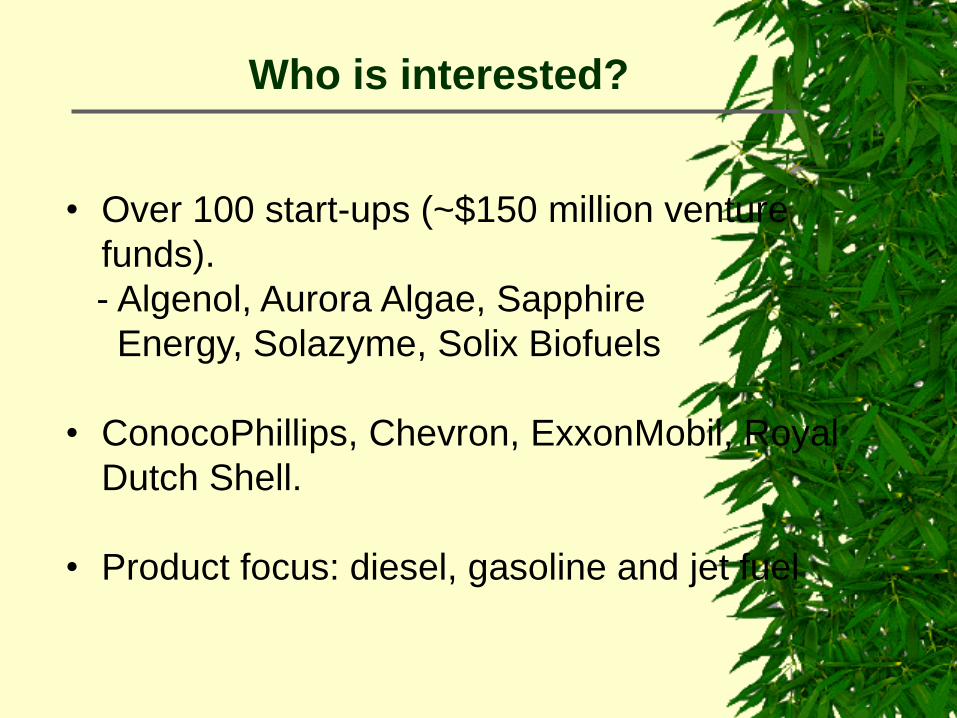
• Over 100 start-ups (~$150 million venture
funds).
- Algenol, Aurora Algae, Sapphire
Energy, Solazyme, Solix Biofuels
• ConocoPhillips, Chevron, ExxonMobil, Royal
Dutch Shell.
• Product focus: diesel, gasoline and jet fuel
Who is interested?
Cellulosic Materials

Biomass Feedstock
“Billion ton” study (USDA/DOE)
• Agriculture: Corn stover, wheat straw, soybean residue, manure, switchgrass, other energy crops.
• Forest: Forest thinnings, fuelwoods, logging residues, wood processing and paper mill residues, urban wood wastes.
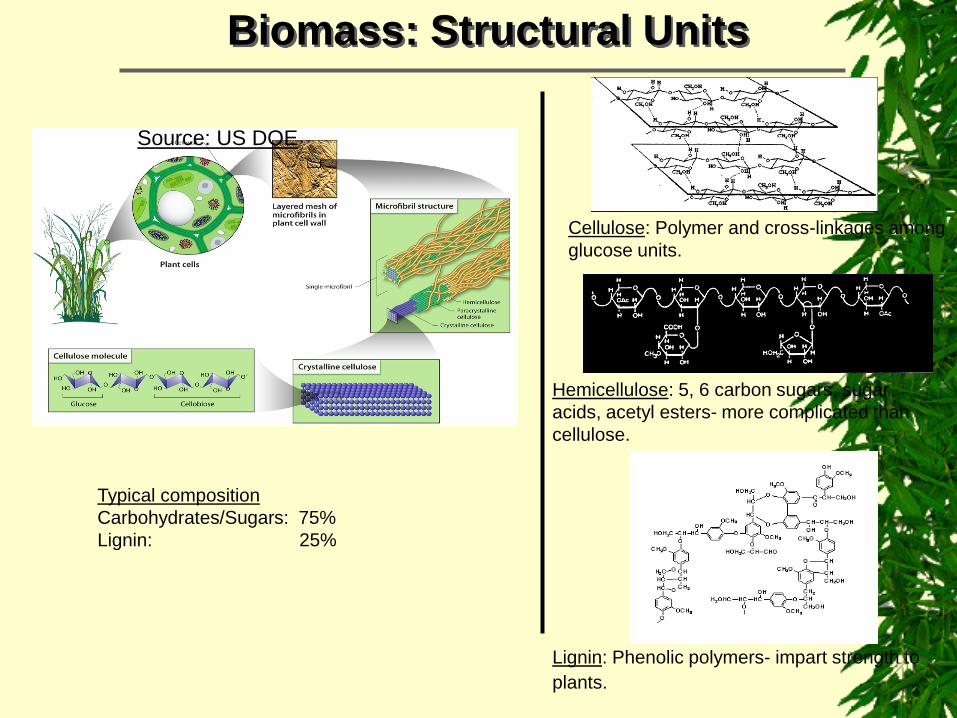
Biomass: Structural Units
Cellulose: Polymer and cross-linkages among
glucose units.
Hemicellulose: 5, 6 carbon sugars, sugar
acids, acetyl esters- more complicated than
cellulose.
Lignin: Phenolic polymers- impart strength to
plants.
Typical composition
Carbohydrates/Sugars: 75%
Lignin: 25%
Source: US DOE

“Biorefinery” Concept

Biomass to Fuels
Methanol
Alcohols (C2+)
F-T Liquids
(Biorefinery Concept)
Hydrogen
(direct & Indirect)
(Feedstock)
SYNGAS
CO,CO2,H2
B
I
O
M
A
S
S
Cat.
Thermochemical Route: Syngas Platform

Approach Combine new Process Engineering and Process Chemistry concepts. Process Chemistry Liquid Phase Low Temperature (LPLT) concept - Single-site or Nano catalysis Process Engineering Heat management - Microchannel Reactors
Challenge Total Carbon Utility with Product specificity - Atom Economy .

Topic 4
New York State Initiatives

Renewable Fuels Roadmap and
Sustainable Biomass Fuels Supply
Released 2010
http://www.nyserda.org/publications/ren
ewablefuelsroadmap/default.asp

Renewable Fuels Roadmap and Sustainable Biomass Fuels Supply
Released 2010
http://www.nyserda.org/publications/renewablefue
lsroadmap/default.asp
• NYSERDA (NYS Energy Research and
Development Authority)
• NYSDEC (NYS Dept. of Environmental
Conservation)
• NYSDAM (NYS Dept. of Agriculture and
Markets

NYS Roadmap Highlights
• Assesses the prospects for the expansion of biofuel
production in New York State, focusing on resource
availability and economic and environmental impacts.
• Topics covered:
• Biodiesel
• Biofuels
• Cellulosic ethanol
• Competing uses
• Conversion technology
• Feedstock
• Greenhouse gas emissions
• Life cycle analysis
• Renewable energy
• Sustainability
• Transportation fuels

Key Issues Considered: 11
1. Stakeholder Input: Vision Document and Stakeholder Input
Workshops.
2. Analysis of Sustainable Feedstock Production Potential in NYS
3. Feedstock Transportation and Logistics
4. Life Cycle Analysis and Public Health Assessment of Biofuel
Production, Transportation, and Use in New York State
5. Technologies for Biofuels Production
6. Biofuel Industry Economic Impacts and Analysis.
7. Worker Training and Business Research Infrastructure for a
Biofuel Industry in New York.
8. Sustainability Criteria.
9. Selected Future Production Pathways in New York.
10. Policy Analysis and Inventory of Existing Relevant State and
Federal Policies.
11. Biofuels Markets in New York State & Integration in the
Northeast Region and Competition for Biomass Resources.

Expanding Biofuels in NYS
Scenarios considered: 3
Scenario 1: ―Big Step Forward‖
• Focus on large (90 MGY) biofuel production plants.
• Rapid development of lignocellulosic feedstock
resources is assumed on available rural lands.
• Total New York production of renewable gasoline
substitutes would reach 508 MGY.
• Under this scenario, New York meets about 5.6% of its
projected gasoline consumption with home grown
biofuels.

Expanding Biofuels in NYS
Scenario 2: ―Giant Leap Forward‖
• Some cropland is used for biofuel production.
• Assumes that 2nd generation lignocellulosic biorefineries
(biochemical and thermochemical systems) are ready for
commercial deployment.
• Large lignocellulosic biorefinery clusters (average capacity
354 MGY) exist in a centralized collection/distribution
system.
• Total New York liquid biofuel production including grain
derived ethanol would reach 1,449 MGY.
• New York could meet about 16% of its projected
transportation gasoline consumption with home grown
biofuels.

Expanding Biofuels in NYS
Scenario 3: ―Distributed Production‖
• Same feedstock production and similar conversion
technology as in Scenario 2.
• This scenario reflects a more decentralized fuel production
industry with no individual biorefinery capacity exceeding
60 MGY, except for the existing grain ethanol biorefineries.
• Total New York liquid biofuel production including grain-
derived ethanol would reach 1,449 MGY.
• New York could meet about 16% of its projected
transportation gasoline consumption with home grown
biofuels.

Biomass Capacity
• Of the State’s 18.5 million acres forest lands, nearly 15.8
million acres is producing or is capable of producing
woody biomass.
• New York agricultural industry currently produces ~12
million dry tons biomass annually and produces another
9.5 Mdt/year of biomass from forests.
• The current forest products industry uses 2.5 Mdt/year.
Corn provides the greatest amount of biomass from a
single agricultural crop in the State (60%) and much of
this is used by the New York dairy industry.

Biofuel Production Technologies
• Fifteen current technologies were evaluated for
converting solid biomass to liquid fuels.
• The Roadmap summarized process descriptions, current
development status, and estimated economic and
performance attributes for the year 2020.
• Only 3 are currently in commercial use.
• By 2020, the total capacity for lignocellulosic ethanol is
estimated to be between 508 and 1,449 million gallons.

Topic 5
Long Island Initiatives

Research Facility
• New York State funded $45 million at SBU.
- Build the Advanced Energy Research & Technology Center (AERTC)
• NSF C-BERD will be housed in this building.
Characterization Facilities
• Center for Functional Nanomaterials (CFN)
- A U.S. Department of Energy (US DOE) $85 million facility at BNL.
Facilities
AERTC CFN

CEWIT
AERTC
Stony Brook University R&D Park

AERTC: An Energy Efficient Building
Leadership in Energy & Design (LEED) Certification
Criteria
• Design
• Construction
• Operation
Levels (based on 100 points) in LEED 2009
• Platinum (80+)
• Gold (60-79)
• Silver (50-59)

LEED Features
• Construction phase: Requires materials within 500 miles
radius- provided jobs within local communities
• Operation:
- Water system. Run rainwater is collected and used
for non-drinking purposes.
- Power savings. Sensors for lighting throughout.
- Solar supplement. Shades to minimize AC usage.
- AC. 4 Ice slabs at night for peak shaving and
daytime use of AC. Chilled water for AC.
- Parking Lot. 30kW solar panels to provide LED
• Provide charging station for 4 electric vehicles (A new
US DOE grant).
AERTC: An Energy Efficient Building

Renewable R&D at Stony Brook
Green Buildings
CEWIT
AERTC
Electric Delivery Systems
- Smart Grid
Green Energy Projects
- Solar
- Biomass to Biofuels
- Geothermal
Carbon Capture Systems Coupled with Fossil Fuels
- CCS

Electric Delivery System:
Smart Grid
Key Elements
• Security
• Reliability
• Renewable fuel choice and
integration
• Solar
• Biofuels from biomass processing
• Wind
• Sustainability

51
Long Island's Smart Energy Corridor
A Collaborative Project
SBU PI:
Professor E. Feinberg, AMS Dept.

52
Long Island's Smart Energy Corridor

53
Renewable Fuels for Smart Grid- Liquids
Liquid
Fuels
• Smart grid and renewable fuels integration
• Skid-mounted (small scale) renewable fuel plants
Focus
• Focus: Transportation and power peak-shaving fuels
• Source: Biomass derived biofuels via pyrolysis and thermochemical routes.
- Gasoline, diesel, ethanol, methanol and butanol.

54
Why
Biogas?
• Biogas assessment and potential on Long Island
- Regional and Global application
• Biogas upgrading to pipeline quality gas
• Biogas- a natural source of energy. Capturing fugitive methane has two advantages:
- Minimize methane release to the atmosphere.
Greenhouse factor: CH4 (17); CO2 (1)
- Simultaneously reduce imported natural gas
Approach
Renewable Fuels for Smart Grid- Biogas

Biogas on Long Island:
Existing & Potential Sources

Biogas vs. Natural Gas
Compound Name Chemical
Formula
Biogas (%) Natural Gas
(%)
Methane CH4 50-75 70-90
Carbon Dioxide CO2 25-50 0-8
Nitrogen N2 0-10 0-5
Hydrogen H2 0-1 Trace
Hydrogen Sulfide H2S 0-3 0-5
Oxygen O2 0-2 0-0.2
Ethane C2H6
Trace
0-20% Propane C3H8
Butane C4H10

Biogas Sources
Landfills
– MSW, C&D, and Yard Waste
Wastewater Treatment Plants
– Sewage sludge
Agricultural Residues
– Plant waste and animal manure

Landfills
Facility Brookhaven 110 Sand
Company
Blydenburgh Oceanside
Total Landfill
Area (acres)
150 116 30.5 190
Area Used for
Gas Collection
(acres)
120 116 30.5 160
Number of
Flares
2 1 2 -
Total Gas
Collected (ft3)
601,940,000 624,320,000 306,400,000 110,440,000
Energy
Produced
(MW-hrs)
64 - - 3,617

Landfills
Landfill
Name
County Waste in
Place (tons)
Opening
Year
Closing
Year
Landfill
Owner
E. Hampton
SLF
Suffolk 1,000,000 1942 1993 Town of E.
Hampton
Holtsville
SLF
Suffolk - 1939 1974 Town of
Brookhaven
North Sea
LF
Suffolk 1,102,714 1963 1995 Town of
Southampton
Port
Washington
LF
Nassau 2,161,000 1983 1991 North
Hempstead

MSW
3.5 million tons of waste produced annually
– 1 million tons is recycled
– 1.5 million tons is incinerated
– 1 million tons is transported off island
According to NYS, 65% of the waste stream
is composed of degradable items in the form
of paper and organics.
Source: Tonjes, D.J. Stony Brook University

MSW
Material Dry Weight
(ton)
Yield (ml of
CH4/dry g)†
Total CH4 Yield
(billion ft3)
Coated Paper 14,570 84.4 0.04
Office Paper 22,466 217.3 0.16
Newspaper 14,570 74.33 0.03
Corrugated 60,895 152.3 0.30
Others 181,326 74.33 0.43
Food Scraps 54,570 300.7 0.53
Yard Trimming 9,760 69.2 0.03
Wood 8,900 62.6 0.07
Total 1.29
† Eleazer, W.E. et al. Environmental Science & Technology 1997

C&D
Facility Amount of Waste
(tons)
CH4 Yield (billion ft3)
Blydenburgh Wood – 34,612 0.07
Cardboard – 8,340 0.04
110 Sand Company Wood – 248,435 0.50
Cardboard – 59,865 0.29
Brookhaven Wood – 105,297 0.21
Cardboard – 25,493 0.12
Total 1.23

Yard Waste 365,000 tons of yard waste annually
– Estimated 170 million ft3 of CH4 per year
AD vs. LF AD vs. WC WC vs. LF
Energy
Production
(mmBTU/yr)
+380,000 +407,910 -30,546
GHG Emissions
(tons/yr CO2 eq.)
-134,379 -93,470 +42,075
NOx (tons/yr) -53.8 -55.4 +1.7
SOx(tons/yr) -75.4 82.2 +6.83
PM-10 (tons/yr) -64.4 -56.0 -8.4
VOC (tons/yr) -9.5 -4.2 -5.2
Lead (lbs/yr) -194.7 -205.0 +10.4
AD: Anaerobic digestion; LF: Landfilling without energy recovery; WC:
Open window composting.
Source: Haight, M. Waste Science & Technology 2005.

WWTPs
34 WWTPs located on Long Island
– 12 in Nassua County; 22 in Suffolk County
Facility
Name
County Authority
Name
Actual Flow
(mgd)
Potential
Electric
Capacity
(kW)
Long Beach
WPC Plant
Nassau Long Beach
DPW
5 122
Bay Park STP
& SD#2
Nassau Nassau County
DPW
53 1178
Cedar Creek
STP & SD#3
Nassau Nassau County
DPW
57 1268

WWTP
On average a WWTP will process 450 L per
day of wastewater per person served
The total solids present in average sanitary
wastewater is 800 mg/L
An estimated 207,406 tons of sludge is
processed yearly by WWTPs on Long Island
Source: Hammer, M. J Waste and Wastewater Technology 2001

WWTP
Assume volatile solids are 75%.
Assume 50% reduction in volatile solids
after digestion.
Assume 16 cubic feet of gas produced per
lb of volatile solids destroyed.
Estimated gas production: 2.5 x 109 ft3
Source: Hammer, M. J Waste and Wastewater Technology 2001

Agricultural Residue
35,682 acres of farmland on Long Island
– 75% is cultivated for crops
– 25% used for pastures, woodland, and
other usage.
On farm composting is the most common
method used for waste disposal.
Assume 33,000 ft3 acre-1 year-1 of CH4
883 x 106 ft3
Source: Weiland, P. Applied Biochemistry and Biotechnology, 2003.

Conclusion
Total biogas potential
= 7.7 billion cubic feet
= 2.3 Twh of electricity
= 12% of total electricity generated by LIPA
from natural gas

Conclusion
Potential
Source
Currently
Exploited
Current/Potential
CH4 Yield (billion)
Optimal Use Technology
Barriers
Sludge No 2.49 ft3 Pipeline quality
gas
ADs are needed
LGRF Yes 1.64 ft3 Electricity Upgrading
Technology
MSW No 1.29 ft3 Pipeline quality
gas
AD; Upgrading
technology
C&D No 1.23 ft3 Pipeline quality
gas
Upgrading
technology
Agriculture
Waste
No 0.88 ft3 On-site usage;
Electricity
ADs are needed
Yard Waste No 0.17 ft3 On-site usage ADs are needed

Center for Bioenergy Research
and Development (CBERD)

Founding Members
Kansas State University (K-State)
North Carolina State University (NCSU)
South Dakota School of Mines and Technology
(SDSMT)
Stony Brook University (SBU)
University of Hawaii (UH)
Total industry membership: 25
C-BERD

CBERD Mission
Education
Industry
Interface
Research
Mission:
• To train students at all levels.
• Develop renewable energy technologies
working with industry.

CBERD Organization
SBU Site
• Biogas upgrading
• Bio-oil Upgrading
• Syngas to fuels
• H2 for fuel cells
Devinder Mahajan
Site Director
David Tonjes
Wendy Tang
Ben Hsiao
Ben Chu
Dilip Gersappe
Hazem Tawfik, Farmingdale
AJ Francis, BNL
CR Krishna, BNL
Kyoung Ro, USDA-ARS
Lijun Wang, NC A&T
Jeff Hung
Kristine Horvat
Saurabh Patel
Shangmin Xiong
Nan Wei
Tsung-Ming Yeh
Celest Okoli
Kurian Kuttiyiel
Kun tan
Matt Graham
Yun Ying
Daniel Santiago
Jake Dietz
FACULTY STUDENTS NATIONAL GRID
NYSERDA
TOWN OF BROOKHAVEN
US ARMY
BNL
AERTC
IAB Members
THRUST AREAS
Nay Htun,
Senior Advisor

Question?